Embed Size (px)
Citation preview

Detailed Placement for Detailed Placement for Improved Depth of Focus and Improved Depth of Focus and
CD ControlCD Control
Puneet GuptaPuneet Gupta11
Andrew B. KahngAndrew B. Kahng1,21,2
Chul-Hong ParkChul-Hong Park2 2
([email protected])([email protected])
1 Blaze DFM, Inc.2 ECE Department, University of California, San Diego
http://vlsicad.ucsd.edu
OutlineOutline
OPC and SRAF: An IntroductionOPC and SRAF: An Introduction The AFCorr MethodologyThe AFCorr Methodology AFCorr Placement PerturbationAFCorr Placement Perturbation Experiments and ResultsExperiments and Results SummarySummary

OPC (Optical Proximity Correction)OPC (Optical Proximity Correction)
Gate CD control is extremely difficult to achieveGate CD control is extremely difficult to achieve Min feature size outpaces introduction of new hardware solutionsMin feature size outpaces introduction of new hardware solutions
OPC = one of available reticle enhancement techniques OPC = one of available reticle enhancement techniques (RET) to improve pattern resolution(RET) to improve pattern resolution Proactive distortion of photomask shape Proactive distortion of photomask shape compensate CD compensate CD
inaccuraciesinaccuracies
Before OPC After OPCC.-H. Park et al., SPIE 2000
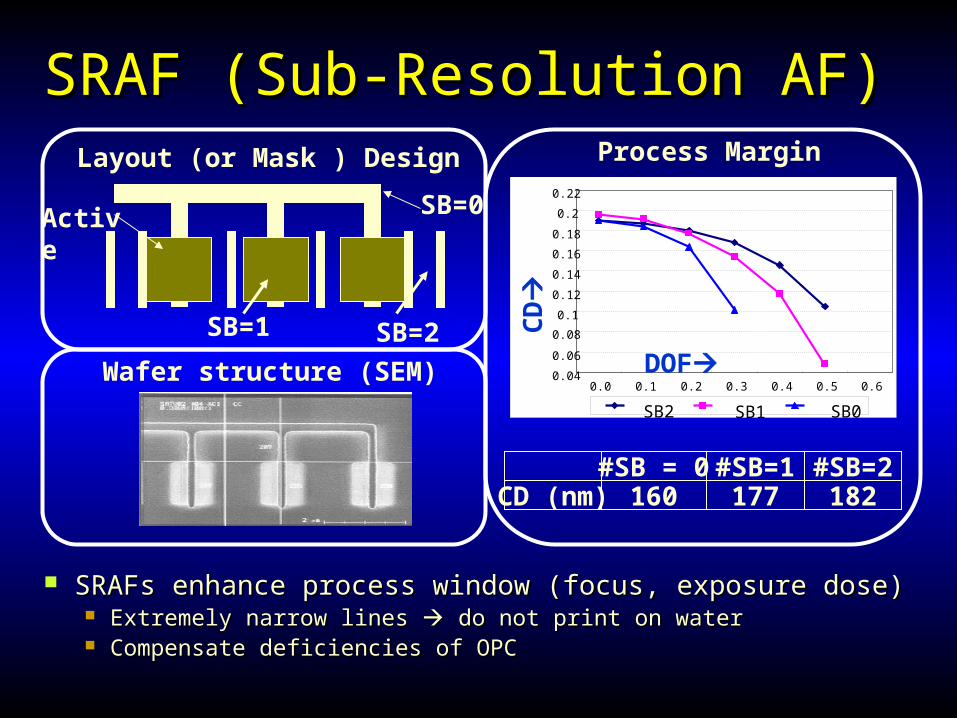
SRAF (Sub-Resolution AF)SRAF (Sub-Resolution AF)
SRAFs enhance process window (focus, exposure dose) SRAFs enhance process window (focus, exposure dose) Extremely narrow lines Extremely narrow lines do not print on water do not print on water Compensate deficiencies of OPCCompensate deficiencies of OPC
0.04
0.06
0.08
0.1
0.12
0.14
0.16
0.18
0.2
0.22
0.0 0.1 0.2 0.3 0.4 0.5 0.6
SB2 SB1 SB0
DOF
CD
SB=0
SB=2SB=1
Active
#SB = 0 #SB=1 #SB=2160 177 182CD (nm)
Layout (or Mask ) Design Process Margin
Wafer structure (SEM)
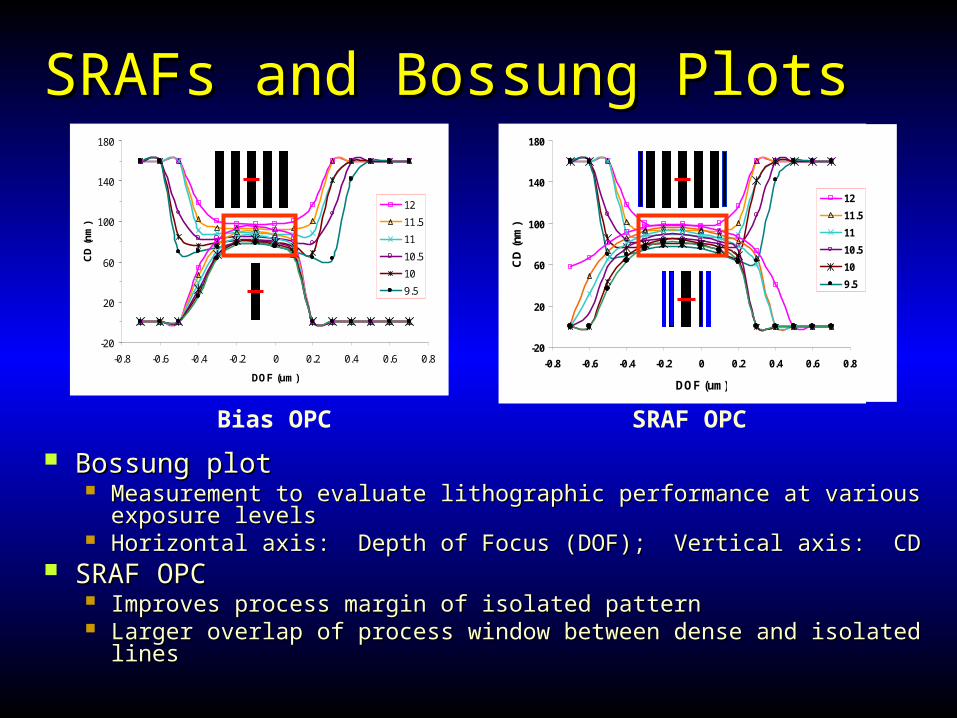
SRAFs and Bossung PlotsSRAFs and Bossung Plots
Bossung plotBossung plot Measurement to evaluate lithographic performance at various Measurement to evaluate lithographic performance at various
exposure levelsexposure levels Horizontal axis: Depth of Focus (DOF); Vertical axis: CDHorizontal axis: Depth of Focus (DOF); Vertical axis: CD
SRAF OPC SRAF OPC Improves process margin of isolated pattern Improves process margin of isolated pattern Larger overlap of process window between dense and isolated linesLarger overlap of process window between dense and isolated lines
-20
20
60
100
140
180
-0.8 -0.6 -0.4 -0.2 0 0.2 0.4 0.6 0.8
DOF (um)
CD
(n
m)
12
11.5
11
10.5
10
9.5
Bias OPC SRAF OPC
-20
20
60
100
140
180
-0.8 -0.6 -0.4 -0.2 0 0.2 0.4 0.6 0.8
DOF (um)
CD
(n
m)
12
11.5
11
10.5
10
9.5

OutlineOutline
OPC and SRAF: An IntroductionOPC and SRAF: An Introduction The AFCorr MethodologyThe AFCorr Methodology AFCorr Placement PerturbationAFCorr Placement Perturbation Experiments and ResultsExperiments and Results SummarySummary

Forbidden PitchesForbidden Pitches
Forbidden pitch lowers printability, DOF margin Forbidden pitch lowers printability, DOF margin and exposure marginand exposure margin
Typically based on tolerance of +/- 10% of CD Must avoid forbidden pitches in layout
-30
10
50
90
130
170
100 300 500 700 900 1100 1300 1500
pitch (nm)
CD
(n
m)
W/O OPC(Best DOF)W/O OPC(Defocus)
Bias OPC(Defocus)SRAF OPC (Defocus)
#SB=1 #SB=2 #SB=3 #SB=4
Allowable
Forbidden

Layout Composability for SRAFsLayout Composability for SRAFs
Small set of allowed feature spacingsSmall set of allowed feature spacings Two components of SRAF-aware methodologyTwo components of SRAF-aware methodology
Assist-correct librariesAssist-correct libraries Inter-device spacing within a standard cellsInter-device spacing within a standard cells Intelligent library designIntelligent library design
Assist-correct placement Assist-correct placement THIS WORK THIS WORK Intelligent whitespace adjustment between cellsIntelligent whitespace adjustment between cells
x+x x
Better than

OutlineOutline
OPC and SRAF: An IntroductionOPC and SRAF: An Introduction The AFCorr MethodologyThe AFCorr Methodology AFCorr Placement PerturbationAFCorr Placement Perturbation Experiments and ResultsExperiments and Results SummarySummary
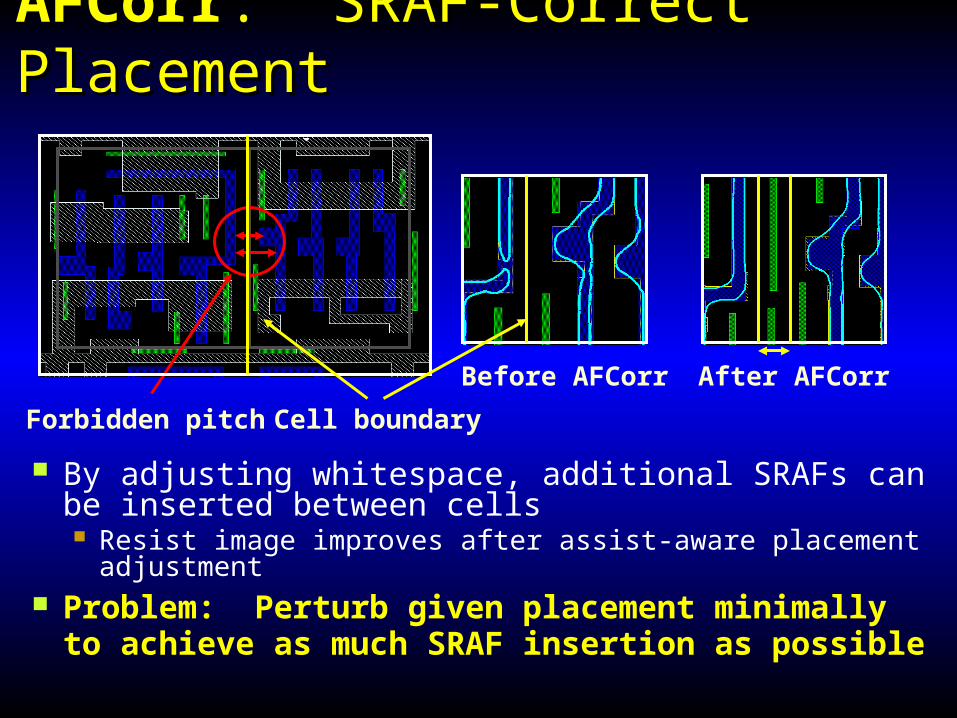
AFCorrAFCorr: SRAF-Correct Placement: SRAF-Correct Placement
By adjusting whitespace, additional SRAFs can be inserted between cells Resist image improves after assist-aware placement
adjustment Problem: Perturb given placement minimally to
achieve as much SRAF insertion as possible
Cell boundaryForbidden pitch
Before AFCorr After AFCorr

Minimum Perturbation ApproachMinimum Perturbation Approach
Objective:Objective: Minimum perturbation of input placementMinimum perturbation of input placement Reduce weighted CD degradation with defocusReduce weighted CD degradation with defocus Preserve timingPreserve timing
Constraint:Constraint: Placement sitemap must be respectedPlacement sitemap must be respected
How:How: One cell row at a timeOne cell row at a time Solve each cell row by Solve each cell row by dynamic programmingdynamic programming
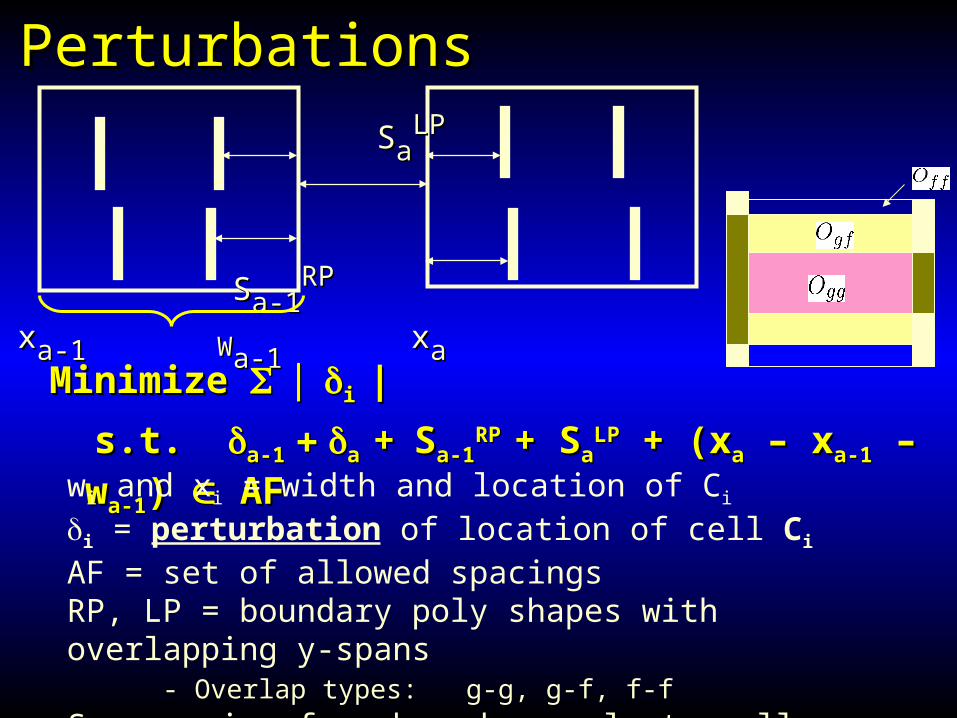
Feasible Placement PerturbationsFeasible Placement Perturbations
Minimize Minimize i i ||
s.t. s.t. a-1a-1a a ++SSa-1a-1RP RP + S+ Saa
LPLP + (x + (xaa – x – xa-1a-1 – w – wa-1a-1) ) AF AFwi and xi = width and location of Ci
i = perturbation of location of cell Ci
AF = set of allowed spacingsRP, LP = boundary poly shapes with overlapping y-spans
- Overlap types: g-g, g-f, f-f
S = spacing from boundary poly to cell border
xxaaxxa-1a-1
SSa-1a-1RPRP
SSaaLPLP
WWa-1a-1

Dynamic Programming SolutionDynamic Programming Solution
weighted objective function E.g., to account for timing-criticality of cells
Slope = Slope = CD / CD / Pitch = CD degradation per unit space Pitch = CD degradation per unit space between AF values between AF values
AFAFii = closest assist-feasible spacing ≤ HSpace = closest assist-feasible spacing ≤ HSpace Overlap_weight = overlap length weighted by relative Overlap_weight = overlap length weighted by relative
importance of printability for gate-to-gate, gate-to-field, and importance of printability for gate-to-gate, gate-to-field, and field-to-fieldfield-to-field
COST (1,b) = | xCOST (1,b) = | x11-b| -b| // subrow up through cell 1, location b// subrow up through cell 1, location b
COST (a,b) = COST (a,b) = (a) |(x(a) |(xaa -b)| + -b)| +
MINMIN{X{Xaa-SRCH ≤ i ≤ X-SRCH ≤ i ≤ Xaa+SRCH}+SRCH} [COST(x [COST(xa-1a-1,i) + HCost(a,b,a-1,i)],i) + HCost(a,b,a-1,i)]
// SRCH = maximum allowed perturbation of cell location// SRCH = maximum allowed perturbation of cell locationHCost = “forbidden-pitch cost” = sum over horiz-adjacencies ofHCost = “forbidden-pitch cost” = sum over horiz-adjacencies of [slope(j) |HSpace –AF[slope(j) |HSpace –AF jj| * overlap_weight]| * overlap_weight] s.t. AFs.t. AFj+1j+1 > HSpace > HSpace AF AFjj
OutlineOutline
OPC and SRAF: An IntroductionOPC and SRAF: An Introduction The AFCorr MethodologyThe AFCorr Methodology AFCorr Placement PerturbationAFCorr Placement Perturbation Experiments and ResultsExperiments and Results SummarySummary
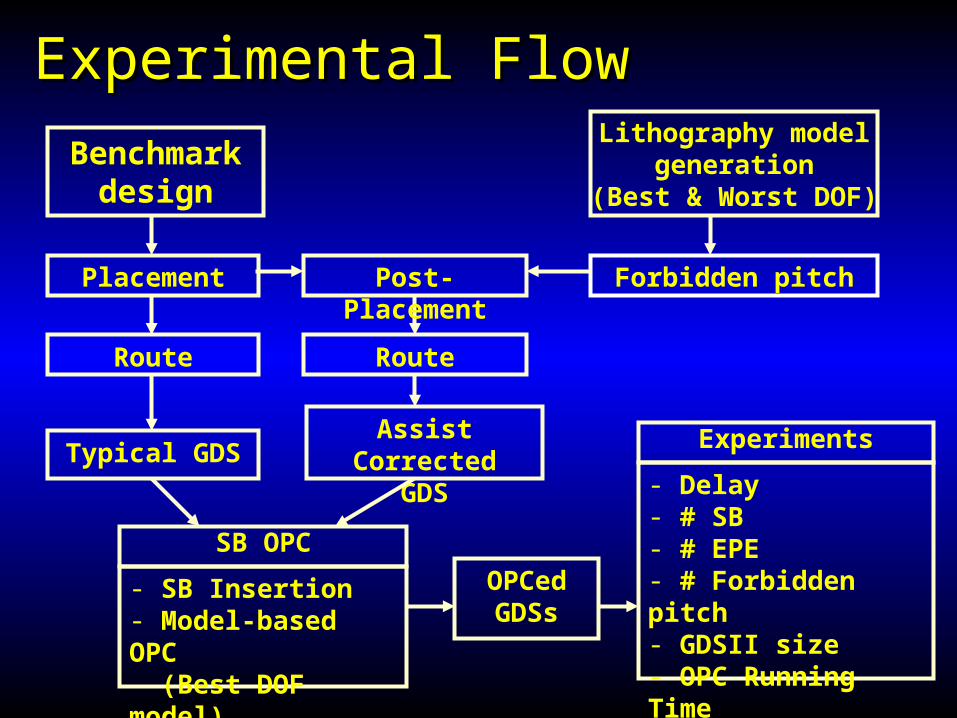
Experimental FlowExperimental Flow
Forbidden pitch
SB OPC
- SB Insertion- Model-based OPC (Best DOF model)
Lithography modelgeneration
(Best & Worst DOF)
Benchmark design
Placement
Assist CorrectedGDS
Route
Typical GDS
Route
Post-Placement
OPCed GDSs
- Delay - # SB - # EPE - # Forbidden pitch- GDSII size- OPC Running Time
Experiments

Experimental SetupExperimental Setup KLA-Tencor’s KLA-Tencor’s ProlithProlith
Model generation for Model generation for OPCproOPCpro Best focus/ worst (0.5 micron) defocusBest focus/ worst (0.5 micron) defocus
Calculating forbidden pitchesCalculating forbidden pitches Mentor’s Mentor’s OPCproOPCpro, SBar , SBar SVRFSVRF
OPC, SRAF insertion, OPC simulationOPC, SRAF insertion, OPC simulation Cadence Cadence SOC EncounterSOC Encounter
PlacementPlacement Synopsys Design ComplierSynopsys Design Complier
SynthesisSynthesis

Experimental MetricsExperimental Metrics SB Count
Total number of scattering bars or SRAFs inserted in the design
Higher number of SRAFs implies less through-focus variation and is hence desirable
Forbidden Pitch Count Number of border poly geometries estimated as
having greater than 10% CD error through-focus EPE Count
Number of edge fragments on border poly geometries having greater than 10% edge placement error at the worst defocus level

Results: Increased SB CountResults: Increased SB Count
0
50000
100000
150000
200000
90 80 70 60 50
Utilization(%)
# t
ota
l SB
0
5000
10000
15000
20000
25000
30000
35000
40000
# S
B D
iffe
ren
ce
SB difference (130)
SB difference (90)
SB w/o AFCorr(130)
SB w AFCorr(130)
SB w/o AFCorr(90)
SB w AFCorr(90)
SB count increases as utilization decreases due to increased whitespace
Better DOF and resist image
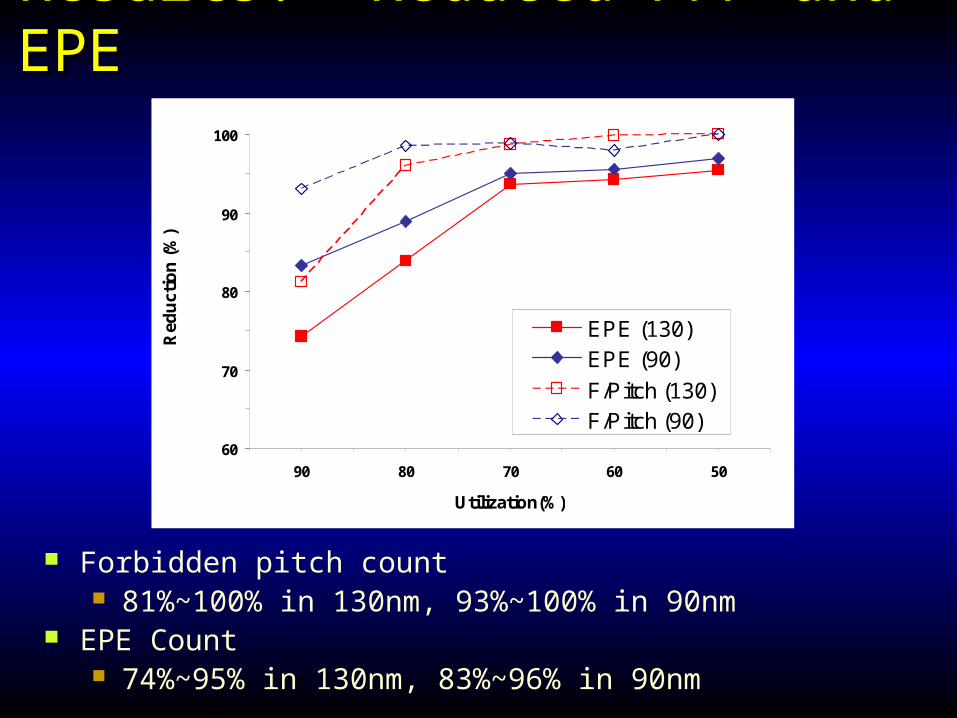
Results: Reduced F/P and EPEResults: Reduced F/P and EPE
Forbidden pitch count 81%~100% in 130nm, 93%~100% in 90nm
EPE Count 74%~95% in 130nm, 83%~96% in 90nm
60
70
80
90
100
90 80 70 60 50
Utilization(%)
Red
uct
ion
(%
)
EPE (130)EPE (90)
F/Pitch (130)F/Pitch (90)
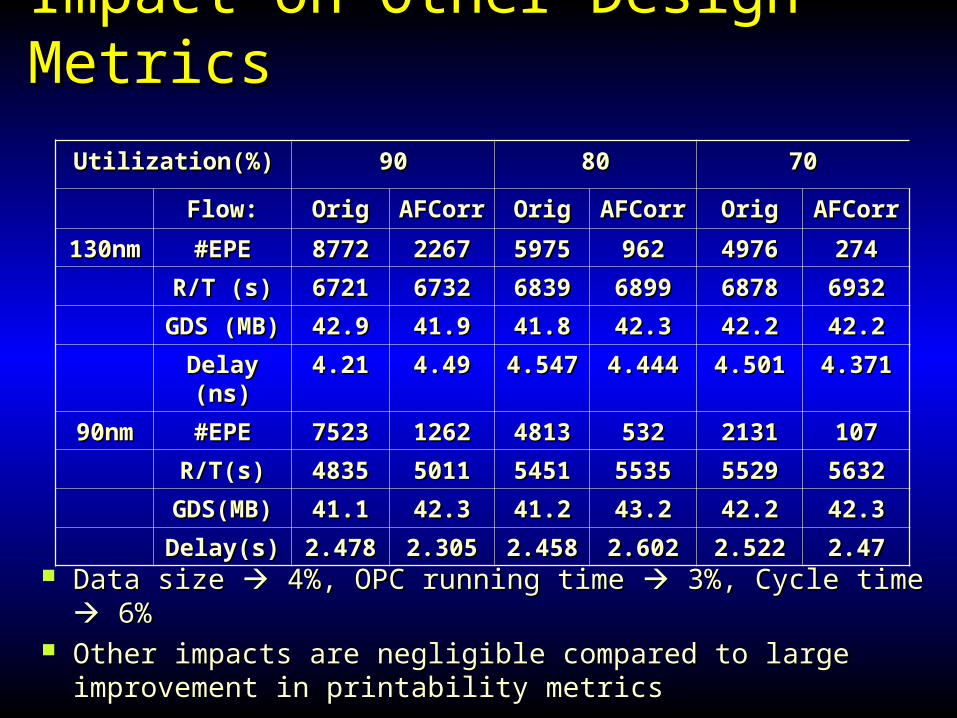
Impact on Other Design MetricsImpact on Other Design Metrics
Data size Data size 4%, OPC running time 4%, OPC running time 3%, Cycle time 3%, Cycle time 6% 6% Other impacts are negligible compared to large improvement Other impacts are negligible compared to large improvement
in printability metricsin printability metrics
Utilization(%)Utilization(%) 9090 8080 7070
Flow:Flow: OrigOrig AFCorrAFCorr OrigOrig AFCorrAFCorr OrigOrig AFCorrAFCorr
130nm130nm #EPE#EPE 87728772 22672267 59755975 962962 49764976 274274
R/T (s)R/T (s) 67216721 67326732 68396839 68996899 68786878 69326932
GDS (MB)GDS (MB) 42.942.9 41.941.9 41.841.8 42.342.3 42.242.2 42.242.2
Delay (ns)Delay (ns) 4.214.21 4.494.49 4.5474.547 4.4444.444 4.5014.501 4.3714.371
90nm90nm #EPE#EPE 75237523 12621262 48134813 532532 21312131 107107
R/T(s)R/T(s) 48354835 50115011 54515451 55355535 55295529 56325632
GDS(MB)GDS(MB) 41.141.1 42.342.3 41.241.2 43.243.2 42.242.2 42.342.3
Delay(s)Delay(s) 2.4782.478 2.3052.305 2.4582.458 2.6022.602 2.5222.522 2.472.47
OutlineOutline
OPC and SRAF: An IntroductionOPC and SRAF: An Introduction Forbidden Pitch Extraction Forbidden Pitch Extraction The AFCorr MethodologyThe AFCorr Methodology Experiments and ResultsExperiments and Results SummarySummary
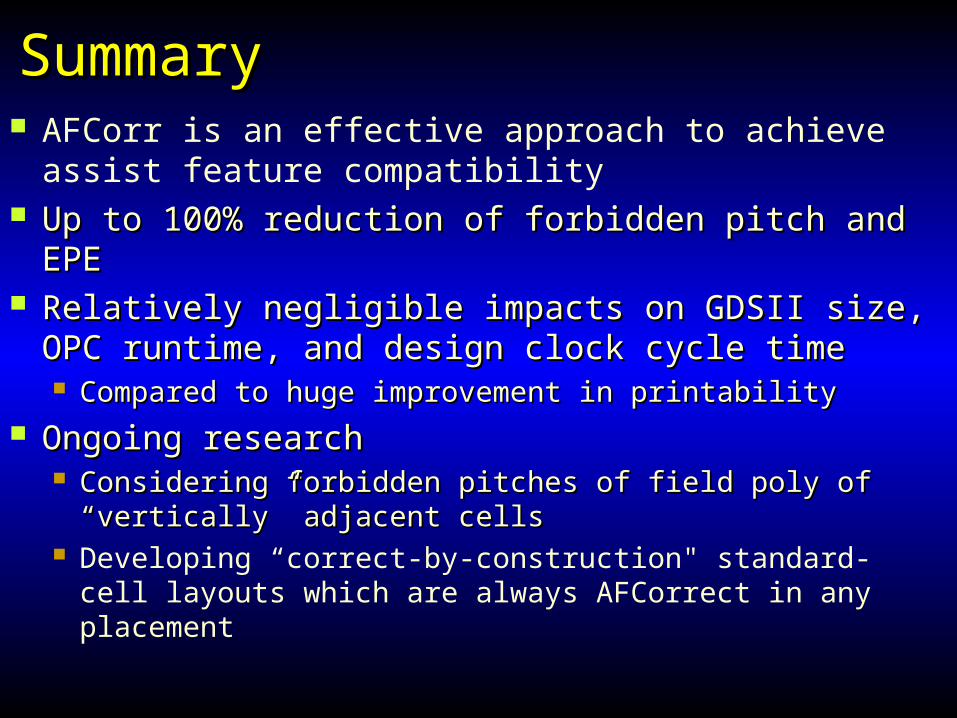
SummarySummary AFCorr is an effective approach to achieve assist
feature compatibility Up to 100% reduction of forbidden pitch and EPEUp to 100% reduction of forbidden pitch and EPE Relatively negligible impacts on GDSII size, OPC Relatively negligible impacts on GDSII size, OPC
runtime, and design clock cycle timeruntime, and design clock cycle time Compared to huge improvement in printabilityCompared to huge improvement in printability
Ongoing researchOngoing research Considering forbidden pitches of field poly of “vertically” Considering forbidden pitches of field poly of “vertically”
adjacent cellsadjacent cells Developing “correct-by-construction" standard-cell layouts
which are always AFCorrect in any placement

Thank You!

NotationNotation
W = cell width; W = cell width; RP, LP = Boundary poly geometriesRP, LP = Boundary poly geometries S = Spacing from boundary poly to cell borderS = Spacing from boundary poly to cell border O = Parallel adjacencies between poly features (g-f, g-g, f-f)O = Parallel adjacencies between poly features (g-f, g-g, f-f) Example:Example: S Sa-1a-1
RP2 RP2 + (x+ (xa-1a-1 – x – xaa – w – wa-1a-1) + S) + SaaLP3LP3 should be assist-correct should be assist-correct
A