Embed Size (px)
Citation preview
www.elsevier.com/locate/cplett
Chemical Physics Letters 425 (2006) 134–137
Detection of Cu(hfac)(tmvs) by Li+ ion attachment mass spectrometry
Toshihiro Fujii a,*, Sundaram Arulmozhiraja b, Megumi Nakamura c, Yoshiro Shiokawa c
a Meisei University, Department of Chemistry, Faculty of Sciences and Engineering, Hodokubo 2-1-1, Hino, Tokyo 191-8506, Japanb Environmental Chemistry Division, National Institute for Environmental Studies, 16-2 Onogawa, Tsukuba, Ibaraki 305-8506, Japan
c Canon Anelva Texnix Corp., Bubai, Fuchu, Tokyo 183-0033, Japan
Received 29 March 2006; in final form 29 April 2006Available online 24 May 2006
Abstract
Li+ ion attachment mass spectrometry was used to detect Cu(1,1,1,5,5,5-hexafluoroacetylacetonate)(vinyltrimethylsilane) [Cu(h-fac)(tmvs)], a thermally labile precursor used in copper chemical vapor deposition (Cu-CVD), with the intent of developing improvedmethods for mass-spectrometric analysis of the CVD process. A uniquely designed quadrupole mass spectrometry (QMS) system coupledwith a Li+ ion emitter and a laboratory-built direct introduction system of the sample provided the molecular ion of Cu(hfac)(tmvs) asthe Li+ ion adduct for the first time. The use of this system demonstrates the feasibility of generating Li+ ion adduct for real-time mon-itoring of products encountered in Cu-CVD process facilities.� 2006 Elsevier B.V. All rights reserved.
1. Introduction
As the electronics industry moves to higher-density inte-grated circuit (IC) devices, the circuits will have to be fab-ricated on an increasingly small scale. For this reason,copper will soon replace aluminum as the material forconductive interconnects because copper has higher con-ductivity and higher resistance to electromigration thanaluminum [1,2]. Chemical vapor deposition (CVD) is asuperior process for producing these microscopic metal fea-tures. CVD of metals such as Al and Cu, which are suitablefor microelectronic applications, has been studied exten-sively [3,4]. In the study of the CVD process, monitoringtechniques can be useful for optimizing the process andassociated tools.
Accordingly, interest in accurate, rapid, and relativelylow-cost monitoring methods for the determination ofCVD precursors has greatly increased in recent years. TheCVD processes used in the semiconductor industry usuallyinvolve precursors that dissociate and either deposit a thinfilm or etch away a thin film of metal. During the deposi-
0009-2614/$ - see front matter � 2006 Elsevier B.V. All rights reserved.
doi:10.1016/j.cplett.2006.05.002
* Corresponding author. Fax: +81 42 591 5595.E-mail address: [email protected] (T. Fujii).
tion and etching processes, various byproduct gases areformed. For specifically determining these molecular spe-cies during CVD, the metal films may have to be formedat lower temperatures, at higher rates, and with higherqualities than is currently possible. Hence, there is a needfor reliable monitoring methods that are capable of mea-suring qualities of precursors in real time, at or below themaximum permissible concentration, in IC manufacturing.
A number of methods have been developed to monitorCVD and etching processes, including quadrupole massspectrometry (QMS) [5–7] and Fourier transform infraredspectroscopy (FT-IR) [8–10]. QMS has high sensitivity, alarge linear dynamic range, rapid response, and the abilityto withstand the reactive, corrosive nature of the effluentstreams being analyzed. The main disadvantage is massinterference, particularly in the electron ionization (EI)mode. FT-IR is a reliable and cost-effective way to monitorsemiconductor processes, but it is not as sensitive as QMS.A new mass-spectrometric technique that provides highsensitivity and fast response time without extensive frag-mentation is desirable.
We have shown recently that, compared to traditionalEI mass spectrometry, Li+ ion attachment mass spectrom-etry (IAMS) [11–15] has considerable advantages for
T. Fujii et al. / Chemical Physics Letters 425 (2006) 134–137 135
monitoring perfluorocarbons (PFCs). Unlike EI mass spec-trometry, which involves ionization by high-energy elec-trons, IAMS is better for preserving the structure ofPFCs, allowing detection of the compounds as adduct ionswithout fragmentation.
In this study, we used Li+ IAMS to detectCu(1,1,1,5,5,5-hexafluoroacetylacetonate)(vinyltrimethylsi-lane) [Cu(hfac)(tmvs)], which is known to deposit qualitycopper films. Any analytical technique for this reagenthas to meet the challenges posed by the fact that it is ther-mally labile, corrosive, and condensable. By means of Li+
IAMS, we were able to detect, for the first time, an intensepeak for the molecular ion. In this Letter, we also discussthe suitability and applicability of the technique for on-linemonitoring with direct, real-time analysis of the Cu(h-fac)(tmvs) CVD products emitted from a cold-wall low-pressure CVD system consisting of a simple thermal reac-tor. We expect this technique to be useful for optimizingthe operation and characteristics of the system.
2. Experimental procedures
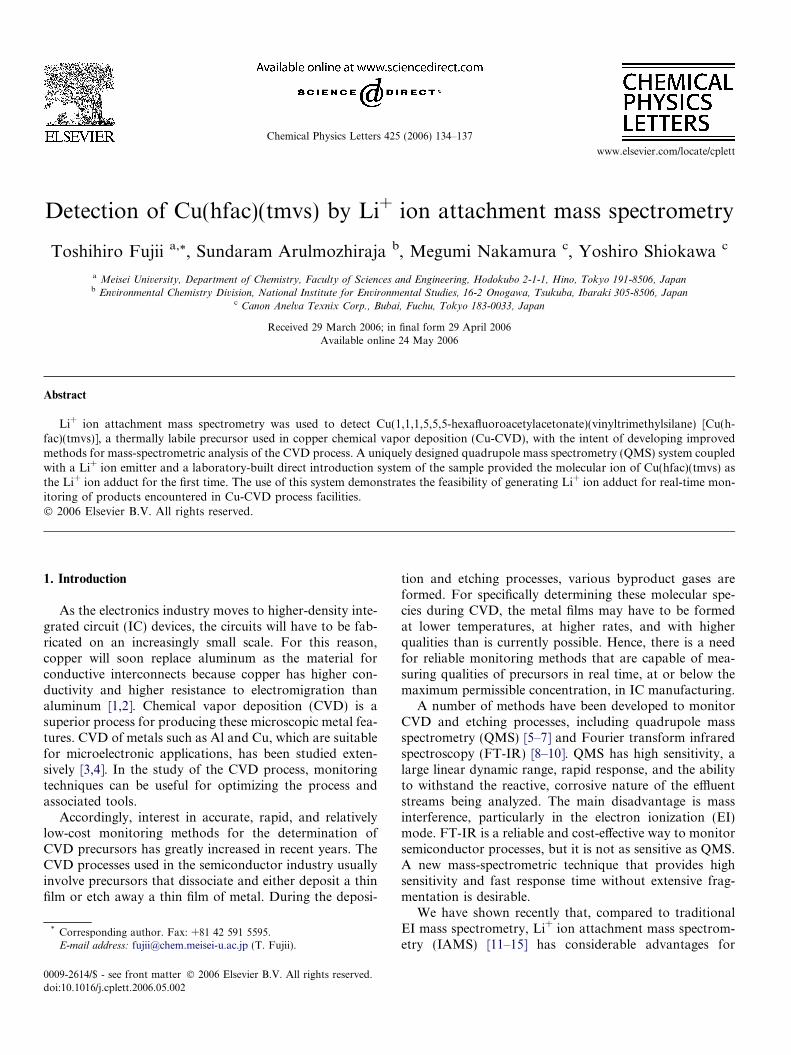
All experiments were performed with a modified versionof a specially prepared IAMS (Canon Anelva Corp.,Tokyo, Japan) consisting of a QMS, a Li+ ion emitter,and a reaction chamber (RC) (Fig. 1). The liquid Cu pre-cursor (CupraSelect; Schumacher Inc.) was delivered tothe sample vessel as a liquid. A stream of sample vaporfrom the vessel was directed into the reaction chamberequipped with the Li+ ion emitter. The flow of the precur-sor was regulated and measured with a variable-conduc-tance valve and a Baratron gauge, respectively.
The RC works as an ionization chamber, with appropri-ate connectors for precursor introduction. The reactor ispumped down to a base pressure of approximately10�4 Pa with a turbomolecular pump and then heated at150 �C under vacuum overnight before sample introduc-tion. The RC is fixed to the main vacuum envelope, which
Fig. 1. Schematic of the experimental setup. The system consists of aQMS equipped with a Li+ ion attachment reaction chamber. A gaseousstream of the Cu(hfac)(tmvs) reagent from a sample vessel is directed intothe reaction chamber through a variable-conductance valve (VCV). TMP:turbomolecular pump.
houses the QMS. All mass-spectrometric measurementswere performed downstream of the thermal reactor systemfor characterization of the precursor substances. The gassampling system consisted of a Teflon sample line, approx-imately 50 cm long.
The Li+ ion affinities of compounds of interest are crit-ical if quantitative results are desired, because the affinitiesaffect the relative sensitivity. In a previous study [15], weestablished an empirical relationship between Li+ ion affin-ities and the intensities of adduct ions, and from this rela-tionship we can estimate the relative sensitivity for organiccompounds of interest in cases in which the Li+ ion affinityis known. This empirical equation can in fact be used todirectly quantify ions from the mass-spectral response.
3. Results and discussion
3.1. Mass-spectrometric studies
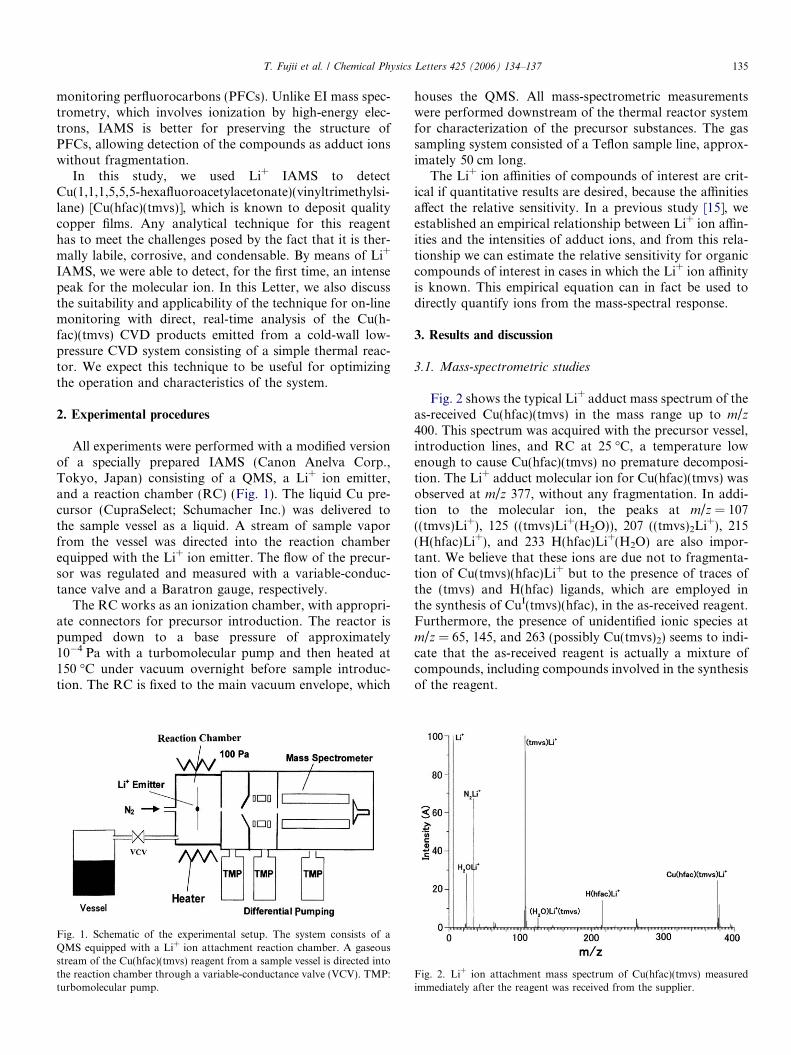
Fig. 2 shows the typical Li+ adduct mass spectrum of theas-received Cu(hfac)(tmvs) in the mass range up to m/z400. This spectrum was acquired with the precursor vessel,introduction lines, and RC at 25 �C, a temperature lowenough to cause Cu(hfac)(tmvs) no premature decomposi-tion. The Li+ adduct molecular ion for Cu(hfac)(tmvs) wasobserved at m/z 377, without any fragmentation. In addi-tion to the molecular ion, the peaks at m/z = 107((tmvs)Li+), 125 ((tmvs)Li+(H2O)), 207 ((tmvs)2Li+), 215(H(hfac)Li+), and 233 H(hfac)Li+(H2O) are also impor-tant. We believe that these ions are due not to fragmenta-tion of Cu(tmvs)(hfac)Li+ but to the presence of traces ofthe (tmvs) and H(hfac) ligands, which are employed inthe synthesis of CuI(tmvs)(hfac), in the as-received reagent.Furthermore, the presence of unidentified ionic species atm/z = 65, 145, and 263 (possibly Cu(tmvs)2) seems to indi-cate that the as-received reagent is actually a mixture ofcompounds, including compounds involved in the synthesisof the reagent.
Fig. 2. Li+ ion attachment mass spectrum of Cu(hfac)(tmvs) measuredimmediately after the reagent was received from the supplier.
136 T. Fujii et al. / Chemical Physics Letters 425 (2006) 134–137
Fig. 2 also includes the background peaks. The back-ground mass spectrum generally shows abundant H2OLi+
as well as other adduct ions with an intense peak at m/z 35,51, and 63. H2OLi+ is derived from ubiquitous water in thesystem and in the nitrogen carrier gas. Ions at m/z 35, 43,51, 53, and 63 can be assigned to N2Li+, (H2O)2Li+, CO2Li+,N2Li+(H2O), and (N2)2Li+, respectively.
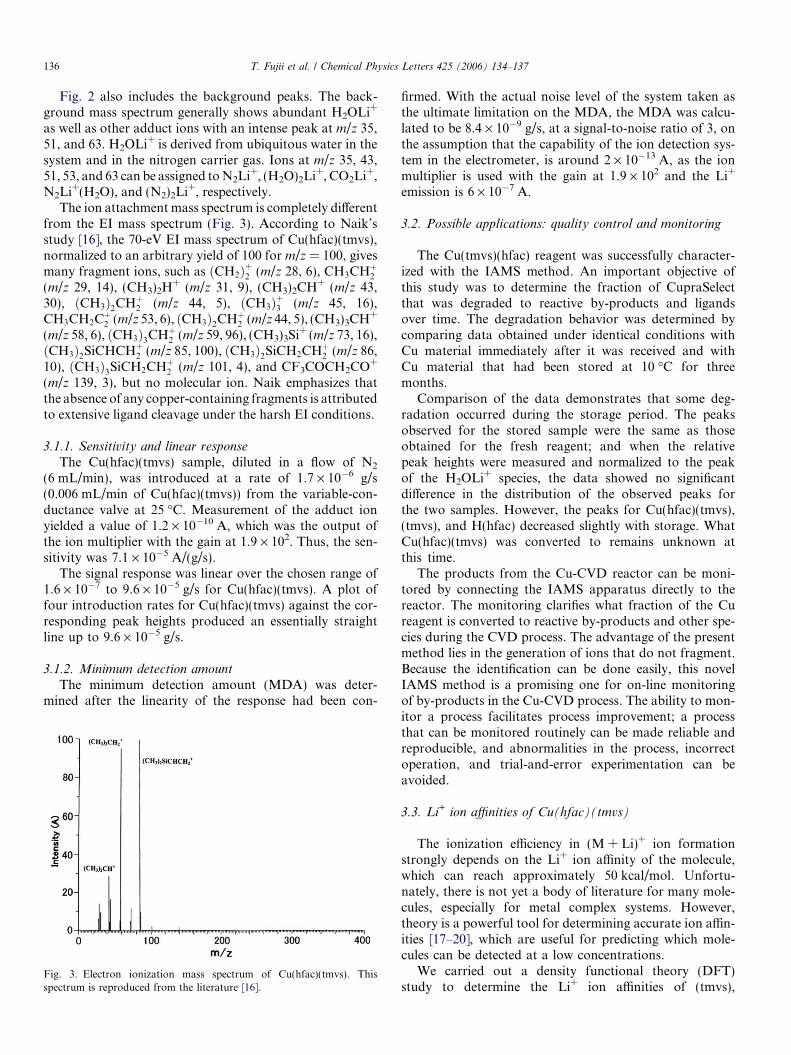
The ion attachment mass spectrum is completely differentfrom the EI mass spectrum (Fig. 3). According to Naik’sstudy [16], the 70-eV EI mass spectrum of Cu(hfac)(tmvs),normalized to an arbitrary yield of 100 for m/z = 100, givesmany fragment ions, such as ðCH2Þþ2 (m/z 28, 6), CH3CHþ2(m/z 29, 14), (CH3)2H+ (m/z 31, 9), (CH3)2CH+ (m/z 43,30), ðCH3Þ2CHþ2 (m/z 44, 5), ðCH3Þþ3 (m/z 45, 16),CH3CH2Cþ2 (m/z 53, 6), ðCH3Þ2CHþ2 (m/z 44, 5), (CH3)3CH+
(m/z 58, 6), ðCH3Þ3CHþ2 (m/z 59, 96), (CH3)3Si+ (m/z 73, 16),ðCH3Þ2SiCHCHþ2 (m/z 85, 100), ðCH3Þ2SiCH2CHþ2 (m/z 86,10), ðCH3Þ3SiCH2CHþ2 (m/z 101, 4), and CF3COCH2CO+
(m/z 139, 3), but no molecular ion. Naik emphasizes thatthe absence of any copper-containing fragments is attributedto extensive ligand cleavage under the harsh EI conditions.
3.1.1. Sensitivity and linear response
The Cu(hfac)(tmvs) sample, diluted in a flow of N2
(6 mL/min), was introduced at a rate of 1.7 · 10�6 g/s(0.006 mL/min of Cu(hfac)(tmvs)) from the variable-con-ductance valve at 25 �C. Measurement of the adduct ionyielded a value of 1.2 · 10�10 A, which was the output ofthe ion multiplier with the gain at 1.9 · 102. Thus, the sen-sitivity was 7.1 · 10�5 A/(g/s).
The signal response was linear over the chosen range of1.6 · 10�7 to 9.6 · 10�5 g/s for Cu(hfac)(tmvs). A plot offour introduction rates for Cu(hfac)(tmvs) against the cor-responding peak heights produced an essentially straightline up to 9.6 · 10�5 g/s.
3.1.2. Minimum detection amount
The minimum detection amount (MDA) was deter-mined after the linearity of the response had been con-
Fig. 3. Electron ionization mass spectrum of Cu(hfac)(tmvs). Thisspectrum is reproduced from the literature [16].
firmed. With the actual noise level of the system taken asthe ultimate limitation on the MDA, the MDA was calcu-lated to be 8.4 · 10�9 g/s, at a signal-to-noise ratio of 3, onthe assumption that the capability of the ion detection sys-tem in the electrometer, is around 2 · 10�13 A, as the ionmultiplier is used with the gain at 1.9 · 102 and the Li+
emission is 6 · 10�7 A.
3.2. Possible applications: quality control and monitoring
The Cu(tmvs)(hfac) reagent was successfully character-ized with the IAMS method. An important objective ofthis study was to determine the fraction of CupraSelectthat was degraded to reactive by-products and ligandsover time. The degradation behavior was determined bycomparing data obtained under identical conditions withCu material immediately after it was received and withCu material that had been stored at 10 �C for threemonths.
Comparison of the data demonstrates that some deg-radation occurred during the storage period. The peaksobserved for the stored sample were the same as thoseobtained for the fresh reagent; and when the relativepeak heights were measured and normalized to the peakof the H2OLi+ species, the data showed no significantdifference in the distribution of the observed peaks forthe two samples. However, the peaks for Cu(hfac)(tmvs),(tmvs), and H(hfac) decreased slightly with storage. WhatCu(hfac)(tmvs) was converted to remains unknown atthis time.
The products from the Cu-CVD reactor can be moni-tored by connecting the IAMS apparatus directly to thereactor. The monitoring clarifies what fraction of the Cureagent is converted to reactive by-products and other spe-cies during the CVD process. The advantage of the presentmethod lies in the generation of ions that do not fragment.Because the identification can be done easily, this novelIAMS method is a promising one for on-line monitoringof by-products in the Cu-CVD process. The ability to mon-itor a process facilitates process improvement; a processthat can be monitored routinely can be made reliable andreproducible, and abnormalities in the process, incorrectoperation, and trial-and-error experimentation can beavoided.
3.3. Li+ ion affinities of Cu(hfac)(tmvs)
The ionization efficiency in (M + Li)+ ion formationstrongly depends on the Li+ ion affinity of the molecule,which can reach approximately 50 kcal/mol. Unfortu-nately, there is not yet a body of literature for many mole-cules, especially for metal complex systems. However,theory is a powerful tool for determining accurate ion affin-ities [17–20], which are useful for predicting which mole-cules can be detected at a low concentrations.
We carried out a density functional theory (DFT)study to determine the Li+ ion affinities of (tmvs),
T. Fujii et al. / Chemical Physics Letters 425 (2006) 134–137 137
H(hfac), and Cu(hfac)(tmvs). We used the B3LYP hybriddensity functional with the 6-311 + G(d, p) basis set tocalculate the Li+ ion affinities of these species. Bothzero-point energy and thermal energy corrections wereincluded in the affinity values. All of the theoretical calcu-lations were done using GAUSSIAN 98 programs [21].Details of the calculations will be reported elsewhere.(tmvs), H(hfac), and Cu(hfac)(tmvs) were found to havelarge Li+ ion affinities—32.51, 36.91, and 50.75 kcal/mol(obtained at their respective most stable complex struc-tures), respectively. Compounds with high Li+ ion affinityvalues are readily detected at low levels. Therefore, wecan reasonably predict that these species should react withLi+ ions as easily as water (which has a Li+ ion affinity of36 kcal/mol) and hence should be as detectable as waterby this method.
4. Concluding remarks
IAMS mass spectrometry was used to detectCu(hfac)(tmvs), a copper complex used for Cu-CVD. Auniquely designed QMS system along with a Li+ ionattachment technique and a laboratory-built direct intro-duction system provided the molecular ion as a Li+ ionadduct, Cu(hfac)(tmvs)Li+, which could be used to mon-itor volume balances for the Cu-CVD reagent used dur-ing processing. This novel IAMS method is promisingfor on-line monitoring of by-products in the Cu-CVDprocess.
The experiments conducted in this study were limited inscope. More comprehensive work will be required for thedevelopment of a practical analytical method. In particu-lar, more work will be needed if the method is to be usedto determine the mechanism and reaction dynamics ofbyproduct formation. We believe that the newly developedIAMS method can be of immediate help in this study.
Acknowledgement
This work was supported in part by The New Energyand Industrial Technology Development Organization(NEDO) under a fund for Fundamental Technology Re-search Facilitation Program.
References
[1] H. Helneder, H. Korner, A. Mitchell, M. Schwerd, U. Seidel,Microelectron. Eng. 55 (2001) 257.
[2] T. Kwok, Mater. Chem. Phys. 33 (1993) 176.[3] D. Kim, R.H. Wentorf, W.N. Gill, J. Electrochem. Soc. 140 (1993)
3273.[4] S.K. Lakshmanan, W.N. Gill, Thin Solid Films 338 (1999) 24.[5] B. Zheng, C. Goldberg, E.T. Eisenbraun, J. Liu, A.E. Kaloeros, P.J.
Toscano, S.P. Murarka, J.F. Loan, J. Sullivan, Mater. Chem. Phys.41 (1995) 173.
[6] S.K. Lakshmanan, W.N. Gills, J. Vac. Sci. Technol. A 16 (1998)2187.
[7] V.M. Donnelly, M.E. Gross, J. Vac. Sci. Technol. A 11 (1993) 66.[8] J.E. Parmeter, J. Phys. Chem. 97 (1993) 11530.[9] J. Farkas, M.J. Hampden-Smith, T.T. Kodas, J. Phys. Chem. 98
(1994) 6753.[10] J. Pinkas, J.C. Huffman, D.V. Baxter, M.H. Chisholm, K.G. Caulton,
Chem. Mater. 7 (1995) 1589.[11] T. Fujii, M. Ogura, H. Jimba, Anal. Chem. 61 (1989) 1026.[12] T. Fujii, K. Syouji, Phys. Rev. A 46 (1992) 3555.[13] T. Fujii, Mass Spectrom. Rev. 19 (2000) 111.[14] T. Fujii, M.J. Kareev, J. Appl. Phys. 89 (2001) 2543.[15] M. Nakamura, K. Hino, T. Sasaki, Y. Shiokawa, T. Fujii, M.
Takayanagi, M. Nakata, J. Vac. Sci. Technol. A 22 (2004) 2347.[16] M.B. Naik, W.N. Gill, R.H. Wentorf, R.R. Reeves, Thin Solid Films
262 (1995) 60.[17] D. Stockigt, Chem. Phys. Lett. 250 (1996) 387.[18] M. Remko, Mol. Phys. 91 (1997) 929.[19] P.C. Miklis, R. Ditchfield, T.A. Spencer, J. Am. Chem. Soc. 120
(1998) 10482.[20] S. Arulmozhiraja, T. Fujii, J. Phys. Chem. 104 (2000) 9613.[21] M.J. Frisch et al., GAUSSIAN 98, Revision A.7, Gaussian, Inc,
Pittsburgh, PA, 1998.