Embed Size (px)
Citation preview
International Journal of Development and Sustainability
ISSN: 2186-8662 – www.isdsnet.com/ijds
Volume 8 Number 1 (2019): Pages 1-18
ISDS Article ID: IJDS18042603
Determinants of internal migration: A Case study of urban informal sector of Punjab
Neena Malhotra *, Pushpa Devi
Punjab School of Economics, Guru Nanak Dev University, Amritsar, India
Abstract
Migration is a universal phenomenon. Internal migration in India, particularly interstate and rural urban streams have
increased in volume and importance over time. Internal migration in India does not fill demand and supply gaps only
but acts as an instrument of survival for millions of poor population concentrated in the states of Uttar Pradesh, Bihar,
Rajasthan and Madhya Pradesh etc. The present study tries to identify important determinants of internal migration
in urban informal sector of Punjab. The study is based on primary survey of 500 respondents, 250 each in Ludhiana
and Amritsar, the two largest cities of Punjab. Push and Pull factors in internal migration have been identified by
applying Logit and Probit regression models. Majority of the internal migrants are young Hindu males who have
migrated to Punjab during last fifteen years. Most of the migrant workers in urban informal sector are either illiterate
or have low level of education and hence they have no option except for working in the informal sector. Most of these
migrants belong to Uttar Pradesh and Bihar and they come to Punjab because of better employment opportunities and
wages. The study finds that better work and help from earlier migrant friends and relatives are the major pull factors
in internal migration in India. Internal Migration is basically driven by push factors like lack of job opportunities for
young males, family problems, agriculture not being profitable, unemployment and landlessness. Among caste and
religion variables, the Hindus and OBCs are more likely to migrate.
Keywords: Internal Migration; Migrant Workers; Logit; Probit
* Corresponding author. E-mail address: [email protected]
Published by ISDS LLC, Japan | Copyright © 2019 by the Author(s) | This is an open access article distributed under the Creative
Commons Attribution License, which permits unrestricted use, distribution, and reproduction in any medium, provided the
original work is properly cited.
Cite this article as: Malhotra, N. and Devi, P. (2019), “Determinants of internal migration: A Case study of urban informal sector
of Punjab”, International Journal of Development and Sustainability, Vol. 8 No. 1, pp. 1-18.
International Journal of Development and Sustainability Vol. 8 No. 1 (2019): 1-18
2 ISDS www.isdsnet.com
1. Introduction
Mobility is an important part of human existence. However, all types of human mobility are not migration
(NSSO, 2010). Migration is a movement from one place to another place for the purpose of taking up permanent
or semi-permanent residence. Migration is classified as internal or international depending on whether the
movement is happening within or across national boundaries. Internal migration always plays an important
role in economic development of the country or region. This type of migration occurs mainly because of the
uneven development of regions or states (Misra, 1998). Uneven development is the main reason for migration
along with factors like unemployment, poverty, fragmentation of land and large family size etc. (DeJong and
Fawcett, 1981; Cherunilam, 1987).
Internal migration in India, particularly interstate and rural urban streams have increased in volume and
importance over time. Internal migration in India does not only fill demand and supply gaps but acts as an
instrument of survival for millions of poor population concentrated in the states of Uttar Pradesh, Bihar,
Rajasthan and Madhya Pradesh etc.
An individual’s decision to migrate depends upon a number of factors such as age, gender, education,
employment, marital status, and position in the household and household characteristics such as the income
level, wealth, religion, and caste(de Haas and Fokkema, 2010; Tsegai, 2007).Migration studies consistently find
that age is a major factor determining the probability of migration. Migration probability is seen to fall with
age and rise with educational attainment of migrant (Shwartz, 1976; Borjas, 2004). In internal migration,
distance is another factor which has encouraged people to migrate. The probability of migrating is inversely
related to the distance. Majority of the migrants prefer short distance migration because they remain aware of
job opportunities, living condition, language and place of destination. The greater the distance, the information
about the job opportunities is less so persons will migrate less. Distance also increases transport cost of
migration. Based on the human capital model, high unemployment rates in origin location should increase the
net benefits from migrating and push workers away. An unemployed person must assess the probability of
gaining employment at the potential destination. Unemployment rates in destination areas reduce the
probability that an unemployed person will migrate there (McConnell and Brue, 1986; Faist, 2000).
There are different factors which encourage people to migrate and such factors are economic, social,
political and cultural but migration is primarily encouraged by economic factors (NSSO, 1998). In a large
number of developing countries, low agricultural income, agricultural unemployment and underemployment
are considered as basic factors pushing the migrants towards prosperous or dynamic areas with greater job
opportunities. Economic factors which encourage migration may be termed as push factors and pull factors.
As per the 2001 Census, the total number of internal migrants was 309 million or nearly 30 per cent of the
total population. As per NSSO 2007-08 there are 326 million migrants in India. About 42.3 million migrants
migrate from other states (33 % from rural areas and 67% from urban areas). Large numbers of migrant
workers migrate from Uttar Pradesh (10.6 million) followed by Bihar (7.05 million), Madhya Pradesh (2.93
million) and Karnataka (1.98 million). Maharashtra, Delhi, Gujarat, Karnataka, Madhya Pradesh, Punjab and
Haryana are the main migration destination states. These are economically developed regions. Migration takes
International Journal of Development and Sustainability Vol. 8 No. 1 (2019): 1-18
ISDS www.isdsnet.com 3
place as a response to demand supply mismatch in labour markets. Migrant workers migrate from the
economically less developed areas to comparatively more developed areas (NSSO, 2010).
1.1. Review of literature
Most of the migrant studies have found that both push and pull factors play an important role in labour
migration. The pull factors which encourage the migrant workers to migrate new places are high wages, better
employment opportunities, increased industrialization, skill formation, better work environment,
opportunities for better education, availability of improved infrastructure, provision of basic amenities,
improved quality of life. On the other hand the major push factors compelling the migrant workers to quit from
the agricultural areas are poverty, unemployment and underemployment, low productivity, low income, crime
at native place, corruption and low level of living (Kumar and Sidhu, 2005; Bhagat, 2009; Chakraborty and Kuri
2013; Gimba and Kumshe, 2011; Malhotra 2015; Malhotra and Devi, 2016; Kohli, 2010; Sridhar et al., 2010;
Taralekar et al., 2012).
The size of net migration of the developed states has been found to be much higher than that of the
backward states. Poor and backward states actually show large population mobility, which is primarily in
search of a livelihood. Majority of the migrant workers migrate to industrially developed states like
Maharashtra and West Bengal. Similarly, the major out migration states are the backward states of Uttar
Pradesh and Bihar (Piplai et al., 1969; Mitra and Mayumi, 2008; Vipul Kant Singh et al., 2011; Chakraborty and
Kuri, 2013).
Lusome and Bhagat (2006) study finds that the reason for migration among the males is employment and
among the females is marriage. Male migrants who move out for work during their young age tend to return
to their origin place at old ages, which reduces the effectiveness of urbanization as a measure of economic or
industrial growth (Rele, 1969; Vipul Kant Singh et al., 2011; Jothy and Kalaiselvi, 2011; Shandilya and Singh,
2012)
Skeldon (1986) study finds that majority of the migrants enter the informal sector and hence create their
own employment. Bhattacharay (1996) study finds that informal sector played an important role in rural
urban migration. A large number of unskilled workers are migrating to work in the informal sector. Many
studies also find that the size of rural to urban migration was directly linked with the spread of urban informal
sector. The job opportunities available in urban informal sectors encourage migrant workers to migrate from
rural to urban areas (Bairagya, 2012; Banerjee, 1983; Chakraborty and Kuri, 2013). Misra, and Mohd. Saif Alam
(2014) study finds that the employers in the informal sector prefer migrants because it is easier to exploit
migrant workers as they may have lesser information about the labour market of the destination place.
2. Database and methodology
The present study is based on primary survey. For collecting the primary data, a detailed questionnaire dealing
with different aspects of internal migration was prepared. The sample comprises of 500 respondents, 250 each
from Amritsar and Ludhiana two largest cities in Punjab. As there is no compiled data on migrants in each city,
International Journal of Development and Sustainability Vol. 8 No. 1 (2019): 1-18
4 ISDS www.isdsnet.com
the method followed is convenient sampling and snowball sampling. Many migration studies have used
snowball sampling. In snowball sampling an initial migrant worker is selected usually as per convenience. After
being interviewed, the migrant workers are asked to identify other migrant workers. This method is used to
gain access to other migrant workers due to location difficulties associated with tracking them. The major
advantage of snowball sampling is that it substantially increases the likelihood of locating the migrant workers.
Data has been collected by personal interview method and the survey was conducted during the period of
September 2014 to May 2015.
2.1. Chi square test
Chi- square test is also known as test of goodness of fit. Chi- square is a non-parametric test and is important
in social science research. It is used to test if the deviation between observation (experiment) and theory may
be attributed to chance (fluctuations of sampling) or if it is really due to the inadequacy of the theory to fit the
observed data. It is denoted by χ2.
Under the Null Hypothesis that there is no significant difference between the observed and theoretical or
hypothetical values, i.e. there is good compatibility between theory and experiment, Karl Pearson proved that
the statistic
𝜒2 = ∑ [(𝑂𝑖−𝐸𝑖)2
𝐸𝑖]𝑛
𝑖=1 (1)
= (𝑂1−𝐸1)2
𝐸1+
(𝑂2−𝐸2)2
𝐸2+ ⋯ … … .
(𝑂𝑛−𝐸𝑛)2
𝐸𝑛 (2)
Follow 𝜒2 distribution with V= n-1, d.f. Where O1, O2,....................On are the observes frequency and
E1,E2,………………….En are the corresponding expected or theoretical frequencies obtain under some theory and
hypothesis.
In this survey level of significance has been taken at 1 percent. If calculated value of the 𝜒2 is greater than
the tabulated value, it is said to be significant. In other words, the discrepancy between the observed and
expected frequencies cannot be attributed to chance and we reject the null hypothesis. On the other hand If
calculated value of the 𝜒2 is less than the tabulated value, so null hypothesis is rejected and it is not significant
at 1 percent level.
2.2. Identification of push and pull factors
In our survey migrant workers have given a large number of reasons affecting migration decision. Some of
these reasons can be categorized as push factors while others are pull factors. Therefore, the respondents who
chose both push and pull factors can be classified as a set of people for whom both the push and pull factors
were important for migration.
Hence to separate the purely push from the purely pull factors, we define a variable Yi, for each individual
migrant, where
𝑌𝑖 =(Number of Pull reasons for migration chosen)
(𝑇𝑜𝑡𝑎𝑙 𝑁𝑢𝑚𝑏𝑒𝑟 𝑜𝑓 𝑟𝑒𝑎𝑠𝑜𝑛𝑠 𝑓𝑜𝑟 𝑚𝑖𝑔𝑟𝑎𝑡𝑖𝑜𝑛 )
International Journal of Development and Sustainability Vol. 8 No. 1 (2019): 1-18
ISDS www.isdsnet.com 5
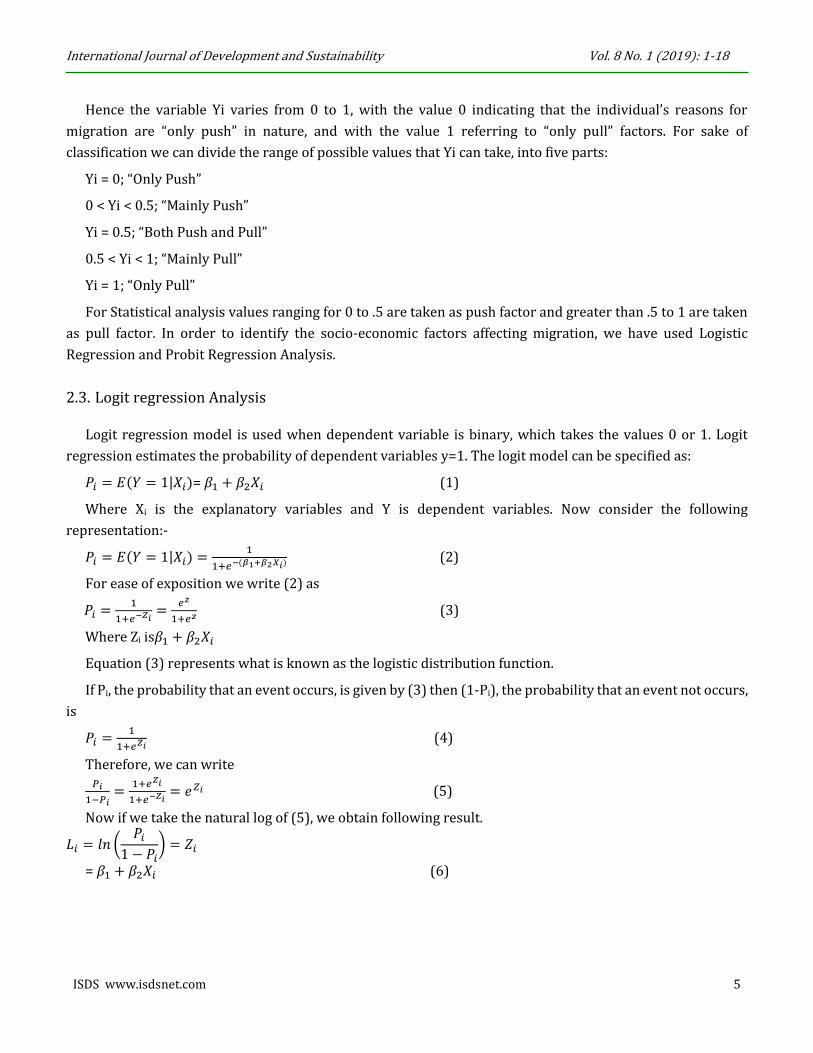
Hence the variable Yi varies from 0 to 1, with the value 0 indicating that the individual’s reasons for
migration are “only push” in nature, and with the value 1 referring to “only pull” factors. For sake of
classification we can divide the range of possible values that Yi can take, into five parts:
Yi = 0; “Only Push”
0 < Yi < 0.5; “Mainly Push”
Yi = 0.5; “Both Push and Pull”
0.5 < Yi < 1; “Mainly Pull”
Yi = 1; “Only Pull”
For Statistical analysis values ranging for 0 to .5 are taken as push factor and greater than .5 to 1 are taken
as pull factor. In order to identify the socio-economic factors affecting migration, we have used Logistic
Regression and Probit Regression Analysis.
2.3. Logit regression Analysis
Logit regression model is used when dependent variable is binary, which takes the values 0 or 1. Logit
regression estimates the probability of dependent variables y=1. The logit model can be specified as:
𝑃𝑖 = 𝐸(𝑌 = 1|𝑋𝑖)= 𝛽1 + 𝛽2𝑋𝑖 (1)
Where Xi is the explanatory variables and Y is dependent variables. Now consider the following
representation:-
𝑃𝑖 = 𝐸(𝑌 = 1|𝑋𝑖) =1
1+𝑒−(𝛽1+𝛽2𝑋𝑖) (2)
For ease of exposition we write (2) as
𝑃𝑖 =1
1+𝑒−𝑍𝑖=
𝑒𝑧
1+𝑒𝑧 (3)
Where Zi is𝛽1 + 𝛽2𝑋𝑖
Equation (3) represents what is known as the logistic distribution function.
If Pi, the probability that an event occurs, is given by (3) then (1-Pi), the probability that an event not occurs,
is
𝑃𝑖 =1
1+𝑒𝑍𝑖 (4)
Therefore, we can write 𝑃𝑖
1−𝑃𝑖=
1+𝑒𝑍𝑖
1+𝑒−𝑍𝑖= 𝑒𝑍𝑖 (5)
Now if we take the natural log of (5), we obtain following result.
𝐿𝑖 = 𝑙𝑛 (𝑃𝑖
1 − 𝑃𝑖) = 𝑍𝑖
= 𝛽1 + 𝛽2𝑋𝑖 (6)
International Journal of Development and Sustainability Vol. 8 No. 1 (2019): 1-18
6 ISDS www.isdsnet.com
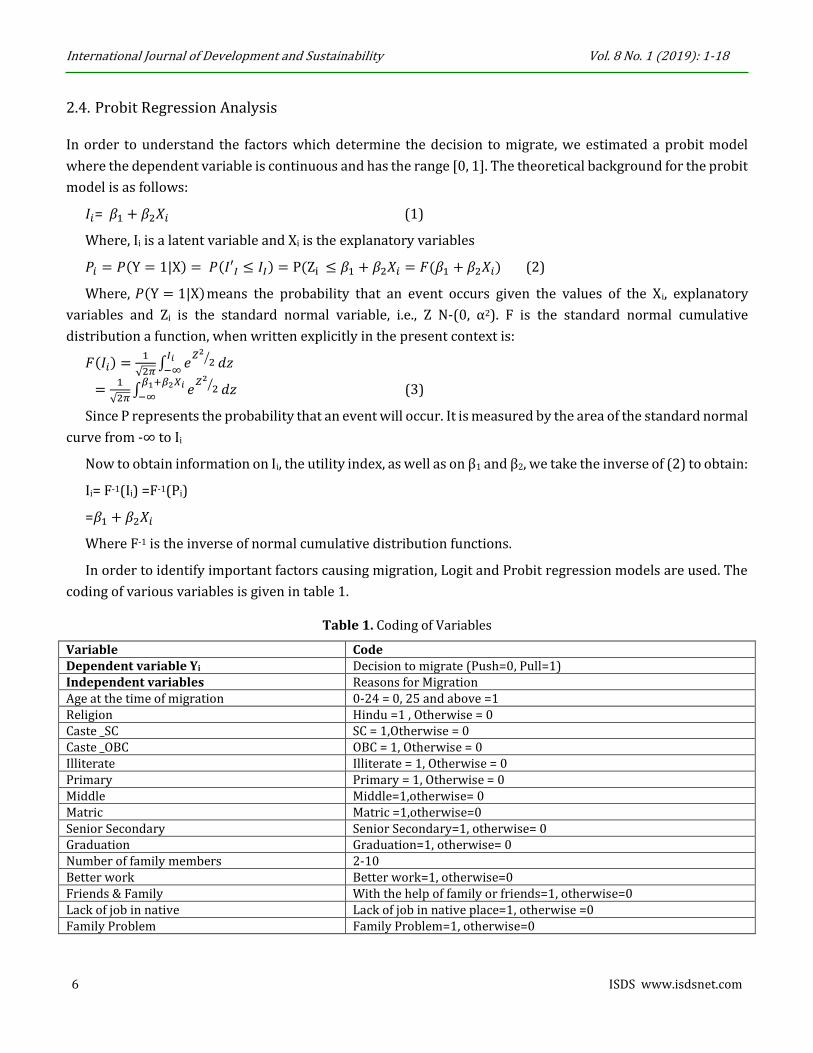
2.4. Probit Regression Analysis
In order to understand the factors which determine the decision to migrate, we estimated a probit model
where the dependent variable is continuous and has the range [0, 1]. The theoretical background for the probit
model is as follows:
𝐼𝑖= 𝛽1 + 𝛽2𝑋𝑖 (1)
Where, Ii is a latent variable and Xi is the explanatory variables
𝑃𝑖 = 𝑃(Y = 1|X) = 𝑃(𝐼′𝐼 ≤ 𝐼𝐼) = P(Zi ≤ 𝛽1 + 𝛽2𝑋𝑖 = 𝐹(𝛽1 + 𝛽2𝑋𝑖) (2)
Where, 𝑃(Y = 1|X)means the probability that an event occurs given the values of the Xi, explanatory
variables and Zi is the standard normal variable, i.e., Z N-(0, α2). F is the standard normal cumulative
distribution a function, when written explicitly in the present context is:
𝐹(𝐼𝑖) =1
√2𝜋∫ 𝑒
𝑍2
2⁄𝐼𝑖
−∞𝑑𝑧
=1
√2𝜋∫ 𝑒
𝑍2
2⁄𝛽1+𝛽2𝑋𝑖
−∞𝑑𝑧 (3)
Since P represents the probability that an event will occur. It is measured by the area of the standard normal
curve from -∞ to Ii
Now to obtain information on Ii, the utility index, as well as on β1 and β2, we take the inverse of (2) to obtain:
Ii= F-1(Ii) =F-1(Pi)
=𝛽1 + 𝛽2𝑋𝑖
Where F-1 is the inverse of normal cumulative distribution functions.
In order to identify important factors causing migration, Logit and Probit regression models are used. The
coding of various variables is given in table 1.
Table 1. Coding of Variables
Variable Code Dependent variable Yi Decision to migrate (Push=0, Pull=1) Independent variables Reasons for Migration Age at the time of migration 0-24 = 0, 25 and above =1 Religion Hindu =1 , Otherwise = 0 Caste _SC SC = 1,Otherwise = 0 Caste _OBC OBC = 1, Otherwise = 0 Illiterate Illiterate = 1, Otherwise = 0 Primary Primary = 1, Otherwise = 0 Middle Middle=1,otherwise= 0 Matric Matric =1,otherwise=0 Senior Secondary Senior Secondary=1, otherwise= 0 Graduation Graduation=1, otherwise= 0 Number of family members 2-10 Better work Better work=1, otherwise=0 Friends & Family With the help of family or friends=1, otherwise=0 Lack of job in native Lack of job in native place=1, otherwise =0 Family Problem Family Problem=1, otherwise=0
International Journal of Development and Sustainability Vol. 8 No. 1 (2019): 1-18
ISDS www.isdsnet.com 7
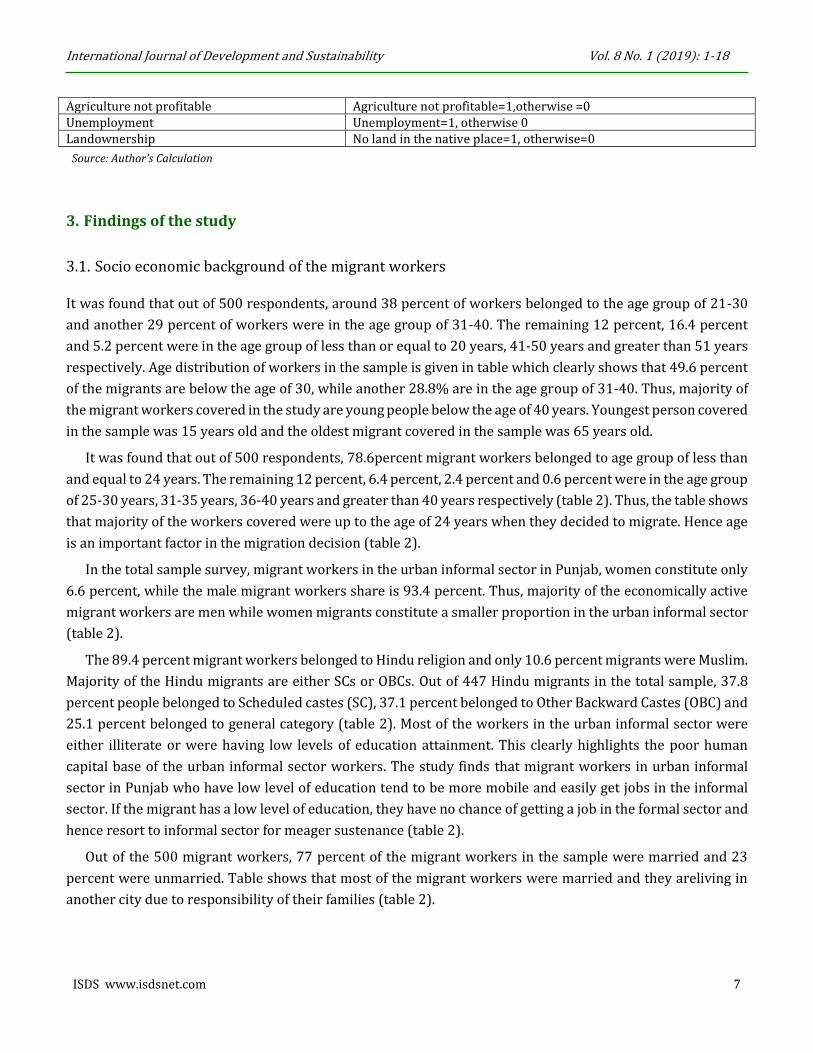
Agriculture not profitable Agriculture not profitable=1,otherwise =0 Unemployment Unemployment=1, otherwise 0 Landownership No land in the native place=1, otherwise=0
Source: Author’s Calculation
3. Findings of the study
3.1. Socio economic background of the migrant workers
It was found that out of 500 respondents, around 38 percent of workers belonged to the age group of 21-30
and another 29 percent of workers were in the age group of 31-40. The remaining 12 percent, 16.4 percent
and 5.2 percent were in the age group of less than or equal to 20 years, 41-50 years and greater than 51 years
respectively. Age distribution of workers in the sample is given in table which clearly shows that 49.6 percent
of the migrants are below the age of 30, while another 28.8% are in the age group of 31-40. Thus, majority of
the migrant workers covered in the study are young people below the age of 40 years. Youngest person covered
in the sample was 15 years old and the oldest migrant covered in the sample was 65 years old.
It was found that out of 500 respondents, 78.6percent migrant workers belonged to age group of less than
and equal to 24 years. The remaining 12 percent, 6.4 percent, 2.4 percent and 0.6 percent were in the age group
of 25-30 years, 31-35 years, 36-40 years and greater than 40 years respectively (table 2). Thus, the table shows
that majority of the workers covered were up to the age of 24 years when they decided to migrate. Hence age
is an important factor in the migration decision (table 2).
In the total sample survey, migrant workers in the urban informal sector in Punjab, women constitute only
6.6 percent, while the male migrant workers share is 93.4 percent. Thus, majority of the economically active
migrant workers are men while women migrants constitute a smaller proportion in the urban informal sector
(table 2).
The 89.4 percent migrant workers belonged to Hindu religion and only 10.6 percent migrants were Muslim.
Majority of the Hindu migrants are either SCs or OBCs. Out of 447 Hindu migrants in the total sample, 37.8
percent people belonged to Scheduled castes (SC), 37.1 percent belonged to Other Backward Castes (OBC) and
25.1 percent belonged to general category (table 2). Most of the workers in the urban informal sector were
either illiterate or were having low levels of education attainment. This clearly highlights the poor human
capital base of the urban informal sector workers. The study finds that migrant workers in urban informal
sector in Punjab who have low level of education tend to be more mobile and easily get jobs in the informal
sector. If the migrant has a low level of education, they have no chance of getting a job in the formal sector and
hence resort to informal sector for meager sustenance (table 2).
Out of the 500 migrant workers, 77 percent of the migrant workers in the sample were married and 23
percent were unmarried. Table shows that most of the migrant workers were married and they areliving in
another city due to responsibility of their families (table 2).
International Journal of Development and Sustainability Vol. 8 No. 1 (2019): 1-18
8 ISDS www.isdsnet.com
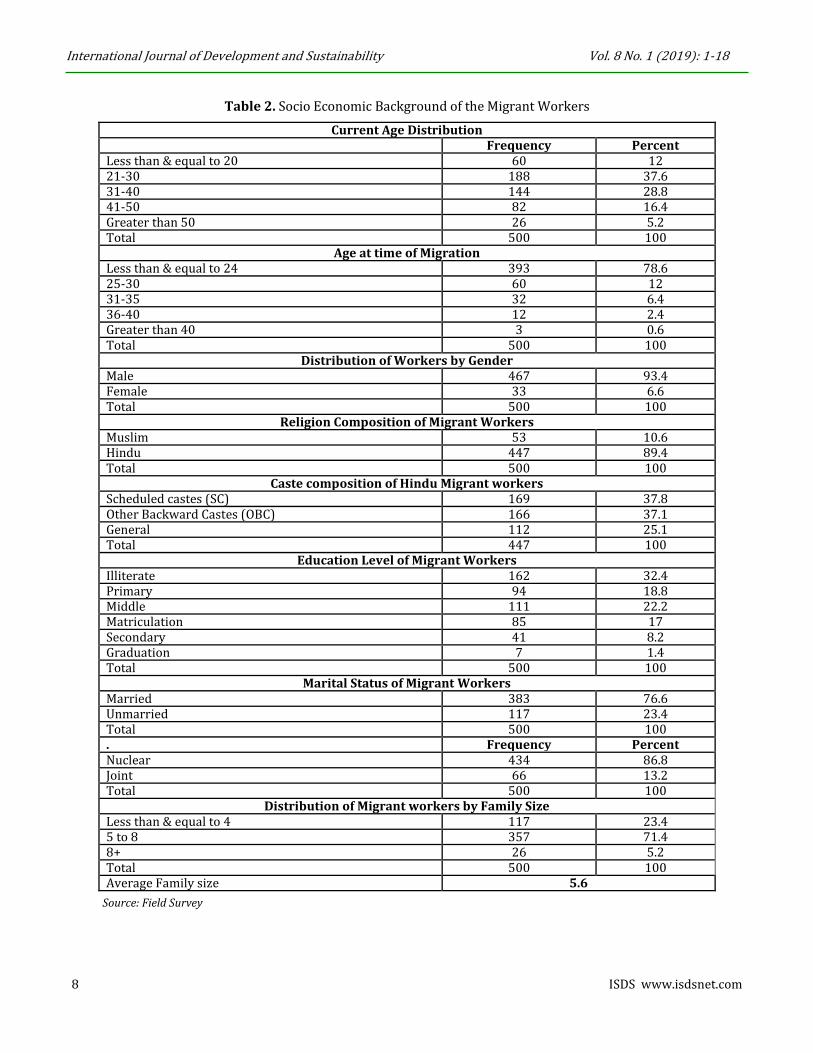
Table 2. Socio Economic Background of the Migrant Workers
Current Age Distribution Frequency Percent Less than & equal to 20 60 12 21-30 188 37.6 31-40 144 28.8 41-50 82 16.4 Greater than 50 26 5.2 Total 500 100
Age at time of Migration Less than & equal to 24 393 78.6 25-30 60 12 31-35 32 6.4 36-40 12 2.4 Greater than 40 3 0.6 Total 500 100
Distribution of Workers by Gender Male 467 93.4 Female 33 6.6 Total 500 100
Religion Composition of Migrant Workers Muslim 53 10.6 Hindu 447 89.4 Total 500 100
Caste composition of Hindu Migrant workers Scheduled castes (SC) 169 37.8 Other Backward Castes (OBC) 166 37.1 General 112 25.1 Total 447 100
Education Level of Migrant Workers Illiterate 162 32.4 Primary 94 18.8 Middle 111 22.2 Matriculation 85 17 Secondary 41 8.2 Graduation 7 1.4 Total 500 100
Marital Status of Migrant Workers Married 383 76.6 Unmarried 117 23.4 Total 500 100 . Frequency Percent Nuclear 434 86.8 Joint 66 13.2 Total 500 100
Distribution of Migrant workers by Family Size Less than & equal to 4 117 23.4 5 to 8 357 71.4 8+ 26 5.2 Total 500 100 Average Family size 5.6
Source: Field Survey
International Journal of Development and Sustainability Vol. 8 No. 1 (2019): 1-18
ISDS www.isdsnet.com 9
Family size influences the migration decision in several ways. As the family size increases the possibly of
migration will increase. According to census 2001, the average family size in India is 5.6. It was found that out
of 500 respondents, about 87 percent migrants belonged to nuclear families and 13.2 percent migrant workers
belonged to joint family system. Table presents that out of 500 respondents, 71.4 percent workers had the
family size of 5-8 members and 23.4 percent workers had the family size of up to 4 members. Only 5.2 percent
respondents had family size of more than 8. The average family size was 5.6(table 2).
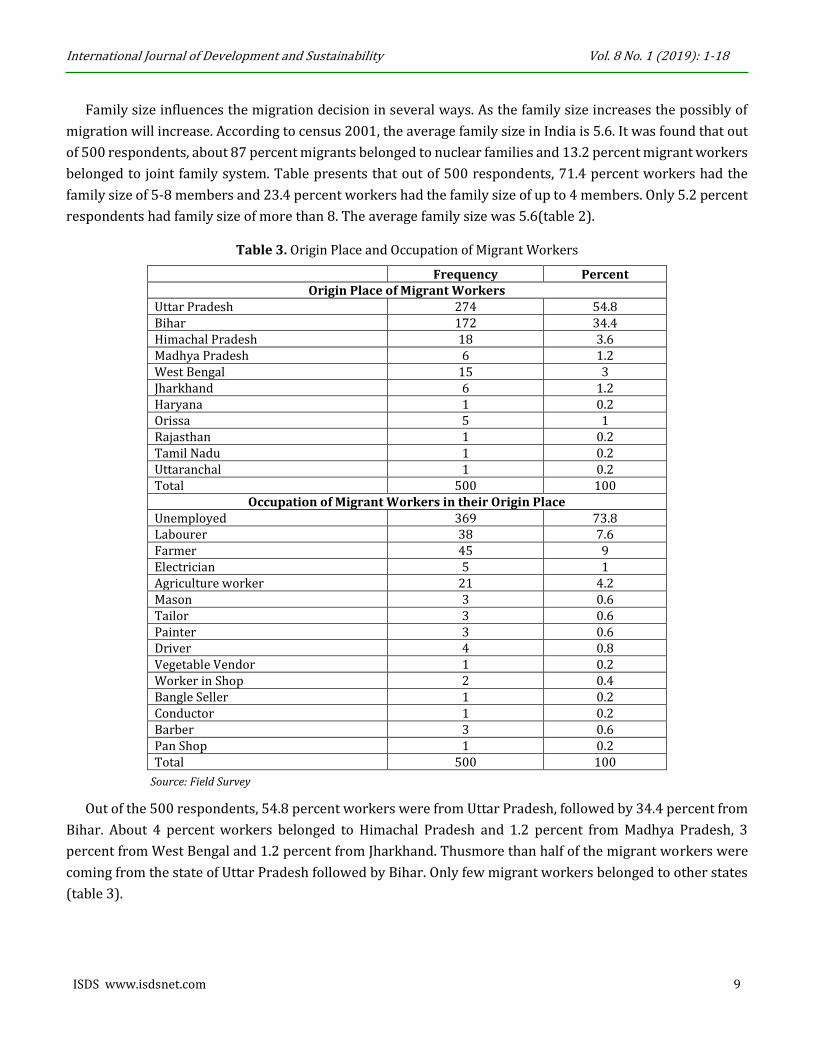
Table 3. Origin Place and Occupation of Migrant Workers
Frequency Percent Origin Place of Migrant Workers
Uttar Pradesh 274 54.8 Bihar 172 34.4 Himachal Pradesh 18 3.6 Madhya Pradesh 6 1.2 West Bengal 15 3 Jharkhand 6 1.2 Haryana 1 0.2 Orissa 5 1 Rajasthan 1 0.2 Tamil Nadu 1 0.2 Uttaranchal 1 0.2 Total 500 100
Occupation of Migrant Workers in their Origin Place Unemployed 369 73.8 Labourer 38 7.6 Farmer 45 9 Electrician 5 1 Agriculture worker 21 4.2 Mason 3 0.6 Tailor 3 0.6 Painter 3 0.6 Driver 4 0.8 Vegetable Vendor 1 0.2 Worker in Shop 2 0.4 Bangle Seller 1 0.2 Conductor 1 0.2 Barber 3 0.6 Pan Shop 1 0.2 Total 500 100
Source: Field Survey
Out of the 500 respondents, 54.8 percent workers were from Uttar Pradesh, followed by 34.4 percent from
Bihar. About 4 percent workers belonged to Himachal Pradesh and 1.2 percent from Madhya Pradesh, 3
percent from West Bengal and 1.2 percent from Jharkhand. Thusmore than half of the migrant workers were
coming from the state of Uttar Pradesh followed by Bihar. Only few migrant workers belonged to other states
(table 3).
International Journal of Development and Sustainability Vol. 8 No. 1 (2019): 1-18
10 ISDS www.isdsnet.com
Out of the 500 respondent’s 73.8 percent workers were unemployed and 26.2 percent were employed. It is
seen from the table 7.8 that among those who were employed, only a small proportion was farmers while the
remaining were labourers or working in the informal sector. Availability of job opportunity and better quality
of job condition play an important role in the decision of migration process. Pre migration occupation also
enables us to understand the causes of migration (table 3).
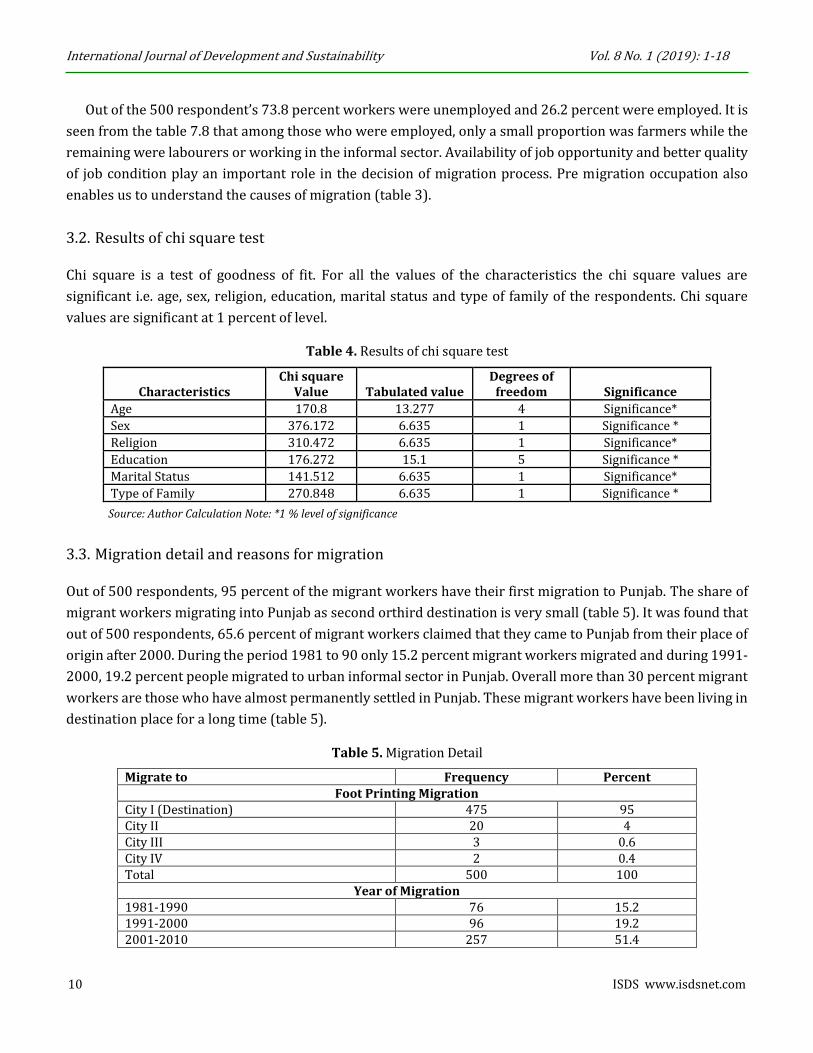
3.2. Results of chi square test
Chi square is a test of goodness of fit. For all the values of the characteristics the chi square values are
significant i.e. age, sex, religion, education, marital status and type of family of the respondents. Chi square
values are significant at 1 percent of level.
Table 4. Results of chi square test
Characteristics Chi square
Value Tabulated value Degrees of
freedom Significance
Age 170.8 13.277 4 Significance*
Sex 376.172 6.635 1 Significance *
Religion 310.472 6.635 1 Significance*
Education 176.272 15.1 5 Significance *
Marital Status 141.512 6.635 1 Significance*
Type of Family 270.848 6.635 1 Significance *
Source: Author Calculation Note: *1 % level of significance
3.3. Migration detail and reasons for migration
Out of 500 respondents, 95 percent of the migrant workers have their first migration to Punjab. The share of
migrant workers migrating into Punjab as second orthird destination is very small (table 5). It was found that
out of 500 respondents, 65.6 percent of migrant workers claimed that they came to Punjab from their place of
origin after 2000. During the period 1981 to 90 only 15.2 percent migrant workers migrated and during 1991-
2000, 19.2 percent people migrated to urban informal sector in Punjab. Overall more than 30 percent migrant
workers are those who have almost permanently settled in Punjab. These migrant workers have been living in
destination place for a long time (table 5).
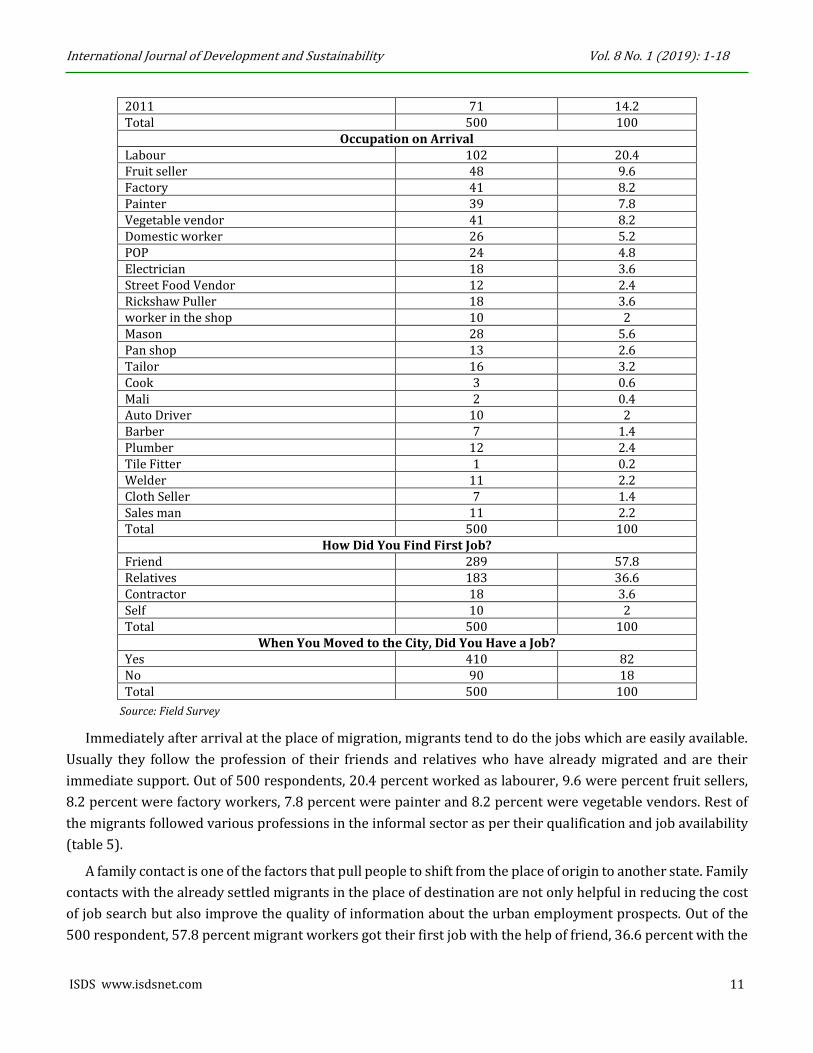
Table 5. Migration Detail
Migrate to Frequency Percent Foot Printing Migration
City I (Destination) 475 95 City II 20 4 City III 3 0.6 City IV 2 0.4 Total 500 100
Year of Migration 1981-1990 76 15.2 1991-2000 96 19.2 2001-2010 257 51.4
International Journal of Development and Sustainability Vol. 8 No. 1 (2019): 1-18
ISDS www.isdsnet.com 11
2011 71 14.2 Total 500 100
Occupation on Arrival Labour 102 20.4 Fruit seller 48 9.6 Factory 41 8.2 Painter 39 7.8 Vegetable vendor 41 8.2 Domestic worker 26 5.2 POP 24 4.8 Electrician 18 3.6 Street Food Vendor 12 2.4 Rickshaw Puller 18 3.6 worker in the shop 10 2 Mason 28 5.6 Pan shop 13 2.6 Tailor 16 3.2 Cook 3 0.6 Mali 2 0.4 Auto Driver 10 2 Barber 7 1.4 Plumber 12 2.4 Tile Fitter 1 0.2 Welder 11 2.2 Cloth Seller 7 1.4 Sales man 11 2.2 Total 500 100
How Did You Find First Job? Friend 289 57.8 Relatives 183 36.6 Contractor 18 3.6 Self 10 2 Total 500 100
When You Moved to the City, Did You Have a Job? Yes 410 82 No 90 18 Total 500 100
Source: Field Survey
Immediately after arrival at the place of migration, migrants tend to do the jobs which are easily available.
Usually they follow the profession of their friends and relatives who have already migrated and are their
immediate support. Out of 500 respondents, 20.4 percent worked as labourer, 9.6 were percent fruit sellers,
8.2 percent were factory workers, 7.8 percent were painter and 8.2 percent were vegetable vendors. Rest of
the migrants followed various professions in the informal sector as per their qualification and job availability
(table 5).
A family contact is one of the factors that pull people to shift from the place of origin to another state. Family
contacts with the already settled migrants in the place of destination are not only helpful in reducing the cost
of job search but also improve the quality of information about the urban employment prospects. Out of the
500 respondent, 57.8 percent migrant workers got their first job with the help of friend, 36.6 percent with the
International Journal of Development and Sustainability Vol. 8 No. 1 (2019): 1-18
12 ISDS www.isdsnet.com
help of theirrelatives and 3.6 with the help of contractor. Only 2 percent migrant workers found their first job
themselves (table 4). Out of 500 respondents, 82 percent of the sample migrants did have a job on arrival in
the city and only 18 percent migrants had to wait for some days or weeks to get their first job on arrival. Thus,
most of the migrants move to the city in the expectation of assured work opportunities (table 5).
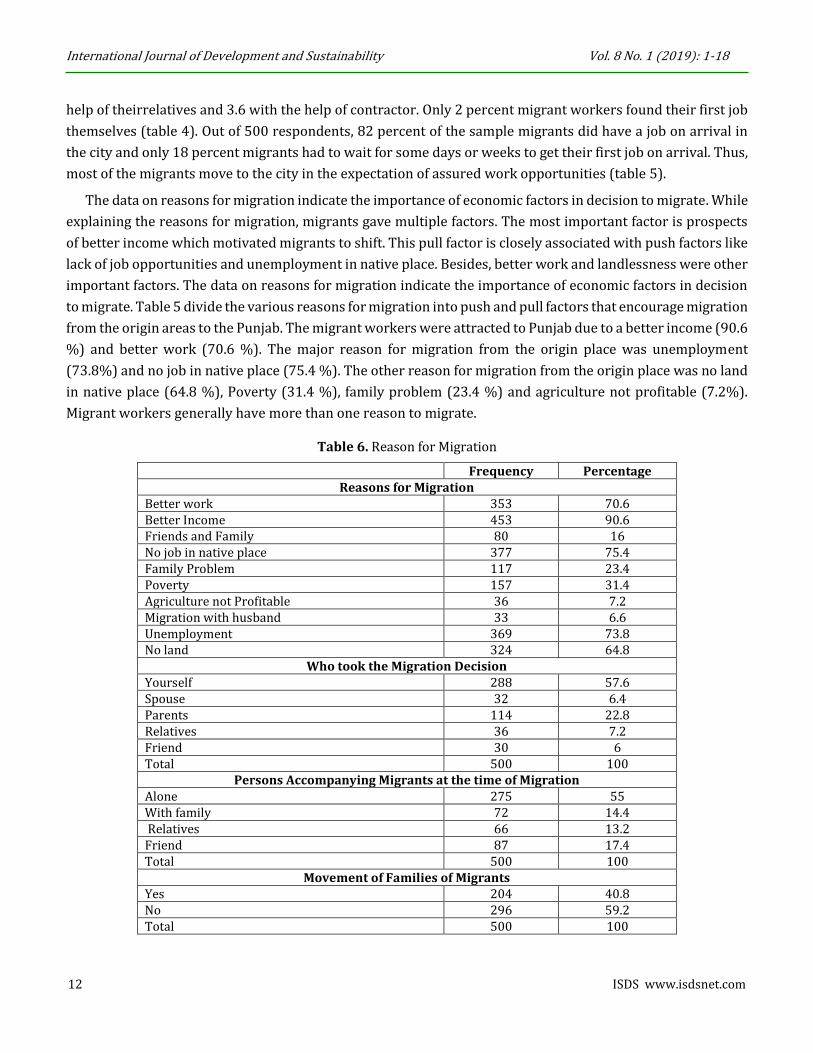
The data on reasons for migration indicate the importance of economic factors in decision to migrate. While
explaining the reasons for migration, migrants gave multiple factors. The most important factor is prospects
of better income which motivated migrants to shift. This pull factor is closely associated with push factors like
lack of job opportunities and unemployment in native place. Besides, better work and landlessness were other
important factors. The data on reasons for migration indicate the importance of economic factors in decision
to migrate. Table 5 divide the various reasons for migration into push and pull factors that encourage migration
from the origin areas to the Punjab. The migrant workers were attracted to Punjab due to a better income (90.6
%) and better work (70.6 %). The major reason for migration from the origin place was unemployment
(73.8%) and no job in native place (75.4 %). The other reason for migration from the origin place was no land
in native place (64.8 %), Poverty (31.4 %), family problem (23.4 %) and agriculture not profitable (7.2%).
Migrant workers generally have more than one reason to migrate.
Table 6. Reason for Migration
Frequency Percentage Reasons for Migration
Better work 353 70.6 Better Income 453 90.6 Friends and Family 80 16 No job in native place 377 75.4 Family Problem 117 23.4 Poverty 157 31.4 Agriculture not Profitable 36 7.2 Migration with husband 33 6.6 Unemployment 369 73.8 No land 324 64.8
Who took the Migration Decision Yourself 288 57.6 Spouse 32 6.4 Parents 114 22.8 Relatives 36 7.2 Friend 30 6 Total 500 100
Persons Accompanying Migrants at the time of Migration Alone 275 55 With family 72 14.4 Relatives 66 13.2 Friend 87 17.4 Total 500 100
Movement of Families of Migrants Yes 204 40.8 No 296 59.2 Total 500 100
International Journal of Development and Sustainability Vol. 8 No. 1 (2019): 1-18
ISDS www.isdsnet.com 13
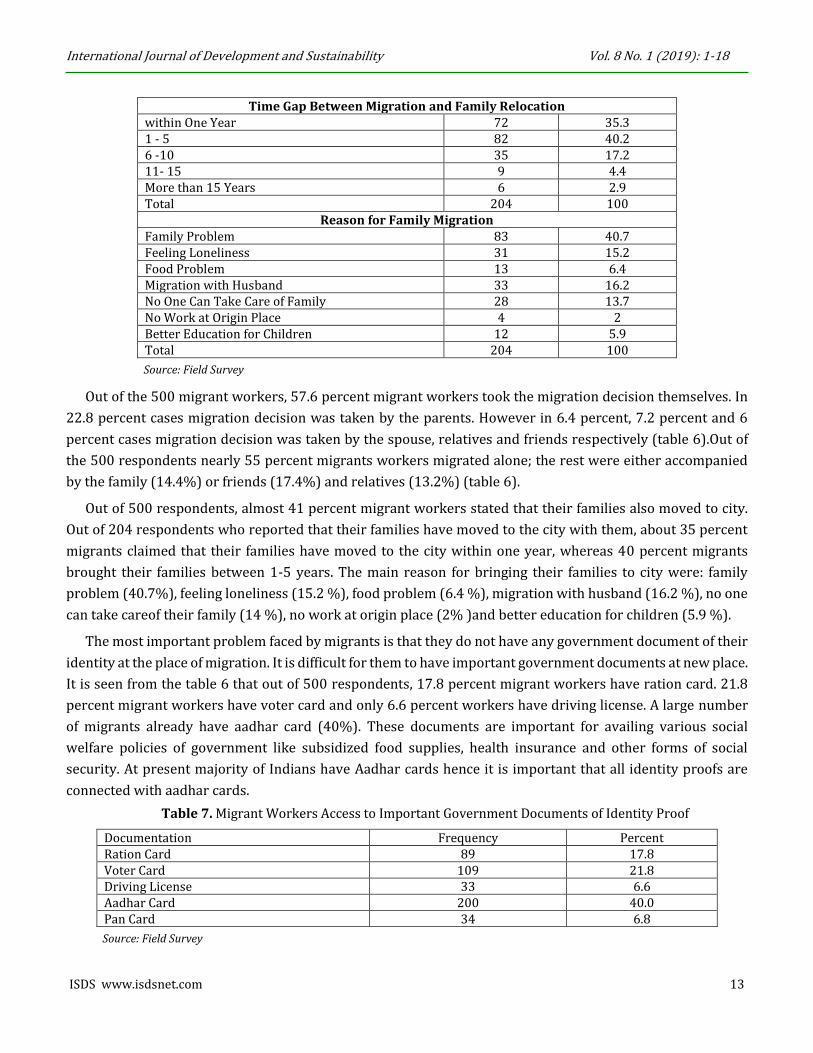
Time Gap Between Migration and Family Relocation within One Year 72 35.3 1 - 5 82 40.2 6 -10 35 17.2 11- 15 9 4.4 More than 15 Years 6 2.9 Total 204 100
Reason for Family Migration Family Problem 83 40.7 Feeling Loneliness 31 15.2 Food Problem 13 6.4 Migration with Husband 33 16.2 No One Can Take Care of Family 28 13.7 No Work at Origin Place 4 2 Better Education for Children 12 5.9 Total 204 100
Source: Field Survey
Out of the 500 migrant workers, 57.6 percent migrant workers took the migration decision themselves. In
22.8 percent cases migration decision was taken by the parents. However in 6.4 percent, 7.2 percent and 6
percent cases migration decision was taken by the spouse, relatives and friends respectively (table 6).Out of
the 500 respondents nearly 55 percent migrants workers migrated alone; the rest were either accompanied
by the family (14.4%) or friends (17.4%) and relatives (13.2%) (table 6).
Out of 500 respondents, almost 41 percent migrant workers stated that their families also moved to city.
Out of 204 respondents who reported that their families have moved to the city with them, about 35 percent
migrants claimed that their families have moved to the city within one year, whereas 40 percent migrants
brought their families between 1-5 years. The main reason for bringing their families to city were: family
problem (40.7%), feeling loneliness (15.2 %), food problem (6.4 %), migration with husband (16.2 %), no one
can take careof their family (14 %), no work at origin place (2% )and better education for children (5.9 %).
The most important problem faced by migrants is that they do not have any government document of their
identity at the place of migration. It is difficult for them to have important government documents at new place.
It is seen from the table 6 that out of 500 respondents, 17.8 percent migrant workers have ration card. 21.8
percent migrant workers have voter card and only 6.6 percent workers have driving license. A large number
of migrants already have aadhar card (40%). These documents are important for availing various social
welfare policies of government like subsidized food supplies, health insurance and other forms of social
security. At present majority of Indians have Aadhar cards hence it is important that all identity proofs are
connected with aadhar cards.
Table 7. Migrant Workers Access to Important Government Documents of Identity Proof
Documentation Frequency Percent Ration Card 89 17.8 Voter Card 109 21.8 Driving License 33 6.6 Aadhar Card 200 40.0 Pan Card 34 6.8
Source: Field Survey
International Journal of Development and Sustainability Vol. 8 No. 1 (2019): 1-18
14 ISDS www.isdsnet.com
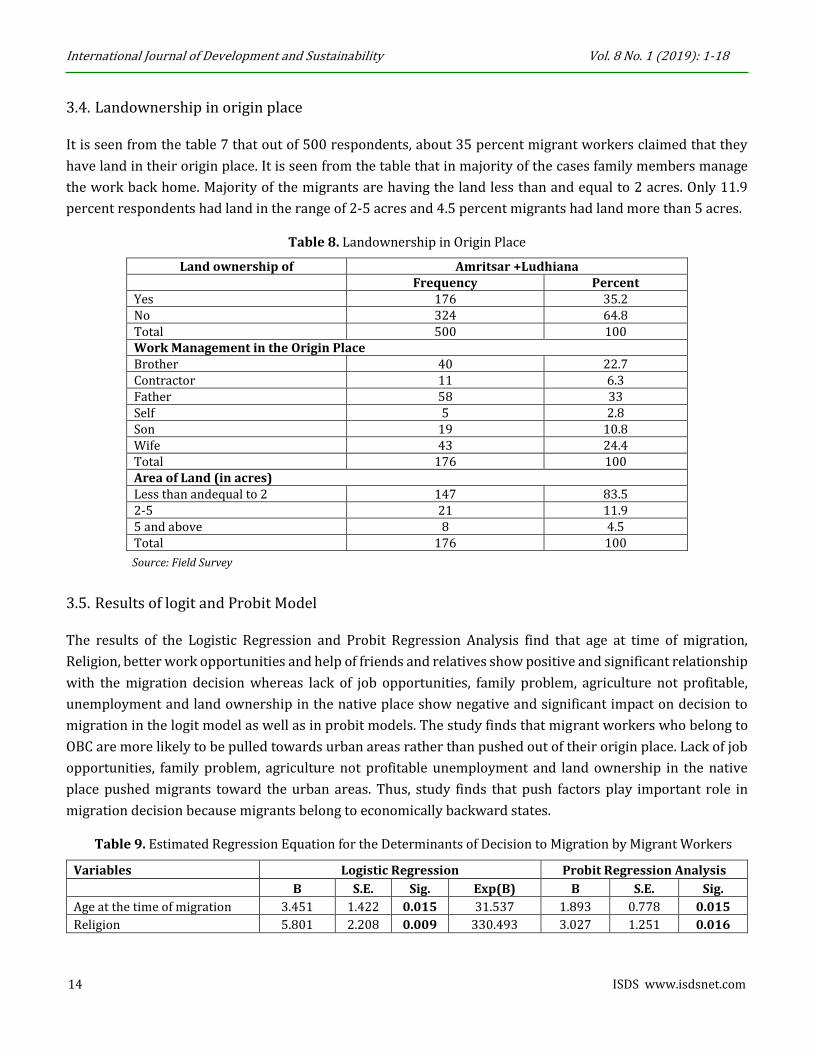
3.4. Landownership in origin place
It is seen from the table 7 that out of 500 respondents, about 35 percent migrant workers claimed that they
have land in their origin place. It is seen from the table that in majority of the cases family members manage
the work back home. Majority of the migrants are having the land less than and equal to 2 acres. Only 11.9
percent respondents had land in the range of 2-5 acres and 4.5 percent migrants had land more than 5 acres.
Table 8. Landownership in Origin Place
Land ownership of Amritsar +Ludhiana Frequency Percent Yes 176 35.2 No 324 64.8 Total 500 100 Work Management in the Origin Place Brother 40 22.7 Contractor 11 6.3 Father 58 33 Self 5 2.8 Son 19 10.8 Wife 43 24.4 Total 176 100 Area of Land (in acres) Less than andequal to 2 147 83.5 2-5 21 11.9 5 and above 8 4.5 Total 176 100
Source: Field Survey
3.5. Results of logit and Probit Model
The results of the Logistic Regression and Probit Regression Analysis find that age at time of migration,
Religion, better work opportunities and help of friends and relatives show positive and significant relationship
with the migration decision whereas lack of job opportunities, family problem, agriculture not profitable,
unemployment and land ownership in the native place show negative and significant impact on decision to
migration in the logit model as well as in probit models. The study finds that migrant workers who belong to
OBC are more likely to be pulled towards urban areas rather than pushed out of their origin place. Lack of job
opportunities, family problem, agriculture not profitable unemployment and land ownership in the native
place pushed migrants toward the urban areas. Thus, study finds that push factors play important role in
migration decision because migrants belong to economically backward states.
Table 9. Estimated Regression Equation for the Determinants of Decision to Migration by Migrant Workers
Variables Logistic Regression Probit Regression Analysis B S.E. Sig. Exp(B) B S.E. Sig.
Age at the time of migration 3.451 1.422 0.015 31.537 1.893 0.778 0.015
Religion 5.801 2.208 0.009 330.493 3.027 1.251 0.016

International Journal of Development and Sustainability Vol. 8 No. 1 (2019): 1-18
ISDS www.isdsnet.com 15
Caste _SC 0.153 1.180 0.897 0.858 0.198 0.644 0.759
Caste _OBC 2.017 1.153 0.080 0.133 1.285 0.640 0.045
Family Size 0.242 0.277 0.382 1.274 0.138 0.154 0.370
Illiterate 1.383 0.921 0.133 0.251 0.705 0.491 0.151
Primary 0.124 0.887 0.889 0.883 0.102 0.487 0.834
Middle 0.606 0.990 0.541 1.832 0.344 0.564 0.542
Matric -0.425 1.346 0.752 0.654 -0.366 0.722 0.613
Senior secondary -0.986 1.281 0.442 0.373 -0.525 0.695 0.450
Graduation 4.143 8.643 0.632 63.003 2.289 5.786 0.692
Better work 2.889 1.343 0.031 17.983 1.675 0.730 0.022
With the help Friend & Relative 5.284 1.522 0.001 197.129 2.778 0.747 0.000
Lack of job in Native -8.336 1.861 0.000 4169.844 -4.627 0.966 0.000
Family Problem -9.179 3.006 0.002 9691.288 -4.924 1.627 0.002
Agriculture not profitable -5.574 2.221 0.012 263.493 -3.085 1.207 0.011
Unemployment -6.562 1.680 0.000 707.986 -3.542 0.853 0.000
Land Ownership -6.002 1.678 0.000 404.424 -3.257 0.875 0.000
Constant -35.112 8.374 0.000 -18.899 4.224 0.000
Pseudo R2 0.8002 0.8014
Source: Author’s Calculation
4. Conclusion
Thus, from the above discussion it is clear that majority of the internal migrants are young Hindu males who
have migrated to Punjab during last fifteen years. Most of the migrant workers in urban informal sector are
either illiterate or have low level of education and hence they have no option except for working in the informal
sector. Most of these migrants belong to Uttar Pradesh and Bihar and they come to Punjab because of better
employment opportunities and wages. The study finds that better work and help from earlier migrant friends
and relatives are the major pull factors in internal migration in India. Internal Migration is basically driven by
push factors ikle lack of job opportunities for young males, family problems, agriculture not being profitable,
unemployment and landlessness. Among caste and religion variables, the Hindus and OBCs are more likely to
migrate.
5. Limitations
The study is based on primary data. The accuracy of the findings depends upon the truthfulness of the
respondents. Despite our best efforts, it is quite difficult to get information from the respondents as they are
hesitant and, in some cases, doubt the intentions of the researchers. Punjab is a unique state in the sense that
it is witnessing a lot of internal in-migration as well as international out-migration of local Punjabi community.
Thus, a comparative analysis of internal in-migration and international out-migration from Punjab is required.

International Journal of Development and Sustainability Vol. 8 No. 1 (2019): 1-18
16 ISDS www.isdsnet.com
References
Bairagya, I. (2012), “Employment in India's informal sector: size, patterns, growth and determinants”, Journal
of the Asia Pacific Economy, Vol.17 No.4, pp. 593-615
Banerjee, B. (1983), “The Role of the Informal Sector in the Migration Process: A Test of Probabilistic Migration
Models and Labour Market Segmentation for India”, Oxford Economic Papers, Vol. 35 No. 3, pp. 399-422.
Bhagat R. (2009), “Internal Migration in India: Are the underclass More Mobile?” in the 26th IUSSP General
Population proceedings of the international conference in Morocco, 27 September- 2 October 2009, pp. 1-21
Bhattacharya, P. (1998), “The Informal Sector and Rural-to-Urban Migration: Some Indian Evidence”, Economic
and Political Weekly, Vol. 33 No. 21, pp. 1255-1262.
Borjas, G.J. (2004), Do Foreign Students Crowd out Native Students from Graduate Programs? NBER Working
Paper No. 10349, National Bureau of Economic Research, Cambridge.
Chakraborty, D. and Kuri, P.K. (2013), “Rural-Urban Migration and Urban Informal Sector in India: An Inter-
State Analysis”, International Journal of Current Research, Vol. 5 No. 4, pp. 950-956.
Cherunilam, F. (1987), Migration: Causes, Correlates, Consequences, trend and Policies, Himalaya Publication
House, Delhi
De Haas, H. and Fokkema, T, (2010), “Intra-Household Conflicts in Migration Decision making: Return and
Pendulum Migration in Morocco”, Population and Development Review, Vol. 36 No. 3, pp. 541-561.
DeJong, G.F. and Fawcett, J.T. (1981), “Motivations for Migration: An Assessment and aValue-Expectancy
Research Model”, in: DeJong, G.F. and Gardener, R.W. (eds.), Migration Decision Making: Multidisciplinary
Approaches to Micro level Studies in Developed and Developing Countries, Pergamon Press, New York.
Faist, T. (2000), The Volume and Dynamics of International Migration and Transnational Spaces, Oxford
University Press, Oxford.
Gimba, Z. and Kumshe, M.G. (2011), “Census and Effects of Rural Urban Migration in Borno State: A Case Study
of Maiduguri Metropolis”, Asian Journal of Business and Management Science, Vol. 1 No. 1, pp. 168-172.
Gupta, A.K., Arora, D.R. and Aggarwal, B.K. (1988), “Sociological Analysis of Migration of Agricultural Labourers
from Eastern to North-Western Region of India”, Indian Journal of Industrial Relations, Vol. 23 No. 4, pp. 429-
445
Gupta, I. and Arup, M. (2002), “Rural Migrants and Labour Segmentation: Micro-Level Evidence from Delhi
Slums”, Economic and Political Weekly, Vol. 37 No. 2, pp. 163-168.
Jothy, K. and Kalaiselvi, S. (2011), "Patterns of Internal Migration: An Analysis Using Census Data of Tamilnadu",
International Journal of Current Research, Vol. 3 No. 1, pp. 89-96.
Kohli, P. (2010), “Inter-State Immigration into Punjab during 1971-91” available at:
https://ia902507.us.archive.org/14/items/InterstateImmigrationIntoPunjabDuring1971-91/Inter-
stateImmigrationIntoPunjabDuring1971-91.pdf (accessed 24 June 2017)
International Journal of Development and Sustainability Vol. 8 No. 1 (2019): 1-18
ISDS www.isdsnet.com 17
Lusome, R. and Bhagat, R.B. (2006), “Trends and Patterns of Internal Migration in India: 1971-2001”, Retrieved
from www.scribd.com.
Malhotra, N. (2007), Marketing research: An applied orientation. Upper Saddle River, NJ: Pearson/Prentice Hall.
Malhotra, N. (2015), “Factors in Internal Labour Migration in India”, ENVISION – International Journal of
Commerce and Management, Vol. 9, pp. 47-55.
Malhotra, N. and Devi, P. (2016), “Analysis of Factors Affecting Internal Migration in India”, Amity Journal of
Economics, Vol. 1 No. 2, PP. 34-51.
McConnell C.R. and Brue, S. (1986), Contemporary Labour Economics, McGraw Hill book company.
Misra, P. and Alam, M.S. (2014), “Urban Informal Sector & Migrants”, International Journal of Business and
Administration Research Review, Vol. 2 No. 4, pp. 72-86.
Misra, S.N. (1998), Dynamics of Rural Urban Migration in India, Anmol Publication Pvt. Ltd New Delhi
Mitra, A. and Mayumi, M. (2008), Rural to Urban Migration – A district level Analysis from India, IDE-JETRA
Report No. 137.
Naresh K. and Sidhu, A.S. (2005), “Pull and Push Factors in Labour Migration: A Study of Brick-Klin Workers in
Punjab”, Indian Journal of Industrial Relations, Vol. 41 No. 2, pp. 221-232.
NSSO (1998), Migration in India 1993, NSS Report No. 430, NSS 49th Round. Ministry of Statistics and Program
Implementation, Government of India, New Delhi
NSSO (2010), Migration in India 2007-2008, NSS Report No. 533 (64/10.2/2), NSS 64th Round, Ministry of
Statistics and Program Implementation, Government of India. New Delhi.
Piplai, T. and Majumdar, N. (1969), “Internal Migration in India: Some Socio-Economic Implications”, Sankhyā:
The Indian Journal of Statistics, Series B, Vol. 31 No. 3/4, pp. 509-522.
Rele J.R. (1969), “Trends and Significance of Internal Migration in India”, Sankhyā: The Indian Journal of
Statistics, Series B, Vol. 31 No. 3/4, pp. 501-508.
Schwartz, A. (1976), “Migration, Age and Education”, Journal of Political Economy, Vol. 84 No. 4, pp. 167-227.
Sethi, S, Ghuman, R. and Ukpere, W.I. (2009), “Socio-economic analysis of the migrant labourers in Punjab: An
empirical analysis”, African Journal of Business Management Vol. 4 No. 10, pp. 2042-2050.
Shandilya, S. and Singh, M. (2012), “Internal Migration in India”, Journal of Business Management & Social
Sciences Research”, Vol. 1 No. 3, pp. 66-69.
Skeldon, R. (1986), “On Migration Patterns in During the 1970s”, Population and Development Review, Vol. 12
No. 4, pp. 759-779.
Sridhar, K.S., Reddy, A.V. and Srinath, P. (2010), “Is it Push or Pull? Recent Evidence from Migration in India”,
South Asia Network of Economic Research Institutes, Vol. 10, pp.1-17
Taralekar, R., Waingankar, P. and Thatkar, P. (2012), “A Study to Assess Pattern of Migration Across India Based
on Census Data”, International Journal of Recent Trends in Science and Technology, Vol. 5 No. 2, pp 74-77.

International Journal of Development and Sustainability Vol. 8 No. 1 (2019): 1-18
18 ISDS www.isdsnet.com
Tsegai, D. (2007), “Migration as a Household Decision: What are the Roles of Income Differences? Insights from
the Volta Basin of Ghana”, The European Journal of Development Research, Vol. 19 No. 2, pp. 305-326.
Vipul Kant Singh et al. (2011), “Changing Pattern of Internal Migration in India: Some Evidence from Census
Data”, International Journal of Current Research, Vol. 3 No. 4, pp. 289-295.