Embed Size (px)
Citation preview
Determination of Aflatoxins
in Food and Feed
with Simple and Optimised Methods
Jorg Stroka
The following work is based on the guidance of
Prof. Dr. Michael PetzBergische Universitat-Gesamthochschule Wuppertal,
Department of Food Chemistry
and
Prof. Dr. Elke AnklamJoint Research Centre of the European Commission
Institute for Health and Consumer ProtectionFood Products and Consumer Goods Unit
to whom I would like to address special thanksfor many ideas, helpful hints and support during this work.
June 1997 - Summer 2000

For my mother and for Claudia,
who supported me during all the time
Special Thanks go to the following persons:
Prof. Dr. Gilbert and Dr. Tony Buckle (CSL, York, United Kingdom)for the co-ordination of the SMT-project and Ir. Hans van Egmond (RIVM,Bilthoven, The Nederlands) for hosting the workshops.
Dr. Achim Boenke (DG-Research, Belgium) for the his advice and con-structive criticism concerning the deliverables of the SMT-project.
Prof. Dr. Franz Ulberth (Agricultural University Vienna, Austria) forhis help and criticism, as well as Mr. Ralf Seyfried (DG-JRC Ispra, Italy)for the help in the construction of the SeBaDeC.
Dr. Urban Joerissen, Mr. Axel Pieper and Mrs. Gunda Niedwetzki(WEJ-Laboratories, Hamburg, Germany) and Dr. Matthias Reuter (LUVA,Kiel, Germany) for the procurement of the homogeneous materials.
Dr. Thomas Peschel and Gunther Tittelbach (Fraunhofer Institute forOptics, Jena, Germany) for the tests and the close collaboration during thedevelopment of the modified office scanner; Mr. Kobus, Mr. Theissen andMr. Cornellisen (DG-JRC Ispra, Italy) for the rapid translation of the ideasfor the SeBaDeC approach.
Mr. Schmitt (SCHOTT-Mainz, Germany) for the free optical filter samplesneeded for the SeBaDeC.
Mr. Thomas Rudolph, Mrs. Lisbeth Meyer and Dr. Markus Lipp (DG-JRC Ispra, Italy) for their support during the thesis.
Dr. Christoph von-Holst (DG-JRC-Ispra, Italy) and Dr. Ken Matthison(CSL, York, United Kingdom) for their help in the statistical evaluation andinterpretation.
Mr. Robert von Otterdijk for the close collaboration during the develop-ment of the TLC-method.
Based on this work, the following publications were put into writing:
1. Stroka J, Joerissen U, Petz M, Anklam E (1999) Investigation of variousextractants for the analysis of aflatoxin B1 in different food and feedmatrices, Food Addit and Contam 16: 331-338.
2. Stroka J, Anklam E, Joerissen U, Gilbert J (2000) Immunoaffinitycleanup with liquid chromatography using post-column brominationfor determination of aflatoxins in peanut butter, pistachio paste, figpaste, and paprika powder: collaborative study, JAOAC International83: 320-340
3. Stroka J, Anklam E, Joerissen U, Gilbert, J (2000) Immunoaffinitycleanup with liquid chromatography using post-column brominationfor determination of aflatoxin B1 in infant formula: collaborative study.JAOAC International in print.
4. Stroka J, Anklam E, Reutter M (2000) Immunoaffinity cleanup with li-quid chromatography using post-column bromination for determinationof aflatoxin B1 in animal feed: collaborative study. JAOAC Interna-tional submitted.
5. Stroka J, Petz M, Anklam E (2000) Analytical methods for the det-ermination of aflatoxins in various food matrices at concentrations re-garding the limits set in European Regulations: Development, charac-teristics, limits, Mycotoxin Research 16: 23-42.
6. Stroka J, van Otterdijk R, Anklam E (2000) Immunoaffinity clean-up prior thin-layer chromatography (TLC) for the determination ofaflatoxins in various food matrices. J Chrom A 904: 251-256.
7. Stroka J, Anklam E (2000) Development of a simplified densitometerfor the determination of aflatoxins by thin layer chromatography. JChrom A 904: 263-268.
2
Abstract
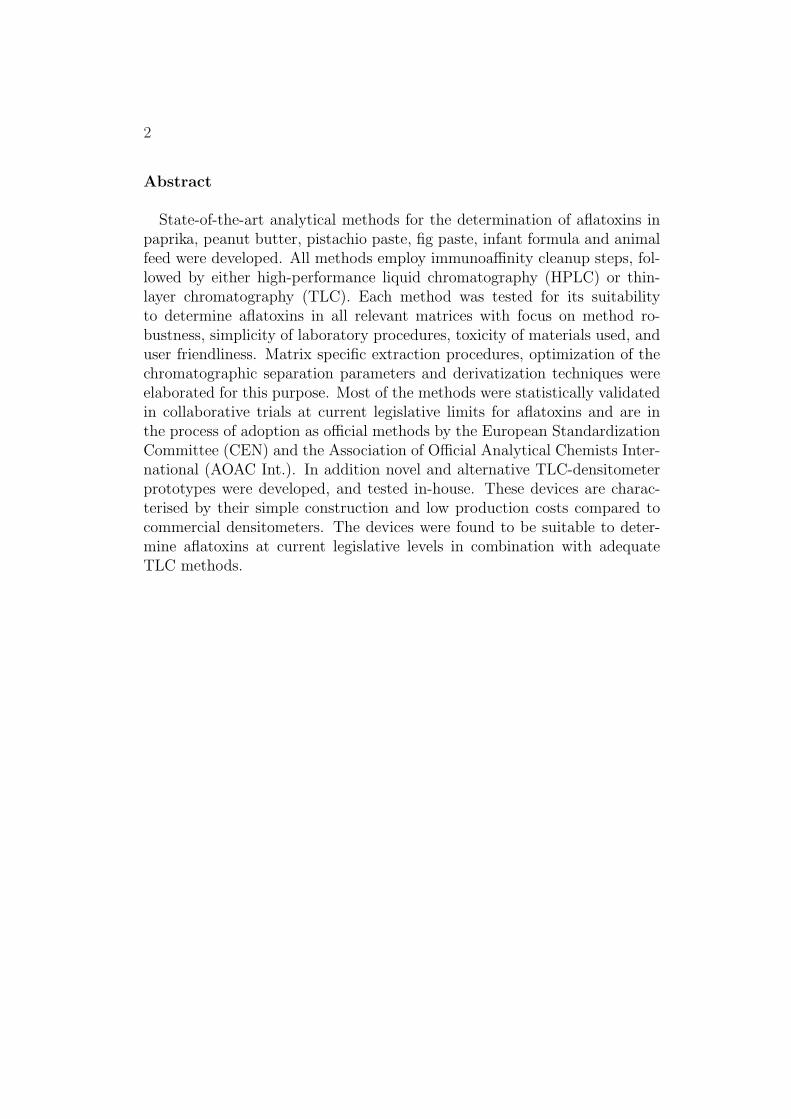
State-of-the-art analytical methods for the determination of aflatoxins inpaprika, peanut butter, pistachio paste, fig paste, infant formula and animalfeed were developed. All methods employ immunoaffinity cleanup steps, fol-lowed by either high-performance liquid chromatography (HPLC) or thin-layer chromatography (TLC). Each method was tested for its suitabilityto determine aflatoxins in all relevant matrices with focus on method ro-bustness, simplicity of laboratory procedures, toxicity of materials used, anduser friendliness. Matrix specific extraction procedures, optimization of thechromatographic separation parameters and derivatization techniques wereelaborated for this purpose. Most of the methods were statistically validatedin collaborative trials at current legislative limits for aflatoxins and are inthe process of adoption as official methods by the European StandardizationCommittee (CEN) and the Association of Official Analytical Chemists Inter-national (AOAC Int.). In addition novel and alternative TLC-densitometerprototypes were developed, and tested in-house. These devices are charac-terised by their simple construction and low production costs compared tocommercial densitometers. The devices were found to be suitable to deter-mine aflatoxins at current legislative levels in combination with adequateTLC methods.
3
Zusammenfassung
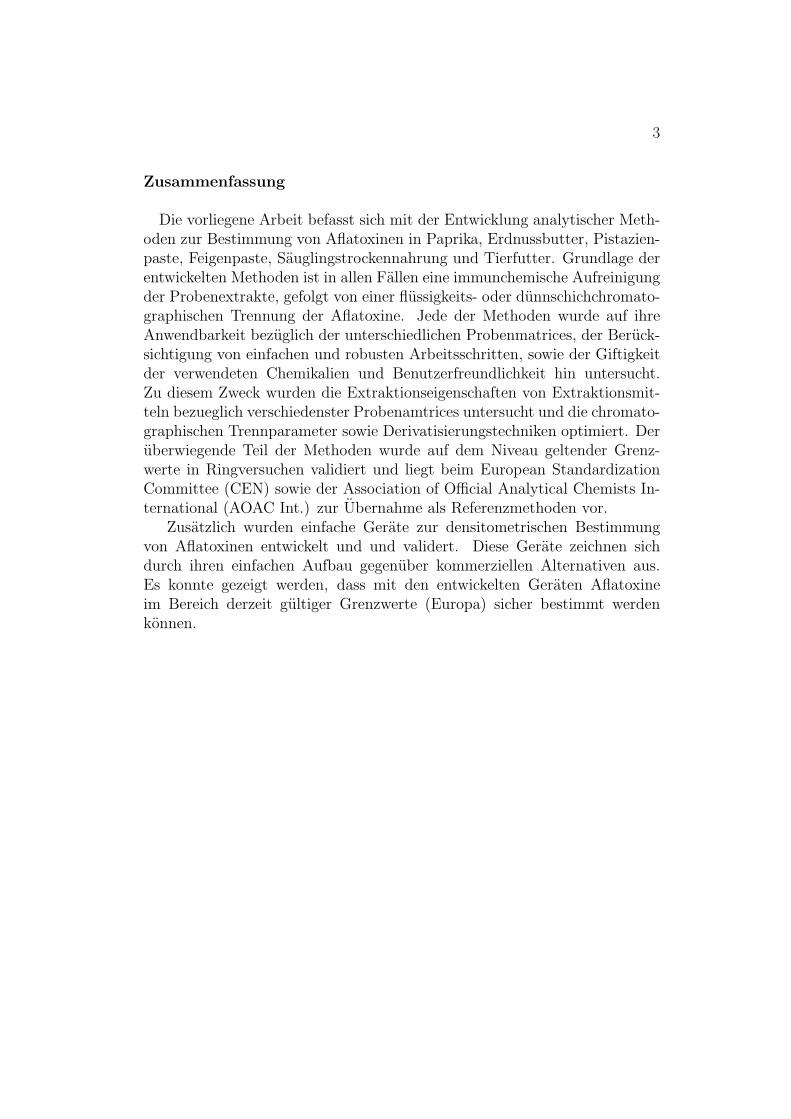
Die vorliegene Arbeit befasst sich mit der Entwicklung analytischer Meth-oden zur Bestimmung von Aflatoxinen in Paprika, Erdnussbutter, Pistazien-paste, Feigenpaste, Sauglingstrockennahrung und Tierfutter. Grundlage derentwickelten Methoden ist in allen Fallen eine immunchemische Aufreinigungder Probenextrakte, gefolgt von einer flussigkeits- oder dunnschichchromato-graphischen Trennung der Aflatoxine. Jede der Methoden wurde auf ihreAnwendbarkeit bezuglich der unterschiedlichen Probenmatrices, der Beruck-sichtigung von einfachen und robusten Arbeitsschritten, sowie der Giftigkeitder verwendeten Chemikalien und Benutzerfreundlichkeit hin untersucht.Zu diesem Zweck wurden die Extraktionseigenschaften von Extraktionsmit-teln bezueglich verschiedenster Probenamtrices untersucht und die chromato-graphischen Trennparameter sowie Derivatisierungstechniken optimiert. Deruberwiegende Teil der Methoden wurde auf dem Niveau geltender Grenz-werte in Ringversuchen validiert und liegt beim European StandardizationCommittee (CEN) sowie der Association of Official Analytical Chemists In-ternational (AOAC Int.) zur Ubernahme als Referenzmethoden vor.
Zusatzlich wurden einfache Gerate zur densitometrischen Bestimmungvon Aflatoxinen entwickelt und und validert. Diese Gerate zeichnen sichdurch ihren einfachen Aufbau gegenuber kommerziellen Alternativen aus.Es konnte gezeigt werden, dass mit den entwickelten Geraten Aflatoxineim Bereich derzeit gultiger Grenzwerte (Europa) sicher bestimmt werdenkonnen.
4
Abbreviations
ADC . . . . . . . . . . . . . . . . . . . . . Analogue Digital ConverterAOAC . . . . . . . . . . . . . . . . . . . . Association of Official Analytical ChemistsAf . . . . . . . . . . . . . . . . . . . . . . . . AflatoxinCAS . . . . . . . . . . . . . . . . . . . . . . Commercially Available ScannerCCD . . . . . . . . . . . . . . . . . . . . . Charge Coupled DeviceCEN . . . . . . . . . . . . . . . . . . . . . European Standardisation Committeedf . . . . . . . . . . . . . . . . . . . . . . . . degree of freedomDMM . . . . . . . . . . . . . . . . . . . . Digital MultimeterELISA . . . . . . . . . . . . . . . . . . . . Enzyme Linked Immuno Sorbent AssayGaP . . . . . . . . . . . . . . . . . . . . . . Gallium-PhosphorusHMF . . . . . . . . . . . . . . . . . . . . . HydroxymethylfurfuralHPLC . . . . . . . . . . . . . . . . . . . . High Performance Liquid ChromatographyIAC . . . . . . . . . . . . . . . . . . . . . . Immunoaffinity ColumnIC . . . . . . . . . . . . . . . . . . . . . . . . Integrated CircuitJRC . . . . . . . . . . . . . . . . . . . . . . Joint Research CentreLC . . . . . . . . . . . . . . . . . . . . . . . Liquid ChromatographyLED . . . . . . . . . . . . . . . . . . . . . . Light Emitting DiodeLOD . . . . . . . . . . . . . . . . . . . . . Limit of DetectionLOQ . . . . . . . . . . . . . . . . . . . . . Limit of QuantificationMeCN . . . . . . . . . . . . . . . . . . . . AcetonitrileMeOH . . . . . . . . . . . . . . . . . . . . MethanolMoFBeS . . . . . . . . . . . . . . . . . . Modified Flat-bed ScannerMS . . . . . . . . . . . . . . . . . . . . . . . Mean Squares = SS/dfOA . . . . . . . . . . . . . . . . . . . . . . . Operational AmplifierOA . . . . . . . . . . . . . . . . . . . . . . . Operational AmplifierPBPB . . . . . . . . . . . . . . . . . . . . Pyridinium bromide perbromidePC . . . . . . . . . . . . . . . . . . . . . . . Personal ComputerPCD . . . . . . . . . . . . . . . . . . . . . Post Column DerivatizationRGB . . . . . . . . . . . . . . . . . . . . . Red-Green-BlueRP . . . . . . . . . . . . . . . . . . . . . . . Reversed PhaseRSD . . . . . . . . . . . . . . . . . . . . . . Relative Standard DeviationSeBaDeC . . . . . . . . . . . . . . . . . Semiconductor Based Densitometer CellSS . . . . . . . . . . . . . . . . . . . . . . . . Sum of SquaresSTDEV . . . . . . . . . . . . . . . . . . Standard Deviationt-BME . . . . . . . . . . . . . . . . . . . tert-Butyl-methyl-etherTFA . . . . . . . . . . . . . . . . . . . . . . Tri-fluoro-acetic AcidTLC . . . . . . . . . . . . . . . . . . . . . . Thin-layer ChromatographyUV . . . . . . . . . . . . . . . . . . . . . . . Ultra-ViolettVIS . . . . . . . . . . . . . . . . . . . . . . Visible (Light)
Contents
1 Introduction and Scope of the Work 71.1 Introduction . . . . . . . . . . . . . . . . . . . . . . . . . . . . 71.2 Scopes of Interest . . . . . . . . . . . . . . . . . . . . . . . . . 18
2 Results and Discussion 202.1 Method Development for a HPLC Method . . . . . . . . . . . 20
2.1.1 Sample Extraction . . . . . . . . . . . . . . . . . . . . 202.1.2 Sample Preparation . . . . . . . . . . . . . . . . . . . . 372.1.3 Determination by HPLC . . . . . . . . . . . . . . . . . 41
2.2 Determination by TLC . . . . . . . . . . . . . . . . . . . . . . 612.2.1 Development of a TLC Method . . . . . . . . . . . . . 61
2.3 Validation by Collaborative Trial Studies . . . . . . . . . . . . 752.3.1 Requirements for Validated Methods . . . . . . . . . . 752.3.2 Organization of the Collaborative Trial . . . . . . . . . 792.3.3 Results of the Collaborative Trial . . . . . . . . . . . . 80
2.4 Development of Simplified Densitometers . . . . . . . . . . . . 1002.4.1 Background . . . . . . . . . . . . . . . . . . . . . . . . 1002.4.2 General Requirements for Aflatoxin Densitometers . . . 1012.4.3 Development of a Semiconductor based Densitometer
Cell . . . . . . . . . . . . . . . . . . . . . . . . . . . . 1012.4.4 Characterization of the Densitometer Cell (Prototype
version 0.1) . . . . . . . . . . . . . . . . . . . . . . . . 1082.4.5 Improvements of the Densitometer Cell (Prototype ver-
sion 0.1) . . . . . . . . . . . . . . . . . . . . . . . . . . 1152.4.6 Modification of an Office Scanner . . . . . . . . . . . . 118
3 Experimental 1333.1 Materials . . . . . . . . . . . . . . . . . . . . . . . . . . . . . 1333.2 Methods . . . . . . . . . . . . . . . . . . . . . . . . . . . . . . 134
3.2.1 Sample Extraction . . . . . . . . . . . . . . . . . . . . 1343.2.2 Immunoaffinity Clean-up . . . . . . . . . . . . . . . . . 135
5
6 CONTENTS
3.2.3 Re-dissolving for TLC Application . . . . . . . . . . . 1353.2.4 HPLC Procedures . . . . . . . . . . . . . . . . . . . . . 1353.2.5 TLC Procedures . . . . . . . . . . . . . . . . . . . . . 1423.2.6 Salting Out Procedures . . . . . . . . . . . . . . . . . . 1453.2.7 Dry Mass Determination (Extract Residue) . . . . . . . 1453.2.8 Water Determination . . . . . . . . . . . . . . . . . . . 1453.2.9 Homogeneity Testing . . . . . . . . . . . . . . . . . . . 1463.2.10 Statistical Tests . . . . . . . . . . . . . . . . . . . . . . 1463.2.11 Photometry . . . . . . . . . . . . . . . . . . . . . . . . 152
4 Summary 153
5 Annex 1765.1 Collaborative Trial Results on Food Stuffs . . . . . . . . . . . 1775.2 Collaborative Trial Results on Infant Formula . . . . . . . . . 1945.3 Collaborative Trial Results on Animal Feed . . . . . . . . . . 196
Chapter 1
Introduction and Scope of theWork
1.1 Introduction
The fungi and their toxins Mycotoxins are secondary metabolites whichare produced by a number of different fungi. The term secondary metaboliteswas introduced into microbial biochemistry in order to differentiate thosecompounds such as alkaloids, terpenes, flavanoids and other plant productsthat may be considered as non-essential for the growth of the plants them-selfs. Conversely, amino acids, fatty acids, saccharides, nucleic acids andproteins - compounds essential for all living organisms - were termed pri-mary metabolites [1].
Mycotoxins have the following characteristics: (I.) They have a restricteddistribution in micro-organisms. (II.) They are characteristic of individualgenera, species or strains. (III.) They are formed along specialized pathwaysfrom a few primary metabolites such as acetyl co-enzyme A (aflatoxins),mevalonic acid lactone, α-amino acids, and intermediates of the shikimic-acid pathway [2].
Currently there are about 300 different known mycotoxins [3], which areproduced by about 200 different fungi of the group of the deuteromycetes(fungi imperfecti), which lack a sexual stage of development and propagatevegetatively through asexual spores (conidiospores or conidia) or the vegeta-tive cells.
However, only a small fraction of approximately 20 out of these 300 knownmycotoxins are normally found in food and feed at levels that are considereda health risk for humans and animals. Among these, the aflatoxins repre-sent - due to their occurrence and toxicity - the main threat in this field
7

8 CHAPTER 1. INTRODUCTION AND SCOPE OF THE WORK
worldwide. Other commonly known and health relevant mycotoxins are thefumonisins, ochratoxin A, the trichotheceens (e.g. deoxynivalenol, zearaleon-one), patulin, cyclopiazonic acid and sterigmatocystin.
Mycotoxins are composed of a diverse range of chemical structures, whilein some cases common substructures such as furanofuran- , lactone- , indol-or chinone-elements can be found. These diverse chemical properties resultin various toxic effects. Therefore mycotoxins are also classified into groupsof hepatoxins (e.g. aflatoxins), nephrotoxins (e.g. ochratoxin A), neurotox-ins (e.g. ergot alkaloids) or endocrine disruptors which mimic mammalianhormones (e.g. zearalenon).
Except for the ergot alkaloides, which are produced by Claviceps pur-purea on grains such as rye, all other relevant mycotoxins that are associatedwith food or feed contamination are derived from the group of the generaAspergillus, Penicillium, Fusarium or Alternaria.
Historical background One of the first reports in history of mycotoxico-sis are related to ergotism, which is caused by the fungi Claviceps purpureaor C. paspali and can be traced back to ancient times. These fungi infectgrain (rye) in the pre-harvest stage and were the cause of severe neurologicalsymptoms as well as many deaths. In the middle ages these symptoms wereknown as St. Antony’s fire, while the link between the cause and the symp-toms (or deaths) was not known.
Nowadays ergotism is, except for some minor incidences, of neglectableimportance for consumer protection because modern food technology allowssufficient ways to control and prevent ergotism. However the problem of my-cotoxicosis has not faded. Acute mycotoxicosis is still of concern in animalhealth, while the human health risks shifted to sub-acute and chronic ex-posures with long term effects such as suppression of the immuno system,endocrine disfunction and cancer.
The discovery of aflatoxins Aflatoxins are produced by the fungi As-pergillus flavus and Aspergillus parasiticus. However, other fungi such asAspergillus nomius and Aspergillus tamarii have also been reported as afla-toxin producers while they seem to have no significant impact on food conta-mination.
Aflatoxins were discovered in the early 1960s, when the cause of the so-called Turkey-X-disease was identified. This disease resulted in the death of
1.1. INTRODUCTION 9
more than 100,000 turkeys in England during 1960 and was caused by con-taminated peanut meal that was fed to the animals. The main responsibletoxic metabolites were identified as aflatoxins B1, B2, G1 and G2, with afla-toxin B1 (AfB1) being the most abundant and toxic metabolite in this group.However recently cyclopiazonic acid (CPA) is also discussed as an cause ofthe Turkey-X-disease in 1960, since A. flavus also produces CPA [4].
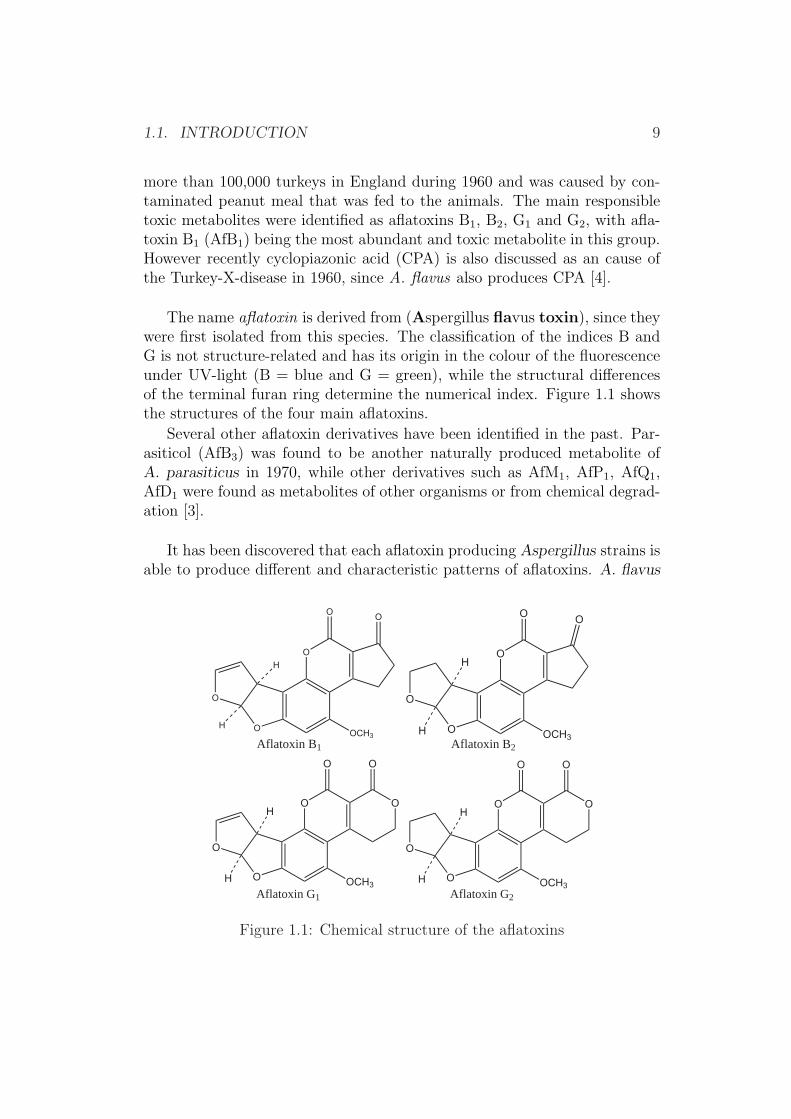
The name aflatoxin is derived from (Aspergillus flavus toxin), since theywere first isolated from this species. The classification of the indices B andG is not structure-related and has its origin in the colour of the fluorescenceunder UV-light (B = blue and G = green), while the structural differencesof the terminal furan ring determine the numerical index. Figure 1.1 showsthe structures of the four main aflatoxins.
Several other aflatoxin derivatives have been identified in the past. Par-asiticol (AfB3) was found to be another naturally produced metabolite ofA. parasiticus in 1970, while other derivatives such as AfM1, AfP1, AfQ1,AfD1 were found as metabolites of other organisms or from chemical degrad-ation [3].
It has been discovered that each aflatoxin producing Aspergillus strains isable to produce different and characteristic patterns of aflatoxins. A. flavus
O
O
O
OCH3
OO
H
H
Aflatoxin B1
O
O
O
O O
OCH3
H
HAflatoxin B2
O
O
O
O
OCH3
H
H
O
O
Aflatoxin G1
O
O
O
O
OCH3
H
H
O
O
Aflatoxin G2
Figure 1.1: Chemical structure of the aflatoxins

10 CHAPTER 1. INTRODUCTION AND SCOPE OF THE WORK
produces exclusively AfB1 and AfB2, while A. parasiticus is able to synthe-size all four major aflatoxins (AfB1, AfB2, AfG1 and AfG2) [5], with AfB1
and AfG1 being the major metabolites [6].
These toxin production patterns of the different fungi are reflected inthe aflatoxin contamination commonly found to be typical for certain foodstuffs. Thus in peanuts all four aflatoxins are commonly detected, sinceA. parasiticus is well adapted to a soil environment. Other food products,derived from aeral parts of plants (e.g. corn, cottonseed, tree nuts) have apattern typical for A. flavus. As a result, over 90% of the contaminated cornsamples only contain AfB1 and AfB2, while in most contaminated peanutproducts all four aflatoxins are found [5].
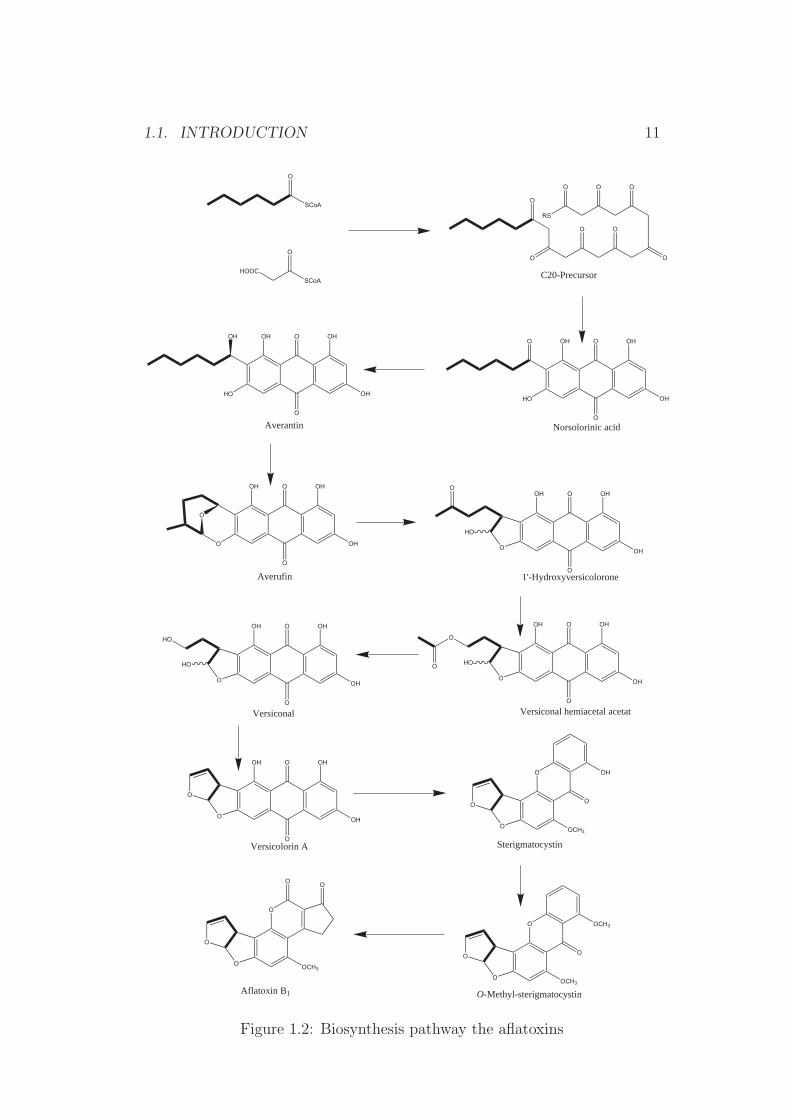
Chemistry of the aflatoxins Aflatoxins are di-furano coumarins withAfB2 and AfG2 being the hydrated derivatives of AfB1 and AfG1. The biosyn-thesis pathway of aflatoxins has been postulated as followed: norsolorinicacid → averufin → versiconalacetate → versicolorin A → sterigmatocystin→ aflatoxin B1 → aflatoxin G1. Figure 1.2 shows the postulated pathway [2].
The toxicity of the aflatoxins decreases from AfB1 → AfG1 → AfB2 →AfG2, which is an indicator that the double bond at the 8,9-position at theterminal furano ring is a crucial factor for the toxicity of the toxin.
Aflatoxins are heat stable compounds and normally do not degrade dur-ing normal food or feed processing. However, several approaches for detox-ification have been proposed, ranging from microbial, physical (extraction,absorption or elevated heat) chemical or even radiation approaches [7–10] .
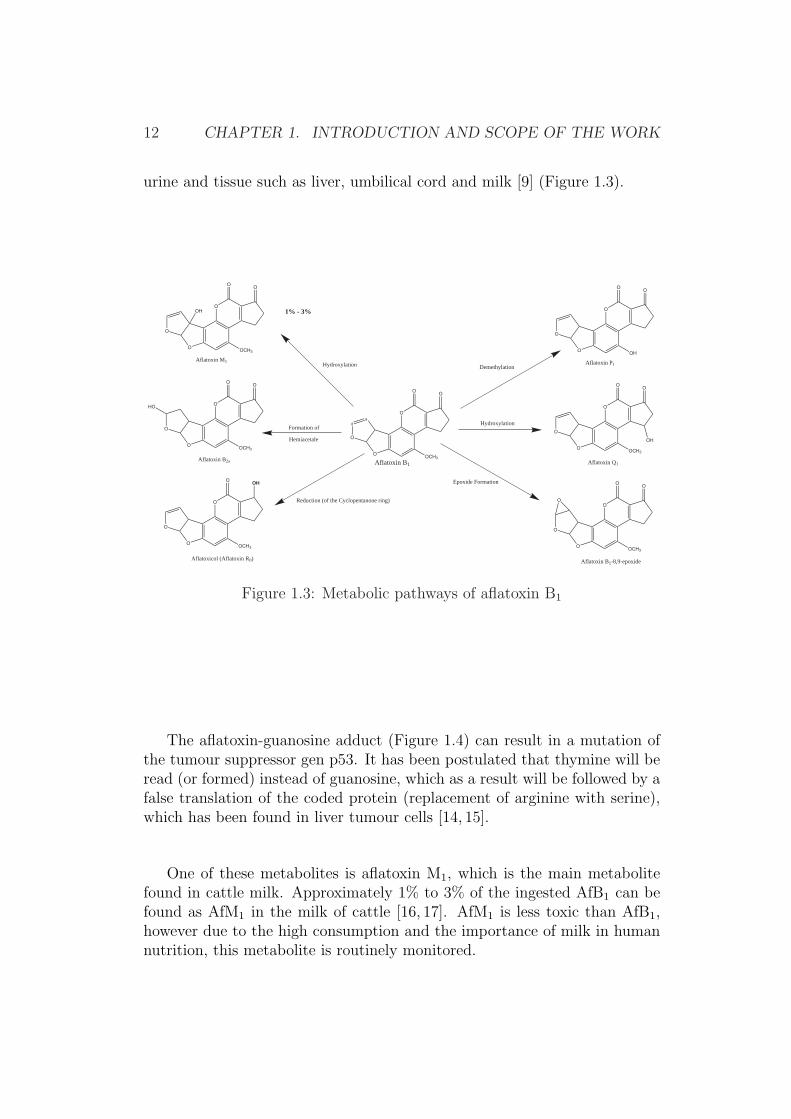
Metabolism of aflatoxins Aflatoxins are strong hepatotoxins and are in-ternationally classified as carcinogens [11]. All animal species tested are sus-ceptible to aflatoxins with ducklings being most sensitive [LD50= 0.4 µg/kg][9]. The metabolic pathway of the aflatoxins is still not fully understood,while it is generally accepted that the metabolism of aflatoxin B1 consistsof two stages. First it is converted by cytochrome P-450-mediated mixed-function oxidase into active electrophilic intermediates (Figure 1.3) and thenconjugated covalently with nucelophiles such as DNA (Figure 1.4), RNA orproteins in the liver cells [9, 12]. The formation of highly reactive 8,9-epoxideintermediates has been first postulated and then confirmed experimentally. Ithas further been postulated that this electophil 8,9-epoxide is formed by themicrosomal mixed-function mono-oxygenase (MFO), which is the causativeagent for the toxicity and/or carcinogenicity [13].
A total of six human metabolites have been found to appear in blood,
1.1. INTRODUCTION 11
O
O
O
OCH3
OO
O
O
O
OCH3
O
OCH3
O
O
O
OCH3
O
OH
O
O
O
O
OH
OH
O
O
O
OH
OH
HO
O
O
O
OH
OH
HO
O
O
HO
O
O
OH
OHO
O
O
OH
OH
HO
O
Aflatoxin B1
OH
OH OH
OHOH
O
O
O
O
OH
OH
OH
HO
OHO
O
OH
OH
OH
HO
O
O OO
O
O
O O
O
RS
O
SCoA
O
SCoA
HOOC C20-Precursor
Norsolorinic acidAverantin
Averufin 1'-Hydroxyversicolorone
Versiconal hemiacetal acetatVersiconal
Versicolorin A Sterigmatocystin
O-Methyl-sterigmatocystin
Figure 1.2: Biosynthesis pathway the aflatoxins
12 CHAPTER 1. INTRODUCTION AND SCOPE OF THE WORK
urine and tissue such as liver, umbilical cord and milk [9] (Figure 1.3).
O
O
O
OCH3
OO
O
O
O
OCH3
OO
O
O
O
OCH3
OHO
OH
HO
Aflatoxin M1
Aflatoxin B2a
Aflatoxicol (Aflatoxin R0)
O
O
O
OH
OO
O
O
O
OCH3
OO
O
O
O
OCH3
OO
Aflatoxin P1
Aflatoxin Q1
Aflatoxin B1-8,9-epoxide
O
O
98
O
OCH3
OO
Aflatoxin B1
OH
O
Hydroxylation
Formation of
Hemiacetale
Reduction (of the Cyclopentanone ring)
Epoxide Formation
Hydroxylation
Demethylation
1% - 3%
Figure 1.3: Metabolic pathways of aflatoxin B1
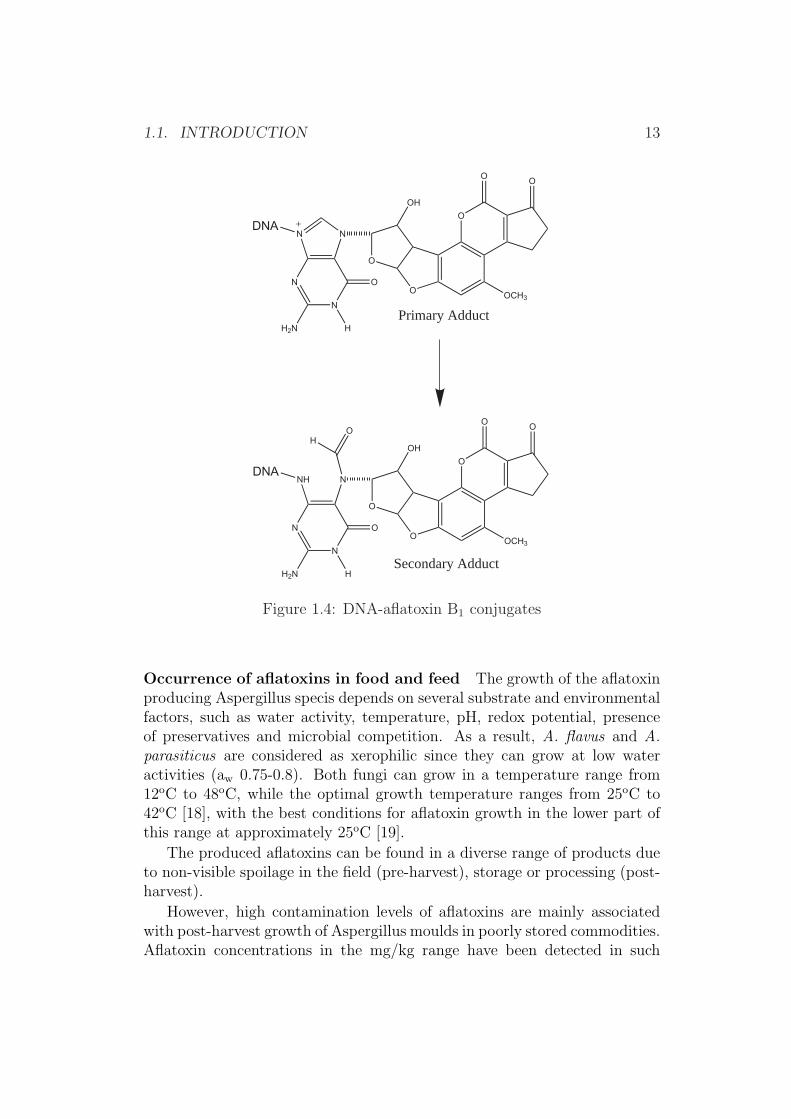
The aflatoxin-guanosine adduct (Figure 1.4) can result in a mutation ofthe tumour suppressor gen p53. It has been postulated that thymine will beread (or formed) instead of guanosine, which as a result will be followed by afalse translation of the coded protein (replacement of arginine with serine),which has been found in liver tumour cells [14, 15].
One of these metabolites is aflatoxin M1, which is the main metabolitefound in cattle milk. Approximately 1% to 3% of the ingested AfB1 can befound as AfM1 in the milk of cattle [16, 17]. AfM1 is less toxic than AfB1,however due to the high consumption and the importance of milk in humannutrition, this metabolite is routinely monitored.
1.1. INTRODUCTION 13
O
O
O
OCH3
OO
OH
NN
N
N
H2N
O
H
DNA +
O
O
O
OCH3
OO
OH
NNH
N
N
H2N
O
H
DNA
OH
Primary Adduct
Secondary Adduct
Figure 1.4: DNA-aflatoxin B1 conjugates
Occurrence of aflatoxins in food and feed The growth of the aflatoxinproducing Aspergillus specis depends on several substrate and environmentalfactors, such as water activity, temperature, pH, redox potential, presenceof preservatives and microbial competition. As a result, A. flavus and A.parasiticus are considered as xerophilic since they can grow at low wateractivities (aw 0.75-0.8). Both fungi can grow in a temperature range from12oC to 48oC, while the optimal growth temperature ranges from 25oC to42oC [18], with the best conditions for aflatoxin growth in the lower part ofthis range at approximately 25oC [19].
The produced aflatoxins can be found in a diverse range of products dueto non-visible spoilage in the field (pre-harvest), storage or processing (post-harvest).
However, high contamination levels of aflatoxins are mainly associatedwith post-harvest growth of Aspergillus moulds in poorly stored commodities.Aflatoxin concentrations in the mg/kg range have been detected in such

14 CHAPTER 1. INTRODUCTION AND SCOPE OF THE WORK
cases [20, 21].The most relevant food items that have been reported to contain aflatox-
ins are cereals such as corn, barley and oats, dried fruits such as figs, nutsand oilseeds such as pistachios or peanuts and cotton seeds as well as spicessuch as pepper, paprika or chillis [1]. However, corn and peanuts are themost frequent contaminated food items worldwide [22].
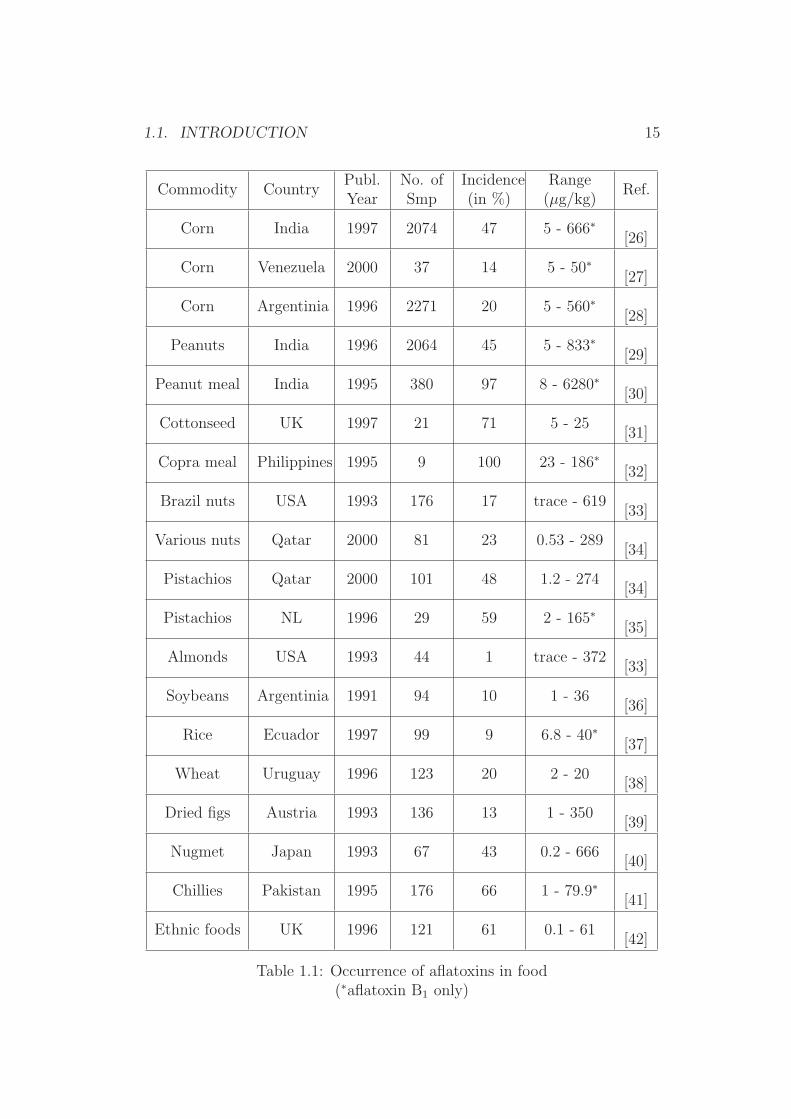
Several surveys on the occurrence of aflatoxins have been reviewed [9, 10,23–25] and clearly show that the occurrence of aflatoxins in food and feedis still a relevant issue in food safety. Table 1.1 gives an overview of recentstudies on aflatoxins in food stuffs [24].
1.1. INTRODUCTION 15
Commodity CountryPubl.Year
No. ofSmp
Incidence(in %)
Range(µg/kg)
Ref.
Corn India 1997 2074 47 5 - 666∗[26]
Corn Venezuela 2000 37 14 5 - 50∗[27]
Corn Argentinia 1996 2271 20 5 - 560∗[28]
Peanuts India 1996 2064 45 5 - 833∗[29]
Peanut meal India 1995 380 97 8 - 6280∗[30]
Cottonseed UK 1997 21 71 5 - 25[31]
Copra meal Philippines 1995 9 100 23 - 186∗[32]
Brazil nuts USA 1993 176 17 trace - 619[33]
Various nuts Qatar 2000 81 23 0.53 - 289[34]
Pistachios Qatar 2000 101 48 1.2 - 274[34]
Pistachios NL 1996 29 59 2 - 165∗[35]
Almonds USA 1993 44 1 trace - 372[33]
Soybeans Argentinia 1991 94 10 1 - 36[36]
Rice Ecuador 1997 99 9 6.8 - 40∗[37]
Wheat Uruguay 1996 123 20 2 - 20[38]
Dried figs Austria 1993 136 13 1 - 350[39]
Nugmet Japan 1993 67 43 0.2 - 666[40]
Chillies Pakistan 1995 176 66 1 - 79.9∗[41]
Ethnic foods UK 1996 121 61 0.1 - 61[42]
Table 1.1: Occurrence of aflatoxins in food(∗aflatoxin B1 only)
16 CHAPTER 1. INTRODUCTION AND SCOPE OF THE WORK
Epidemiological studies Several epidemiological studies have been car-ried out to determine the intake and the concentration of aflatoxins in thehuman body [9, 17, 43].
It was shown that aflatoxins can be found in significant fractions of differ-ent populations. Studies carried out in Africa indicated that approximately12% - 37% of the African population has measurable amounts of aflatoxinin the blood serum [43]. The daily intake of aflatoxins was estimated to be2.7 ng per kg body weight per day for US citizens, 3.5 to 55 ng/kg bw/dayfor Thai and up to 220 ng/kg bw/day for Africans. However certain authorsreported intake estimations of up to 22000 µg (absolute) per day [9, 22].
Correlations between aflatoxin intake and certain diseases were found,while links to primary liver cancer, Reye’s syndrome, Kwashiorkor and othermalignant diseases are currently discussed [9, 17, 22, 44].
Mycotoxin regulations Due to the potential health risk of mycotoxinsfor humans and animals, legal limits for food and feeding stuffs have been es-tablished in at least 77 countries worldwide with different levels ranging from0 µg/kg to 50 µg/kg for aflatoxin B1 or total aflatoxins [45]. For animal feedat least 75 countries have introduced or proposed regulations for aflatoxincontrol, while aflatoxin M1, as the main metabolite of aflatoxin B1 in dairyproducts, is regulated in at least 22 countries [16] at levels from 0 µg/kg to1 µg/kg.
To assure proper consumer protection, the European Commission rec-ently established legal limits in the lower µg/kg range (2 µg/kg aflatoxin B1
and 4 µg/kg total aflatoxins) for food and for infant formula at 0.1 µg/kgaflatoxin B1 [46]. In addition to these regulations, the European Commissionrecognized the relevance of aflatoxin exposure for human health by adopt-ing regulations that banned the import of certain food stuffs for a limitedtime [47, 48].
In addition to these health concerns for humans and animals, economicalreasons are another drive for regulations. As an example, due to estimatedaflatoxin levels in feed, a weight reduction of approximately 3% was calcu-lated for US broilers, which was found to be equivalent to a loss of 140 millionUS$ per year [49], while the annual costs for the detoxification of aflatoxincontaminated peanuts and the post harvest losses in Australia, Indonesia andthe US are estimated to 3 to 6 million Australian $, respectively 90 millionA$ for Indonesia and 210 million A$ for the USA [50].
Methods of analysis Methods of analysis for aflatoxins have undergonecontinuous development since the aflatoxins were discovered in the early

1.1. INTRODUCTION 17
1960s. This development was mainly due to legislative changes as well asto the continuous progress in analytical chemistry.
As a result, the exposure of humans and animals to mycotoxins wasmainly limited through chemical screening/monitoring programmes of thesuspected commodities [1]. These programmes, however, depend directlyon precise and reliable analytical methods for mycotoxin determination insometimes rather complex food and feed matrices.
Therefore requirements for analytical methods have been established atnational and international level. Internationally relevant requirements arelaid down by organizations such as the European Committee for Standard-ization (CEN) or the Association of Official Analytical Chemists Interna-tional (AOAC International). For adoption as official methods any proposedmethod should be validated in a collaborative trial study. Minimum methodperformance characteristics [51], the framework for the conduct of collabor-ative trial studies as well as the statistical evaluation are clearly defined inprotocols for the adoption [52]. Any method that has been established andtested according to these protocols can be recognized as official method foruse in legal cases or for international trade.
Several analytical method principles for the determination of aflatoxinshave been developed, ranging from thin-layer chromatography (TLC), highperformance liquid chromatography (HPLC), fluorimetry or enzyme linkedimmuno sorbent assay (ELISA) techniques [1, 53–57].
Nowadays, economical aspects become more important in method devel-opment. Particularly fast and efficient procedures (material and chemicalsconsumption) as well as automatization [58] are highly desired features.
Even though several methods have already been validated in collabor-ative studies with some success, there was still a need for further methoddevelopment and validation. Previously validated method were mainly lim-ited to matrices such as peanuts or corn, while for food products such as figs,pistachios, paprika or infant formula no internationally recognized methodwas available for the desired purpose here. Particularly the target contamin-ation range of aflatoxins of already available methods [59] was significantlyhigher compared to the recently required target level of 1 µg/kg to 5 µg/kgfor aflatoxins [46].
One reason that no method was previously validated at an internationallevel for the targeted contamination range was thought to be due to thepredicted poor precision data that would be obtained in such a collaborativetrial study [60].
However, recent progress in analytical chemistry, such as the availabilityof immunoaffinity columns for aflatoxins [61] and new post-column deriva-tization techniques for HPLC [62] were found to improve analytical results
18 CHAPTER 1. INTRODUCTION AND SCOPE OF THE WORK
significantly [63].It was shown that with care and attention to detail during organization of
a collaborative trial impressive performance characteristics can be obtained,even with classical solid phase sample preparation methods in combinationwith HPLC [64].
A UK collaborative trial with peanut butter was carried out when im-munoaffinity columns first became available (1989) which initially indicatedpromising results [65]. With a subsequent international collaborative trialin 1990 [80], using post-column derivatization with iodine, some participantsexperienced problems with recoveries and despite acceptable precision datathe method was not pursued for AOAC recognition.
Another collaborative trial [67] organized in the UK for food control anal-ysts (21 public analyst laboratories) again for peanut butter reported RSDr-values ranging from 17% to 44% and RSDR-values ranging from 36% to 54%for concentrations of total aflatoxins from 7 µg/kg to 47 µg/kg. The preci-sion parameters were regarded as rather high for this trial and the samplesdistributed were atypical having aflatoxin G1 as the principal aflatoxin inthe mixture of aflatoxins in the peanut butter.
The most successful collaborative trial was carried out in 1990 [68], basedon immunoaffinity column clean-up of samples and either solution fluorimetryor post-column derivatization with iodine for determining total aflatoxinsin corn, peanuts and peanut butter. This method was adopted by AOACInternational [59].
Due to the legislative limits for aflatoxins in food in the lower µg/kg range,the European Commission recognized the need for an adequate analyticalmethod and the recognition by CEN through validation [69]. The desiredmethods should have performance characteristics similar or better than theabove discussed methods, while the analytical procedures should be simpleand rapid enough to make use of the method for routine work.
1.2 Scopes of Interest
The aim of this work was the development of state-of-the-art analytical HPLCand TLC methods for further validation in collaborative trial studies.
Current European legislative levels for food and feed matrices in additionto simplicity and robustness of the method were the main goals in this work,since these are crucial aspects in modern analytical chemistry [70].
Since HPLC and TLC approaches both have their assets [19], it was dec-ided to initially further improve existing methods for TLC and HPLC. In asecond step, these methods were foreseen to be validated through collabor-

1.2. SCOPES OF INTEREST 19
ative trial studies, with the aim of adoption as official methods by AOACInternational and CEN.
Chapter 2
Results and Discussion
2.1 Method Development for a HPLC Method
2.1.1 Sample Extraction
Interaction between solvent and sample (Salting Out Effects andWater Adsorption) Prior to detection and quantification of the afla-toxins, they must be isolated from the rather complex and variable samplematrices. This is generally done by extraction of the sample material withan organic solvent, in order to dissolve the aflatoxins for further clean-up.
Several extractants have been proposed for the extraction of aflatoxinsfrom food and animal feeds [71] [72–76]. Since modern clean-up proceduresfor aflatoxins are based on immunoaffinity [1, 61], the extractants used forextraction consist preferably of an aqueous organic solvent such as methanol(MeOH), acetonitrile (MeCN) or acetone [1, 61, 77–79] [80, 81] [82–84].
Organic solvents other than these are less favorable, since they cannot beapplied directly onto the IAC and require the removal of the solvent, whilediluted aqueous extractants are easy to use for automated immunoaffinityclean-up procedures with subsequent HPLC determination of the aflatoxins[85]. Automatisation was found to improve recoveries and repeatability [61].
Several aqueous extractants of MeOH, MeCN and acetone as well as vari-ous extractant-to-sample-ratios have been under investigation and were com-pared for recovery in various sample materials [77, 86, 87]. However, none ofthese publications considered possible matrix-extractant interactions and re-sulting composition changes of the filtered extracts, while the focus of thesestudies was on the recovery of the analyte.
20
2.1. METHOD DEVELOPMENT FOR A HPLC METHOD 21
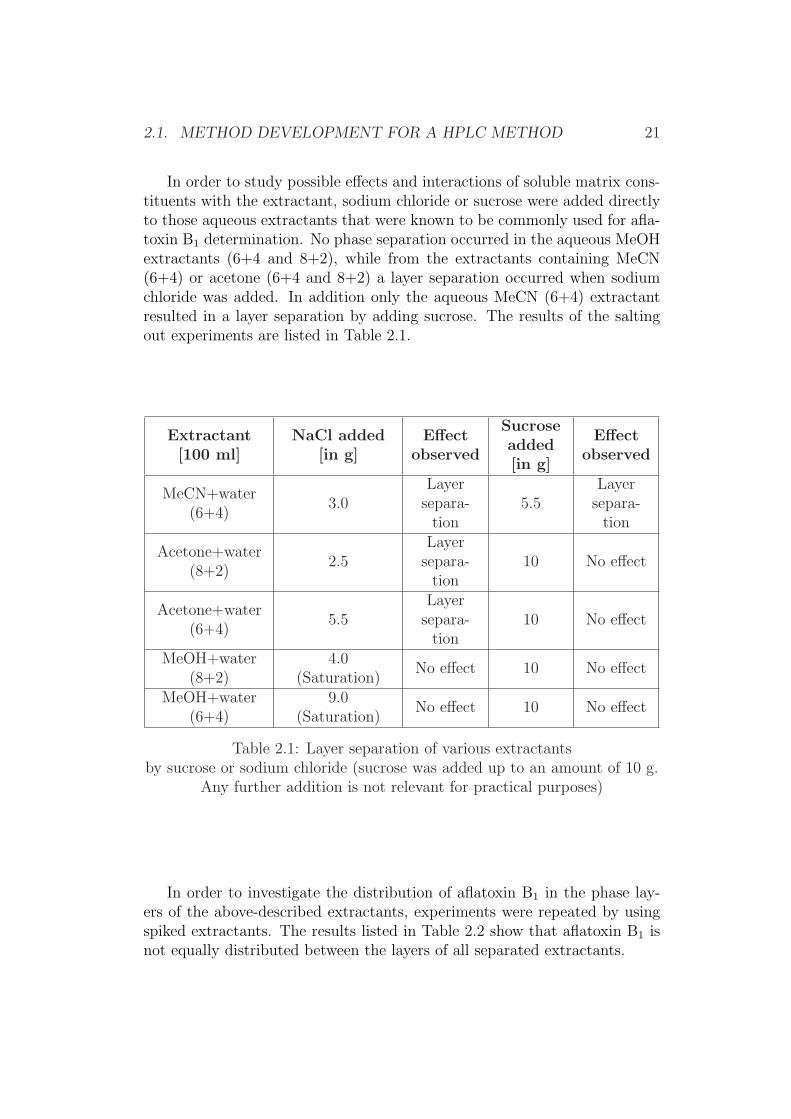
In order to study possible effects and interactions of soluble matrix cons-tituents with the extractant, sodium chloride or sucrose were added directlyto those aqueous extractants that were known to be commonly used for afla-toxin B1 determination. No phase separation occurred in the aqueous MeOHextractants (6+4 and 8+2), while from the extractants containing MeCN(6+4) or acetone (6+4 and 8+2) a layer separation occurred when sodiumchloride was added. In addition only the aqueous MeCN (6+4) extractantresulted in a layer separation by adding sucrose. The results of the saltingout experiments are listed in Table 2.1.
Extractant[100 ml]
NaCl added[in g]
Effectobserved
Sucroseadded[in g]
Effectobserved
MeCN+water(6+4)
3.0Layer
separa-tion
5.5Layer
separa-tion
Acetone+water(8+2)
2.5Layer
separa-tion
10 No effect
Acetone+water(6+4)
5.5Layer
separa-tion
10 No effect
MeOH+water(8+2)
4.0(Saturation)
No effect 10 No effect
MeOH+water(6+4)
9.0(Saturation)
No effect 10 No effect
Table 2.1: Layer separation of various extractantsby sucrose or sodium chloride (sucrose was added up to an amount of 10 g.
Any further addition is not relevant for practical purposes)
In order to investigate the distribution of aflatoxin B1 in the phase lay-ers of the above-described extractants, experiments were repeated by usingspiked extractants. The results listed in Table 2.2 show that aflatoxin B1 isnot equally distributed between the layers of all separated extractants.
22 CHAPTER 2. RESULTS AND DISCUSSION
Extractant (50 ml)AfB1 in
upper layer[in %]
AfB1 inlower layer
[in %]MeCN+water 6+4 (2 g NaCl) 93 7
MeCN+water 6+4 (3 g Sucrose) 93 7
Acetone+water 8+2 (1.5 g NaCl) 88 12
Acetone+water 6+4 (3 g NaCl) 69 31
Table 2.2: Distribution of AfB1
in the extractant layers after separation
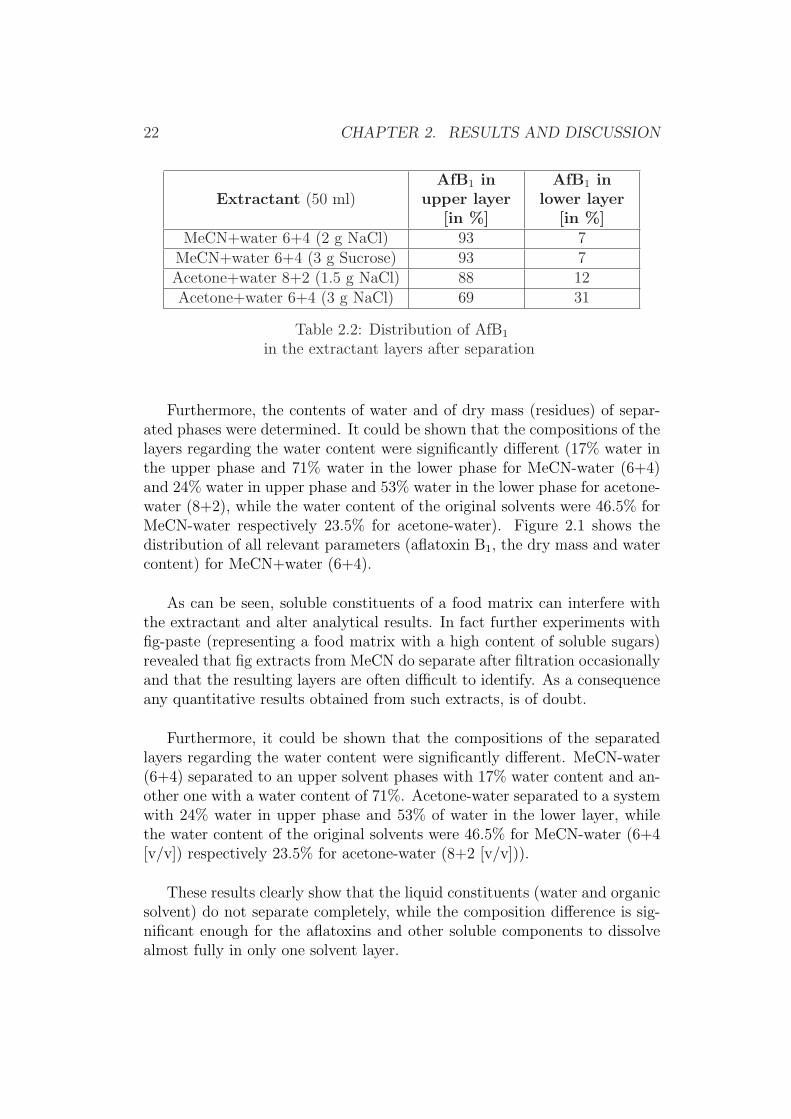
Furthermore, the contents of water and of dry mass (residues) of separ-ated phases were determined. It could be shown that the compositions of thelayers regarding the water content were significantly different (17% water inthe upper phase and 71% water in the lower phase for MeCN-water (6+4)and 24% water in upper phase and 53% water in the lower phase for acetone-water (8+2), while the water content of the original solvents were 46.5% forMeCN-water respectively 23.5% for acetone-water). Figure 2.1 shows thedistribution of all relevant parameters (aflatoxin B1, the dry mass and watercontent) for MeCN+water (6+4).
As can be seen, soluble constituents of a food matrix can interfere withthe extractant and alter analytical results. In fact further experiments withfig-paste (representing a food matrix with a high content of soluble sugars)revealed that fig extracts from MeCN do separate after filtration occasionallyand that the resulting layers are often difficult to identify. As a consequenceany quantitative results obtained from such extracts, is of doubt.
Furthermore, it could be shown that the compositions of the separatedlayers regarding the water content were significantly different. MeCN-water(6+4) separated to an upper solvent phases with 17% water content and an-other one with a water content of 71%. Acetone-water separated to a systemwith 24% water in upper phase and 53% of water in the lower layer, whilethe water content of the original solvents were 46.5% for MeCN-water (6+4[v/v]) respectively 23.5% for acetone-water (8+2 [v/v])).
These results clearly show that the liquid constituents (water and organicsolvent) do not separate completely, while the composition difference is sig-nificant enough for the aflatoxins and other soluble components to dissolvealmost fully in only one solvent layer.
2.1. METHOD DEVELOPMENT FOR A HPLC METHOD 23
Figure 2.1: Distribution of extractant constituentsafter layer separation
A B C D E FResults of the determination of components in the separated phases after addition of
sodium chloride (A - C) or sucrose (D - F). Columns A and D reflect the water content, columnsB and E the residues after evaporation (dry mass) and columns C and F the aflatoxin B1 distribution.
Rel
ativ
e di
strib
utio
n [in
%]
0
20
40
60
80
100Upper phaseLower phase
24 CHAPTER 2. RESULTS AND DISCUSSION
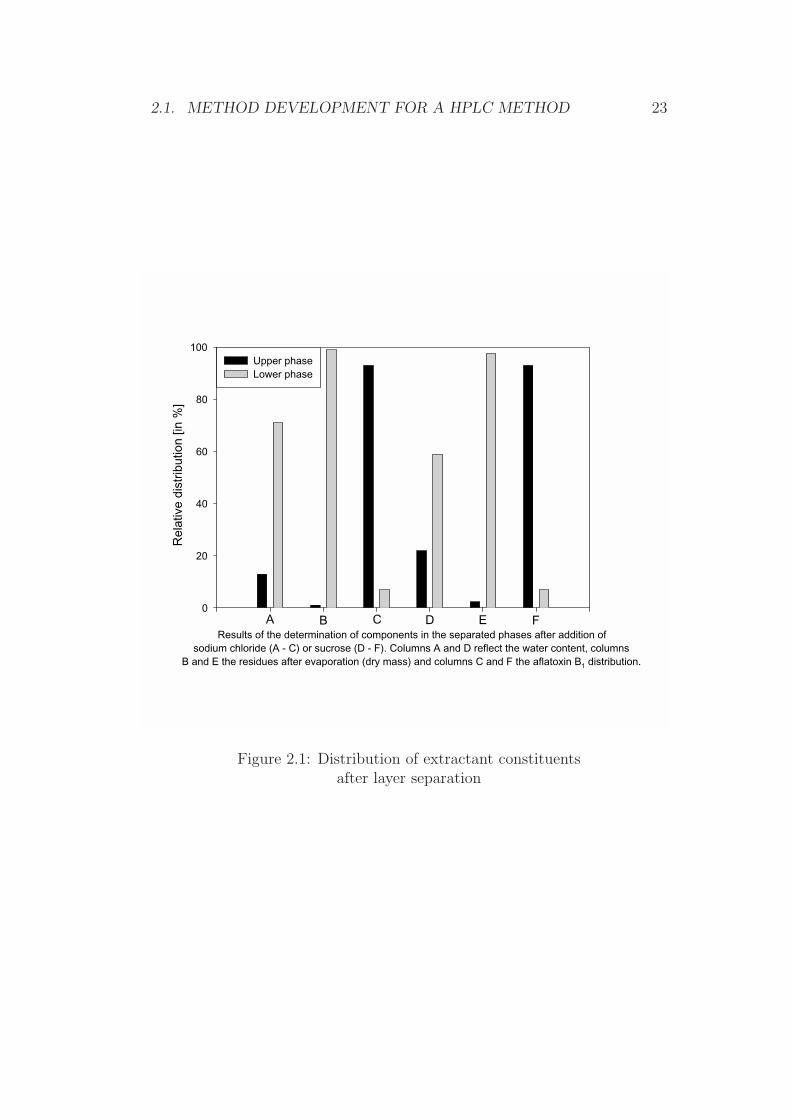
A visible phase layer separation of MeCN and acetone extracts as theyoccurred with figs were not observed for matrices such as paprika powder,animal feed or infant formula. However it was observed that the volume offiltrate decreased significantly for MeCN extracts, depending on the amountof sample used for extraction.
In addition certain extracted sample materials clotted during extractionwith MeCN-water (6+4), while extracts derived from MeOH-water (8+2)and acetone-water (8+2) resulted in a distinct separation of the extractantfrom the deposited matrix particles (Figures 2.2 and 2.3). This effect can betraced back as water adsorption by the matrix in addition to a non visiblephase separation, which will lead to the same effect as the observed saltingout.
Figure 2.2: Difference in the sedimentation of paprika powderwith different extractants
2.1. METHOD DEVELOPMENT FOR A HPLC METHOD 25
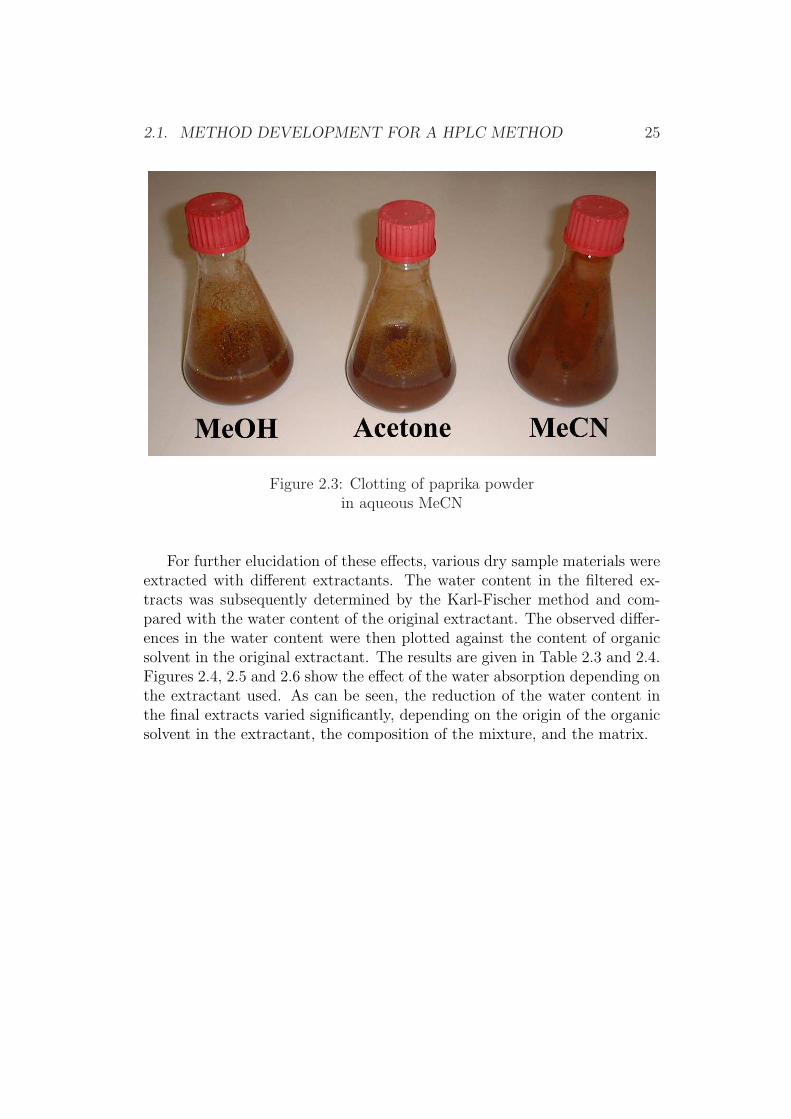
Figure 2.3: Clotting of paprika powderin aqueous MeCN
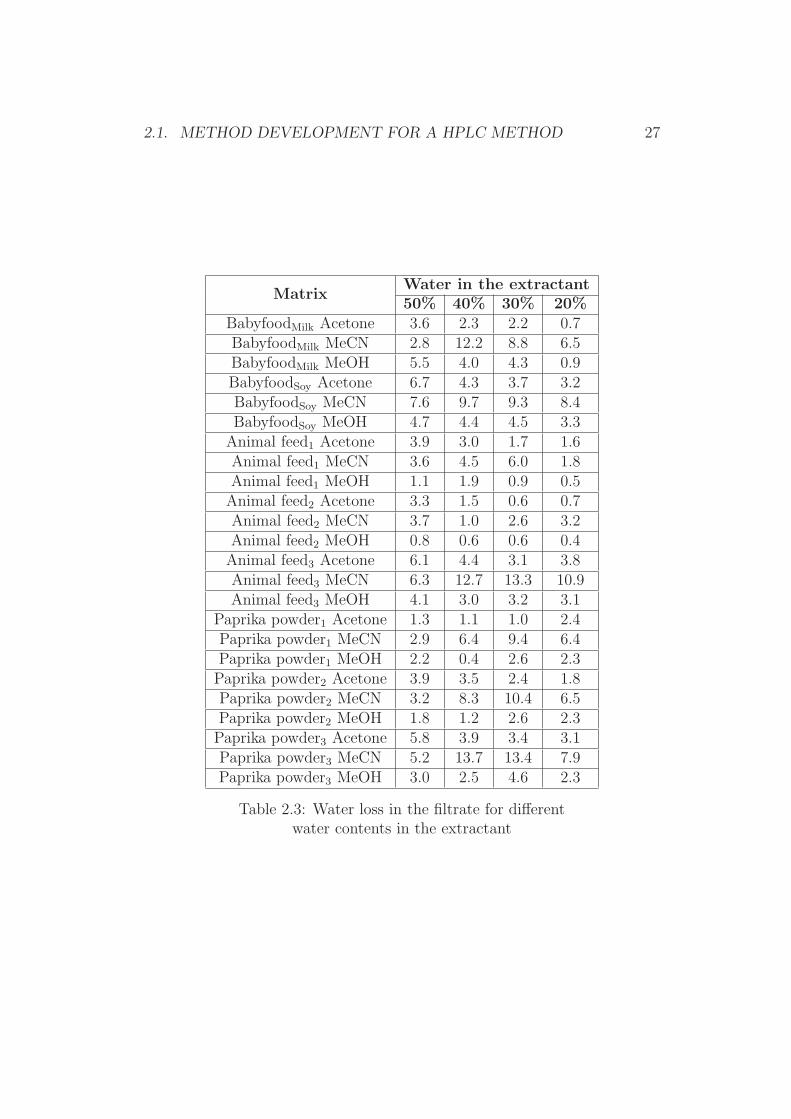
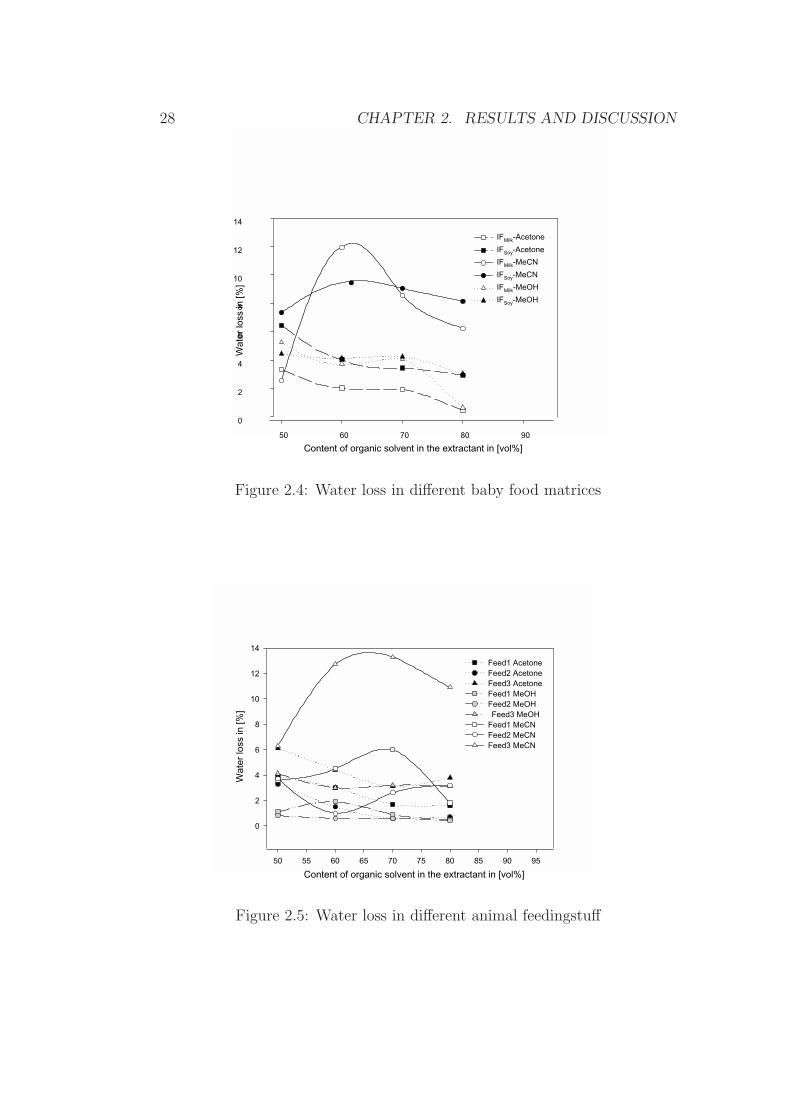
For further elucidation of these effects, various dry sample materials wereextracted with different extractants. The water content in the filtered ex-tracts was subsequently determined by the Karl-Fischer method and com-pared with the water content of the original extractant. The observed differ-ences in the water content were then plotted against the content of organicsolvent in the original extractant. The results are given in Table 2.3 and 2.4.Figures 2.4, 2.5 and 2.6 show the effect of the water absorption depending onthe extractant used. As can be seen, the reduction of the water content inthe final extracts varied significantly, depending on the origin of the organicsolvent in the extractant, the composition of the mixture, and the matrix.

26 CHAPTER 2. RESULTS AND DISCUSSION
Samplematerial:
gramsamplepro 100
mL
MeCN:H2O(6+4 [v/v])
MeOH:H2O(8+2 [v/v])
Acetone:H2O(8+2 [v/v])
Soy basedinfant
formula
10 3.9 1.4 1.120 8.4 3.3 3.240 18.3 5.6 5.7
Milk basedinfant
formula
10 2.8 0.3 0.120 6.5 0.9 0.740 18.3 3.0 1.0
Animalfeed #1
10 0.9 0.2 0.820 1.8 0.5 1.540 4.6 0.6 5.1
Animalfeed #2
10 1.8 0.8 0.720 3.2 0.4 0.740 14.2 1.1 1.8
Animalfeed #3
10 3.5 2.0 2.020 10.9 3.1 3.840 23.6 5.0 8.2
Paprika #110 1.3 0.5 1.120 6.4 2.3 2.440 21.2 3.7 4.1
Paprika #210 2.8 0.9 0.420 6.5 2.3 1.740 20.5 3.4 4.2
Paprika #310 2.8 1.2 1.120 7.9 2.3 3.040 24.1 4.9 6.0
Table 2.4: Water loss in the extration filtratefor different sample-to-extractant ratios
2.1. METHOD DEVELOPMENT FOR A HPLC METHOD 27
MatrixWater in the extractant50% 40% 30% 20%
BabyfoodMilk Acetone 3.6 2.3 2.2 0.7BabyfoodMilk MeCN 2.8 12.2 8.8 6.5BabyfoodMilk MeOH 5.5 4.0 4.3 0.9BabyfoodSoy Acetone 6.7 4.3 3.7 3.2BabyfoodSoy MeCN 7.6 9.7 9.3 8.4BabyfoodSoy MeOH 4.7 4.4 4.5 3.3
Animal feed1 Acetone 3.9 3.0 1.7 1.6Animal feed1 MeCN 3.6 4.5 6.0 1.8Animal feed1 MeOH 1.1 1.9 0.9 0.5Animal feed2 Acetone 3.3 1.5 0.6 0.7Animal feed2 MeCN 3.7 1.0 2.6 3.2Animal feed2 MeOH 0.8 0.6 0.6 0.4Animal feed3 Acetone 6.1 4.4 3.1 3.8Animal feed3 MeCN 6.3 12.7 13.3 10.9Animal feed3 MeOH 4.1 3.0 3.2 3.1
Paprika powder1 Acetone 1.3 1.1 1.0 2.4Paprika powder1 MeCN 2.9 6.4 9.4 6.4Paprika powder1 MeOH 2.2 0.4 2.6 2.3Paprika powder2 Acetone 3.9 3.5 2.4 1.8Paprika powder2 MeCN 3.2 8.3 10.4 6.5Paprika powder2 MeOH 1.8 1.2 2.6 2.3Paprika powder3 Acetone 5.8 3.9 3.4 3.1Paprika powder3 MeCN 5.2 13.7 13.4 7.9Paprika powder3 MeOH 3.0 2.5 4.6 2.3
Table 2.3: Water loss in the filtrate for differentwater contents in the extractant
28 CHAPTER 2. RESULTS AND DISCUSSION
Figure 2.4: Water loss in different baby food matrices
Figure 2.5: Water loss in different animal feedingstuff
0
2
4
6
8
10
12
14
Content of organic solvent in the extractant in [vol%]50 60 70 80 90
Wat
er lo
ss in
[%]
0
2
4
6
8
10
12
14
IFMilk-Acetone
IFSoy-Acetone
IFMilk-MeCN
IFSoy-MeCN
IFMilk-MeOH
IFSoy-MeOH
Content of organic solvent in the extractant in [vol%]
50 55 60 65 70 75 80 85 90 95
Wat
er lo
ss in
[%]
0
2
4
6
8
10
12
14
Feed1 AcetoneFeed2 AcetoneFeed3 AcetoneFeed1 MeOHFeed2 MeOHFeed3 MeOH
Feed1 MeCNFeed2 MeCNFeed3 MeCN
2.1. METHOD DEVELOPMENT FOR A HPLC METHOD 29
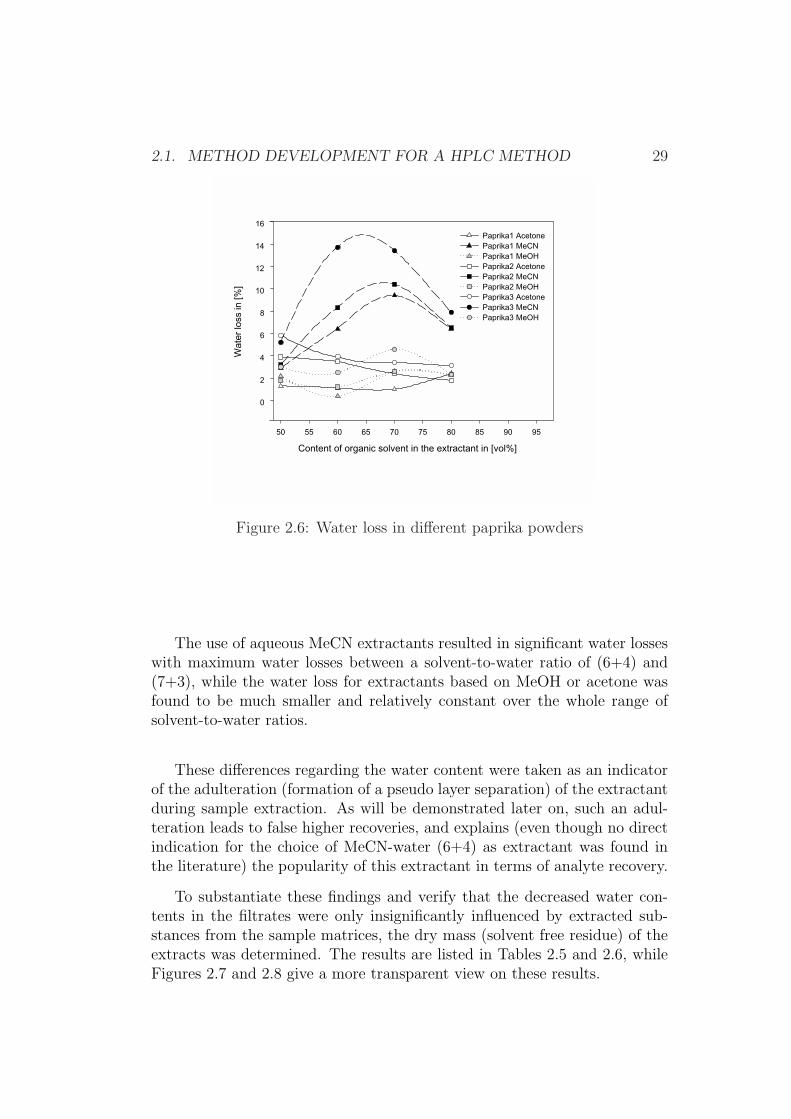
Figure 2.6: Water loss in different paprika powders
The use of aqueous MeCN extractants resulted in significant water losseswith maximum water losses between a solvent-to-water ratio of (6+4) and(7+3), while the water loss for extractants based on MeOH or acetone wasfound to be much smaller and relatively constant over the whole range ofsolvent-to-water ratios.
These differences regarding the water content were taken as an indicatorof the adulteration (formation of a pseudo layer separation) of the extractantduring sample extraction. As will be demonstrated later on, such an adul-teration leads to false higher recoveries, and explains (even though no directindication for the choice of MeCN-water (6+4) as extractant was found inthe literature) the popularity of this extractant in terms of analyte recovery.
To substantiate these findings and verify that the decreased water con-tents in the filtrates were only insignificantly influenced by extracted sub-stances from the sample matrices, the dry mass (solvent free residue) of theextracts was determined. The results are listed in Tables 2.5 and 2.6, whileFigures 2.7 and 2.8 give a more transparent view on these results.
Content of organic solvent in the extractant in [vol%]
50 55 60 65 70 75 80 85 90 95
Wat
er lo
ss in
[%]
0
2
4
6
8
10
12
14
16
Paprika1 AcetonePaprika1 MeCNPaprika1 MeOHPaprika2 AcetonePaprika2 MeCNPaprika2 MeOHPaprika3 AcetonePaprika3 MeCNPaprika3 MeOH

30 CHAPTER 2. RESULTS AND DISCUSSION
Sample MaterialMeOH:H2O
(8+2)Acetone:H2O
(85+15)MeCN:H2O
(6+4)
BabyfoodMilk 2.5 1.8 1.5
BabyfoodSoy 9.0 1.0 2.0
Animal feed1 2.7 1.3 2.6
Animal feed2 1.8 1.3 1.9
Animal feed3 11.2 0.8 1.7
Paprika powder1 8.7 4.3 3.8
Paprika powder2 9.9 3.0 3.4
Paprika powder3 11.7 3.3 2.7
Table 2.5: Dry mass of various sample extracts(solvent free residue in %) at a ratio of 20 g per 100 mL
Figure 2.7: Dry mass (residue) depending on the extractant
Matrices that were extracted at a sample-to-extractant ratio of 1:5 (w/v)
MeCN Acetone MeOH
Dry
mas
s (r
esid
ue)
afte
r ev
apor
atio
n [in
%]
0
2
4
6
8
10
12
Animal Feed1
Animal Feed2
Animal Feed3
Infant formulasoy
Infant formulamilk
Paprika1
Paprika2
Paprika3
2.1. METHOD DEVELOPMENT FOR A HPLC METHOD 31
g/100mL
Methanol Acetonitrile Acetone#1 #2 #3 #1 #2 #3 #1 #2 #3
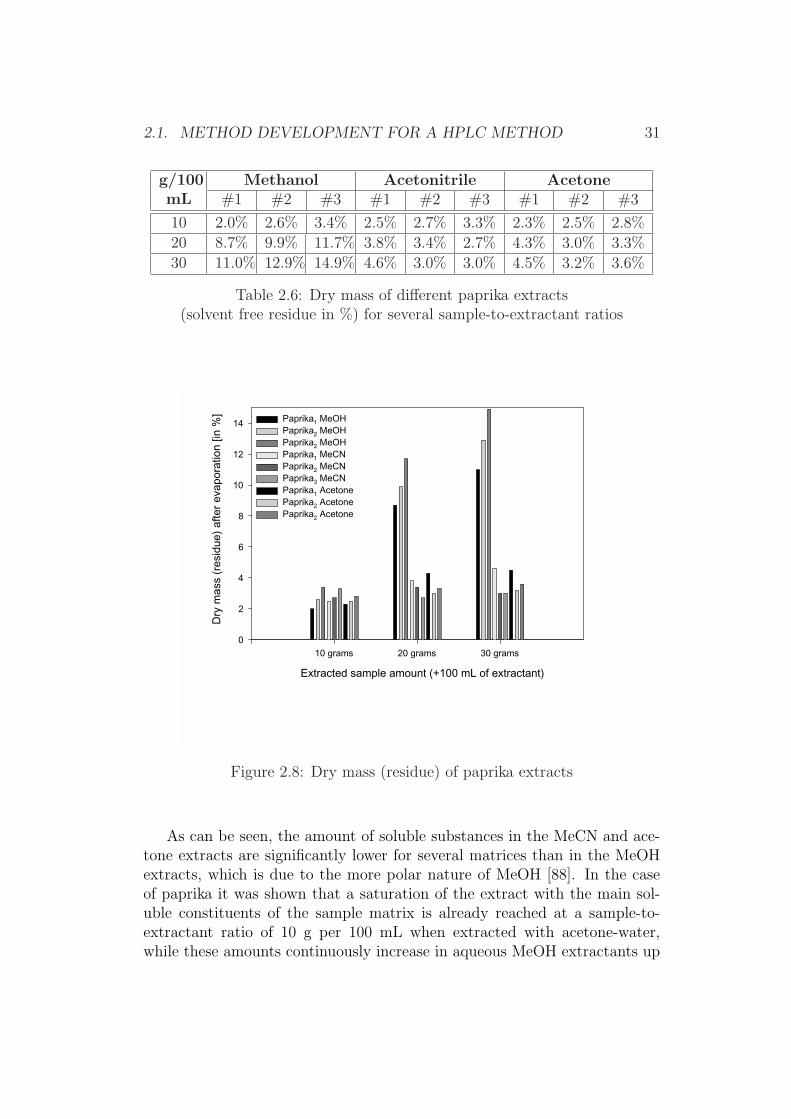
10 2.0% 2.6% 3.4% 2.5% 2.7% 3.3% 2.3% 2.5% 2.8%
20 8.7% 9.9% 11.7% 3.8% 3.4% 2.7% 4.3% 3.0% 3.3%
30 11.0% 12.9% 14.9% 4.6% 3.0% 3.0% 4.5% 3.2% 3.6%
Table 2.6: Dry mass of different paprika extracts(solvent free residue in %) for several sample-to-extractant ratios
Figure 2.8: Dry mass (residue) of paprika extracts
As can be seen, the amount of soluble substances in the MeCN and ace-tone extracts are significantly lower for several matrices than in the MeOHextracts, which is due to the more polar nature of MeOH [88]. In the caseof paprika it was shown that a saturation of the extract with the main sol-uble constituents of the sample matrix is already reached at a sample-to-extractant ratio of 10 g per 100 mL when extracted with acetone-water,while these amounts continuously increase in aqueous MeOH extractants up
Extracted sample amount (+100 mL of extractant)
10 grams 20 grams 30 grams
Dry
mas
s (r
esid
ue)
afte
r ev
apor
atio
n [in
%]
0
2
4
6
8
10
12
14 Paprika1 MeOHPaprika2 MeOHPaprika2 MeOHPaprika1 MeCNPaprika2 MeCNPaprika3 MeCNPaprika1 AcetonePaprika2 AcetonePaprika2 Acetone
32 CHAPTER 2. RESULTS AND DISCUSSION
to a ratio of 40 g per 100 mL, which is the line of practicable procedures.
It must be mentioned, that these dry mass experiments must be inter-preted with care, at least in the case of aqueous MeCN, since the filteredextracts had a different composition than the original extractants used. Gen-erally in these extracts the water content was decreased and therefore thepolarity decreased, while the solubility of the according solvent layer, whichremained in the filter cake was unknown.
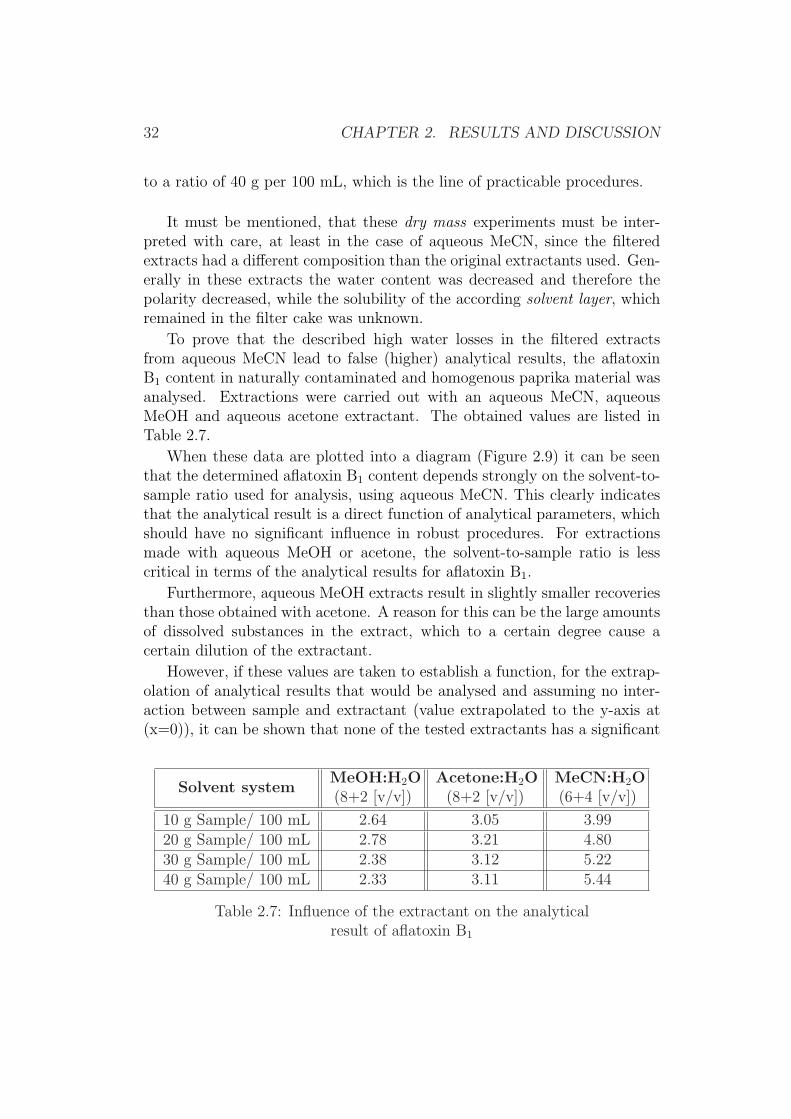
To prove that the described high water losses in the filtered extractsfrom aqueous MeCN lead to false (higher) analytical results, the aflatoxinB1 content in naturally contaminated and homogenous paprika material wasanalysed. Extractions were carried out with an aqueous MeCN, aqueousMeOH and aqueous acetone extractant. The obtained values are listed inTable 2.7.
When these data are plotted into a diagram (Figure 2.9) it can be seenthat the determined aflatoxin B1 content depends strongly on the solvent-to-sample ratio used for analysis, using aqueous MeCN. This clearly indicatesthat the analytical result is a direct function of analytical parameters, whichshould have no significant influence in robust procedures. For extractionsmade with aqueous MeOH or acetone, the solvent-to-sample ratio is lesscritical in terms of the analytical results for aflatoxin B1.
Furthermore, aqueous MeOH extracts result in slightly smaller recoveriesthan those obtained with acetone. A reason for this can be the large amountsof dissolved substances in the extract, which to a certain degree cause acertain dilution of the extractant.
However, if these values are taken to establish a function, for the extrap-olation of analytical results that would be analysed and assuming no inter-action between sample and extractant (value extrapolated to the y-axis at(x=0)), it can be shown that none of the tested extractants has a significant
Solvent systemMeOH:H2O(8+2 [v/v])
Acetone:H2O(8+2 [v/v])
MeCN:H2O(6+4 [v/v])
10 g Sample/ 100 mL 2.64 3.05 3.99
20 g Sample/ 100 mL 2.78 3.21 4.80
30 g Sample/ 100 mL 2.38 3.12 5.22
40 g Sample/ 100 mL 2.33 3.11 5.44
Table 2.7: Influence of the extractant on the analyticalresult of aflatoxin B1

2.1. METHOD DEVELOPMENT FOR A HPLC METHOD 33
advantage in terms of a better recovery.
To further support the findings that extractions made with aqueous MeCNlead to false recoveries, fortified (spiked) blank paprika material was anal-ysed. Recoveries ranged from 137% to 170% for aqueous MeCN extraction(40 g/100 mL) clearly showing a crucial error in this method, while for lowerratios (10 g/ 100 mL) this effect will be masked and the recoveries were foundto be in an acceptable range of 78% - 89%. Recoveries obtained with aque-ous MeOH were inconspicuous for the whole range of 10 g to 40 g of samplematerial per 100 mL extractant and varied from 75% - 94%.
These experiments showed that aqueous MeCN is an inadequate extrac-tant for aflatoxin analysis and might lead to false analytical results. Despiteits popularity as extractant it should therefore be replaced by either aqueousacetone or MeOH.
Furthermore, it should be stressed that another drawback of MeCN isthe unsteady water absorption (even though only an indicator) by matricesof the same origin. As already shown in Table 2.3 the water-loss within a
Figure 2.9: Dependency of analytical results on the extractant
Extracted sample amount (+100 mL of extractant)
10 grams 20 grams 30 grams
Dry
mas
s (r
esid
ue)
afte
r ev
apor
atio
n [in
%]
0
2
4
6
8
10
12
14 Paprika1 MeOHPaprika2 MeOHPaprika2 MeOHPaprika1 MeCNPaprika2 MeCNPaprika3 MeCNPaprika1 AcetonePaprika2 AcetonePaprika2 Acetone
34 CHAPTER 2. RESULTS AND DISCUSSION
very specific food group such as paprika powder might differ significantly(6%, 8%, and 14% for MeCN [6+4]). This fact indicates an unpredictableinteraction and thus makes it impossible to correct any results for recovery.Nevertheless the loss of water should not be used for correction of analyticaldata, since it reveals no information of the volumes of the separated phasesformed during extraction, thus the analyte concentration.
These effects should not only concern the determination of aflatoxin B1
but also all those analytes that have comparable solubility and distributionproperties in separated solvent layers. Therefore these effects should gener-ally be taken into consideration when extractants are compared or selectedfor recovery and suitability.
Matrices with a high content of fat (Pistachio Paste and PeanutButter) Peanuts and pistachios are matrices with a high content of fatand especially in the case of follow-up products such as peanut butter orpistachio paste the fat content and the consistency of these matrices are ofgreat importance for the extraction procedure. After technological process-ing, these products consist of a lipid-phase with incorporated particles thatare contaminated with aflatoxins. Aflatoxins are practically not fat soluble,thus a sufficient extraction is crucial to free any possible incorporated afla-toxins.
Chloroform (as a fat soluble solvent that also dissolves aflatoxins) was notconsidered to be used due to its toxicity and its incompatibility for furtherimmunoaffinity clean-up procedures.
Aqueous acetone1 was found to be a sufficiently fat soluble solvent topenetrate the fat phase of peanut or pistachio products and dissolve the afla-toxins. However it was not considered as an appropriate extractant (eventhough a rapid dissolution of the fat and the aflatoxins was observed), sincethe dilution of the filtered extracts with phosphate buffered saline or water2 separated the dissolved fat and formed fine emulsions, which required ad-ditional clean-up steps and which did not occur with aqueous MeOH.
The extraction by high-speed blending with aqueous MeOH together witha non-polar solvent (hexane or cyclohexane) was found to be the most suit-able extraction mode.
1Acetone-water [8+2]2See Chapter 2.1.2
2.1. METHOD DEVELOPMENT FOR A HPLC METHOD 35
A subsequent filtration of the homogenized extract (emulsion of the non-polar solvent and the aqueous MeOH) allowed the successful separation ofthe non-polar solvent. The fat containing phase remained in the filter cake,while the aqueous filtrate (containing the extracted aflatoxins) was directlyready for further analysis. However, any delay in the filtration resulted in aseparation of the emulsion and the formation of two layers in the filtrate.
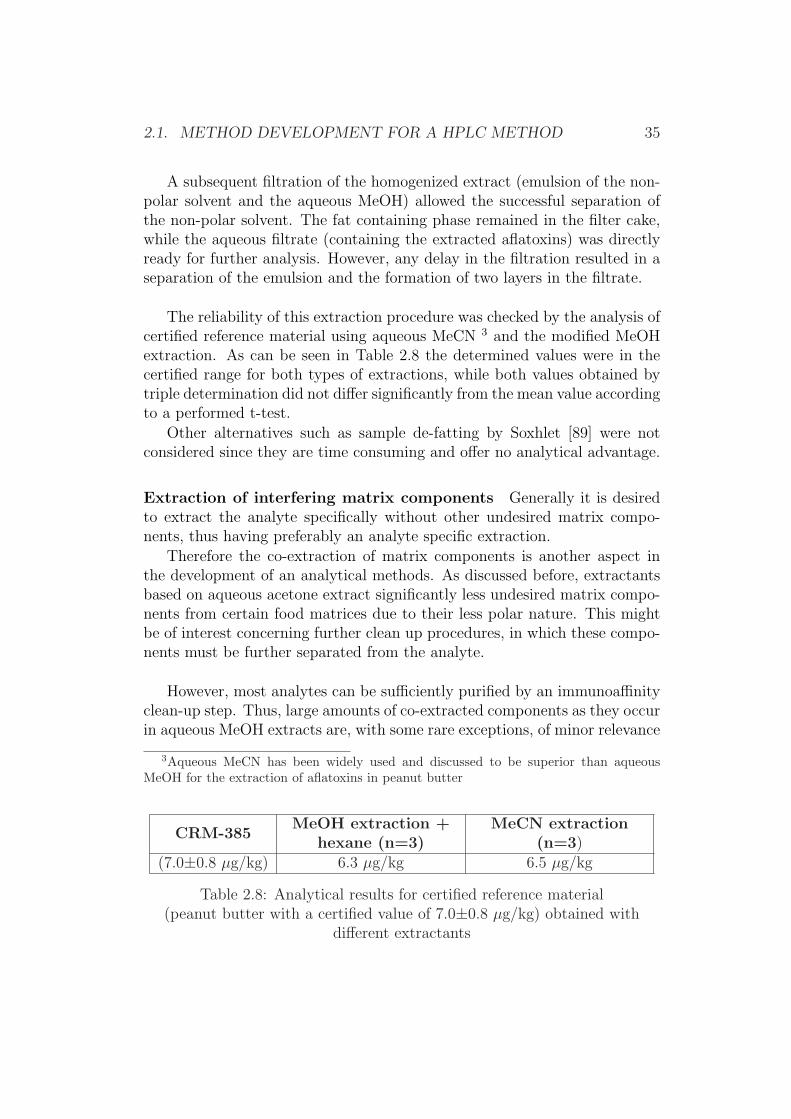
The reliability of this extraction procedure was checked by the analysis ofcertified reference material using aqueous MeCN 3 and the modified MeOHextraction. As can be seen in Table 2.8 the determined values were in thecertified range for both types of extractions, while both values obtained bytriple determination did not differ significantly from the mean value accordingto a performed t-test.
Other alternatives such as sample de-fatting by Soxhlet [89] were notconsidered since they are time consuming and offer no analytical advantage.
Extraction of interfering matrix components Generally it is desiredto extract the analyte specifically without other undesired matrix compo-nents, thus having preferably an analyte specific extraction.
Therefore the co-extraction of matrix components is another aspect inthe development of an analytical methods. As discussed before, extractantsbased on aqueous acetone extract significantly less undesired matrix compo-nents from certain food matrices due to their less polar nature. This mightbe of interest concerning further clean up procedures, in which these compo-nents must be further separated from the analyte.
However, most analytes can be sufficiently purified by an immunoaffinityclean-up step. Thus, large amounts of co-extracted components as they occurin aqueous MeOH extracts are, with some rare exceptions, of minor relevance
3Aqueous MeCN has been widely used and discussed to be superior than aqueousMeOH for the extraction of aflatoxins in peanut butter
CRM-385MeOH extraction +
hexane (n=3)MeCN extraction
(n=3)(7.0±0.8 µg/kg) 6.3 µg/kg 6.5 µg/kg
Table 2.8: Analytical results for certified reference material(peanut butter with a certified value of 7.0±0.8 µg/kg) obtained with
different extractants
36 CHAPTER 2. RESULTS AND DISCUSSION
due to the highly specific affinity of the analyte to the antibody.
Animal feed containing citrus pulp Citrus pulp is a common cons-titutent in animal feed and has been described in literature to cause inter-ferences with aflatoxins by determination with TLC and with HPLC [62, 90–92]. To a certain degree these interferences could be minimized in HPLC byderivatization with bromine rather than with iodine [90].
However chromatograms obtained from extracts of aqueous MeOH canstill contain sufficient amounts of interfering citrus pulp even when purifiedby immunoaffinity. The reason for this interference can be assumed to bethat citrus pulp might concentrate on the immunoaffinity gel and elutes to-gether with the aflatoxin when washed out with neat MeOH.
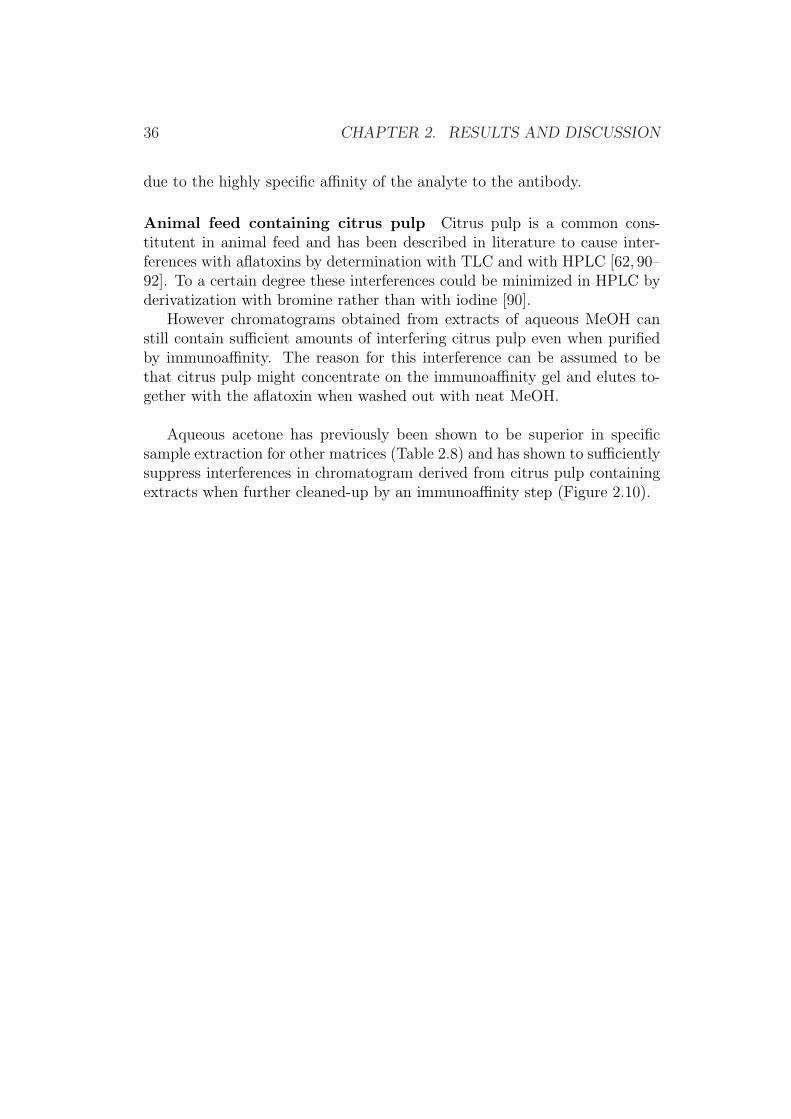
Aqueous acetone has previously been shown to be superior in specificsample extraction for other matrices (Table 2.8) and has shown to sufficientlysuppress interferences in chromatogram derived from citrus pulp containingextracts when further cleaned-up by an immunoaffinity step (Figure 2.10).
2.1. METHOD DEVELOPMENT FOR A HPLC METHOD 37
time [in minutes]
0 2 4 6 8 10 12 14 16
Sig
nal [
in m
V]
5
6
7Operating conditions:Injection volume: 200 µLColumn: LC-18 (25 cm and 4.6 mm inner diameter)Flow rate: 1 mL/minuteMobile phase: water-methanol-acetonitrile (6+3+2 [v/v/v]),containing 120 mg KBr and 350 µL HNO3 of (c HNO3=4 Mol/L)Derivatisation: electrochemical bromination (KOBRA-cell)Detection: Fluorescence (Ex.:365 nm, Em.:435 nm)
AfB1
blank
Figure 2.10: Chromatogram of an animal feedingstuff extractat approximately 1 µg/kg aflatoxin B1
2.1.2 Sample Preparation
After extraction from the sample matrix, the aflatoxins have to be furtherisolated from any co-extracted matrix constituents. This is commonly doneby solid phase extraction [93] or more recently by immunoaffinity clean-upprocedures [61], while the latter procedures are the method of choice. There-fore the robustness and reliability of the immunoaffinity clean-up step for thehere described matrices and methods were specifically evaluated. Generallythe filtered extracts were diluted with PBS and directly applied on the IAC.In cases of considerable precipitation during the dilution process the extractswere filtered to avoid clogging of the IACs.
38 CHAPTER 2. RESULTS AND DISCUSSION
Sensitivity of the immunoaffinity column against organic solventsThe nature of organic solvent is a critical parameter since the aflatoxin an-tibodies in the IAC are sensitive towards organic solvents. Several dilutedextractants as well as immunoaffinity loading and elution procedures for my-cotoxins have been reviewed [61]. Methanol concentrations of 5% up to 30%in the diluted extracts used for IA-clean up have been reported, while acetoneconcentration were found to be more critical for recovery, thus concentra-tions of 1% already might cause losses of aflatoxin G2, while concentrationsof >20% cause significant losses of aflatoxin B2. It was found that final ace-tone concentrations of approximately 2% were suitable for most IACs andminimise undesired losses [78].
However, the development of IACs is an ongoing process and it was ex-pected that the quality of IACs has changed over the time and even fromproduct to product. Therefore the reviewed procedures were taken as aguideline for an in-house IAC testing.
The used IACs here were specified by the supplier not to be used withMeOH concentrations higher than 10%, while for diluted acetone solutionsno reliable data was available 4. Since it was intended to use acetone-waterfor the extraction of animal feed the robustness of the IACs was tested withmixed standard solution of aflatoxins and solutions of MeOH (10%) andvarious acetone concentration.
Aflatoxins in 10% MeOH were found to result in no significant loss inimmunoaffinity performance (recovery), even if large volumes up to 100 mLwere applied (Figure 2.11), thus indicating the suitable stability indicatedby the supplier. Even solutions of 30 mL with a content of 15% MeOHhave been shown to result in no relevant loss in performance (recovery of>90% for all aflatoxins), indicating a sufficient margin of robustness. Higherconcentrations than this were not investigated in order to remain in the areaof recommendation by the supplier.
4Rhone-Diagnostics Easy Extract columns

2.1. METHOD DEVELOPMENT FOR A HPLC METHOD 39
Figure 2.11: Robustness of IACs towards aqueous MeOH solutions
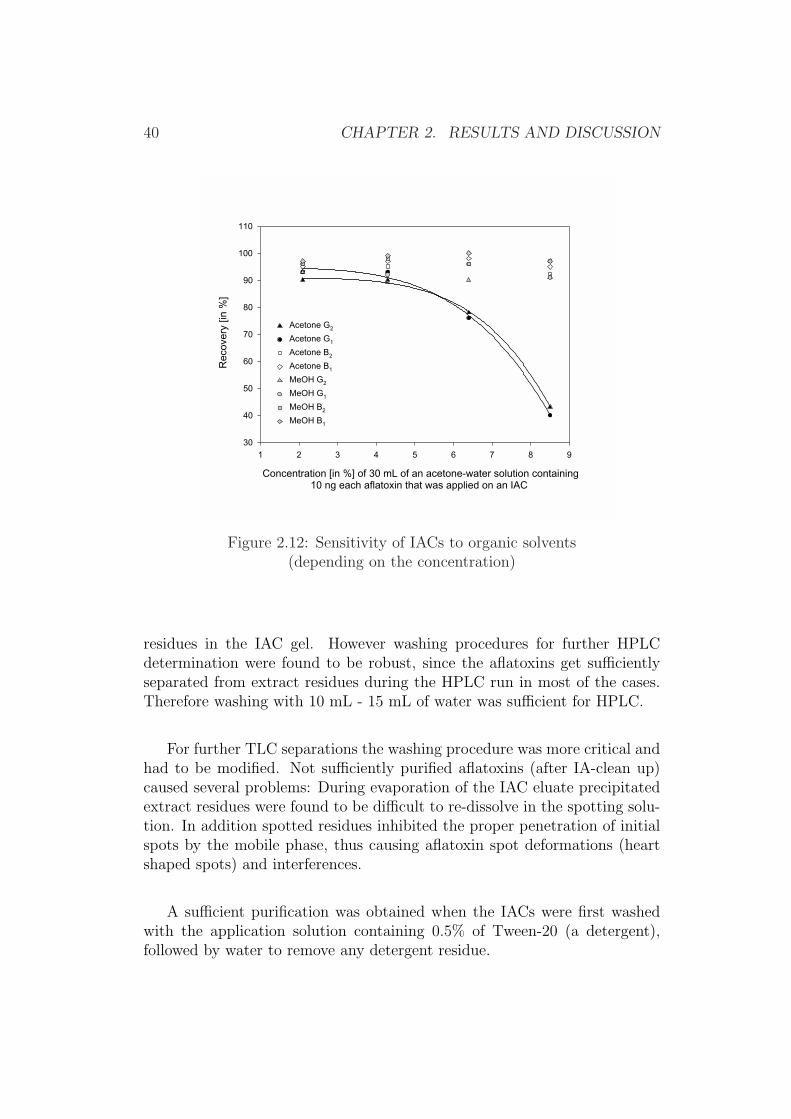
The application of diluted MeCN or acetone does not allow such concen-trations as were used for MeOH or even in such large amounts of extractaliquots. MeCN was not tested for this purpose since it was previously ex-cluded as an extractant, while acetone was directly compared with MeOH.As can be seen in Figures 2.12 and 2.13 the recovery for aflatoxins G1 and G2
decreases drastically at larger concentrations of acetone (>5%) or if largervolumes of solutions of aqueous acetone are applied. However the recovery foraflatoxin B1 and aflatoxin B2 remained fairly stable even at concentrationsof more than 8%, thus indicating that for methods designed to determineaflatoxin B1 only5, acetone extractants were suitable up to a concentrationof around 8% for the IAC-type used, with a sufficient margin of robustnesseven if volumes of 50 mL were applied on the IAC.
Washing procedures for the IAC Generally IACs are washed with wa-ter, PBS, or better with a solution that has the same composition as thediluted extract. The latter helps to avoid precipitation of diluted matrix
5A regulatory limit for cattle feed is foreseen to be established only for aflatoxin B1
Amount [in mL] of a 10 % MeOH-water solution containing 10 ngof each aflatoxin that were applied on an IAC
0 20 40 60 80 100 120
Rec
over
y [in
%]
0
10
20
30
40
50
60
70
80
90
100
110
AfG1
AfG2
AfB1
AfB2
40 CHAPTER 2. RESULTS AND DISCUSSION
Figure 2.12: Sensitivity of IACs to organic solvents(depending on the concentration)
residues in the IAC gel. However washing procedures for further HPLCdetermination were found to be robust, since the aflatoxins get sufficientlyseparated from extract residues during the HPLC run in most of the cases.Therefore washing with 10 mL - 15 mL of water was sufficient for HPLC.
For further TLC separations the washing procedure was more critical andhad to be modified. Not sufficiently purified aflatoxins (after IA-clean up)caused several problems: During evaporation of the IAC eluate precipitatedextract residues were found to be difficult to re-dissolve in the spotting solu-tion. In addition spotted residues inhibited the proper penetration of initialspots by the mobile phase, thus causing aflatoxin spot deformations (heartshaped spots) and interferences.
A sufficient purification was obtained when the IACs were first washedwith the application solution containing 0.5% of Tween-20 (a detergent),followed by water to remove any detergent residue.
Concentration [in %] of 30 mL of an acetone-water solution containing10 ng each aflatoxin that was applied on an IAC
1 2 3 4 5 6 7 8 9
Rec
over
y [in
%]
30
40
50
60
70
80
90
100
110
Acetone G2
Acetone G1
Acetone B2
Acetone B1
MeOH G2
MeOH G1
MeOH B2
MeOH B1
2.1. METHOD DEVELOPMENT FOR A HPLC METHOD 41
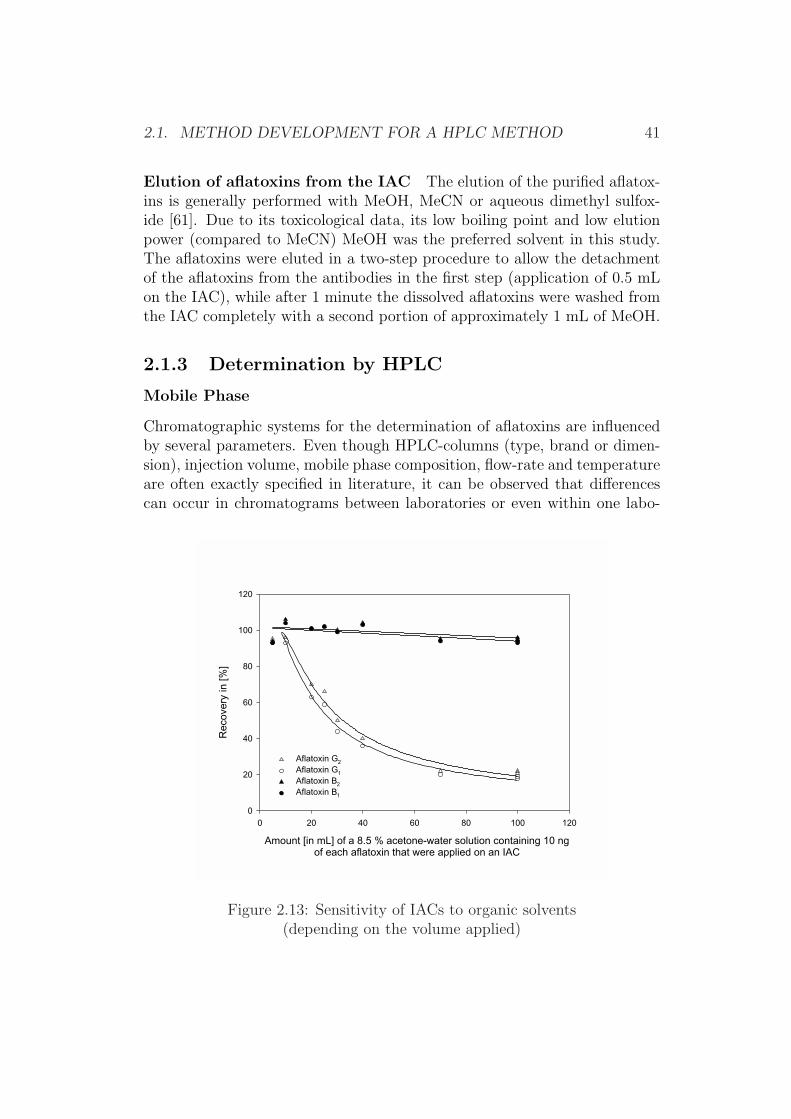
Elution of aflatoxins from the IAC The elution of the purified aflatox-ins is generally performed with MeOH, MeCN or aqueous dimethyl sulfox-ide [61]. Due to its toxicological data, its low boiling point and low elutionpower (compared to MeCN) MeOH was the preferred solvent in this study.The aflatoxins were eluted in a two-step procedure to allow the detachmentof the aflatoxins from the antibodies in the first step (application of 0.5 mLon the IAC), while after 1 minute the dissolved aflatoxins were washed fromthe IAC completely with a second portion of approximately 1 mL of MeOH.
2.1.3 Determination by HPLC
Mobile Phase
Chromatographic systems for the determination of aflatoxins are influencedby several parameters. Even though HPLC-columns (type, brand or dimen-sion), injection volume, mobile phase composition, flow-rate and temperatureare often exactly specified in literature, it can be observed that differencescan occur in chromatograms between laboratories or even within one labo-
Figure 2.13: Sensitivity of IACs to organic solvents(depending on the volume applied)
Amount [in mL] of a 8.5 % acetone-water solution containing 10 ngof each aflatoxin that were applied on an IAC
0 20 40 60 80 100 120
Rec
over
y in
[%]
0
20
40
60
80
100
120
Aflatoxin G2
Aflatoxin G1 Aflatoxin B2
Aflatoxin B1

42 CHAPTER 2. RESULTS AND DISCUSSION
ratory at different times.Several mobile phases based on different ratios of water, MeOH and MeCNhave been described in the literature for reversed-phase separations of afla-toxins (Table 2.9). Most authors did not indicate reasons for the selection ofthe mobile phase used or even chromatographic system, while can be assumedthat systems were optimized for short retention times with full baseline sep-aration of the peaks concerned.
Ref.Mobile phase composition and HPLC column typeMeCN [Vol%] H2O MeOH MeCN Column
[97] 33 670 [mL] 0 [mL] 330 [mL] Phenyl[85] 30 580 [mL] 120 [mL] 300 [mL] ODS1[101] 22 630 [mL] 150 [mL] 220 [mL] RP-18[169] 20 600 [mL] 200 [mL] 200 [mL] LC-18[90] 17 1300 [mL] 700 [mL] 400 [mL] RP-18
Table 2.9: Composition of selected mobile phases with differentMeCN content The values for Vol% are not corrected for volume
contraction of the final solution.
The focus of the elaborated mobile phase development was orientated onpublished data and considered to obtain sharp peaks with a resolution of≥1.256 (to limit errors during integration [94]), favorable capacity factors(k’) of 1 - 5 [95], while reducing the amount of MeCN in the mobile phase.Low amounts of MeCN were favorable, since MeCN is a toxic solvent andthe membrane of the post derivatization system (KOBRA7-cell) is known tobe sensitive towards higher concentrations of MeCN.
Mobile phases on the base of water and MeOH were tested initially. How-ever it was found that these binary systems did not allow the separation ofthe aflatoxins in a reasonable time of analysis. The amounts of MeOH neededto allow the separations in an acceptable amount of time, lead to the mergingof aflatoxin peaks, due to the relative low plate numbers that were obtainedwith these binary systems. Mobile phases out of water and MeCN offeredsharper peaks for all aflatoxins, however the peaks could not be separated
6According to the technical annex of the project proposal the maximum height of thevalley of 2 overlapping peaks had to be less than 10% of the peak height of the smallerpeak.
7Kok’s bromination apparatus
2.1. METHOD DEVELOPMENT FOR A HPLC METHOD 43
fully due to similar retention times in these mobile phases. A mobile phasecomposed of water, MeOH and MeCN (600 + 300 + 200 [v/v/v]), as it waspreviously described [81], has been found to offer a sufficient separation witha least amount of MeCN for the in-house HPLC system. This mobile phaseoffered the desired peak separation within an analysis time of 15 minuteswith a relatively small amount of MeCN of less than 20 vol%.
Injection Volume and Injection Solvent
The HPLC injection volume can be a critical parameter that can highlyinfluence the performance of an HPLC system. On one hand a large injectionincreases the fraction of the analyte, while on the other hand large injectionvolumes imply that the starting zone at the beginning of the chromatogramcan lead to losses of performance.
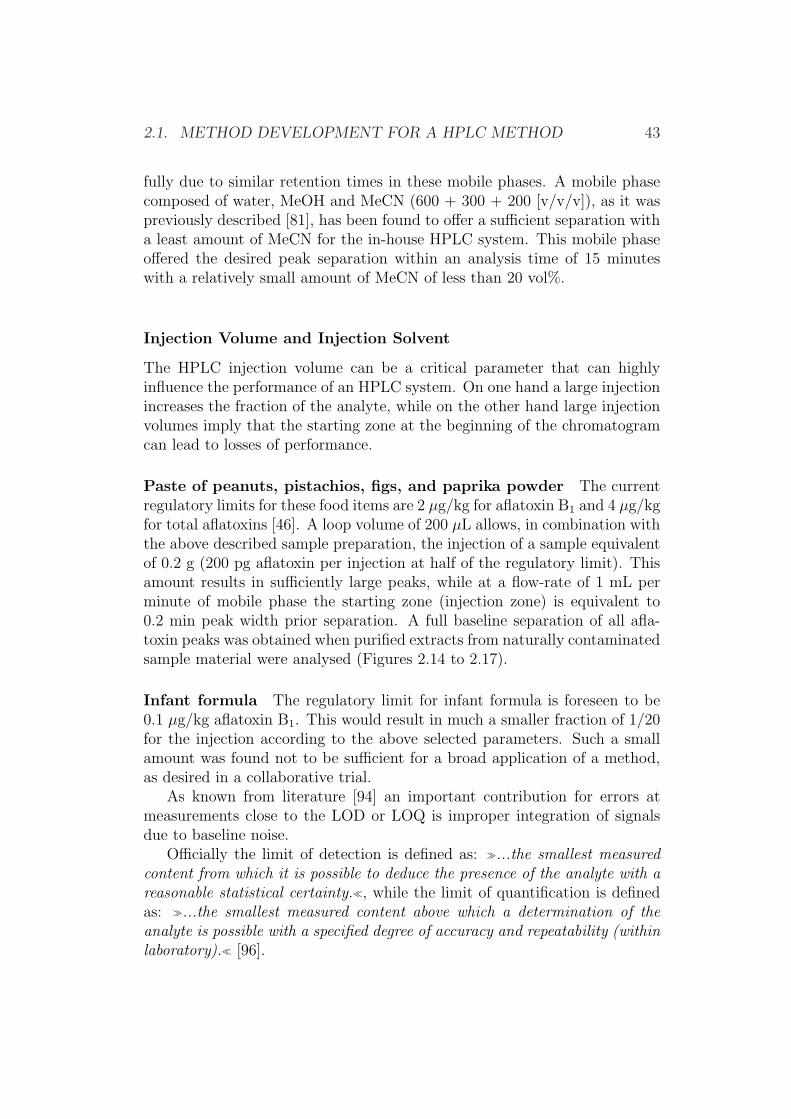
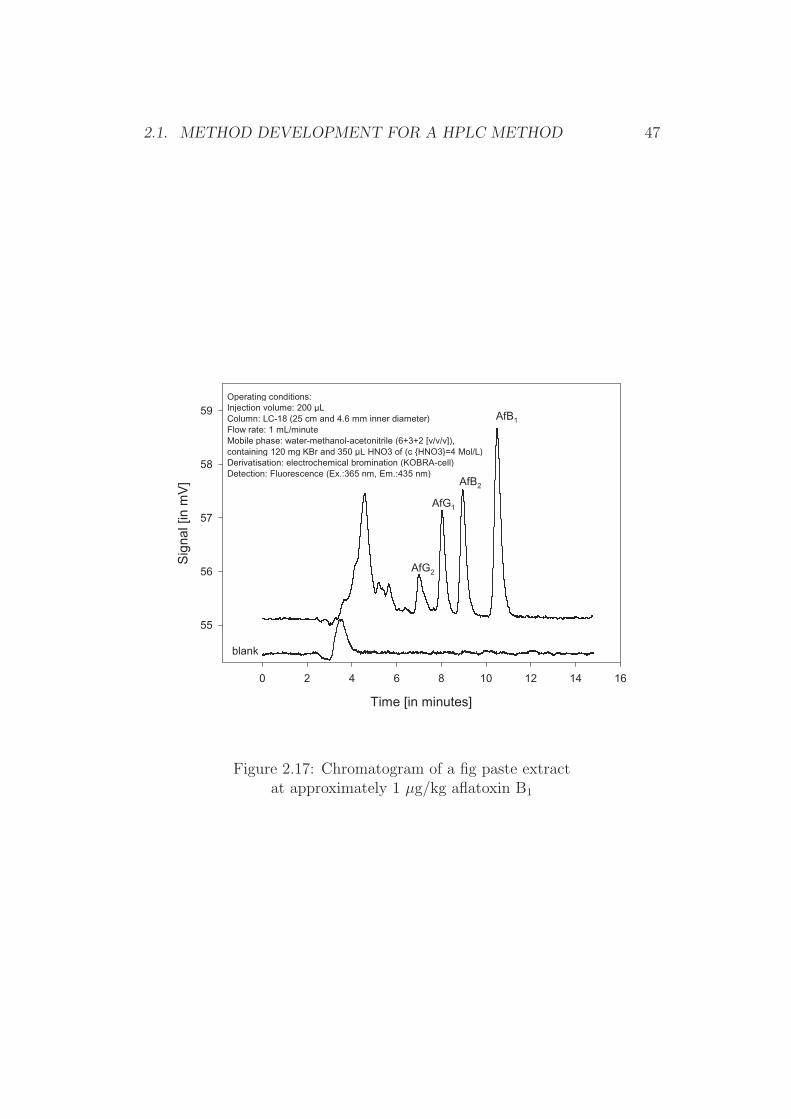
Paste of peanuts, pistachios, figs, and paprika powder The currentregulatory limits for these food items are 2 µg/kg for aflatoxin B1 and 4 µg/kgfor total aflatoxins [46]. A loop volume of 200 µL allows, in combination withthe above described sample preparation, the injection of a sample equivalentof 0.2 g (200 pg aflatoxin per injection at half of the regulatory limit). Thisamount results in sufficiently large peaks, while at a flow-rate of 1 mL perminute of mobile phase the starting zone (injection zone) is equivalent to0.2 min peak width prior separation. A full baseline separation of all afla-toxin peaks was obtained when purified extracts from naturally contaminatedsample material were analysed (Figures 2.14 to 2.17).
Infant formula The regulatory limit for infant formula is foreseen to be0.1 µg/kg aflatoxin B1. This would result in much a smaller fraction of 1/20for the injection according to the above selected parameters. Such a smallamount was found not to be sufficient for a broad application of a method,as desired in a collaborative trial.
As known from literature [94] an important contribution for errors atmeasurements close to the LOD or LOQ is improper integration of signalsdue to baseline noise.
Officially the limit of detection is defined as: À...the smallest measuredcontent from which it is possible to deduce the presence of the analyte with areasonable statistical certainty.¿, while the limit of quantification is definedas: À...the smallest measured content above which a determination of theanalyte is possible with a specified degree of accuracy and repeatability (withinlaboratory).¿ [96].
44 CHAPTER 2. RESULTS AND DISCUSSION
Time [in minutes]
0 2 4 6 8 10 12 14 16
Sig
nal [
in m
V]
54
55
56
57
58
59
60
61
62
AfB1
AfB2AfG1
AfG2
Operating conditions:Injection volume: 200 µLColumn: LC-18 (25 cm and 4.6 mm inner diameter)Flow rate: 1 mL/minuteMobile phase: water-methanol-acetonitrile (6+3+2 [v/v/v]),containing 120 mg KBr and 350 µL HNO3 of (c HNO3=4 Mol/L)Derivatisation: electrochemical bromination (KOBRA-cell)Detection: Fluorescence (Ex.:365 nm, Em.:435 nm)
Figure 2.14: Chromatogram of a peanut butter extractat approximately 1 µg/kg aflatoxin B1
2.1. METHOD DEVELOPMENT FOR A HPLC METHOD 45
Time [in minutes]
0 2 4 6 8 10 12 14 16
Sig
nal [
in m
V]
54
55
56
57
58
59
60
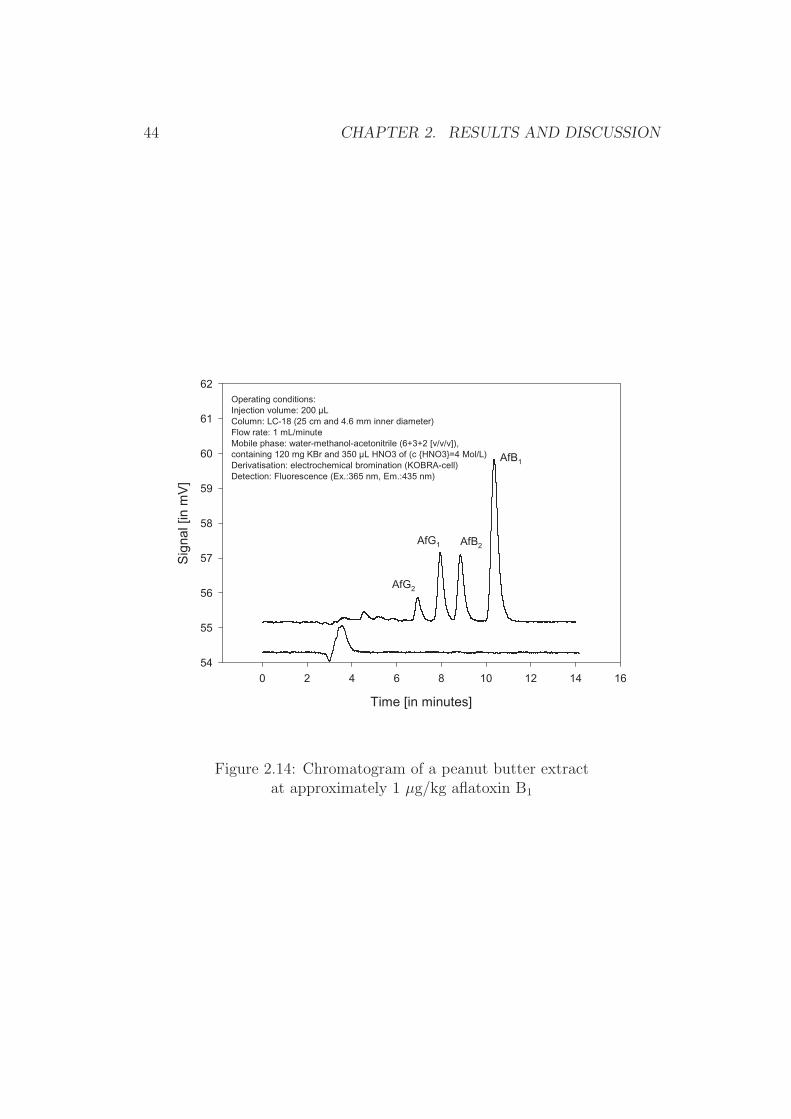
61Operating conditions:Injection volume: 200 µLColumn: LC-18 (25 cm and 4.6 mm inner diameter)Flow rate: 1 mL/minuteMobile phase: water-methanol-acetonitrile (6+3+2 [v/v/v]),containing 120 mg KBr and 350 µL HNO3 of (c HNO3=4 Mol/L)Derivatisation: electrochemical bromination (KOBRA-cell)Detection: Fluorescence (Ex.:365 nm, Em.:435 nm)
AfB1
AfB2
AfG1
blank
Figure 2.15: Chromatogram of a pistachio paste extractat approximately 1 µg/kg aflatoxin B1

46 CHAPTER 2. RESULTS AND DISCUSSION
Time [in minutes]
0 2 4 6 8 10 12 14 16
Sig
nal [
in m
V]
55
56
57
58
59
60
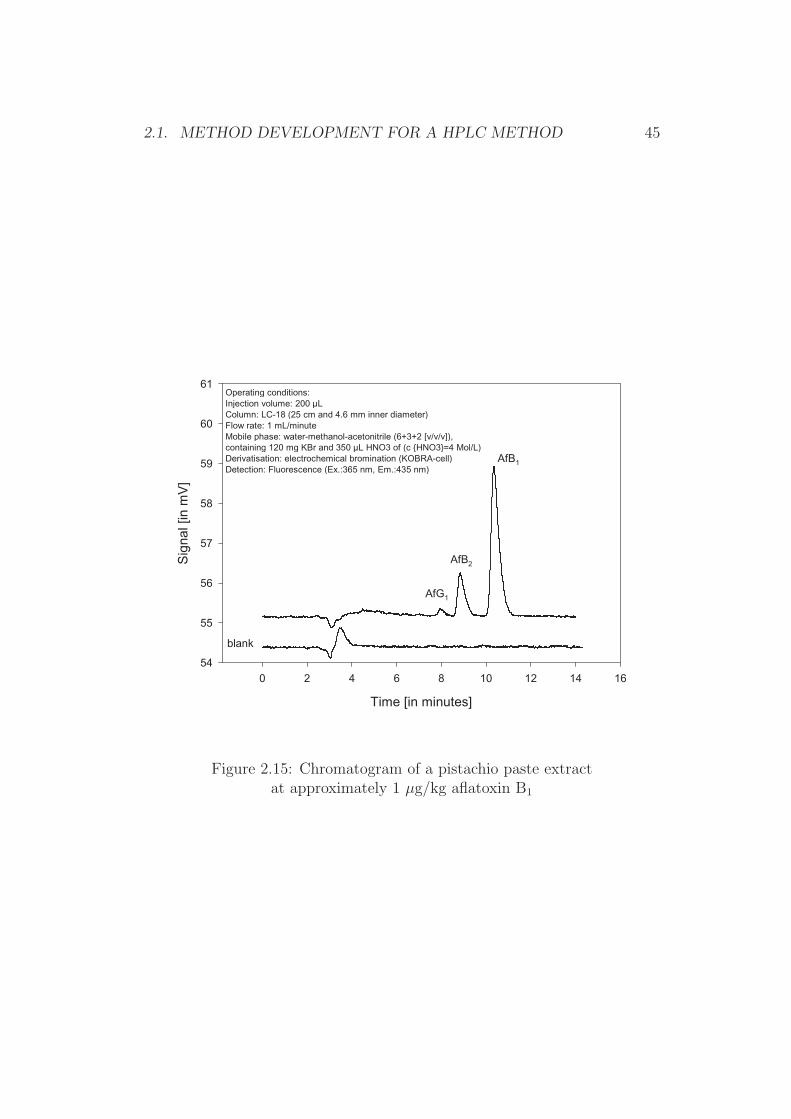
Operating conditions:Injection volume: 200 µLColumn: LC-18 (25 cm and 4.6 mm inner diameter)Flow rate: 1 mL/minuteMobile phase: water-methanol-acetonitrile (6+3+2 [v/v/v]),containing 120 mg KBr and 350 µL HNO3 of (c HNO3=4 Mol/L)Derivatisation: electrochemical bromination (KOBRA-cell)Detection: Fluorescence (Ex.:365 nm, Em.:435 nm)
AfB1
AfB2
AfG1
blank
Figure 2.16: Chromatogram of a paprika powder extractat approximately 1 µg/kg aflatoxin B1
2.1. METHOD DEVELOPMENT FOR A HPLC METHOD 47
Time [in minutes]
0 2 4 6 8 10 12 14 16
Sig
nal [
in m
V]
55
56
57
58
59Operating conditions:Injection volume: 200 µLColumn: LC-18 (25 cm and 4.6 mm inner diameter)Flow rate: 1 mL/minuteMobile phase: water-methanol-acetonitrile (6+3+2 [v/v/v]),containing 120 mg KBr and 350 µL HNO3 of (c HNO3=4 Mol/L)Derivatisation: electrochemical bromination (KOBRA-cell)Detection: Fluorescence (Ex.:365 nm, Em.:435 nm)
AfB1
AfB2
AfG1
AfG2
blank
Figure 2.17: Chromatogram of a fig paste extractat approximately 1 µg/kg aflatoxin B1

48 CHAPTER 2. RESULTS AND DISCUSSION
Therefore, an experiment was carried out to find out the performancecharacteristics of the chromatographic and the detection system. Thereforemultiple injections of several aflatoxin B1 solutions were made close to theassumed LOQ. The RSD of these signals for each level was then plottedagainst the corresponding amount. As can be seen in Figure 2.18 the amountthat was needed for sufficiently precise measurements is about 20 pg aflatoxinper injection. However to obtain a certain margin of safety, an amount ofapproximately two to three times the measured value was targeted.
A simple strategy to assure the detection of sufficiently large amounts ofaflatoxin was the injection of larger volumes then 200 µL, as was previouslydone. Such a procedure will allow to increase the amount of aflatoxin B1 forthe injection, without work intensive procedures such as evaporation, whichis known to be an additional source of errors [97] and also more difficult toautomate.
In a calculation model the amount of AfB1 that can be injected by simplyincreasing the injection volume to 1000 µL was determined:
Amount of aflatoxin B1 injected [in pg]
0 10 20 30 40
Rel
ativ
e S
tand
ard
Dev
iatio
n [in
%]
0
10
20
30
40
Signal area
Signal height
Figure 2.18: Signal precision and aflatoxin B1 amountfor the in-house HPLC-fluorimeter (detector) system

2.1. METHOD DEVELOPMENT FOR A HPLC METHOD 49
AfB1 =weight [g] * aliquot for IAC [mL] * inj. vol. [mL] * contamin.[µg/kg]
extractant [mL] * elution after IAC [mL]
AfB1 =50g ∗ 10mL ∗ 1mL ∗ 0.1µg/kg
200mL ∗ 5mL
AfB1 = 0.05ng = 50 pg
As can be seen, an absolute amount of 50 pg of aflatoxin B1 can be injectedthis way. However when large volumes are injected into a HPLC system, theperformance of the separation is likely to suffer due to peak broadening. Acommon procedure to overcome this is the injection of the analyte in a solventsufficiently lower in elution power than the mobile phase. Thus the aflatoxinB1 and other substances will concentrate during injection in the first layersof the HPLC column, which results in a better HPLC separation thereafter.
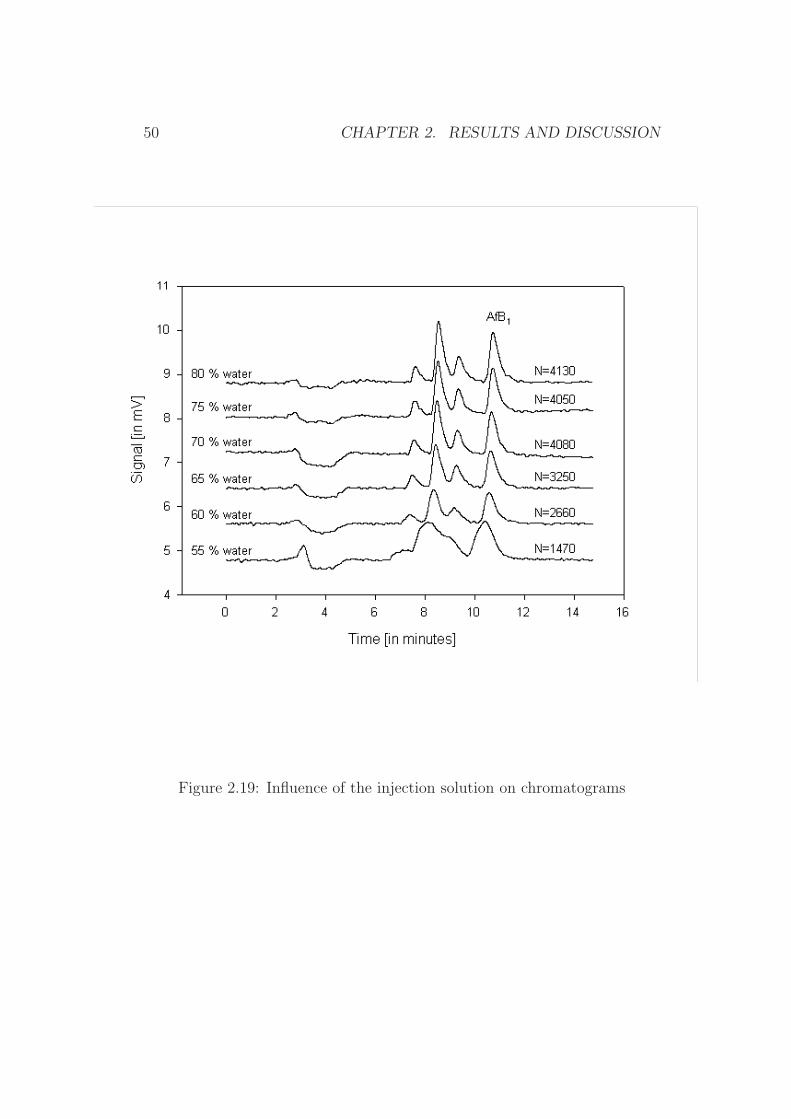
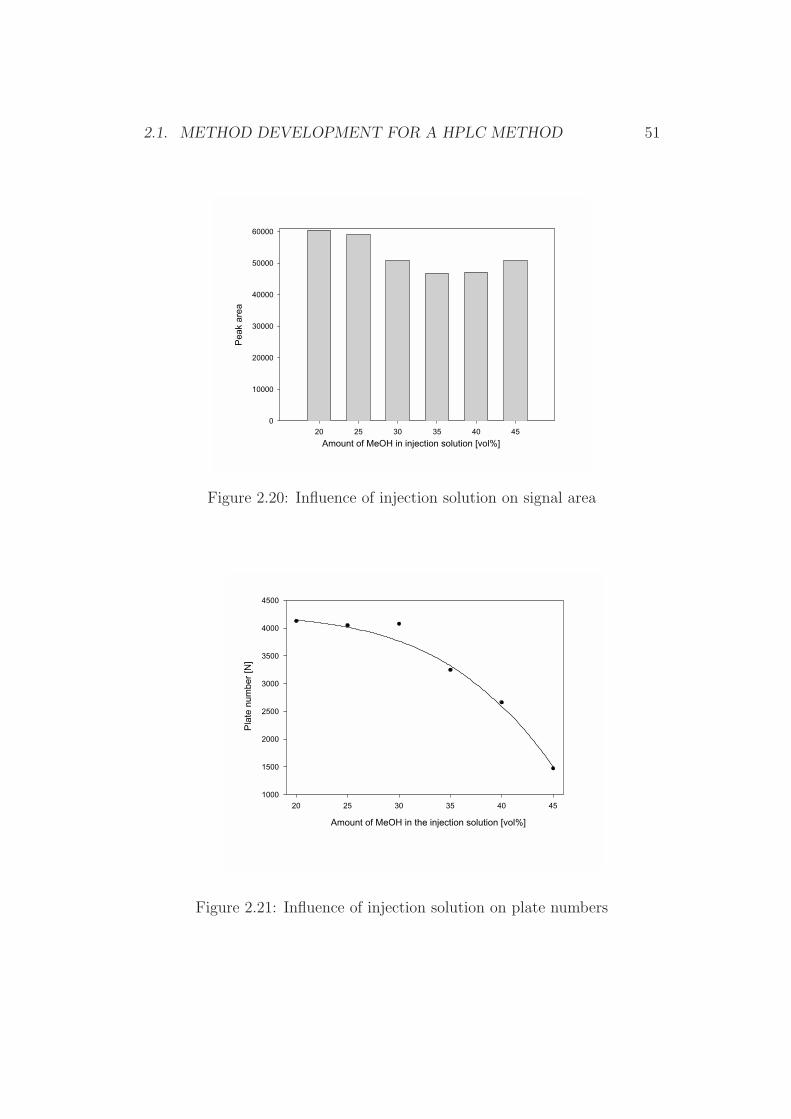
It was reported that the composition of the injection solvent and of themobile phase were identified to be crucial in terms of separation efficiency[98]. This holds especially true for large injection volumes [99]. Thereforethe interaction of the mobile phase and the injection solvent was evaluated interms of plate numbers (N) and baseline separation of aflatoxin B1 with othersubstances. It could be demonstrated that the desired volume of 1000 µLcan be injected without any significant loss of performance, provided thatthe compositions of the mobile phase and the injection solvent were chosencarefully. Figure 2.19 shows the resulting chromatograms for different water-MeOH solvents, while Figures 2.20 and 2.21 reflect the relationship of thesignal yield and the platenumber for the corresponding chromatograms.
It was concluded that a water content of 65 vol% of water or even higher(1.75 mL MeOH form the elution of the aflatoxin + 3.25 mL water) in theinjection solution was sufficient to allow a sufficient separation.
Derivatization and Detection
Aflatoxins are highly fluorescent compounds, while the flourescence proper-ties of the single aflatoxins differ in several aspects. Besides the the slightlydifferent emission maxima of each aflatoxin one of the most important char-acteristics is the solvent depending fluorescence quenching of some aflatoxins.AfB1 and AfB2 are known to undergo quenching of fluorescence in chlorinatedsolutions, while AfB1 and AfG1 undergo quenching when present in aqueous
50 CHAPTER 2. RESULTS AND DISCUSSION
Figure 2.19: Influence of the injection solution on chromatograms
2.1. METHOD DEVELOPMENT FOR A HPLC METHOD 51
Figure 2.20: Influence of injection solution on signal area
Figure 2.21: Influence of injection solution on plate numbers
Amount of MeOH in injection solution [vol%]20 25 30 35 40 45
Pea
k ar
ea
0
10000
20000
30000
40000
50000
60000
Amount of MeOH in the injection solution [vol%]
20 25 30 35 40 45
Pla
te n
umbe
r [N
]
1000
1500
2000
2500
3000
3500
4000
4500

52 CHAPTER 2. RESULTS AND DISCUSSION
Time [in minutes]
-2 0 2 4 6 8 10 12 14 16
Sig
nal [
in m
V]
4.2
4.4
4.6
4.8
5.0
5.2
5.4
5.6
5.8
6.0
6.2
6.4
6.6
6.8
7.0
AfB1
Operating conditions:Injection volume: 1000 µLColumn: LC-18 (25 cm and 4.6 mm inner diameter)Flow rate: 1 mL/minuteMobile phase: water-methanol-acetonitrile (6+3+2 [v/v/v]),containing 120 mg KBr and 350 µL HNO3 of (c HNO3=4 Mol/L)Derivatisation: electrochemical bromination (KOBRA-cell)Detection: Fluorescence (Ex.:365 nm, Em.:435 nm)
blank
Figure 2.22: Chromatogram of infant formulaat a contamination level of approximately 0.1 µg/kg aflatoxin AfB1
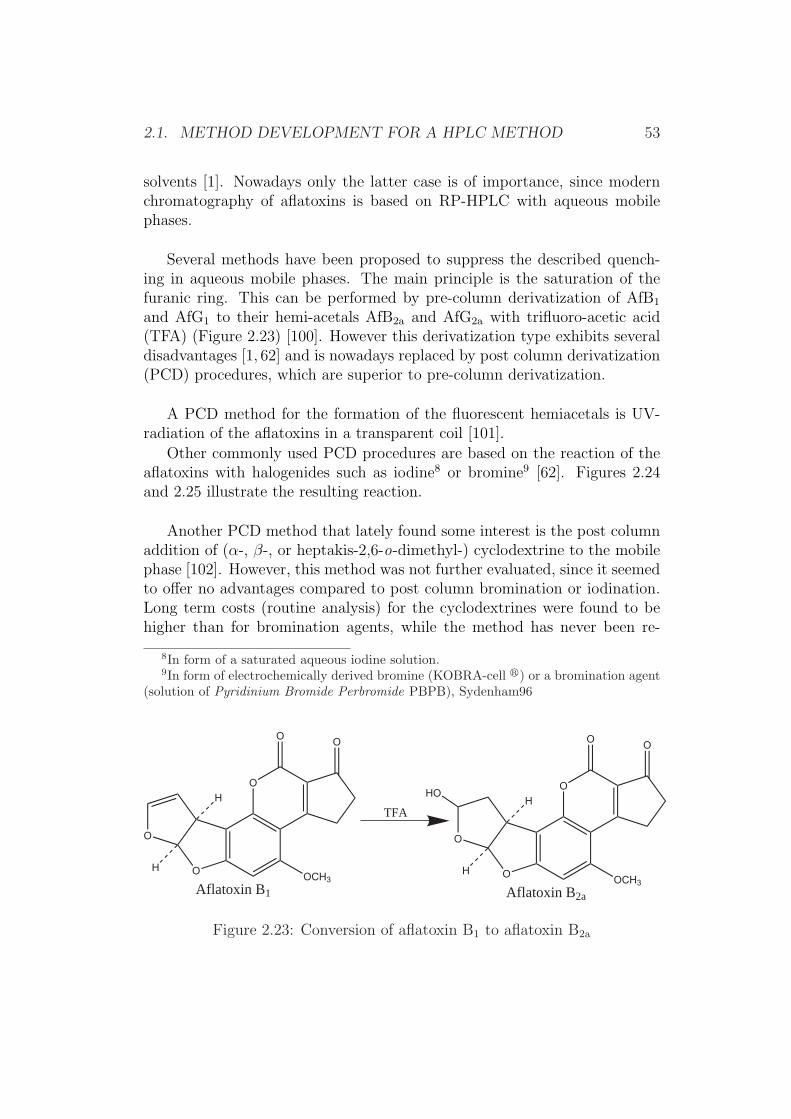
2.1. METHOD DEVELOPMENT FOR A HPLC METHOD 53
solvents [1]. Nowadays only the latter case is of importance, since modernchromatography of aflatoxins is based on RP-HPLC with aqueous mobilephases.
Several methods have been proposed to suppress the described quench-ing in aqueous mobile phases. The main principle is the saturation of thefuranic ring. This can be performed by pre-column derivatization of AfB1
and AfG1 to their hemi-acetals AfB2a and AfG2a with trifluoro-acetic acid(TFA) (Figure 2.23) [100]. However this derivatization type exhibits severaldisadvantages [1, 62] and is nowadays replaced by post column derivatization(PCD) procedures, which are superior to pre-column derivatization.
A PCD method for the formation of the fluorescent hemiacetals is UV-radiation of the aflatoxins in a transparent coil [101].
Other commonly used PCD procedures are based on the reaction of theaflatoxins with halogenides such as iodine8 or bromine9 [62]. Figures 2.24and 2.25 illustrate the resulting reaction.
Another PCD method that lately found some interest is the post columnaddition of (α-, β-, or heptakis-2,6-o-dimethyl-) cyclodextrine to the mobilephase [102]. However, this method was not further evaluated, since it seemedto offer no advantages compared to post column bromination or iodination.Long term costs (routine analysis) for the cyclodextrines were found to behigher than for bromination agents, while the method has never been re-
8In form of a saturated aqueous iodine solution.9In form of electrochemically derived bromine (KOBRA-cell r) or a bromination agent
(solution of Pyridinium Bromide Perbromide PBPB), Sydenham96
O
O
O
OCH3
OO
H
H
Aflatoxin B1
O
O
O
OCH3
OO
H
H
Aflatoxin B2a
HO
TFA
Figure 2.23: Conversion of aflatoxin B1 to aflatoxin B2a
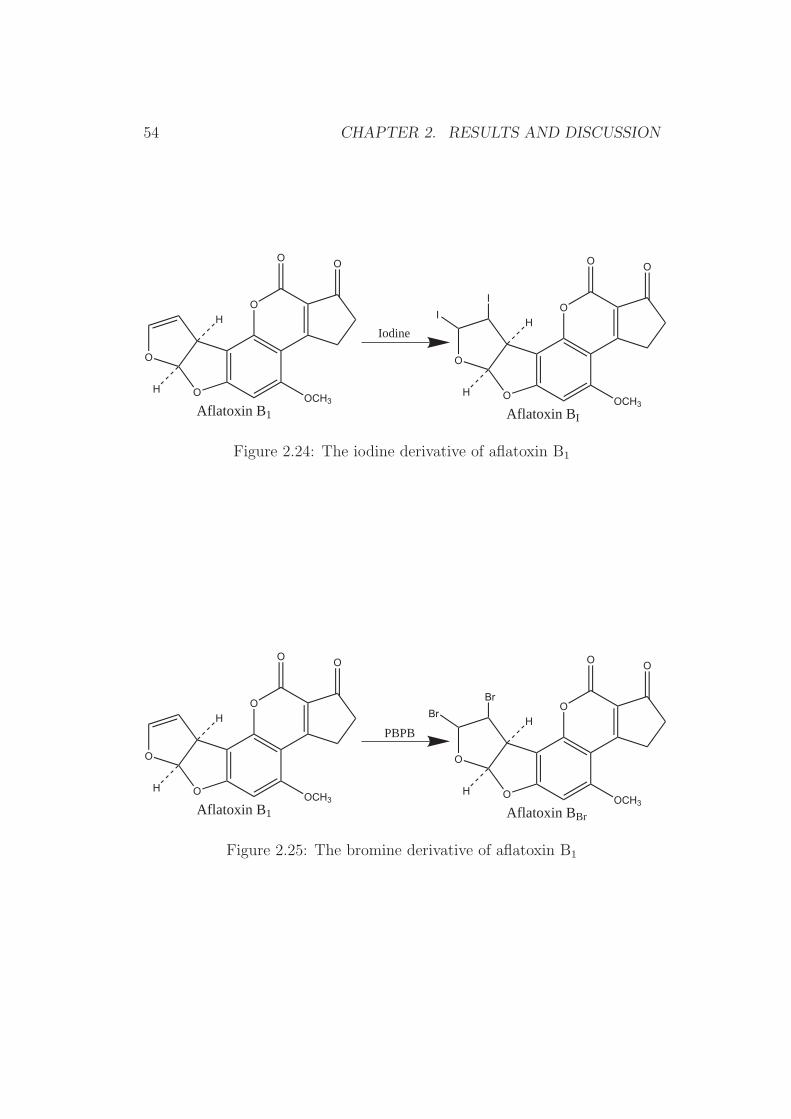
54 CHAPTER 2. RESULTS AND DISCUSSION
O
O
O
OCH3
OO
H
H
Aflatoxin B1
O
O
O
OCH3
OO
H
H
Aflatoxin BI
I
I
Iodine
Figure 2.24: The iodine derivative of aflatoxin B1
O
O
O
OCH3
OO
H
H
Aflatoxin B1
O
O
O
OCH3
OO
H
H
Aflatoxin BBr
Br
PBPB
Br
Figure 2.25: The bromine derivative of aflatoxin B1

2.1. METHOD DEVELOPMENT FOR A HPLC METHOD 55
ported to be used for routine analysis.
From the methods discussed only bromination, iodination, and UV-lightwere considered as possible candidates, since they have been applied forroutine work. However, bromination can be achieved by two different ap-proaches. One method is the addition of a bromination agent (PyridiniumBromide Perbromide PBPB) to the mobile phase, while the second method isthe production of electrochemically generated bromine. This is achieved byaddition of Potassium bromide to the mobile phase, which releases brominein a special generator cell. A schematic draw of the KOBRA-cell r is givenin Figure 2.25.
The conditions and requirements of the two bromination and the iodina-tion PCD are listed in Table 2.10. As can be seen, post column brominationis superior in terms of the equipment required and in reaction time, whileiodination requires harsher reaction conditions (temperature and time).
Figure 2.26: Schematic layout of the KOBRA-cell r
HPLC Column
Reaction Coil
Detector
Solvent Flow
Black
Red
Membrane
Spacer
SpacerSteel electrode
Platinum electrode
Waste
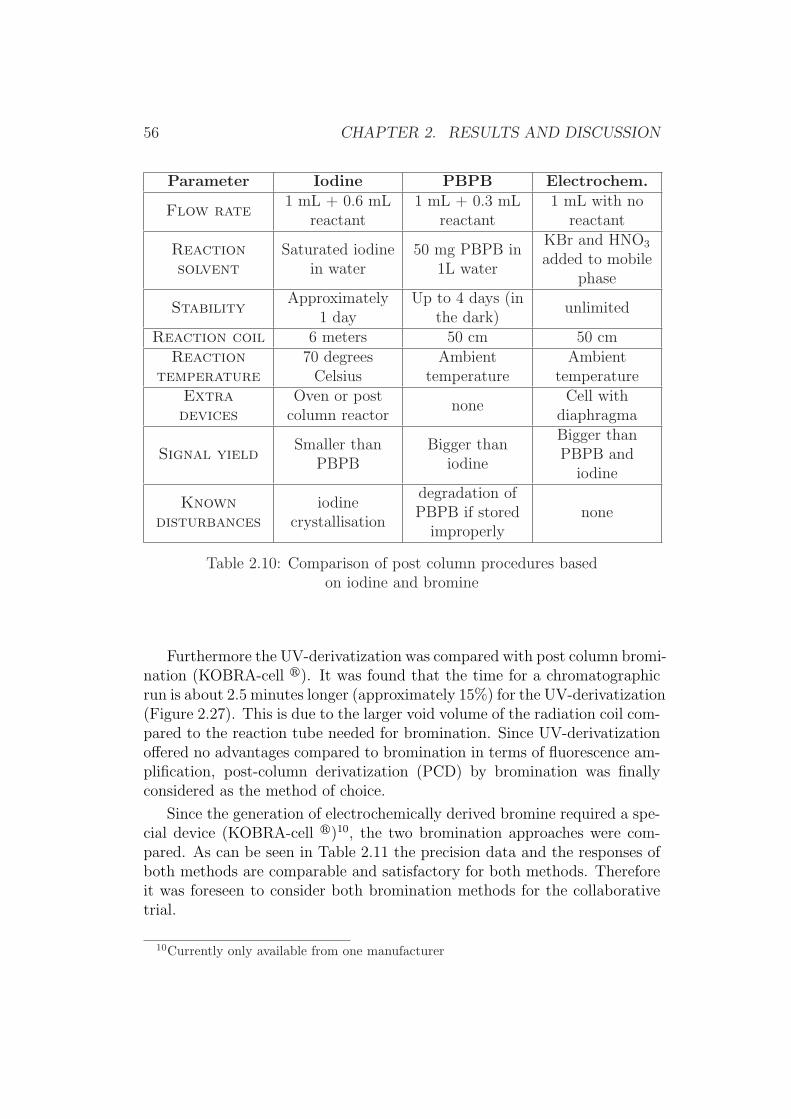
56 CHAPTER 2. RESULTS AND DISCUSSION
Parameter Iodine PBPB Electrochem.
Flow rate1 mL + 0.6 mL
reactant1 mL + 0.3 mL
reactant1 mL with no
reactant
Reactionsolvent
Saturated iodinein water
50 mg PBPB in1L water
KBr and HNO3
added to mobilephase
StabilityApproximately
1 dayUp to 4 days (in
the dark)unlimited
Reaction coil 6 meters 50 cm 50 cmReaction
temperature70 degrees
CelsiusAmbient
temperatureAmbient
temperatureExtradevices
Oven or postcolumn reactor
noneCell with
diaphragma
Signal yieldSmaller than
PBPBBigger than
iodine
Bigger thanPBPB and
iodine
Knowndisturbances
iodinecrystallisation
degradation ofPBPB if stored
improperlynone
Table 2.10: Comparison of post column procedures basedon iodine and bromine
Furthermore the UV-derivatization was compared with post column bromi-nation (KOBRA-cell r). It was found that the time for a chromatographicrun is about 2.5 minutes longer (approximately 15%) for the UV-derivatization(Figure 2.27). This is due to the larger void volume of the radiation coil com-pared to the reaction tube needed for bromination. Since UV-derivatizationoffered no advantages compared to bromination in terms of fluorescence am-plification, post-column derivatization (PCD) by bromination was finallyconsidered as the method of choice.
Since the generation of electrochemically derived bromine required a spe-cial device (KOBRA-cell r)10, the two bromination approaches were com-pared. As can be seen in Table 2.11 the precision data and the responses ofboth methods are comparable and satisfactory for both methods. Thereforeit was foreseen to consider both bromination methods for the collaborativetrial.
10Currently only available from one manufacturer
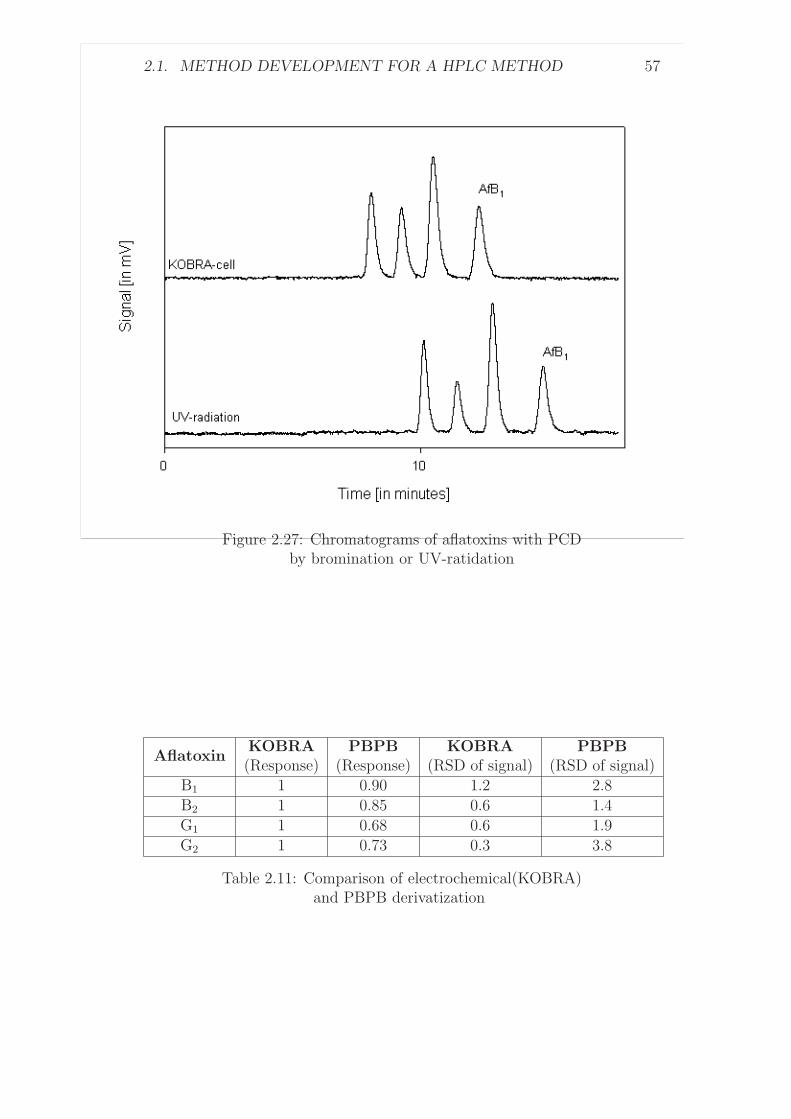
2.1. METHOD DEVELOPMENT FOR A HPLC METHOD 57
Figure 2.27: Chromatograms of aflatoxins with PCDby bromination or UV-ratidation
AflatoxinKOBRA(Response)
PBPB(Response)
KOBRA(RSD of signal)
PBPB(RSD of signal)
B1 1 0.90 1.2 2.8
B2 1 0.85 0.6 1.4
G1 1 0.68 0.6 1.9
G2 1 0.73 0.3 3.8
Table 2.11: Comparison of electrochemical(KOBRA)and PBPB derivatization
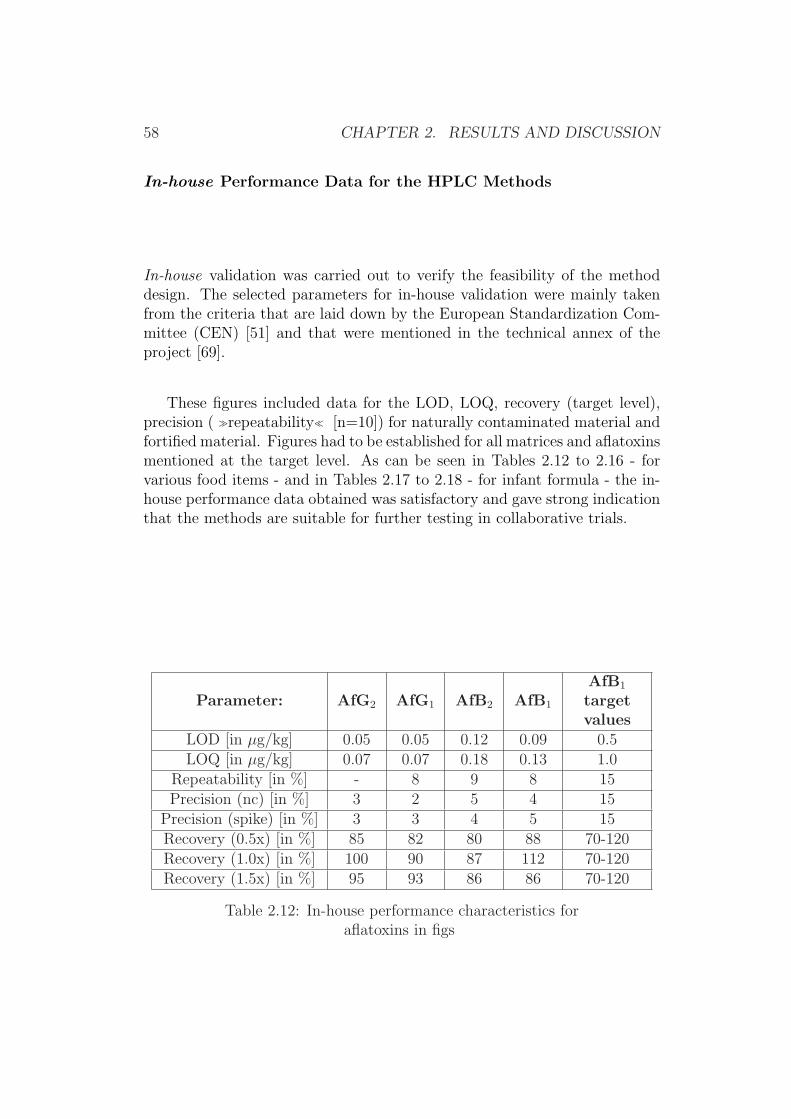
58 CHAPTER 2. RESULTS AND DISCUSSION
In-house Performance Data for the HPLC Methods
In-house validation was carried out to verify the feasibility of the methoddesign. The selected parameters for in-house validation were mainly takenfrom the criteria that are laid down by the European Standardization Com-mittee (CEN) [51] and that were mentioned in the technical annex of theproject [69].
These figures included data for the LOD, LOQ, recovery (target level),precision ( Àrepeatability¿ [n=10]) for naturally contaminated material andfortified material. Figures had to be established for all matrices and aflatoxinsmentioned at the target level. As can be seen in Tables 2.12 to 2.16 - forvarious food items - and in Tables 2.17 to 2.18 - for infant formula - the in-house performance data obtained was satisfactory and gave strong indicationthat the methods are suitable for further testing in collaborative trials.
Parameter: AfG2 AfG1 AfB2 AfB1
AfB1
targetvalues
LOD [in µg/kg] 0.05 0.05 0.12 0.09 0.5LOQ [in µg/kg] 0.07 0.07 0.18 0.13 1.0
Repeatability [in %] - 8 9 8 15Precision (nc) [in %] 3 2 5 4 15
Precision (spike) [in %] 3 3 4 5 15Recovery (0.5x) [in %] 85 82 80 88 70-120Recovery (1.0x) [in %] 100 90 87 112 70-120Recovery (1.5x) [in %] 95 93 86 86 70-120
Table 2.12: In-house performance characteristics foraflatoxins in figs
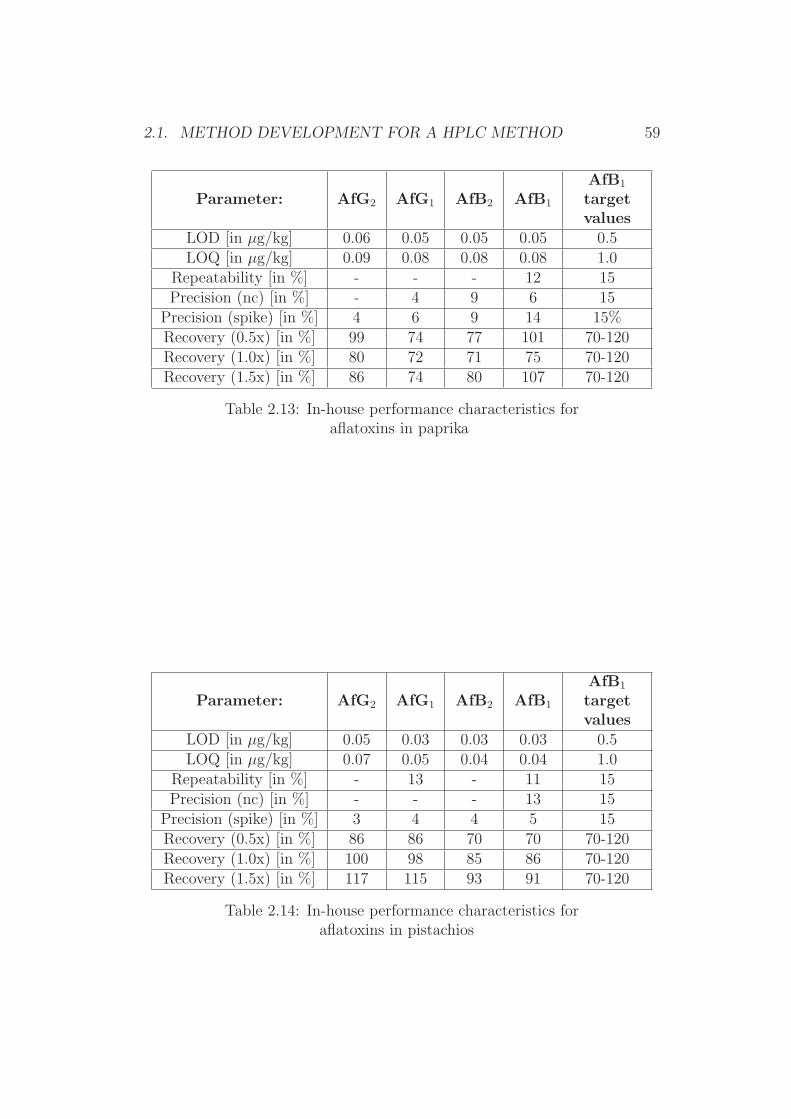
2.1. METHOD DEVELOPMENT FOR A HPLC METHOD 59
Parameter: AfG2 AfG1 AfB2 AfB1
AfB1
targetvalues
LOD [in µg/kg] 0.06 0.05 0.05 0.05 0.5LOQ [in µg/kg] 0.09 0.08 0.08 0.08 1.0
Repeatability [in %] - - - 12 15Precision (nc) [in %] - 4 9 6 15
Precision (spike) [in %] 4 6 9 14 15%Recovery (0.5x) [in %] 99 74 77 101 70-120Recovery (1.0x) [in %] 80 72 71 75 70-120Recovery (1.5x) [in %] 86 74 80 107 70-120
Table 2.13: In-house performance characteristics foraflatoxins in paprika
Parameter: AfG2 AfG1 AfB2 AfB1
AfB1
targetvalues
LOD [in µg/kg] 0.05 0.03 0.03 0.03 0.5LOQ [in µg/kg] 0.07 0.05 0.04 0.04 1.0
Repeatability [in %] - 13 - 11 15Precision (nc) [in %] - - - 13 15
Precision (spike) [in %] 3 4 4 5 15Recovery (0.5x) [in %] 86 86 70 70 70-120Recovery (1.0x) [in %] 100 98 85 86 70-120Recovery (1.5x) [in %] 117 115 93 91 70-120
Table 2.14: In-house performance characteristics foraflatoxins in pistachios
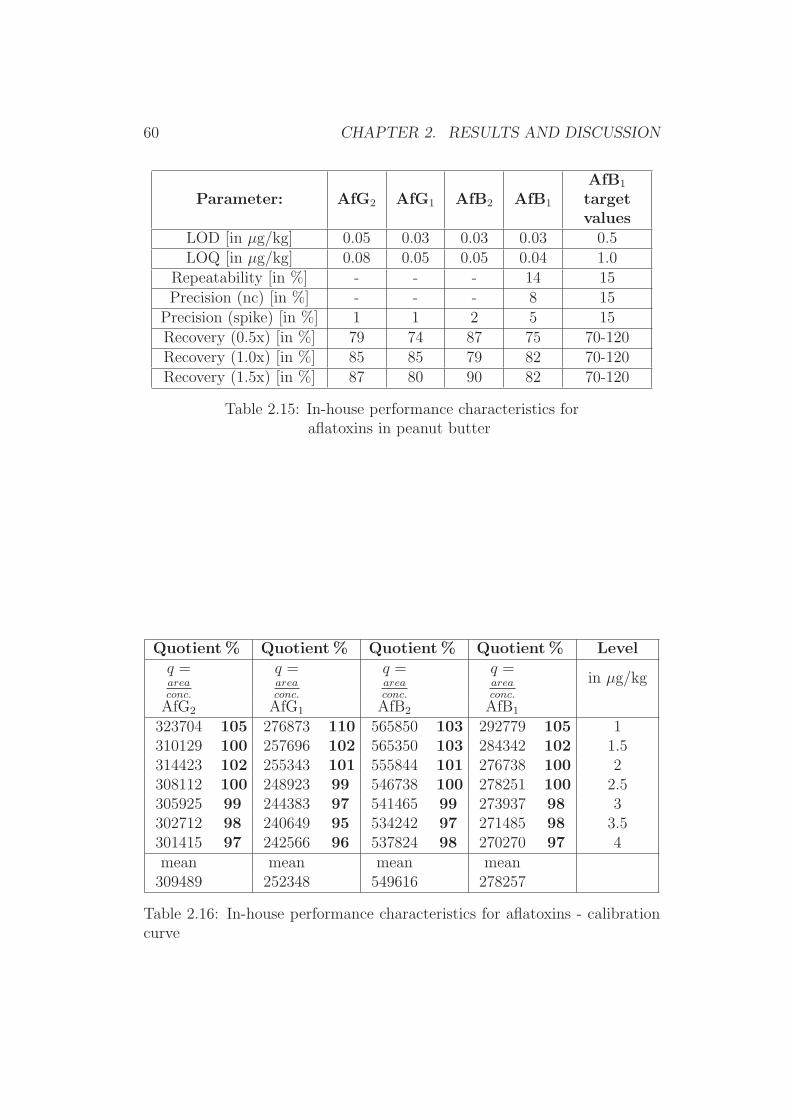
60 CHAPTER 2. RESULTS AND DISCUSSION
Parameter: AfG2 AfG1 AfB2 AfB1
AfB1
targetvalues
LOD [in µg/kg] 0.05 0.03 0.03 0.03 0.5LOQ [in µg/kg] 0.08 0.05 0.05 0.04 1.0
Repeatability [in %] - - - 14 15Precision (nc) [in %] - - - 8 15
Precision (spike) [in %] 1 1 2 5 15Recovery (0.5x) [in %] 79 74 87 75 70-120Recovery (1.0x) [in %] 85 85 79 82 70-120Recovery (1.5x) [in %] 87 80 90 82 70-120
Table 2.15: In-house performance characteristics foraflatoxins in peanut butter
Quotient % Quotient % Quotient % Quotient % Levelq =areaconc.
q =areaconc.
q =areaconc.
q =areaconc.
in µg/kg
AfG2 AfG1 AfB2 AfB1
323704 105 276873 110 565850 103 292779 105 1310129 100 257696 102 565350 103 284342 102 1.5314423 102 255343 101 555844 101 276738 100 2308112 100 248923 99 546738 100 278251 100 2.5305925 99 244383 97 541465 99 273937 98 3302712 98 240649 95 534242 97 271485 98 3.5301415 97 242566 96 537824 98 270270 97 4mean mean mean mean
309489 252348 549616 278257
Table 2.16: In-house performance characteristics for aflatoxins - calibrationcurve
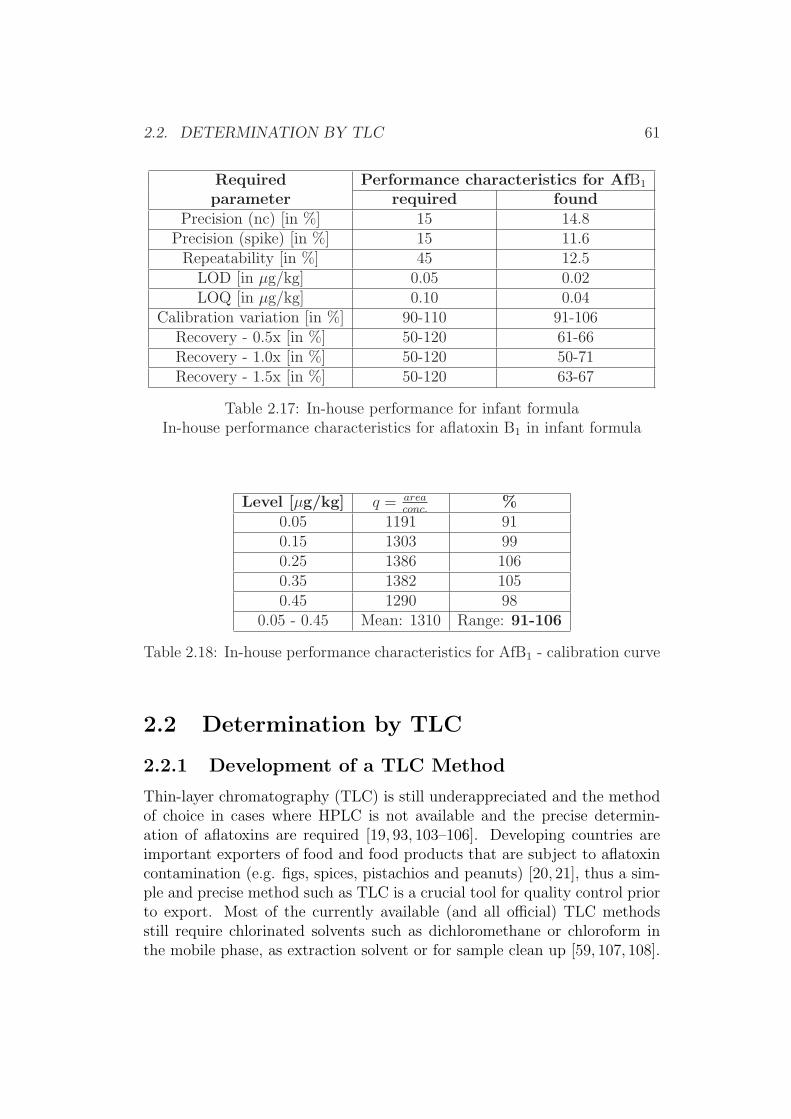
2.2. DETERMINATION BY TLC 61
Requiredparameter
Performance characteristics for AfB1
required foundPrecision (nc) [in %] 15 14.8
Precision (spike) [in %] 15 11.6Repeatability [in %] 45 12.5
LOD [in µg/kg] 0.05 0.02LOQ [in µg/kg] 0.10 0.04
Calibration variation [in %] 90-110 91-106Recovery - 0.5x [in %] 50-120 61-66Recovery - 1.0x [in %] 50-120 50-71Recovery - 1.5x [in %] 50-120 63-67
Table 2.17: In-house performance for infant formulaIn-house performance characteristics for aflatoxin B1 in infant formula
Level [µg/kg] q = areaconc.
%0.05 1191 910.15 1303 990.25 1386 1060.35 1382 1050.45 1290 98
0.05 - 0.45 Mean: 1310 Range: 91-106
Table 2.18: In-house performance characteristics for AfB1 - calibration curve
2.2 Determination by TLC
2.2.1 Development of a TLC Method
Thin-layer chromatography (TLC) is still underappreciated and the methodof choice in cases where HPLC is not available and the precise determin-ation of aflatoxins are required [19, 93, 103–106]. Developing countries areimportant exporters of food and food products that are subject to aflatoxincontamination (e.g. figs, spices, pistachios and peanuts) [20, 21], thus a sim-ple and precise method such as TLC is a crucial tool for quality control priorto export. Most of the currently available (and all official) TLC methodsstill require chlorinated solvents such as dichloromethane or chloroform inthe mobile phase, as extraction solvent or for sample clean up [59, 107, 108].

62 CHAPTER 2. RESULTS AND DISCUSSION
However chlorinated solvents are considered to be ecological hazards [109];they are constantly being banned in laboratory routine work where possible.
Thus, a state-of-the-art TLC method, which is user friendly, easy to per-form and renounces the use of chlorinated or other toxic solvents would behighly desirable for analysts who rely on TLC.
One approach considered the implementation of immunoaffinity columns,which are nowadays easily available in all parts of the world at a fair price.Therefore the implementation of the immunoaffinity clean-up step that hasbeen applied for the above described HPLC method [83] was slightly modifiedfor later TLC separation.
The combination of IAC and TLC has so far only been considered for thedetermination of aflatoxins at contamination levels of 10 µg/kg - 50 µg/kg[110] or more recently for the quantification of aflatoxin M1 in milk11, whilethe application for the variety of food items and contamination level describedhere has not been applied yet.
Sample Extraction
As described in Chapter 2.1.3, it is possible to quantify aflatoxin amountsof a few pg (absolute) by HPLC, however the fluorimetric determinationof aflatoxins on TLC-plates requires significantly larger amounts for precisequantification.
As shown in chapter 2.1.2 aqueous MeOH is the only extractant that al-lows the application of larger fractions of sample extract on the IAC. There-fore the extraction procedure was not subject to modification for the TLCemployed here.
Sample Preparation
Removal of interfering matrix traces Paprika powder samples whichwere analysed by TLC and purified with the described IA clean-up procedurefor HPLC (Chapter 2.1.2) resulted in interferences on the TLC plate. It wasfound that a rapid and simple IA clean-up procedure, as used for HPLC, wasnot applicable for TLC determination. In addition, it was found that theevaporated IAC eluates from pistachios, peanuts and corn caused problemsduring re-dissolving and in spot symmetry after TLC development.
The reason for these interferences, which did not occur in HPLC, weredue to the different separation mechanism of both systems (normal-phaseTLC and reversed-phase HPLC).
11Personal communication with Sylviane Dragacci, AFSSA, France
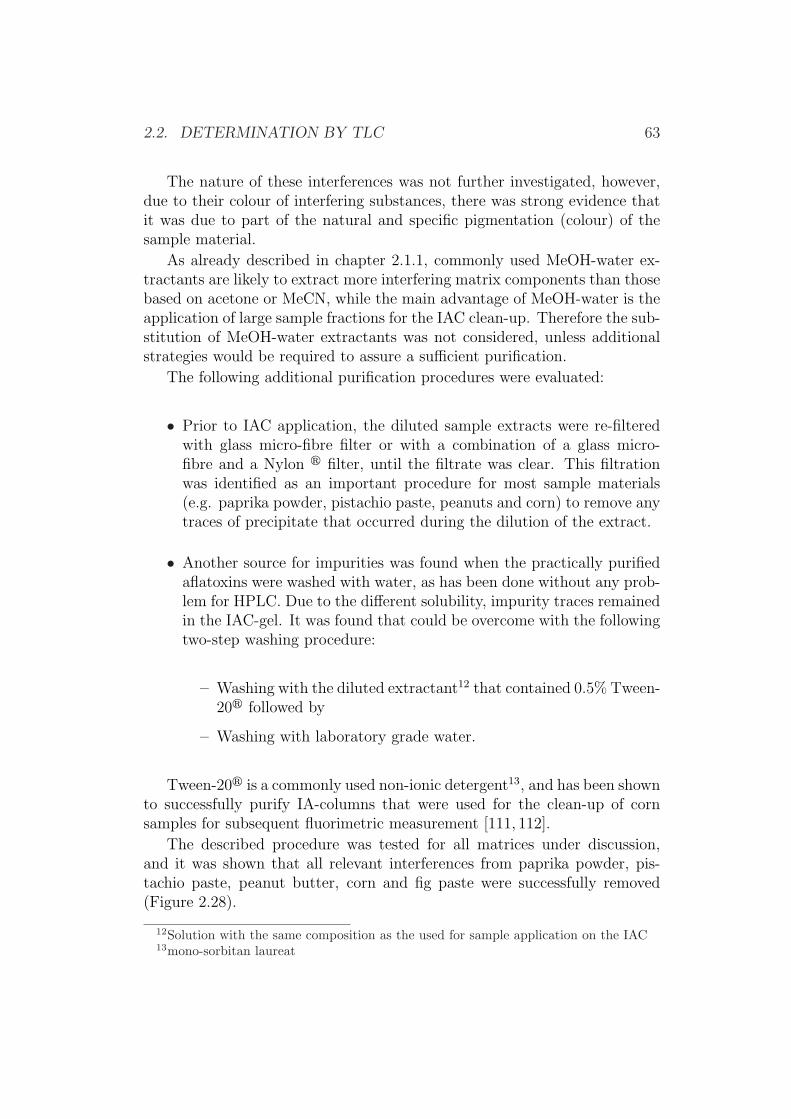
2.2. DETERMINATION BY TLC 63
The nature of these interferences was not further investigated, however,due to their colour of interfering substances, there was strong evidence thatit was due to part of the natural and specific pigmentation (colour) of thesample material.
As already described in chapter 2.1.1, commonly used MeOH-water ex-tractants are likely to extract more interfering matrix components than thosebased on acetone or MeCN, while the main advantage of MeOH-water is theapplication of large sample fractions for the IAC clean-up. Therefore the sub-stitution of MeOH-water extractants was not considered, unless additionalstrategies would be required to assure a sufficient purification.
The following additional purification procedures were evaluated:
• Prior to IAC application, the diluted sample extracts were re-filteredwith glass micro-fibre filter or with a combination of a glass micro-fibre and a Nylon r filter, until the filtrate was clear. This filtrationwas identified as an important procedure for most sample materials(e.g. paprika powder, pistachio paste, peanuts and corn) to remove anytraces of precipitate that occurred during the dilution of the extract.
• Another source for impurities was found when the practically purifiedaflatoxins were washed with water, as has been done without any prob-lem for HPLC. Due to the different solubility, impurity traces remainedin the IAC-gel. It was found that could be overcome with the followingtwo-step washing procedure:
– Washing with the diluted extractant12 that contained 0.5% Tween-20r followed by
– Washing with laboratory grade water.
Tween-20r is a commonly used non-ionic detergent13, and has been shownto successfully purify IA-columns that were used for the clean-up of cornsamples for subsequent fluorimetric measurement [111, 112].
The described procedure was tested for all matrices under discussion,and it was shown that all relevant interferences from paprika powder, pis-tachio paste, peanut butter, corn and fig paste were successfully removed(Figure 2.28).
12Solution with the same composition as the used for sample application on the IAC13mono-sorbitan laureat
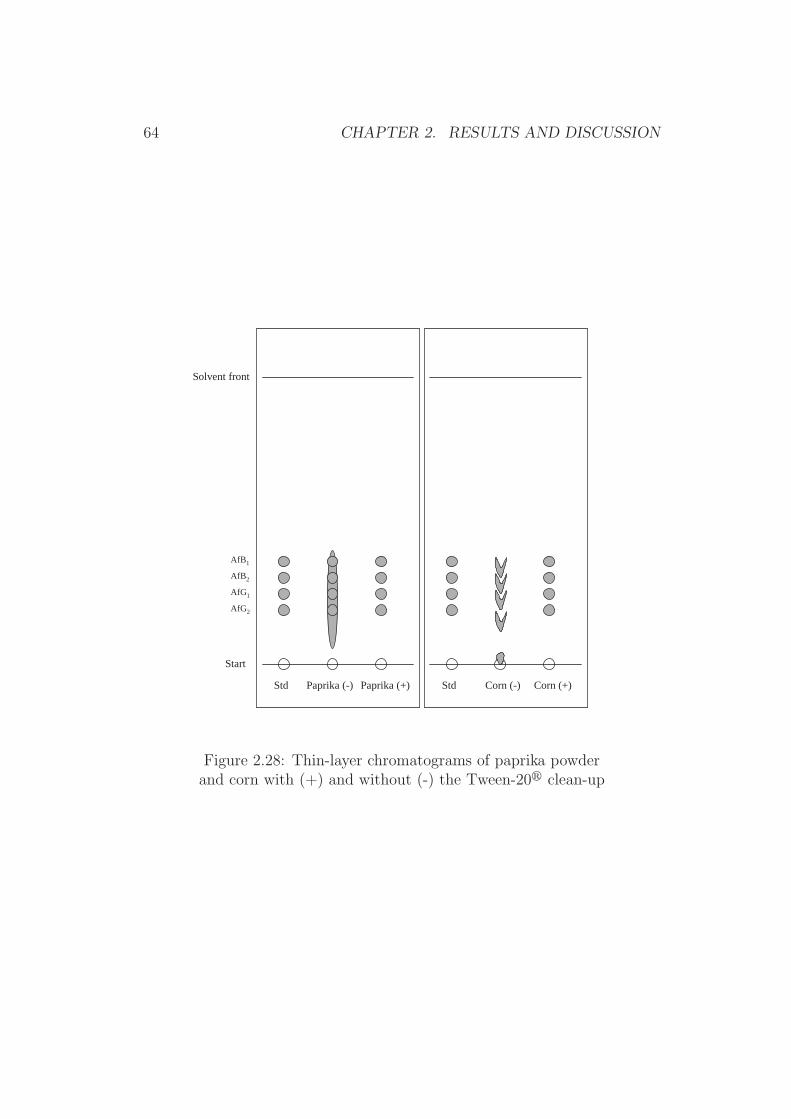
64 CHAPTER 2. RESULTS AND DISCUSSION
AfB1
AfG1
AfB2
AfG2
Paprika (-) Corn (-)Paprika (+) Std Corn (+)Std
Start
Solvent front
Figure 2.28: Thin-layer chromatograms of paprika powderand corn with (+) and without (-) the Tween-20r clean-up
2.2. DETERMINATION BY TLC 65
Elaboration of a suitable spotting solvent It has been observed thatMeOH is inappropriate for spotting of aflatoxins on silicagel TLC-plates. Dueto its high elution strength, the aflatoxins would concentrate on the outerrim of the solvent front, which leads to unsuitable spots (Figure 2.30). Thus,an additional evaporation step was required for TLC separation. This allowsto further concentrate the purified aflatoxins, while transferring them to asuitable solvent.
Loss of aflatoxins during evaporation Several factors that can leadto aflatoxin degradation during chemical analysis have already been identifiedin the past [64, 113, 114].
It was found that the pattern of aflatoxin losses can give information onthe general principle of the observed loss. A degradation due to an alkalineenvironment will result mainly in a loss of AfG1 and AfG2, while UV-lightinduced degradation has shown to result in lower values for AfB1 and AfG1
mainly [64]. The reason for the latter case is the formation of hemiacetals(similar to the derivatization by TFA) as described in chapter 2.1.3, whichonly AfB1 and AfG1 can form. Alkaline degradation is due to the cleavage ofthe lactone, to which AfG1 and AfG2 are more susceptible, since they containtwo lactone systems (Figure 2.29).
Even though only acid washed glassware was used for all procedures14,it was found that recoveries from fortified samples yielded in unacceptablefigures of 50% to 55% for aflatoxins AfG1 and AfG2, while recoveries foraflatoxins AfB1 and AfB2 were in an acceptable range of 80% to 85%.
On one hand recoveries and peak pattern obtained from evaporated methanolstandard solutions revealed that no loss of aflatoxins occurred during theevaporation of aflatoxin standards in neat methanol. On the other hand,most of the other procedures that have been adopted from an HPLC method[83] have shown to be robust.
Therefore the degradation was thought to be due to other causes linked toevaporation, such as water or PBS residues in the IAC eluate (which are notpresent in neat MeOH standard solutions), or even traces of the Tween-20or other unknown washed-off materials from the IAC.
For further investigation, aflatoxins in methanol were evaporated afteraddition of aqueous solutions that contained PBS and/or Tween-20r.
These experiments revealed that in most evaporated solutions an aflatoxinloss occurred, while the loss in neat MeOH was only marginal. However this
14All glassware that was used in this study was sufficiently acid washed with 10% sul-phuric acid over night to remove any traces of alkaline substances and subsequently thor-oughly washed with water.
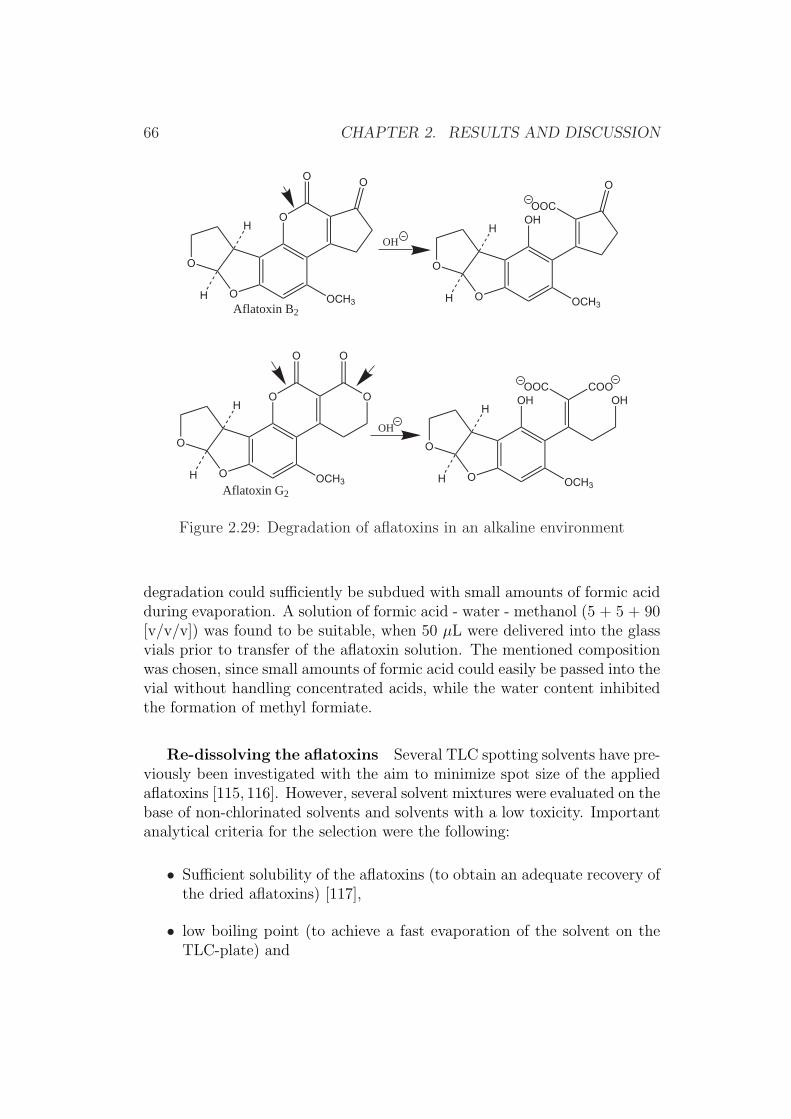
66 CHAPTER 2. RESULTS AND DISCUSSION
O
O
O
O O
OCH3
H
HAflatoxin B2
O
O
O
O
OCH3
H
H
O
O
Aflatoxin G2
OOCOH
O
O
O
OCH3
H
H
OOCOH
O
O
OCH3
H
H
OHCOO
OH
OH
Figure 2.29: Degradation of aflatoxins in an alkaline environment
degradation could sufficiently be subdued with small amounts of formic acidduring evaporation. A solution of formic acid - water - methanol (5 + 5 + 90[v/v/v]) was found to be suitable, when 50 µL were delivered into the glassvials prior to transfer of the aflatoxin solution. The mentioned compositionwas chosen, since small amounts of formic acid could easily be passed into thevial without handling concentrated acids, while the water content inhibitedthe formation of methyl formiate.
Re-dissolving the aflatoxins Several TLC spotting solvents have pre-viously been investigated with the aim to minimize spot size of the appliedaflatoxins [115, 116]. However, several solvent mixtures were evaluated on thebase of non-chlorinated solvents and solvents with a low toxicity. Importantanalytical criteria for the selection were the following:
• Sufficient solubility of the aflatoxins (to obtain an adequate recovery ofthe dried aflatoxins) [117],
• low boiling point (to achieve a fast evaporation of the solvent on theTLC-plate) and

2.2. DETERMINATION BY TLC 67
• low elution strength (to avoid migration of the aflatoxins to the solventfront during application) [117].
One of the first candidate solutions chosen was a mixture of toluene-MeCN since aflatoxins are commonly stored in solutions of 95% to 98 %toluene-MeCN. However, next to the relative toxicity of MeCN, the boilingpoints of toluene (111oC) and of MeCN (82oC) are relatively high. There-fore solvent mixtures based on n-hexane (68oC) or cyclohexane (81oC) wereevaluated as spotting solvents, while the boiling point of n-pentane (36oC)was considered to be too low for precise measurements (especially in warmerregions).
It was found that the presence of a sufficiently polar solvent, such asacetone (56oC) or MeOH (65oC) was essential to retrieve the dried aflatoxinsin solution. Experimental data from evaporated aflatoxin standards, whichwere re-dissolved in various solvent candidates, showed that even an acetoneconcentration of 15% in n-hexane or cyclohexane only resulted in recoveriesof 85% - 90% of the evaporated amount. Contrary to acetone, MeOH aloneis not sufficiently miscible with n-hexane or cyclohexane, thus no relevantrecovery data was obtained.
Experiments based on the addition of acetone (as modifier) and MeOHresulted in miscible solutions and offered excellent recoveries. Consequently,a solvent mixture of hexane-acetone-MeOH (90 + 5 + 5 [v/v/v]) was foundto be most suitable in terms of recovery (98% - 101%) for all aflatoxins. Spotdiameters were found to be between 2.0 and 2.5 mm when volumes of 100 µLwere applied within 2 min (Figure 2.30). In addition, the mixture consists ofsolvents with relatively low toxicity compared to previously described spot-ting solvents [20].
Methanol 100% Hexane-acetone-methanol (90+5+5)
Aflatoxins
Solvent front
Figure 2.30: Evaluation of the elaborated spotting solventand comparison with methanol

68 CHAPTER 2. RESULTS AND DISCUSSION
Due to the fairly low boiling point of the spotting solvent mixture, un-wanted evaporation during the re-dissolving process had to be minimized.This was achieved by injecting the solvent into already sealed glass vials(containing the evaporated aflatoxins) with a micro-litre syringe. A volumeof 150 µL had been selected, assuring that aflatoxins dissolve fully and onlya neglectable amount of solvent would evaporate in the head space of thevial.
Application of the aflatoxins on the TLC-plate In a previousstudy different spotting procedures for aflatoxins were elaborated and it wasreported that no significant difference in precision was found when solutionswere sprayed or spotted [115].
However, while elaborating several spotting solvents and techniques, itwas found that peak heights of classically applied aflatoxin spots (syringeor capillary) were approximately 15% to 30% smaller than those obtainedby spraying procedures. It is remarkable that this effect was found for allspotting solution compositions. Hence it can be concluded that the waysolvent is applied on the TLC-plate is an important factor for the fluorescencesignal yield (Table 2.19).
Spotting solventClassical spotting Linomat (spraying)A B C D A B C D
Aflatoxin Peak height [in mV]AfB1 128 100 137 110 148 138 176 162AfB2 79 66 87 96 90 94 120 114AfG1 102 89 105 100 117 128 127 126AfG2 90 83 95 99 110 106 123 122
Aflatoxin Percentage compared to LinomatAfB1 86 72 78 78 - - - -AfB2 87 70 76 84 - - - -AfG1 87 70 83 79 - - - -AfG2 82 78 77 81 - - - -
Table 2.19: Differences in results from classical spotting and spraying.A = MeOH; B = acetone:hexane (15+85); C = MeOH:acetone:hexane
(5+5+90); D = acetone:cyclohexane (10+90)
The reason for this is thought to be that the solvent penetrates the TLClayer directly using the classical spotting, while on the other hand they startto evaporate even before the analyte reaches the TLC plate, when sprayed.
2.2. DETERMINATION BY TLC 69
Thus, a higher concentration of the analyte in the upper layers of the TLC-plate can be expected. This assumption is further supported by the factthat the biggest difference occured with the solution that evaporated fastest(Solution B), while MeOH resulted in the smallest difference.
It seems that due to the different experimental design (spotting and spray-ing was performed on different plates) [115] this phenomenon remained un-covered, since no direct comparison was achievable this way [118].
Concerning the precision for both application methods no differences werefound for solutions spotted and sprayed with MeOH-acetone-hexane, whichsupports the previously found data.
Additional experiments were carried out to investigate the effect of differ-ent spot or band sizes on densitometric signals. This parameter was thoughtto be important, in case aflatoxins were spotted manually at different appli-cation speeds and thus might differ even slightly. Therefore equal amounts ofaflatoxins were sprayed as bands of different sizes from 2 mm - 8 mm on theTLC-plate. This allowed the investigation of any tendencies or differencesthat might occur. Aflatoxin spots were pre-developed with MeOH to flattenbands and spots. No relevant difference or tendency was observed, providedthat the area scanned recorded the total amount of aflatoxin applied15.
Thin-layer Separation of Aflatoxins
TLC-plate material Since the previous immunoaffinity column clean-up delivered highly purified aflatoxins, the aim was to achieve a sufficientTLC separation with a single one-dimensional development. Several TLC-materials have been investigated in the past [119–122] while despite certainadvantages for polyamide [122], the overall performance of silica gel succeededin most applications. Generally silica gel TLC plates have appropriate op-tical properties for the fluorescence detection of the aflatoxins, are easy touse and are fairly inexpensive. In addition, there are performance studies foraflatoxin determination on different silica gel materials [123, 124] and on fluo-rometric measurements in general [125]. The authors concluded that HPTLCmaterial offers the best performance, while the quality of silica gel plates isan important parameter for precise fluorometric measurements. However,the primary strategy was to evaluate standard TLC plates, since HPTLCmaterial is costly and was only considered if separations were not sufficient.
Mobile phase composition During mobile phase testing, special atten-tion was again drawn to the absence of chlorinated solvents and those with a
15Scanned band size was 12 mm for all spots

70 CHAPTER 2. RESULTS AND DISCUSSION
low toxicity. Nevertheless, this mobile phase shall allow the separation of allfour aflatoxins in a one-dimensional run. This was considered to be essential,to justify the use of IAC in combination with TLC.
In previous work several mobile phase compositions have been described[126–129] [130–134]. However, only one mobile phase based on a mixture ofdiethyl ether, MeOH and water [133] was confirmed to be promising. Thismobile phase was simply modified by substituting the highly volatile andperoxide susceptible diethyl ether with the significantly more stable tert-butyl-methyl-ether (t-BME). In conclusion, a mobile phase composed of t-BME-MeOH-water (480+15+5 [v/v/v]) was found to deliver the same andsufficient results as the diethyl candidate, while t-BME even offers a (morefavourable) higher boiling point.
Nevertheless, the evaporation of the mobile phase after TLC developmentis still very rapid and requires no vacuum, or heat. These features offer aneasy handling of the mobile phase at room temperature. All four aflatox-ins were sufficiently separated in a single run with Rf-values of 0.40 (AfB1),0.35 (AfB2), 0.29 (AfG1), and 0.25 (AfG2) using an unlined and unequili-brated tank (Figure 2.28). Therefore the simultaneous application of severalsamples and standards on one TLC-plate is possible, while classical clean-upprocedures16 require a two dimensional TLC-separation for many matriceswith interfering compounds [107, 108]. This requirement drastically limitsthe number of samples that can be applied on a single plate.
Additional experiments for the robustness of the mobile phase were per-formed, by repeatedly use of the mobile phase. The main effect was a shift toincreased Rf-values. However, the separation of all four aflatoxins was stillsatisfying and showed the ability to reuse the mobile phase several times.
Fluorescence amplification after TLC development The fluorescenceintensity of an organic substance can be quenched or amplified by certain pa-rameters such a pH and other chemical or physical environmental changes.In HPLC the fluorescence of aflatoxins is known to be amplified by chemicalderivatization [79, 135] or by additives in the mobile phase such as the addi-tion of cyclodextrines [102, 136]. In the latter case the amplification is of aphysical nature. Similar to this effect, the amplification of fluorescence forTLC has been described in the literature [137] by simple means of dippingor spraying the TLC-plates in paraffin solutions. An interesting observationwas found to be the amplification of aflatoxins by free fatty acids (as a resultof matrix interference), causing recoveries far above 100% [138].
In order to investigate the fluorescence amplification, a TLC-plate was
16Solid phase extraction
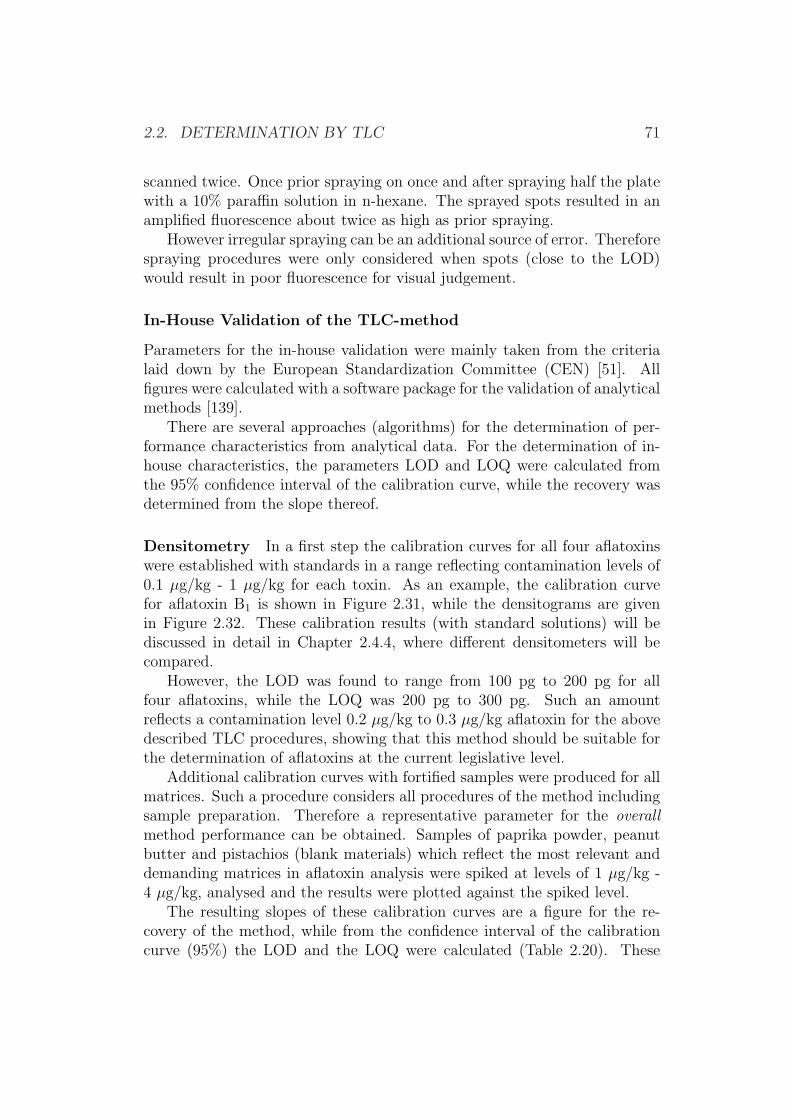
2.2. DETERMINATION BY TLC 71
scanned twice. Once prior spraying on once and after spraying half the platewith a 10% paraffin solution in n-hexane. The sprayed spots resulted in anamplified fluorescence about twice as high as prior spraying.
However irregular spraying can be an additional source of error. Thereforespraying procedures were only considered when spots (close to the LOD)would result in poor fluorescence for visual judgement.
In-House Validation of the TLC-method
Parameters for the in-house validation were mainly taken from the criterialaid down by the European Standardization Committee (CEN) [51]. Allfigures were calculated with a software package for the validation of analyticalmethods [139].
There are several approaches (algorithms) for the determination of per-formance characteristics from analytical data. For the determination of in-house characteristics, the parameters LOD and LOQ were calculated fromthe 95% confidence interval of the calibration curve, while the recovery wasdetermined from the slope thereof.
Densitometry In a first step the calibration curves for all four aflatoxinswere established with standards in a range reflecting contamination levels of0.1 µg/kg - 1 µg/kg for each toxin. As an example, the calibration curvefor aflatoxin B1 is shown in Figure 2.31, while the densitograms are givenin Figure 2.32. These calibration results (with standard solutions) will bediscussed in detail in Chapter 2.4.4, where different densitometers will becompared.
However, the LOD was found to range from 100 pg to 200 pg for allfour aflatoxins, while the LOQ was 200 pg to 300 pg. Such an amountreflects a contamination level 0.2 µg/kg to 0.3 µg/kg aflatoxin for the abovedescribed TLC procedures, showing that this method should be suitable forthe determination of aflatoxins at the current legislative level.
Additional calibration curves with fortified samples were produced for allmatrices. Such a procedure considers all procedures of the method includingsample preparation. Therefore a representative parameter for the overallmethod performance can be obtained. Samples of paprika powder, peanutbutter and pistachios (blank materials) which reflect the most relevant anddemanding matrices in aflatoxin analysis were spiked at levels of 1 µg/kg -4 µg/kg, analysed and the results were plotted against the spiked level.
The resulting slopes of these calibration curves are a figure for the re-covery of the method, while from the confidence interval of the calibrationcurve (95%) the LOD and the LOQ were calculated (Table 2.20). These
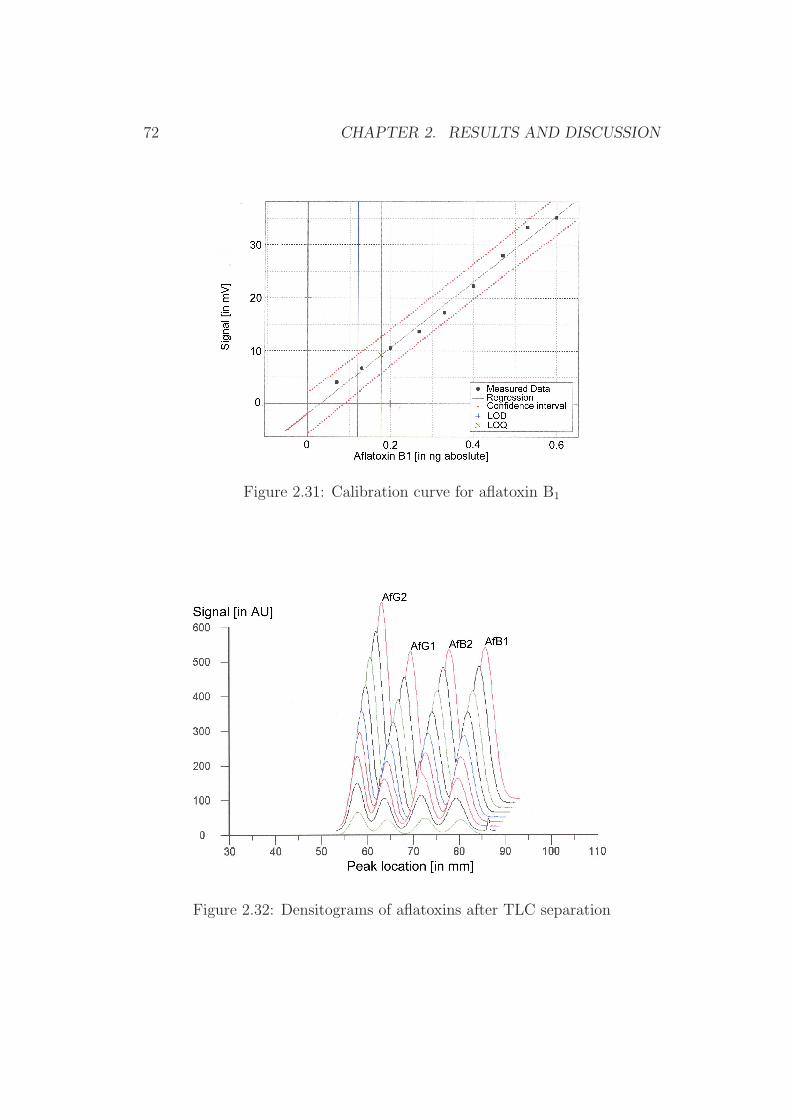
72 CHAPTER 2. RESULTS AND DISCUSSION
Figure 2.31: Calibration curve for aflatoxin B1
Figure 2.32: Densitograms of aflatoxins after TLC separation
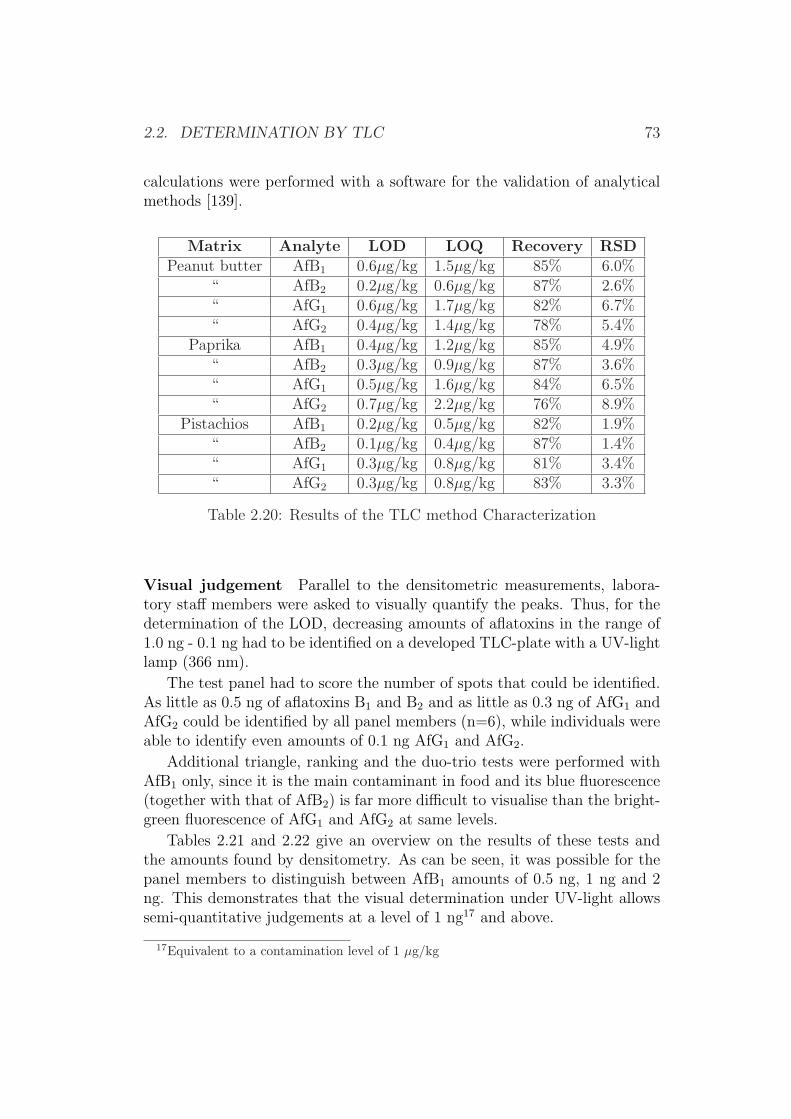
2.2. DETERMINATION BY TLC 73
calculations were performed with a software for the validation of analyticalmethods [139].
Matrix Analyte LOD LOQ Recovery RSDPeanut butter AfB1 0.6µg/kg 1.5µg/kg 85% 6.0%
“ AfB2 0.2µg/kg 0.6µg/kg 87% 2.6%“ AfG1 0.6µg/kg 1.7µg/kg 82% 6.7%“ AfG2 0.4µg/kg 1.4µg/kg 78% 5.4%
Paprika AfB1 0.4µg/kg 1.2µg/kg 85% 4.9%“ AfB2 0.3µg/kg 0.9µg/kg 87% 3.6%“ AfG1 0.5µg/kg 1.6µg/kg 84% 6.5%“ AfG2 0.7µg/kg 2.2µg/kg 76% 8.9%
Pistachios AfB1 0.2µg/kg 0.5µg/kg 82% 1.9%“ AfB2 0.1µg/kg 0.4µg/kg 87% 1.4%“ AfG1 0.3µg/kg 0.8µg/kg 81% 3.4%“ AfG2 0.3µg/kg 0.8µg/kg 83% 3.3%
Table 2.20: Results of the TLC method Characterization
Visual judgement Parallel to the densitometric measurements, labora-tory staff members were asked to visually quantify the peaks. Thus, for thedetermination of the LOD, decreasing amounts of aflatoxins in the range of1.0 ng - 0.1 ng had to be identified on a developed TLC-plate with a UV-lightlamp (366 nm).
The test panel had to score the number of spots that could be identified.As little as 0.5 ng of aflatoxins B1 and B2 and as little as 0.3 ng of AfG1 andAfG2 could be identified by all panel members (n=6), while individuals wereable to identify even amounts of 0.1 ng AfG1 and AfG2.
Additional triangle, ranking and the duo-trio tests were performed withAfB1 only, since it is the main contaminant in food and its blue fluorescence(together with that of AfB2) is far more difficult to visualise than the bright-green fluorescence of AfG1 and AfG2 at same levels.
Tables 2.21 and 2.22 give an overview on the results of these tests andthe amounts found by densitometry. As can be seen, it was possible for thepanel members to distinguish between AfB1 amounts of 0.5 ng, 1 ng and 2ng. This demonstrates that the visual determination under UV-light allowssemi-quantitative judgements at a level of 1 ng17 and above.
17Equivalent to a contamination level of 1 µg/kg
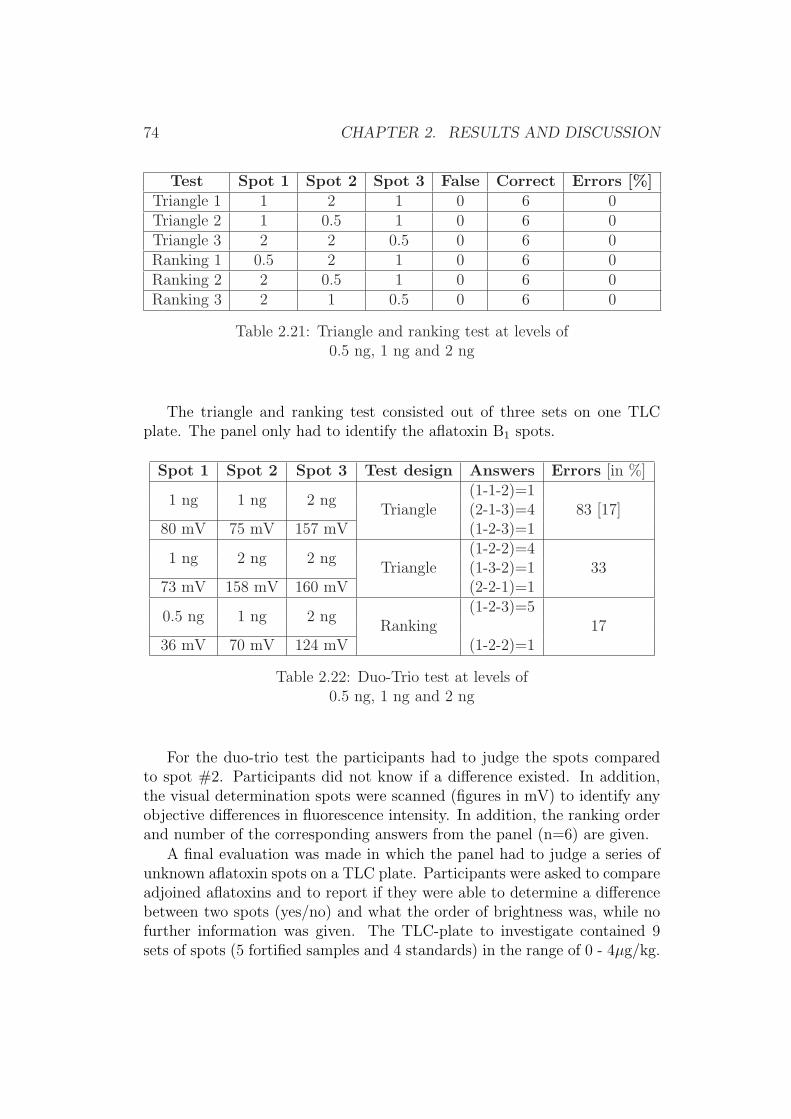
74 CHAPTER 2. RESULTS AND DISCUSSION
Test Spot 1 Spot 2 Spot 3 False Correct Errors [%]Triangle 1 1 2 1 0 6 0Triangle 2 1 0.5 1 0 6 0Triangle 3 2 2 0.5 0 6 0Ranking 1 0.5 2 1 0 6 0Ranking 2 2 0.5 1 0 6 0Ranking 3 2 1 0.5 0 6 0
Table 2.21: Triangle and ranking test at levels of0.5 ng, 1 ng and 2 ng
The triangle and ranking test consisted out of three sets on one TLCplate. The panel only had to identify the aflatoxin B1 spots.
Spot 1 Spot 2 Spot 3 Test design Answers Errors [in %]
1 ng 1 ng 2 ng(1-1-2)=1
Triangle (2-1-3)=4 83 [17]80 mV 75 mV 157 mV (1-2-3)=1
1 ng 2 ng 2 ng(1-2-2)=4
Triangle (1-3-2)=1 3373 mV 158 mV 160 mV (2-2-1)=1
0.5 ng 1 ng 2 ng(1-2-3)=5
Ranking 1736 mV 70 mV 124 mV (1-2-2)=1
Table 2.22: Duo-Trio test at levels of0.5 ng, 1 ng and 2 ng
For the duo-trio test the participants had to judge the spots comparedto spot #2. Participants did not know if a difference existed. In addition,the visual determination spots were scanned (figures in mV) to identify anyobjective differences in fluorescence intensity. In addition, the ranking orderand number of the corresponding answers from the panel (n=6) are given.
A final evaluation was made in which the panel had to judge a series ofunknown aflatoxin spots on a TLC plate. Participants were asked to compareadjoined aflatoxins and to report if they were able to determine a differencebetween two spots (yes/no) and what the order of brightness was, while nofurther information was given. The TLC-plate to investigate contained 9sets of spots (5 fortified samples and 4 standards) in the range of 0 - 4µg/kg.
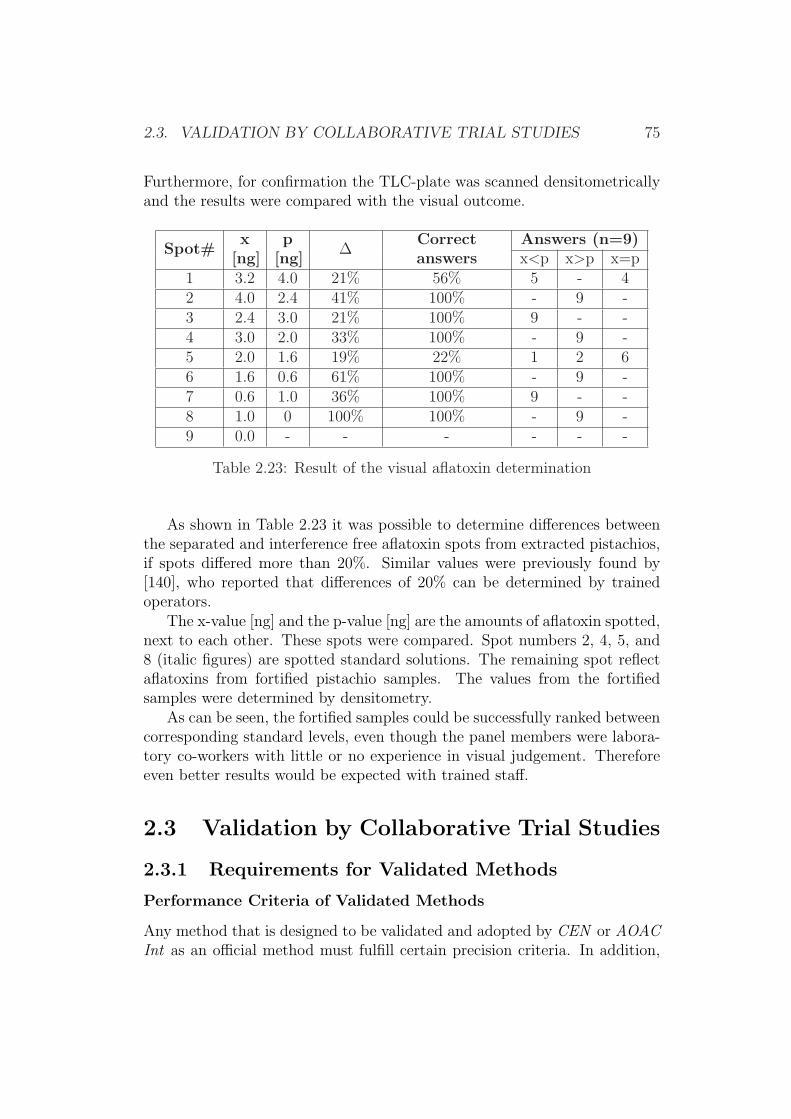
2.3. VALIDATION BY COLLABORATIVE TRIAL STUDIES 75
Furthermore, for confirmation the TLC-plate was scanned densitometricallyand the results were compared with the visual outcome.
Spot#x
[ng]p
[ng]∆
Correctanswers
Answers (n=9)x<p x>p x=p
1 3.2 4.0 21% 56% 5 - 42 4.0 2.4 41% 100% - 9 -3 2.4 3.0 21% 100% 9 - -4 3.0 2.0 33% 100% - 9 -5 2.0 1.6 19% 22% 1 2 66 1.6 0.6 61% 100% - 9 -7 0.6 1.0 36% 100% 9 - -8 1.0 0 100% 100% - 9 -9 0.0 - - - - - -
Table 2.23: Result of the visual aflatoxin determination
As shown in Table 2.23 it was possible to determine differences betweenthe separated and interference free aflatoxin spots from extracted pistachios,if spots differed more than 20%. Similar values were previously found by[140], who reported that differences of 20% can be determined by trainedoperators.
The x-value [ng] and the p-value [ng] are the amounts of aflatoxin spotted,next to each other. These spots were compared. Spot numbers 2, 4, 5, and8 (italic figures) are spotted standard solutions. The remaining spot reflectaflatoxins from fortified pistachio samples. The values from the fortifiedsamples were determined by densitometry.
As can be seen, the fortified samples could be successfully ranked betweencorresponding standard levels, even though the panel members were labora-tory co-workers with little or no experience in visual judgement. Thereforeeven better results would be expected with trained staff.
2.3 Validation by Collaborative Trial Studies
2.3.1 Requirements for Validated Methods
Performance Criteria of Validated Methods
Any method that is designed to be validated and adopted by CEN or AOACInt as an official method must fulfill certain precision criteria. In addition,
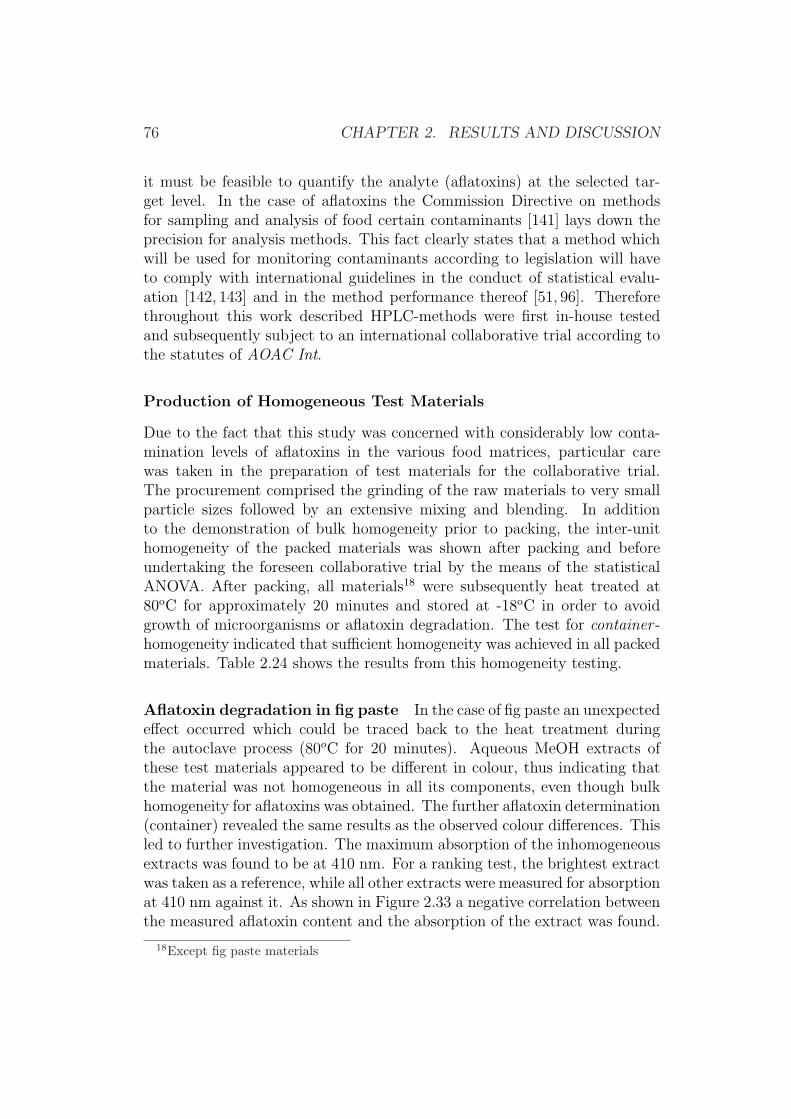
76 CHAPTER 2. RESULTS AND DISCUSSION
it must be feasible to quantify the analyte (aflatoxins) at the selected tar-get level. In the case of aflatoxins the Commission Directive on methodsfor sampling and analysis of food certain contaminants [141] lays down theprecision for analysis methods. This fact clearly states that a method whichwill be used for monitoring contaminants according to legislation will haveto comply with international guidelines in the conduct of statistical evalu-ation [142, 143] and in the method performance thereof [51, 96]. Thereforethroughout this work described HPLC-methods were first in-house testedand subsequently subject to an international collaborative trial according tothe statutes of AOAC Int.
Production of Homogeneous Test Materials
Due to the fact that this study was concerned with considerably low conta-mination levels of aflatoxins in the various food matrices, particular carewas taken in the preparation of test materials for the collaborative trial.The procurement comprised the grinding of the raw materials to very smallparticle sizes followed by an extensive mixing and blending. In additionto the demonstration of bulk homogeneity prior to packing, the inter-unithomogeneity of the packed materials was shown after packing and beforeundertaking the foreseen collaborative trial by the means of the statisticalANOVA. After packing, all materials18 were subsequently heat treated at80oC for approximately 20 minutes and stored at -18oC in order to avoidgrowth of microorganisms or aflatoxin degradation. The test for container -homogeneity indicated that sufficient homogeneity was achieved in all packedmaterials. Table 2.24 shows the results from this homogeneity testing.
Aflatoxin degradation in fig paste In the case of fig paste an unexpectedeffect occurred which could be traced back to the heat treatment duringthe autoclave process (80oC for 20 minutes). Aqueous MeOH extracts ofthese test materials appeared to be different in colour, thus indicating thatthe material was not homogeneous in all its components, even though bulkhomogeneity for aflatoxins was obtained. The further aflatoxin determination(container) revealed the same results as the observed colour differences. Thisled to further investigation. The maximum absorption of the inhomogeneousextracts was found to be at 410 nm. For a ranking test, the brightest extractwas taken as a reference, while all other extracts were measured for absorptionat 410 nm against it. As shown in Figure 2.33 a negative correlation betweenthe measured aflatoxin content and the absorption of the extract was found.
18Except fig paste materials
2.3. VALIDATION BY COLLABORATIVE TRIAL STUDIES 77
Material Target Achieved F-valueAfB1 µg/kg AfB1 µg/kg (Fcrit = 3.02p=0.05)
Pistachio paste
0 0.2 -1 0.8±0.06 0.42 1.7±0.27 1.54 3.5±0.15 0.1
Peanut butter
0 <0.1 -1 1.0±0.17 1.02 1.6±0.27 1.04 3.6±0.47 0.6
Fig paste
0 0.3±0.05 1.91 1.3±0.04 0.12 2.0±0.97 0.34 3.3±0.33 1.2
Paprikapowder
0 <0.1 -1 1.1±0.15 1.02 1.8±0.14 0.34 4.0±0.36 0.4
Infant formula
0 <0.05 -0.05 0.09±0.02 1.60.1 0.13±0.02 0.70.2 0.21±0.04 0.8
Animal feed
0 0.09±0.004 -0.5 0.68±0.02 0.71 1.03±0.01 0.25 5.21±0.10 0.6
Table 2.24: Results from the various homogeneity studys on AfB1

78 CHAPTER 2. RESULTS AND DISCUSSION
Figure 2.33: Correlation between extract colour and aflatoxin contentof fig extracts after heat treatment
Absorption of the extract at 410 nm
0.0 0.2 0.4 0.6 0.8 1.0 1.2 1.4
Am
ount
of t
oxin
s fo
und
afte
r IA
C [i
n ng
/g]
1
2
3
4
5
Aflatoxin B1
Total aflatoxins

2.3. VALIDATION BY COLLABORATIVE TRIAL STUDIES 79
The darkening of extracts was explained to be due to the Maillard-Reaction (so called Ànon enzymatic browning¿). Apparently the correla-tion indicated that the measurement of aflatoxins will be affected by ma-trices that undergo Maillard-Reaction (e.g. during storage or treatment).The exact mechanism, which caused this apparent loss of aflatoxins needsfurther investigation and it is still unclear whether both effects (lower afla-toxin values and Maillard-Reaction) are linked, or just correlate, whetherthe aflatoxins will be masked or undergo chemical degradation to non toxicmetabolites in the food matrix. The fact that (measured) aflatoxin levels de-crease during heat treatment or chemical treatment [8–10, 144] is known andhas been investigated for the detoxification of feeding stuffs [144], howeverthe reported conditions were far above 100oC. Furthermore, correlations ofbrowning effects of sample extracts or HMF content and measured aflatoxinconcentration has not been described before.
Due to this resulting inhomogeneity of the fig material, it was preparedtwice. All results given in this work concerned the second batch of nonheat-treated material, which appeared to be stable and homogeneous.
2.3.2 Organization of the Collaborative Trial
The participating laboratories from the different countries represented across-section of national research organizations, food control authorities, andfood industry affiliations. Prior to the trial each participant received a prac-tice sample which comprised blank material and a calibrant solution for spik-ing. A pre-collaborative trial workshop was organized by myself in collab-oration with other partners of the project where any problems experiencedwith the analysis of the practice sample were discussed, and the details andorganization of the trial were outlined by the co-ordinators.
Each of the collaborative trial participants received:
• Eight coded samples of each matrix (blind duplicates at four contentlevels) plus four units labelled Àblank¿ (for spiking).
• One amber vial marked ÀAflatoxin calibrant¿ containing a mixture ofaflatoxins B1, B2, G1 and G2, which was to be employed as the (mixed)calibrant aflatoxin solution described in the method.
• Two amber vials marked ÀSpike solution A¿ and ÀSpike solution B¿ tobe used for spike recovery determinations.
• A sufficient amount of immunoaffinity columns (with a minimum of 2spares) for the clean-up of material extracts.

80 CHAPTER 2. RESULTS AND DISCUSSION
• A copy of the method.
• A report form for analytical data as well as reporting any criticismsand suggestions.
• A ÀCollaborative Study Materials Receipt¿ form.
Each participant was required to prepare one extract from each mate-rial, perform the clean-up using one immunoaffinity column and analyse theextracts by HPLC. Additionally each participant was asked to spike four in-dicated blank materials of each matrix at two different levels with SolutionA and Solution B which contained aflatoxins at concentrations unknown toparticipants. After adding the spike solution, participants were instructed tomix by shaking and allow the sample to stand for at least 30 minutes priorto extraction.
In case different matrices had to be analysed, participants were advisedto analyse different matrices on separate days. This would mean analysinga batch of 12 samples (8 coded plus 4 spike samples per matrix) on separatedays. Participants were instructed that samples should be analysed in thenumerical sequence of the sample codes (nested design).
2.3.3 Results of the Collaborative Trial
Collaborative Trial Results for Paprika Powder, Fig Paste, PeanutButter and Pistachio Paste
All 16 collaborators who received test samples completed the study. All datasubmitted for the study for the four commodities are presented in the Annex(Tables 5.1 to 5.16). Each table is sub-divided presenting individual resultsfor aflatoxins B1, B2, G1, G2 and total aflatoxins. The data are given asindividual pairs of results for each participant (identified as A to P). Blanksamples (identified as samples c) were spiked with 1.0 µg/kg and 4.0 µg/kgof aflatoxins B1 and G1 and 0.2 µg/kg and 0.8 µg/kg for aflatoxins B2 andG2 (identified as samples a and b and giving corresponding levels for totalaflatoxins of 2.4 µg/kg and 9.6 µg/kg respectively). Samples d, e and f areblind duplicates for naturally contaminated materials in each case.
Precision estimates were obtained using the one-way analysis of varianceapproach according to the IUPAC Harmonized Protocol [52]. Details of thefood matrices, the average analyte concentration, the standard deviations
2.3. VALIDATION BY COLLABORATIVE TRIAL STUDIES 81
for repeatability (sr) and reproducibility (SR), the relative standard devia-tions for repeatability (RSDr) and reproducibility (RSDR), the number ofstatistical outlier laboratories and the percentage recovery are presented inTables 2.25 to 2.28 for aflatoxins B1 and total aflatoxins respectively. Thecollaborative trial results had previously been examined for evidence of in-dividual systematic error (p<0.025) using Cochran’s and Grubbs tests pro-gressively [52]. Pairs of results that were identified as outliers are given inslanted* numbers in Tables 5.1 to 5.16.
Regarding the results for aflatoxin B1 and for total aflatoxins (exclud-ing data for blank materials) the maximum numbers of outliers identifiedwas 4 laboratories, giving acceptable data from 12 to 16 laboratories. Dueto differences in reporting limits for not detectable amounts, the results forblank materials in the cases of peanut butter and paprika powder were notanalysed statistically. However the results clearly indicated that all partici-pants could identify the blank pairs of samples as not containing detectableaflatoxins or containing levels which were detectable but close to measurablelimits. The results for the blank samples of pistachio and fig pastes showedthat both samples contained low but measurable amounts of aflatoxins. Theaverage levels of aflatoxin B1 in the pistachio and fig pastes were found to be0.13 µg/kg and 0.32 µg/kg respectively (corresponding to 0.2 µg/kg and 0.6µg/kg for total aflatoxins respectively). In the case of aflatoxins G1 and G2 inpistachio paste, the results for the three naturally contaminated samples (d,e and f ) contained levels that were below the limits of detection (3x baselinenoise), and therefore it was not possible to undertake statistical analysis inthis instance.
The precision data is shown in Tables 2.25 to 2.28. Based on results forspiked samples (blind pairs at two levels) as well as naturally contaminatedsamples (blind pairs at three levels) the relative standard deviation for re-peatability (RSDr) ranged from 4.6% to 23.3% for total aflatoxins and from3.1% to 20.0% for aflatoxin B1. The relative standard deviation for repro-ducibility (RSDR) ranged from 14.1% to 34.2% for total aflatoxins, and from9.1% to 32.2% for aflatoxin B1. This precision data is comparable with thosefrom other reference methods [68], while the range of food items covers allimportant products at the relevant working level.

82 CHAPTER 2. RESULTS AND DISCUSSION
Number of laboratories 16Sample Set (nc = naturally contam.) 1 2 3(nc) 4(nc) 5(nc)Parameter Aflatoxin B1
Number of samples (duplicates) 1 1 1 1 1Number of laboratories retained aftereliminating outliers
15 13 15 14 14
Number of outliers 1 3 1 2 2Number of accepted results 15 13 15 14 14Mean value [in µg/kg] 0.87 3.65 0.80 1.52 3.40Repeatability standard deviation sr
[in µg/kg]0.09 0.11 0.05 0.10 0.13
Repeatability relative standard devia-tion RSDr [in %]
10 3 6 6 4
Repeatability limit r(r=2.8∗sr) [inµg/kg]
0.25 0.31 0.14 0.28 0.36
Reproducibility standard deviation sR
[in µg/kg]0.16 0.66 0.26 0.22 0.65
Reproducibility relative standard de-viation RSDR [in %]
19 18 32 14 19
Reproducibility limit R[R=2.8∗sR] [inµg/kg]
0.45 1.85 0.73 0.62 1.82
Recovery [in %] 87 91 - - -Parameter Total aflatoxinsNumber of samples (duplicates) 1 1 1 1 1Number of laboratories retained aftereliminating outliers
15 15 15 13 14
Number of outliers 1 1 1 3 2Number of accepted results 15 15 15 13 14Mean value [in µg/kg] 1.9 7.9 1.3 2.2 5.0Repeatability standard deviation sr
[in µg/kg]0.26 0.67 0.08 0.16 0.23
Repeatability relative standard devia-tion RSDr [in %]
13 9 6 7 5
Repeatability limit r (r=2.8∗sr) [inµg/kg]
0.73 1.88 0.22 0.45 0.64
Reproducibility standard deviation sR
[in µg/kg]0.35 1.76 0.46 0.32 0.96
Reproducibility relative standard de-viation RSDR [in %]
18 22 34 14 19
Reproducibility limit R [R=2.8∗sR][in µg/kg]
0.98 4.93 1.29 0.90 2.69
Recovery [in %] 81 82 - - -
Table 2.25: Precision data for aflatoxin B1 in peanut butter

2.3. VALIDATION BY COLLABORATIVE TRIAL STUDIES 83
Number of laboratories 16Sample Set (nc = naturally contam.) 1 2 3(nc) 4(nc) 5(nc)Parameter Aflatoxin B1
Number of samples (duplicates) 1 1 1 1 1Number of laboratories retained aftereliminating outliers
15 12 13 15 14
Number of outliers 1 4 3 1 2Number of accepted results 15 12 13 15 14Mean value [in µg/kg] 0.94 3.29 0.74 1.54 2.93Repeatability standard deviation sr
[in µg/kg]0.13 0.13 0.08 0.27 0.59
Repeatability relative standard devia-tion RSDr [in %]
14 4 11 18 20
Repeatability limit r (r=2.8∗sr) [inµg/kg]
0.36 0.36 0.22 0.76 1.65
Reproducibility standard deviation sR
[in µg/kg]0.15 1.02 0.12 0.36 0.61
Reproducibility relative standard de-viation RSDR [in %]
16 31 17 23 21
Reproducibility limit R [R=2.8∗sR][in µg/kg]
0.42 2.86 0.34 1.01 1.71
Recovery [in %] 94 82 - - -Parameter Total aflatoxinsNumber of samples (duplicates) 1 1 1 1 1Number of laboratories retained aftereliminating outliers
14 14 13 15 14
Number of outliers 2 2 3 1 2Number of accepted results 14 14 13 15 14Mean value [in µg/kg] 2.0 7.8 0.8 1.7 3.3Repeatability standard deviation sr
[in µg/kg]0.24 1.82 0.10 0.31 0.66
Repeatability relative standard devia-tion RSDr [in %]
12 23 12 18 20
Repeatability limit r (r=2.8∗sr) [inµg/kg]
0.67 5.10 0.28 0.87 1.85
Reproducibility standard deviation sR
[in µg/kg]0.36 1.82 0.17 0.42 0.72
Reproducibility relative standard de-viation RSDR [in %]
18 23 21 24 22
Reproducibility limit R [R=2.8∗sR][in µg/kg]
1.01 5.1 0.48 1.18 2.02
Recovery [in %] 83 81 - - -
Table 2.26: Precision data for pistachio paste
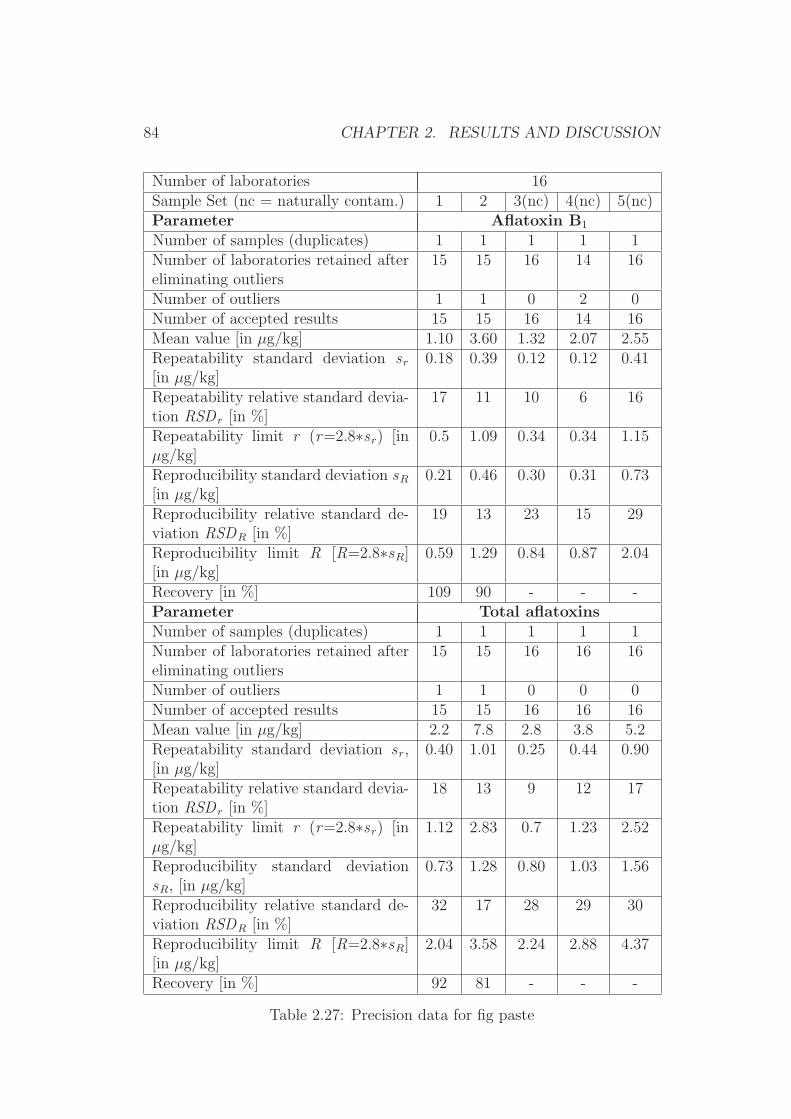
84 CHAPTER 2. RESULTS AND DISCUSSION
Number of laboratories 16Sample Set (nc = naturally contam.) 1 2 3(nc) 4(nc) 5(nc)Parameter Aflatoxin B1
Number of samples (duplicates) 1 1 1 1 1Number of laboratories retained aftereliminating outliers
15 15 16 14 16
Number of outliers 1 1 0 2 0Number of accepted results 15 15 16 14 16Mean value [in µg/kg] 1.10 3.60 1.32 2.07 2.55Repeatability standard deviation sr
[in µg/kg]0.18 0.39 0.12 0.12 0.41
Repeatability relative standard devia-tion RSDr [in %]
17 11 10 6 16
Repeatability limit r (r=2.8∗sr) [inµg/kg]
0.5 1.09 0.34 0.34 1.15
Reproducibility standard deviation sR
[in µg/kg]0.21 0.46 0.30 0.31 0.73
Reproducibility relative standard de-viation RSDR [in %]
19 13 23 15 29
Reproducibility limit R [R=2.8∗sR][in µg/kg]
0.59 1.29 0.84 0.87 2.04
Recovery [in %] 109 90 - - -Parameter Total aflatoxinsNumber of samples (duplicates) 1 1 1 1 1Number of laboratories retained aftereliminating outliers
15 15 16 16 16
Number of outliers 1 1 0 0 0Number of accepted results 15 15 16 16 16Mean value [in µg/kg] 2.2 7.8 2.8 3.8 5.2Repeatability standard deviation sr,[in µg/kg]
0.40 1.01 0.25 0.44 0.90
Repeatability relative standard devia-tion RSDr [in %]
18 13 9 12 17
Repeatability limit r (r=2.8∗sr) [inµg/kg]
1.12 2.83 0.7 1.23 2.52
Reproducibility standard deviationsR, [in µg/kg]
0.73 1.28 0.80 1.03 1.56
Reproducibility relative standard de-viation RSDR [in %]
32 17 28 29 30
Reproducibility limit R [R=2.8∗sR][in µg/kg]
2.04 3.58 2.24 2.88 4.37
Recovery [in %] 92 81 - - -
Table 2.27: Precision data for fig paste
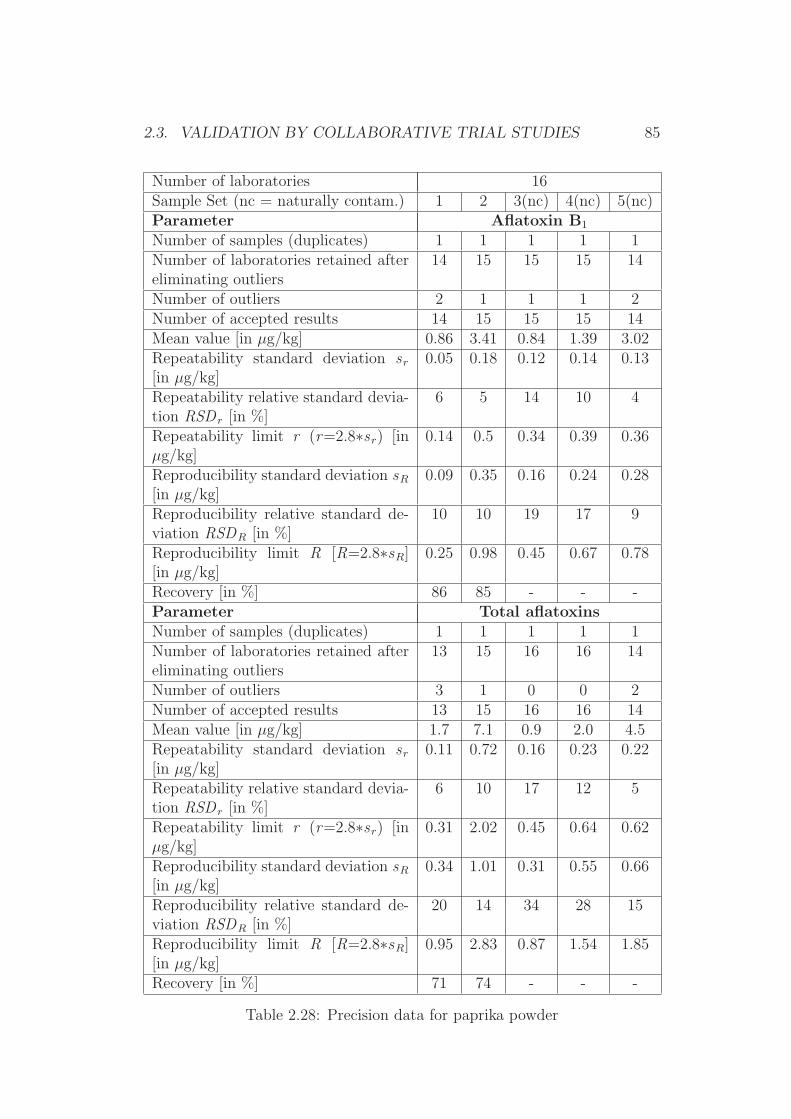
2.3. VALIDATION BY COLLABORATIVE TRIAL STUDIES 85
Number of laboratories 16Sample Set (nc = naturally contam.) 1 2 3(nc) 4(nc) 5(nc)Parameter Aflatoxin B1
Number of samples (duplicates) 1 1 1 1 1Number of laboratories retained aftereliminating outliers
14 15 15 15 14
Number of outliers 2 1 1 1 2Number of accepted results 14 15 15 15 14Mean value [in µg/kg] 0.86 3.41 0.84 1.39 3.02Repeatability standard deviation sr
[in µg/kg]0.05 0.18 0.12 0.14 0.13
Repeatability relative standard devia-tion RSDr [in %]
6 5 14 10 4
Repeatability limit r (r=2.8∗sr) [inµg/kg]
0.14 0.5 0.34 0.39 0.36
Reproducibility standard deviation sR
[in µg/kg]0.09 0.35 0.16 0.24 0.28
Reproducibility relative standard de-viation RSDR [in %]
10 10 19 17 9
Reproducibility limit R [R=2.8∗sR][in µg/kg]
0.25 0.98 0.45 0.67 0.78
Recovery [in %] 86 85 - - -Parameter Total aflatoxinsNumber of samples (duplicates) 1 1 1 1 1Number of laboratories retained aftereliminating outliers
13 15 16 16 14
Number of outliers 3 1 0 0 2Number of accepted results 13 15 16 16 14Mean value [in µg/kg] 1.7 7.1 0.9 2.0 4.5Repeatability standard deviation sr
[in µg/kg]0.11 0.72 0.16 0.23 0.22
Repeatability relative standard devia-tion RSDr [in %]
6 10 17 12 5
Repeatability limit r (r=2.8∗sr) [inµg/kg]
0.31 2.02 0.45 0.64 0.62
Reproducibility standard deviation sR
[in µg/kg]0.34 1.01 0.31 0.55 0.66
Reproducibility relative standard de-viation RSDR [in %]
20 14 34 28 15
Reproducibility limit R [R=2.8∗sR][in µg/kg]
0.95 2.83 0.87 1.54 1.85
Recovery [in %] 71 74 - - -
Table 2.28: Precision data for paprika powder
86 CHAPTER 2. RESULTS AND DISCUSSION
Although the method described here is only recommended for applicationat levels of aflatoxin B1 at greater than 1 µg/kg and for total aflatoxinsat greater than 2.4 µg/kg, there is evidence from the blank matrices thatcontained low levels of aflatoxins that the method in fact gives satisfactoryperformance at lower levels. Thus, for pistachio and fig pastes containinglevels of 0.1 µg/kg and 0.3 µg/kg aflatoxin B1 respectively (and correspondingtotal aflatoxin levels of 0.2 µg/kg and 0.6 µg/kg respectively) RSDr’s of 19.2%and 24.5% and RSDR’s of 49.5% and 30.6% were obtained for aflatoxin B1 andRSDr’s of 53.4% and 43.3% and RSDR’s of 58.2% and 52.9% were obtainedfor total aflatoxins. Although these precision values are higher than those atdetection levels at which the method is being proposed, the HORRAT valuesare nevertheless still below 2.0 and only in one instance slightly exceed 1.0.
Thus in principle the method could be claimed as operable with accept-able performance characteristics at levels as low as 0.1 µg/kg for aflatoxin B1
and 0.2 µg/kg for total aflatoxins in pistachio paste. The values for recover-ies of aflatoxin B1 derived from the spiked samples were found to range from82% to 109% and for total aflatoxins to range from 71% to 92% (Tables 2.25to 2.28).
The lowest recoveries were obtained for paprika powder, and the highestvalues for fig paste where the blank material used for spiking contained lowlevels of aflatoxins. When the average level of aflatoxin B1 of 0.3 µg/kg in theblank fig paste is deducted from measured values after spiking, the recoveryvalues decreased from 109% to 78% and from 90% to 82%. Similarly whenthe measured level of total aflatoxins of 0.6 µg/kg in the blank fig paste wasdeducted, the recoveries decreased from 92% to 67% and from 81% to 75%.Recoveries for aflatoxins B2, G1 and G2 ranged from 58% to 123% with thelowest recoveries again being for paprika powder and the high recoveries be-ing for fig paste where, if blank background levels were subtracted, decreasefrom 123% to 75%. As the method is envisaged as being applied to determineeither or both aflatoxin B1 and total aflatoxins, the recoveries were deemedas acceptable.
The acceptability of the precision characteristics of the method were as-sessed on the basis of the HORRAT values [145] which compare the RSDR
at the various levels and in the various matrices with those values predictedfrom collaborative trial studies taken from published literature. When out-liers were excluded, the HORRAT values for aflatoxin B1 ranged from 0.3to 0.7 for peanut butter, from 0.4 to 0.8 for pistachio paste, from 0.3 to 0.7for fig paste and from 0.2 to 0.4 for paprika powder. The HORRAT val-ues for aflatoxin B2, G1 and G2 were generally of the same order as those
2.3. VALIDATION BY COLLABORATIVE TRIAL STUDIES 87
for aflatoxin B1 and only in one case (for aflatoxin G2 in a sample of figpaste) were the HORRAT values >1. For total aflatoxins the HORRAT val-ues ranged from 0.3 to 0.8 for peanut butter, from 0.4 to 0.7 for pistachiopaste, from 0.5 to 0.8 for fig paste and from 0.4 to 0.7 for paprika powder.In any event all HORRAT values were <2.0 which is taken as indicating anacceptable precision, and were better than or comparable to values reportedin the AOAC-IUPAC official first action method [146] notwithstanding thelow levels of aflatoxin contamination in this instance.
Collaborative Trial Results for Infant Formula
Fourteen laboratories participated in the study and all laboratories completedthe study. The full set of single results for the trial is given in the Annex(Table 5.17) as individual pairs for each sample and for each participant(identified as 1 to 14).
The collaborative trial results were examined for evidence of individualsystematic error (p<0.025) using Cochran’s and Grubbs tests progressively[52]. Pairs of results that were identified as outliers are given in italics* inTable 5.17.
Blank samples (identified as sample c) were spiked with 0.1 µg/kg and0.2 µg/kg of aflatoxin B1 as blind duplicates (identified as samples a and brespectively). Samples d, e and f are blind duplicates for naturally contam-inated materials in each case.
Precision estimates were obtained using one-way analysis of variance ap-proach according to the IUPAC Harmonized Protocol [52]. Details of theaverage aflatoxin B1 contents of the various baby food test samples, thestandard deviations for repeatability (RSDr) and reproducibility (RSDR),the number of statistical outlier laboratories, the HORRAT values and themean percentage recovery are presented in Table 2.29. For the results foraflatoxin B1 given in Table 5.17 (excluding the data for blank materials) themaximum numbers of outliers identified was 3 laboratories, giving acceptabledata ranging from 11 to 14 laboratories.
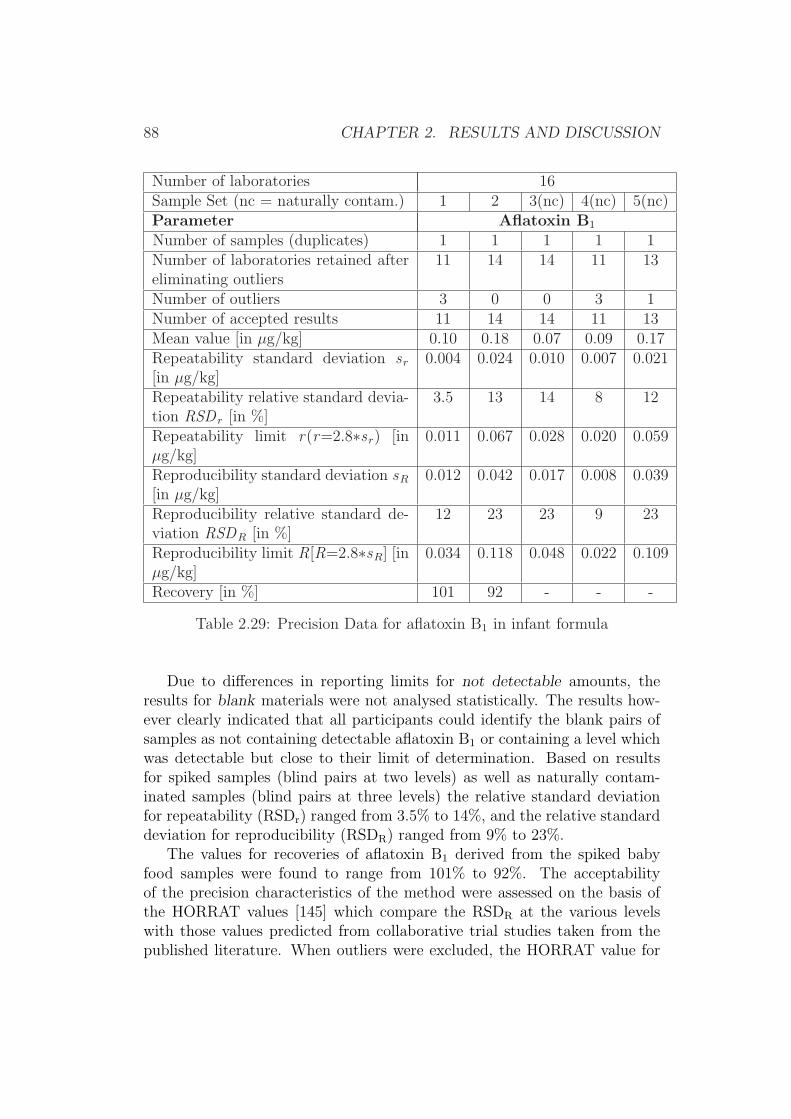
88 CHAPTER 2. RESULTS AND DISCUSSION
Number of laboratories 16Sample Set (nc = naturally contam.) 1 2 3(nc) 4(nc) 5(nc)Parameter Aflatoxin B1
Number of samples (duplicates) 1 1 1 1 1Number of laboratories retained aftereliminating outliers
11 14 14 11 13
Number of outliers 3 0 0 3 1Number of accepted results 11 14 14 11 13Mean value [in µg/kg] 0.10 0.18 0.07 0.09 0.17Repeatability standard deviation sr
[in µg/kg]0.004 0.024 0.010 0.007 0.021
Repeatability relative standard devia-tion RSDr [in %]
3.5 13 14 8 12
Repeatability limit r(r=2.8∗sr) [inµg/kg]
0.011 0.067 0.028 0.020 0.059
Reproducibility standard deviation sR
[in µg/kg]0.012 0.042 0.017 0.008 0.039
Reproducibility relative standard de-viation RSDR [in %]
12 23 23 9 23
Reproducibility limit R[R=2.8∗sR] [inµg/kg]
0.034 0.118 0.048 0.022 0.109
Recovery [in %] 101 92 - - -
Table 2.29: Precision Data for aflatoxin B1 in infant formula
Due to differences in reporting limits for not detectable amounts, theresults for blank materials were not analysed statistically. The results how-ever clearly indicated that all participants could identify the blank pairs ofsamples as not containing detectable aflatoxin B1 or containing a level whichwas detectable but close to their limit of determination. Based on resultsfor spiked samples (blind pairs at two levels) as well as naturally contam-inated samples (blind pairs at three levels) the relative standard deviationfor repeatability (RSDr) ranged from 3.5% to 14%, and the relative standarddeviation for reproducibility (RSDR) ranged from 9% to 23%.
The values for recoveries of aflatoxin B1 derived from the spiked babyfood samples were found to range from 101% to 92%. The acceptabilityof the precision characteristics of the method were assessed on the basis ofthe HORRAT values [145] which compare the RSDR at the various levelswith those values predicted from collaborative trial studies taken from thepublished literature. When outliers were excluded, the HORRAT value for

2.3. VALIDATION BY COLLABORATIVE TRIAL STUDIES 89
aflatoxin B1 ranged from 0.l to 0.4, being significantly below 2.0 which indi-cates acceptable precision data.
Comments from collaborative trial participants Comments on thetrial were made by 7 of the 14 participants. In all cases the participantsregarded the method description as being adequate. For participant 9 where2 pairs of results were rejected as being outliers, no comments were given.Participant 2 and participant 4 made no comments either. Participant 3 hadprepared the standards in MeOH as solvent. Participant 12 expressed somedoubt as to their results for spiked samples, but did not give a technicalreason. However, the value for aflatoxin B1 was found to be in compliance(i.e. this participant did not produce an outlier value for the spiked samples).Participant 13 again only used an injection volume of 200 µL, although nofurther comments were made or problems reported.
Collaborative Trial Results for Animal Feed
All 21 laboratories that received the test samples completed the study. Thefull set of results for this trial is given in the Annex (Table 5.18) as individualpairs of results for each participant (identified as 1 to 21). Blank samples(identified as sample a) were spiked with 1.2 µg/kg and 3.6 µg/kg of aflatoxinB1 as blind duplicates. Samples b, c, and d were also blind duplicates but ofnaturally contaminated materials.
Precision estimates were obtained using one-way analysis of variance ap-proach according to the AOAC Harmonized Protocol [52]. Details of the av-erage aflatoxin B1 contents of the various animal feeding stuff test samples,the standard deviations for repeatability (RSDr) and reproducibility (RSDR),the number of statistical outlier laboratories, the HORRAT values and themean percentage recovery are presented in Table ??. The collaborative trialresults were examined for evidence of individual systematic error (p<0.025)using Cochran’s and Grubbs tests progressively [52]. Pairs of results thatwere identified as outliers are given in italic* numbers. For the results foraflatoxin B1 given in Table 2.30 (excluding the data for blank materials) themaximum numbers of outliers identified was 3 laboratories, giving acceptabledata ranging from 18 to 20 laboratories.
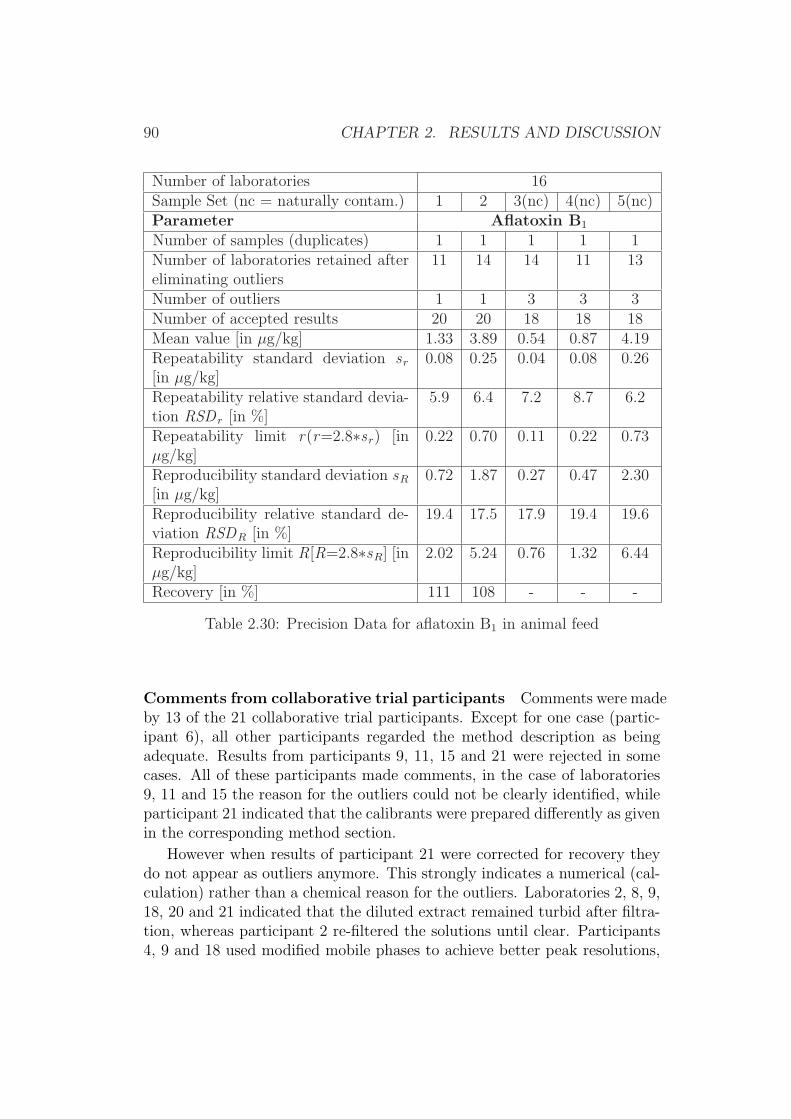
90 CHAPTER 2. RESULTS AND DISCUSSION
Number of laboratories 16Sample Set (nc = naturally contam.) 1 2 3(nc) 4(nc) 5(nc)Parameter Aflatoxin B1
Number of samples (duplicates) 1 1 1 1 1Number of laboratories retained aftereliminating outliers
11 14 14 11 13
Number of outliers 1 1 3 3 3Number of accepted results 20 20 18 18 18Mean value [in µg/kg] 1.33 3.89 0.54 0.87 4.19Repeatability standard deviation sr
[in µg/kg]0.08 0.25 0.04 0.08 0.26
Repeatability relative standard devia-tion RSDr [in %]
5.9 6.4 7.2 8.7 6.2
Repeatability limit r(r=2.8∗sr) [inµg/kg]
0.22 0.70 0.11 0.22 0.73
Reproducibility standard deviation sR
[in µg/kg]0.72 1.87 0.27 0.47 2.30
Reproducibility relative standard de-viation RSDR [in %]
19.4 17.5 17.9 19.4 19.6
Reproducibility limit R[R=2.8∗sR] [inµg/kg]
2.02 5.24 0.76 1.32 6.44
Recovery [in %] 111 108 - - -
Table 2.30: Precision Data for aflatoxin B1 in animal feed
Comments from collaborative trial participants Comments were madeby 13 of the 21 collaborative trial participants. Except for one case (partic-ipant 6), all other participants regarded the method description as beingadequate. Results from participants 9, 11, 15 and 21 were rejected in somecases. All of these participants made comments, in the case of laboratories9, 11 and 15 the reason for the outliers could not be clearly identified, whileparticipant 21 indicated that the calibrants were prepared differently as givenin the corresponding method section.
However when results of participant 21 were corrected for recovery theydo not appear as outliers anymore. This strongly indicates a numerical (cal-culation) rather than a chemical reason for the outliers. Laboratories 2, 8, 9,18, 20 and 21 indicated that the diluted extract remained turbid after filtra-tion, whereas participant 2 re-filtered the solutions until clear. Participants4, 9 and 18 used modified mobile phases to achieve better peak resolutions,
2.3. VALIDATION BY COLLABORATIVE TRIAL STUDIES 91
whereas participant 11 reported to have better signals with this method if theIAC eluate was evaporated and re-dissolved in the mobile phase. Laborato-ries 6, 12, 16, 18 and 19 made comments on the calibration, stating that thenumber of calibration points was exhaustive, while participant 16 had prob-lems to get a sufficient signal for the lowest calibration point. Participant8 noticed a significant PBPB-reagent degradation after two days (smallerpeaks and higher background noise). Only the participant 6 used option B
(all others used option A) due to poor signals. In one case, participant 15,it was stated that two test sample containers contained slightly less than 50g, while one participant 18 used only a fraction of the containers for analysis.
Comparison of all Trial Results
A total of 28 different laboratories participated in at least one of the threetrial studies, while several laboratories participated in more than one trial.As a result fifteen laboratories participated in two of the three trials, while 8laboratories participated in all 3 trial studies (Table 2.31). The AfB1 resultsfrom the fortification experiments (spiked samples) of these eight laboratorieswere extracted and compared for the reported recoveries. The aim of thisprocedure was to determine whether recoveries were random from trial totrial (for each laboratory) or if the recovery was systematically biased. Thedata analysis from fortified material was chosen, since these results wereinfluenced by the overall procedures of the specific laboratory (collaborativetrial method, handling of standard solutions and fortification procedure).
However previous to this between-trial comparison, the impact of thisselective data extraction of the overall results was investigated. Thereforeaverage recoveries (after elimination of outliers) of all laboratories and theone after extraction of the 8 laboratories were compared for each matrix andfortification level. As can be seen in Table 2.32 the obtained recoveries afterthe extraction of the 8 laboratories were not much different from the originalrecoveries.
The recoveries of the selected laboratories (Table 2.32) were plotted foreach matrix and the two spiking levels (Figure 2.34). As can be seen, thematrix had a superior influence on the recovery than the spiking level. Asexpected, for most matrices the average recovery (mean of the 8 laboratories)was better for higher spiking levels (4 µg/kg), than those for lower spikinglevels (1 µg/kg) for paprika powder, pistachio paste, peanut butter and figpaste, as well as infant formula (0.2 µg/kg and 0.1 µg/kg). Neverthelessthese recovery differences were marginal and neglectable compared to theinfluence of the matrix/method.
Spiking levels (low and high) for animal feed were in a similar range

92 CHAPTER 2. RESULTS AND DISCUSSION
ID-1 ID-2 ID-3- 5 N7 - -
3 1 G- 2 B- 10 O
19 - -8 - -14 - -- - J5 - -
1 8 A
6 7 L
12 6 I
17 9 C9 - -2 - E15 - -
4 13 P18 - -20 - -- 11 H
10 12 -
13 3 D16 - -
11 14 M- - K- 4 F
21 - -
Table 2.31: Codes of all trial participants: ID-1=animal feedtrial; ID-2=infant formula trial; ID-3=pistachios-paprika-peanuts-fig trial.
Laboratories that participated in all three trial are highlighted.
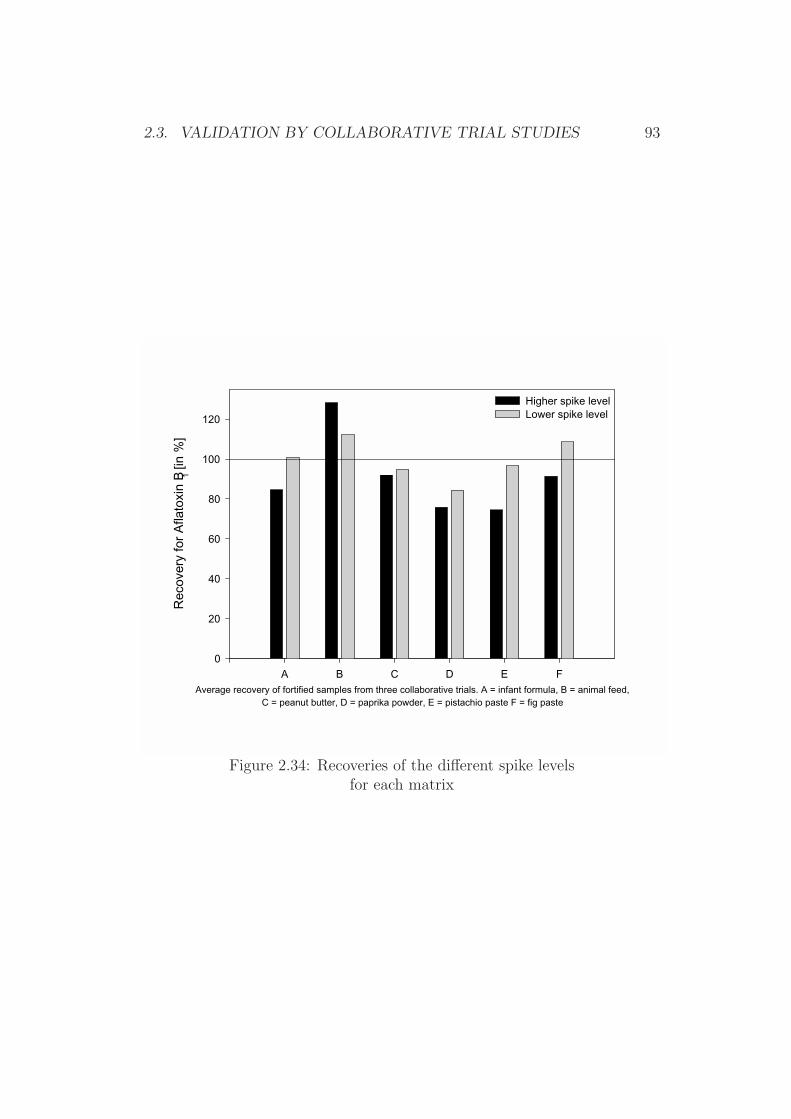
2.3. VALIDATION BY COLLABORATIVE TRIAL STUDIES 93
Figure 2.34: Recoveries of the different spike levelsfor each matrix
Average recovery of fortified samples from three collaborative trials. A = infant formula, B = animal feed,C = peanut butter, D = paprika powder, E = pistachio paste F = fig paste
A B C D E F
Rec
over
y fo
r A
flato
xin
B 1 [in
%]
0
20
40
60
80
100
120
Higher spike levelLower spike level
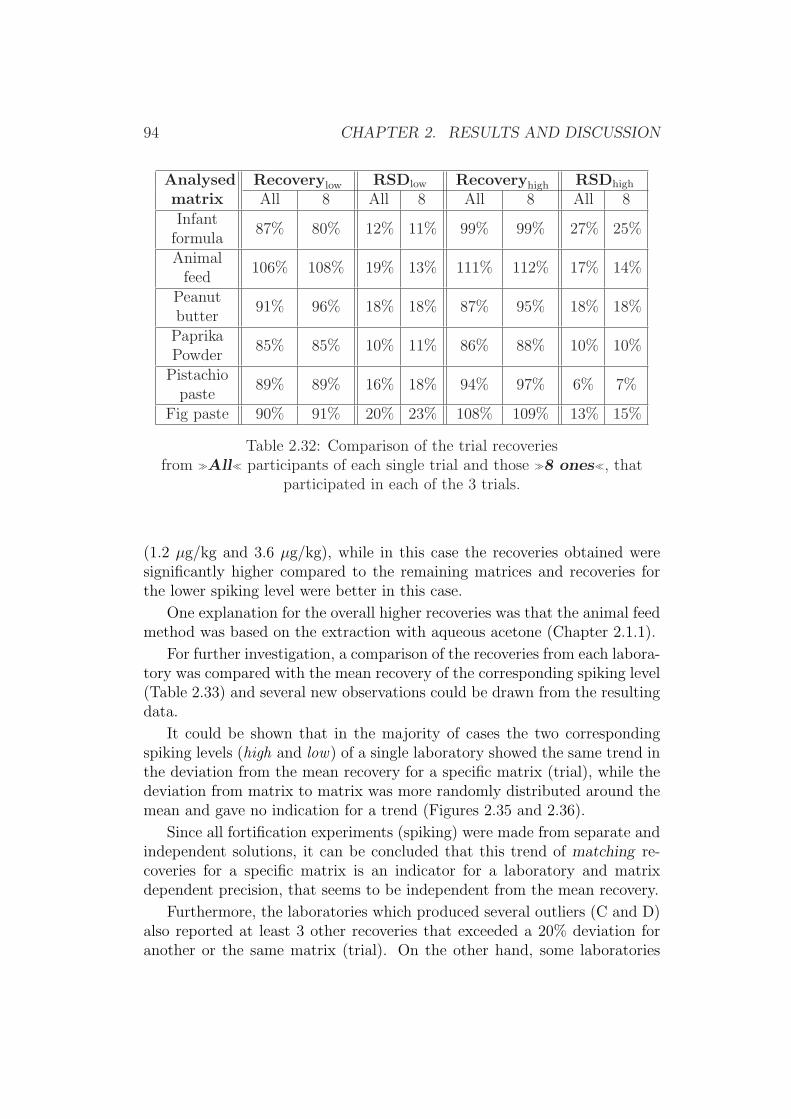
94 CHAPTER 2. RESULTS AND DISCUSSION
Analysedmatrix
Recoverylow RSDlow Recoveryhigh RSDhigh
All 8 All 8 All 8 All 8Infant
formula87% 80% 12% 11% 99% 99% 27% 25%
Animalfeed
106% 108% 19% 13% 111% 112% 17% 14%
Peanutbutter
91% 96% 18% 18% 87% 95% 18% 18%
PaprikaPowder
85% 85% 10% 11% 86% 88% 10% 10%
Pistachiopaste
89% 89% 16% 18% 94% 97% 6% 7%
Fig paste 90% 91% 20% 23% 108% 109% 13% 15%
Table 2.32: Comparison of the trial recoveriesfrom ÀAll¿ participants of each single trial and those À8 ones¿, that
participated in each of the 3 trials.
(1.2 µg/kg and 3.6 µg/kg), while in this case the recoveries obtained weresignificantly higher compared to the remaining matrices and recoveries forthe lower spiking level were better in this case.
One explanation for the overall higher recoveries was that the animal feedmethod was based on the extraction with aqueous acetone (Chapter 2.1.1).
For further investigation, a comparison of the recoveries from each labora-tory was compared with the mean recovery of the corresponding spiking level(Table 2.33) and several new observations could be drawn from the resultingdata.
It could be shown that in the majority of cases the two correspondingspiking levels (high and low) of a single laboratory showed the same trend inthe deviation from the mean recovery for a specific matrix (trial), while thedeviation from matrix to matrix was more randomly distributed around themean and gave no indication for a trend (Figures 2.35 and 2.36).
Since all fortification experiments (spiking) were made from separate andindependent solutions, it can be concluded that this trend of matching re-coveries for a specific matrix is an indicator for a laboratory and matrixdependent precision, that seems to be independent from the mean recovery.
Furthermore, the laboratories which produced several outliers (C and D)also reported at least 3 other recoveries that exceeded a 20% deviation foranother or the same matrix (trial). On the other hand, some laboratories
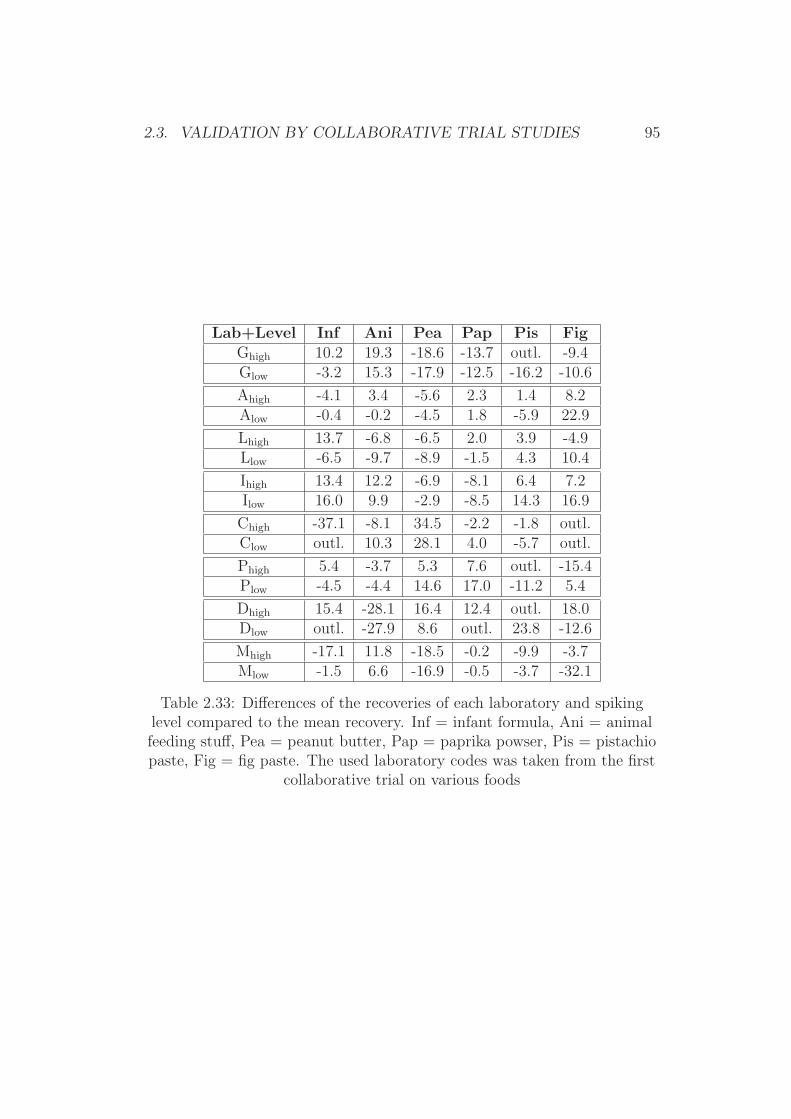
2.3. VALIDATION BY COLLABORATIVE TRIAL STUDIES 95
Lab+Level Inf Ani Pea Pap Pis FigGhigh 10.2 19.3 -18.6 -13.7 outl. -9.4Glow -3.2 15.3 -17.9 -12.5 -16.2 -10.6
Ahigh -4.1 3.4 -5.6 2.3 1.4 8.2Alow -0.4 -0.2 -4.5 1.8 -5.9 22.9
Lhigh 13.7 -6.8 -6.5 2.0 3.9 -4.9Llow -6.5 -9.7 -8.9 -1.5 4.3 10.4
Ihigh 13.4 12.2 -6.9 -8.1 6.4 7.2Ilow 16.0 9.9 -2.9 -8.5 14.3 16.9
Chigh -37.1 -8.1 34.5 -2.2 -1.8 outl.Clow outl. 10.3 28.1 4.0 -5.7 outl.
Phigh 5.4 -3.7 5.3 7.6 outl. -15.4Plow -4.5 -4.4 14.6 17.0 -11.2 5.4
Dhigh 15.4 -28.1 16.4 12.4 outl. 18.0Dlow outl. -27.9 8.6 outl. 23.8 -12.6
Mhigh -17.1 11.8 -18.5 -0.2 -9.9 -3.7Mlow -1.5 6.6 -16.9 -0.5 -3.7 -32.1
Table 2.33: Differences of the recoveries of each laboratory and spikinglevel compared to the mean recovery. Inf = infant formula, Ani = animalfeeding stuff, Pea = peanut butter, Pap = paprika powser, Pis = pistachiopaste, Fig = fig paste. The used laboratory codes was taken from the first
collaborative trial on various foods
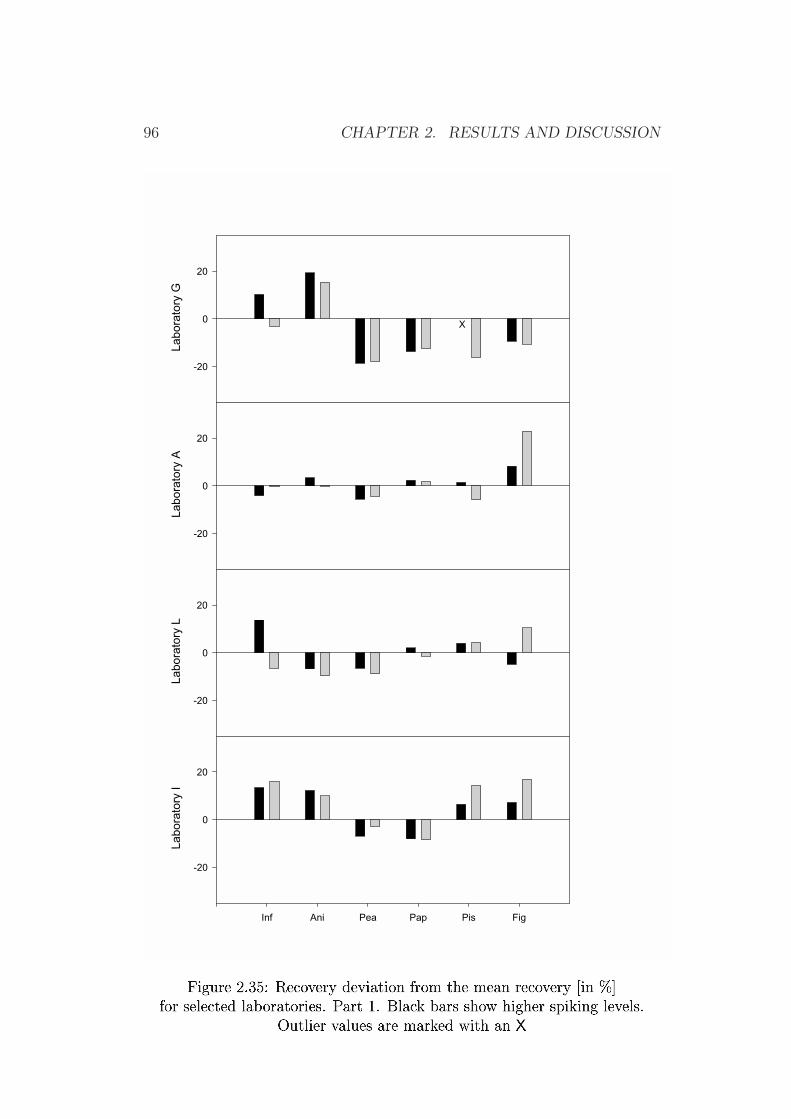
Labo
rato
ry G
-20
0
20
Labo
rato
ry A
-20
0
20
Labo
rato
ry L
-20
0
20
Inf Ani Pea Pap Pis Fig
Labo
rato
ry I
-20
0
20
X
Figure 2.35: Recovery deviation from the mean recovery [in %]
for selected laboratories. Part 1. Black bars show higher spiking levels.
Outlier values are marked with an X
96 CHAPTER 2. RESULTS AND DISCUSSION
Figure 2.35: Recovery deviation from the mean recovery [in %]for selected laboratories. Part 1. Black bars show higher spiking levels.
Outlier values are marked with an X
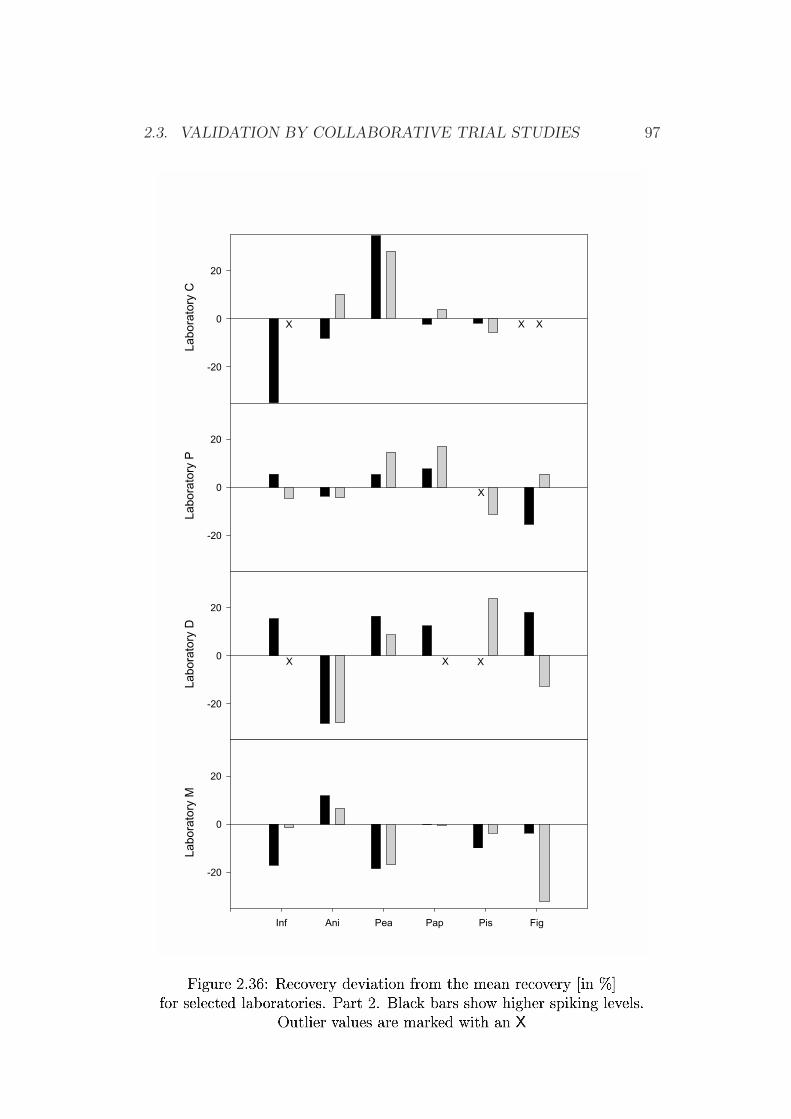
Labo
rato
ry C
-20
0
20
Labo
rato
ry P
-20
0
20
Labo
rato
ry D
-20
0
20
Inf Ani Pea Pap Pis Fig
Labo
rato
ry M
-20
0
20
X X X
X
X X X
Figure 2.36: Recovery deviation from the mean recovery [in %]
for selected laboratories. Part 2. Black bars show higher spiking levels.
Outlier values are marked with an X
2.3. VALIDATION BY COLLABORATIVE TRIAL STUDIES 97
Figure 2.36: Recovery deviation from the mean recovery [in %]for selected laboratories. Part 2. Black bars show higher spiking levels.
Outlier values are marked with an X
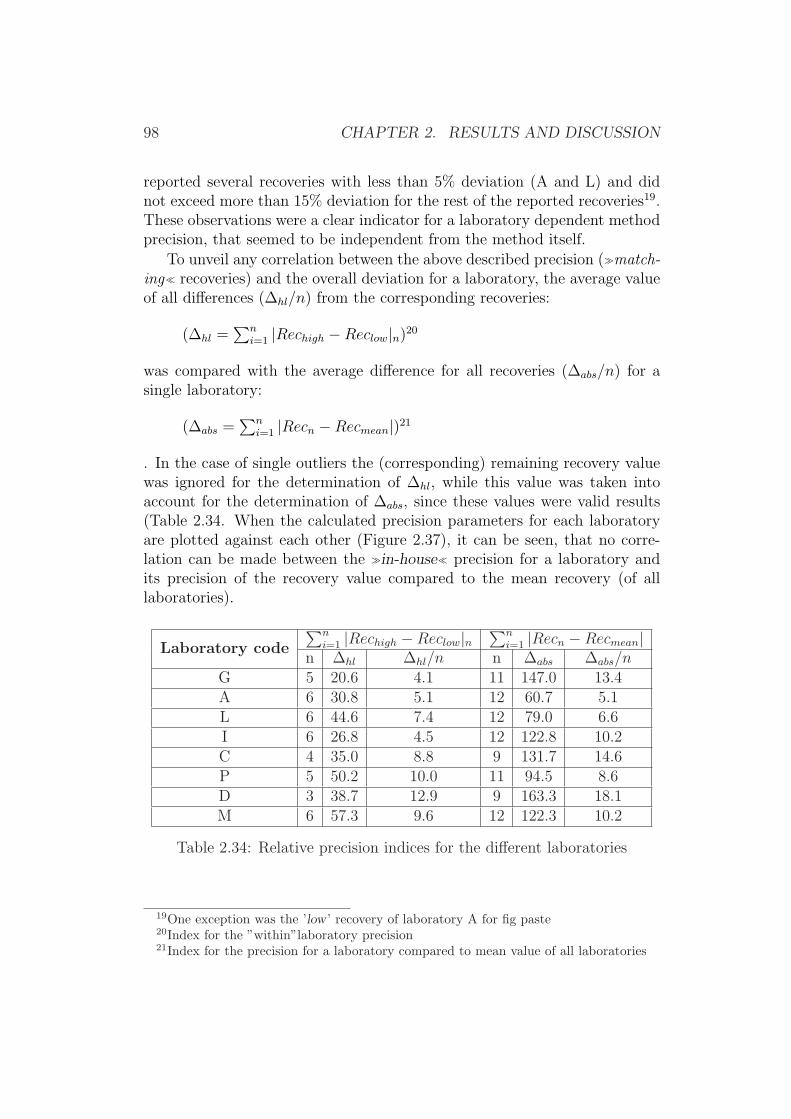
98 CHAPTER 2. RESULTS AND DISCUSSION
reported several recoveries with less than 5% deviation (A and L) and didnot exceed more than 15% deviation for the rest of the reported recoveries19.These observations were a clear indicator for a laboratory dependent methodprecision, that seemed to be independent from the method itself.
To unveil any correlation between the above described precision (Àmatch-ing¿ recoveries) and the overall deviation for a laboratory, the average valueof all differences (∆hl/n) from the corresponding recoveries:
(∆hl =∑n
i=1 |Rechigh −Reclow|n)20
was compared with the average difference for all recoveries (∆abs/n) for asingle laboratory:
(∆abs =∑n
i=1 |Recn −Recmean|)21
. In the case of single outliers the (corresponding) remaining recovery valuewas ignored for the determination of ∆hl, while this value was taken intoaccount for the determination of ∆abs, since these values were valid results(Table 2.34. When the calculated precision parameters for each laboratoryare plotted against each other (Figure 2.37), it can be seen, that no corre-lation can be made between the Àin-house¿ precision for a laboratory andits precision of the recovery value compared to the mean recovery (of alllaboratories).
Laboratory code
∑ni=1 |Rechigh −Reclow|n
∑ni=1 |Recn −Recmean|
n ∆hl ∆hl/n n ∆abs ∆abs/nG 5 20.6 4.1 11 147.0 13.4A 6 30.8 5.1 12 60.7 5.1L 6 44.6 7.4 12 79.0 6.6I 6 26.8 4.5 12 122.8 10.2C 4 35.0 8.8 9 131.7 14.6P 5 50.2 10.0 11 94.5 8.6D 3 38.7 12.9 9 163.3 18.1M 6 57.3 9.6 12 122.3 10.2
Table 2.34: Relative precision indices for the different laboratories
19One exception was the ’low ’ recovery of laboratory A for fig paste20Index for the ”within”laboratory precision21Index for the precision for a laboratory compared to mean value of all laboratories

Relative "within" laboratory precision index
2 4 6 8 10 12 14
Rel
ativ
e pr
ecis
ion
inde
x co
mpa
red
to th
e m
ean
4
6
8
10
12
14
16
18
20
G
A
L
I
C
P
D
M
Figure 2.37: Correlation of the calculated precision
parameters from Table 2.34
2.3. VALIDATION BY COLLABORATIVE TRIAL STUDIES 99
Figure 2.37: Correlation of the calculated precisionparameters from Table 2.34
100 CHAPTER 2. RESULTS AND DISCUSSION
To summarize, it can be said that no trend in the results from matrixto matrix was observed for any laboratory, while for the discussed preci-sion data no correlation was found within the selected group of laboratories.However, it was revealed that differences in the precision between laborato-ries existed, and that the number of outliers was found to be an indicator forthe performance of the remaining valid data within the laboratory group.
2.4 Development of Simplified Densitometers
2.4.1 Background
Several methods for the determination of aflatoxins after TLC-separationare available and commonly used depending on the availability of technicalequipment. The far most easiest method is the previously described visualjudgment under UV-light (Chapter 2.2.1). This technique requires a mercurylamp with an emission of 366 nm22. However, results strongly depend on thevisual skills of the analyst. Another drawback of this detection approach isthat no documentation such as a densitogram or photograph is available tosupport the results if needed later on.
The alternative to visual judgment of spot intensities is the densitometricdetermination of the aflatoxin spots on the TLC-plate. Densitometry allowsto measure the fluorescence of aflatoxins under UV-light in transmission orreflection mode. Modern aflatoxin densitometry uses exclusively fluorescencereflection for measurement, since the transmission mode requires transparentTLC-plates.
Nowadays, commercially available fluorescence densitometers have beendeveloped to state-of-the-art products with excellent performance charac-teristics concerning precision, data resolution and flexibility. However suchinstruments are rather bulky (due to the broad applicability for most TLCapplications) and depend on connection to the mains. Therefore a new devicehas been developed with the intention to deliver a simplified, inexpensive andprecise alternative to commercially available TLC densitometers.
The main approach was to substitute the currently used components suchas mercury gas tubes and photomultiplier with state-of-the-art semiconduc-tors. The most recent availability of light emitting diodes (LED) with a peakwavelengh of 370 nm initiated the first considerations of a miniaturised low-power densitometer. In the past several approaches have already been madeto elaborate and validate means for the fluorescence determination on TLCplates with commercially available or simple prototype apparatus [147–154],
22Maximum excitation wavelenght for aflatoxins
2.4. DEVELOPMENT OF SIMPLIFIED DENSITOMETERS 101
while some more recent approaches considered high tech laser applicationsfor the determination of aflatoxins on TLC plates [155, 156].
However, lasers are still fairly expensive instruments [157] although avail-able in small, which makes them undesirable for the goals described here.Impressive results have been achieved by simple means with so-called Àspot-meter¿ prototypes [147, 148] that even used simple photoresistors and mer-cury lamps for fluorescence measurement. These devices were simple in itsconstruction and dedicated to determine the fluorescence with a probe thatwas positioned over the aflatoxin spot. Spots as low as 1 ng were recorded.However all ’spotmeters ’ measured the fluorescence by transmission on theTLC-plate, which was induced by mercury gas tubes.
More recently, with the availability of modern photographic and computerequipment, the use of digital cameras or common office scanners has beendescribed for the use of TLC measurements [105, 158, 159].
2.4.2 General Requirements for Aflatoxin Densitome-ters
One of the most important requirements for any aflatoxin densitometer al-ternative is the applicability in view of current legislative limits. Thereforeany device must have a sufficiently low limit of detection (LOD) and limitof quantification (LOQ) in combination with an appropriate TLC method).Furthermore the device must deliver reproducible and stable signals, thusno significant drift or fade of the signal23 shall influence the measurement.Additional features such as simplicity, low power consumption or low pro-duction costs were highly desired for these alternatives.
2.4.3 Development of a Semiconductor based Densit-ometer Cell
The implementation of the novel UV-LED (peak emission at 370 [nm]) wasan exceptional approach, since no other commonly available alternative tomercury lamps exist for the excitation of aflatoxins at the desired wavelength(Figure 2.3824).
In addition, the substitution of the photomultiplier usually utilized wasnecessary in order to miniaturise and reduce the power consumption of thedevice. The only appropriate sensor was found to be a novel photo-diode
23e.g. degradation of the aflatoxins during the measurement24Reprint with permission of Alex Ryer, International Light
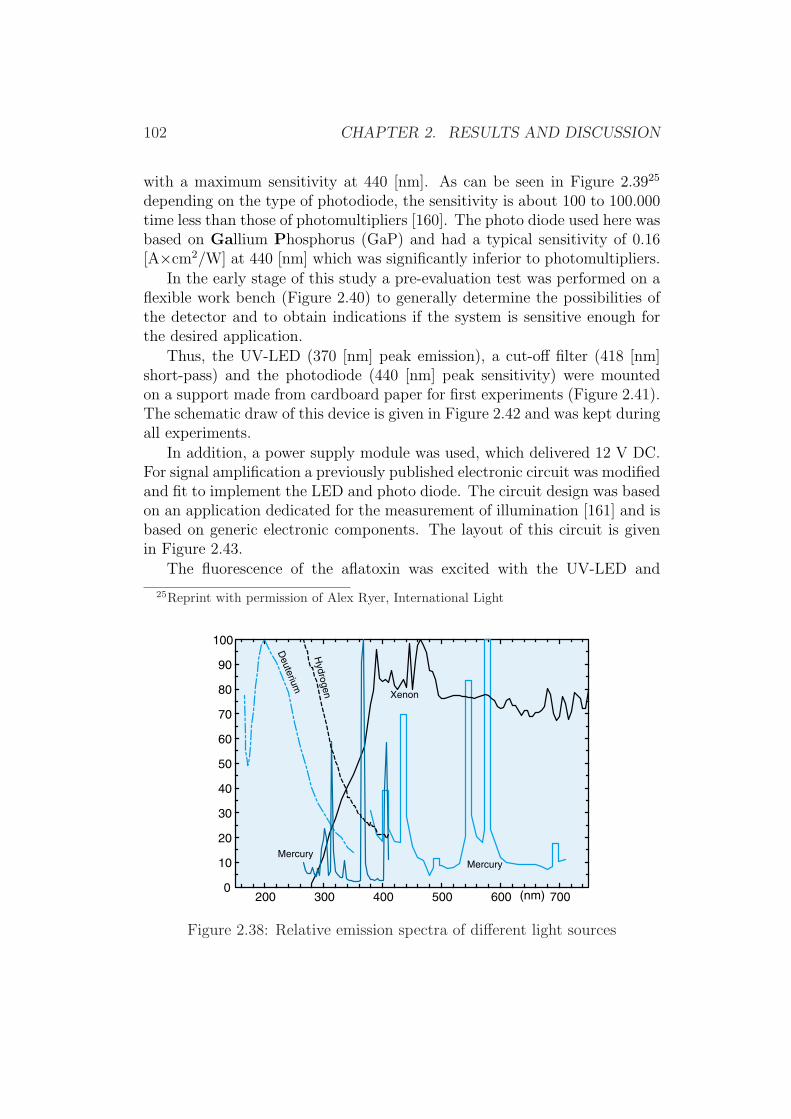
102 CHAPTER 2. RESULTS AND DISCUSSION
with a maximum sensitivity at 440 [nm]. As can be seen in Figure 2.3925
depending on the type of photodiode, the sensitivity is about 100 to 100.000time less than those of photomultipliers [160]. The photo diode used here wasbased on Gallium Phosphorus (GaP) and had a typical sensitivity of 0.16[A×cm2/W] at 440 [nm] which was significantly inferior to photomultipliers.
In the early stage of this study a pre-evaluation test was performed on aflexible work bench (Figure 2.40) to generally determine the possibilities ofthe detector and to obtain indications if the system is sensitive enough forthe desired application.
Thus, the UV-LED (370 [nm] peak emission), a cut-off filter (418 [nm]short-pass) and the photodiode (440 [nm] peak sensitivity) were mountedon a support made from cardboard paper for first experiments (Figure 2.41).The schematic draw of this device is given in Figure 2.42 and was kept duringall experiments.
In addition, a power supply module was used, which delivered 12 V DC.For signal amplification a previously published electronic circuit was modifiedand fit to implement the LED and photo diode. The circuit design was basedon an application dedicated for the measurement of illumination [161] and isbased on generic electronic components. The layout of this circuit is givenin Figure 2.43.
The fluorescence of the aflatoxin was excited with the UV-LED and
25Reprint with permission of Alex Ryer, International Light
Figure 2.38: Relative emission spectra of different light sources
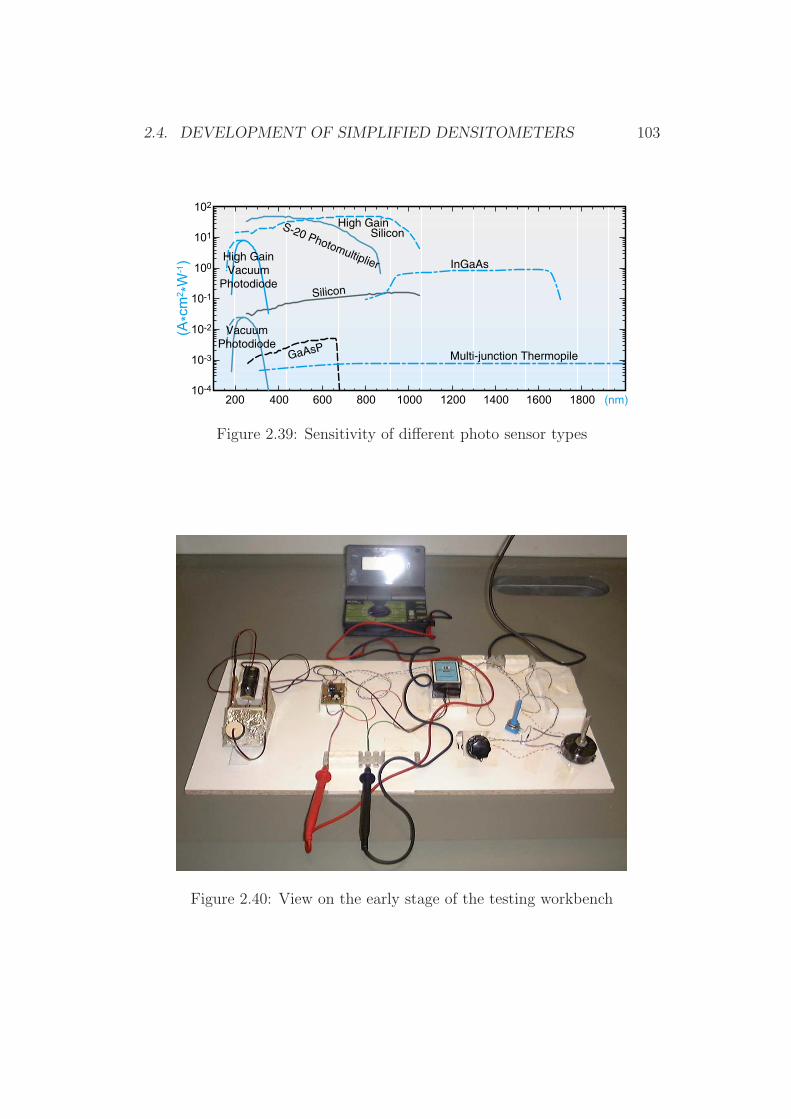
2.4. DEVELOPMENT OF SIMPLIFIED DENSITOMETERS 103
Figure 2.39: Sensitivity of different photo sensor types
Figure 2.40: View on the early stage of the testing workbench

104 CHAPTER 2. RESULTS AND DISCUSSION
Figure 2.41: View on an early prototype of the SeBaDeC
L E D P h o to d io d e
C u t-o ff filte r
W in d o w
A fla to x in sp o t
E xc ita tionE m iss ion
Figure 2.42: Schematic draw of the SeBaDeC
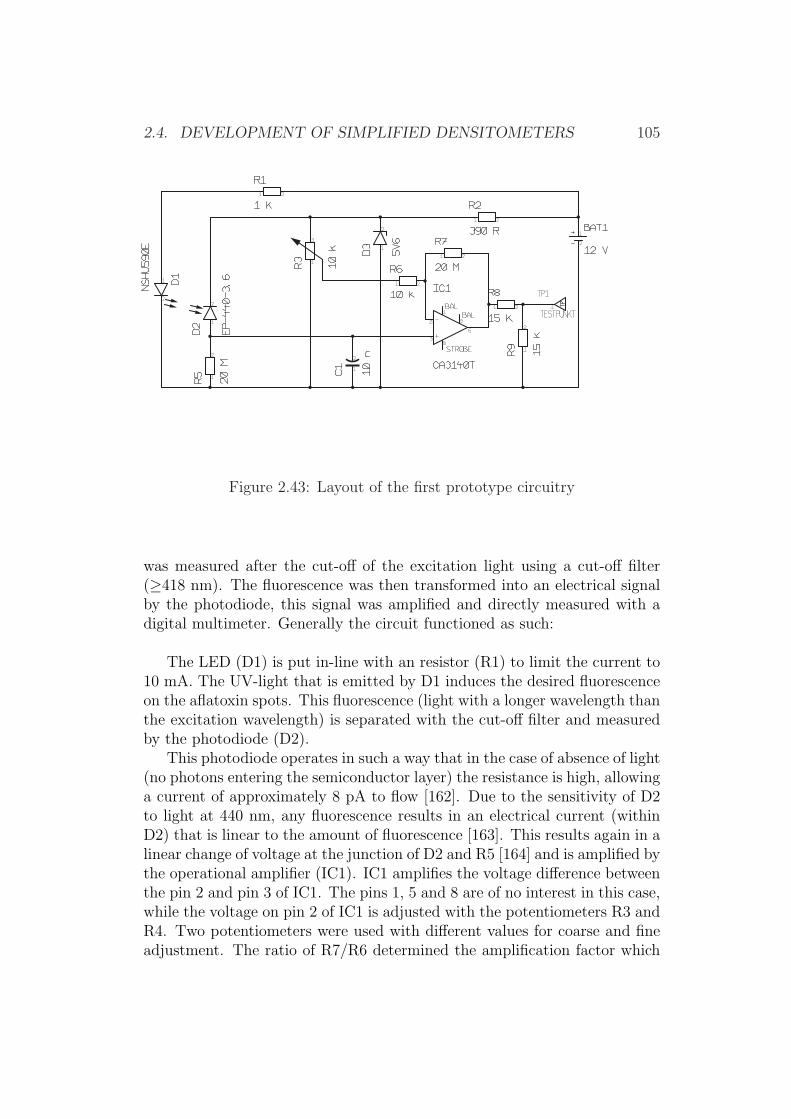
2.4. DEVELOPMENT OF SIMPLIFIED DENSITOMETERS 105
Figure 2.43: Layout of the first prototype circuitry
was measured after the cut-off of the excitation light using a cut-off filter(≥418 nm). The fluorescence was then transformed into an electrical signalby the photodiode, this signal was amplified and directly measured with adigital multimeter. Generally the circuit functioned as such:
The LED (D1) is put in-line with an resistor (R1) to limit the current to10 mA. The UV-light that is emitted by D1 induces the desired fluorescenceon the aflatoxin spots. This fluorescence (light with a longer wavelength thanthe excitation wavelength) is separated with the cut-off filter and measuredby the photodiode (D2).
This photodiode operates in such a way that in the case of absence of light(no photons entering the semiconductor layer) the resistance is high, allowinga current of approximately 8 pA to flow [162]. Due to the sensitivity of D2to light at 440 nm, any fluorescence results in an electrical current (withinD2) that is linear to the amount of fluorescence [163]. This results again in alinear change of voltage at the junction of D2 and R5 [164] and is amplified bythe operational amplifier (IC1). IC1 amplifies the voltage difference betweenthe pin 2 and pin 3 of IC1. The pins 1, 5 and 8 are of no interest in this case,while the voltage on pin 2 of IC1 is adjusted with the potentiometers R3 andR4. Two potentiometers were used with different values for coarse and fineadjustment. The ratio of R7/R6 determined the amplification factor which

106 CHAPTER 2. RESULTS AND DISCUSSION
was 2000 in this example. On pin 6 the amplified signal was divided by theresistors R8 and R9 and directly displayed on an attached digital multimeter(DMM).
First experiments with this construction (Figure 2.41) indicated thatamounts of 5 ng of aflatoxin B1 yielded in definite signals on the DMM.This gave a strong indication that with further improvements of the detectorcell design and the electronic circuits, it should be possible to detect smalleramounts. Furthermore, the data of the preliminary experiments indicatedthat measurements were highly influenced by smallest amounts of scatteringlight in a dark room, as well as the natural electrical field of the operator’shand. Hence any movement of the operator influenced the signal. To elimi-nate these unwanted effects a fully light and electrical field shielded detectorcell was considered be crucial for further experiments. Therefore such a dis-crete metal container (hosting the UV-LED, the photodiode and the cut-offfilter) was made. In addition, the wiring from the detector cell to the ampli-fier was made with shielded cables in addition. In order to allow a reliableand easy data processing, the amplified signal was directly converted intodigital data with a simple analogue-digital-converter (ADC) in combinationwith an easily understandable software [165]. The origin of this hardware-software combination (ADC) was subject to a submission for a contest in1998 and thus was fully described. The author of the software approved thefree use without any restrictions. This set-up allowed direct data recordingto the parallel port of a PC. The circuit layout of this preliminary version isshown in Figure 2.44 and functions as follows:
The LED D1 was operated in series with R1 and powered by a constantvoltage controlled by IC9. IC9 is a variable voltage controller and can beadjusted by the potentiometer R26. The zener -diode D10 and R2 functionas a voltage stabiliser on the input segment of IC1.
The amplified signal was divided to fit to a range of 0 - 5 V by thepotentiometer R23. This output signal of maximum 5 V was then convertedinto digital data by the IC3 (ADC). The diode pair D7 and D8 guaranteedthat the voltage on the analogue input of IC3 (pin2) does not exceed 5 Vduring the calibration process to protect IC3. A more detailed descriptionof the circuit can be found in [161, 165].
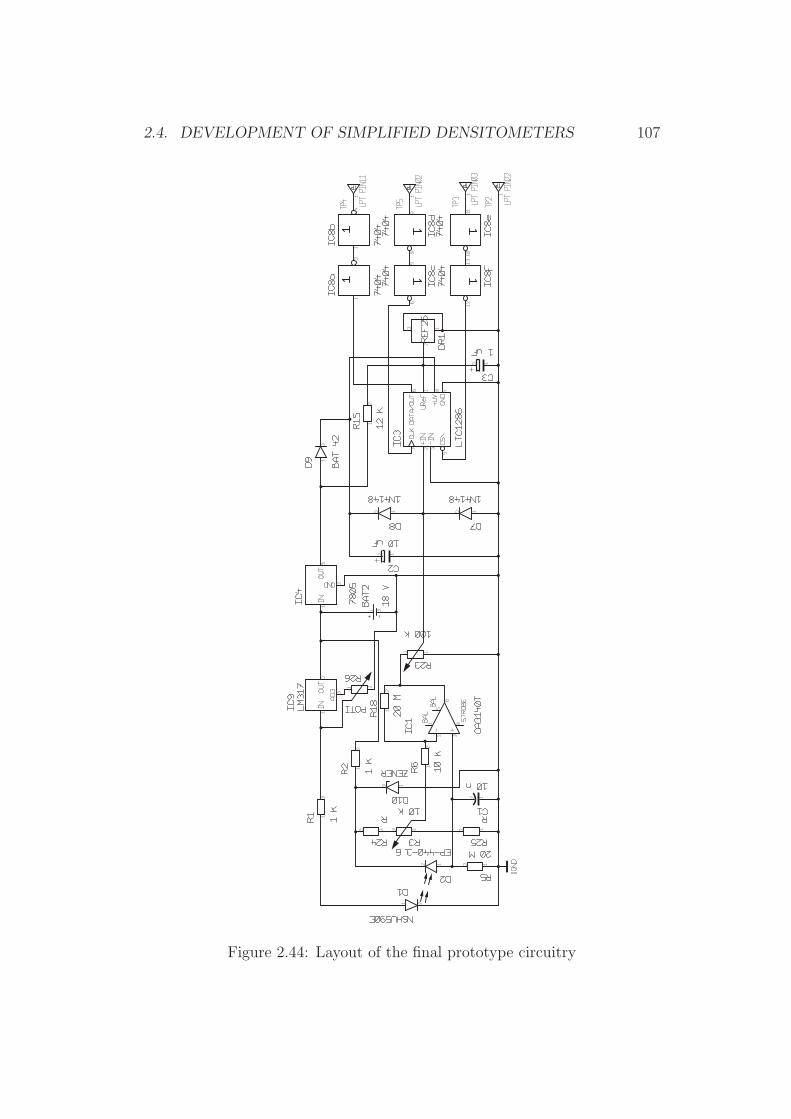
2.4. DEVELOPMENT OF SIMPLIFIED DENSITOMETERS 107
Figure 2.44: Layout of the final prototype circuitry
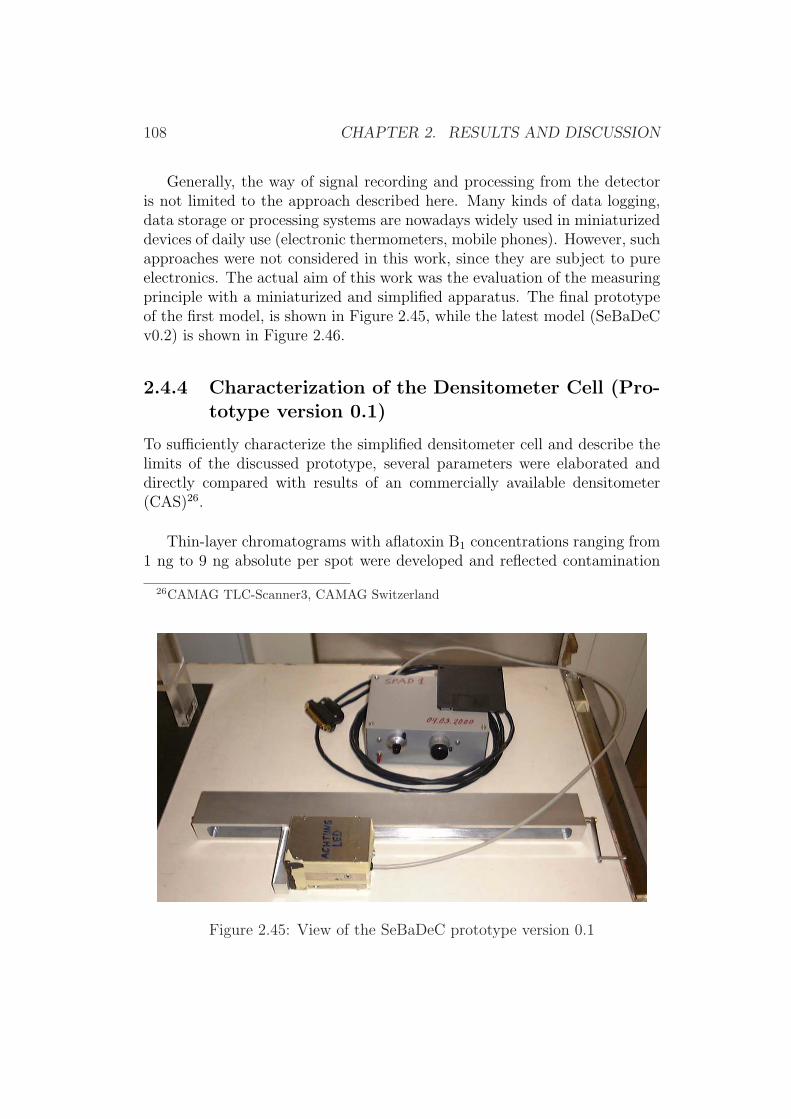
108 CHAPTER 2. RESULTS AND DISCUSSION
Generally, the way of signal recording and processing from the detectoris not limited to the approach described here. Many kinds of data logging,data storage or processing systems are nowadays widely used in miniaturizeddevices of daily use (electronic thermometers, mobile phones). However, suchapproaches were not considered in this work, since they are subject to pureelectronics. The actual aim of this work was the evaluation of the measuringprinciple with a miniaturized and simplified apparatus. The final prototypeof the first model, is shown in Figure 2.45, while the latest model (SeBaDeCv0.2) is shown in Figure 2.46.
2.4.4 Characterization of the Densitometer Cell (Pro-totype version 0.1)
To sufficiently characterize the simplified densitometer cell and describe thelimits of the discussed prototype, several parameters were elaborated anddirectly compared with results of an commercially available densitometer(CAS)26.
Thin-layer chromatograms with aflatoxin B1 concentrations ranging from1 ng to 9 ng absolute per spot were developed and reflected contamination
26CAMAG TLC-Scanner3, CAMAG Switzerland
Figure 2.45: View of the SeBaDeC prototype version 0.1
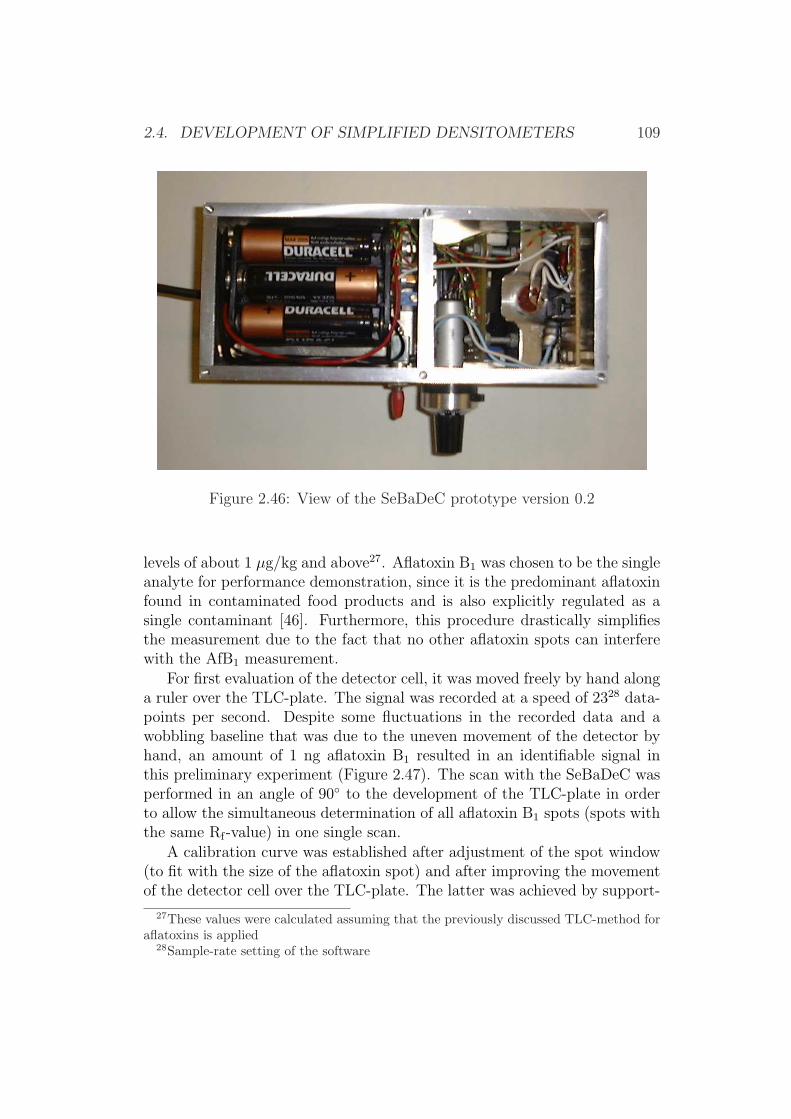
2.4. DEVELOPMENT OF SIMPLIFIED DENSITOMETERS 109
Figure 2.46: View of the SeBaDeC prototype version 0.2
levels of about 1 µg/kg and above27. Aflatoxin B1 was chosen to be the singleanalyte for performance demonstration, since it is the predominant aflatoxinfound in contaminated food products and is also explicitly regulated as asingle contaminant [46]. Furthermore, this procedure drastically simplifiesthe measurement due to the fact that no other aflatoxin spots can interferewith the AfB1 measurement.
For first evaluation of the detector cell, it was moved freely by hand alonga ruler over the TLC-plate. The signal was recorded at a speed of 2328 data-points per second. Despite some fluctuations in the recorded data and awobbling baseline that was due to the uneven movement of the detector byhand, an amount of 1 ng aflatoxin B1 resulted in an identifiable signal inthis preliminary experiment (Figure 2.47). The scan with the SeBaDeC wasperformed in an angle of 90 to the development of the TLC-plate in orderto allow the simultaneous determination of all aflatoxin B1 spots (spots withthe same Rf-value) in one single scan.
A calibration curve was established after adjustment of the spot window(to fit with the size of the aflatoxin spot) and after improving the movementof the detector cell over the TLC-plate. The latter was achieved by support-
27These values were calculated assuming that the previously discussed TLC-method foraflatoxins is applied
28Sample-rate setting of the software
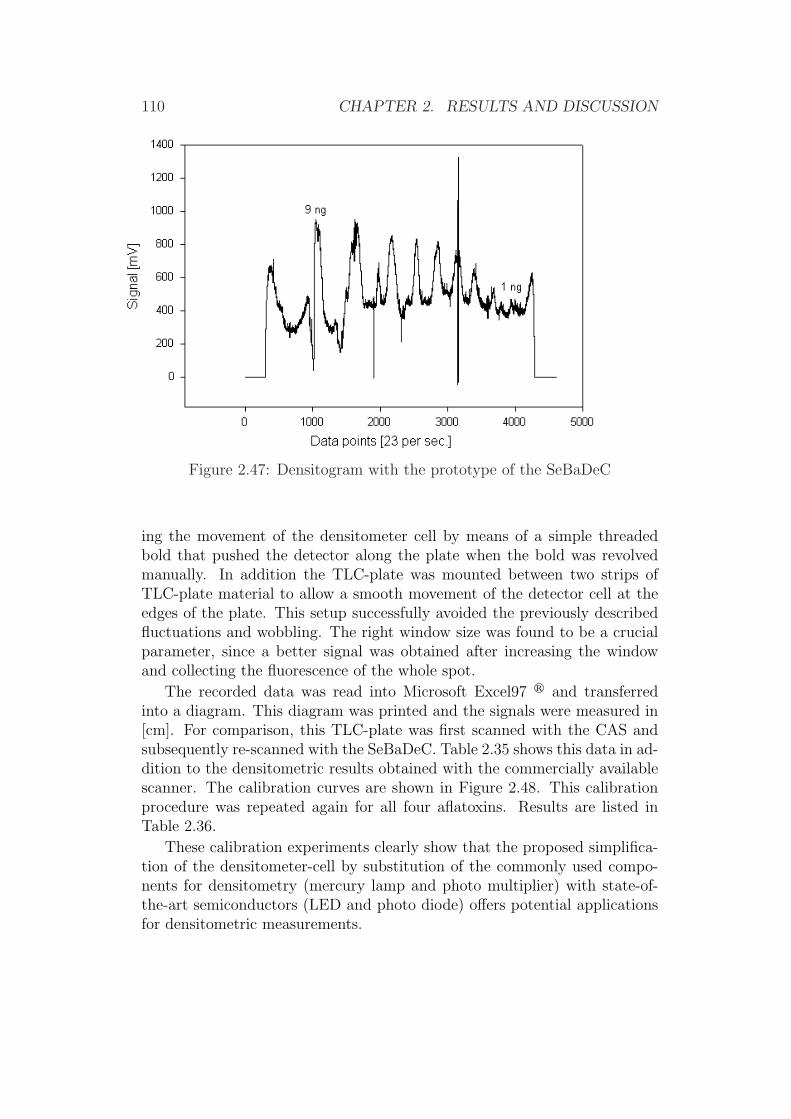
110 CHAPTER 2. RESULTS AND DISCUSSION
Figure 2.47: Densitogram with the prototype of the SeBaDeC
ing the movement of the densitometer cell by means of a simple threadedbold that pushed the detector along the plate when the bold was revolvedmanually. In addition the TLC-plate was mounted between two strips ofTLC-plate material to allow a smooth movement of the detector cell at theedges of the plate. This setup successfully avoided the previously describedfluctuations and wobbling. The right window size was found to be a crucialparameter, since a better signal was obtained after increasing the windowand collecting the fluorescence of the whole spot.
The recorded data was read into Microsoft Excel97 r and transferredinto a diagram. This diagram was printed and the signals were measured in[cm]. For comparison, this TLC-plate was first scanned with the CAS andsubsequently re-scanned with the SeBaDeC. Table 2.35 shows this data in ad-dition to the densitometric results obtained with the commercially availablescanner. The calibration curves are shown in Figure 2.48. This calibrationprocedure was repeated again for all four aflatoxins. Results are listed inTable 2.36.
These calibration experiments clearly show that the proposed simplifica-tion of the densitometer-cell by substitution of the commonly used compo-nents for densitometry (mercury lamp and photo multiplier) with state-of-the-art semiconductors (LED and photo diode) offers potential applicationsfor densitometric measurements.

Amount of aflatoxin B1 spotted on the TLC-plate [ng]0 2 4 6 8 10
Sig
nal
0
100
200
300
400
500
SeBaDeC
CAS
Figure 2.48: Comparison of calibration data from CAS and SeBaDeC
2.4. DEVELOPMENT OF SIMPLIFIED DENSITOMETERS 111
ng AfB1 CAS SeBaDeC
1 44.9 1.42 92.5 2.03 136 3.44 177.2 4.05 219.1 5.26 264.5 5.77 312.9 6.58 360.3 7.69 401.6 8.9
Correlation (r=) 0.9998 0.9961LOD [ng] 0.4 1.5LOQ [ng] 0.5 2.2
Table 2.35: Comparison of AfB1 calibration resultsfor the CAS and SeBaDeC
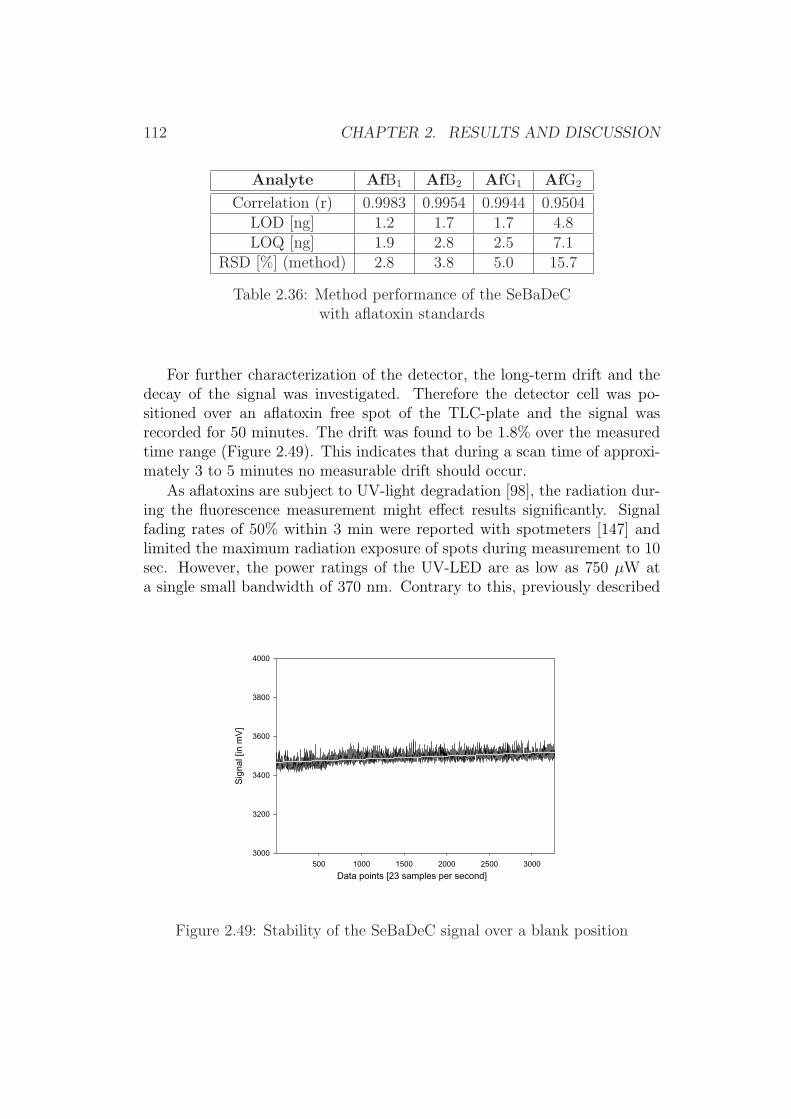
112 CHAPTER 2. RESULTS AND DISCUSSION
Analyte AfB1 AfB2 AfG1 AfG2
Correlation (r) 0.9983 0.9954 0.9944 0.9504LOD [ng] 1.2 1.7 1.7 4.8LOQ [ng] 1.9 2.8 2.5 7.1
RSD [%] (method) 2.8 3.8 5.0 15.7
Table 2.36: Method performance of the SeBaDeCwith aflatoxin standards
For further characterization of the detector, the long-term drift and thedecay of the signal was investigated. Therefore the detector cell was po-sitioned over an aflatoxin free spot of the TLC-plate and the signal wasrecorded for 50 minutes. The drift was found to be 1.8% over the measuredtime range (Figure 2.49). This indicates that during a scan time of approxi-mately 3 to 5 minutes no measurable drift should occur.
As aflatoxins are subject to UV-light degradation [98], the radiation dur-ing the fluorescence measurement might effect results significantly. Signalfading rates of 50% within 3 min were reported with spotmeters [147] andlimited the maximum radiation exposure of spots during measurement to 10sec. However, the power ratings of the UV-LED are as low as 750 µW ata single small bandwidth of 370 nm. Contrary to this, previously described
Figure 2.49: Stability of the SeBaDeC signal over a blank position
Data points [23 samples per second]500 1000 1500 2000 2500 3000
Sig
nal [
in m
V]
3000
3200
3400
3600
3800
4000
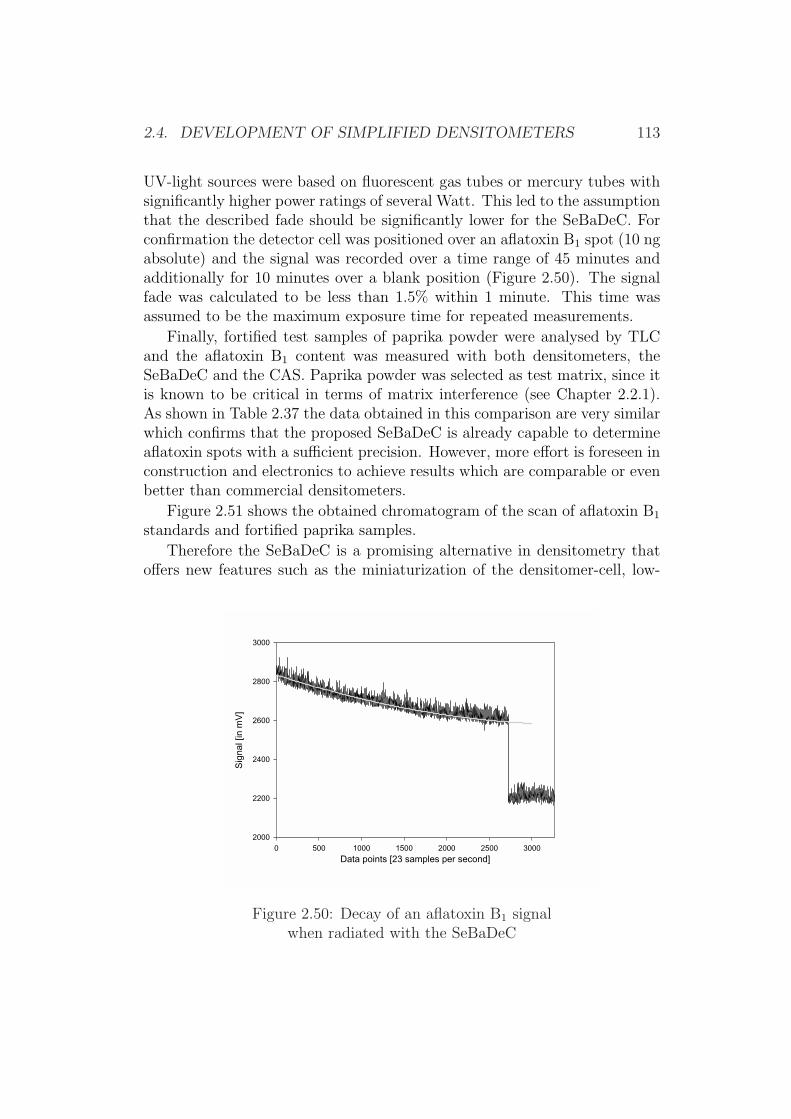
2.4. DEVELOPMENT OF SIMPLIFIED DENSITOMETERS 113
UV-light sources were based on fluorescent gas tubes or mercury tubes withsignificantly higher power ratings of several Watt. This led to the assumptionthat the described fade should be significantly lower for the SeBaDeC. Forconfirmation the detector cell was positioned over an aflatoxin B1 spot (10 ngabsolute) and the signal was recorded over a time range of 45 minutes andadditionally for 10 minutes over a blank position (Figure 2.50). The signalfade was calculated to be less than 1.5% within 1 minute. This time wasassumed to be the maximum exposure time for repeated measurements.
Finally, fortified test samples of paprika powder were analysed by TLCand the aflatoxin B1 content was measured with both densitometers, theSeBaDeC and the CAS. Paprika powder was selected as test matrix, since itis known to be critical in terms of matrix interference (see Chapter 2.2.1).As shown in Table 2.37 the data obtained in this comparison are very similarwhich confirms that the proposed SeBaDeC is already capable to determineaflatoxin spots with a sufficient precision. However, more effort is foreseen inconstruction and electronics to achieve results which are comparable or evenbetter than commercial densitometers.
Figure 2.51 shows the obtained chromatogram of the scan of aflatoxin B1
standards and fortified paprika samples.
Therefore the SeBaDeC is a promising alternative in densitometry thatoffers new features such as the miniaturization of the densitomer-cell, low-
Figure 2.50: Decay of an aflatoxin B1 signalwhen radiated with the SeBaDeC
Data points [23 samples per second]0 500 1000 1500 2000 2500 3000
Sig
nal [
in m
V]
2000
2200
2400
2600
2800
3000
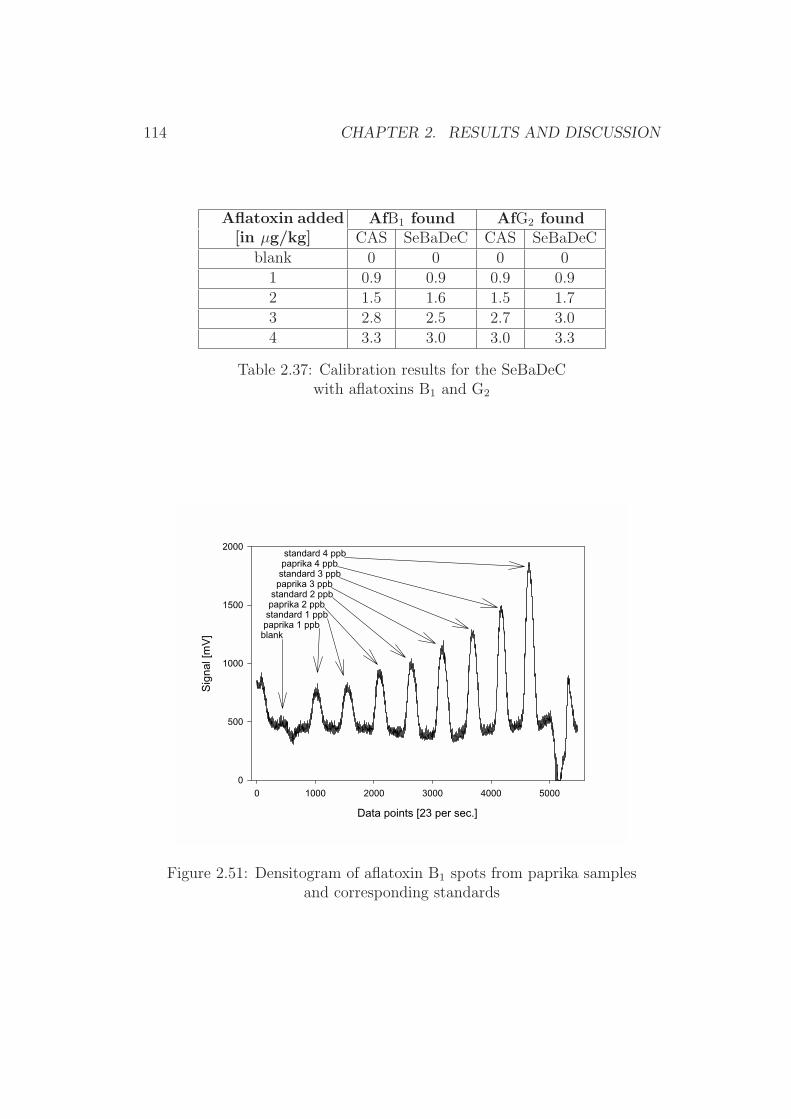
114 CHAPTER 2. RESULTS AND DISCUSSION
Aflatoxin added[in µg/kg]
AfB1 found AfG2 foundCAS SeBaDeC CAS SeBaDeC
blank 0 0 0 01 0.9 0.9 0.9 0.92 1.5 1.6 1.5 1.73 2.8 2.5 2.7 3.04 3.3 3.0 3.0 3.3
Table 2.37: Calibration results for the SeBaDeCwith aflatoxins B1 and G2
Figure 2.51: Densitogram of aflatoxin B1 spots from paprika samplesand corresponding standards
Data points [23 per sec.]
0 1000 2000 3000 4000 5000
Sig
nal [
mV
]
0
500
1000
1500
2000 standard 4 ppb paprika 4 ppb standard 3 ppb paprika 3 ppb standard 2 ppb paprika 2 ppb standard 1 ppb paprika 1 ppbblank
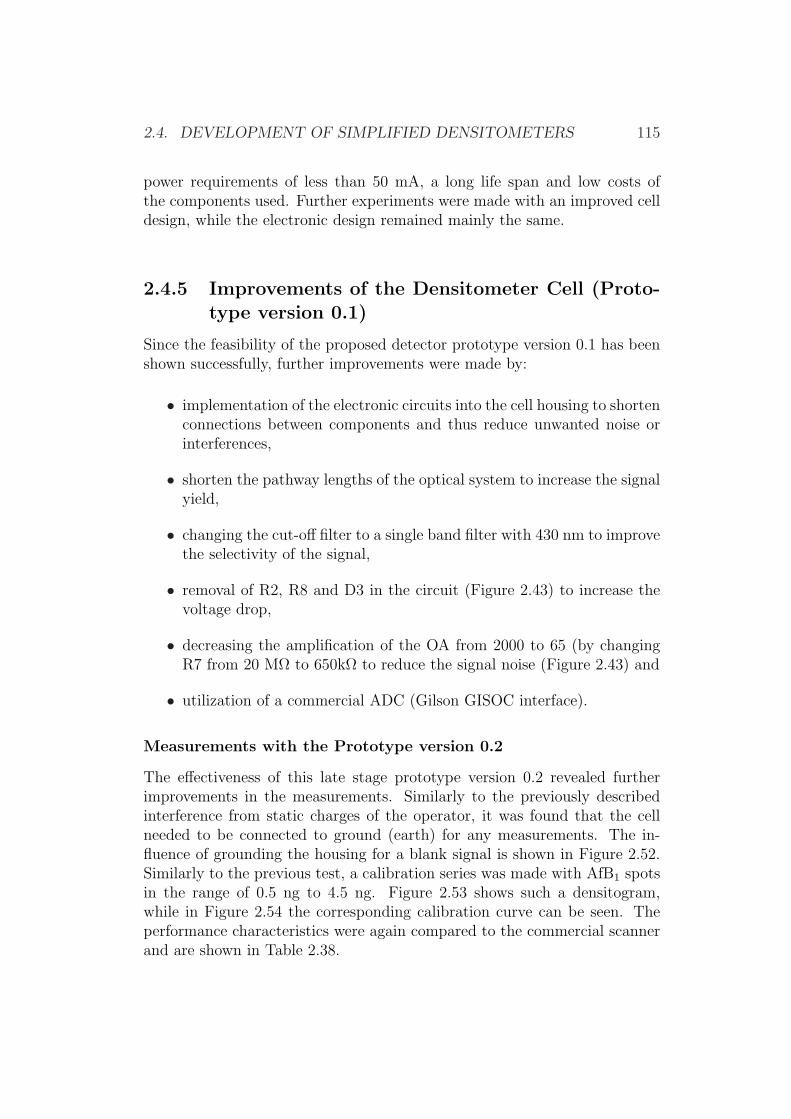
2.4. DEVELOPMENT OF SIMPLIFIED DENSITOMETERS 115
power requirements of less than 50 mA, a long life span and low costs ofthe components used. Further experiments were made with an improved celldesign, while the electronic design remained mainly the same.
2.4.5 Improvements of the Densitometer Cell (Proto-type version 0.1)
Since the feasibility of the proposed detector prototype version 0.1 has beenshown successfully, further improvements were made by:
• implementation of the electronic circuits into the cell housing to shortenconnections between components and thus reduce unwanted noise orinterferences,
• shorten the pathway lengths of the optical system to increase the signalyield,
• changing the cut-off filter to a single band filter with 430 nm to improvethe selectivity of the signal,
• removal of R2, R8 and D3 in the circuit (Figure 2.43) to increase thevoltage drop,
• decreasing the amplification of the OA from 2000 to 65 (by changingR7 from 20 MΩ to 650kΩ to reduce the signal noise (Figure 2.43) and
• utilization of a commercial ADC (Gilson GISOC interface).
Measurements with the Prototype version 0.2
The effectiveness of this late stage prototype version 0.2 revealed furtherimprovements in the measurements. Similarly to the previously describedinterference from static charges of the operator, it was found that the cellneeded to be connected to ground (earth) for any measurements. The in-fluence of grounding the housing for a blank signal is shown in Figure 2.52.Similarly to the previous test, a calibration series was made with AfB1 spotsin the range of 0.5 ng to 4.5 ng. Figure 2.53 shows such a densitogram,while in Figure 2.54 the corresponding calibration curve can be seen. Theperformance characteristics were again compared to the commercial scannerand are shown in Table 2.38.
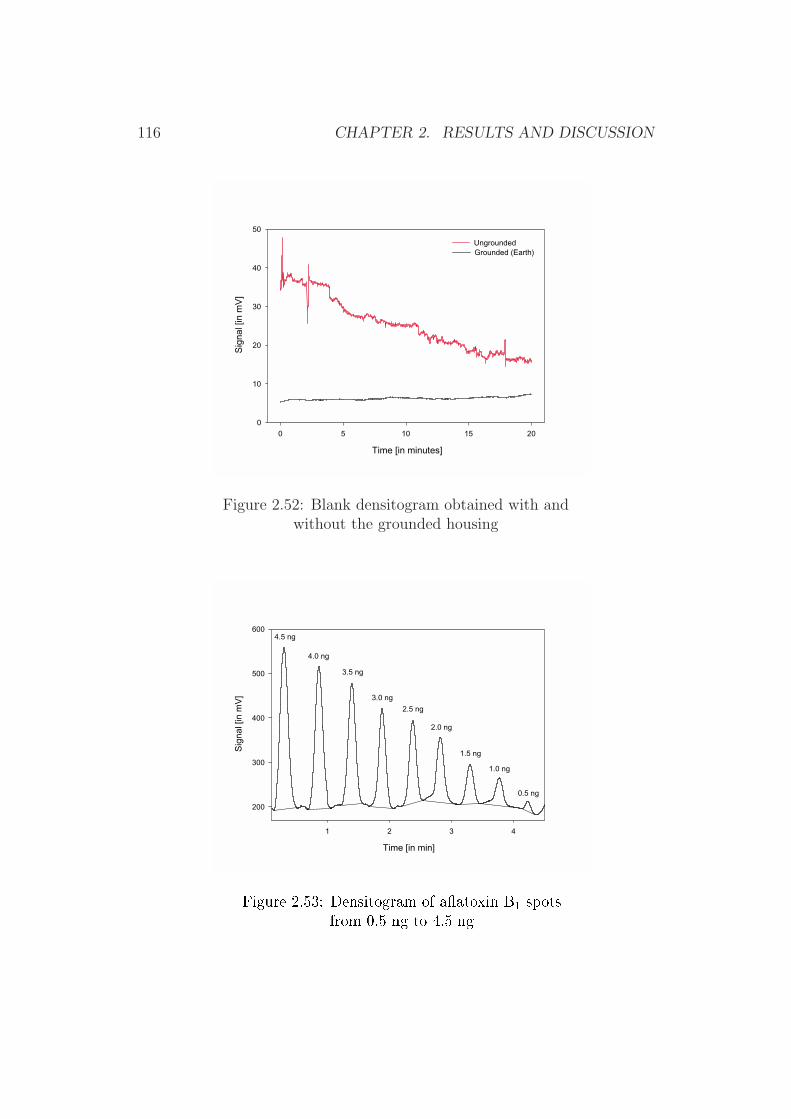
116 CHAPTER 2. RESULTS AND DISCUSSION
Figure 2.52: Blank densitogram obtained with andwithout the grounded housing
Time [in minutes]
0 5 10 15 20
Sig
nal [
in m
V]
0
10
20
30
40
50
Grounded (Earth)Ungrounded
Time [in min]
1 2 3 4
Sig
nal [
in m
V]
200
300
400
500
600
0.5 ng
1.0 ng
1.5 ng
2.0 ng
2.5 ng
3.0 ng
3.5 ng
4.0 ng
4.5 ng
Figure 2.53: Densitogram of a atoxin B1 spots
from 0.5 ng to 4.5 ng
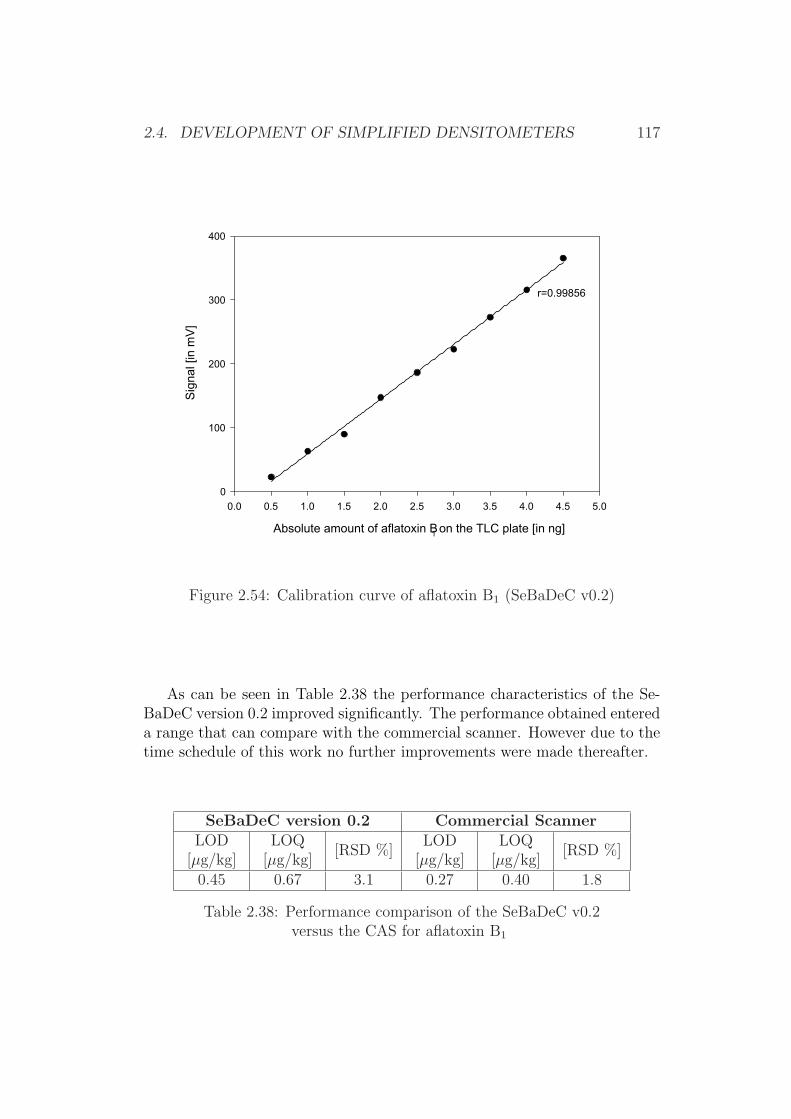
Absolute amount of aflatoxin B1 on the TLC plate [in ng]
0.0 0.5 1.0 1.5 2.0 2.5 3.0 3.5 4.0 4.5 5.0
Sig
nal [
in m
V]
0
100
200
300
400
2.4. DEVELOPMENT OF SIMPLIFIED DENSITOMETERS 117
Figure 2.54: Calibration curve of aflatoxin B1 (SeBaDeC v0.2)
As can be seen in Table 2.38 the performance characteristics of the Se-BaDeC version 0.2 improved significantly. The performance obtained entereda range that can compare with the commercial scanner. However due to thetime schedule of this work no further improvements were made thereafter.
SeBaDeC version 0.2 Commercial ScannerLOD
[µg/kg]LOQ
[µg/kg][RSD %]
LOD[µg/kg]
LOQ[µg/kg]
[RSD %]
0.45 0.67 3.1 0.27 0.40 1.8
Table 2.38: Performance comparison of the SeBaDeC v0.2versus the CAS for aflatoxin B1
r=0.99856
118 CHAPTER 2. RESULTS AND DISCUSSION
2.4.6 Modification of an Office Scanner
General Considerations
In addition to the above described SeBaDeC, another approach to delivera simplified densitometer was the modification of a commercially availableflat-board scanner to be used as densitometer. Commercially available flat-board scanners are widely used in combination with a personal computer(PC) and can be considered as standard components in office work. Thewide availability of such devices led to the idea that they should be easyto obtain in most cases and might even be easily modified for the desiredapplication.
Generally flat-board scanners contain a movable unit, housing the lightsource and a detector-module which are moved together at a close distancealong the area which is to be scanned. Commonly used light sources arecold-cathode tubes, while charge coupled device-modules (CCD) are used aslight detectors.
Such a CCD array detector provides the capability to acquire a full spec-trum in the time it takes a scanning unit to sample a single wavelength.This detector exhibits a high quantum efficiency and a readout noise whichis about 100 times lower than conventional photodiode array detectors. Thishigh sensitivity provides the basis for a sensitive measurement and means thatfar less fluorescence (light) is necessary for accurate measurements, which inturn results in a lower LOD and LOQ.
However for the determination of fluorescence from aflatoxin spots a num-ber of elements in the scanner had to be changed. First of all the light sourcehad to be changed from the default tube to a UV-tube with a peak emissionwavelength of 366 nm (mercury band) to a allow the excitation of aflatoxinfluorescence.
In addition the introduction of a cut-off filter system was considered tobe implemented into the scanner system, which cut off the excitation lightof 366 nm produced by the UV-light source. This filter should reveal a highcontrast in terms of fluorescence and residue light derived by other causes.
Furthermore all UV-light sensitive parts of the scanner had to be pro-tected sufficiently with a cover or by other means. To assure the success ofthis project, the construction and preliminary experiments were performedat the Fraunhofer Institut fur Optik und Feinmechanik in Jena (Contractor),in close collaboration with myself. During the early stage of the project theminimum requirements and specifications were defined as follows:
2.4. DEVELOPMENT OF SIMPLIFIED DENSITOMETERS 119
• No special communication protocol was required, thus the software forobtaining the image data shall be the generic TWAIN-driver29 providedby the scanner manifacturer.
• The image evaluation must be performed with a generic image evalua-tion software, which shall be independent from the modified scanner.
• The scanner must transfer the signal via a parallel-interface, thus al-lowing to operate it with most IBM compatible PCs.
• The device must achieve an optical resolution of 300 dpi30 and a channeldepth of at least 8-bit (256); preferably 12-bit (4096). This allows asufficient resolution in the spot intensity,which is equivalent to a truecolour mode of 36-bit (12-bit for each of the three colour channels (RedGreen Blue)).
• A spot of 1 ng AflatoxinB1 must result in a detectable signal.
Due to the large extent of the assessment for available office scanners,the contractor started to look for available material and suitable scanners forthis project. Preliminary test were performed and strongly indicated thatthe foreseen project was technically possible.
Development of the Modified Scanner
Selection of the appropriate office scanner Commercially available of-fice scanners share a similar mechanical construction with small deviations.The principle construction consists of a light-tube (VIS) with a diameter of2 - 3 mm and a movable apparatus containing the CCD-module and theoptical system. The light-tube is positioned close to the scanner glass-platethat supports the image during the scan.
A commonly available office scanner from UMAX (Model Astra 2000 P)was selected as a suitable candidate due to the following facts and features:
• Excellent notes in tests of appropriate computer journals.
• Available specifications of the used CCD-module31.29TWAIN stands for Technology Without An Interesting Name and defines the com-
munication protocol between any image processing software and hardware devices (e.g.scanners) for the aquisation of image data.
30dpi = Dots per inch31NEC µPD3798, see annex for further specifications
120 CHAPTER 2. RESULTS AND DISCUSSION
• The scanner is made out of non-fluorescent materials.
• The TWAIN-interface allowed a 36-bit colour depth of the scannedimage.
• Parallel-port interface that required no special ports on a PC.
Selection of the UV-light source (UV-tube) Appropriate UV-tubeswith an emission wavelength of 366 nm were evaluated for the replacementof the VIS-tube. Due to the dimension of the field (A4) to be scanned, aswell as the dimension of the scanner itself, the tube should have a length ofapproximately 200 [mm] with maximal power ratings of 10 Watts, which isequivalent to the power ratings of normal scanners. The UV-tube TL 6W/08Blacklight Blue from Philips was found to be appropriate and is a commonlyused UV-tube in various fields, thus the availability of the tube should beguaranteed in the near future.
Despite the fact that this tube is designed to be run in a hot cathode mode,it can also be run in cold cathode mode. The power ratings of the tube arenominally 6 watts, which are equivalent to 0.75 watts of UV-A radiation. Adrawback of this tube was the diameter of 16 mm, since the approximatediameter of tubes in scanner is 3 mm. However, another candidate as anappropriate tube was not identified.
After this selection, the homogeneity of the radiation along the tube axiswas tested in dependence of the distance from the tube. As can be seen inFigure 2.55 the total radiation is fairly constant at several distances from 5.5mm to 41.2 mm along the tube axis. The measured variations in the regionof 5 cm to 15 cm along the tube axis were in the range of 10% around themean, while the highest variation occurred at the ends of the tube.
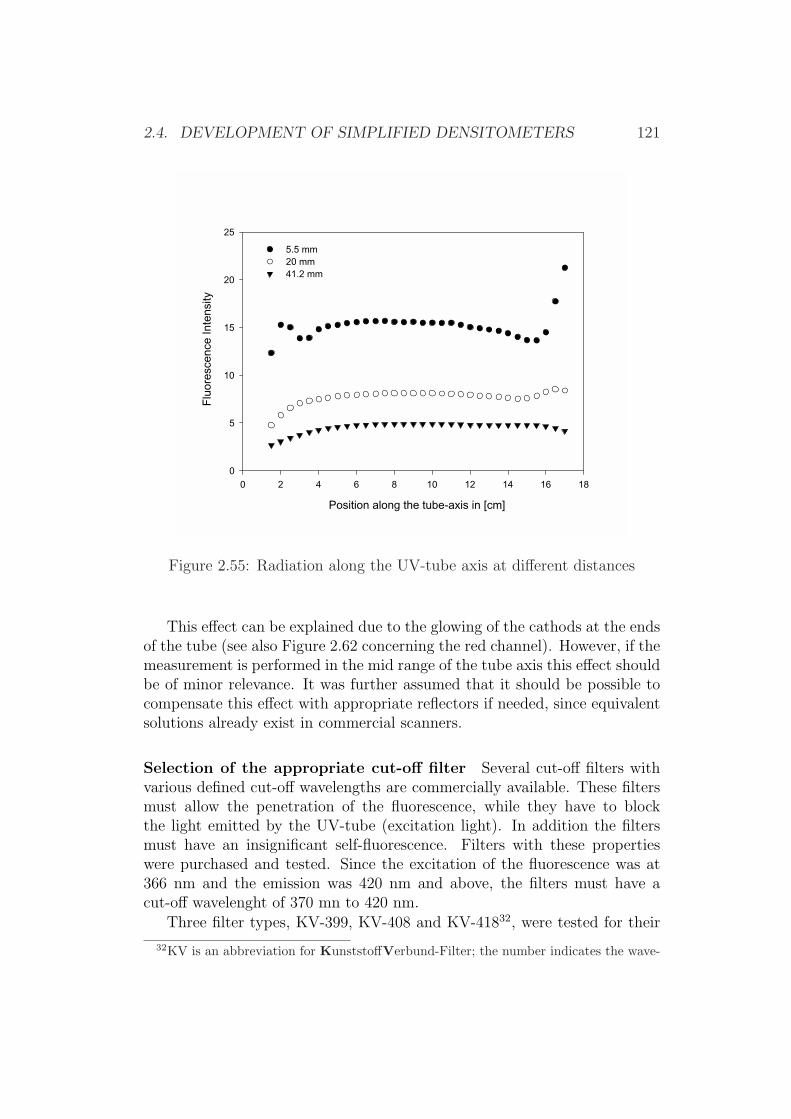
2.4. DEVELOPMENT OF SIMPLIFIED DENSITOMETERS 121
Figure 2.55: Radiation along the UV-tube axis at different distances
This effect can be explained due to the glowing of the cathods at the endsof the tube (see also Figure 2.62 concerning the red channel). However, if themeasurement is performed in the mid range of the tube axis this effect shouldbe of minor relevance. It was further assumed that it should be possible tocompensate this effect with appropriate reflectors if needed, since equivalentsolutions already exist in commercial scanners.
Selection of the appropriate cut-off filter Several cut-off filters withvarious defined cut-off wavelengths are commercially available. These filtersmust allow the penetration of the fluorescence, while they have to blockthe light emitted by the UV-tube (excitation light). In addition the filtersmust have an insignificant self-fluorescence. Filters with these propertieswere purchased and tested. Since the excitation of the fluorescence was at366 nm and the emission was 420 nm and above, the filters must have acut-off wavelenght of 370 mn to 420 nm.
Three filter types, KV-399, KV-408 and KV-41832, were tested for their
32KV is an abbreviation for KunststoffVerbund-Filter; the number indicates the wave-
Position along the tube-axis in [cm]
0 2 4 6 8 10 12 14 16 18
Flu
ores
cenc
e In
tens
ity
0
5
10
15
20
25
5.5 mm20 mm41.2 mm
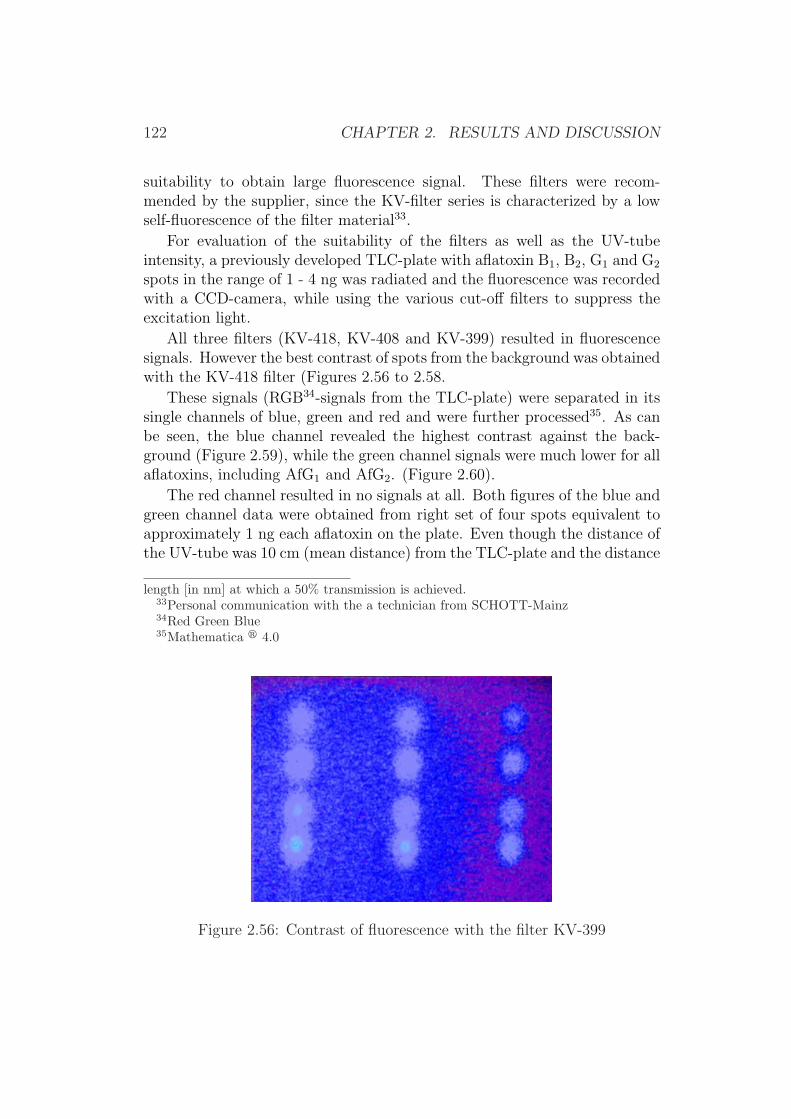
122 CHAPTER 2. RESULTS AND DISCUSSION
suitability to obtain large fluorescence signal. These filters were recom-mended by the supplier, since the KV-filter series is characterized by a lowself-fluorescence of the filter material33.
For evaluation of the suitability of the filters as well as the UV-tubeintensity, a previously developed TLC-plate with aflatoxin B1, B2, G1 and G2
spots in the range of 1 - 4 ng was radiated and the fluorescence was recordedwith a CCD-camera, while using the various cut-off filters to suppress theexcitation light.
All three filters (KV-418, KV-408 and KV-399) resulted in fluorescencesignals. However the best contrast of spots from the background was obtainedwith the KV-418 filter (Figures 2.56 to 2.58.
These signals (RGB34-signals from the TLC-plate) were separated in itssingle channels of blue, green and red and were further processed35. As canbe seen, the blue channel revealed the highest contrast against the back-ground (Figure 2.59), while the green channel signals were much lower for allaflatoxins, including AfG1 and AfG2. (Figure 2.60).
The red channel resulted in no signals at all. Both figures of the blue andgreen channel data were obtained from right set of four spots equivalent toapproximately 1 ng each aflatoxin on the plate. Even though the distance ofthe UV-tube was 10 cm (mean distance) from the TLC-plate and the distance
length [in nm] at which a 50% transmission is achieved.33Personal communication with the a technician from SCHOTT-Mainz34Red Green Blue35Mathematica r 4.0
Figure 2.56: Contrast of fluorescence with the filter KV-399
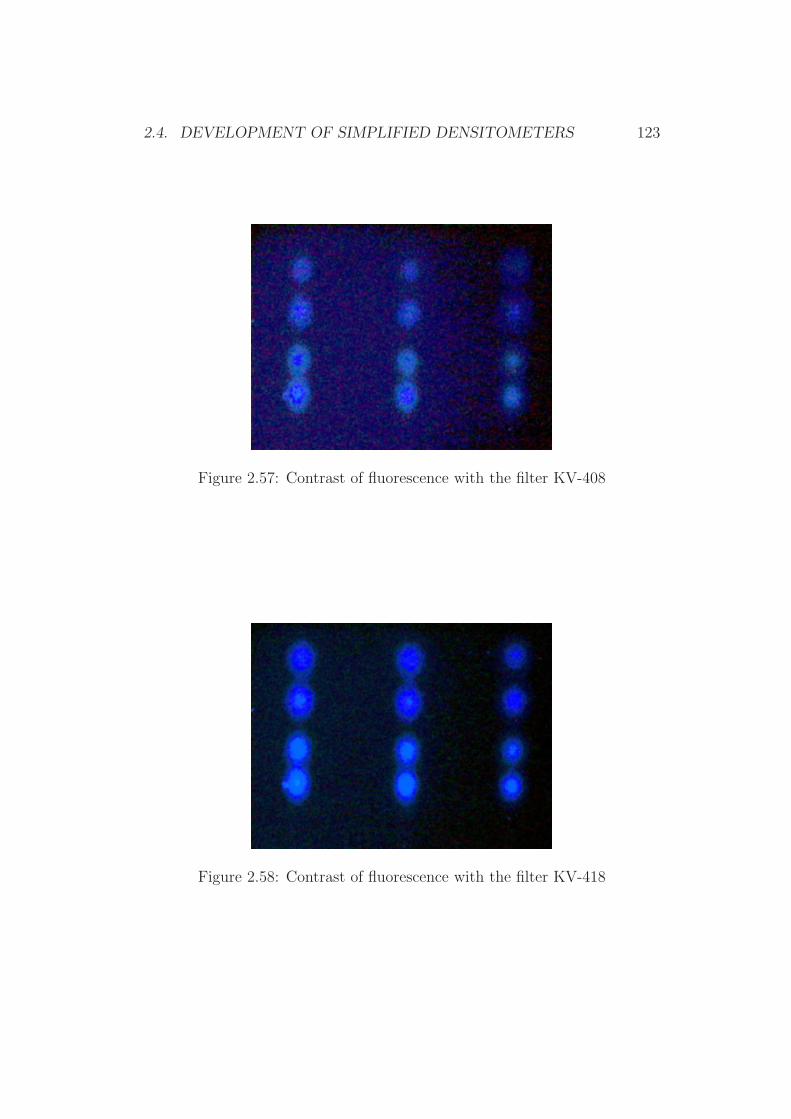
2.4. DEVELOPMENT OF SIMPLIFIED DENSITOMETERS 123
Figure 2.57: Contrast of fluorescence with the filter KV-408
Figure 2.58: Contrast of fluorescence with the filter KV-418
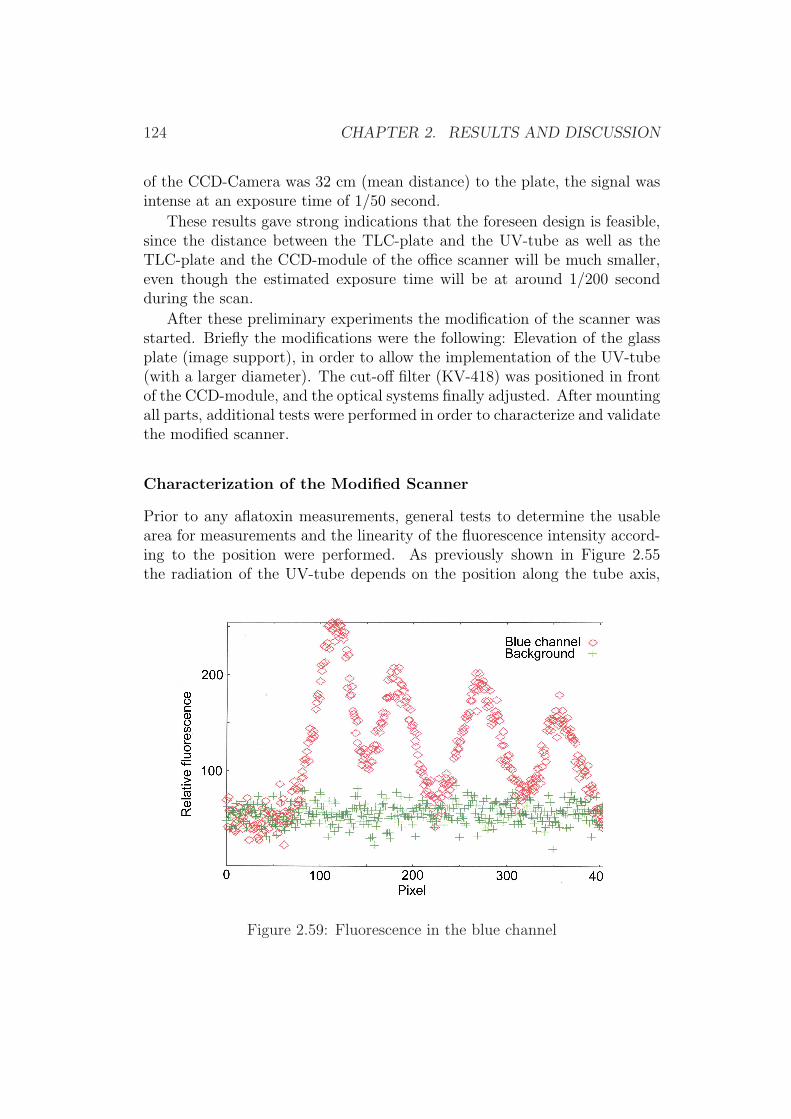
124 CHAPTER 2. RESULTS AND DISCUSSION
of the CCD-Camera was 32 cm (mean distance) to the plate, the signal wasintense at an exposure time of 1/50 second.
These results gave strong indications that the foreseen design is feasible,since the distance between the TLC-plate and the UV-tube as well as theTLC-plate and the CCD-module of the office scanner will be much smaller,even though the estimated exposure time will be at around 1/200 secondduring the scan.
After these preliminary experiments the modification of the scanner wasstarted. Briefly the modifications were the following: Elevation of the glassplate (image support), in order to allow the implementation of the UV-tube(with a larger diameter). The cut-off filter (KV-418) was positioned in frontof the CCD-module, and the optical systems finally adjusted. After mountingall parts, additional tests were performed in order to characterize and validatethe modified scanner.
Characterization of the Modified Scanner
Prior to any aflatoxin measurements, general tests to determine the usablearea for measurements and the linearity of the fluorescence intensity accord-ing to the position were performed. As previously shown in Figure 2.55the radiation of the UV-tube depends on the position along the tube axis,
Figure 2.59: Fluorescence in the blue channel
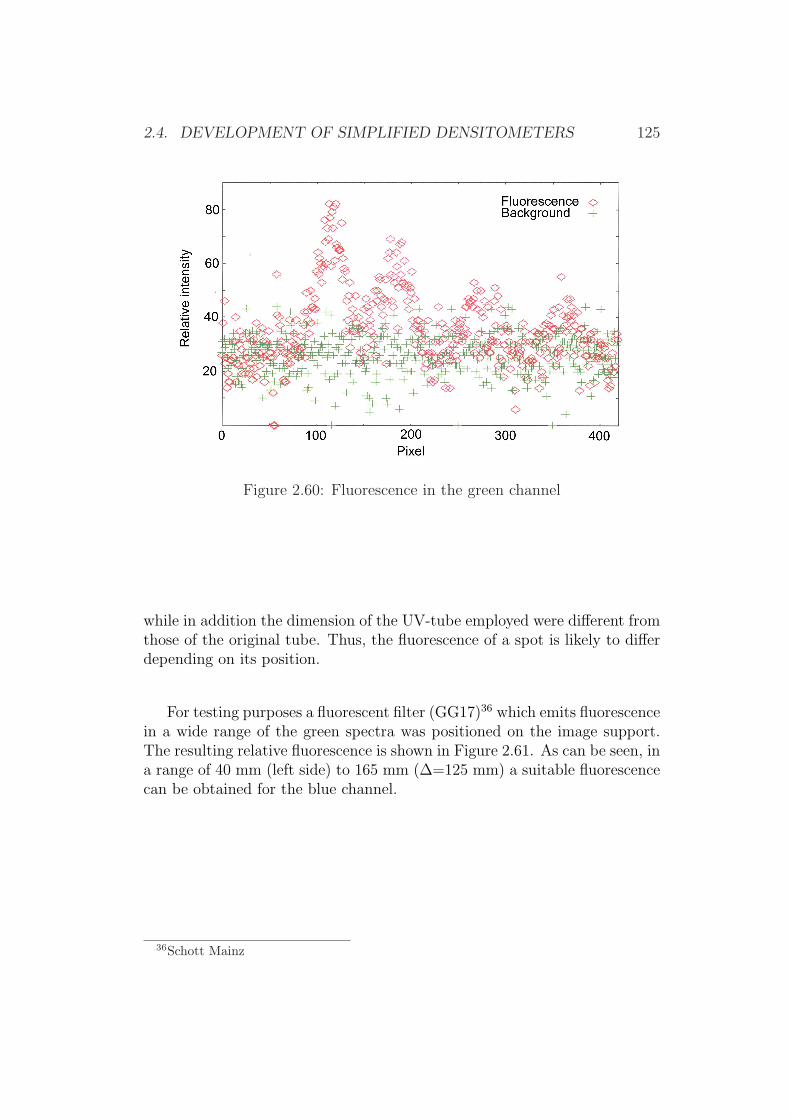
2.4. DEVELOPMENT OF SIMPLIFIED DENSITOMETERS 125
Figure 2.60: Fluorescence in the green channel
while in addition the dimension of the UV-tube employed were different fromthose of the original tube. Thus, the fluorescence of a spot is likely to differdepending on its position.
For testing purposes a fluorescent filter (GG17)36 which emits fluorescencein a wide range of the green spectra was positioned on the image support.The resulting relative fluorescence is shown in Figure 2.61. As can be seen, ina range of 40 mm (left side) to 165 mm (∆=125 mm) a suitable fluorescencecan be obtained for the blue channel.
36Schott Mainz

126 CHAPTER 2. RESULTS AND DISCUSSION
Figure 2.61: Relative fluorescence in the blue- and green-channelalong the UV-tube
The observed fluorescence variation was ±10% (peak to valley) in theselected range. These observed variations were found to be reproducible andare thought to be due to differences in the coating of the tube. However, sinceit is foreseen to perform the calibration of unknown aflatoxin spots at thesame location (position along the UV-tube), these variations are neglectablefor further determinations.
In addition to this test, the influence of the cathode glowing was deter-mined, since this effect can be seen on scanned images as bright red stripesalong the image and contributes most to the background signal. Figure 2.62shows this effect, which almost exclusively effects the red-channel, while theblue-channel is significantly less affected37.
37This is important for the measurement of fluorescence at about 440 nm.
Position along the UV-tube axis in [mm]
20 30 40 50 60 70 80 90 100 110 120 130 140 150 160 170 180 190
Rel
ativ
e In
tens
ity
0
20
40
60
80
100
120
Green ChannelBlue Channel

2.4. DEVELOPMENT OF SIMPLIFIED DENSITOMETERS 127
Figure 2.62: Effect of the Cathode Glowing on the different CCD-Channels
After these characterizations TLC-plates with different levels of aflatoxinswere measured.
Results of TLC-plate Measurements
To measure the signal intensities of aflatoxin spots on the TLC-plate, a seriesof aflatoxins in the range of 1 ng to 9 ng for AfB2 and AfG2, respectively0.5 ng to 4.5 ng for AfB1 and AfG1 were spotted and developed. The resultingchromatogram was first scanned with the CAS and subsequently re-scannedwith the modified scanner. Figure 2.63 shows the obtained image (AfB1,AfB2, AfG1 and AfG2 from top to the bottom), while Figures 2.64 to 2.67show the corresponding spot intensities as graphical plots.
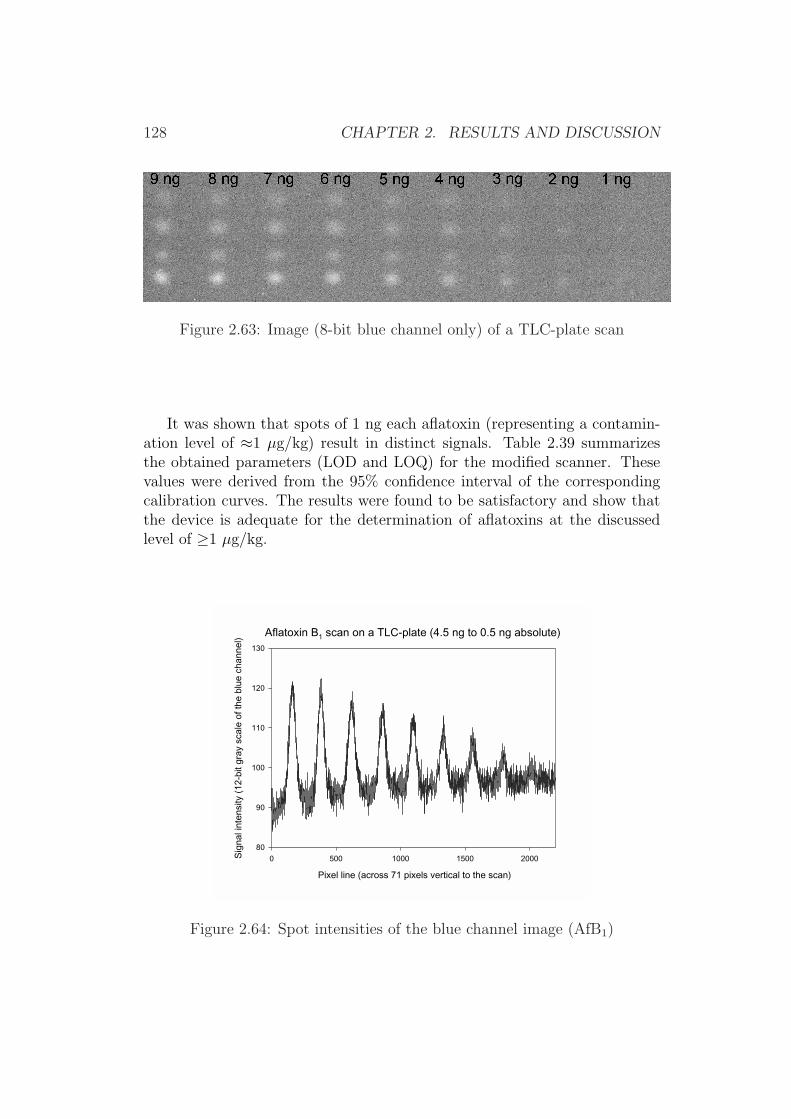
128 CHAPTER 2. RESULTS AND DISCUSSION
Figure 2.63: Image (8-bit blue channel only) of a TLC-plate scan
It was shown that spots of 1 ng each aflatoxin (representing a contamin-ation level of ≈1 µg/kg) result in distinct signals. Table 2.39 summarizesthe obtained parameters (LOD and LOQ) for the modified scanner. Thesevalues were derived from the 95% confidence interval of the correspondingcalibration curves. The results were found to be satisfactory and show thatthe device is adequate for the determination of aflatoxins at the discussedlevel of ≥1 µg/kg.
Figure 2.64: Spot intensities of the blue channel image (AfB1)
Aflatoxin B1 scan on a TLC-plate (4.5 ng to 0.5 ng absolute)
Pixel line (across 71 pixels vertical to the scan)
0 500 1000 1500 2000Sig
nal i
nten
sity
(12
-bit
gray
sca
le o
f the
blu
e ch
anne
l)
80
90
100
110
120
130
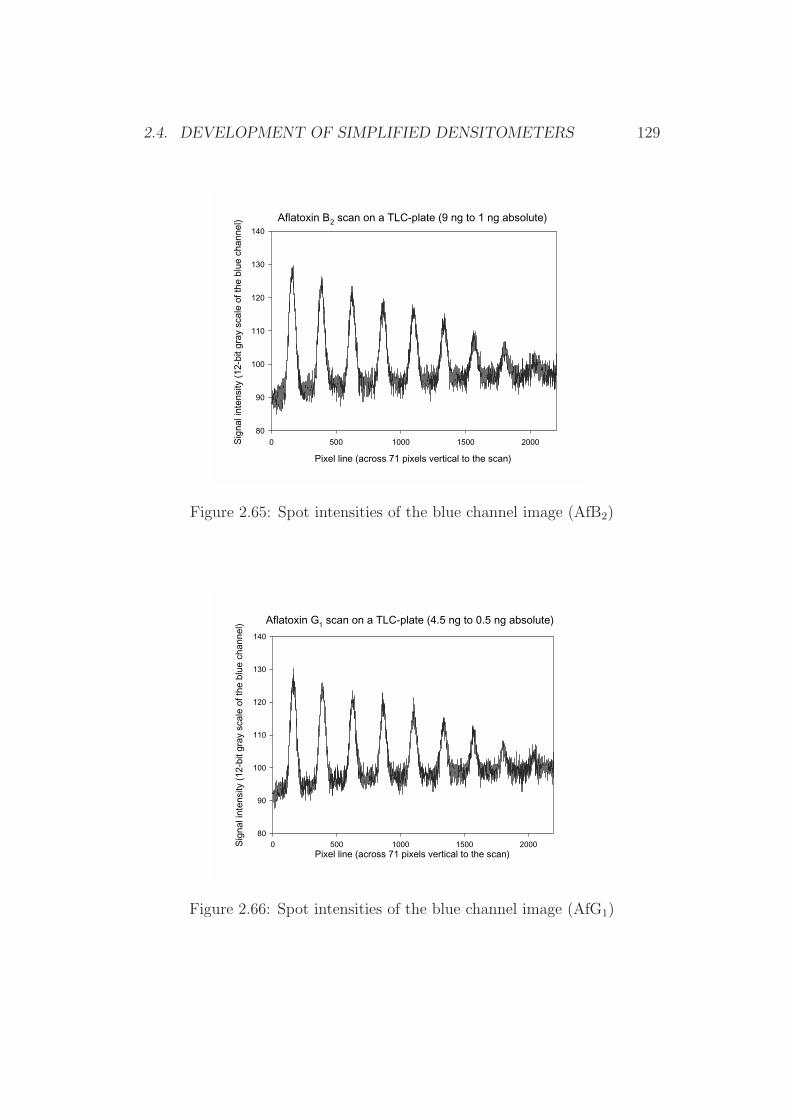
2.4. DEVELOPMENT OF SIMPLIFIED DENSITOMETERS 129
Figure 2.65: Spot intensities of the blue channel image (AfB2)
Figure 2.66: Spot intensities of the blue channel image (AfG1)
Aflatoxin B2 scan on a TLC-plate (9 ng to 1 ng absolute)
Pixel line (across 71 pixels vertical to the scan)
0 500 1000 1500 2000Sig
nal i
nten
sity
(12
-bit
gray
sca
le o
f the
blu
e ch
anne
l)
80
90
100
110
120
130
140
Aflatoxin G1 scan on a TLC-plate (4.5 ng to 0.5 ng absolute)
Pixel line (across 71 pixels vertical to the scan)0 500 1000 1500 2000S
igna
l int
ensi
ty (
12-b
it gr
ay s
cale
of t
he b
lue
chan
nel)
80
90
100
110
120
130
140

130 CHAPTER 2. RESULTS AND DISCUSSION
Figure 2.67: Spot intensities of the blue channel image (AfG2)
Figure 2.68: Calibration curves for Aflatoxin B2 andAflatoxin G2 (modified scanner)
Aflatoxin G2 scan on a TLC-plate (9 ng to 1 ng absolute)
Pixel line (across 71 pixels vertical to the scan)0 500 1000 1500 2000S
igna
l int
ensi
ty (
12-b
it gr
ay s
cale
of t
he b
lue
chan
nel)
80
90
100
110
120
130
140
150
Aflatoxin amount on TLC plate [in ng]
0 1 2 3 4 5 6 7 8 9 10
Sig
nal h
eigh
t [in
cm
]
0
2
4
6
8
10
12
14
16
Aflatoxin B2
Aflatoxin G2
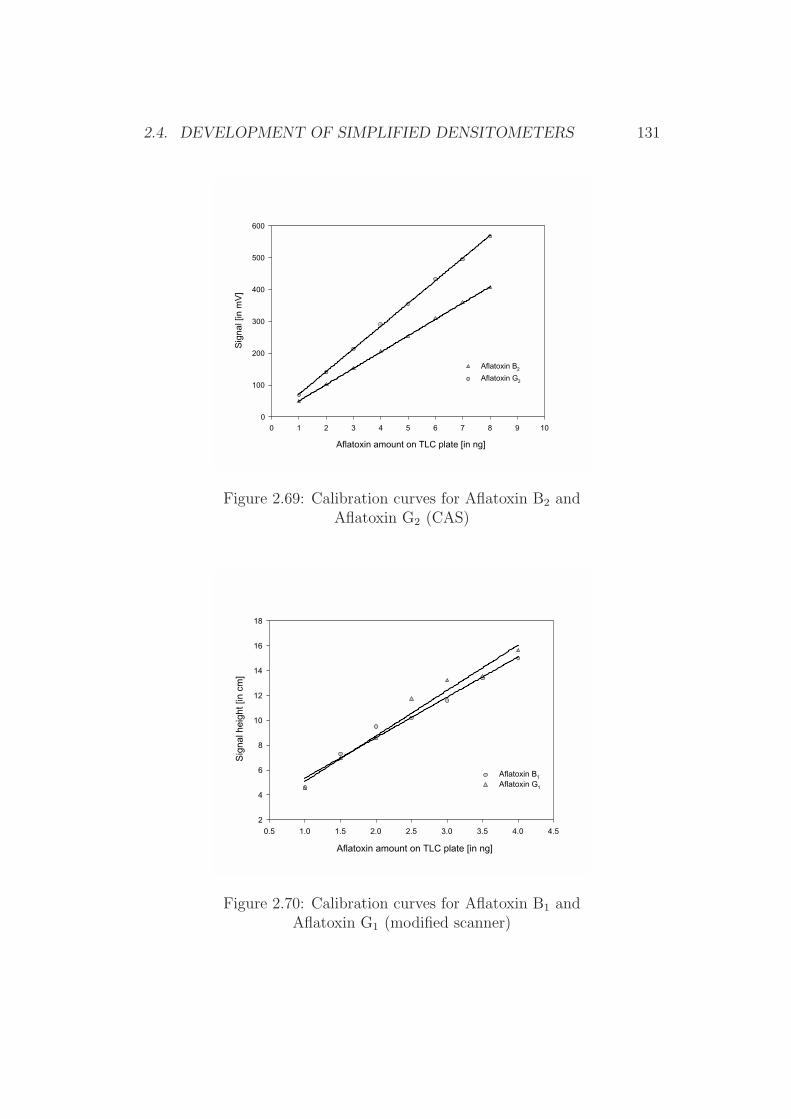
2.4. DEVELOPMENT OF SIMPLIFIED DENSITOMETERS 131
Figure 2.69: Calibration curves for Aflatoxin B2 andAflatoxin G2 (CAS)
Figure 2.70: Calibration curves for Aflatoxin B1 andAflatoxin G1 (modified scanner)
Aflatoxin amount on TLC plate [in ng]
0 1 2 3 4 5 6 7 8 9 10
Sig
nal [
in m
V]
0
100
200
300
400
500
600
Aflatoxin B2
Aflatoxin G2
Aflatoxin amount on TLC plate [in ng]
0.5 1.0 1.5 2.0 2.5 3.0 3.5 4.0 4.5
Sig
nal h
eigh
t [in
cm
]
2
4
6
8
10
12
14
16
18
Aflatoxin B1
Aflatoxin G1

132 CHAPTER 2. RESULTS AND DISCUSSION
Figure 2.71: Calibration curves for Aflatoxin B1 andAflatoxin G1 (CAS)
AnalyteCAS Modified Scanner
LOD LOQ RSD LOD LOQ RSD[µg/kg] [µg/kg] [in %] [µg/kg] [µg/kg] [in %]
AfB1 0.4 0.6 2.7 1.3 1.9 7.6AfB2 0.2 0.4 0.9 0.9 1.4 3.2AfG1 0.3 0.5 2.5 1.2 1.7 7.1AfG2 0.6 0.8 2.0 1.4 2.0 4.9
Table 2.39: Results of the comparison CAS vs modified scanner
Aflatoxin amount on TLC plate [in ng]
0.0 0.5 1.0 1.5 2.0 2.5 3.0 3.5 4.0 4.5 5.0
Sig
nal [
in m
V]
0
50
100
150
200
250
300
Aflatoxin B1
Aflatoxin G1
Chapter 3
Experimental
3.1 Materials
1. Reagents: All reagents were of recognized analytical grade. Unlessstated differently, the water used complied with grade 3 of ISO 3696
(a) Sodium chloride - Merck, Darmstadt [Germany]
(b) Phosphate buffered saline (PBS) pH 7.4 - Sigma Aldrich, Milano[Italy]
(c) Pyridinium hydrobromide perbromide (PBPB) [CAS: 39416-48-3]- Sigma Aldrich, Milano [Italy]
(d) Potassium bromide - Merck, Darmstadt [Germany]
(e) LC grade acetonitrile - Merck, Darmstadt [Germany]
(f) LC grade methanol - Merck, Darmstadt [Germany]
(g) Methanol (pure) - Merck, Darmstadt [Germany]
(h) LC grade water, complying with grade 1 of ISO 3696
(i) Extraction solvent: methanol - water solution [8 + 2 (v/v)]
(j) n-Hexane (pure), cyclohexane (pure) or petrolether 60-140 - Merck,Darmstadt [Germany]
(k) Nitric acid - Merck, Darmstadt [Germany]
(l) LC mobile phase solvent (A) Water/acetonitrile/methanol solu-tion [6 + 2 + 3 (v/v/v)]
(m) LC mobile phase solvent (B) For use with electrochemically gener-ated bromine: Water/acetonitrile/methanol solution [6 + 2 + 3 (v/v/v)]containing 120 mg potassium bromide and 350 mL nitric acid at4 mol/L
133

134 CHAPTER 3. EXPERIMENTAL
(n) Post column reagent Dissolve 25 mg PBPB in 500 mL H2O. So-lution can be used for up to four days if stored in a dark place atroom temperature. This solution was only used in combinationwith LC mobile phase solvent (B)
(o) Toluene - Merck, Darmstadt [Germany]
(p) Aflatoxins in crystal form - Sigma Aldrich, Milano [Italy]
(q) Sucrose - Merck, Darmstadt [Germany]
(r) Paraffin [liquid] - Merck, Darmstadt [Germany]
2. Apparatus:
(a) High-performance Liquid Chromatograph:
i. Gilson HPLC pump system; pump models: À306¿ and À307¿
ii. Gilson Unipoint software, version: 1.71
iii. Gilson ASPEC system; Automated Sample Preparation, Ex-traction and Collection device; model: ÀASPEC XL¿
iv. Supelco LC-18 HPLC column, 25 [cm] - 4.6 [mm] i.d.
v. Phone-Diagnostics KOBRA-cellr
vi. Waters fluorescence detector; model: 474
vii. Gilson UV-VIS detector; model: ÀV119 ¿
(b) Water Determination
i. Metrohm, Karl-Fischer water titration unit; model: À719 STitrino ¿
(c) Thin-layer Chromatography
i. CAMAG sample application device; model: ÀLinomat¿
ii. CAMAG Cats software, DOS-version
iii. CAMAG TLC-scanner; model: Scanner3
3.2 Methods
3.2.1 Sample Extraction
Generally a test portion of 50 g was extracted with a mixture of methanol-water (8 + 2 [v/v]). Depending on the extracted food matrix specific mod-ifications had to be made. For the extraction of fig paste, peanut butterand pistachio paste the material was extracted for 3 minutes with a highspeed blender. Fatty commodities (peanut butter and pistachios) required

3.2. METHODS 135
the addition of 50 mL of n-hexane (or cyclohexane or petrolether) to theextractant to form an emulsion to allow a sufficient extraction. Paprika pow-der was extracted by shaking for 30 minutes (provided that the powder isground sufficiently). This allows to process several samples simultaneouslyand reduces the risk of cross contamination. After extraction the extractantwas subsequently filtered and diluted with PBS.
3.2.2 Immunoaffinity Clean-up
The filtered sample extract was diluted with water or PBS to a concentrationof less than 11% MeOH and directly applied on the IAC (HPLC procedure)or filtered through a micro-fibre filter (TLC procedure). The diluted filtratewhich had to be equivalent to 2.5 g of sample material was passed throughthe IAC at a flow rate of maximum 5 mL/min. The column was washedwith water (HPLC procedure) or the column was washed with a washingsolution containing Tween-20 and 11 % of methanol followed by water (TLCprocdure). The IAC was gently dried by applying a light vacuum for 3 to 5s.The aflatoxins were eluted in a two step procedure. First a volume of 0.50 mLmethanol was passed on the IAC. After 1 minute a second portion of methanol[1.0 mL] was passed on the IAC. The purified aflatoxins were collected in avolumetric flask and diluted with water to a defined volume (HPLC procdure)or they were collected in a glass vial (acid washed) which contained 50 µL ofan MeOH-formic acid solution. This solution was subsequently dried undera stream of nitrogen (TLC procdure).
3.2.3 Re-dissolving for TLC Application
The dried aflatoxins were re-dissolved in 150 µL of a hexane-acetone-methanolsolution (90 + 5 + 5 [v/v/v]). This procedure was performed in a sealed 2mL glass vial.
3.2.4 HPLC Procedures
Injection of the Aflatoxins into the HPLC-system
The solution with the purified aflatoxins was injected into a HPLC injectionport. The injection by total loop mode guarantees maximum accuracy. Thetotal loop mode was carried out according to the injection port manufac-turer1. Therefore a sample volume of 3 times the injection loop size was used
1Rheodyne

136 CHAPTER 3. EXPERIMENTAL
and at least 2/3 of this volume was injected into the valve, to ensure thatthe middle fraction remains in the injection loop. Thus, the loop was rinsedwith the injection solvent while enough solvent remained in the valve.
HPLC Separation
The aflatoxins were isocratically separated on a RP-HPLC column with thedescribed mobile phase containing water, methanol and acetonitrile. Theflow rate was 1 mL per minute. The aflatoxins appeared to be base lineresolved and eluted in the order AfG2 → AfG1 → AfB2 → AfB1.
Post Column Derivatization
The KOBRA-cell r settings were according to the specification of the manu-facturer (see parameters below), while Figures 3.1 and 3.2 show the schematicHPLC setup for both systems.
KOBRA-cell r settings:
Mobile phase according to previous section, containing120 mg KBr and 350 µL HNO3 (c(HNO3)=4 mol/L) each litre.Electrical current: 100 µA.Reaction tubing with 40 cm and 0.5 mm inner diameter (equiva-lent to a reaction time of ≥ 4 seconds).
The addition of PBPB as bromination agent was performed with an aux-iliary pulse-less HPLC pump. As a pressure and flow buffer, a Silica gel(Mesch 60 - 200) filled housing of an old plastic-polymer column (25 cm,4.6 mm inner diameter) was used.
PBPB settings:
Mobile phase according to previous section.Reagent solvent: 50 mg/L PBPB in water.Void volume T-piece mixing chamber.Flow-rates: 1 mL/min. (mobile phase) - 0.3 mL/min. (reactionsolvent).Reaction tubing with 60 cm and 0.5 mm inner diameter (equiva-lent to a reaction time of ≥ 4 seconds).
In addition, flow chart diagrams of the described procedures are given inFigures 3.3 to Figures 3.5.
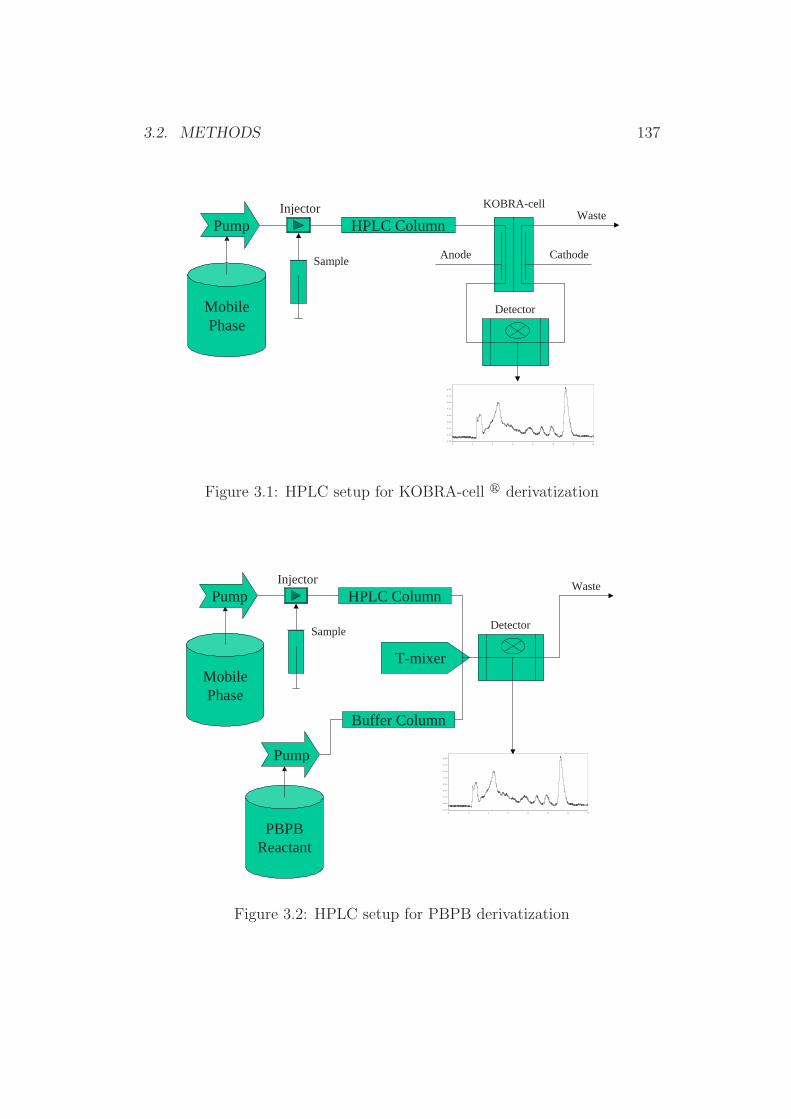
3.2. METHODS 137
HPLC ColumnPumpInjector KOBRA-cell
Waste
Detector
Anode Cathode
4.75
4.95
5.15
5.35
5.55
5.75
5.95
6.15
6.35
0 2 4 6 8 10 12 14
MobilePhase
Sample
Figure 3.1: HPLC setup for KOBRA-cell r derivatization
HPLC ColumnPumpInjector
Waste
Detector
4.75
4.95
5.15
5.35
5.55
5.75
5.95
6.15
6.35
0 2 4 6 8 10 12 14
MobilePhase
Sample
Buffer Column
T-mixer
Pump
PBPBReactant
Figure 3.2: HPLC setup for PBPB derivatization
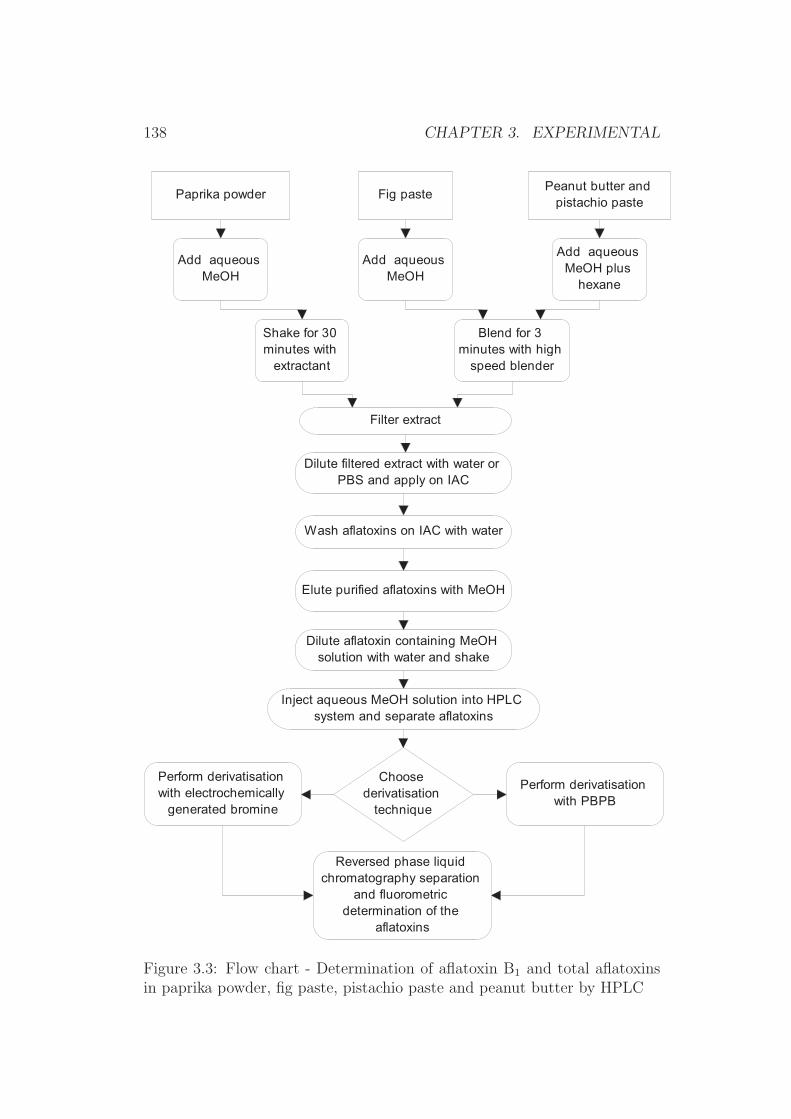
138 CHAPTER 3. EXPERIMENTAL
Paprika powderPeanut butter and
pistachio pasteFig paste
Shake for 30 minutes with
extractant
Blend for 3 minutes with high
speed blender
Add aqueous MeOH
Add aqueous MeOH
Add aqueous MeOH plus
hexane
Filter extract
Dilute filtered extract with water or PBS and apply on IAC
Wash aflatoxins on IAC with water
Elute purified aflatoxins with MeOH
Dilute aflatoxin containing MeOH solution with water and shake
Inject aqueous MeOH solution into HPLC system and separate aflatoxins
Perform derivatisation with electrochemically
generated bromine
Perform derivatisation with PBPB
Choose derivatisation
technique
Reversed phase liquid chromatography separation
and fluorometric determination of the
aflatoxins
Figure 3.3: Flow chart - Determination of aflatoxin B1 and total aflatoxinsin paprika powder, fig paste, pistachio paste and peanut butter by HPLC
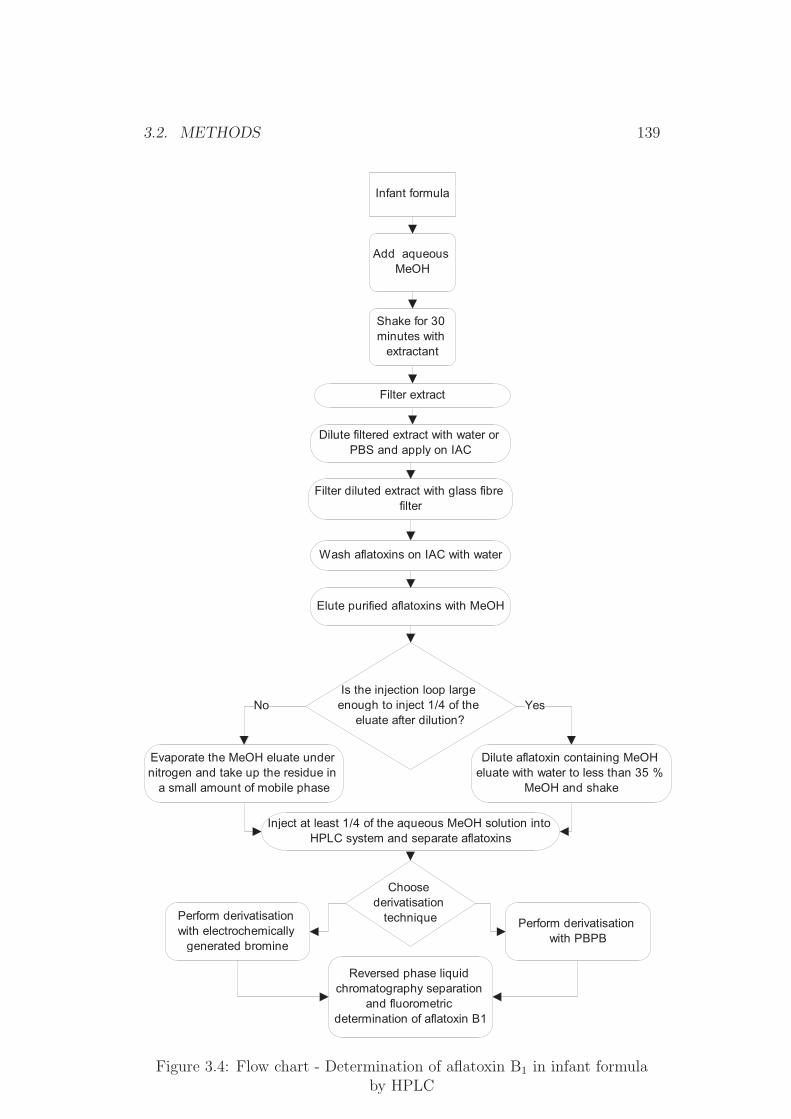
3.2. METHODS 139
Infant formula
Shake for 30 minutes with
extractant
Add aqueous MeOH
Filter extract
Dilute filtered extract with water or PBS and apply on IAC
Wash aflatoxins on IAC with water
Elute purified aflatoxins with MeOH
Dilute aflatoxin containing MeOH eluate with water to less than 35 %
MeOH and shake
Inject at least 1/4 of the aqueous MeOH solution into HPLC system and separate aflatoxins
Perform derivatisation with electrochemically
generated bromine
Perform derivatisation with PBPB
Choose derivatisation
technique
Filter diluted extract with glass fibre filter
Is the injection loop large enough to inject 1/4 of the
eluate after dilution?
Evaporate the MeOH eluate under nitrogen and take up the residue in
a small amount of mobile phase
No Yes
Reversed phase liquid chromatography separation
and fluorometric determination of aflatoxin B1
Figure 3.4: Flow chart - Determination of aflatoxin B1 in infant formulaby HPLC

140 CHAPTER 3. EXPERIMENTAL
Animal feed
Shake for 30 minutes with
extractant
Add aqueous acetone
Filter extract
Dilute filtered extract with water or PBS and apply on IAC
Wash aflatoxins on IAC with water
Elute purified aflatoxins with MeOH
Dilute aflatoxin containing MeOH eluate with water and shake
Inject at least 1/4 of the aqueous MeOH solution into HPLC system and separate aflatoxins
Perform derivatisation with electrochemically
generated bromine
Perform derivatisation with PBPB
Choose derivatisation
technique
Filter diluted extract with glass fibre filter
Reversed phase liquid chromatography separation
and fluorometric determination of aflatoxin B1
Figure 3.5: Flow chart - Determination of aflatoxin B1 animal feedingstuffby HPLC
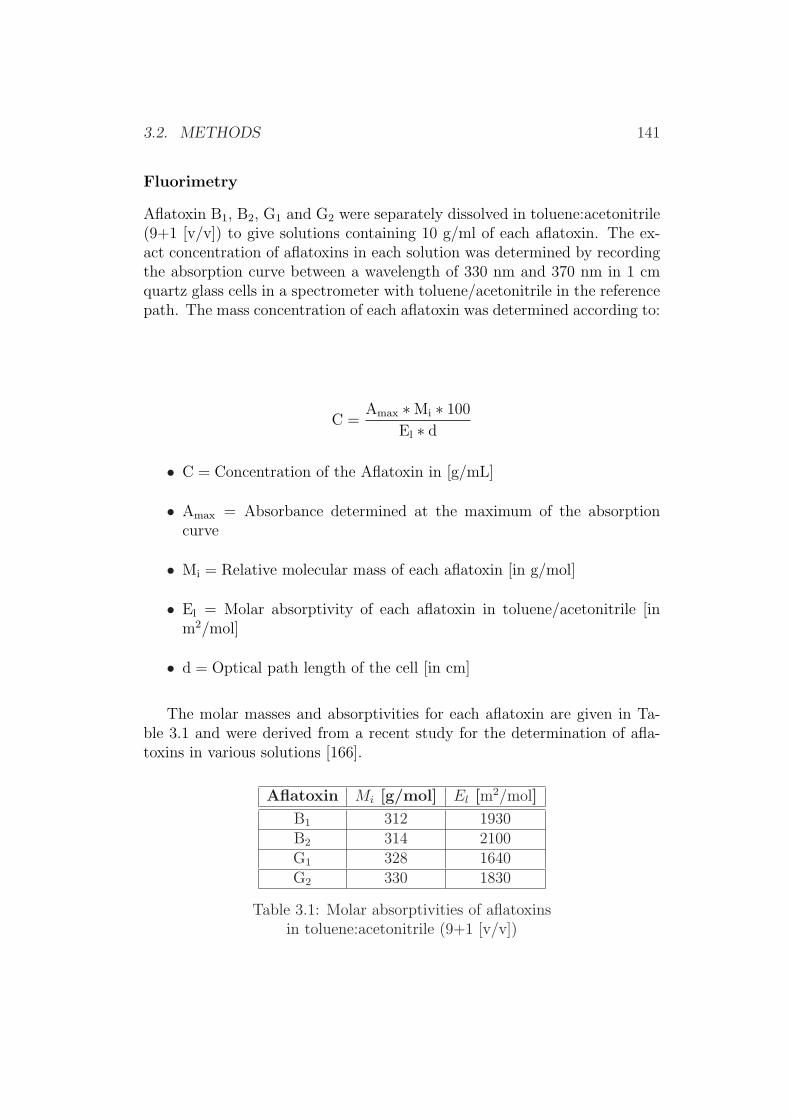
3.2. METHODS 141
Fluorimetry
Aflatoxin B1, B2, G1 and G2 were separately dissolved in toluene:acetonitrile(9+1 [v/v]) to give solutions containing 10 g/ml of each aflatoxin. The ex-act concentration of aflatoxins in each solution was determined by recordingthe absorption curve between a wavelength of 330 nm and 370 nm in 1 cmquartz glass cells in a spectrometer with toluene/acetonitrile in the referencepath. The mass concentration of each aflatoxin was determined according to:
C =Amax ∗Mi ∗ 100
El ∗ d
• C = Concentration of the Aflatoxin in [g/mL]
• Amax = Absorbance determined at the maximum of the absorptioncurve
• Mi = Relative molecular mass of each aflatoxin [in g/mol]
• El = Molar absorptivity of each aflatoxin in toluene/acetonitrile [inm2/mol]
• d = Optical path length of the cell [in cm]
The molar masses and absorptivities for each aflatoxin are given in Ta-ble 3.1 and were derived from a recent study for the determination of afla-toxins in various solutions [166].
Aflatoxin Mi [g/mol] El [m2/mol]
B1 312 1930B2 314 2100G1 328 1640G2 330 1830
Table 3.1: Molar absorptivities of aflatoxinsin toluene:acetonitrile (9+1 [v/v])

142 CHAPTER 3. EXPERIMENTAL
3.2.5 TLC Procedures
Application (spotting) of the the Aflatoxins on the TLC-plate
Exactly 100 µL of the re-dissolved aflatoxin solution (Chapter 3.2.3) werespotted on a silica-gel 60 TLC plate with a gas-tight micro litre syringe anddried with warm air.
TLC Separation
After application, a pre-run procedure was performed prior to the main sep-aration. This was done with neat MeOH, which was allowed to run justover the applied analyte spots, concentrating all of the analyte into smallbands. The plate was dried with warm air to assure that no MeOH residuesremained on the TLC-plate. The aflatoxins were separated with the mobilephase in an unlined and unsaturated TLC tank in the dark.
Fluorescence Amplification
For fluorescence amplification the developed TLC-plates were sprayed witha solution of 10 % paraffin in n-hexane. The n-hexane was evaporated andthe fluorescence was determined thereafter. A flowchart of the method pro-cedures is given in Figure 3.6.
Quantification
Scans of the developed TLC-plates were performed with the CAMAG TLC-Scanner as reference in addition to the developed prototype systems andvisual detection. A direct comparison of the semiconductor densitometerand the modified flat-board scanner was not performed, due to technicalproblems (mounting and dismounting procedures during development of bothprototypes).
Visual Determination Visual detection of the aflatoxins was carriedout by radiation of the aflatoxins with a UV-light source of 366 nm in thedarkness. Spots from the samples and standards were compared for inten-sity and reported as Àsmaller than¿, Àbetween¿ or Àequivalent to¿ the cor-responding standards. Spots were marked2 for documentation with a softpencil after reporting of intensity.
2after finishing all densitometric measurements
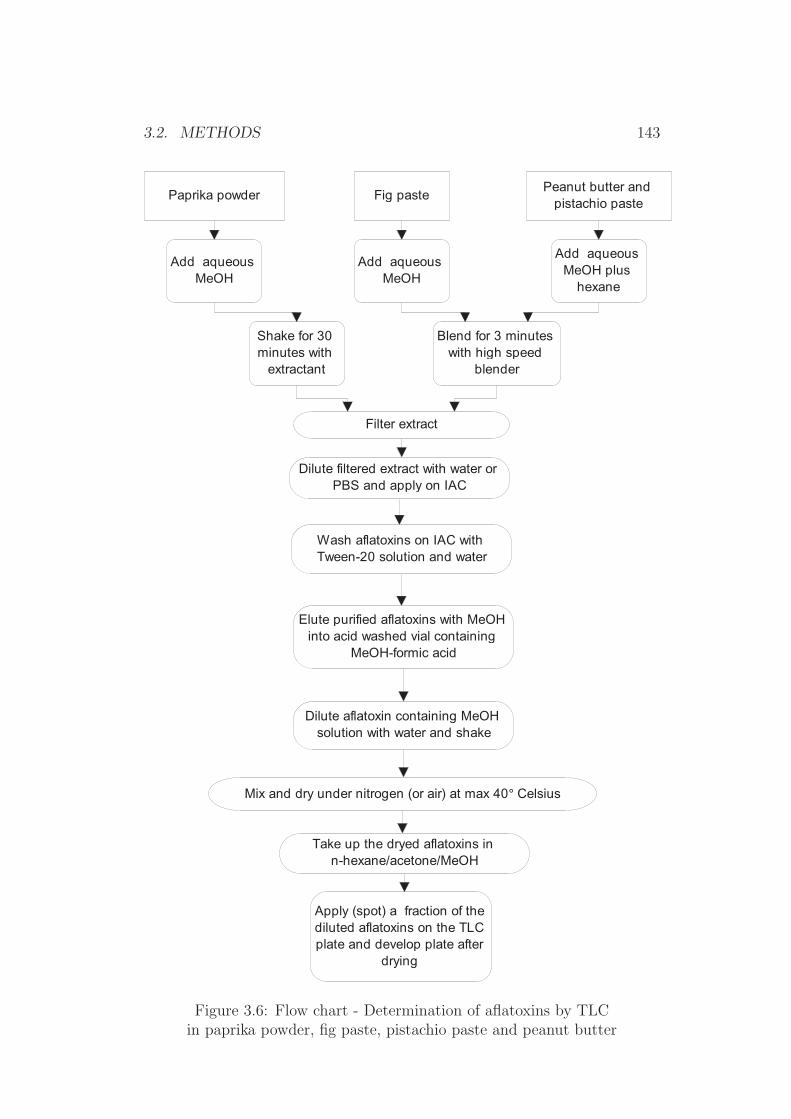
3.2. METHODS 143
Paprika powderPeanut butter and
pistachio pasteFig paste
Shake for 30 minutes with
extractant
Blend for 3 minutes with high speed
blender
Add aqueous MeOH
Add aqueous MeOH
Add aqueous MeOH plus
hexane
Filter extract
Dilute filtered extract with water or PBS and apply on IAC
Wash aflatoxins on IAC with Tween-20 solution and water
Elute purified aflatoxins with MeOH into acid washed vial containing
MeOH-formic acid
Dilute aflatoxin containing MeOH solution with water and shake
Mix and dry under nitrogen (or air) at max 40° Celsius
Take up the dryed aflatoxins in n-hexane/acetone/MeOH
Apply (spot) a fraction of the diluted aflatoxins on the TLC plate and develop plate after
drying
Figure 3.6: Flow chart - Determination of aflatoxins by TLCin paprika powder, fig paste, pistachio paste and peanut butter
144 CHAPTER 3. EXPERIMENTAL
CAMAG TLC-Scanner TLC-plates were scanned for fluorescencewith an excitation wavelength of 366 nm (mercury lamp). The emitted flu-orescence was filtered from the excitation with a cut-off filter of ≥ 418 nm.The densitometric scans were performed with the following parameters:
- scanwidth: 8 mm
- slitwidth: 0.2 mm
- data step resolution: 100 µm
Semiconductor Densitometer (SeBaDeC) The location of the afla-toxin spots was marked on the vertical sides of the TLC-plates3 and the de-tector unit was moved horizontally along the corresponding aflatoxins. Thedetector unit was moved manually with a threaded bold support. Scans wereperformed with a data sampling rate of 23 points per second4. Previous toeach scan the blank signal was adjusted to approximately 300 mV over anaflatoxin free region of the TLC-plate. The data was recorded and saved as atext-file5. The data was imported to a spread-sheet programme6 and plottedinto a diagram.
Measurements with the Modified Flat-board Scanner The mod-ified flat-board scanner that was built in co-operation with the FraunhoferInstitut fur Optik und Feinmechanik in Jena, Germany, was directly attachedto a PC via the parallel port. The driver that came with the scanner (Vis-taScan 3.5.1) was installed on the PC under Windows98 and the image wasscanned after a warm up phase of approximately 10 minutes in the advancedmode.
Thereafter the developed TLC plate was pre-viewed under a UV-lamp andthe area that contained the aflatoxin spots was marked with a fluorescent feltpen. The plate was then positioned at an angle of 90o on the image support(glass) of the scanner. Thus all spots with the same retention time werescanned at the same position along the UV-tube axis.
The TLC-plate was pre-viewed and the area containing the aflatoxins wasselected according to the previously marked dimensions (inside the fluores-cent felt pen corners).
3This was known from the scan with the CAMAG densitometer4The data sample rate was selected with the program MultiMet5tab-delimited numbers of the signal in mV6Microsoft Excel97

3.2. METHODS 145
TLC-plates were scanned with the device at a resolution of 300 dpi7 andat 36-bit colour depth8 and saved as an image file9. All automatic functionsof the scanner driver were disabled during this scan and manual adjustmentswere made to increase contrast and saturation if necessary.
The evaluation of the image was performed with an image measurementsoftware10. Therefore the colour channels of the image were extracted intosingle channels and only the blue-channel data was taken for further analy-sis11. To measure the aflatoxin spots the line intensity of a 71 pixels wideline was performed (the whole peak was covered). This line was positionedalong the aflatoxin spots, covering all spots of the same aflatoxin type. Theintensities were automatically transferred into a table and further processedwith a spread-sheet program12.
3.2.6 Salting Out Procedures
A volume of 100 ml of extractant was filled into a 100 ml volumetric cylinder.Sodium chloride or sucrose was added in portions of 0.5 g. The extractantwas then shaken, until all solids were diluted or a layer separation occurred.
3.2.7 Dry Mass Determination (Extract Residue)
A portion of the filtrate (approximately 1 ml) was weighed into a smallbeaker. The dry mass was calculated after evaporation of the extractant at102±2C until a constant weight was obtained.
3.2.8 Water Determination
The water determination of extractants was performed by the Karl-Fischermethod. An exactly measured amount of approximately 100 mg of the extrac-tant was injected in the reacting chamber. Results were directly calculatedby the Karl-Fischer device after calibration.
7dots per inch812-bit per channel of Red, Green and Blue (resolution of 2048)9TIFF-Format
10SigmaScan, SigmaScan Pro or NHI image11the image had to be reduced to 8-bit grayscale since the software did not support
higher values12Microsoft Excel97
146 CHAPTER 3. EXPERIMENTAL
3.2.9 Homogeneity Testing
Homogeneity testing was performed at two stages during material prepara-tion. At the 1st stage the material was tested for homogeneity after therequired amount of test material was prepared (bulk homogeneity). Afterachieving a positive result for bulk homogeneity the material was packed intest material containers and the homogeneity was tested again between ran-domly chosen containers (container homogeneity).For both homogeneity test series a fraction of 10 times 50 g (50 g = to-tal content of a material container) was taken for analysis. These fractionswere mixed again (or in the case of fig paste divided into small pieces ofapproximately 0.5 g) and split in two parts. All separated sub-fractions wereanalysed separately.
3.2.10 Statistical Tests
The statistical tests that were used during the collaborative trial studiesare briefly described below. For detailed descriptions and exact deviations ofthese parameters the following documents may be used [107, 142, 143, 167]. Itmust be noticed that for the adoption of analytical methods several differentparameters might be applied or defined. This holds true especially for theconfidence levels that exist for statistical tests.
For example, the adoption of a method according to AOAC Interna-tional13 requires the use of the application of a probability level of P =2.5% for Cochran and Grubbs outlier tests. In addition the maximum out-liers in a study must not exceed 22.2%. Other organizations might indicateother probability levels or do not explicitly regulate the maximum amountof accepted outliers [167].
Outlier Testing
The outlier identification of collaborative trial data was performed accordingto the AOAC harmonized protocol for the design, conduct and interpretationof method-performance studies [52]. This procedure requires the applica-tion of the Cochran outlier test (1-tail, P = 2.5%) followed by the Grubbsoutlier test (2-tail, P = 2.5%) for single and paired outliers. The AOACharmonised protocol limits the outliers to maximum 2/9 of all results. Thusa collaborative trial must not exceed 22.2% identified outliers for validation.The outlier identification scheme was performed according to the AOAC har-monized protocol [52] (Figure 3.7).
13All statistical tests described here were according to AOAC statutes.
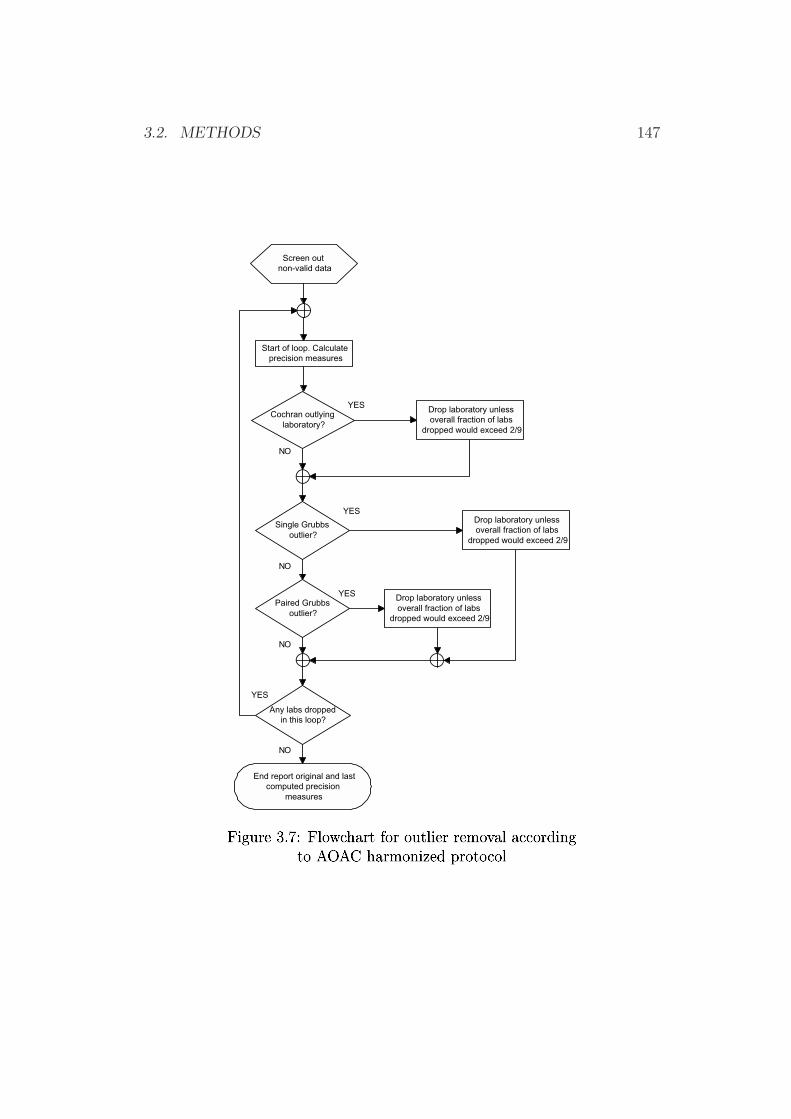
3.2. METHODS 147
Figure 3.7: Flowchart for outlier removal accordingto AOAC harmonized protocol
Screen out non-valid data
Start of loop. Calculate precision measures
Cochran outlying laboratory?
Single Grubbs outlier?
Paired Grubbs outlier?
Any labs dropped in this loop?
End report original and last computed precision
measures
Drop laboratory unless overall fraction of labs
dropped would exceed 2/9
Drop laboratory unless overall fraction of labs
dropped would exceed 2/9
Drop laboratory unless overall fraction of labs
dropped would exceed 2/9
YES
NO
YES
NO
YES
YES
NO
NO
Figure 3.7: Flowchart for outlier removal according
to AOAC harmonized protocol
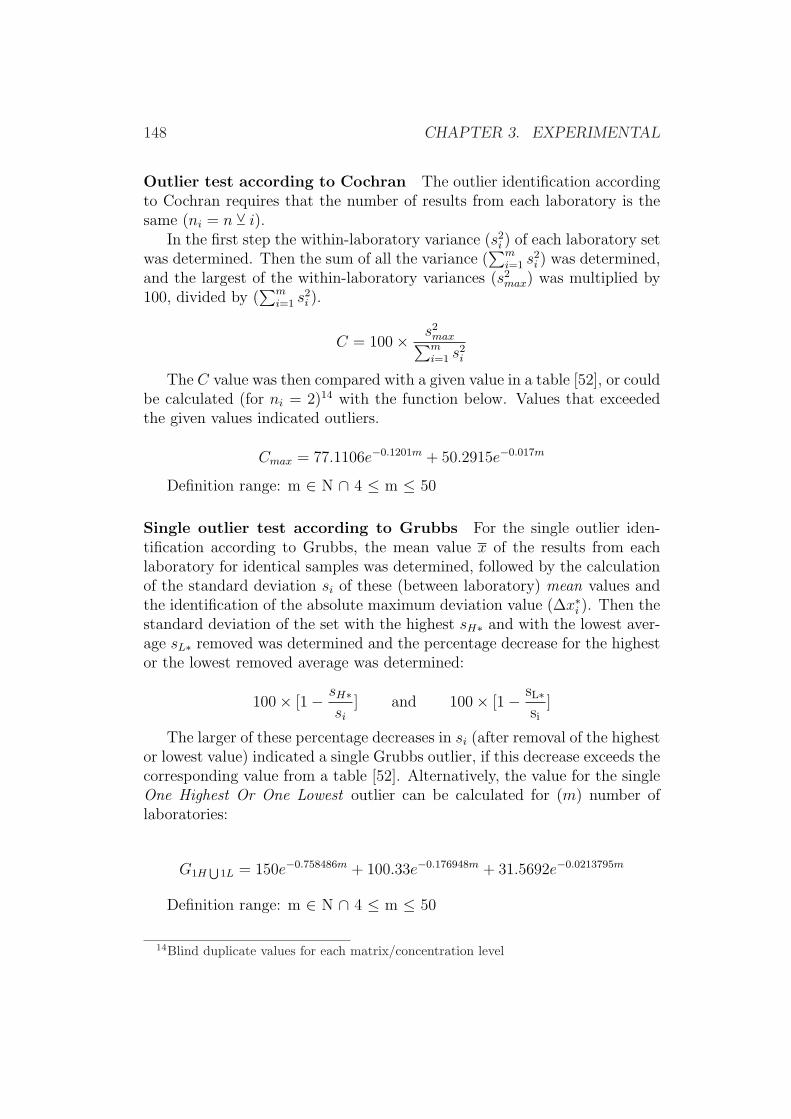
148 CHAPTER 3. EXPERIMENTAL
Outlier test according to Cochran The outlier identification accordingto Cochran requires that the number of results from each laboratory is thesame (ni = n Y i).
In the first step the within-laboratory variance (s2i ) of each laboratory set
was determined. Then the sum of all the variance (∑m
i=1 s2i ) was determined,
and the largest of the within-laboratory variances (s2max) was multiplied by
100, divided by (∑m
i=1 s2i ).
C = 100× s2max∑mi=1 s2
i
The C value was then compared with a given value in a table [52], or couldbe calculated (for ni = 2)14 with the function below. Values that exceededthe given values indicated outliers.
Cmax = 77.1106e−0.1201m + 50.2915e−0.017m
Definition range: m ∈ N ∩ 4 ≤ m ≤ 50
Single outlier test according to Grubbs For the single outlier iden-tification according to Grubbs, the mean value x of the results from eachlaboratory for identical samples was determined, followed by the calculationof the standard deviation si of these (between laboratory) mean values andthe identification of the absolute maximum deviation value (∆x∗i ). Then thestandard deviation of the set with the highest sH∗ and with the lowest aver-age sL∗ removed was determined and the percentage decrease for the highestor the lowest removed average was determined:
100× [1− sH∗si
] and 100× [1− sL∗si
]
The larger of these percentage decreases in si (after removal of the highestor lowest value) indicated a single Grubbs outlier, if this decrease exceeds thecorresponding value from a table [52]. Alternatively, the value for the singleOne Highest Or One Lowest outlier can be calculated for (m) number oflaboratories:
G1HS
1L = 150e−0.758486m + 100.33e−0.176948m + 31.5692e−0.0213795m
Definition range: m ∈ N ∩ 4 ≤ m ≤ 50
14Blind duplicate values for each matrix/concentration level
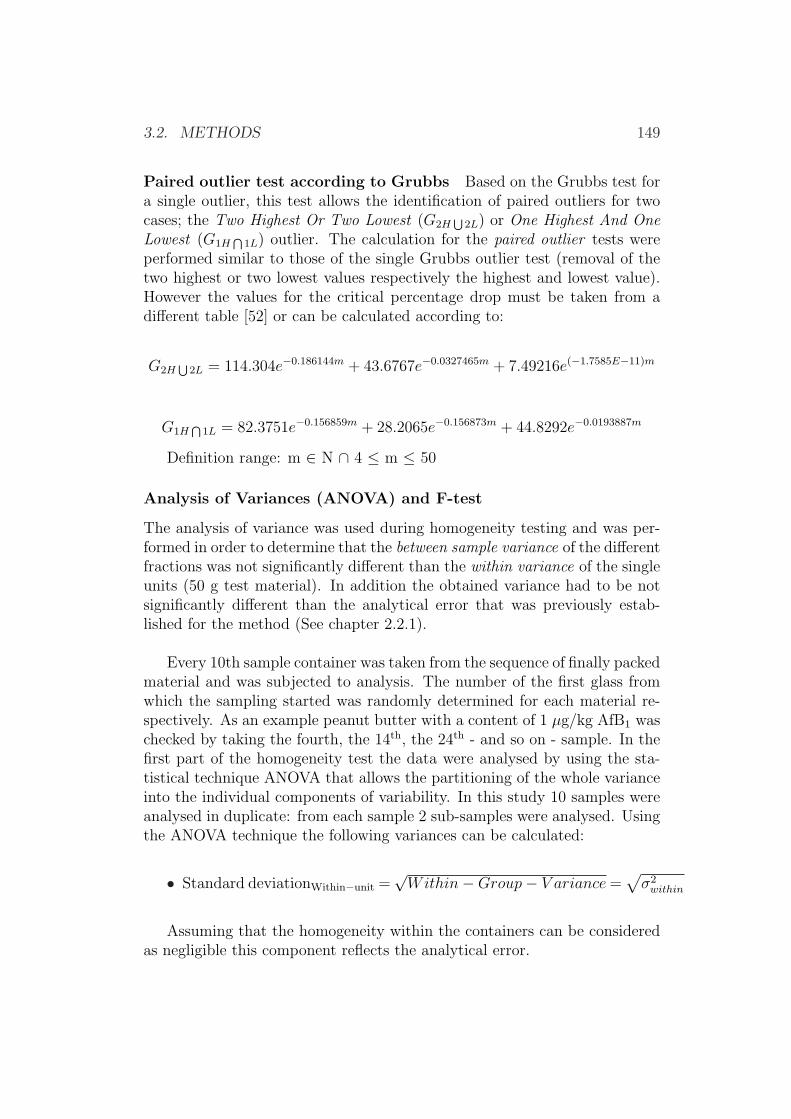
3.2. METHODS 149
Paired outlier test according to Grubbs Based on the Grubbs test fora single outlier, this test allows the identification of paired outliers for twocases; the Two Highest Or Two Lowest (G2H
S2L) or One Highest And One
Lowest (G1HT
1L) outlier. The calculation for the paired outlier tests wereperformed similar to those of the single Grubbs outlier test (removal of thetwo highest or two lowest values respectively the highest and lowest value).However the values for the critical percentage drop must be taken from adifferent table [52] or can be calculated according to:
G2HS
2L = 114.304e−0.186144m + 43.6767e−0.0327465m + 7.49216e(−1.7585E−11)m
G1HT
1L = 82.3751e−0.156859m + 28.2065e−0.156873m + 44.8292e−0.0193887m
Definition range: m ∈ N ∩ 4 ≤ m ≤ 50
Analysis of Variances (ANOVA) and F-test
The analysis of variance was used during homogeneity testing and was per-formed in order to determine that the between sample variance of the differentfractions was not significantly different than the within variance of the singleunits (50 g test material). In addition the obtained variance had to be notsignificantly different than the analytical error that was previously estab-lished for the method (See chapter 2.2.1).
Every 10th sample container was taken from the sequence of finally packedmaterial and was subjected to analysis. The number of the first glass fromwhich the sampling started was randomly determined for each material re-spectively. As an example peanut butter with a content of 1 µg/kg AfB1 waschecked by taking the fourth, the 14th, the 24th - and so on - sample. In thefirst part of the homogeneity test the data were analysed by using the sta-tistical technique ANOVA that allows the partitioning of the whole varianceinto the individual components of variability. In this study 10 samples wereanalysed in duplicate: from each sample 2 sub-samples were analysed. Usingthe ANOVA technique the following variances can be calculated:
• Standard deviationWithin−unit =√
Within−Group− V ariance =√
σ2within
Assuming that the homogeneity within the containers can be consideredas negligible this component reflects the analytical error.

150 CHAPTER 3. EXPERIMENTAL
• Between-Group-Variance = σ2between
• Overall variance = σ2total = σ2
between + σ2within
• Standard deviationBetweensamples =
√σ2
between+σ2within
2= σs
The latter component reflects the heterogeneity of the material and canonly be calculated if the F-test of the ANOVA indicates a significant dif-ference of σ2
between and σ2within. The material can be regarded as sufficiently
homogeneous if the variances mentioned above do not differ significantly fromthe variance of the repeatability of the method. This repeatability was de-termined in the in-house performance study. The equality of the varianceswas checked by using the F-test at the 95% confidence interval level.The ANOVA test was performed using an internal Macro provided by Mi-crosoft Excel.
t-test
The t-test was applied in addition to the ANOVA during the homogeneitytesting in order to check for any drift in the results during analysis. The testcomprises the following steps:
• The samples of each material were arranged in the chronological orderin which they had been analysed making up a row of 20 values.
• The mean (x1) of the 1st, 2nd and 3rd value and the mean (x2) of the18th, 19th and 20th value were calculated respectively. In case of a trendin the results the difference of these two values would be significant.
– In order to check for a significant difference of the means the t-value was calculated according to the following equation:
tcalc =|x1 − x2|
√3
STDEV
where SD is the standard deviation of the method determined inthe in-house performance study.
– The calculated t-value (tcalc)was compared with the critical t-value(tcrit). If tcalc is within the range of ±tcrit, the difference of themeans is not significant indicating that no trend of the results canbe observed.
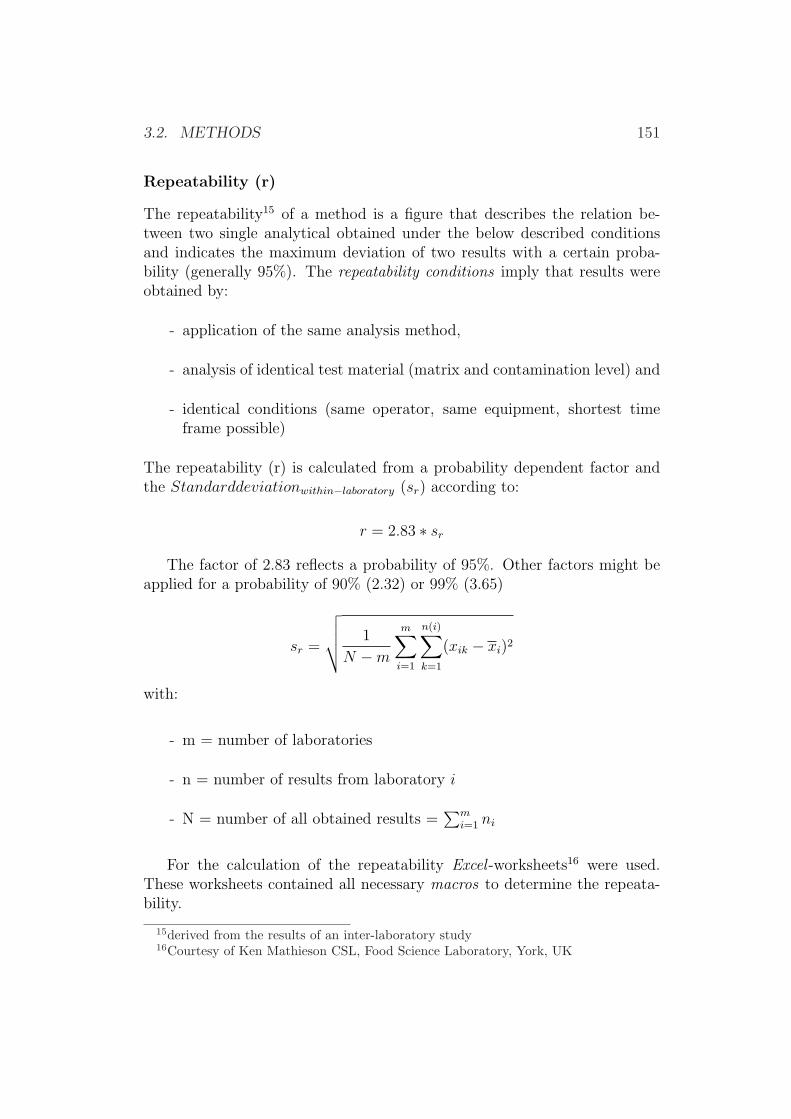
3.2. METHODS 151
Repeatability (r)
The repeatability15 of a method is a figure that describes the relation be-tween two single analytical obtained under the below described conditionsand indicates the maximum deviation of two results with a certain proba-bility (generally 95%). The repeatability conditions imply that results wereobtained by:
- application of the same analysis method,
- analysis of identical test material (matrix and contamination level) and
- identical conditions (same operator, same equipment, shortest timeframe possible)
The repeatability (r) is calculated from a probability dependent factor andthe Standarddeviationwithin−laboratory (sr) according to:
r = 2.83 ∗ sr
The factor of 2.83 reflects a probability of 95%. Other factors might beapplied for a probability of 90% (2.32) or 99% (3.65)
sr =
√√√√ 1
N −m
m∑i=1
n(i)∑
k=1
(xik − xi)2
with:
- m = number of laboratories
- n = number of results from laboratory i
- N = number of all obtained results =∑m
i=1 ni
For the calculation of the repeatability Excel -worksheets16 were used.These worksheets contained all necessary macros to determine the repeata-bility.
15derived from the results of an inter-laboratory study16Courtesy of Ken Mathieson CSL, Food Science Laboratory, York, UK
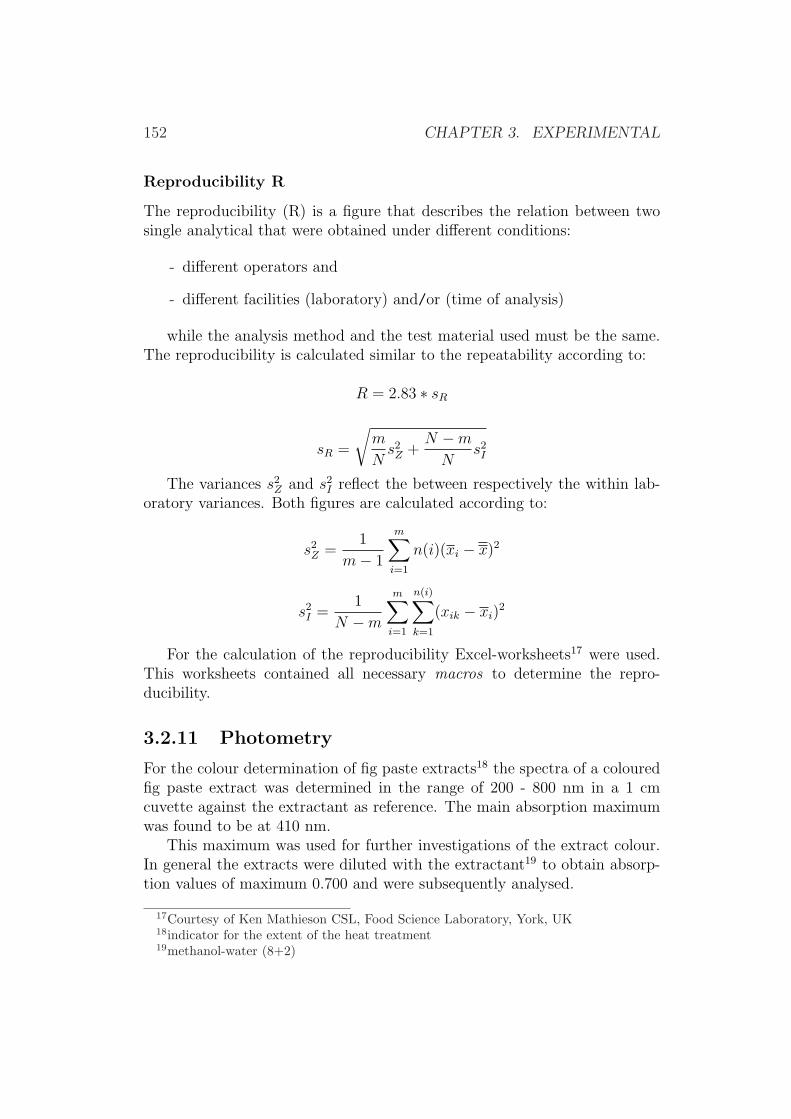
152 CHAPTER 3. EXPERIMENTAL
Reproducibility R
The reproducibility (R) is a figure that describes the relation between twosingle analytical that were obtained under different conditions:
- different operators and
- different facilities (laboratory) and/or (time of analysis)
while the analysis method and the test material used must be the same.The reproducibility is calculated similar to the repeatability according to:
R = 2.83 ∗ sR
sR =
√m
Ns2
Z +N −m
Ns2
I
The variances s2Z and s2
I reflect the between respectively the within lab-oratory variances. Both figures are calculated according to:
s2Z =
1
m− 1
m∑i=1
n(i)(xi − x)2
s2I =
1
N −m
m∑i=1
n(i)∑
k=1
(xik − xi)2
For the calculation of the reproducibility Excel-worksheets17 were used.This worksheets contained all necessary macros to determine the repro-ducibility.
3.2.11 Photometry
For the colour determination of fig paste extracts18 the spectra of a colouredfig paste extract was determined in the range of 200 - 800 nm in a 1 cmcuvette against the extractant as reference. The main absorption maximumwas found to be at 410 nm.
This maximum was used for further investigations of the extract colour.In general the extracts were diluted with the extractant19 to obtain absorp-tion values of maximum 0.700 and were subsequently analysed.
17Courtesy of Ken Mathieson CSL, Food Science Laboratory, York, UK18indicator for the extent of the heat treatment19methanol-water (8+2)
Chapter 4
Summary
Aflatoxins are toxic metabolites that can occur in food and animal feed.Due to their hepatotoxic and carcinogenic properties they are regulated in alarge number of countries. Recently the European Commission set new legallimits for aflatoxin B1 and total aflatoxins [46]. To support the monitoringof these contaminants, the need for adequate (validated) analytical methodswas expressed.
The main approach of this work was to develop new, adapt already ex-isting, and finally validate HPLC and TLC methods. Main focus during thisprocess was to put fast, efficient, robust, and user friendly procedures onthe use of non toxic solvents. Due to the structure of this work, no generalconclusions can be reached. Thus several single and independent conclusionswill be drawn, while as a matter of fact, all given goals of this work wereachieved successfully.
Concerning method development and validation (collaborative trial study),it can be concluded that robust, efficient and user friendly methods wereachieved. The described methods were applicable for most relevant matricessuch as fig paste, paprika powder, peanut butter, pistachio paste, animalfeedingstuff, and infant formula, while only small deviations in the meth-ods were required for adoption to the various matrices and target levels.These include the extraction solvent, the immunoaffinity clean-up and in-jection volume. The extraction of sample material was identified to be acritical procedure, since certain extractants, such as aqueous acetonitrile,can lead to false results for aflatoxin determination (recoveries of more than150%). Subsequently, after drafting the methods, collaborative studies wereconducted.
Collaborative trial study on paprika powder, pistachio paste, peanutbutter, and fig paste For this HPLC method validation, excellent pre-
153
154 CHAPTER 4. SUMMARY
cision data was obtained for all matrices. Repeatability and reproducibilityvalues were far below figures that were predicted through comparison withprevious studies [145]. Thus spiked levels of 2.4 µg/kg and 9.6 µg/kg fortotal aflatoxins which included incorporation of amounts of 1.0 µg/kg and4.0 µg/kg of aflatoxin B1 respectively. Recoveries for total aflatoxins rangedfrom 71% to 92% with the corresponding recoveries for aflatoxin B1 rangingfrom 82% to 109%. Based on results for spiked samples (blind pairs at twolevels) as well as naturally contaminated samples (blind pairs at four lev-els including blank) the relative standard deviation for repeatability (RSDr)ranged from 4.6% to 23.3% for total aflatoxins and from 3.1% to 20.0% foraflatoxin B1. The relative standard deviation for reproducibility (RSDR)ranged from 14.1% to 34.2% for total aflatoxins, and from 9.1% to 32.2% foraflatoxin B1. The method showed acceptable within-laboratory and between-laboratory precision for all four matrices, as evidenced by HORRAT ratios,at the low levels of determination for both total aflatoxins and aflatoxin B1.
Collaborative study on infant formula Concerning this collaborativestudy, samples were spiked at levels of 0.1 µg/kg and 0.2 µg/kg for afla-toxin B1. Recoveries ranged from 101% - 92%. Based on results for spikedsamples (blind pairs at two levels) as well as naturally contaminated samples(blind pairs at three levels) the relative standard deviation for the RSDr
ranged from 3.5% - 14%. The relative standard deviation for the RSDR
ranged from 9% - 23%.
Collaborative study on animal feedingstuff For this collaborative studysamples were spiked at levels of 1.2 µg/kg and 3.6 µg/kg for aflatoxin B1. Re-coveries ranged from 74% - 157%. Based on results for spiked samples (blindpairs at two levels) as well as naturally contaminated samples (blind pairs atthree levels) the relative standard deviation for the RSDr ranged from 5.9%- 8.7%. The relative standard deviation for the RSDR ranged from 17.5% -19.6%.
All obtained precision data from these collaborative studies fulfilled thecriteria for analytical methods that were given by the European Committeefor Standardisation (CEN) [51]. Thus the work clearly showed that with careand attention to detail during the organization of the collaborative trial itwas possible to achieve impressive performance characteristics even at lowlimits of detection.
TLC-method development Concerning the development of a novel TLCmethod that fully abstains from the use of any chlorinated or highly toxic
155
solvents, SIMILAR in-house performance data was obtained, as reported forthe HPLC method. The sample preparation was derived from the previousprocedures used for HPLC and contained an immunoaffinity clean-up step.Such a clean up procedure is still uncommon for TLC methods. Spottingsolvents and mobile phases were developed on the base of non-chlorinatedand non-toxic solvent mixtures. It was found that a spotting solvent basedon n-hexane, acetone and methanol showed excellent properties, while a mo-bile phase based on a mixture of tert-butylmethylether, methanol and watersufficiently separated aflatoxin spots on normal silica gel TLC-plates.
Simplified TLC-densitometers Two new simple and low-cost alterna-tives for currently available TLC densitometers were described and evalu-ated: a miniaturized device based on a solid stated detector cell (SeBaDeC)and a modified office scanner. The first approach was found to be an inex-pensive alternative to the currently used equipment. Due to the low powerconsumption of a novel UV-light source this SeBaDeC principle offers batteryoperation. Furthermore the lifetime of the light source is superior comparedto mercury lamps or gas tubes.
The signal processing and data recording were based on inexpensive andcommonly available electronic components. The performance data demon-strated that the SeBaDeC is suitable for the determination of aflatoxins atEuropean regulatory limits of 2 µg/kg aflatoxin B1 (respectively 4 µg/kgtotal aflatoxins) in combination with the previously described TLC method.However, at the current state of development, further improvements of theprototype in design of the cell and electronic circuits are still conceivable.However it is questionable if the effort of such improvements will meet theexpectations, since further performance characteristics are not required foraflatoxin measurements. Other developments, such as the application of theSeBaDeC principle for the measurement of aflatoxins on Florisil tips are morepromising, since this would allow a rapid determination of total aflatoxins(for screening purposes) without any chromatographic separation.
The approach by modification of an office scanner was found to be anotherinteresting and user friendly alternative. In this approach the light tube wassubstituted by a commonly available UV-tube, while this excitation light wascut-off at the detector module with an high-pass filter, thus allowing onlythe fluorescence to be measured. For measurement, the resulting imageswere processed with imaging software. The sensitivity of this devices hasbeen shown to be sufficient to determine aflatoxin amounts of ≥2 ng Scannerabsolute.
With some limitations, both devices (Scanner and SeBaDeC) have shown

156 CHAPTER 4. SUMMARY
to compare with a commercially available scanner for the densitometric mea-surement of aflatoxins on TLC-plates.
Bibliography
[1] Sydenham EW, Shephard GS (1996) Chromatographicand allied methods of analysis for selected mycotoxins,in: Gilbert J (Editor), Progress in Food ContaminantAnalysis, ISBN: 0-7514-0337-7
[2] Steyn PS (1998) The biosynthesis of mycotoxins. vueMed Vet 149: 469-478
[3] Cole RJ, Cox RH (1981) Handbook of toxic fungalmetabolites. Academic Press, New York ISBN: 0-12-179760-0
[4] Bullerman LB (1999) Mycotoxins, in: Robinson RK,Batt CA, Patel PD (Editors), Encyclopedia of food mi-crobiology, Academic Press, ISBN: 0-12-227070-3
[5] Moss MO (1989) Mycotoxins of Aspergillus and otherfilamentous fungi. J Appl Bacteriol Symp Suppl 1989:69S-81S
[6] Goldblatt LA (1969) Aflatoxin - Scientific Background,Control, and Implications, pp. 13-46 (Aflatoxin Forma-tion by Aspergillus Flavus). Academic Press, New York
[7] Chitrangada D, Mishra HN (2000) Effects of aflatoxinB1 detoxification on the physicochemical properties andquality of ground nut meal. Food Chem 70: 483-487
[8] Bhatnagar D, Lillehoj EB, Benett JW (1991) Biolog-ical detoxification of Mycotoxins, in: Mycotoxins andAnimal Foods by Smith JE (Ed.). CRC-Press ISBN: 0-8493-4904-4
157
158 BIBLIOGRAPHY
[9] European Commission (1994) Mycotoxins in HumanNutrition and Health (Document EUR 16048 EN). Eu-ropean Commission Bruxelles
[10] Rustom IYS (1997) Aflatoxin in food and feed: occur-rence, legislation and inactivation by physical methods.Food Chem 59: 57-67
[11] International Agency for Research on Cancer (1993)IARC Monographs on the evaluation of carcinogenicrisk to humans. Volume 56, IARC Working goup, WorldHealth Organization, Lyon, France
[12] Marquardt H, Schafer SG (1994) Lehrbuch der Toxikolo-gie. BI-Wissenschaftsverlag, Mannheim, Germany
[13] Terao K, Ohtssubo K (1991) Biological Activities ofmycotoxins: field and experimental mycotoxicosis, pp.455-488 in: Mycotoxins and Animal Foods by Smith JE(Ed.), CRC Press ISBN: 0-8493-4904-4
[14] Hsu IC, Metcalf RA, Sun T, Welsh JA, Wang NJ, HarrisCC (1991) Mutational hotspot in the p53 gene in humanhepatocellular carcinomas. Nature 350: 427-428
[15] Bressac B, Kew M, Wands J, Ozturk M (1991) SelectiveG to T mutations of p53 gene in hepatocellular carci-noma from southern Africa. Nature 350: 429-431
[16] van Egmond HP, Svensson UK, Fremy JM (1997) My-cotoxins, in: Monograph on residues and contaminantsin milk and milkproducts. International Dairy FederationISBN: 9-290-98025-8
[17] Muecke W (1999) Schimmelpilze, Vorkommen - Gesund-heitsgefahren - Schutzmassnahmen. Ecomed ISBN: 3-609-68000-9
[18] Bhatnager D, Cleveland TE, Payne GA (1999) As-pergillus flavus, in: Robinson RK, Batt CA, Patel PD(Editors), Encyclopedia of food microbiology, AcademicPress, ISBN: 0-12-227070-3
BIBLIOGRAPHY 159
[19] Scott PM (1991) Methods of analysis for mycotoxins - anoverview, in: Analysis of oilseeds, fats and fatty foods,by Rossel JB & Pritchard JLR (Ed.) ISBN: 1-85166-614-1
[20] Moss MO (1991) Economic importance of mycotoxins -recent incidences. Int Biodeterior 27: 195-204
[21] Bhat RV (1988) Mould deterioration of agricultural com-modities during transit: problems faced by developingcountries. Int J Food Microbiol 7: 219-225
[22] World Health Organization (1997) World health statis-tics quarterly - Food safety and foodborne disease. 50:143-147
[23] Battalico A (1989) Presence, persistence and toxicityof mycotoxins in foods, pp. 51-60 in: Proceedings ofthe International Symposium on: Food Safety: newmethods for research and control, by De Paoli E, GalliCL, Restani P (Ed.) Milan Fair, November 22-23, 1998ISBN: 8821419231
[24] Pittet A (1998) Natural occurrence of mycotoxins infoods and feeds - an updated review. vue Med Vet 149:479-492
[25] Strange RN (1991) Natural occurrence of mycotoxins ingroundnuts, cottonseed, soya, and cassava, in: Mycotox-ins and Animal Foods by Smith JE (Ed.). CRC-PressISBN: 0-8493-4904-4
[26] Bhat RV, Vasanthi S, Rao BS, Rao RN, Rao VS, Na-garaja KV, Bai RG, Prasad CAK, Vanchinathan S, RoyR, Saha S, Mukherjee A, Ghosh PK, Toteja GS, SaxenaBN (1997) Aflatoxin B1 contamination in maize samplescollected from different geographical regions of India - amulticentre study. Food Addit Contam 14: 151-156
[27] Medina-Martinez MS, Martinez AJ (2000) Mould occur-rence and aflatoxin B1 and fumonisin B1 determinationin corn samples in Venezuela. J Agric Food Chem 48:2833-2836
160 BIBLIOGRAPHY
[28] Resnik S, Neira S, Pacin A, Martinez E, Apro N, LatreiteS (1996) A survey of the natural occurrence of aflatoxinsand zearalenone in Argentine field maize: 1983-1994.Food Addit Contam 13: 115-120
[29] Bhat RV, Vasanthi S, Rao BS, Rao RN, Rao VS, Na-garaja KV, Bai RG, Prasad CAK, Vanchinathan S, RoyR, Saha S, Mukherjee A, Ghosh PK, Toteja GS, Sax-ena BN (1996) Aflatoxin B1 contamination in groundnutsamples collected from different geographical regions ofIndia - a multicentre study. Food Addit Contam 13: 325-331
[30] Dahvan AS, Choudary MR (1995) Incidence of aflatox-ins in animal feedstuffs: a decade’s scenario in India.JAOAC 78: 693-698
[31] Scudamore KA, Hetmanski MT, Chan HK, Collins S(1997) Occurrence of mycotoxins in raw ingredience usedfor animal feeding stuffs in the United Kingdom in 1992.Food Addit Contam 14: 157-173
[32] Arim RH, Ferolin CA, Dumada-Ug LM (1995) Compar-ison of three methods for the determination of aflatoxinsin copra meal. Food Addit Contam 12: 415-420
[33] Pohland AE (1993) Mycotoxins in rewiev. Food AdditContam 10: 17-28
[34] Abdulkadar AHW, Al-Ali A, Al-Jedah J (2000) Afla-toxin contamination in edible nuts imported in Qatar.Food Control 11: 157-160
[35] Scholten JM, Spanier MC (1996) Determination of afla-toxin B1 in pistachio kernels and shells. JAOAC 79:1360-1364
[36] Pinto VEF, Vaamonde G, Brizzio SB, Apro N (1991)Aflatoxin production in soybean varieties grown in Ar-gentina. J Food Prot 54: 542-545
[37] Muhlemann M, Luthy J, Hubner P (1997) Myco-toxin contamination of food in Ecuador. Mitt GebieteLebensm Hyg 88: 474-496
BIBLIOGRAPHY 161
[38] Pineiro MS, Dawson R, Costarrica ML (1996) Mon-itoring programme for mycotoxin contamination inUruguayan food and feeds. Natural Toxins 4: 242-245
[39] Hussain M, Vojir F (1993) Stichprobenplan fur die Ab-nahmeprufung beim Import getrockneter Feigen. DtschLebensm Rundsch 89: 379-383
[40] Takahashi T (1993) Aflatoxin contamination in nutmeg:analysis of interfering TLC spots. J Food Sci 58: 197-198
[41] Shamsuddin ZA, Khan MA, Khan BA, Ahmad MA, Ah-mad A (1995) Contamination of red chilli with aflatoxinB1 in Pakistan. Mycotoxin Res 11: 21-24
[42] Patel S, Hazel CM, Winterton AGM, Mortby E (1996)Survey of ethnic foods for mycotoxins. Food Addit Con-tam 13: 833-841
[43] Maxwell SM, Apeagyei F, de Vries HR, Mwanmut DDand Hendrickse RG (1989) Aflatoxins in breast milk,neonatal cord blood and sera of pregnant woman. To-cicol Rev 8: 19-29
[44] Weidenborner M (1999) Lebensmittelmykologie. Behr’sVerlag, Hamburg Germany ISBN: 3-86022-457-3
[45] Food and Agriculture Organization of the United Na-tions (1995) Worldwide regulations for mycotoxins 1995- A compendium, FAO Food and Nutrition Paper no.64. FAO, Rome
[46] Commission Directive 98/1525/EC of 16th July 1999amending Directive 97/194/EC on aflatoxins in foodand Commission Directive 1999/39/EC of 6 May 1999amending Directive 96/5/EC on processed cereal-basedfoods and infant formulae for infants and young children,Official Journal of the European Communities L124/8
[47] Commission Decision 97/613/EC of 8 September 1997on the temporary suspension of imports of pistachiosand certain products derived from pistachios originat-ing in or consigned from Iran. Official Journal L 248,11.09.1997
162 BIBLIOGRAPHY
[48] Commission Decision 1999/356/EC of 28 May 1999 onthe temporary suspension of imports of peanuts and cer-tain products derived from peanuts originating in or con-signed from Egypt. Official Journal L 139, 02.06.1999
[49] Wyatt RD (1991) Poultry, in: Mycotoxins and AnimalFoods by Smith JE (Ed.). CRC-Press ISBN: 0-8493-4904-4
[50] Hansen RB, Norman KL (1999) Economic importance ofaflatoxin to the Australian peanut industry, in: DietzgenRD (Editor) Elimination of aflatoxin contamination inpeanut - ACIAR Proceedings No. 89. Australian Cen-tre for International Agricultural Research, Canberra.ISBN: 1-86320-270-6
[51] European Committee for Standardization (1996) Doc-uments prEN-ISO 15141-1 and prEN-ISO 15141-2 onFood analysis, Horizontal methods - Criteria Analyticalmethods for mycotoxins, Brussels, Belgium
[52] William Horwitz, (1995) Protocol for the design, con-duct and interpretation of method-performance studies(Technical report). Pure & Appl Chem 67: 331-343
[53] Coker RD, Jones BD (1988) Determination of myco-toxins, in: Food Science & Technology - A series ofmonographs, HPLC in food analysis. by R. Macrae (Ed.)ISBN: 0-12-464781-2
[54] Betina V (1989) Chromatographic methods as tools inthe field of mycotoxins. J Chrom 477: 187-233
[55] Scott PM (1993) Recent developments in methods ofanalysis for mycotoxins in foodstuffs. Trends in AnalChem 12: 373-381
[56] Ikins WG (1991) Modern methods of analyzing myco-toxins in foods, in: Instrumental methods for qualityassurance in food, by DYC Fung & RF Matthews (Ed.)Marcel Dekker ISBN: 0-82478-278-X
[57] Leitao J, Bailly J-R, de Saint Blanquat G (1990) Det-ermination of mycotoxins in grains and related products,

BIBLIOGRAPHY 163
in: Food analysis by HPLC, by LML Nollet ISBN: 0-8247-8623-8
[58] van Rhijn JA, Viveen J, Tuinstra LGMTh (1992) Auto-mated determination of aflatoxin B1 in cattle feed bytwo-column solid phase extraction with on-line high-performance liquid chromatography. J Chrom 592: 265-269
[59] Official Methods of Analysis of AOAC International(1995) Natural toxins Vol II Chapter 47: 1-35
[60] Horwitz W, Albert R, Nesheim S (1993) Reliability ofmycotoxin assays - an update. JAOAC Int 76: 461-491
[61] Scott PM, Trucksess MW (1997) Application of Im-munoaffinity Columns to Mycotoxin Analysis (Review).JAOAC 80: 941-949
[62] Kok WTh, van Neer ThCH, Traag WA, TuinstraLGMTh (1986) Determination of aflatoxins in cattle feedby liquid chromatography and post-column derivatiza-tion with electrochemically generated bromine. J Chro-matogr 367: 231-236
[63] Roos AH, van der Kamp HJ, Marley EC (1997)Advantages of Immunoaffinity Columns compared toFlorisil/C18 Columns for the Determination of Aflatox-ins in Animal Feed. Mycotoxin Research 13: 2-10
[64] van Egmond HP, Heisterkamp SH, Paulsch WEE (1991)EC-collaborative study on the determination of aflatoxinB1 in animal feeding stuffs. Food Addit Contamin 8: 17-29
[65] Patey AL, Sharman M, Gilbert J (1990) Determin-ation of aflatoxin B1 levels in peanut butter usingan immunoaffinity column cleanup procedure: inter-laboratory study. Food Addit Contam 7: 515-520
[66] Patey AL, Sharman M, Gilbert J (1991) Liquid-chromatographic determination of aflatoxin levels inpeanut butters using an immunoaffinity column cleanup
164 BIBLIOGRAPHY
method: international collaborative trial. JAOAC 74:76-81
[67] Worner FM, Patey AL, Wood R (1992) Determination ofthe levels of aflatoxin in peanut butter using the aflaprepimmunoaffinity column clean-up procedure: collabor-ative trial. J Assoc Publ Analysts 28: 1-10
[68] Trucksess MW, Stack ME, Nesheim S, Page SW, AlbertRH, Hansen TJ, Donahue KF (1991) Immunoaffinitycolumn coupled with solution fluorimetry or liquid chro-matography post-column derivatization for determin-ation of aflatoxins in corn [maize], peanuts and peanutbutter: collaborative study. J Assoc Off Anal Chem 74:81-88
[69] Standards Measurements and Testing Programme. Ded-icated Call for Proposals (95/C 148/07). The Valida-tion of analytical methods to determine the content ofaflatoxin, ochratoxin, patulin in foodstuffs of vegetableorigin. SMT4-CT96-2045 Project
[70] Beonke A (1998) Method validation for mycotoxin det-ermination in food and feedstuffs. Trends in analyticalchemistry 17: 10-16
[71] Crosby NT (1984) Review of current and future analyt-ical methods for the determination of mycotoxins, FoodAdd Contam 1: 39-44
[72] Eppley RM (1966) A versatile procedure for assay andpreparatory separation of aflatoxins from peanut butterproducts, J. Assoc. Off. Anal. 49, 1218-1223
[73] Goto T, Manabe M, Matsuura S (1979) Application ofHPLC to the analysis of aflatoxins in foods and feeds -Preparation of sample and column. Agric Biol Chem 43:2591-2592
[74] Robertson jr JA, Louise SL, Cucullu AF, Goldblatt LA(1965) Assay of aflatoxin in peanuts and peanut prod-ucts using acetone-hexane-water for extraction. J AmerOil Chem Soc 42: 467-471

BIBLIOGRAPHY 165
[75] Thean JE, Lorenz DR, Wilson DM, Rodgers K, Gueld-ner RC (1980) Extraction, Cleanup, and QuantitativeDetermination of Aflatoxins in Corn. J Assoc Anal Chem63: 631-633
[76] Yin L (1969) Note on acetonitrile as an extracting sol-vent for aflatoxins, J. Assoc. Off. Anal. 52, 880
[77] Bradburn N, Coker RD, Blunden G (1995) A compara-tive study of solvent extraction efficiency and the perfor-mance of immunoaffinity and solid phase columns on thedetermination of aflatoxin B1. Food Chem 52: 179-185
[78] Egana JA, Candlish AAG (1993) Immunoaffinity col-umn chromatography for aflatoxins: assessment withacetone/water extraction procedure, in: Scudamore J(Editor) Proceedings of a UK Workshop held on 21.-23. April 1993 at Brunel University on Occurrence andsignificance of myctoxins. pp 217-221
[79] Garner RC, Whattam MM, Taylor PJL, Stow MW(1993) Analysis of United Kingdom spices for aflatox-ins using an immunoaffinity column clean-up procedurefollowed by high-performance liquid chromatographicanalysis and post-column derivatization with pyridiniumbromide perbromide. J Chromatogr 648: 485-490
[80] Patey AL, Sharman M, Gilbert J (1991) Liquid Chrom-atographic Determination of Aflatoxin Levels in PeanutButter Using an Immunoaffinity Column CleanupMethod: International Collaborative Trial. JAOAC 74:76-81
[81] RHONE-POLENC DIAGNOSTICS (1996) Aflaprep-Brochure. Rhone-Polenc Diagnostics, Glasgow, UK
[82] Roch OG, Blunden G, Coker RD, Nawaz S, (1992)Development and validation of a solid phase extrac-tion/HPLC method for the determination of aflatoxinsin groundnut meal. Chromatographia 33: 208-212
[83] Stroka J, Anklam E, Joerissen U, Gilbert J (2000) Im-munoaffinity column cleanup with liquid chromatogra-phy using post-column bromination for determination
166 BIBLIOGRAPHY
of aflatoxins in peanut butter, pistachio paste, fig paste,and paprika powder: collaborative study. JAOAC Int83: 320 - 340
[84] Werner, G., 1991, Bestimmung der Aflatoxine in Fut-termitteln nach selektiver Reinigung an einer Im-munoaffinitaetssaeule, Agribiological Research, 44 (4),289-298
[85] Sharman M, Gilbert J (1991) Automated aflatoxinanalysis of food and animal feeds using immunoaffin-ity column clean-up and high-performance liquid chrom-atographic determination. J Chromatography 543: 220-225
[86] Chang HHL, de Fries JW, Hobbs WE (1979) Compar-ative study of two methods for extraction of aflatoxinfrom peanut meat and peanut butter. JAOAC 62: 1281-1284
[87] Shotwell OL, Goulden, ML (1977) Aflatoxin: compari-son of analyses of corn by various methods. JAOAC 60:83-88
[88] Peusch M, Mueller-Seitz E, Petz M, Mueller A, An-klam E (1997) Extraction of capsaicinoids from chillies(Capsicum frutenscens L.) and paprika (Capsicum an-nuum L.) using supercritical fluids and organic solvents.Z Lebensm Unters Forsch A 204: 351-355
[89] Jones BD (1972) Methods of aflatoxin analysis (G70).The Tropical Products Institute, London.
[90] Traag WA, van Trijp JMP, Tuinstra LGMTh (1987)Sample clean-up and post-column derivatization for thedetermination of aflatoxin B1 in feedstuffs by liquid chro-matography. J Chromatogr 396: 389-394
[91] Jain A, Hatch R (1980) Determination of Aflatoxins inCompound Feedstuffs Containing Citrus Pulp. J AssocOff Anal Chem 63: 626-630
[92] Tuinstra LGMTh ,Verhuelsdonk CAH, Bronsgeest JM,Paulsch WE (1975) Aflatoxin B1 in compound Feedstuffs
BIBLIOGRAPHY 167
containing Citrus Pulp. Procedures for Screening andsemi-quantitative Determination. Netherlands J AgricSci 23: 10-17
[93] Betina V (1993) in: Chromatography of mycotoxins -techniques and applications. J Chromatogr library 54:141-251
[94] Dyson N (1998) Chromatographic Integration Methods,Second Edition. The Royal Society of Chemists, UKISBN: 0-85404-510-4
[95] Meyer VR (1992) Praxis der Hochleistungs -Flussigkeitschromatographie. ISBN: 379355452X
[96] Commission Directive 87/410/EC of 14th July 1987, lay-ing down the methods to be used for detection residues ofsubstances having a hormonal action and of substanceshaving a thyrostatic action, Official Journal of the Eu-ropean Communities L223/18
[97] Kussak A, Andersson B, Andersson K (1993) Automatedsample clean-up with solid-phase extraction for the det-ermination of aflatoxins in urine by liquid chromatogra-phy. J Chrom 616: 235-341
[98] Beaver RW (1990) Effects of injection solvent and mo-bile phase on efficiency in reversed-phase liquid chrom-atographic determination of aflatoxin M1. JAOAC 73:69-70
[99] Meyer V (1999) Fallstricke und Fehlerquellen der HPLCin Bildern. Wiley-VCH ISBN: 3-527-29794-4
[100] Takahashi DM (1977) Reversed-phase high performanceliquid chromatographic analytical system for aflatoxinsin wines with fluorescence detection. J Chrom 131: 147-156
[101] Joshua H (1993) Determination of aflatoxins byreversed-phase high performance liquid chromatograhpywith post-column in-line photochemical derivatizationand fluorescence detection. J Chrom 654: 247-254
168 BIBLIOGRAPHY
[102] Cepeda A, Franco CM, Fente CA, Vazquez BI, Ro-driguez JL, Prognon P, Mahuzier (1996) Postcolumn ex-citation of aflatoxins using cyclodextrins in liquid chro-matography for food analysis. J Chrom A 721: 69-74
[103] Sherma J (2000) Thin-layer Chromatography - The un-derappreciated analytical alternative. Inside LaboratoryManagement (AOAC Int) Jan. 2000
[104] Leming L, Zhang J, Wang P, Wang Y, Chen J (1998)Thin-layer chromatography of mycotoxins and compari-son with other chromatographic methods. J ChromatogrA 815: 3-20
[105] Prosek M (2000) My favorite separation method, in:Planar Chromatography 2000, Proceedings of the In-ternational Society for Planar Separations in Lillafured,Hungary.
[106] Kaiser RE (1986) Chromatographic Methods - PlanarChromatography vol. 1. Dr. Alfred Huethig Verlag, Hei-delberg, Basel ISBN: 3-7785-0780-X
[107] Amtliche Sammlung von Untersuchungsverfahren nachparagraph 35 LMBG (1999) Nachweis und Bestimmungder Aflatoxine B1, B2, G1 und G2 in Lebensmitteln. VolI/1 00.00-2
[108] Schweizerisches Lebensmittelbuch (1994) ToxischeStoffe naturlichen Ursprungs Vol VI.
[109] Montreal Protocolhttp://www.unepie.org/ozat/protocol/main.html
[110] Carvajal M, Mulholland F, Carner CR (1990) Compar-ison of the Easi-Extract immunoaffinity concentrationprocedure with the AOAC CB method for the extrac-tion and quantitation of aflatoxin B1 in raw ground un-skinned peanuts. J Chromatogr 511: 379-383
[111] Duncan K, Scott K, Zabe N, Kohn B, Prioli R (1998) Im-proved fluorometric and chromatographic methods forthe quantification of fumonisins B1, B2 and B3. J Chro-matogr A 815: 41-47

BIBLIOGRAPHY 169
[112] Kruger SC, Kohn B, RAmsey CS, Prioli R (1999) Rapidimmunoaffinity-based method for determination of zear-alenone in corn by fluorometry and liquid chromatogra-phy. JAOAC Intl. 82: 1364-1368
[113] Beaver R W (1990) Degradation of aflatoxins in commonHPLC solvents. J High Res Chromatogr 13: 833-835
[114] Andrellos PJ, Beckwith AC, Eppley RM (1967) Photo-chemical changes of aflatoxin B1. JAOAC 50: 346-350
[115] Coker DR, Jewers K, Tomlins KI, Blunden G (1988) De-velopment of rapid methods for the analysis of aflatoxinin agricultural produce (I) Evaluation of instrumenta-tion used for high-performance thin-layer chromatogra-phy of aflatoxins. Chromatographia 25: 875-880
[116] Kozloski RP (1981) Novel thin-layer chromatographictechniques for aflatoxin analysis. JAOAC 64: 1263-1264
[117] Hahn-Deinstrop E (1998) Dunnschichtchromatographie,Praktische Durchfuhrung und Fehlervermeidung. Wiley-VCH ISBN: 3-527-28873-2
[118] Pons WA, Robertson jr. JA, Goldblatt LA (1966) Ob-jective fluorometric measurement of aflatoxins on TLCplates. JAOCS 43: 665-669
[119] Trager WT, Stoloff L, Campbell AD (1964) A Compar-ison of Assay Procedures for Aflatoxin in Peanut Prod-ucts. JAOAC 47: 993-1001
[120] Friedlander A, Gonen M (1970) Use of Polyamide ThinLayer Chromatography for Detection of Aflatoxins. Is-rael J Chem 8: 87-91
[121] Miskovic D (1980) Chromatographic analysis of myco-toxins on thin layers of rice starch. Chromatographia 13:342-344
[122] Lee H, Ling KJ (1967) Application of Polyamide impreg-nated Film Thin Layer Chromatography for the Detec-tion of Aflatoxins. Formosan Medical Assoc 66: 92-100

170 BIBLIOGRAPHY
[123] Beljarrs PR, Fabry FHM (1972) Quantitative fluoroden-sitometric measurements of Aflatoxin B1 with a FlyingSpot Densitometer, I. Fluorodensitometric Study of theBehavior of Aflatoxin B1 Standard Spots on differentTypes of Silica Gel. JAOAC 55: 775-780
[124] Heathcore JG, Hibbert JR (1975) Improvements in thethin-layer chromatography of natural products I. Thin-layer chromatography of the aflatoxins. J Chromatogr108: 131-140
[125] Liang Y, Baker ME, Gilmore DA, Denton MB (1996)Evaluation of commercial silica-gel HPTLC-plates forquantitative fluorescence analysis. J Planar Chromatog-raphy 9: 247-253
[126] Engstrom WG (1969) New Solvent Systems for Thin-Layer Chromatography of Aflatoxins. J Chromatogr 44:128-132
[127] Shi CN, Marth EH (1969) Improved Procedures for Mea-surement of Aflatoxins With Thin Layer Chromatogra-phy and Fluorometry. J Milk & Food Technol 32: 213-217
[128] Singh C (1970) Thin - Layer Chromatography of Afla-toxins. Anal Biochem 7: 568-569
[129] Stubblefield RD, Shannon GM, Shotwell OL (1969) Afla-toxins: Improved Resolution by Thin Layer Chromatog-raphy. JAOAC 52: 669-672
[130] Tomlins KI, Jewers K, Coker DR, Nagler JM (1989) Abi-directional HPTLC Development Method for the De-tection of Low Levels of Aflatoxin in Maize Extracts.Chromatographia 27: 49-52
[131] Waltking A, Bleffert G, Fogerty R (1973) A newBenzene-Ethanol-Water Solvent System for TLC Sep-aration of Aflatoxins. J Am Oil Chem Soc 50: 424-425
[132] Issaq HJ, Cutchin W (1981) A guide to thin-layer chrom-atographic systems for the separation of aflatoxin B1, B2,G1 and G2. J Liquid Chrom 4: 1087-1096
BIBLIOGRAPHY 171
[133] Velasco J (1969) A simplified procedure for the det-ermination of aflatoxin B1 in cottonseed meals. JAOCS46: 105-107
[134] Nesheim S (1969) Conditions and techniques for thinlayer chromatography of aflatoxins. J AOCS 46: 335-338
[135] Shepherd MJ, Gilbert J (1981) . Food Addit Contam 1:325-335
[136] Francis jun OJ, Kirschenheuter GP, Ware GM, CarmanAS, Kuan SS (1988) β-Cyclodextrin post-column fluo-rescence enhancement of aflatoxins for reversed-phaseliquid-chromatographic determination in corn [maize].JAOAC 71: 725-728
[137] Jork H, Funk W, Fischer W, Wimmer H (1994) Thin-layer chromatography: Reagents and detection methodsVol. 1b. Verlag Chemie, Weinheim ISBN: 3-527-28205-X
[138] Zennie TM (1984) Instrumental HPTLC of aflatoxins:Fluorescence enhancement by corn free fatty acids. JLiquid Chrom 7: 1383-1391
[139] Software package: Methodenvalidierung in der Analytik(1999) Novia GmbH, Saarbruecken, Germany
[140] Beckwith AC, Stoloff L (1968) Fluorodensitometricmeasurement of aflatoxin thin-layer chromatograms.JAOAC 51: 602-608
[141] Commission Directive 98/53/EC of July 1998 layingdown the sampling methods and methods of analysis forthe official control of the levels for certain contaminantsin foodstuffs. Official Journal fo the European Commu-nities L 201/93 from 17.07.1998
[142] Youden WJ, Steiner EH (1975) Statistical Manual ofthe Association of Official Analytical Chemists. AOAC,Gaithersburg ISBN: 0-935584-15-3
[143] AOAC Int (1997) Associate referee’s manual on devel-opment, study, review, and approval process. AOAC in-ternal publication.

172 BIBLIOGRAPHY
[144] Pemberton AD, Simpson TJ (1991) The Chemical De-gradation of Mycotoxins, in: Mycotoxins and AnimalFoods by Smith JE (Ed.). CRC-Press ISBN: 0-8493-4904-4
[145] Horwitz W, Albert R (1991) Performance characteris-tics of methods of analysis used for regulatory purposes.JAOAC 74: 718-744
[146] Cunniff P (Editor)(1995) Official Methods of Analysis,16th Edition, Vol II. AOAC International, Arlington
[147] Peterson R, Ciegler A, Hall H (1967) Densitometric mea-surement of aflatoxin. J Chrom 27: 304-307
[148] Dikens J, Mcclure W F, Whitaker T B (1980) Densit-ometric equipment for rapid quantitation of aflatoxinsof thin-layer chromatograms. J American Oil Chem Soc57: 205-208
[149] Pons WA (1971) Evaluation of reflectance fluorodesit-ometry for measuring aflatoxins on thin-layer plates. JAssoc Off Anal Chem 54: 870-873
[150] Pons W, Robertson J A, Goldblatt L (1968) Objectivefluorometric measurement of aflatoxins on TLC-plates.J American Oil Chemists Society 43: 665-669
[151] Robertson JA, Pons WA (1968) Solid State Fluorescenceemission of aflatoxins on silica gel. J. AOAC 51: 1190-1192
[152] Toth L, Tauchmann F, Leistner, L (1970) QuantitativerNachweis der Aflatoxine durch photofluorometrischeBestimmung direkt von Duennschichtplatten. Fleis-chwirtschaft 50: 1235-1237
[153] Whitaker TB, Dickens JW, Slate AB (1980) Computer-ized system to quantify aflatoxin using thin-layer chro-matography. Peanut Science 17: 96-100
[154] Ayres JL, Sinnhuber RO (1966) Fluorodensitometry ofaflatoxins on thin-layer plates. J American Oil Chem Soc43: 423-424
BIBLIOGRAPHY 173
[155] Berman MR, Zare RN (1975) Laser fluorescence analysisof chromatograms: Sub-nanogram detection of aflatox-ins. Anal Chem 47: 1200-1201
[156] Bicking MKL, Knisley RN, Svec HJ (1983) Determin-ation of aflatoxins in air samples of refuse-derived fuelby thin layer chromatography with laser induced fluores-cence spectrometric detection. J Anal Chem 55: 200-204
[157] Ommenetto N (1998) Role of lasers in analytical atomicspectroscopy: where, when and why - Plenary Lecture.J Anal Atomic Spec 13: 385-399
[158] Prosek M (1997) Validation of quantitative TLC usingdigital video camera, in: Proceedings of the 9th interna-tional symposium on instrumental planar chromatogra-phy. Interlaken, Swizerland 9.-11. April 1997
[159] Vovk I (2000) CCD sensors in planar chromatograph,in: Planar Chromatography 2000, Proceedings of the In-ternational Society for Planar Separations in Lillafured,Hungary.
[160] Ryer A (1997) Light Measurement Handbook (Interna-tional Light - iL) http://www.intl-light.com/handbook/
[161] Schommers A (1994) Elektronik gar nicht schwer - Ex-perimente mit Optoelektronik. Band 4: 67-77 Elektor-Verlag GmbH Aachen, Germany ISBN: 3-928051-03-2
[162] Roithner Lasertechnik (2000) Data sheet for the photo-diode EP-440. Roithner Lasertechnik, Fleischmanngasse9, 1040 Vienna, Austria.
[163] Beuth K (1997) Bauelemente (Elektronik 2). VogelBuchverlag, Wuerzburg, Germany ISBN: 3-8023-1713-0
[164] Schmidt WD (1997) Sensorschaltungstechnik (Elek-tronik 8). Vogel Buchverlag, Wuerzburg, GermanyISBN: 3-8023-1574-X
[165] Mocq F (1997) Multimet. Elektor 313: 52-53

174 BIBLIOGRAPHY
[166] Nesheim S (1999) Molar absorptivities of aflatoxinsB1, B2, G1 and G2 in acetonitrile, methanol, andtoluene-acetonitrile (9+1) (Modification of AOAC Of-ficial Method 971.22): Collaborative Study. JAOAC Int82: 251-258
[167] International Organization for Standartization (1998)ISO Standard 5725 - Accuracy (trueness and precison)of measurement methods and results. ISO, Genevre
[168] Dirksen AJ (1987) Elektronische Messinstrumente - DieTheorie des korrekten Messens. 235-245 Elektor-VerlagGmbH Aachen, Germany
[169] Kussak A, Andersson B, Andersson K (1995) Determin-ation of aflatoxins in airborne dust from feed factoriesby automated immunoaffinity column clean-up and li-quid chromatography. J Chrom 708: 55-60
[170] Dorner JW (1998) Chromatographic Analysis of My-cotoxins pp 113-168, in: Chromatographic Analysisof Environmental and Food Toxicants by TakayukiShibamoto (Ed.) Marcel Dekker ISBN: 0-824-70145-3
[171] Samarajeewa U (1991) In Situ degradation of mycotox-ins by physical methods, in: Mycotoxins and AnimalFoods by Smith JE (Ed.). CRC-Press ISBN: 0-8493-4904-4
[172] Mehan VK, Bhavanishankar TN, Bedi JS (1985) Com-parison of different methods for extraction and estima-tion of aflatoxin B1 in groundnut. J Food Sci & Tech 22:123-125
[173] Farag RS, El-leithy MA, Basyony AE, Daw ZY (1986)Effects of various substrates on aflatoxin production byA. parasiticus. JAOCS 63: 1024-1026
[174] Leibetseder J (1989) Die Bedeutung der Mycotoxine furMensch und Tier. Ernahrung 13: 739-745
[175] Tuinstra LGMTh, Haasnoot W (1983) Rapid determin-ation of aflatoxin B1 in dutch feeding stuffs by high-performance liquid chromatography and post-columnderivatization. J Chrom 282: 47-462

BIBLIOGRAPHY 175
[176] Marth EH (1990) Mycotoxins, in: Foodborne DiseaseHandbook by Cliver DO (Ed.) Academic Press ISBN: 0-121-76558-X

Chapter 5
Annex
176

5.1. COLLABORATIVE TRIAL RESULTS ON FOOD STUFFS 177
5.1 Collaborative Trial Results on Food Stuffs

178 CHAPTER 5. ANNEX
LabID
spike(a1)
spike(b1)
spike(a2)
spike(b2)
nc(c1)
nc(c2)
A 0.99 3.52 0.81 3.44 <0.2 <0.2B 0.00* 0.50* 0.10* 0.40* 0 0C 0.91 3.12 0.94 3.48 <0.01 0.05D 0.36* 3.77 0.77* 4.00 <0.05 <0.05E 0.80 4.03 0.80 3.87 <0.10 <0.10F 0.74 2.93 0.73 2.91 <0.18 0.2G 0.77 2.97 0.75 2.71 <0.52 <0.52H 0.86 3.29 0.93 3.57 0.04 0.07I 0.80 2.94 0.80 3.16 <0.1 <0.1J 0.78 3.35 0.80 3.33 <0.15 <0.15K 0.94 3.73 0.85 3.75 <0.18 <0.18L 0.88 3.47 0.86 3.47 <0.01 <0.01M 0.88 3.46 0.88 3.30 <0.1 <0.1N 0.88 3.06 0.82 3.48 <0.1 <0.1O 0.79 3.07 0.91 3.65 0.07 0.06P 1.10 3.62 1.01 3.77 0.19 0.09
LabID
nc(d1)
nc(d2)
nc(e1)
nc(e2)
nc(f1)
nc(f2)
A 1.071 0.746 1.31 1.25 2.933 3.22B 0.2* 0.1* 0.2* 0.3* 0.3* 0.4*C 0.8 0.81 1.51 1.54 3.12 3.2D 1.07 0.99 1.42 1.62 3.84* 1.61*E 0.7 0.62 1.35 1.28 2.94 3.23F 0.72 0.7 0.81 1.15 2.92 2.68G 0.59 0.61 1.05 0.8 2.57 2.67H 0.79 0.92 1.32 1.73 3.11 2.99I 0.8 0.76 1.26 1.36 3.06 3.12J 0.76 0.88 1.27 1.39 2.72 2.85K 0.74 0.96 1.56 1.25 2.72 2.52L 1.27 0.85 1.47 1.62 3.29 3.37M 0.74 0.8 1.44 1.40 2.84 2.93N 1.06 0.96 1.78 1.74 3.43 3.39O 0.82 0.8 1.48 1.49 2.77 3.12P 1.05 0.89 1.47 1.70 3.39 3.44
Table 5.1: Single results on aflatoxin B1 in paprika powder

5.1. COLLABORATIVE TRIAL RESULTS ON FOOD STUFFS 179
LabID
spike(a1)
spike(b1)
spike(a2)
spike(b2)
nc(c1)
nc(c2)
A 0.24 0.73 0.15 0.73 <0.1 <0.1B 0.10 0.30* 0.10 0.20* 0 0C 0.22 0.60 0.16 0.67 <0.01 <0.01D 0.08 0.78 0.18 0.82 <0.05 <0.05E 0.09 0.73 0.08 0.64 <0.04 <0.04F 0.15 0.61 0.16 0.69 <0.04 <0.04G <0.23* 0.59 <0.23* 0.53 <0.23 <0.23H 0.14 0.30* 0.07 0.64* <* <*I 0.16 0.62 0.16 0.74 <0.05 <0.05J 0.19 0.71 0.16 0.69 <0.07 <0.07K 0.21 0.77 0.17 0.85 <0.06 <0.06L 0.18 0.68 0.19 0.73 <0.01 <0.01M 0.17 0.74 0.18 0.67 <0.08 <0.08N 0.15 0.57 0.13 0.62 <0.1 <0.1O 0.17 0.68 0.18 0.77 <0.02 <0.02P 0.15 0.74 0.19 0.77 <0.03 <0.03
LabID
nc(d1)
nc(d2)
nc(e1)
nc(e2)
nc(f1)
nc(f2)
A <0.1* <0.1* 0.125* <0.1* 0.205 0.176B 0 0 0 0.1 0.1* 0.1*C 0.05 0.04 0.14 0.08 0.2 0.19D 0.07 0.1 0.1 0.16 0.28* 0.12*E <0.04* <0.04* <0.04* <0.04* 0.1* 0.12*F 0.06 0.05 0.07 0.09 0.19 0.2G <0.23* <0.23* <0.23* <0.23* <0.23* <0.23*H 0.04 0.06 0.09 0.1 0.17 0.18I 0.06 0.06 0.1 0.1 0.2 0.22J 0.04 0.03 0.09 0.08 0.2 0.21K 0.061 0.078 0.149 0.102 0.225 0.188L 0.07 0.05 0.08 0.1 0.19 0.2M <0.08* <0.08* 0.12 0.15 0.2 0.22N 0.67* <0.1* 0.11 0.08 0.2 0.2O 0.06 0.06 0.11 0.11 0.22 0.24P 0.07 0.07 0.12 0.13 0.25 0.25
Table 5.2: Single results on aflatoxin B2 in paprika powder
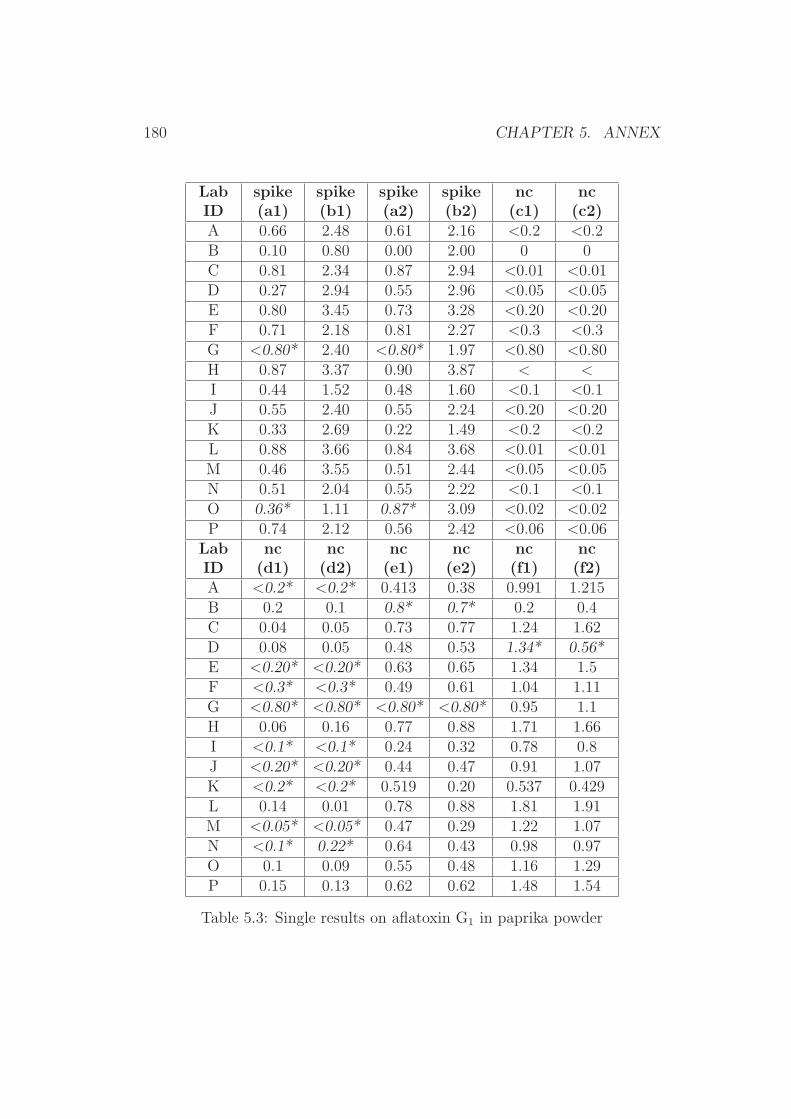
180 CHAPTER 5. ANNEX
LabID
spike(a1)
spike(b1)
spike(a2)
spike(b2)
nc(c1)
nc(c2)
A 0.66 2.48 0.61 2.16 <0.2 <0.2B 0.10 0.80 0.00 2.00 0 0C 0.81 2.34 0.87 2.94 <0.01 <0.01D 0.27 2.94 0.55 2.96 <0.05 <0.05E 0.80 3.45 0.73 3.28 <0.20 <0.20F 0.71 2.18 0.81 2.27 <0.3 <0.3G <0.80* 2.40 <0.80* 1.97 <0.80 <0.80H 0.87 3.37 0.90 3.87 < <
I 0.44 1.52 0.48 1.60 <0.1 <0.1J 0.55 2.40 0.55 2.24 <0.20 <0.20K 0.33 2.69 0.22 1.49 <0.2 <0.2L 0.88 3.66 0.84 3.68 <0.01 <0.01M 0.46 3.55 0.51 2.44 <0.05 <0.05N 0.51 2.04 0.55 2.22 <0.1 <0.1O 0.36* 1.11 0.87* 3.09 <0.02 <0.02P 0.74 2.12 0.56 2.42 <0.06 <0.06
LabID
nc(d1)
nc(d2)
nc(e1)
nc(e2)
nc(f1)
nc(f2)
A <0.2* <0.2* 0.413 0.38 0.991 1.215B 0.2 0.1 0.8* 0.7* 0.2 0.4C 0.04 0.05 0.73 0.77 1.24 1.62D 0.08 0.05 0.48 0.53 1.34* 0.56*E <0.20* <0.20* 0.63 0.65 1.34 1.5F <0.3* <0.3* 0.49 0.61 1.04 1.11G <0.80* <0.80* <0.80* <0.80* 0.95 1.1H 0.06 0.16 0.77 0.88 1.71 1.66I <0.1* <0.1* 0.24 0.32 0.78 0.8J <0.20* <0.20* 0.44 0.47 0.91 1.07K <0.2* <0.2* 0.519 0.20 0.537 0.429L 0.14 0.01 0.78 0.88 1.81 1.91M <0.05* <0.05* 0.47 0.29 1.22 1.07N <0.1* 0.22* 0.64 0.43 0.98 0.97O 0.1 0.09 0.55 0.48 1.16 1.29P 0.15 0.13 0.62 0.62 1.48 1.54
Table 5.3: Single results on aflatoxin G1 in paprika powder
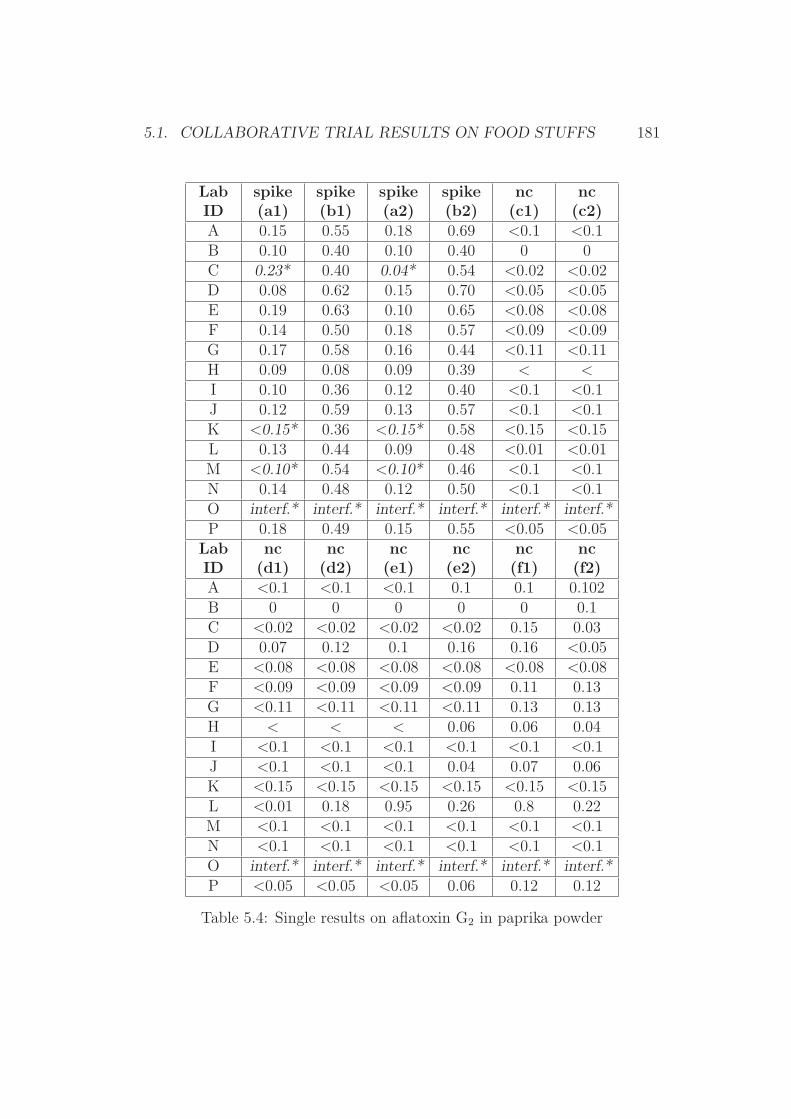
5.1. COLLABORATIVE TRIAL RESULTS ON FOOD STUFFS 181
LabID
spike(a1)
spike(b1)
spike(a2)
spike(b2)
nc(c1)
nc(c2)
A 0.15 0.55 0.18 0.69 <0.1 <0.1B 0.10 0.40 0.10 0.40 0 0C 0.23* 0.40 0.04* 0.54 <0.02 <0.02D 0.08 0.62 0.15 0.70 <0.05 <0.05E 0.19 0.63 0.10 0.65 <0.08 <0.08F 0.14 0.50 0.18 0.57 <0.09 <0.09G 0.17 0.58 0.16 0.44 <0.11 <0.11H 0.09 0.08 0.09 0.39 < <
I 0.10 0.36 0.12 0.40 <0.1 <0.1J 0.12 0.59 0.13 0.57 <0.1 <0.1K <0.15* 0.36 <0.15* 0.58 <0.15 <0.15L 0.13 0.44 0.09 0.48 <0.01 <0.01M <0.10* 0.54 <0.10* 0.46 <0.1 <0.1N 0.14 0.48 0.12 0.50 <0.1 <0.1O interf.* interf.* interf.* interf.* interf.* interf.*P 0.18 0.49 0.15 0.55 <0.05 <0.05
LabID
nc(d1)
nc(d2)
nc(e1)
nc(e2)
nc(f1)
nc(f2)
A <0.1 <0.1 <0.1 0.1 0.1 0.102B 0 0 0 0 0 0.1C <0.02 <0.02 <0.02 <0.02 0.15 0.03D 0.07 0.12 0.1 0.16 0.16 <0.05E <0.08 <0.08 <0.08 <0.08 <0.08 <0.08F <0.09 <0.09 <0.09 <0.09 0.11 0.13G <0.11 <0.11 <0.11 <0.11 0.13 0.13H < < < 0.06 0.06 0.04I <0.1 <0.1 <0.1 <0.1 <0.1 <0.1J <0.1 <0.1 <0.1 0.04 0.07 0.06K <0.15 <0.15 <0.15 <0.15 <0.15 <0.15L <0.01 0.18 0.95 0.26 0.8 0.22M <0.1 <0.1 <0.1 <0.1 <0.1 <0.1N <0.1 <0.1 <0.1 <0.1 <0.1 <0.1O interf.* interf.* interf.* interf.* interf.* interf.*P <0.05 <0.05 <0.05 0.06 0.12 0.12
Table 5.4: Single results on aflatoxin G2 in paprika powder
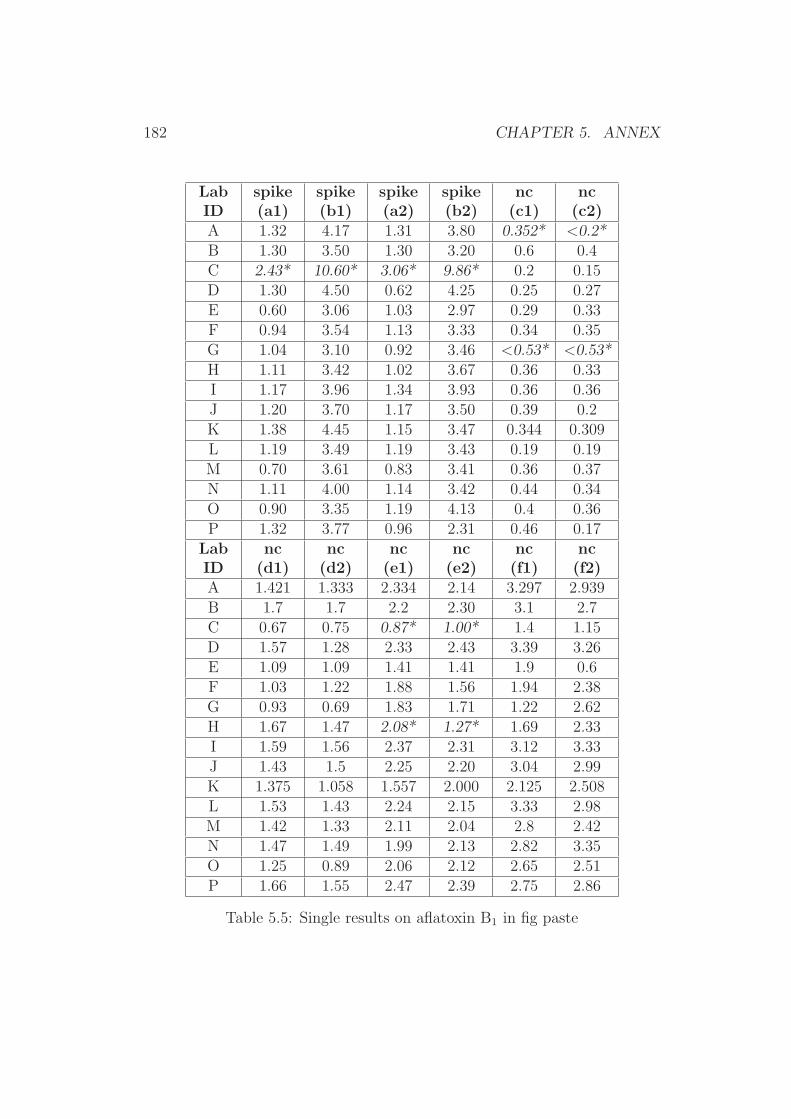
182 CHAPTER 5. ANNEX
LabID
spike(a1)
spike(b1)
spike(a2)
spike(b2)
nc(c1)
nc(c2)
A 1.32 4.17 1.31 3.80 0.352* <0.2*B 1.30 3.50 1.30 3.20 0.6 0.4C 2.43* 10.60* 3.06* 9.86* 0.2 0.15D 1.30 4.50 0.62 4.25 0.25 0.27E 0.60 3.06 1.03 2.97 0.29 0.33F 0.94 3.54 1.13 3.33 0.34 0.35G 1.04 3.10 0.92 3.46 <0.53* <0.53*H 1.11 3.42 1.02 3.67 0.36 0.33I 1.17 3.96 1.34 3.93 0.36 0.36J 1.20 3.70 1.17 3.50 0.39 0.2K 1.38 4.45 1.15 3.47 0.344 0.309L 1.19 3.49 1.19 3.43 0.19 0.19M 0.70 3.61 0.83 3.41 0.36 0.37N 1.11 4.00 1.14 3.42 0.44 0.34O 0.90 3.35 1.19 4.13 0.4 0.36P 1.32 3.77 0.96 2.31 0.46 0.17
LabID
nc(d1)
nc(d2)
nc(e1)
nc(e2)
nc(f1)
nc(f2)
A 1.421 1.333 2.334 2.14 3.297 2.939B 1.7 1.7 2.2 2.30 3.1 2.7C 0.67 0.75 0.87* 1.00* 1.4 1.15D 1.57 1.28 2.33 2.43 3.39 3.26E 1.09 1.09 1.41 1.41 1.9 0.6F 1.03 1.22 1.88 1.56 1.94 2.38G 0.93 0.69 1.83 1.71 1.22 2.62H 1.67 1.47 2.08* 1.27* 1.69 2.33I 1.59 1.56 2.37 2.31 3.12 3.33J 1.43 1.5 2.25 2.20 3.04 2.99K 1.375 1.058 1.557 2.000 2.125 2.508L 1.53 1.43 2.24 2.15 3.33 2.98M 1.42 1.33 2.11 2.04 2.8 2.42N 1.47 1.49 1.99 2.13 2.82 3.35O 1.25 0.89 2.06 2.12 2.65 2.51P 1.66 1.55 2.47 2.39 2.75 2.86
Table 5.5: Single results on aflatoxin B1 in fig paste
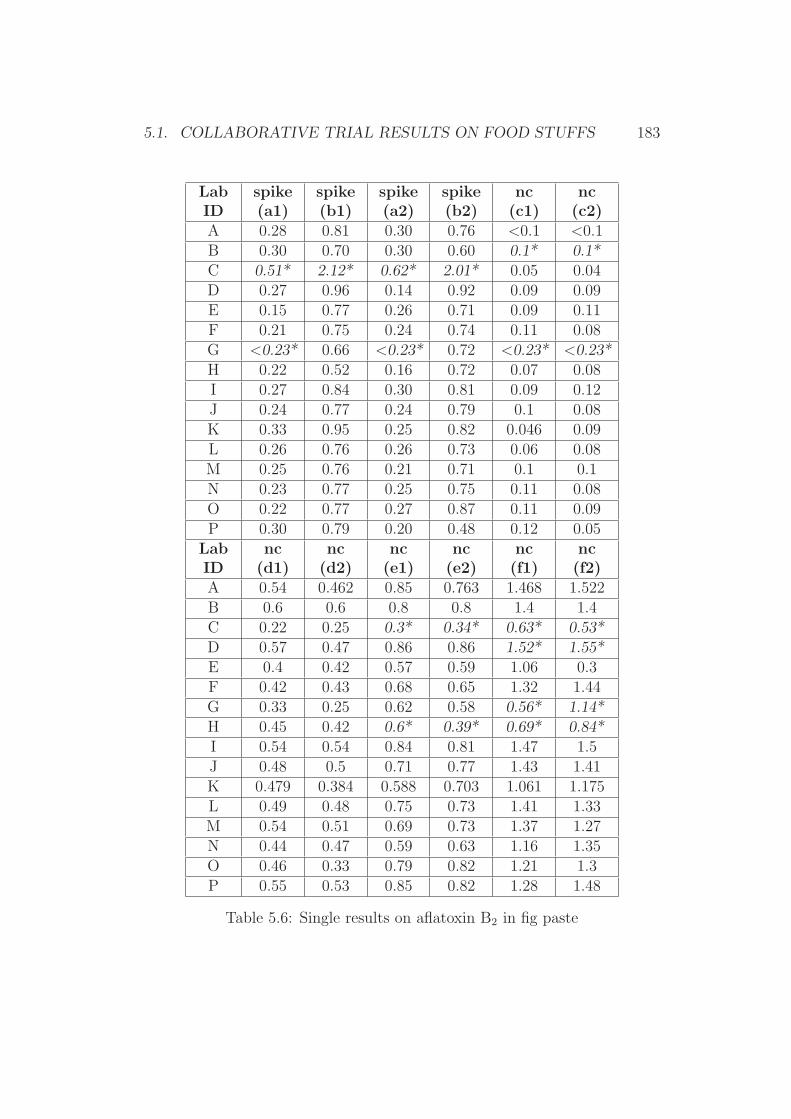
5.1. COLLABORATIVE TRIAL RESULTS ON FOOD STUFFS 183
LabID
spike(a1)
spike(b1)
spike(a2)
spike(b2)
nc(c1)
nc(c2)
A 0.28 0.81 0.30 0.76 <0.1 <0.1B 0.30 0.70 0.30 0.60 0.1* 0.1*C 0.51* 2.12* 0.62* 2.01* 0.05 0.04D 0.27 0.96 0.14 0.92 0.09 0.09E 0.15 0.77 0.26 0.71 0.09 0.11F 0.21 0.75 0.24 0.74 0.11 0.08G <0.23* 0.66 <0.23* 0.72 <0.23* <0.23*H 0.22 0.52 0.16 0.72 0.07 0.08I 0.27 0.84 0.30 0.81 0.09 0.12J 0.24 0.77 0.24 0.79 0.1 0.08K 0.33 0.95 0.25 0.82 0.046 0.09L 0.26 0.76 0.26 0.73 0.06 0.08M 0.25 0.76 0.21 0.71 0.1 0.1N 0.23 0.77 0.25 0.75 0.11 0.08O 0.22 0.77 0.27 0.87 0.11 0.09P 0.30 0.79 0.20 0.48 0.12 0.05
LabID
nc(d1)
nc(d2)
nc(e1)
nc(e2)
nc(f1)
nc(f2)
A 0.54 0.462 0.85 0.763 1.468 1.522B 0.6 0.6 0.8 0.8 1.4 1.4C 0.22 0.25 0.3* 0.34* 0.63* 0.53*D 0.57 0.47 0.86 0.86 1.52* 1.55*E 0.4 0.42 0.57 0.59 1.06 0.3F 0.42 0.43 0.68 0.65 1.32 1.44G 0.33 0.25 0.62 0.58 0.56* 1.14*H 0.45 0.42 0.6* 0.39* 0.69* 0.84*I 0.54 0.54 0.84 0.81 1.47 1.5J 0.48 0.5 0.71 0.77 1.43 1.41K 0.479 0.384 0.588 0.703 1.061 1.175L 0.49 0.48 0.75 0.73 1.41 1.33M 0.54 0.51 0.69 0.73 1.37 1.27N 0.44 0.47 0.59 0.63 1.16 1.35O 0.46 0.33 0.79 0.82 1.21 1.3P 0.55 0.53 0.85 0.82 1.28 1.48
Table 5.6: Single results on aflatoxin B2 in fig paste
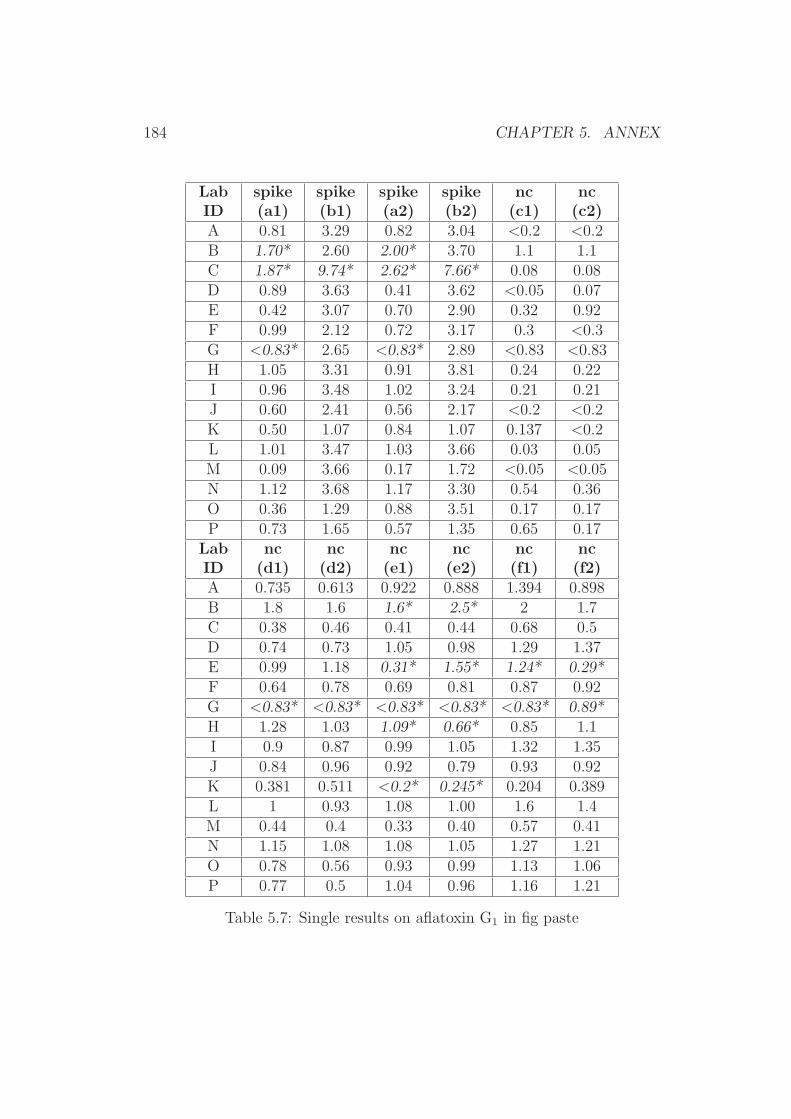
184 CHAPTER 5. ANNEX
LabID
spike(a1)
spike(b1)
spike(a2)
spike(b2)
nc(c1)
nc(c2)
A 0.81 3.29 0.82 3.04 <0.2 <0.2B 1.70* 2.60 2.00* 3.70 1.1 1.1C 1.87* 9.74* 2.62* 7.66* 0.08 0.08D 0.89 3.63 0.41 3.62 <0.05 0.07E 0.42 3.07 0.70 2.90 0.32 0.92F 0.99 2.12 0.72 3.17 0.3 <0.3G <0.83* 2.65 <0.83* 2.89 <0.83 <0.83H 1.05 3.31 0.91 3.81 0.24 0.22I 0.96 3.48 1.02 3.24 0.21 0.21J 0.60 2.41 0.56 2.17 <0.2 <0.2K 0.50 1.07 0.84 1.07 0.137 <0.2L 1.01 3.47 1.03 3.66 0.03 0.05M 0.09 3.66 0.17 1.72 <0.05 <0.05N 1.12 3.68 1.17 3.30 0.54 0.36O 0.36 1.29 0.88 3.51 0.17 0.17P 0.73 1.65 0.57 1.35 0.65 0.17
LabID
nc(d1)
nc(d2)
nc(e1)
nc(e2)
nc(f1)
nc(f2)
A 0.735 0.613 0.922 0.888 1.394 0.898B 1.8 1.6 1.6* 2.5* 2 1.7C 0.38 0.46 0.41 0.44 0.68 0.5D 0.74 0.73 1.05 0.98 1.29 1.37E 0.99 1.18 0.31* 1.55* 1.24* 0.29*F 0.64 0.78 0.69 0.81 0.87 0.92G <0.83* <0.83* <0.83* <0.83* <0.83* 0.89*H 1.28 1.03 1.09* 0.66* 0.85 1.1I 0.9 0.87 0.99 1.05 1.32 1.35J 0.84 0.96 0.92 0.79 0.93 0.92K 0.381 0.511 <0.2* 0.245* 0.204 0.389L 1 0.93 1.08 1.00 1.6 1.4M 0.44 0.4 0.33 0.40 0.57 0.41N 1.15 1.08 1.08 1.05 1.27 1.21O 0.78 0.56 0.93 0.99 1.13 1.06P 0.77 0.5 1.04 0.96 1.16 1.21
Table 5.7: Single results on aflatoxin G1 in fig paste

5.1. COLLABORATIVE TRIAL RESULTS ON FOOD STUFFS 185
LabID
spike(a1)
spike(b1)
spike(a2)
spike(b2)
nc(c1)
nc(c2)
A 0.15 0.63 0.25 0.69 <0.1 <0.1B 0.30 0.50 0.40 0.70 0.2 0.3C 0.49 2.12* 0.53 1.70* <0.02 <0.02D 0.20* 0.78 <0.05* 0.73 <0.05 <0.05E 0.09 0.61 0.01 0.61 <0.08 <0.08F 0.19 0.48 0.19 0.62 <0.09 <0.09G 0.15 0.62 0.16 0.64 <0.10 <0.10H 0.19 0.27 0.09 0.58 <0.15 <0.15I 0.18 0.69 0.18 0.69 <0.1 <0.1J 0.14 0.56 0.13 0.46 <0.1 <0.1K <0.15* 0.28 0.19* 0.27 <0.15 <0.15L 0.17 0.72 0.17 0.67 0.02 <0.01M <0.1* 0.69 <0.1* 0.27 <0.1 <0.1N 0.22 0.71 0.47 0.95 0.36 <0.1O 0.10 0.35 0.20 0.80 <0.02 <0.02P 0.14 0.40 0.11 0.30 <0.05 <0.05
LabID
nc(d1)
nc(d2)
nc(e1)
nc(e2)
nc(f1)
nc(f2)
A 0.22 0.232 0.406 0.378 0.726 0.551B 0.5 0.4 0.5 0.60 0.8 0.7C 0.08 0.12 0.14 0.16 0.27 0.17D 0.26 0.29 0.35 0.43 0.68 0.62E 0.2 0.24 0.31 0.27 0.46 0.22F 0.18 0.22 0.31 0.30 0.46 0.56G 0.17 0.11 0.25 0.23 0.25 0.43H 0.27 0.22 0.3 0.20 0.3 0.34I 0.27 0.27 0.39 0.39 0.63 0.63J 0.26 0.26 0.37 0.35 0.52 0.58K 0.149 0.212 <0.15* <0.15* <0.15* 0.242*L 0.36 0.45 0.44 0.43 0.74 0.61M 0.18 0.18 0.21 0.27 0.44 0.43N 0.32 0.47 0.55* 0.28* 0.48 0.51O 0.27 0.19 0.42 0.45 0.6 0.62P 0.23 0.18 0.38 0.39 0.58 0.6
Table 5.8: Single results on aflatoxin G2 in fig paste
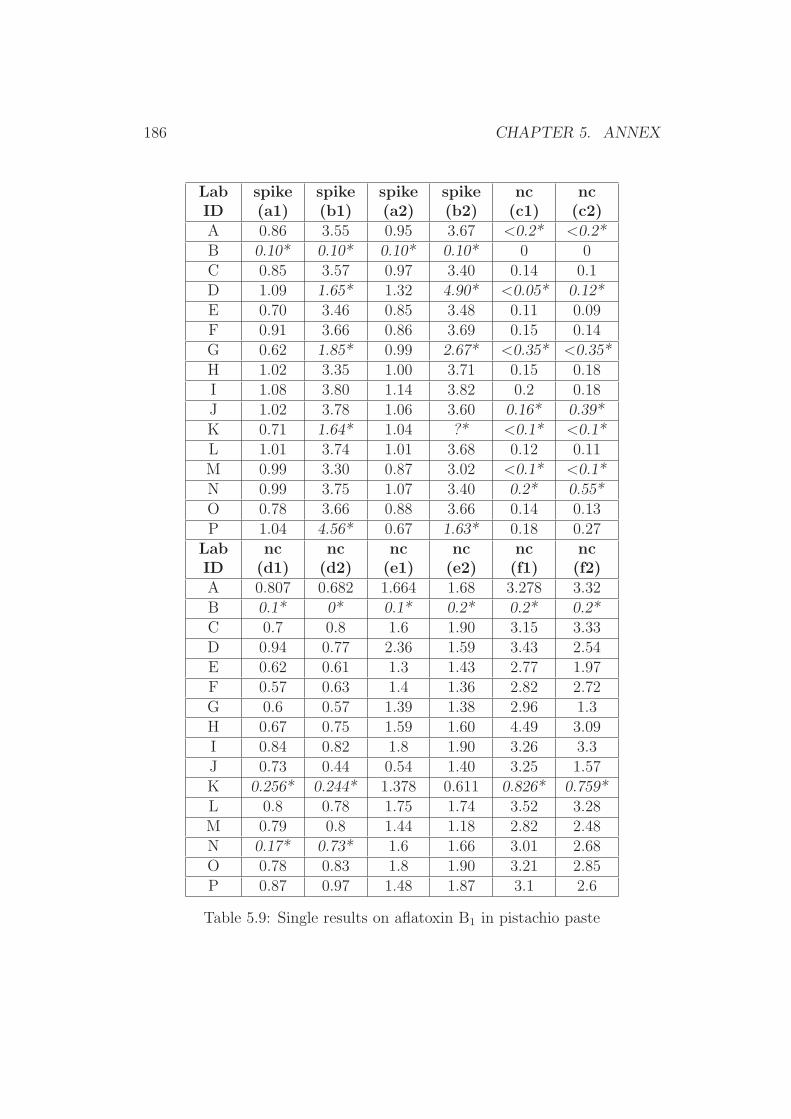
186 CHAPTER 5. ANNEX
LabID
spike(a1)
spike(b1)
spike(a2)
spike(b2)
nc(c1)
nc(c2)
A 0.86 3.55 0.95 3.67 <0.2* <0.2*B 0.10* 0.10* 0.10* 0.10* 0 0C 0.85 3.57 0.97 3.40 0.14 0.1D 1.09 1.65* 1.32 4.90* <0.05* 0.12*E 0.70 3.46 0.85 3.48 0.11 0.09F 0.91 3.66 0.86 3.69 0.15 0.14G 0.62 1.85* 0.99 2.67* <0.35* <0.35*H 1.02 3.35 1.00 3.71 0.15 0.18I 1.08 3.80 1.14 3.82 0.2 0.18J 1.02 3.78 1.06 3.60 0.16* 0.39*K 0.71 1.64* 1.04 ?* <0.1* <0.1*L 1.01 3.74 1.01 3.68 0.12 0.11M 0.99 3.30 0.87 3.02 <0.1* <0.1*N 0.99 3.75 1.07 3.40 0.2* 0.55*O 0.78 3.66 0.88 3.66 0.14 0.13P 1.04 4.56* 0.67 1.63* 0.18 0.27
LabID
nc(d1)
nc(d2)
nc(e1)
nc(e2)
nc(f1)
nc(f2)
A 0.807 0.682 1.664 1.68 3.278 3.32B 0.1* 0* 0.1* 0.2* 0.2* 0.2*C 0.7 0.8 1.6 1.90 3.15 3.33D 0.94 0.77 2.36 1.59 3.43 2.54E 0.62 0.61 1.3 1.43 2.77 1.97F 0.57 0.63 1.4 1.36 2.82 2.72G 0.6 0.57 1.39 1.38 2.96 1.3H 0.67 0.75 1.59 1.60 4.49 3.09I 0.84 0.82 1.8 1.90 3.26 3.3J 0.73 0.44 0.54 1.40 3.25 1.57K 0.256* 0.244* 1.378 0.611 0.826* 0.759*L 0.8 0.78 1.75 1.74 3.52 3.28M 0.79 0.8 1.44 1.18 2.82 2.48N 0.17* 0.73* 1.6 1.66 3.01 2.68O 0.78 0.83 1.8 1.90 3.21 2.85P 0.87 0.97 1.48 1.87 3.1 2.6
Table 5.9: Single results on aflatoxin B1 in pistachio paste

5.1. COLLABORATIVE TRIAL RESULTS ON FOOD STUFFS 187
LabID
spike(a1)
spike(b1)
spike(a2)
spike(b2)
nc(c1)
nc(c2)
A 0.15 0.73 0.20 0.77 <0.1 <0.1B 0.10* 0.10* 0.10* 0.10* 0 0C 0.18 0.83 0.20 0.80 0.02 <0.01D 0.26* 0.37 0.24* 1.00 <0.05 <0.05E 0.18 0.72 0.16 0.70 0.03 0.03F 0.17 0.82 0.16 0.79 <0.03 <0.03G <0.17* 0.40 0.19* 0.58 <0.17 <0.17H 0.18 0.47 0.17 0.72 <0.04 <0.04I 0.20 0.76 0.22 0.76 <0.05 <0.05J 0.18 0.73 0.20 0.72 <0.04 0.05K 0.17 0.34* 0.23 ?* <0.04 <0.04L 0.20 0.78 0.18 0.76 0.01 0.01M 0.18 0.65 0.17 0.62 <0.08 <0.08N 0.19 0.74 0.21 0.69 <0.1 <0.1O 0.15 0.75 0.18 0.74 <0.02 <0.02P 0.20 0.92 0.13 0.35 0.02 0.02
LabID
nc(d1)
nc(d2)
nc(e1)
nc(e2)
nc(f1)
nc(f2)
A 0.103* <0.1* 0.163 0.159 0.339 0.335B 0* 0* 0.1 0.1 0.1* 0.1*C 0.08 0.08 0.15 0.2 0.32 0.35D 0.13 0.11 0.22 0.17 0.35 0.26E 0.1 0.09 0.14 0.15 0.29 0.22F 0.08 0.09 0.17 0.12 0.17 0.26G <0.17* <0.17* <0.17* <0.17* 0.28* <0.17*H 0.09 0.09 0.14 0.15 0.43 0.27I 0.12 0.1 0.18 0.18 0.32 0.34J 0.09 0.06 0.05 0.12 0.32 0.18K 0.041 0.048 0.177 0.09 0.097* 0.106*L 0.1 0.1 0.14 0.17 0.32 0.31M 0.11 0.11 0.16 0.14 0.31 0.27N <0.1* 0.11* 0.15 0.16 0.28 0.23O 0.1 0.11 0.18 0.2 0.34 0.3P 0.11 0.12 0.17 0.19 0.33 0.28
Table 5.10: Single results on aflatoxin B2 in pistachio paste
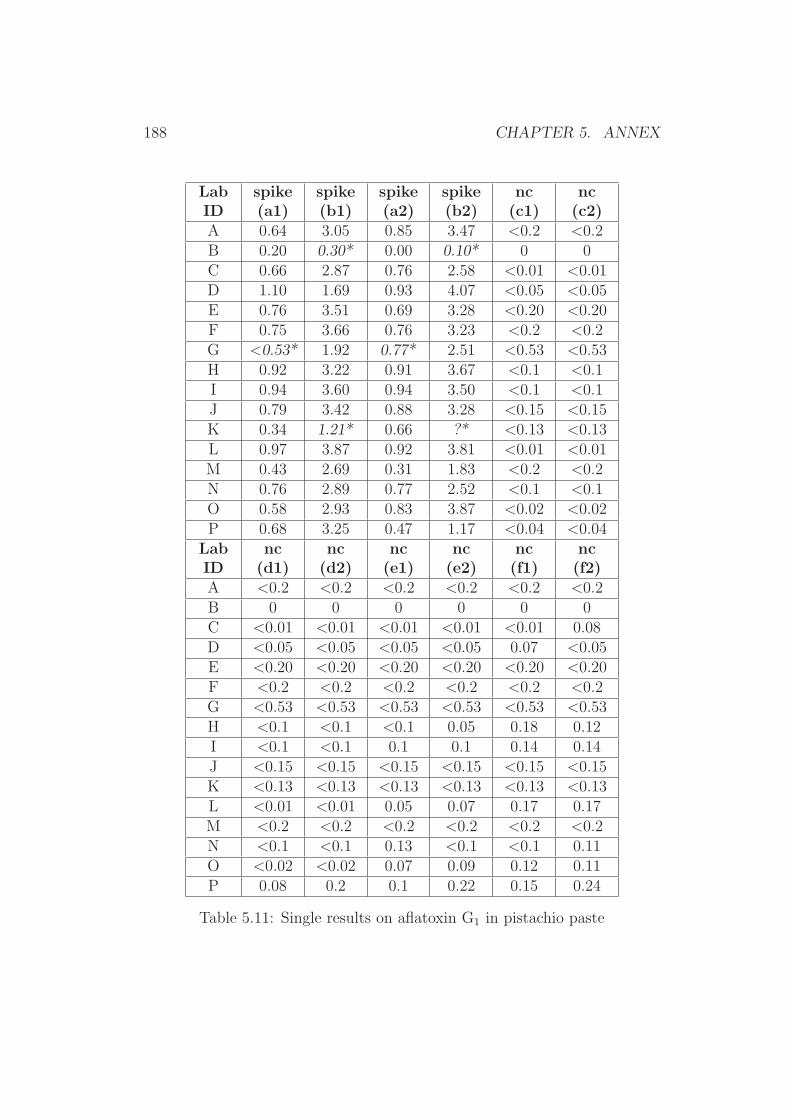
188 CHAPTER 5. ANNEX
LabID
spike(a1)
spike(b1)
spike(a2)
spike(b2)
nc(c1)
nc(c2)
A 0.64 3.05 0.85 3.47 <0.2 <0.2B 0.20 0.30* 0.00 0.10* 0 0C 0.66 2.87 0.76 2.58 <0.01 <0.01D 1.10 1.69 0.93 4.07 <0.05 <0.05E 0.76 3.51 0.69 3.28 <0.20 <0.20F 0.75 3.66 0.76 3.23 <0.2 <0.2G <0.53* 1.92 0.77* 2.51 <0.53 <0.53H 0.92 3.22 0.91 3.67 <0.1 <0.1I 0.94 3.60 0.94 3.50 <0.1 <0.1J 0.79 3.42 0.88 3.28 <0.15 <0.15K 0.34 1.21* 0.66 ?* <0.13 <0.13L 0.97 3.87 0.92 3.81 <0.01 <0.01M 0.43 2.69 0.31 1.83 <0.2 <0.2N 0.76 2.89 0.77 2.52 <0.1 <0.1O 0.58 2.93 0.83 3.87 <0.02 <0.02P 0.68 3.25 0.47 1.17 <0.04 <0.04
LabID
nc(d1)
nc(d2)
nc(e1)
nc(e2)
nc(f1)
nc(f2)
A <0.2 <0.2 <0.2 <0.2 <0.2 <0.2B 0 0 0 0 0 0C <0.01 <0.01 <0.01 <0.01 <0.01 0.08D <0.05 <0.05 <0.05 <0.05 0.07 <0.05E <0.20 <0.20 <0.20 <0.20 <0.20 <0.20F <0.2 <0.2 <0.2 <0.2 <0.2 <0.2G <0.53 <0.53 <0.53 <0.53 <0.53 <0.53H <0.1 <0.1 <0.1 0.05 0.18 0.12I <0.1 <0.1 0.1 0.1 0.14 0.14J <0.15 <0.15 <0.15 <0.15 <0.15 <0.15K <0.13 <0.13 <0.13 <0.13 <0.13 <0.13L <0.01 <0.01 0.05 0.07 0.17 0.17M <0.2 <0.2 <0.2 <0.2 <0.2 <0.2N <0.1 <0.1 0.13 <0.1 <0.1 0.11O <0.02 <0.02 0.07 0.09 0.12 0.11P 0.08 0.2 0.1 0.22 0.15 0.24
Table 5.11: Single results on aflatoxin G1 in pistachio paste

5.1. COLLABORATIVE TRIAL RESULTS ON FOOD STUFFS 189
LabID
spike(a1)
spike(b1)
spike(a2)
spike(b2)
nc(c1)
nc(c2)
A 0.13 0.61 0.15 0.73 <0.1 <0.1B 0.20 0.30 0.10 0.20 0 0C 0.15 0.70 0.20 0.60 <0.02 <0.02D 0.24 0.35 0.18 0.87 <0.05 <0.05E 0.17 0.74 0.15 0.66 <0.08 <0.08F 0.17 0.78 0.17 0.63 <0.09 <0.09G 0.11 0.43 0.18 0.58 <0.08 <0.08H 0.17 0.27 0.09 0.66 <0.1 <0.1I 0.20 0.72 0.20 0.74 <0.1 <0.1J 0.18 0.68 0.19 0.70 <0.08 <0.08K 0.11 0.25* 0.13 ?* <0.1 <0.1L 0.19 0.76 0.17 0.77 <0.01 <0.01M 0.15* 0.60 <0.10* 0.43 <0.1 <0.1N 0.19 0.67 0.21 0.58 <0.1 <0.1O 0.12 0.64 0.17 0.80 <0.02 <0.02P 0.13 0.71 0.09 0.25 <0.03 <0.03
LabID
nc(d1)
nc(d2)
nc(e1)
nc(e2)
nc(f1)
nc(f2)
A <0.1 <0.1 <0.1 <0.1 <0.1 <0.1B 0 0 0 0 0 0C <0.02 <0.02 <0.02 <0.02 <0.02 <0.02D <0.05 <0.05 <0.05 <0.05 <0.05 <0.05E <0.08 <0.08 <0.08 <0.08 <0.08 <0.08F <0.09 <0.09 <0.09 <0.09 <0.09 <0.09G <0.08 <0.08 <0.08 <0.08 <0.08 <0.08H <0.1 <0.1 <0.1 <0.1 <0.1 <0.1I <0.1 <0.1 <0.1 <0.1 <0.1 <0.1J <0.08 <0.08 <0.08 <0.08 <0.08 <0.08K <0.1 <0.1 <0.1 <0.1 <0.1 <0.1L <0.01 <0.01 <0.01 <0.01 <0.01 0.015M <0.1 <0.1 <0.1 <0.1 <0.1 <0.1N <0.1 <0.1 <0.1 <0.1 <0.1 <0.1O <0.02 <0.02 <0.02 <0.02 <0.02 <0.02P <0.03 <0.03 <0.03 <0.03 <0.03 <0.03
Table 5.12: Single results on aflatoxin G2 in pistachio paste
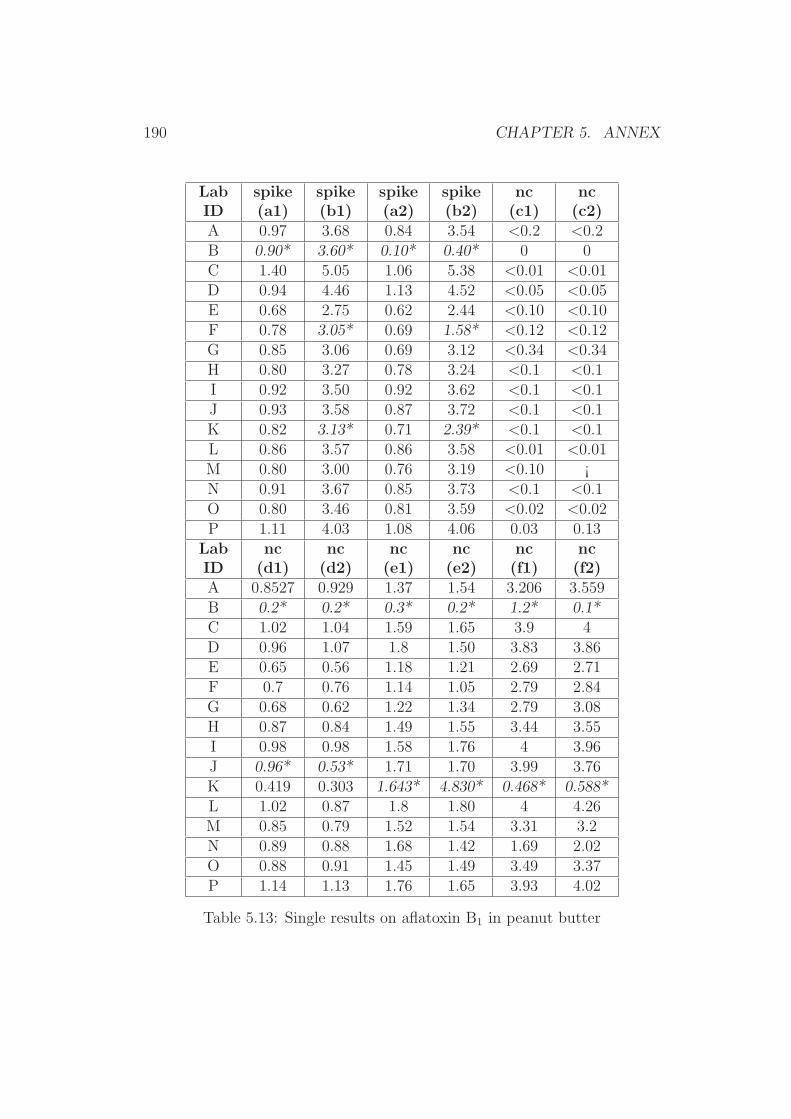
190 CHAPTER 5. ANNEX
LabID
spike(a1)
spike(b1)
spike(a2)
spike(b2)
nc(c1)
nc(c2)
A 0.97 3.68 0.84 3.54 <0.2 <0.2B 0.90* 3.60* 0.10* 0.40* 0 0C 1.40 5.05 1.06 5.38 <0.01 <0.01D 0.94 4.46 1.13 4.52 <0.05 <0.05E 0.68 2.75 0.62 2.44 <0.10 <0.10F 0.78 3.05* 0.69 1.58* <0.12 <0.12G 0.85 3.06 0.69 3.12 <0.34 <0.34H 0.80 3.27 0.78 3.24 <0.1 <0.1I 0.92 3.50 0.92 3.62 <0.1 <0.1J 0.93 3.58 0.87 3.72 <0.1 <0.1K 0.82 3.13* 0.71 2.39* <0.1 <0.1L 0.86 3.57 0.86 3.58 <0.01 <0.01M 0.80 3.00 0.76 3.19 <0.10 ¡N 0.91 3.67 0.85 3.73 <0.1 <0.1O 0.80 3.46 0.81 3.59 <0.02 <0.02P 1.11 4.03 1.08 4.06 0.03 0.13
LabID
nc(d1)
nc(d2)
nc(e1)
nc(e2)
nc(f1)
nc(f2)
A 0.8527 0.929 1.37 1.54 3.206 3.559B 0.2* 0.2* 0.3* 0.2* 1.2* 0.1*C 1.02 1.04 1.59 1.65 3.9 4D 0.96 1.07 1.8 1.50 3.83 3.86E 0.65 0.56 1.18 1.21 2.69 2.71F 0.7 0.76 1.14 1.05 2.79 2.84G 0.68 0.62 1.22 1.34 2.79 3.08H 0.87 0.84 1.49 1.55 3.44 3.55I 0.98 0.98 1.58 1.76 4 3.96J 0.96* 0.53* 1.71 1.70 3.99 3.76K 0.419 0.303 1.643* 4.830* 0.468* 0.588*L 1.02 0.87 1.8 1.80 4 4.26M 0.85 0.79 1.52 1.54 3.31 3.2N 0.89 0.88 1.68 1.42 1.69 2.02O 0.88 0.91 1.45 1.49 3.49 3.37P 1.14 1.13 1.76 1.65 3.93 4.02
Table 5.13: Single results on aflatoxin B1 in peanut butter
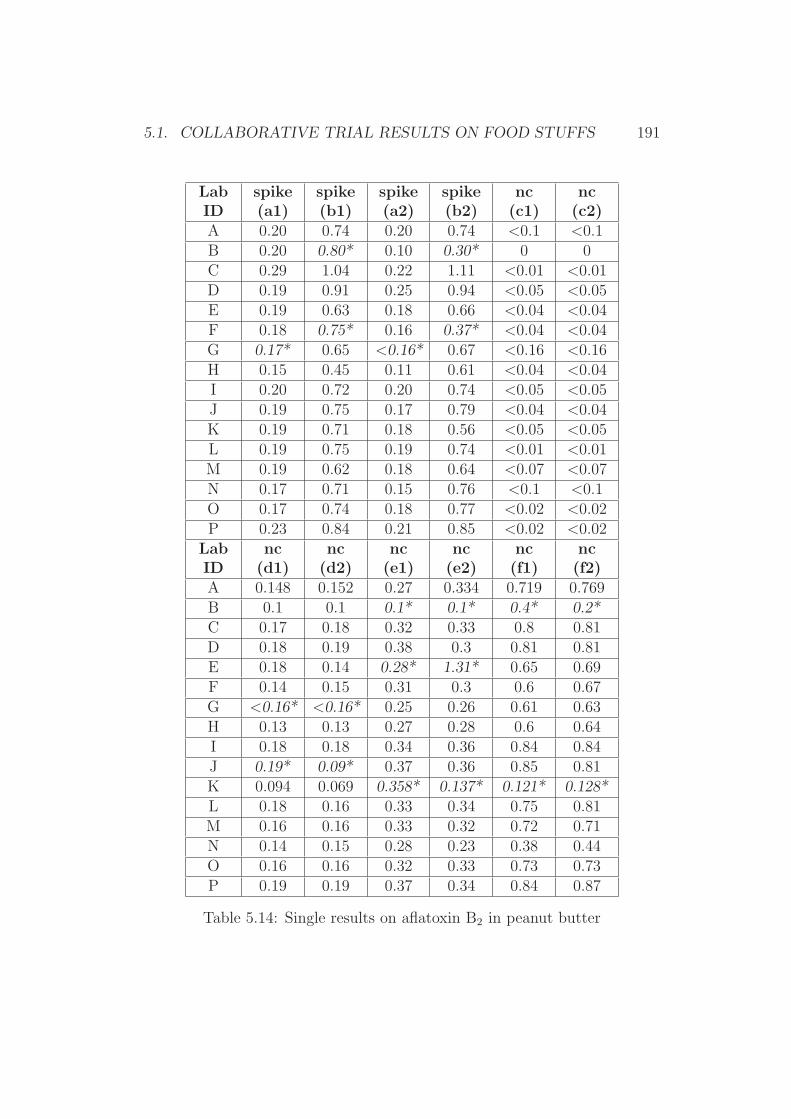
5.1. COLLABORATIVE TRIAL RESULTS ON FOOD STUFFS 191
LabID
spike(a1)
spike(b1)
spike(a2)
spike(b2)
nc(c1)
nc(c2)
A 0.20 0.74 0.20 0.74 <0.1 <0.1B 0.20 0.80* 0.10 0.30* 0 0C 0.29 1.04 0.22 1.11 <0.01 <0.01D 0.19 0.91 0.25 0.94 <0.05 <0.05E 0.19 0.63 0.18 0.66 <0.04 <0.04F 0.18 0.75* 0.16 0.37* <0.04 <0.04G 0.17* 0.65 <0.16* 0.67 <0.16 <0.16H 0.15 0.45 0.11 0.61 <0.04 <0.04I 0.20 0.72 0.20 0.74 <0.05 <0.05J 0.19 0.75 0.17 0.79 <0.04 <0.04K 0.19 0.71 0.18 0.56 <0.05 <0.05L 0.19 0.75 0.19 0.74 <0.01 <0.01M 0.19 0.62 0.18 0.64 <0.07 <0.07N 0.17 0.71 0.15 0.76 <0.1 <0.1O 0.17 0.74 0.18 0.77 <0.02 <0.02P 0.23 0.84 0.21 0.85 <0.02 <0.02
LabID
nc(d1)
nc(d2)
nc(e1)
nc(e2)
nc(f1)
nc(f2)
A 0.148 0.152 0.27 0.334 0.719 0.769B 0.1 0.1 0.1* 0.1* 0.4* 0.2*C 0.17 0.18 0.32 0.33 0.8 0.81D 0.18 0.19 0.38 0.3 0.81 0.81E 0.18 0.14 0.28* 1.31* 0.65 0.69F 0.14 0.15 0.31 0.3 0.6 0.67G <0.16* <0.16* 0.25 0.26 0.61 0.63H 0.13 0.13 0.27 0.28 0.6 0.64I 0.18 0.18 0.34 0.36 0.84 0.84J 0.19* 0.09* 0.37 0.36 0.85 0.81K 0.094 0.069 0.358* 0.137* 0.121* 0.128*L 0.18 0.16 0.33 0.34 0.75 0.81M 0.16 0.16 0.33 0.32 0.72 0.71N 0.14 0.15 0.28 0.23 0.38 0.44O 0.16 0.16 0.32 0.33 0.73 0.73P 0.19 0.19 0.37 0.34 0.84 0.87
Table 5.14: Single results on aflatoxin B2 in peanut butter
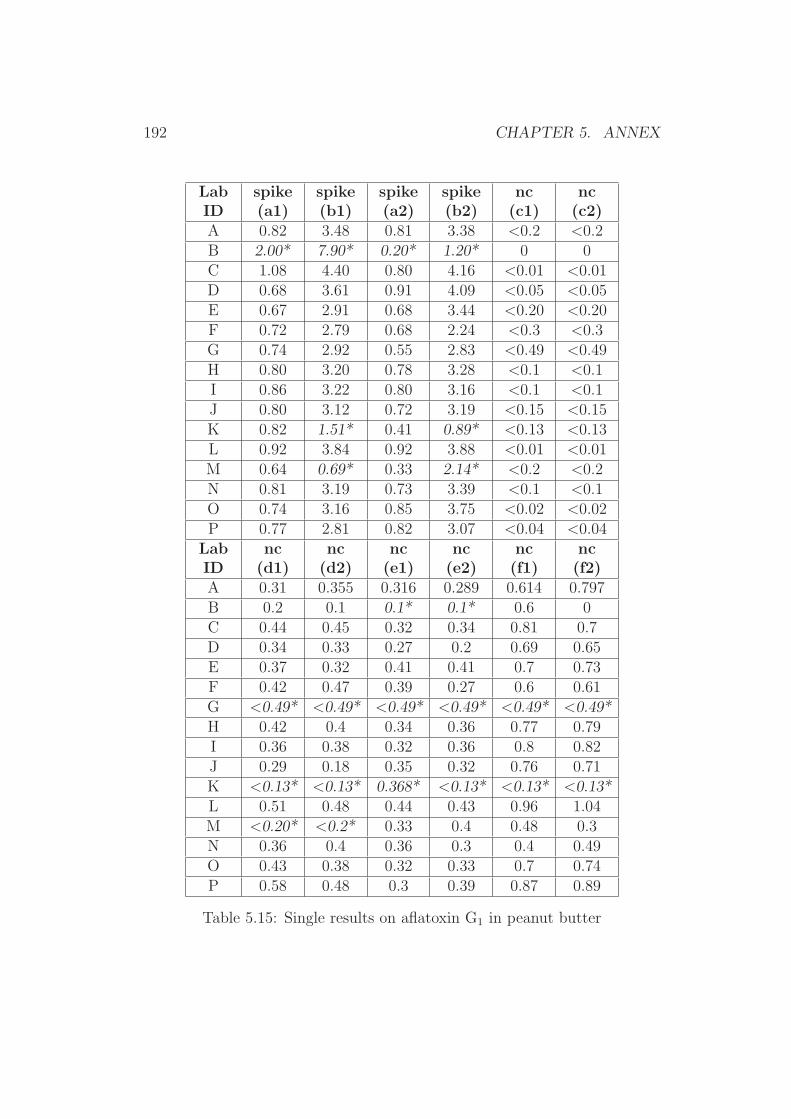
192 CHAPTER 5. ANNEX
LabID
spike(a1)
spike(b1)
spike(a2)
spike(b2)
nc(c1)
nc(c2)
A 0.82 3.48 0.81 3.38 <0.2 <0.2B 2.00* 7.90* 0.20* 1.20* 0 0C 1.08 4.40 0.80 4.16 <0.01 <0.01D 0.68 3.61 0.91 4.09 <0.05 <0.05E 0.67 2.91 0.68 3.44 <0.20 <0.20F 0.72 2.79 0.68 2.24 <0.3 <0.3G 0.74 2.92 0.55 2.83 <0.49 <0.49H 0.80 3.20 0.78 3.28 <0.1 <0.1I 0.86 3.22 0.80 3.16 <0.1 <0.1J 0.80 3.12 0.72 3.19 <0.15 <0.15K 0.82 1.51* 0.41 0.89* <0.13 <0.13L 0.92 3.84 0.92 3.88 <0.01 <0.01M 0.64 0.69* 0.33 2.14* <0.2 <0.2N 0.81 3.19 0.73 3.39 <0.1 <0.1O 0.74 3.16 0.85 3.75 <0.02 <0.02P 0.77 2.81 0.82 3.07 <0.04 <0.04
LabID
nc(d1)
nc(d2)
nc(e1)
nc(e2)
nc(f1)
nc(f2)
A 0.31 0.355 0.316 0.289 0.614 0.797B 0.2 0.1 0.1* 0.1* 0.6 0C 0.44 0.45 0.32 0.34 0.81 0.7D 0.34 0.33 0.27 0.2 0.69 0.65E 0.37 0.32 0.41 0.41 0.7 0.73F 0.42 0.47 0.39 0.27 0.6 0.61G <0.49* <0.49* <0.49* <0.49* <0.49* <0.49*H 0.42 0.4 0.34 0.36 0.77 0.79I 0.36 0.38 0.32 0.36 0.8 0.82J 0.29 0.18 0.35 0.32 0.76 0.71K <0.13* <0.13* 0.368* <0.13* <0.13* <0.13*L 0.51 0.48 0.44 0.43 0.96 1.04M <0.20* <0.2* 0.33 0.4 0.48 0.3N 0.36 0.4 0.36 0.3 0.4 0.49O 0.43 0.38 0.32 0.33 0.7 0.74P 0.58 0.48 0.3 0.39 0.87 0.89
Table 5.15: Single results on aflatoxin G1 in peanut butter

5.1. COLLABORATIVE TRIAL RESULTS ON FOOD STUFFS 193
LabID
spike(a1)
spike(b1)
spike(a2)
spike(b2)
nc(c1)
nc(c2)
A 0.14 0.68 0.16 0.70 <0.1 <0.1B 0.40* 1.40* 0.20* 0.50* 0 0C 0.24* 0.88 0.10* 0.77 <0.02 <0.02D 0.15 0.78 0.22 0.84 <0.05 <0.05E 0.15 0.69 0.13 0.71 <0.08 <0.08F 0.14 0.36 0.16 0.46 <0.09 <0.09G 0.17 0.69 0.14 0.67 <0.07 <0.07H 0.13* 0.17 0.03* 0.50 <0.1 <0.1I 0.18 0.66 0.16 0.68 <0.1 <0.1J 0.17 0.69 0.15 0.66 <0.08 <0.08K 0.17* 0.34 <0.1* 0.19 <0.1 <0.1L 0.16 0.60 0.16 0.59 <0.01 <0.01M <0.05* 0.18 <0.05* 0.44 <0.05 <0.05N 0.15 0.70 0.15 0.75 <0.1 <0.1O 0.16 0.70 0.19 0.80 <0.02 <0.02P 0.17 0.64 0.18 0.68 <0.03 <0.03
LabID
nc(d1)
nc(d2)
nc(e1)
nc(e2)
nc(f1)
nc(f2)
A 0.102 0.101 <0.1* 0.115* 0.185 0.234B 0.2* 0.1* 0.1* 0.2* 0.3 0.2C 0.11 0.1 0.05 0.07 0.22 0.16D 0.080 0.100 0.09 0.06 0.21 0.23E 0.12 0.09 0.1 0.13 0.23 0.2F 0.12 0.13 0.13 0.08 0.18* 0.49*G 0.07 0.07 <0.07* <0.07* 0.16 0.17H 0.09 0.07 0.07 0.07 0.17 0.17I 0.1 0.1 0.1 0.1 0.22 0.24J 0.08* <0.08* 0.08 0.1 0.21 0.23K <0.1* <0.1* 0.103* <0.1* <0.1* <0.1*L 0.09 0.12 0.08 0.1 0.27 0.28M <0.05* <0.05* 0.06* <0.05* 0.18* <0.05*N 0.11 0.11 0.1 0.095 0.13 0.14O 0.1 0.11 0.1 0.1 0.18 0.23P 0.13 0.13 0.09 0.09 0.25 0.27
Table 5.16: Single results on aflatoxin G2 in peanut butter

194 CHAPTER 5. ANNEX
5.2 Collaborative Trial Results on Infant For-
mula
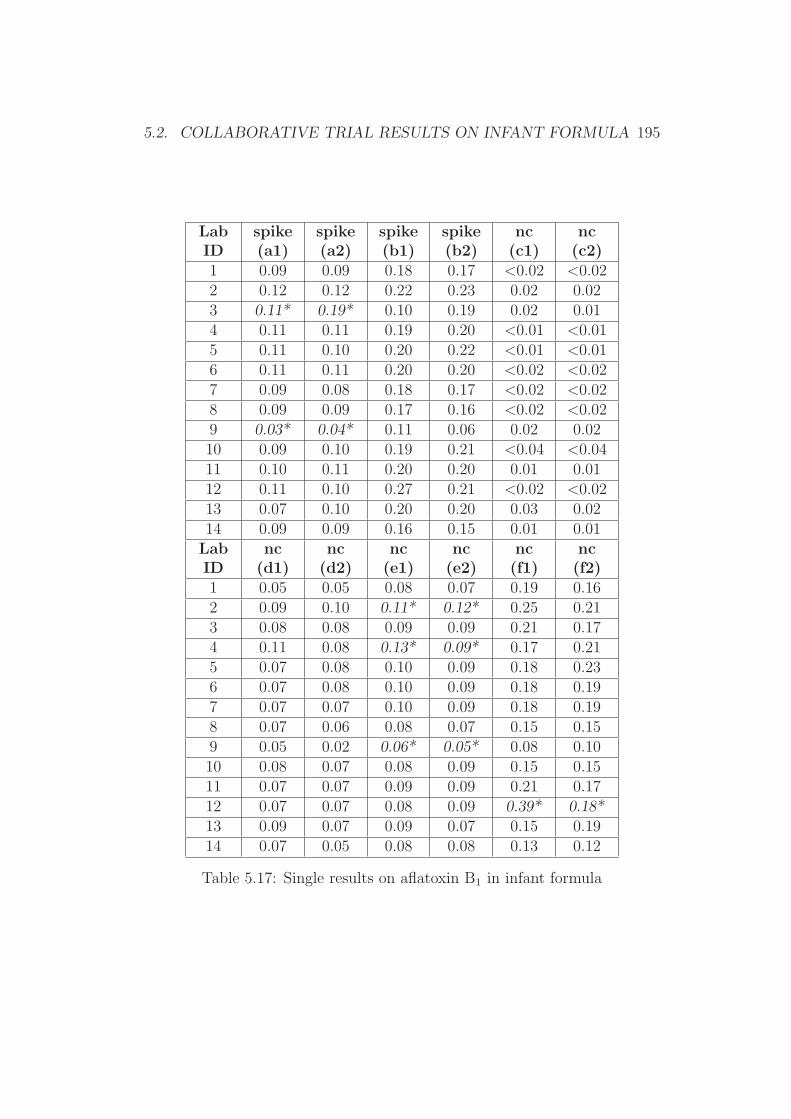
5.2. COLLABORATIVE TRIAL RESULTS ON INFANT FORMULA 195
LabID
spike(a1)
spike(a2)
spike(b1)
spike(b2)
nc(c1)
nc(c2)
1 0.09 0.09 0.18 0.17 <0.02 <0.022 0.12 0.12 0.22 0.23 0.02 0.023 0.11* 0.19* 0.10 0.19 0.02 0.014 0.11 0.11 0.19 0.20 <0.01 <0.015 0.11 0.10 0.20 0.22 <0.01 <0.016 0.11 0.11 0.20 0.20 <0.02 <0.027 0.09 0.08 0.18 0.17 <0.02 <0.028 0.09 0.09 0.17 0.16 <0.02 <0.029 0.03* 0.04* 0.11 0.06 0.02 0.0210 0.09 0.10 0.19 0.21 <0.04 <0.0411 0.10 0.11 0.20 0.20 0.01 0.0112 0.11 0.10 0.27 0.21 <0.02 <0.0213 0.07 0.10 0.20 0.20 0.03 0.0214 0.09 0.09 0.16 0.15 0.01 0.01
LabID
nc(d1)
nc(d2)
nc(e1)
nc(e2)
nc(f1)
nc(f2)
1 0.05 0.05 0.08 0.07 0.19 0.162 0.09 0.10 0.11* 0.12* 0.25 0.213 0.08 0.08 0.09 0.09 0.21 0.174 0.11 0.08 0.13* 0.09* 0.17 0.215 0.07 0.08 0.10 0.09 0.18 0.236 0.07 0.08 0.10 0.09 0.18 0.197 0.07 0.07 0.10 0.09 0.18 0.198 0.07 0.06 0.08 0.07 0.15 0.159 0.05 0.02 0.06* 0.05* 0.08 0.1010 0.08 0.07 0.08 0.09 0.15 0.1511 0.07 0.07 0.09 0.09 0.21 0.1712 0.07 0.07 0.08 0.09 0.39* 0.18*13 0.09 0.07 0.09 0.07 0.15 0.1914 0.07 0.05 0.08 0.08 0.13 0.12
Table 5.17: Single results on aflatoxin B1 in infant formula

196 CHAPTER 5. ANNEX
5.3 Collaborative Trial Results on Animal Feed

5.3. COLLABORATIVE TRIAL RESULTS ON ANIMAL FEED 197
LabID
spike(a1)
spike(a2)
spike(b1)
spike(b2)
nc(c1)
nc(c2)
1 1.26 1.42 3.94 4.10 <0,2 <0,22 1.17 0.90 3.62 3.62 0.00 0.143 1.59 1.47 4.48 4.70 <0.34 <0.344 1.28 1.31 3.77 3.76 0.04 0.055 0.92 1.08 2.97 2.88 0.12 0.086 1.33 1.13 3.70 3.60 <0,2 <0,27 1.13 1.11 3.50 3.36 <0,25 <0,258 1.47 1.46 3.89 3.95 0.16 0.129 1.63 1.63 4.88 4.20 0.11 0.1410 1.10 1.04 3.64 2.77 0.00 0.0011 1.44 1.41 4.33 4.31 0.54 0.6212 1.49 1.44 4.29 4.38 0.08 0.0113 1.01 1.01 2.99 2.77 0.00 0.0114 0.94 0.92 2.80 2.67 n.d. n.d.15 1.88 1.70 4.46 3.56 1.11 0.8016 1.28 1.21 3.75 3.67 0.04 0.0717 1.52 1.42 3.46 3.75 0.10 <0.0518 1.38 1.45 4.01 4.02 0.12 0.0819 1.27 1.32 3.66 3.76 0.05 0.0520 1.80 1.75 5.60 5.30 0.12 0.1021 5.44* 5.60* 15.84* 14.32* 0.96 0.80
Table 5.18: Single results on aflatoxin B1 in animal feed (Part1)
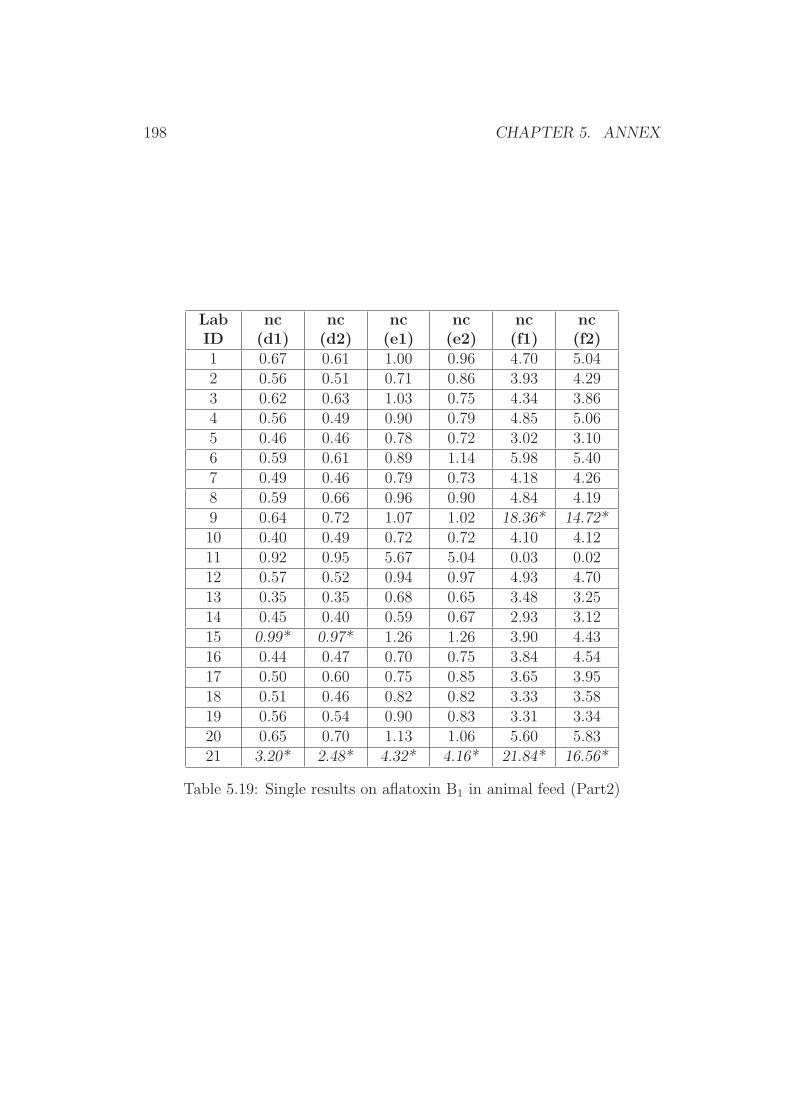
198 CHAPTER 5. ANNEX
LabID
nc(d1)
nc(d2)
nc(e1)
nc(e2)
nc(f1)
nc(f2)
1 0.67 0.61 1.00 0.96 4.70 5.042 0.56 0.51 0.71 0.86 3.93 4.293 0.62 0.63 1.03 0.75 4.34 3.864 0.56 0.49 0.90 0.79 4.85 5.065 0.46 0.46 0.78 0.72 3.02 3.106 0.59 0.61 0.89 1.14 5.98 5.407 0.49 0.46 0.79 0.73 4.18 4.268 0.59 0.66 0.96 0.90 4.84 4.199 0.64 0.72 1.07 1.02 18.36* 14.72*10 0.40 0.49 0.72 0.72 4.10 4.1211 0.92 0.95 5.67 5.04 0.03 0.0212 0.57 0.52 0.94 0.97 4.93 4.7013 0.35 0.35 0.68 0.65 3.48 3.2514 0.45 0.40 0.59 0.67 2.93 3.1215 0.99* 0.97* 1.26 1.26 3.90 4.4316 0.44 0.47 0.70 0.75 3.84 4.5417 0.50 0.60 0.75 0.85 3.65 3.9518 0.51 0.46 0.82 0.82 3.33 3.5819 0.56 0.54 0.90 0.83 3.31 3.3420 0.65 0.70 1.13 1.06 5.60 5.8321 3.20* 2.48* 4.32* 4.16* 21.84* 16.56*
Table 5.19: Single results on aflatoxin B1 in animal feed (Part2)