Embed Size (px)
Citation preview
Determination of Ancestry from Discrete Traits of the Mandible
Nicolette M. L. Parr
B.A., University of Florida at Gainesville, 2002
A Thesis Submitted in Partial Fulfillment of the Requirements for the Degree of Master of Science in Human Biology in the Graduate School of the University of Indianapolis
August 2005
Copyright © 2005 Nicolette M. L. Parr. All Rights Reserved
i
FORM B
Accepted by the faculty of the Graduate School, University of Indianapolis, in the partial fulfillment of the requirements for the Master of Science degree in
HUMAN BIOLOGY
Stephen P. Nawrocki __________________________________ Thesis Advisor – Dr. Stephen P. Nawrocki, D.A.B.F.A
Christopher W. Schmidt __________________________________
Reader – Dr. Christopher W. Schmidt
8-15-05 _______________________
Date

ii
DEDICATION
I would like to dedicate this thesis to my parents who have always supported me
emotionally and physically and for their constant encouragement to do my best.
iii
ACKNOWLEDGEMENTS
This project would not have been possible without the help and support of many people.
First and foremost, I would like to thank Dr. Stephen Nawrocki for the endless guidance and
knowledge that he bestowed upon me. I am also appreciative for all of the time, effort, and
financial support that he put into my trip to South Africa. Additionally, I am grateful to Dr.
Christopher Schmidt for his support and assistance throughout the course of this study.
I would also like to thank Dr. Mike Warren, Dr. David Hunt, Lyman Jellema, and Dr. Jan
Meiring for allowing me access to their collections. I would also like to express my extreme
gratitude to Dr. Maryna Steyn, Dr. Erika L’Abbé, and Marius Loots for being such gracious
hosts, tour guides, and friends during my stay in South Africa.
I am also forever grateful to my friends at the University of Indianapolis for their
constant support. I would especially like to thank Janene Curtis, Molly Hill, and Krista Latham
for setting the bar high so that I could only attempt to follow; Adam Kolatorowicz for his
friendship; Bobbie Leeper for never leaving my side for two months; Carlos Zambrano for
putting up with my occasional ranting and raving, now and for six more years; Jeremy Potter for
helping me out when I was in a bind and for being so patient and understanding; Sarah Kiley for
being an amazing roommate and even better friend; and last but not least, Jenn Harms for many
much needed laughs, always being a shoulder to lean on, and for sharing two difficult but
amazing years with me.
iv
ABSTRACT
In the field of forensic anthropology, the construction of a biological profile is of utmost
importance in the identification of a decedent. The biological profile includes the age, sex,
stature, and ancestry of the individual. Of these, ancestry is considered the most difficult to
determine.
The purpose of this study is to build on previous non-metric studies of the mandible to
determine whether it may be used to differentiate between individuals of European and African
ancestry. This study looks at skeletal remains from the Hamann-Todd Collection, the Terry
Collection, a contemporary forensic collection at the University of Florida, and the Pretoria Bone
Collection in South Africa. A total of 921 individuals with documented age, sex, and ancestry
were analyzed. Twelve non-metric traits were examined: ramus inversion, location of inversion,
gonial eversion, mandibular border form, mandibular tori, robusticity of muscle attachment sites,
mylohyoid bridging, accessory mandibular foramen, chin prominence, chin shape, number of
mental foramina, and the position of the mental foramen.
Wilcoxon Signed Ranks Test was used to determine if there was a relationship between
trait frequency and side. This test was also used to see if there was a significant amount of intra-
observer error between the first and second scorings of the Florida sample. Ordinal regression
was utilized to determine the effect, if any, that age, sex, ancestry, and the interaction between
sex and ancestry have on any given non-metric trait.
Six traits differed significantly between the left and right sides. Intra-observer error was
relatively low, with two traits showing a significant difference between the first and second
observations. Nine out of 12 traits were significantly affected by ancestry. However, due to the
v
effects of sex, age, and the sensitivity of ordinal regression, some of these traits may be less
useful than others in determining ancestry in unknown cases. Ramus inversion, gonial inversion,
muscle attachment sites, chin shape, number of mental foramina, and position of the mental
foramen are the most effective traits to use when determining ancestry. However, caution must
be taken because all of them except the number of mental foramen are significantly affected by
sex. The number of mental foramina may be the most reliable trait because it is statistically and
practically significant and it is not affected by sex, age, or the interaction between sex and
ancestry. However, multiple foramina are very rare in all populations studied.
European individuals were found to most likely posses little to no ramus inversion, no
gonial eversion (straight gonia), gracile muscle attachment sites, a round or square chin, one
mental foramen, and a more anteriorly placed mental foramen. Individuals of African descent
were more likely to display moderate to extreme ramus inversion, gonial inversion, a round chin,
and multiple mental foramina.
This study is the first multivariate study conducted on discrete mandibular traits used for
the determination of ancestry. Employing ordinal regression on a large sample of identified
individuals, this study determines whether sex and age affect the incidence of each trait
independently of ancestry. Additionally individuals from two separate continents are examined;
therefore, the findings are applicable for worldwide use. While ancestry determination from the
cranium has been established as reliable in the literature, a suite of characteristics derived from
multiple bones is preferred. The inclusion of mandibular traits builds on previous non-metric
studies and helps to increase the reliability of ancestral determination from the skeleton.
vi
TABLE OF CONTENTS
Signature Page . . . . . . . . . . . . . . . . . . . . . . . . . . . . . . . . . . . . . . . . . . . . . . . . . . . . . . . . . . . . . i
Dedication . . . . . . . . . . . . . . . . . . . . . . . . . . . . . . . . . . . . . . . . . . . . . . . . . . . . . . . . . . . . . . . . ii
Acknowlegements . . . . . . . . . . . . . . . . . . . . . . . . . . . . . . . . . . . . . . . . . . . . . . . . . . . . . . . . . . iii
Abstract . . . . . . . . . . . . . . . . . . . . . . . . . . . . . . . . . . . . . . . . . . . . . . . . . . . . . . . . . . . . . . . . . . iv
Chapter 1: Introduction . . . . . . . . . . . . . . . . . . . . . . . . . . . . . . . . . . . . . . . . . . . . . . . . . . . . . . 1
Chapter 2: Background . . . . . . . . . . . . . . . . . . . . . . . . . . . . . . . . . . . . . . . . . . . . . . . . . . . . . . 10
Chapter 3: Materials and Methods . . . . . . . . . . . . . . . . . . . . . . . . . . . . . . . . . . . . . . . . . . . . . 33
Chapter 4: Results . . . . . . . . . . . . . . . . . . . . . . . . . . . . . . . . . . . . . . . . . . . . . . . . . . . . . . . . . . 46
Chapter 5: Discussion and Conclusions . . . . . . . . . . . . . . . . . . . . . . . . . . . . . . . . . . . . . . . . . 73
Literature Cited . . . . . . . . . . . . . . . . . . . . . . . . . . . . . . . . . . . . . . . . . . . . . . . . . . . . . . . . . . . . 98
1
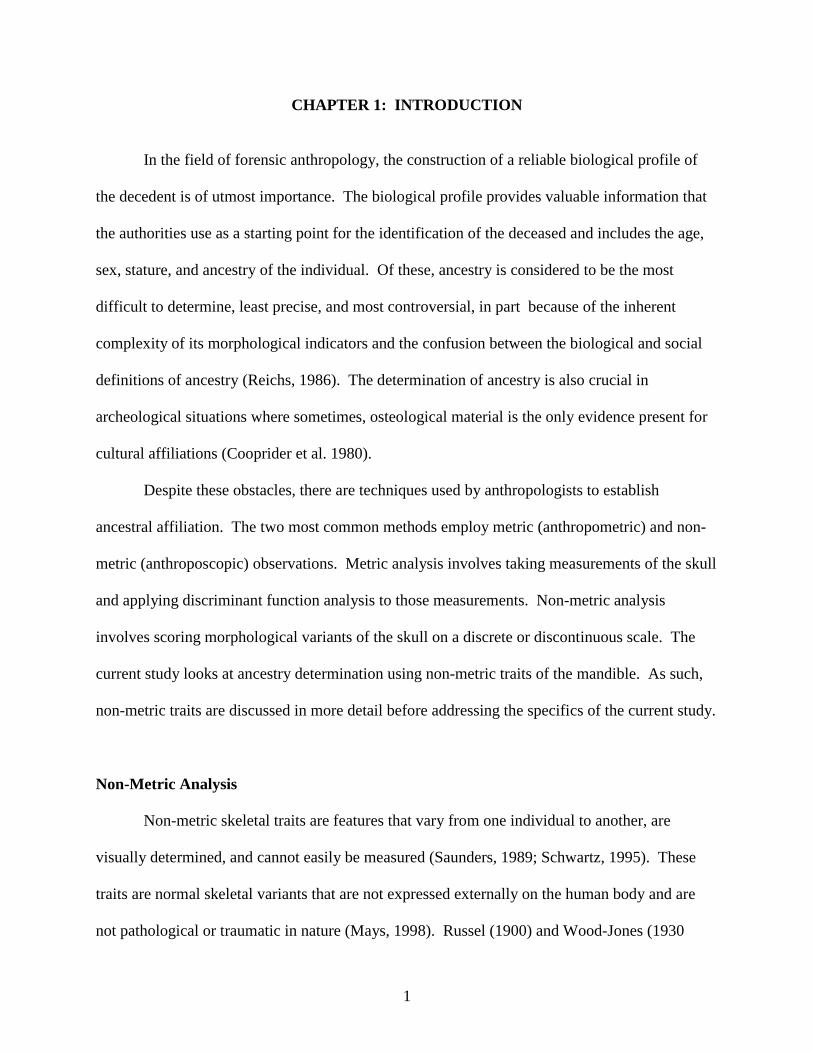
CHAPTER 1: INTRODUCTION
In the field of forensic anthropology, the construction of a reliable biological profile of
the decedent is of utmost importance. The biological profile provides valuable information that
the authorities use as a starting point for the identification of the deceased and includes the age,
sex, stature, and ancestry of the individual. Of these, ancestry is considered to be the most
difficult to determine, least precise, and most controversial, in part because of the inherent
complexity of its morphological indicators and the confusion between the biological and social
definitions of ancestry (Reichs, 1986). The determination of ancestry is also crucial in
archeological situations where sometimes, osteological material is the only evidence present for
cultural affiliations (Cooprider et al. 1980).
Despite these obstacles, there are techniques used by anthropologists to establish
ancestral affiliation. The two most common methods employ metric (anthropometric) and non-
metric (anthroposcopic) observations. Metric analysis involves taking measurements of the skull
and applying discriminant function analysis to those measurements. Non-metric analysis
involves scoring morphological variants of the skull on a discrete or discontinuous scale. The
current study looks at ancestry determination using non-metric traits of the mandible. As such,
non-metric traits are discussed in more detail before addressing the specifics of the current study.
Non-Metric Analysis
Non-metric skeletal traits are features that vary from one individual to another, are
visually determined, and cannot easily be measured (Saunders, 1989; Schwartz, 1995). These
traits are normal skeletal variants that are not expressed externally on the human body and are
not pathological or traumatic in nature (Mays, 1998). Russel (1900) and Wood-Jones (1930
2
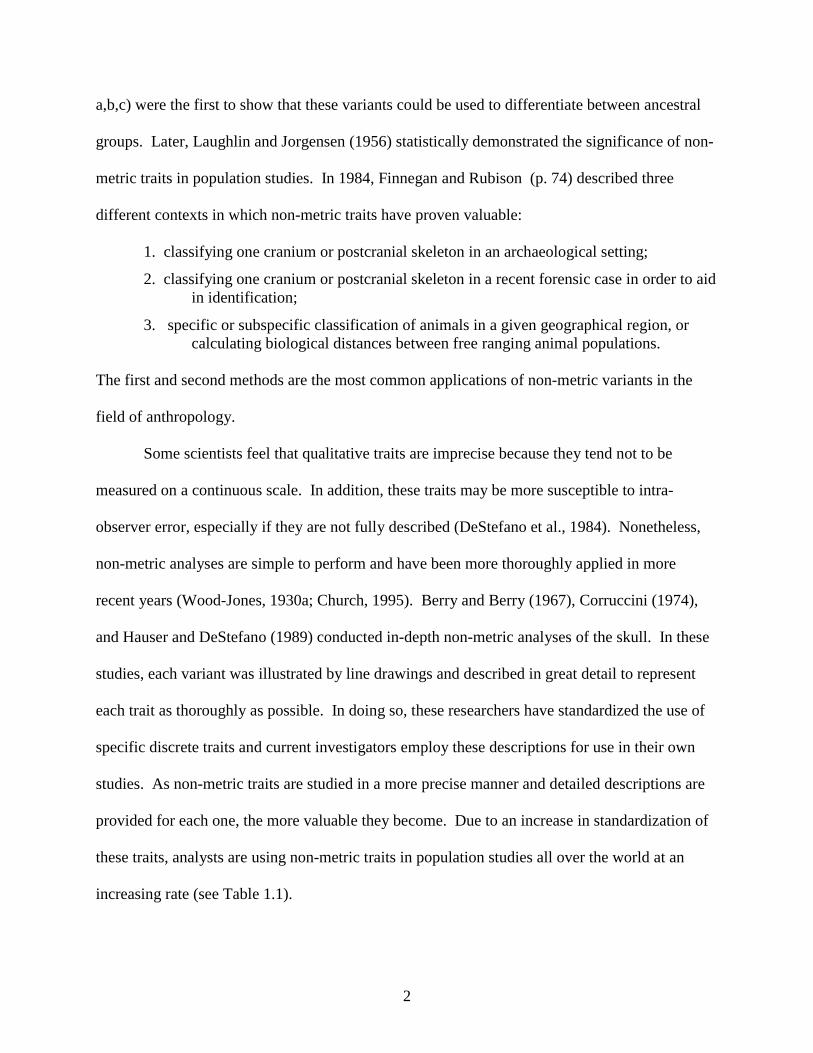
a,b,c) were the first to show that these variants could be used to differentiate between ancestral
groups. Later, Laughlin and Jorgensen (1956) statistically demonstrated the significance of non-
metric traits in population studies. In 1984, Finnegan and Rubison (p. 74) described three
different contexts in which non-metric traits have proven valuable:
1. classifying one cranium or postcranial skeleton in an archaeological setting;
2. classifying one cranium or postcranial skeleton in a recent forensic case in order to aid in identification;
3. specific or subspecific classification of animals in a given geographical region, or calculating biological distances between free ranging animal populations.
The first and second methods are the most common applications of non-metric variants in the
field of anthropology.
Some scientists feel that qualitative traits are imprecise because they tend not to be
measured on a continuous scale. In addition, these traits may be more susceptible to intra-
observer error, especially if they are not fully described (DeStefano et al., 1984). Nonetheless,
non-metric analyses are simple to perform and have been more thoroughly applied in more
recent years (Wood-Jones, 1930a; Church, 1995). Berry and Berry (1967), Corruccini (1974),
and Hauser and DeStefano (1989) conducted in-depth non-metric analyses of the skull. In these
studies, each variant was illustrated by line drawings and described in great detail to represent
each trait as thoroughly as possible. In doing so, these researchers have standardized the use of
specific discrete traits and current investigators employ these descriptions for use in their own
studies. As non-metric traits are studied in a more precise manner and detailed descriptions are
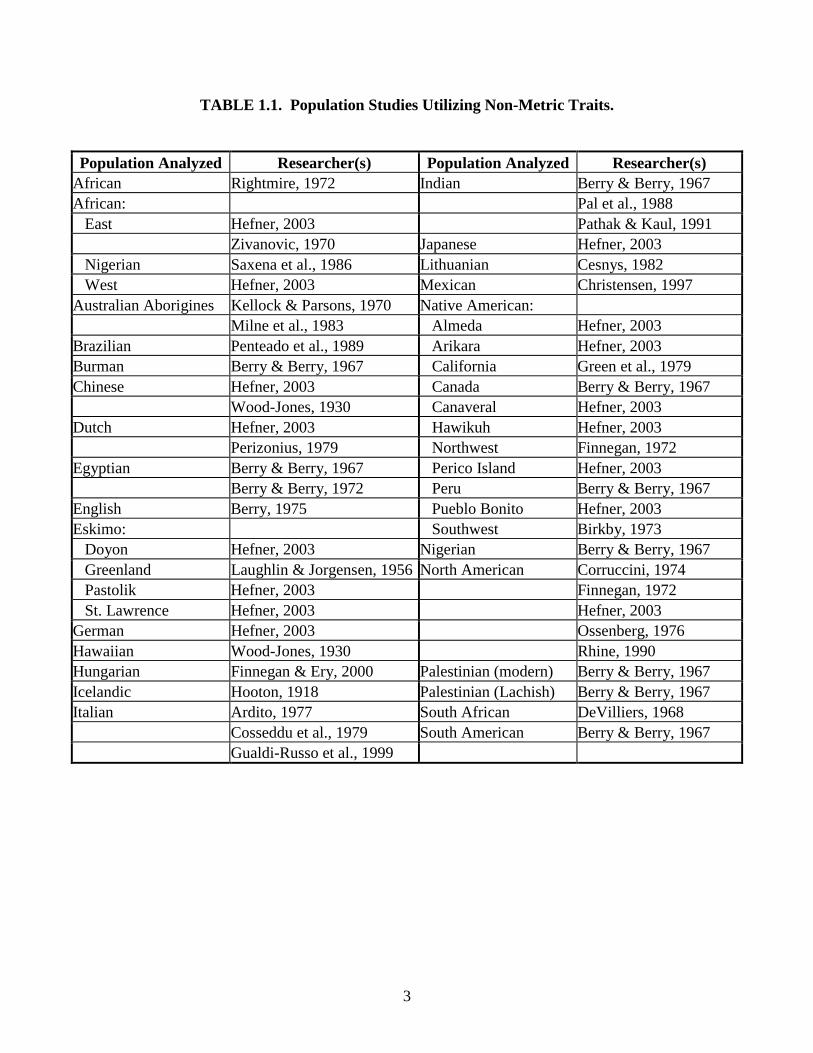
provided for each one, the more valuable they become. Due to an increase in standardization of
these traits, analysts are using non-metric traits in population studies all over the world at an
increasing rate (see Table 1.1).
3
TABLE 1.1. Population Studies Utilizing Non-Metric Traits.
Population Analyzed Researcher(s) Population Analyzed Researcher(s) African Rightmire, 1972 Indian Berry & Berry, 1967 African: Pal et al., 1988 East Hefner, 2003 Pathak & Kaul, 1991 Zivanovic, 1970 Japanese Hefner, 2003 Nigerian Saxena et al., 1986 Lithuanian Cesnys, 1982 West Hefner, 2003 Mexican Christensen, 1997 Australian Aborigines Kellock & Parsons, 1970 Native American: Milne et al., 1983 Almeda Hefner, 2003 Brazilian Penteado et al., 1989 Arikara Hefner, 2003 Burman Berry & Berry, 1967 California Green et al., 1979 Chinese Hefner, 2003 Canada Berry & Berry, 1967 Wood-Jones, 1930 Canaveral Hefner, 2003 Dutch Hefner, 2003 Hawikuh Hefner, 2003 Perizonius, 1979 Northwest Finnegan, 1972 Egyptian Berry & Berry, 1967 Perico Island Hefner, 2003 Berry & Berry, 1972 Peru Berry & Berry, 1967 English Berry, 1975 Pueblo Bonito Hefner, 2003 Eskimo: Southwest Birkby, 1973 Doyon Hefner, 2003 Nigerian Berry & Berry, 1967 Greenland Laughlin & Jorgensen, 1956 North American Corruccini, 1974 Pastolik Hefner, 2003 Finnegan, 1972 St. Lawrence Hefner, 2003 Hefner, 2003 German Hefner, 2003 Ossenberg, 1976 Hawaiian Wood-Jones, 1930 Rhine, 1990 Hungarian Finnegan & Ery, 2000 Palestinian (modern) Berry & Berry, 1967 Icelandic Hooton, 1918 Palestinian (Lachish) Berry & Berry, 1967 Italian Ardito, 1977 South African DeVilliers, 1968 Cosseddu et al., 1979 South American Berry & Berry, 1967 Gualdi-Russo et al., 1999
4
Most non-metric traits that are utilized fall into a number of different categories (Mays,
1998, p. 102):
1. variation in the number of bones or teeth; 2. anomalies of bone fusion; 3. variation in bony foramina; 4. articular facet variations; 5. hyperostoses: traits characterized by a localized excess of bone formation; 6. hypostoses: traits characterized by a localized deficiency of bone; 7. variation in the form of the tooth crowns.
Although there is much disagreement among anthropologists, the scoring of traits is traditionally
performed in two ways. Those that have intermediate stages are scored on a ranked system
(Church, 1995; Corruccini, 1974). These traits are ordinal in nature and have been described as
“quasi-continuous” because they appear to range in a gradating order that is, nonetheless,
difficult to scale metrically (eg., the mandibular torus may be scored as small, medium, or large)
(Saunders, 1989). More clearly discontinuous traits are scored as “present/absent” or
“complete/incomplete.” Such traits usually include the presence/absence of a particular bone or
foramen or whether or not a certain foramen is completely formed (e.g., lambdoid ossicle,
foramen of Huschke, or supraorbital foramen). Many non-metric studies have employed
discontinuous morphological variants (Berry and Berry, 1967; Corruccini, 1974; Finnegan, 1972;
Hauser and DeStefano, 1989; Laughlin and Jorgensen, 1956; Ossenberg, 1976; Penteado et al.,
1989; Rosing, 1934; Russell, 1900; Wood-Jones 1930a,b,c; 1933), yet these discrete traits are
more useful for determining population distances of closely related groups and usually are not as
practical for differentiating between two or three large ancestral groups in a forensic context
(Finnegan and McGuire, 1979; Hefner, 2003).
Anthropologists have generally scored bilateral traits in two ways. The first method
scores a trait if it is present in an individual regardless of whether it appears on one or both sides
5
of the body. The alternative technique involves scoring the variant separately as it occurs on
each side. Both of these methods have their faults. The scoring per individual method may
underestimate the occurrence of a trait within a population. The side method treats the trait as if
it is independent between sides (Saunders, 1989) and tends to overestimate the occurrence of
variants, resulting in an artificially inflated sample size (Suchey, 1975).
Age, Sex, and Side Differences in Non-Metric Traits
Age. A landmark study by Ossenberg (1969) using discrete traits found that the presence
of non-metric traits differed considerably by age. However, the differences encountered varied
mostly in sub-adult individuals and were due to developmental changes. Most scientists agree
that sub-adults should be excluded when looking at non-metric traits (Saunders, 1989). Various
studies using adults have shown that there is a significant difference in the expression of discrete
traits between various age groups (Corruccini, 1974; Dahinten and Pucciarelli, 1981; Finnegan,
1972; Molto, 1983; Muller & Mayhall, 1971; Ossenberg, 1969; Sonnier et al., 1999). For some
of these studies, when age was a factor, hyperostotic traits were more frequent in older
individuals while younger individuals showed and more hypostotic conditions (Molto, 1983;
Ossenberg, 1969). This phenomenon is likely due to continual ossification in adults, leading to
the elimination of hypostotic traits (Buikstra, 1972; Saunders, 1989). Other studies have failed
to find a significant age effect (Berry, 1975; Brasili et al., 1999; Brasili-Gualandi and Gualdi-
Russo, 1989; Finnegan and Marcsik 1979; Sciulli, 1990). Nonetheless, age should be taken into
consideration when dealing with non-metric traits (Brothwell, 1981; Buikstra, 1972; Saunders,
1989). Additionally, a sample with known age of death is preferable to one with only anatomical
estimates of age (Corruccini, 1974).
6
Sex. A number of researchers have found that there are no significant sex differences in
non-metric traits (Berry and Berry, 1967; Cosseddu et al., 1979; Muller & Mayhall, 1971;
Ossenberg, 1976; Sawyer et al. 1998), while other studies show a disparity between the sexes
(Angel and Kelley, 1990; Berry, 1975; Corruccini, 1974; Finnegan, 1972; Finnegan and Marcsik,
1989; Sonnier et al., 1999). Some analysts have excluded traits that are influenced by sexual
dimorphism from their studies (Finnegan, 1972; Jantz, 1970; Perizonius, 1979). However, this
approach decreases the number of traits used in the study, and dimorphic traits are usually the
most variable ones between populations (Finnegan, 1972). A more appropriate solution is to
divide the sample into males and females and then analyze each group separately (Berry, 1975;
Brasili-Gualandi and Gualdi-Russo, 1989; Brasili et al., 1999; Brothwell, 1981; Cesnys, 1982;
Corruncini, 1974; Cosseddu et al. 1979; Milne et al. 1983; Woo, 1950). Several researchers have
hypothesized that differential appearance of traits may be due to increased skeletal robusticity in
males and decreased robusticity in females. Males are more likely to express hyperostotic
features, whereas hypostotic traits are more common in females (Ossenberg, 1969; Molto, 1983).
Side. As with age and sex discrepancies, the laterality of discrete traits is another issue
that has been disputed by anthropologists. Several studies have shown that non-metric traits are
symmetrical (Brasili and Gualdi-Russo, 1989; Brasili et al., 1999; Cosseddu et al., 1979;
Finnegan and Marcsik, 1979; Ossenberg, 1981; Sawyer et al., 1998; Sonnier et al., 1999), while a
few researchers have noted that traits can differ significantly between sides (Finnegan and
Marcsik 1989; Green et al. 1979). Researchers who have found a discrepancy between the sides
have suggested that previous studies were using incorrect statistical tests and instead suggest
using chi-squared analysis (Green et al. 1979).
7
Advantages of Non-Metric Analyses
The technique of analyzing discrete variants does not require expensive, delicate, or
complex equipment (Rhine, 1990). Therefore, analyses of discrete traits can be conducted fairly
quickly. Another advantage of non-metric analysis is that it can be performed on incomplete
skulls, whereas with metric analysis, an entire skull is typically necessary for a full battery of
measurements. In order to score a discrete trait, the only portion of the skull necessary is the
area where the variant occurs; therefore, even fragments of skulls can be analyzed for discrete
characteristics (Rhine, 1990). Additionally, non-metric analyses may be utilized regardless of
prior knowledge of the sex of an individual, whereas most older metric analysis methods
required the allocation of an individual to a particular sex before the discriminant function could
be applied (Finnegan and McGuire, 1979). However, modern computer methods such as
FORDISC 2.0 allow you to apply discriminant functions without knowing sex.
Disadvantages of Non-Metric Analyses
Non-metric analyses have been criticized because of the subjectivity of the
anthropologist’s characterization of the traits in question, which may account for a high degree
of inter-observer error (Church, 1995). Another problem with the use of non-metric variants is
that many are not clearly illustrated in the literature; therefore, an investigator may not know
exactly what she is looking for (Rosing, 1984). Non-metric traits that have been thoroughly
explained should have greater reliability and less inter-observer error. Unfortunately, there are
still certain traits that have not been adequately described, consequently decreasing their value
(Wood-Jones, 1930; Church, 1995).
Another problem is that studies using non-metric traits generally use rudimentary
8
statistics. Being discontinuous in nature, it is more difficult to properly analyze non-metric
traits. While statistical methods do exist for non-metric traits, such as the Grewal-Smith method
used by Berry and Berry (1967) and the non-parametric Rubison method used by Finnegan and
Rubison (1984), it is rare that such statistical analyses are used in forensic studies since they are
more appropriate for micro-geographical studies that concentrate on closely related populations.
Instead, most non-metric studies within the field of forensic anthropology emphasize simple trait
frequencies as a means of analysis (Hefner, 2003).
Purpose and Hypothesis
The purpose of this study is to build on previous non-metric studies of the mandible to
determine whether it may be used to differentiate between individuals of European and African
ancestry. Several studies have shown that ancestry can be determined by looking at non-metric
characteristics of the skull. Unfortunately, the majority of these studies neglected to include the
mandible. Many of the traits commonly used for the determination of ancestry are found on the
face. However, these facial bones are rather thin, are the most fragile part of the skull, and are
usually the first to be destroyed by taphomonic forces. The mandible, however, is quite dense
and is more likely to survive in an archeological or forensic setting. Many relevant studies suffer
from small sample sizes, do not control for age or sex, or were derived from collections whose
ancestry was anatomically determined rather than known.
There is no discrete trait that is unique to any particular population; therefore, several
traits will be used to determine their relative frequencies between and among populations. The
discrete traits included in the present analyses are: ramus inversion, location of inversion, gonial
eversion, mandibular border form, presence of mandibular tori, robusticity of muscle attachment
sites, mylohyoid bridging, chin prominence, chin shape, number of mental foramina, position of
9
the mental foramen, and presence of an accessory mandibular foramen. Additionally, five
measurements (bigonial width, bicondylar breadth, mandibular length, mandibular angle, and
minimum ramus breadth) also are included to account for size differences between male and
female individuals. A large sample of modern individuals from two continents (North America
and Africa) is used, all having documented age, sex, and ancestry.
Chapter 2 examines previous studies that have focused on determining ancestry from the
mandible. Chapter 3 presents the sample populations, the utilized traits, the methods used to
score each trait, and a summary of statistical methods used in the study. Chapter 4 presents the
results of the statistical analyses. Finally, in Chapter 5, the findings are discussed in the broader
context of forensic analysis.
10
CHAPTER 2: BACKGROUND
The most reliable skeletal element for determining ancestry is the skull (Rathbun &
Buikstra, 1984; Krogman, 1986, Novotny et al. 1993). However, the most widely used area of
the cranium is the face, which is comprised of thin and fragile bone. While the majority of
anthropologists focus primarily on the cranium, few studies have sufficiently analyzed
mandibular characteristics as dependable ancestral indicators. The mandible is more robust than
the facial bones, therefore, it is more likely to survive in an archeological or forensic setting.
Some have argued that the mandible is not useful in the determination of ancestry (Jankowsky,
1930; Morant et al., 1923), whereas other studies have demonstrated that the opposite is true
(Angel and Kelley, 1990; Parr, 2003; Rhine, 1990; Schulz, 1933).
Early Studies
Metric. Between the early 1900’s and 1990, few studies were conducted on the
mandible. Most of these studies are obscure, difficult to obtain, and in a language other than
English. Jankowsky (1930, as cited in Krogman, 1986) conducted a metric analysis of 15
individuals from Europe, Africa, Java, Australia, Japan, and Polynesia as a means for
determining ancestry. Using two indices constructed from measurements of the mandibular
ramus and corpus, Jankowsky concluded that there was so much variability between the
populations that the mandible could not be used for determining ancestry. However his sample
size was essentially too small to draw any definitive conclusions.
In 1936, Morant and colleagues conducted a metric study to determine the effectiveness
of mandibular measurements in ancestry determination. The measurements and methods used
11
were taken from an earlier, pilot study conducted on 32 Tibetan skulls, 23 of which had
mandibles, and 5 additional loose mandibles (Morant et al., 1923). Many of the basic
measurements of the mandible used today, such as bicondylar breadth and bicondylar width, are
derived from this initial study. Each measurement was described in great detail and taken on 256
Egyptian mandibles from the Kerma and Qau populations. They concluded that there was no
difference between these two closely-related groups.
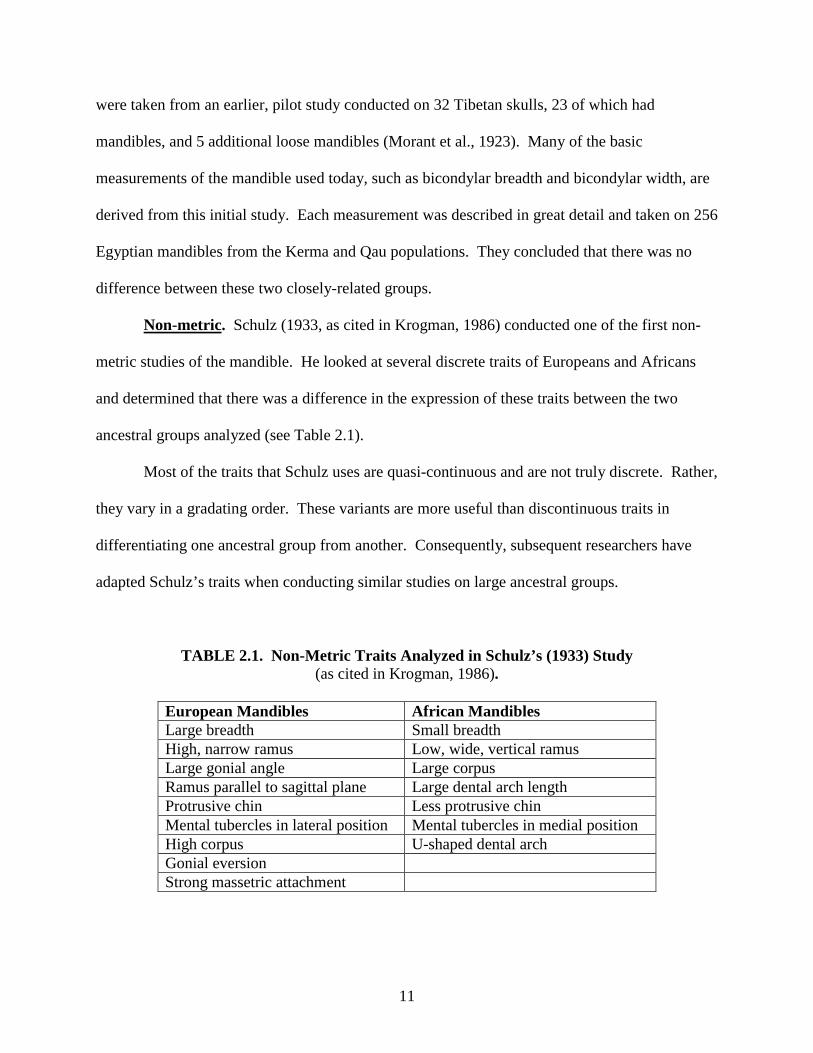
Non-metric. Schulz (1933, as cited in Krogman, 1986) conducted one of the first non-
metric studies of the mandible. He looked at several discrete traits of Europeans and Africans
and determined that there was a difference in the expression of these traits between the two
ancestral groups analyzed (see Table 2.1).
Most of the traits that Schulz uses are quasi-continuous and are not truly discrete. Rather,
they vary in a gradating order. These variants are more useful than discontinuous traits in
differentiating one ancestral group from another. Consequently, subsequent researchers have
adapted Schulz’s traits when conducting similar studies on large ancestral groups.
TABLE 2.1. Non-Metric Traits Analyzed in Schulz’s (1933) Study (as cited in Krogman, 1986).
European Mandibles African Mandibles Large breadth Small breadth High, narrow ramus Low, wide, vertical ramus Large gonial angle Large corpus Ramus parallel to sagittal plane Large dental arch length Protrusive chin Less protrusive chin Mental tubercles in lateral position Mental tubercles in medial position High corpus U-shaped dental arch Gonial eversion Strong massetric attachment
12
Murphy (1957) performed another non-metric study of the mandible. He was concerned
primarily with non-metric traits of the chin, including the number of mental foramina, the
position and direction of the mental foramen, the lingual aspect of the mandible, the genial
tubercles, and genial foramina. Six-hundred and twenty-five juvenile and adult Australian
Aborigine mandibles were analyzed. The sample was separated into five age groups based on
the development of the dentition. Edentulous or near-edentulous mandibles were excluded from
the age related analyses. Sex of the individual was only noted in the adult mandibles (n = 476).
Murphy used Chi-squared analysis to determine the significance of age, sex, and side for each
trait.
Multiple mental foramina were found in 16.7% of the sample; of these, only 4% were
bilateral. Sex was found to be significant with 12.1% males and 19.2% females possessing
multiple mental foramina (at p < 0.01). There were no significant differences by age. Single
foramina were scored according to the direction the foramen opened. These were scored as
upward and forward, upward, upward and backward, or backward. The direction of the opening
of the foramen was found to vary with age; the youngest group was most likely to have an
upward-opening foramen (76.5%) and the oldest group had an upward- and backward-opening
foramen. Sex had no effect on the direction of the mental foramen.
The position of the mental foramen was also noted in relation to the teeth (e.g., at P1,
P1/P2, P2, P2/M1, or M1). The foramen was found to move posteriorly as individuals aged. Sex
differences were non-existent, and in a pooled sample of males and females, 43.8% of the
individuals’ foramina were located under the second premolar. However, in comparison to other
studies on the position of the mental foramen, Australian Aborigines were more likely to have a
more posteriorly-positioned mental foramen (under the P2/M1 or M1) than other ancestral
13
groups as reported by Akabori for Japanese (1934), Montagu for Europeans (1954), and Miller
for Hindu (1955) (as cited in Murphy, 1957).
Murphy divides the lingual aspect of the mandible into alveolar and basal areas. The
alveolar area may have either one or both of the following: a mid-line groove or a para-sagittal
groove. Both types of grooves were found in 9% of the sample. The mid-line groove was
present in 58.8% of the sample and varied significantly by both sex and age. The para-sagittal
groove, however, was more rare and was only found in 21.4% of the population. Age and sex
were insignificant in all five age groups.
The basal area contains the genial tubercles and genial foramina. Murphy follows
Topinard’s classification of the genial tubercles (as cited in Augier, 1931, p. 31):
1. two superior and two inferior tubercles; 2. two superior and one inferior tubercle; 3. the same disposition but thickened; 4. a common spine.
The third type is most common in the youngest age group (100%), the second type is most
prevalent in females (48.5%), and the first type is most common in males (48.5%). Age was
found to be statistically significant, but sex was not. Three types of genial foramina may be
found, which are named in relation to their position to the genial tubercles: supragenial,
intergenial, and infragenial (Thomson, 1916, as cited in Murphy, 1957). All three foramina were
present in 7.2% of the population and each one was found in 87.7%, 21.6%, and 45.2% of the
sample, respectively. None showed any significant differences by age or sex.
Murphy was the first to go beyond mere classification of mandibular variants and
actually used a statistical test (chi-square) to determine the traits’ relation to age and sex.
Unfortunately, although his sample is divided by age, he places all adult individuals into one
category, significantly decreasing the amount of variation that may have existed between
14
younger and older adults.
Modern Studies
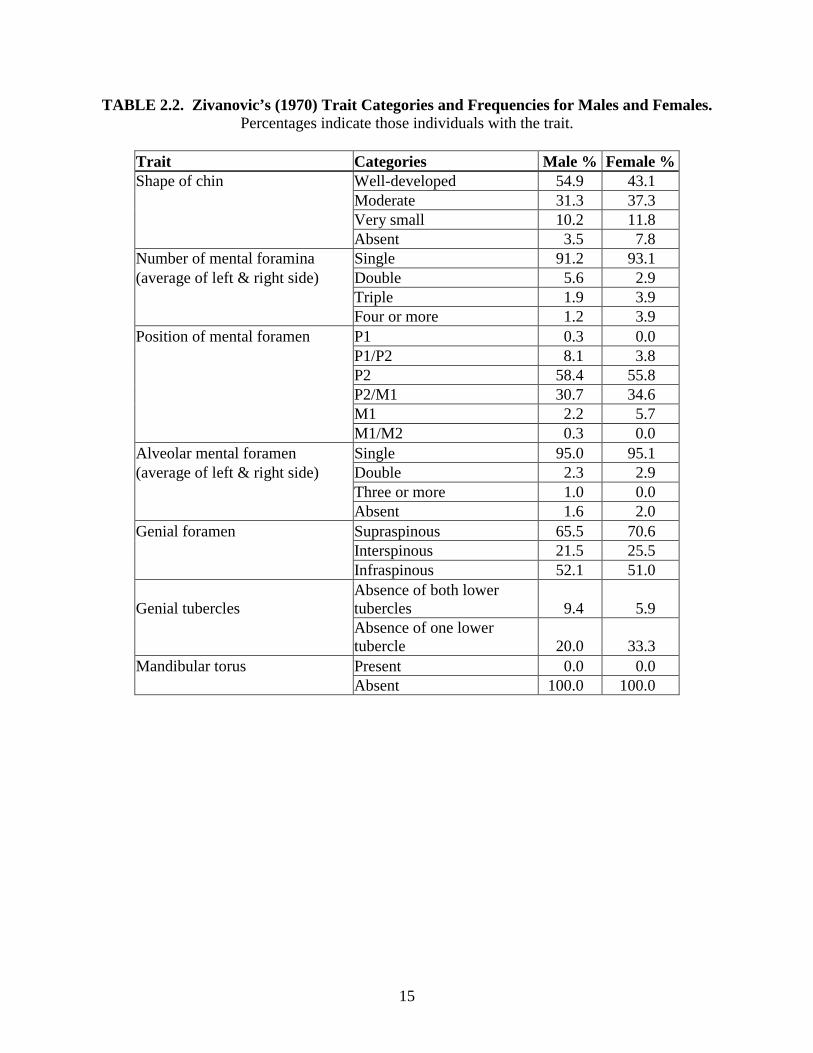
Zivanovic (1970) analyzed non-metric characteristics of the mandible in 335 (n = 284
males and n = 51 females) East African mandibles (see Table 2.2). This study is unique because
it is the first for the mandible that uses a sample of known sex and age at death. In addition to
traits documented in the table given below, Zivanovic also found that the most common opening
for the mental foramen was either posteriorly and superiorly or superiorly; however, no
frequencies were given for this trait.
There are several problems that degrade the quality of this study. First, Zivanovic
presented the general frequencies of each trait in the population but did not use robust statistical
tests. Additionally, he used a collection of individuals with known age, yet he combined all
individuals into one age group and did not attempt to test the effect of age on each trait. Finally,
although males and females were analyzed separately, the small female sample may not have
been large enough, especially when age was not taken into account.
Rhine’s (1990) study of 87 skulls focuses on various morphological characteristics, many
of which were previously analyzed by Schulz (1933). Rhine examined European Americans
(n = 53), African Americans (n = 7), Hispanic Americans (n = 15), prehistoric Native Americans
(n = 9), and modern Native Americans (n = 3). He presented simple descriptive statistics and
noted that many traits are common among populations, warning against the use any single
feature to determine ancestry. Instead, he recommends that characteristics should be used
together in order to obtain the most accurate result (see Table 2.3). As with any method, Rhine
states that results may only be precisely duplicated with sufficient training and practice.
15
TABLE 2.2. Zivanovic’s (1970) Trait Categories and Frequencies for Males and Females. Percentages indicate those individuals with the trait.
Trait Categories Male % Female %Shape of chin Well-developed 54.9 43.1 Moderate 31.3 37.3 Very small 10.2 11.8 Absent 3.5 7.8 Number of mental foramina Single 91.2 93.1 (average of left & right side) Double 5.6 2.9 Triple 1.9 3.9 Four or more 1.2 3.9 Position of mental foramen P1 0.3 0.0 P1/P2 8.1 3.8 P2 58.4 55.8 P2/M1 30.7 34.6 M1 2.2 5.7 M1/M2 0.3 0.0 Alveolar mental foramen Single 95.0 95.1 (average of left & right side) Double 2.3 2.9 Three or more 1.0 0.0 Absent 1.6 2.0 Genial foramen Supraspinous 65.5 70.6 Interspinous 21.5 25.5 Infraspinous 52.1 51.0
Genial tubercles Absence of both lower tubercles 9.4 5.9
Absence of one lower tubercle 20.0 33.3
Mandibular torus Present 0.0 0.0 Absent 100.0 100.0
16
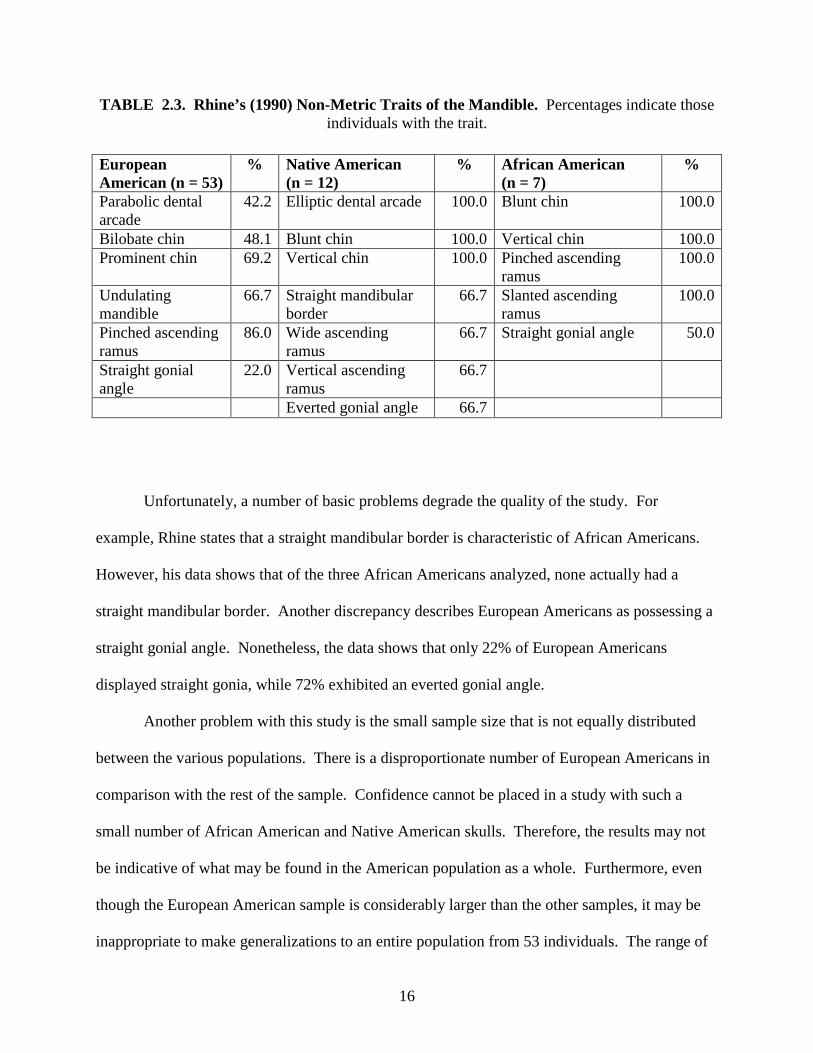
TABLE 2.3. Rhine’s (1990) Non-Metric Traits of the Mandible. Percentages indicate those individuals with the trait.
Unfortunately, a number of basic problems degrade the quality of the study. For
example, Rhine states that a straight mandibular border is characteristic of African Americans.
However, his data shows that of the three African Americans analyzed, none actually had a
straight mandibular border. Another discrepancy describes European Americans as possessing a
straight gonial angle. Nonetheless, the data shows that only 22% of European Americans
displayed straight gonia, while 72% exhibited an everted gonial angle.
Another problem with this study is the small sample size that is not equally distributed
between the various populations. There is a disproportionate number of European Americans in
comparison with the rest of the sample. Confidence cannot be placed in a study with such a
small number of African American and Native American skulls. Therefore, the results may not
be indicative of what may be found in the American population as a whole. Furthermore, even
though the European American sample is considerably larger than the other samples, it may be
inappropriate to make generalizations to an entire population from 53 individuals. The range of
European American (n = 53)
% Native American (n = 12)
% African American (n = 7)
%
Parabolic dental arcade
42.2 Elliptic dental arcade 100.0 Blunt chin 100.0
Bilobate chin 48.1 Blunt chin 100.0 Vertical chin 100.0Prominent chin 69.2 Vertical chin 100.0 Pinched ascending
ramus 100.0
Undulating mandible
66.7 Straight mandibular border
66.7 Slanted ascending ramus
100.0
Pinched ascending ramus
86.0 Wide ascending ramus
66.7 Straight gonial angle 50.0
Straight gonial angle
22.0 Vertical ascending ramus
66.7
Everted gonial angle 66.7
17
variation within populations cannot be demonstrated with samples of a modest size, particularly
once they are subdivided by sex and age. Rhine undoubtedly chose to group males and females
together and to ignore age because the sample was too small to split up.
In another study, Angel and Kelley (1990) focused solely on two non-metric traits as
ancestral indicators: inversion of the posterior border of the mandibular ramus and eversion of
the gonia. They looked at a total of 376 females and 406 males spanning 5 generations. Their
sample consisted of a number of individuals from the Terry collection, forensic cases, two 19th
century African American cemeteries, and Plains Indians. Angel and Kelley determined the
degree of inversion and gonial flare by scoring each trait on a four-point scale (absent, slight,
marked, and extremely marked). However, they did not describe these categories or the
boundaries between them, leading to possible confusion in scoring these traits if used by other
researchers.
Inversion of the ramus was found to vary between the populations studied. European
Americans had inversion present 30% of the time, whereas in African Americans, inversion was
observed in 95% of the individuals examined. The Native American population fell between the
European Americans and African Americans, with inversion present 44.5% of the time. There is
a significant difference in the amount of ramus inversion between European and African
Americans. However, the Native American population is not significantly different from the
European American population.
The results for gonial eversion were more homogenous and do not appear to have
produced any statistically significant differences. European Americans exhibited eversion 77.1%
of the time, while African Americans displayed eversion in 89.1% of the cases. The smallest
percentage of gonial eversion was found in Native Americans, with 63.8% of the sample
18
displaying the trait. In the entire sample, 27.1% of the females and 11.4% of the males lacked
gonial eversion.
Despite the demonstrated differences in ramus inversion, the question remains as to why
these differences exist. Angel and Kelley noted that there are several muscles and ligaments that
attach at these locations, but they do not delve far into how these soft tissues may account for the
ancestral differences seen in the posterior mandible.
In 2001, Berg performed a study on the mandibles of European Americans, Africans
(Nubians), and South East Asians. The European American sample was composed of United
States service personnel. However, this sample was so small that Berg included the European
American data published in Rhine (1990) and Angel and Kelley (1990). Similarly, his African
sample also includes published data from Angel and Kelley (1990). Only males and “probable”
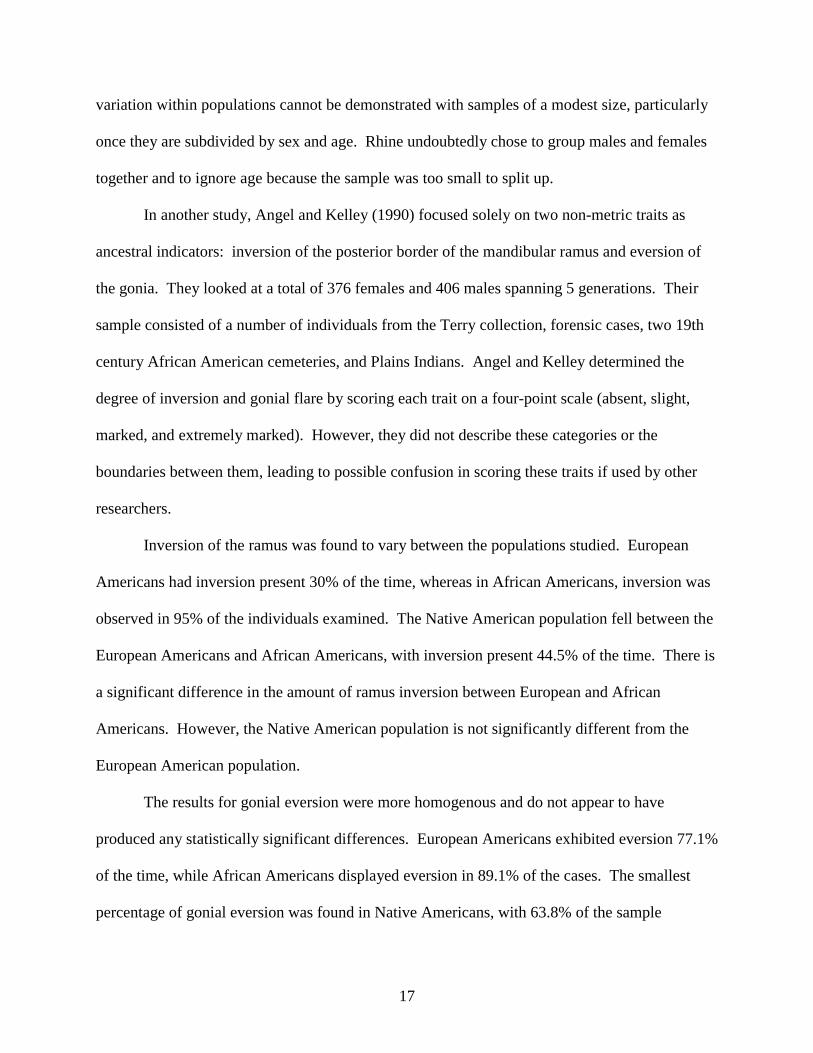
males were analyzed due to the small sample size of females. Berg analyzed seven traits: the
shape of the chin, the lower border of the mandible, the shape of the ascending ramus, the profile
of the ascending ramus, gonial flare, mandibular torus, and inversion of the posterior edge of the
ramus (see Table 2.4). Exact frequencies are only provided for a few of the traits.
Berg found that a bilobate chin type was most common in European Americans, while
both SE Asians and Africans had a blunt chin. Previous studies have shown that an undulating
mandibular border is the most common form in European Americans (Rhine, 1990). However,
in Berg’s sample all three ancestral groups possess an undulating mandibular border at similar
rates. An undulating mandibular border is the most common form in all three populations,
however, the rocker jaw is also commonly found in the SE Asian and African groups. Using a
composite of Rhine’s data and his own, Berg noted that European Americans were most likely to
have a pinched ascending ramus. However, Berg’s European American sample displayed a
19
TABLE 2.4. Analyzed Traits and Their Categories from Berg (2001).
Trait Categories Shape of chin bilobate blunt pointed square Lower border of mandible undulating straight rocker Ascending ramus shape pinched wide Ascending ramus profile straight medium slanted Gonial flare inverted straight/absent slight medium everted Mandibular torus present absent Posterior ramus edge inversion absent slight medium strong
pinched ramus 30% of the time, while 80% of Rhine’s European sample had pinched rami. The
inclusion of Rhine’s data seems to dramatically alter the results. As a result, Berg stated that this
trait may be poorly defined and that the categories of “pinched” and “wide” are difficult to
differentiate between researchers. A similar predicament was found when scoring ascending
ramus profile. The addition of Rhine’s data to the sample results in 96% of the European
American sample having slanted rami. The incidence of mandibular tori does not differ between
ancestral groups, with each group having a low occurrence of the trait. Half of the individuals
analyzed displayed little or no gonial flare; eversion was present and was more common in
20
European Americans and Africans. Berg’s data on inversion of the posterior ramus are
consistent with Angel and Kelley’s data. Africans had the highest percentage of inversion, while
SE Asians and European Americans rarely showed the trait. In sum, only three traits were found
useful for differentiating between the three populations: bilobate chin in European Americans,
rocker jaw in SE Asians and Africans, and an inverted posterior ramus in Africans.
While Berg is successful in obtaining a large sample for his SE Asian population, he has
a meager sample for his African and European American samples. In an effort to strengthen his
study, he included data from previous studies but increases the chance of inter-observer error in
the process. Furthermore, Berg used rudimentary statistics by simply recording the frequency of
each trait per population. By only using males and not controlling for age, this study does not
account for factors that may play an important part in trait expression.
By far, the most valuable aspect in Berg’s study is his documentation of SE Asian traits.
In the field of forensic anthropology, Native Americans have generally been used as a substitute
for Asian populations. However, Berg notes that traits that are common in Native Americans are
not as prevalent as those seen in SE Asians. The majority of the data that has been published for
Native Americans do not concur with Berg’s SE Asian data, especially in regards to the inferior
mandibular border and ascending ramus profile. Therefore, SE Asian populations should be
studied in more depth and not placed into the Native American category.
Studies of Specific Traits
In addition to broader studies on a variety of traits in different populations, there are
several studies that concentrate on one specific trait. These studies generally do not use complex
statistical testing; instead, they employ simple descriptive statistics and focus on documenting
21
the frequency of a given trait in one or multiple populations. These traits have been analyzed
since the late 1800’s and are primarily those that can be easily detected with the human eye.
Such traits include mandibular tori, the number and position of mental foramina, and mylohyoid
bridging, which will be discussed in detail due to their abundance in the literature.
Mandibular tori studies. The mandibular torus is perhaps the most studied anomaly of
the mandible, perhaps because when it is present, it can hardly go unnoticed. Danielli (1884)
and Hansen (1887 & 1895) were the first to document this anomaly, which was later given the
name torus mandibularis by Furst (1908) (as cited in Fenner, 1939 and Hrdlicka, 1940).
Mandibular tori frequencies have been noted to differ between some populations (Hrdlicka,
1940; Klatsky, 1956; Sawyer et al., 1979; Sellevold, 1980; Sonnier et al. 1999), vary in size and
shape (Hooton, 1918; Fenner, 1939; Hrdlicka, 1940; Klatsky, 1956; Sellevold, 1980; Eggen &
Natvig, 1994), and may vary depending on age and sex (Hrdlicka, 1940; Johnson et al., 1965;
Mayhall et al., 1970; Muller & Mayhall, 1971; Eggen & Natvig, 1994).
Most early studies are concerned primarily with describing and documenting the
occurrence of mandibular tori in different populations. These studies do not perform any
statistical analyses, nor do they separate individuals by age or sex. In 1918, Hooton documented
mandibular tori on a 5-point, semi-ordinal scale (absent, slight, medium, pronounced, and very
pronounced) in 56 Icelandic mandibles. Of these, 67.9% displayed at least slight mandibular
tori. Fenner (1939) also examined mandibular tori in Australians, Melasians, and Tasmanians.
He also used a 5-point scale (absent, very small, small, medium, and large). A total of 598
individuals were examined and only 17 (2.8%) displayed at least a slight mandibular torus; none
were assigned to the “large” category.
22
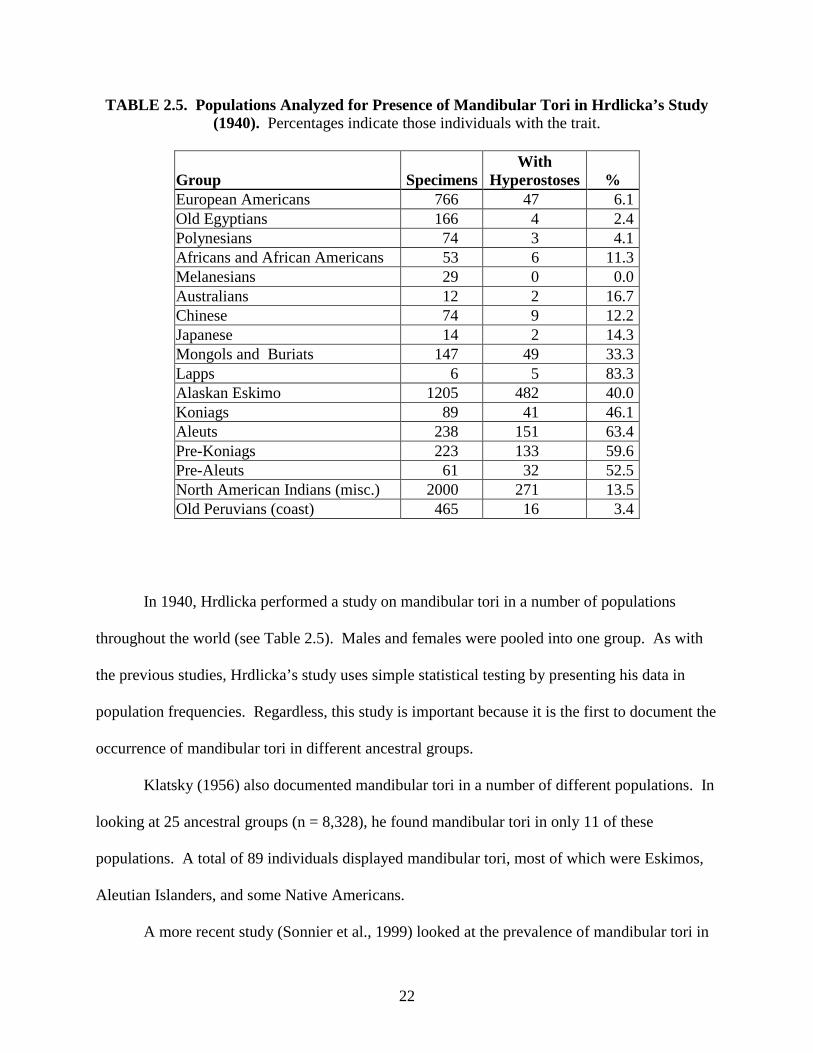
TABLE 2.5. Populations Analyzed for Presence of Mandibular Tori in Hrdlicka’s Study (1940). Percentages indicate those individuals with the trait.
Group SpecimensWith
Hyperostoses % European Americans 766 47 6.1 Old Egyptians 166 4 2.4 Polynesians 74 3 4.1 Africans and African Americans 53 6 11.3 Melanesians 29 0 0.0 Australians 12 2 16.7 Chinese 74 9 12.2 Japanese 14 2 14.3 Mongols and Buriats 147 49 33.3 Lapps 6 5 83.3 Alaskan Eskimo 1205 482 40.0 Koniags 89 41 46.1 Aleuts 238 151 63.4 Pre-Koniags 223 133 59.6 Pre-Aleuts 61 32 52.5 North American Indians (misc.) 2000 271 13.5 Old Peruvians (coast) 465 16 3.4
In 1940, Hrdlicka performed a study on mandibular tori in a number of populations
throughout the world (see Table 2.5). Males and females were pooled into one group. As with
the previous studies, Hrdlicka’s study uses simple statistical testing by presenting his data in
population frequencies. Regardless, this study is important because it is the first to document the
occurrence of mandibular tori in different ancestral groups.
Klatsky (1956) also documented mandibular tori in a number of different populations. In
looking at 25 ancestral groups (n = 8,328), he found mandibular tori in only 11 of these
populations. A total of 89 individuals displayed mandibular tori, most of which were Eskimos,
Aleutian Islanders, and some Native Americans.
A more recent study (Sonnier et al., 1999) looked at the prevalence of mandibular tori in
23
328 individuals from the Terry Anatomical Collection. Two hundred and fifty-four European
Americans (119 males, 135 females) and 74 African Americans (43 males, 31 females) were
analyzed. Laterality, age, and edentulism were also taken into account. There was no statistical
difference between left and right sides of the mandible, yet there was a significant difference
between males and females, with mandibular tori more common in males.
Dentate mandibles possessed tori 39.3% of the time, while mandibular tori were only
noted in 8.3% of the edentulous mandibles. These data suggest that there is an inverse
relationship between the expression of tori and loss of teeth. Older edentate individuals would
be less likely to display tori due to the extreme amount of remodeling that occurs. Mandibular
tori were found in 33.8% of the African Americans but were less frequent in the European
American sample (24.8%).
Since its initial documentation, the origin and cause of the mandibular torus has been
debated. Hooton (1918) suggested that the mandibular torus is a result of intense strain placed
on the mandible by people living in northern latitudes who subsisted on rough animal foods.
Therefore, he proposed that it is a functional adaptation and is not a morphological character to
be used for ancestral affiliation. Similarly, Matthews’ (1933) study indicated that mandibular
tori are “not restricted to race, sex, or age;” rather, they are a product of intense masticatory
stress.
In a subsequent study, Weidenreich (1936) analyzed the mandibular torus in the
mandibles of Sinanthropus pekinensis and Chinese and determined that they were not
physiological or pathological in nature. Instead, Weidenreich proposes that the mandibular torus
is a result of a reduction in jaw size throughout evolution, leaving behind a “pillar” of bone.
Drennan (1937) further validated Weidenreich’s hypothesis in his study of 29 Bushman
24
mandibles. Thirty-two percent of these mandibles displayed well-defined tori and the absence of
extreme wear on the teeth in these mandibles indicates that the mandibular torus is not
functional. A number of studies followed in an attempt to prove either the masticatory stress
model (Hrdlicka, 1940; Johnson, 1959) or the heredity model (Moorees et al., 1952; Suzuki &
Sakai, 1960; Sawyer et al., 1979; Sellevold, 1980). However, Johnson (1959) was the first to
definitively show in their familial study that mandibular tori are genetic in nature and have an
autosomal dominant mode of inheritance.
Studies on the number of the mental foramina. The occurrence of a single mental
foramen is the most common form in humans, although it has been noted that in some
individuals there may be more than one foramen, ranging from small to large in size (Riesenfeld,
1956; Murphy, 1957; DeVillers, 1968; Zivanovic, 1970; Gershenson et al., 1986; Hauser &
DeStefano, 1989; Shankland, 1994). This phenomenon is attributed to the branching of the
mental nerve before exiting the mandible (Serman, 1989). One study suggests that multiple
foramina may be the result of the inferior alveolar nerve branching outside the mandible and then
one branch re-entering the mandible near the mental foramen (Herman, 1989). The number of
foramina may differ between ancestral groups (Montagu 1954; Riesenfeld, 1956; Sawyer et al.,
1998; Simonton, 1923; Zivanovic, 1970) and if there are multiple foramina, the most common
number is two (Montagu, 1954). The mental foramen is rarely absent (DeFreitas et al., 1979).
Simonton (1923) conducted an early study on the number of mental foramina in various
populations across the world: European Americans (n = 138), Kentucky Indians (n = 150),
Arkansas Indians (n = 108), Californian Indians, Indians from other states (n = 342), Africans (n
= 42), Melanesians (n = 58), Japanese (n = 10), Eskimo (n = 114), and Egyptians (n = 78), where
“n” is the number of sides examined. He discovered that the most common number of mental
25
foramen in humans is one. Of the populations analyzed, all had at least one case of multiple
mental foramina, except for the Japanese and Egyptian samples. The discrepancy in the
Japanese and Egyptian samples may be due to their small size (n = 5 and n = 39 individuals,
respectively). Africans displayed the highest frequency of accessory mental foramina at 16%.
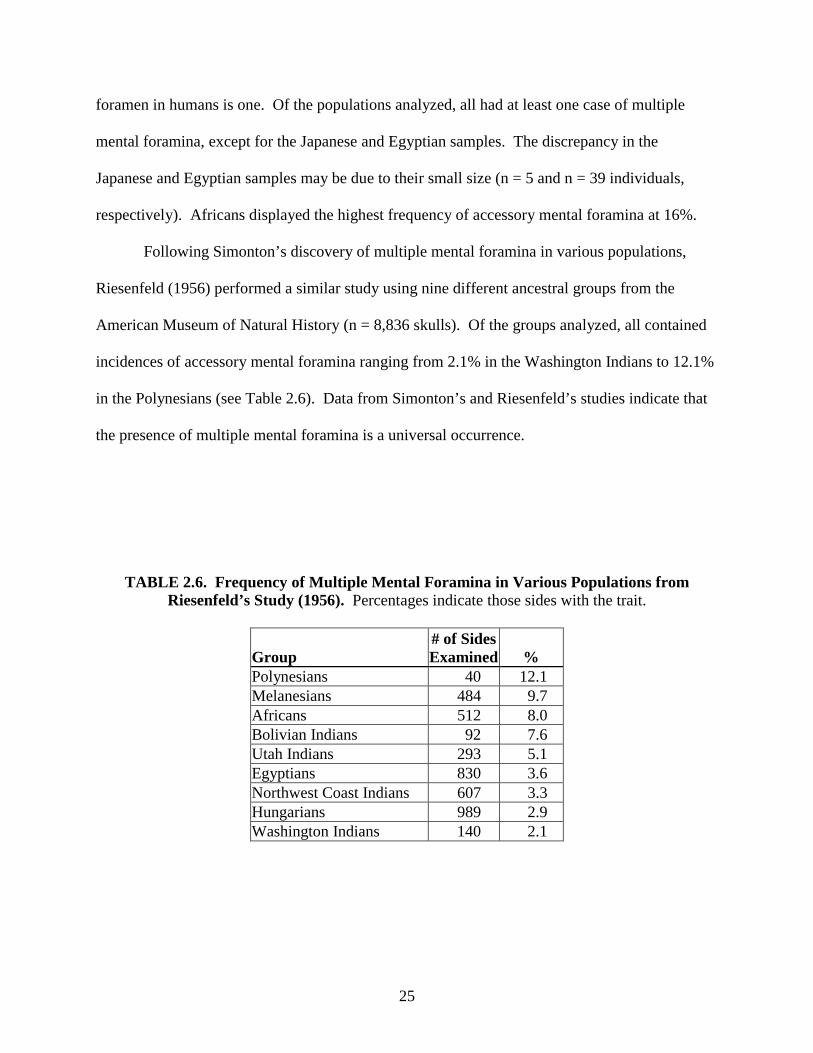
Following Simonton’s discovery of multiple mental foramina in various populations,
Riesenfeld (1956) performed a similar study using nine different ancestral groups from the
American Museum of Natural History (n = 8,836 skulls). Of the groups analyzed, all contained
incidences of accessory mental foramina ranging from 2.1% in the Washington Indians to 12.1%
in the Polynesians (see Table 2.6). Data from Simonton’s and Riesenfeld’s studies indicate that
the presence of multiple mental foramina is a universal occurrence.
TABLE 2.6. Frequency of Multiple Mental Foramina in Various Populations from Riesenfeld’s Study (1956). Percentages indicate those sides with the trait.
Group # of Sides Examined %
Polynesians 40 12.1 Melanesians 484 9.7 Africans 512 8.0 Bolivian Indians 92 7.6 Utah Indians 293 5.1 Egyptians 830 3.6 Northwest Coast Indians 607 3.3 Hungarians 989 2.9 Washington Indians 140 2.1
26
Sawyer and colleagues (1998) conducted one of the more recent studies of the mandible
by looking at accessory mental foramina. Four ancestral populations were analyzed: South
Asian Indians (n = 234), African Americans (n = 166), European Americans (n = 255), and Pre-
Columbian Nazca Native Americans (n = 50). Each mandible was scored bilaterally for the
presence of accessory mandibular foramina. At most, two foramina were found per individual in
each population. The European American and Indian populations were least likely to have
accessory mandibular foramina, with an incidence of 1.4% and 1.5%, respectively.
Accessory foramina were present in 4.4% of the African American sample, while the
Nazca mandibles were reported to have the highest frequency at 8.5%. This trait did not display
any significant sex or side differences. While Sawyer and associates did demonstrate that there
were frequency differences between each population analyzed, these differences are not adequate
enough to effectively discriminate from one population to the next.
Studies on the position of the mental foramen. The mental foramen is most commonly
situated beneath the fourth premolar (Simonton, 1923; Montagu, 1954; Gershenson et al., 1986;
Shankland, 1994). However, its position variable and may change location in cases of extreme
resorption of the mandible due to tooth loss and in cases of extreme tooth wear (Simonton, 1923;
Montagu, 1954; Gershenson et al., 1986; Green & Darvell, 1988).
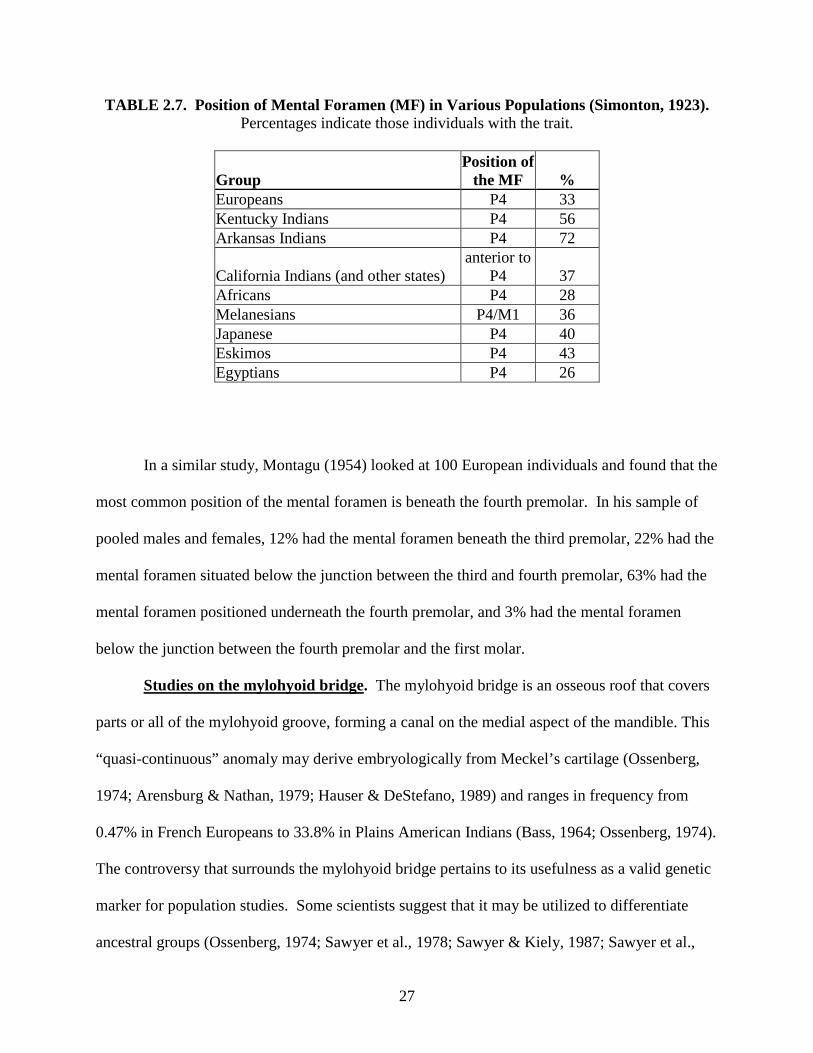
In an early study on the mental foramen, Simonton (1923) documented the position of the
mental foramen in different ancestral groups. Nine populations were analyzed showing that that
the mental foramen is most commonly situated below the forth premolar (P4) (see Table 2.7).
However, Simonton demonstrated that its position may vary depending on the population
analyzed. While the frequencies of these populations differ, they may not be sufficient to
differentiate one ancestral group from another.
27
TABLE 2.7. Position of Mental Foramen (MF) in Various Populations (Simonton, 1923). Percentages indicate those individuals with the trait.
Group Position of
the MF % Europeans P4 33 Kentucky Indians P4 56 Arkansas Indians P4 72
California Indians (and other states) anterior to
P4 37 Africans P4 28 Melanesians P4/M1 36 Japanese P4 40 Eskimos P4 43 Egyptians P4 26
In a similar study, Montagu (1954) looked at 100 European individuals and found that the
most common position of the mental foramen is beneath the fourth premolar. In his sample of
pooled males and females, 12% had the mental foramen beneath the third premolar, 22% had the
mental foramen situated below the junction between the third and fourth premolar, 63% had the
mental foramen positioned underneath the fourth premolar, and 3% had the mental foramen
below the junction between the fourth premolar and the first molar.
Studies on the mylohyoid bridge. The mylohyoid bridge is an osseous roof that covers
parts or all of the mylohyoid groove, forming a canal on the medial aspect of the mandible. This
“quasi-continuous” anomaly may derive embryologically from Meckel’s cartilage (Ossenberg,
1974; Arensburg & Nathan, 1979; Hauser & DeStefano, 1989) and ranges in frequency from
0.47% in French Europeans to 33.8% in Plains American Indians (Bass, 1964; Ossenberg, 1974).
The controversy that surrounds the mylohyoid bridge pertains to its usefulness as a valid genetic
marker for population studies. Some scientists suggest that it may be utilized to differentiate
ancestral groups (Ossenberg, 1974; Sawyer et al., 1978; Sawyer & Kiely, 1987; Sawyer et al.,
28
1990; Manjunath, 2003), while others believe that its use in population studies has limitations
(Lundy, 1980; Kaul & Pathak, 1984).
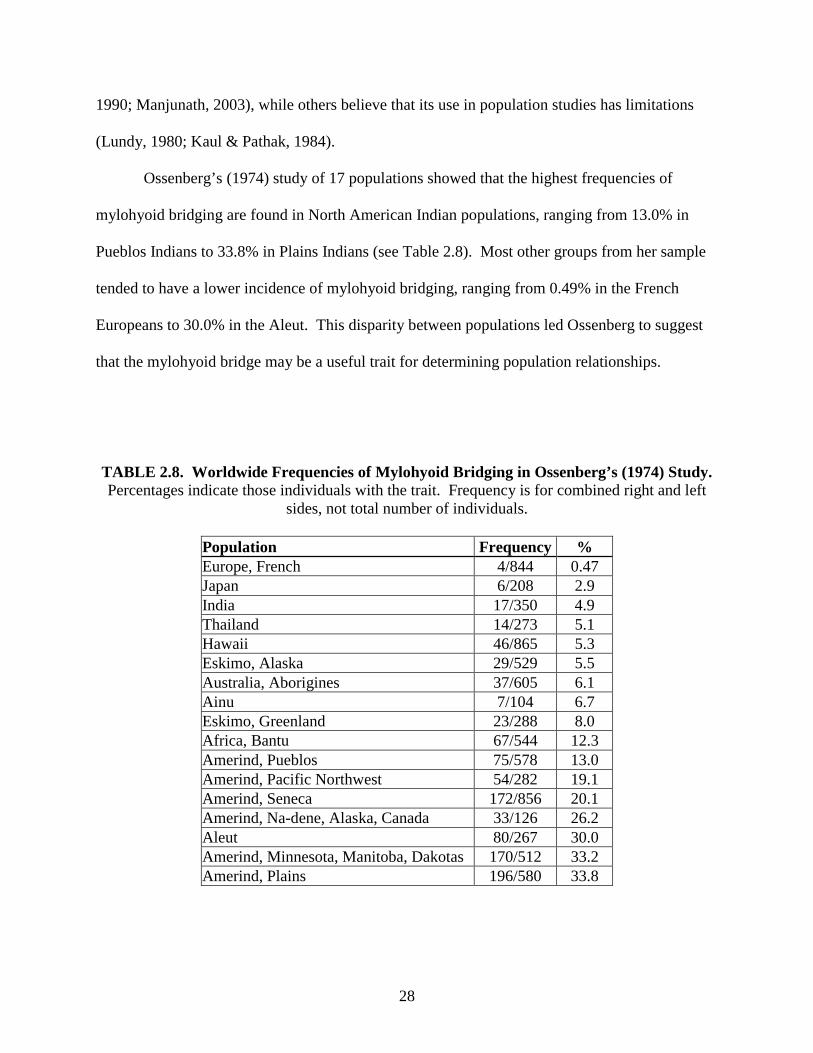
Ossenberg’s (1974) study of 17 populations showed that the highest frequencies of
mylohyoid bridging are found in North American Indian populations, ranging from 13.0% in
Pueblos Indians to 33.8% in Plains Indians (see Table 2.8). Most other groups from her sample
tended to have a lower incidence of mylohyoid bridging, ranging from 0.49% in the French
Europeans to 30.0% in the Aleut. This disparity between populations led Ossenberg to suggest
that the mylohyoid bridge may be a useful trait for determining population relationships.
TABLE 2.8. Worldwide Frequencies of Mylohyoid Bridging in Ossenberg’s (1974) Study. Percentages indicate those individuals with the trait. Frequency is for combined right and left
sides, not total number of individuals.
Population Frequency % Europe, French 4/844 0.47 Japan 6/208 2.9 India 17/350 4.9 Thailand 14/273 5.1 Hawaii 46/865 5.3 Eskimo, Alaska 29/529 5.5 Australia, Aborigines 37/605 6.1 Ainu 7/104 6.7 Eskimo, Greenland 23/288 8.0 Africa, Bantu 67/544 12.3 Amerind, Pueblos 75/578 13.0 Amerind, Pacific Northwest 54/282 19.1 Amerind, Seneca 172/856 20.1 Amerind, Na-dene, Alaska, Canada 33/126 26.2 Aleut 80/267 30.0 Amerind, Minnesota, Manitoba, Dakotas 170/512 33.2 Amerind, Plains 196/580 33.8
29
Sawyer and colleagues (1978) documented the mylohyoid bridging in three populations.
The pre-Columbian Peruvian sample consisted of 122 juvenile and adults. Age was determined
osteologically and sex was determined through cultural artifacts, examination of external
genitalia, and osteolgical examination of the pelves. European Americans (n = 90) and African
Americans (117) from the Terry Anatomical Collection were analyzed for comparison.
Individuals from this collection have a known age and sex. The incidence of mylohyoid bridging
is 17.6% in the Peruvian population, with 30.9% of females and 6.7% of males exhibiting the
trait. In the European American sample, 16.1% expressed the trait, with 31.6% being females
and 12.0% being males. The African American sample had an incidence of 15.4% of expression
of mylohyoid bridging, with 27.8% of females and 9.9% of males exhibiting the trait.
Sawyer and colleagues found that side was not statistically significant for this trait,
however, sex was found to be significant, with females having a higher incidence of mylohyoid
bridging in all three populations. The frequency of mylohyoid bridging in the Peruvian sample is
similar to the frequencies found by Ossenberg (1974) in her American Indian samples, ranging
from 13.0% to 33.8%. Since their observed frequency of mylohyoid bridging falls in the range
of Ossenberg’s sample, Sawyer and colleagues suggest that mylohyoid bridging is a trait that is
common in individuals of Asian descent and it may be used for ancestral studies. However, their
European American and African American samples also fall within the range of American
Indians, indicating that this trait may not be as specific to Asian populations as they
hypothesized.
Sawyer and Kiely (1987) analyzed the incidence of mylohyoid bridging in an Asian
Indian population. Two-hundred and thirty four individuals were documented, 125 males and
109 females. Sex was determined osteologically from the skull. All statistical tests were
30
performed using chi-squared analysis. Sex had no statistical significance in the 2.6% of the
population that expressed mylohyoid bridging. The right side showed a statistically significant
difference from the left side (90.9% and 9.1%, respectively). Sawyer and Kiely conclude that
although previous studies have shown varying frequencies of mylohyoid bridging in the same
populations, it still may be useful as an ancestral indicator when combined with other discrete
traits.
In their most recent study, Sawyer and colleagues (1990) documented mylohyoid
bridging in 464 pre-Columbian Chileans. Two-hundred and fifty two males and 212 females
were analyzed. The incidence of mylohyoid bridging in the entire population was 4.09%, with
no difference between the sexes. However, this frequency is far lower than what has been found
in other individuals of Asian descent and is lower than their previous study (1978) on pre-
Columbian Peruvians. Despite the fact that the incidence of mylohyoid bridging is so variable in
Native American populations, Sawyer and colleagues are insistent that it may be utilized to
differentiate one population from another as long as it is used with a variety of other non-metric
traits.
Another study of Indian mandibles (Manjunath, 2003) showed a higher incidence of
mylohyoid bridging than has been previously reported (Sawyer & Kiely, 1987). Manjunath
analyzed 225 South Indian mandibles and reported that 6.39% of this population exhibited a
mandibular bridge. Sawyer and Kiely documented mylohyoid bridging in 2.6% of their East
Indian mandibles. Manjunath’s study shows that there is some variation in the incidence of
mylohyoid bridging and suggests that it may be a useful trait for population studies.
Lundy (1980) disputes previous studies’ suggestion of the utility of mylohyoid bridging
as an ancestral indicator. Lundy conducted a study of 73 (36 males, 23 females, and 14
31
unknown) South African Khoisan mandibles. Only adults were analyzed and sex was
determined osteologically. He found that 32.2% of his sample expressed mylohyoid bridging,
33.3% in males and 30.4% in females. Sex and side were insignificant to the manifestation of
the trait; however, females displayed a higher bilateral expression. Previous authors suggested
that mylohyoid bridging may be an ancestral indicator for individuals of Asian descent.
However, the high incidence of mylohyoid bridging in the Khoisan, paralleled by the American
Indians of Ossenberg’s study (1974), indicates that it cannot be used reliably in isolation for
population studies.
Kaul and Pathak (1984) documented the incidence of mylohyoid bridging in four skeletal
samples from India and found that it varied from 2.98% to 7.14% of the time. Kaul and Pathak
compare their findings with 11 other researchers who looked at a total of 37 different population
groups. They found that these frequencies are in the lower half of what has been recorded in
studies of other populations. Furthermore, in a comparison with previous studies they showed
that the occurrence of mylohyoid bridging it highly variable. For example, French Europeans
displayed a frequency of 0.47% (Ossenberg, 1974), while European Americans have mylohyoid
bridging 11.15% and 16.10% of the time (Corruccini, 1974 and Sawyer et al. 1978, respectively).
These two populations should have similar frequencies, but since their incidence is so disparate,
Kaul and Pathak come to the conclusion that mylohyoid bridging is not a useful trait for
population studies.
Summary
Most ancestral studies look primarily at the mid-face to place an individual in a particular
group. This area, however, is very fragile and is usually the first to be destroyed in a forensic or
32
archeological setting. On the other hand, the mandible is far denser and tends to be very well
preserved. Due to its durability, it may serve as a useful tool for population studies. However,
few studies have been conducted on the mandible as a means for determining ancestry. Those
that have analyzed the mandible are inconclusive or use statistical tests that are too simplistic to
get any real value out of the results for the sample population. Additionally, previous studies
rarely control for sex and age, factors that may have an effect on the manifestation of a particular
trait. Further studies should be conducted to definitively establish the utility of the mandible in
the determination of ancestry in different populations.
33
CHAPTER 3: MATERIALS AND METHODS
Sample Population
Specimens were drawn from three collections in the United States and one collection in
South Africa. The C.A. Hamann and T.W. Todd Osteological Collection at the Cleveland
Museum of Natural History is comprised of skeletons from the late 19th century and the early
20th centuries. These individuals were primarily unclaimed bodies from the Cuyahoga County
Morgue and other hospitals in the Cleveland area. The Robert J. Terry Anatomical Skeletal
Collection at the National Museum of Natural History in Washington D.C. is also composed of
skeletons from the late 19th and early 20th centuries. These were mostly unclaimed cadavers
from St. Louis hospitals and institutional morgues, the majority of which came from lower socio-
economic groups. The collection housed at the Forensic Research Laboratory at the University
of Florida is a known contemporary forensic collection. These jaws were sectioned and
identified by a forensic odontologist and are currently being retained at the Forensic Research
Laboratory as evidence. The Pretoria Bone Collection at the Department of Anatomy,
University of Pretoria, South Africa is a modern cadaver collection from the mid-20th century to
the present. This collection is comprised of both donated and unclaimed cadavers.
The Hamann-Todd and the Terry Collections were each visited for a one-week period.
Data were colleted from the Pretoria Bone Collection over a two-month period. The Florida
Collection was visited twice with a three-month intervening period for the purpose of
determining intra-observer error, which is discussed in the latter half of this chapter. The current
study is limited to individuals of European and African ancestry. While the addition of Native
Americans to the sample may have proven beneficial, I have decided to study only those
individuals with a securely known sex and age at death. Since Native American skeletal
34
collections are usually prehistoric, their sexes and ages can only be estimated from
morphological characteristics, and some errors are therefore likely.
In this thesis, the term “African” refers to all “black” individuals from both North
America and South Africa. The term “European” refers to all “white” individuals from both
North America and South Africa. “African American” refers to “black” individuals who lived
and died in the United States, while the term “European American” refers to “white” individuals
who lived and died in the United States. The term “Native African” refers to “black” individuals
who lived and died in South Africa, while “European African” refers to “white” individuals who
lived and died in South Africa.
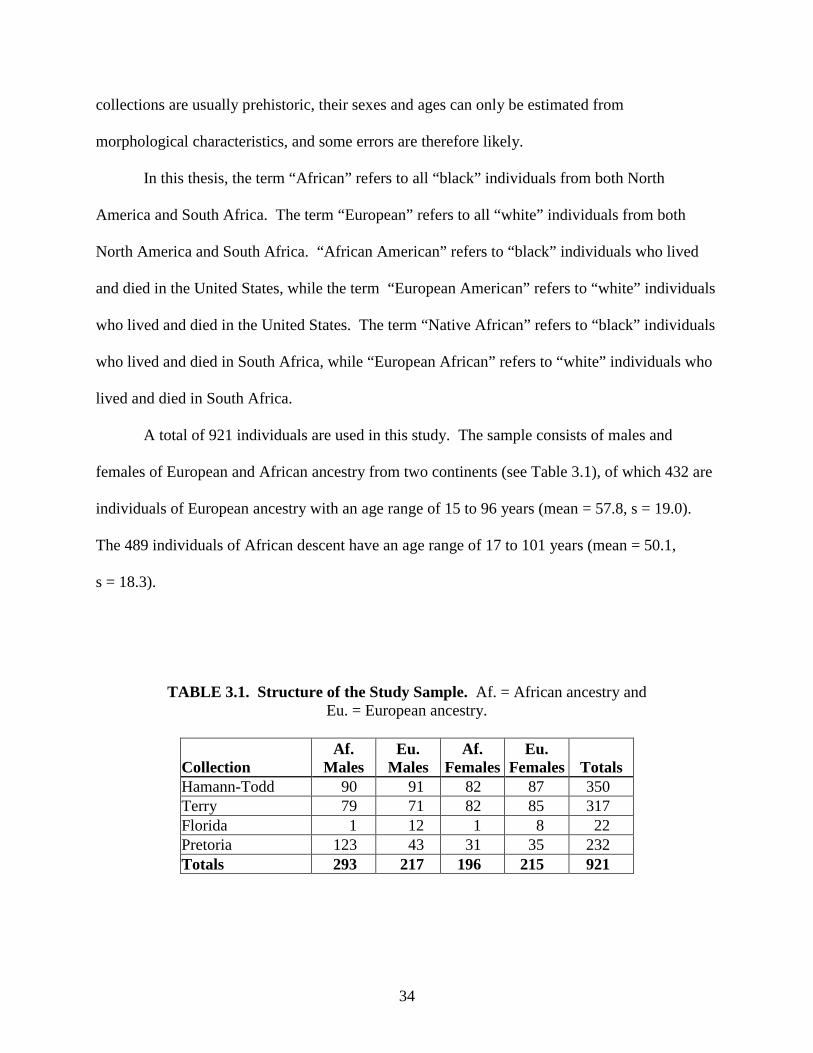
A total of 921 individuals are used in this study. The sample consists of males and
females of European and African ancestry from two continents (see Table 3.1), of which 432 are
individuals of European ancestry with an age range of 15 to 96 years (mean = 57.8, s = 19.0).
The 489 individuals of African descent have an age range of 17 to 101 years (mean = 50.1,
s = 18.3).
TABLE 3.1. Structure of the Study Sample. Af. = African ancestry and Eu. = European ancestry.
Collection Af.
Males Eu.
Males Af.
FemalesEu.
Females Totals Hamann-Todd 90 91 82 87 350 Terry 79 71 82 85 317 Florida 1 12 1 8 22 Pretoria 123 43 31 35 232 Totals 293 217 196 215 921
35
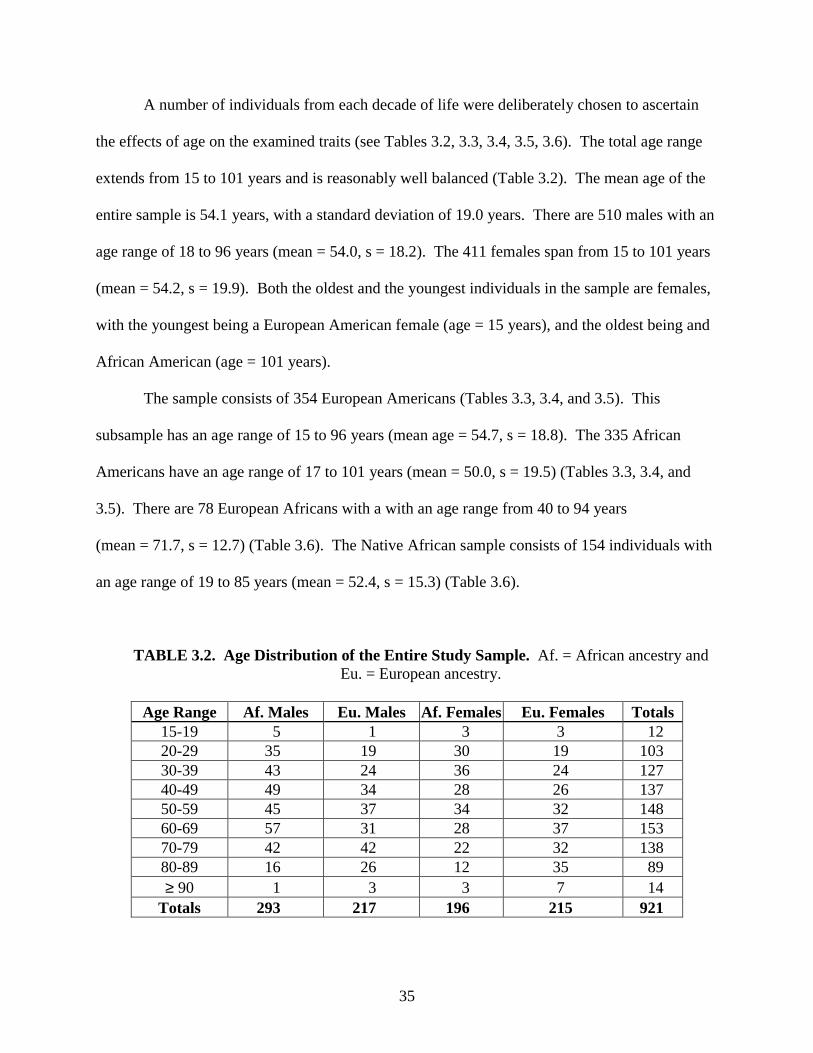
A number of individuals from each decade of life were deliberately chosen to ascertain
the effects of age on the examined traits (see Tables 3.2, 3.3, 3.4, 3.5, 3.6). The total age range
extends from 15 to 101 years and is reasonably well balanced (Table 3.2). The mean age of the
entire sample is 54.1 years, with a standard deviation of 19.0 years. There are 510 males with an
age range of 18 to 96 years (mean = 54.0, s = 18.2). The 411 females span from 15 to 101 years
(mean = 54.2, s = 19.9). Both the oldest and the youngest individuals in the sample are females,
with the youngest being a European American female (age = 15 years), and the oldest being and
African American (age = 101 years).
The sample consists of 354 European Americans (Tables 3.3, 3.4, and 3.5). This
subsample has an age range of 15 to 96 years (mean age = 54.7, s = 18.8). The 335 African
Americans have an age range of 17 to 101 years (mean = 50.0, s = 19.5) (Tables 3.3, 3.4, and
3.5). There are 78 European Africans with a with an age range from 40 to 94 years
(mean = 71.7, s = 12.7) (Table 3.6). The Native African sample consists of 154 individuals with
an age range of 19 to 85 years (mean = 52.4, s = 15.3) (Table 3.6).
TABLE 3.2. Age Distribution of the Entire Study Sample. Af. = African ancestry and Eu. = European ancestry.
Age Range Af. Males Eu. Males Af. Females Eu. Females Totals
15-19 5 1 3 3 12 20-29 35 19 30 19 103 30-39 43 24 36 24 127 40-49 49 34 28 26 137 50-59 45 37 34 32 148 60-69 57 31 28 37 153 70-79 42 42 22 32 138 80-89 16 26 12 35 89 ≥ 90 1 3 3 7 14
Totals 293 217 196 215 921
36
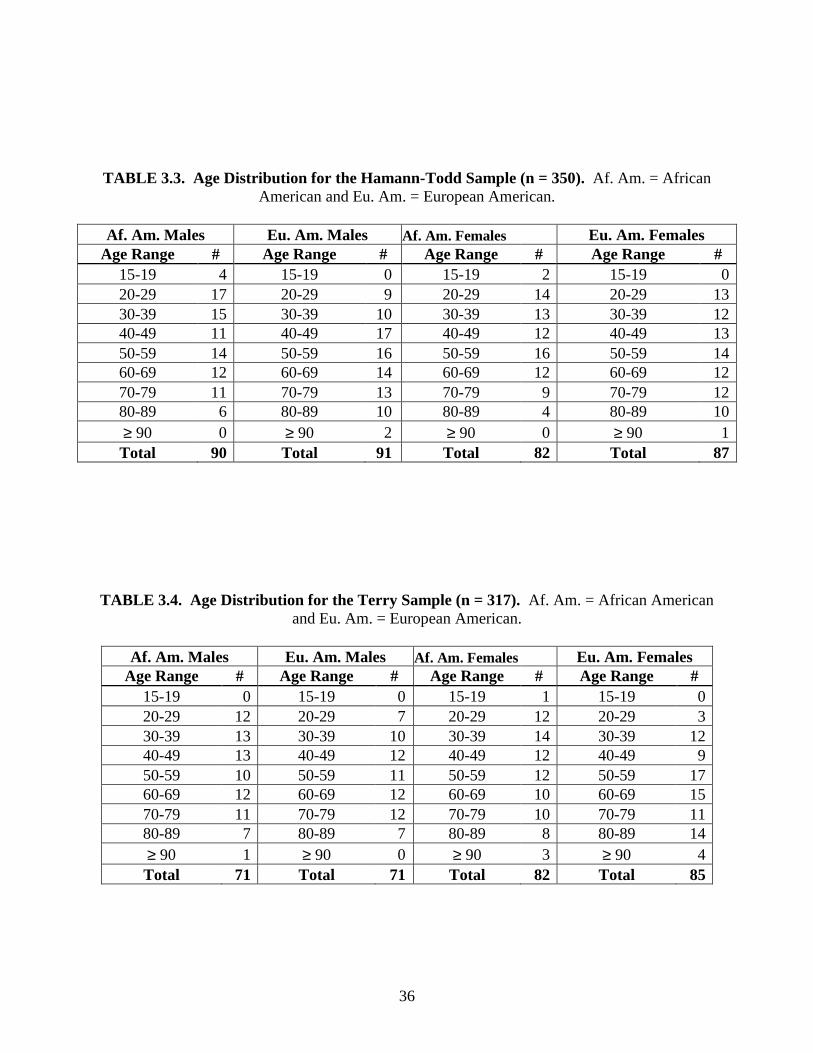
TABLE 3.3. Age Distribution for the Hamann-Todd Sample (n = 350). Af. Am. = African American and Eu. Am. = European American.
Af. Am. Males Eu. Am. Males Af. Am. Females Eu. Am. Females
Age Range # Age Range # Age Range # Age Range # 15-19 4 15-19 0 15-19 2 15-19 020-29 17 20-29 9 20-29 14 20-29 1330-39 15 30-39 10 30-39 13 30-39 1240-49 11 40-49 17 40-49 12 40-49 1350-59 14 50-59 16 50-59 16 50-59 1460-69 12 60-69 14 60-69 12 60-69 1270-79 11 70-79 13 70-79 9 70-79 1280-89 6 80-89 10 80-89 4 80-89 10≥ 90 0 ≥ 90 2 ≥ 90 0 ≥ 90 1Total 90 Total 91 Total 82 Total 87
TABLE 3.4. Age Distribution for the Terry Sample (n = 317). Af. Am. = African American and Eu. Am. = European American.
Af. Am. Males Eu. Am. Males Af. Am. Females Eu. Am. Females
Age Range # Age Range # Age Range # Age Range # 15-19 0 15-19 0 15-19 1 15-19 020-29 12 20-29 7 20-29 12 20-29 330-39 13 30-39 10 30-39 14 30-39 1240-49 13 40-49 12 40-49 12 40-49 950-59 10 50-59 11 50-59 12 50-59 1760-69 12 60-69 12 60-69 10 60-69 1570-79 11 70-79 12 70-79 10 70-79 1180-89 7 80-89 7 80-89 8 80-89 14≥ 90 1 ≥ 90 0 ≥ 90 3 ≥ 90 4Total 71 Total 71 Total 82 Total 85
37
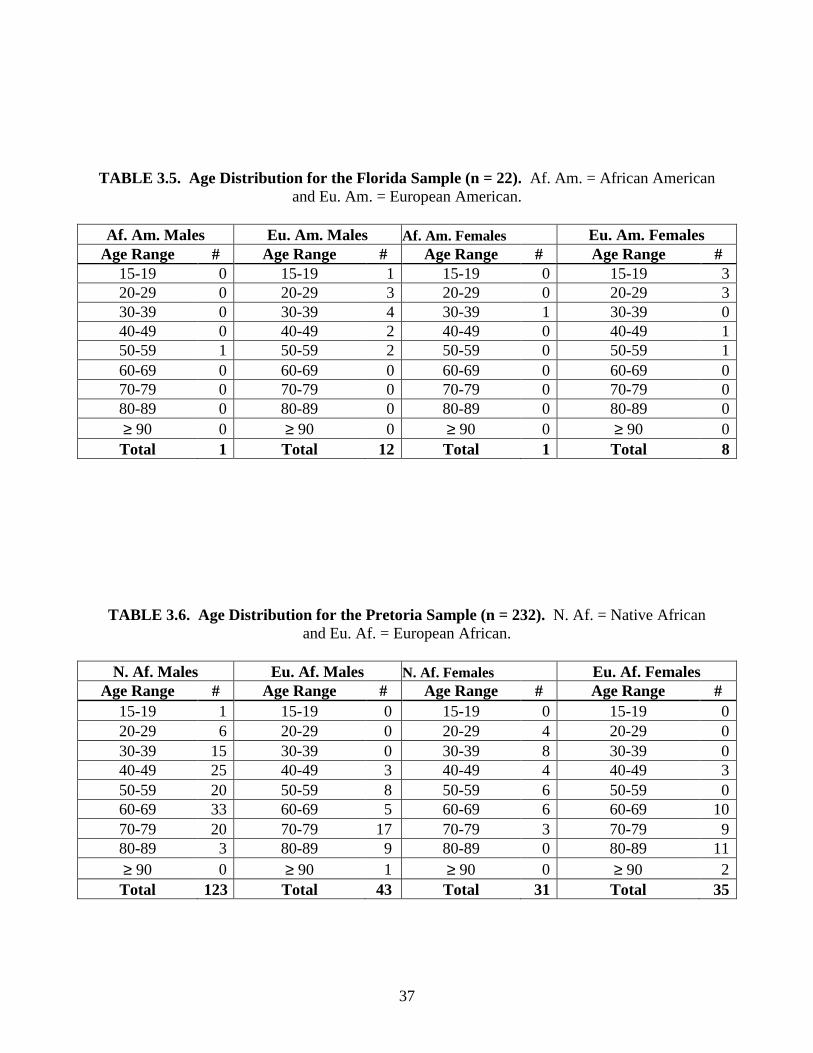
TABLE 3.5. Age Distribution for the Florida Sample (n = 22). Af. Am. = African American and Eu. Am. = European American.
Af. Am. Males Eu. Am. Males Af. Am. Females Eu. Am. Females
Age Range # Age Range # Age Range # Age Range # 15-19 0 15-19 1 15-19 0 15-19 320-29 0 20-29 3 20-29 0 20-29 330-39 0 30-39 4 30-39 1 30-39 040-49 0 40-49 2 40-49 0 40-49 150-59 1 50-59 2 50-59 0 50-59 160-69 0 60-69 0 60-69 0 60-69 070-79 0 70-79 0 70-79 0 70-79 080-89 0 80-89 0 80-89 0 80-89 0≥ 90 0 ≥ 90 0 ≥ 90 0 ≥ 90 0Total 1 Total 12 Total 1 Total 8
TABLE 3.6. Age Distribution for the Pretoria Sample (n = 232). N. Af. = Native African and Eu. Af. = European African.
N. Af. Males Eu. Af. Males N. Af. Females Eu. Af. Females
Age Range # Age Range # Age Range # Age Range # 15-19 1 15-19 0 15-19 0 15-19 020-29 6 20-29 0 20-29 4 20-29 030-39 15 30-39 0 30-39 8 30-39 040-49 25 40-49 3 40-49 4 40-49 350-59 20 50-59 8 50-59 6 50-59 060-69 33 60-69 5 60-69 6 60-69 1070-79 20 70-79 17 70-79 3 70-79 980-89 3 80-89 9 80-89 0 80-89 11≥ 90 0 ≥ 90 1 ≥ 90 0 ≥ 90 2Total 123 Total 43 Total 31 Total 35
38
The African American males have an age range from 18 to 91 years (mean = 50.1,
s = 19.8). The European American males range from 19 to 96 years (mean = 54.0, s = 17.9).
African American females range from 17 to 101 years (mean = 49.9, s = 19.4). European
American females span from 15 to 94 years (mean = 55.4, s = 19.7). The Native African males
have an age range from 19 to 85 years (mean = 53.7, s = 15.0). European African males span
from 40 to 91 years (mean = 69.8, s = 12.9). The Native African females range from 22 to 75
years (mean = 47.5, s = 15.8). The European African females range from 45 to 94 years
(mean = 73.7, s = 12.1) (Tables 3.3, 3.4, 3.5, and 3.6).
There are 22 individuals analyzed from the Florida collection with an age range of 15 to
59 years (mean = 34.0, s =13.8) (Table 3.5). The 317 individuals from the Terry collection have
an age range spanning from 19 to 101 years (mean = 55.0, s = 19.3) (Table 3.4). The Hamann-
Todd sample includes 350 individuals ranging from 17 to 96 years (mean = 51.3, s = 18.9)
(Table 3.3). The 232 individuals in the Pretoria sample range in age from 19 to 94 years
(mean = 58.9, s = 17.1) (Table 3.6).
Analyzed Traits
Twelve non-metric traits were documented: ramus inversion, location of inversion,
gonial eversion, mandibular border form, presence of mandibular tori, robusticity of muscle
attachment sites, mylohyoid bridging, chin prominence, chin shape, number of mental foramina,
position of the mental foramen, and presence of an accessory mandibular foramen. With the
exception of robusticity of muscle attachment sites, these traits were chosen because they have
been described adequately by previous researchers and some have been shown to differ between
populations (Angel and Kelley, 1990; Berry and Berry, 1967; Corruccini, 1974; DeVilliers,
39
1968; Finnegan and Marcsik, 1979; Hauser and DeStefano, 1989; Houghton, 1978; Ossenberg,
1969; Rhine, 1990; Sawyer et al. 1979; Sawyer et al., 1998). Robusticity of muscle attachment
sites is included to see if body build has an effect on the expression of mandibular traits. Two of
the traits examined (mylohyoid bridging and accessory mandibular foramen) are discrete
(nominal) in nature and are scored either as “present” or “absent.” However, the other traits vary
in a gradating order and must be scored in a different manner. These ordinal traits are described
as “quasi-continuous” (Saunders, 1989) and have intermediate stages scored on a ranked scale.
Ramus inversion. In some individuals, the edge of the posterior mandibular ramus is
medially rotated (Angel and Kelley, 1990). Ramus inversion is an ordinal trait that is scored on
a four-point scale (0 to 3) for the right and left sides of the mandible separately. A score of “0”
indicates a completely straight ramus that lacks inversion. A score of “1” indicates slight
inversion. A mandible that displays a moderate amount of incurvature of the ramus is given a
score of “2.” A score of “3” indicates extreme inversion that dominates the majority of the
ramus (Parr, 2003).
Location of inversion. Both right and left rami are evaluated separately on a 3-point
ordinal scale depending on the location of greatest incurvature. A score of “0” indicates that the
greatest amount of incurvature is located in the lower third of the ramus. A mandible with
inversion that is greatest in the middle third of the ramus is given a score of “1.” A score of “2”
indicates a ramus with the greatest incurvature in the upper third of the ramus.
Gonial eversion. Gonial angle eversion is scored separately on each side using a 5-point
ordinal scale. A gonial angle displaying inversion is assigned a score of “–1.” A score of “0”
indicates a gonion aligned with the ramus and completely lacking eversion or inversion (Rhine,
1990). A mandible with slight eversion of the gonial angle is given a score of “1.” A score of
40
“2” is assigned when a moderate amount of eversion is observed. A mandible with extreme
eversion is given a score of “3” (Parr, 2003).
Mandibular border form. Mandibular border form is scored on a nominal scale on both
left and right sides. If the inferior mandibular border appears to have no curvature, it is scored as
“straight.” Any superior (concave) curvature of the border located around the second molar is
scored as “undulating.” These mandibles generally appear to have a thinning mandibular corpus.
The term “rocker” is applied to any mandible that has a convex or inferiorly-curving border
(Houghton, 1978; Rhine, 1990).
Mandibular tori. Bony exostoses on the lingual surface of the corpus vary in size and
shape (Sellevold, 1980) and are usually located between the alveolar region and the mylohyoid
line (Hrdlicka, 1940; Sawyer et al., 1979; Sellevold, 1980; Woo, 1950; Zivanovic, 1970). Each
side was scored independently using an ordinal scale. The trait is scored as “0” if no tori are
present. Slight eminences are given a score of “1.” Marked tori, or those the size of a pea are
assigned a score of “2.” Extreme cases of mandibular tori, such as those that are much larger
than a pea and exhibiting multiple lobules, are given a score of “3.”
Muscle attachment sites. Varying bony ridges or protuberances of different sizes may
develop at muscle attachment points. Ridges from the medial pterygoid attachment on the
medial border of the ramus is scored on a 3-point ordinal scale on each side separately. A ramus
that is flat and smooth to the touch, with a minimal amount of ridging, is given a score of “0.” A
ramus with slight muscle attachment sites is given a score of “1.” A score of “2” is given to a
mandible that has moderate muscle attachment points that look like small hills. A ramus with a
score of “3” has the appearance of raised attachment points that look like mountain peaks,
displaying extreme robusticity.
41
Mylohyoid bridge. The mylohyoid bridge is an “osseous roof” located on the medial
aspect of the ramus covering a portion of the mylohyoid groove, thus forming a canal (Hauser
and DeStefano, 1989). This discrete characteristic is nominally scored as “present” if the trait is
visible or “absent” if it is lacking. Each side is scored individually. In the case of incomplete
bridging, such as the formation of two spicules of bone over the canal that have failed to connect
in the middle, the trait is marked as absent.
Accessory mandibular foramen. The mandibular foramen is located on the medial
portion of the mandibular ramus. An accessory mandibular foramen, also known as the posterior
orifice of a canal de Serres, may be present near the mandibular foramen (Hauser and DeStefano,
1989) and ranges in size from small to large (Sutton, 1974). This trait is scored for the left and
right sides independently on a nominal scale, as either “present” or “absent.”
Chin prominence. The prominence of the chin, or mental eminence, has been shown to
vary in different ancestral groups (Rhine, 1990) and is scored on a 3-point ordinal scale. A
protruding chin region is scored as “prominent” or “0”, while a straight chin is scored as
“vertical” or “1” (Murphy, 1957; Rhine, 1990). Mandibles with a receding chin will be scored as
“recessive” or “-1.” This trait may be difficult to score because sometimes it is difficult to
distinguish between prominent and vertical chin. This issue will be addressed in more detail in
the following chapters.
Chin shape. Relative development of the mental protuberance and the mental tubercles
determine the shape of the chin (DeVilliers, 1968; Rhine, 1990; Schulz, 1933 Zivanovic, 1970).
Three basic shapes have been noted:
Round: chins in which there is either equal (but moderate) development of both protuberance and tubercles or only slight development of the mental tubercles.
42
Square: this category includes those specimens in which the mental tubercles show a marked degree of development combined with either a slight or moderated development of the mental protuberance. A fossa mentalis is present. Pointed: this category includes those mandibles in which there is a marked development of the mental protuberance combined with either a slight or moderate development of the mental tubercles (DeVilliers, 1968; p. 147).
Chin shape is scored on a nominal scale according to the aforementioned descriptions
(eg., round = 0, square = 1, and pointed = 2).
Number of mental foramina. The mental foramen is situated laterally on the labial
aspect of the mandibular corpus, just below junction of the fourth premolar and the first molar
(Hauser and DeStefano, 1989; Sawyer et al., 1998; Shankland, 1994; Toh, 1992). While the
occurrence of a single foramen is the most common form in humans, it has been noted that in
some individuals there may be more than one foramen, ranging from small to large in size
(DeFreitas et al., 1979; DeVillers, 1968; Gershenson et al., 1986; Hauser & DeStefano, 198;
Murphy, 1957; Riesenfeld, 1956; Sawyer et al., 1998; Simonton, 1923; Zivanovic, 1970).
Accessory foramina are usually the result of the branching of the mental nerve before exiting the
mental foramen (Serman, 1989; Toh, 1992). This feature is scored on an ordinal scale. The right
and left sides are scored independently, using values of 0, 1, 2, or 3, depending on the number of
foramina present.
Position of the mental foramen. The left and right mental foramina are scored
independently on a ordinal scale with regards to their positions in relation to the teeth. The
mandible is placed flat on a table and using the straight edge of a piece of paper, the position of
the mental foramen is noted. If the mental foramen is located directly under the third premolar
(P3) it is given a score of “0.” If it is located beneath the junction between the third premolar
and the forth premolar (P3/P4) it is given a score of “1.” When the mental foramen is positioned
under the forth premolar (P4) it is assigned a score of “2.” A mental foramen situated under the
43
junction between the forth premolar and the first molar (P4/M1) is given a score of “3.” Lastly,
if the mental foramen is directly beneath the first molar (M1) it is assigned a score of “4.” In
cases where multiple foramina are present, the largest foramen is scored.
Mandibular measurements. Five basic measurements are taken to account for the size
differences that may be found: bigonial width, bicondylar breadth, mandibular length,
mandibular angle, and minimum ramus breadth. Each measurement is taken with either a
Mitutoyo Sliding Calipers or a Paleo-Tech Mandibulometer, following Moore-Jansen and Jantz
(1990). A mandibulometer was not available at the Hamann-Todd collection; therefore,
mandibular length and mandibular angle could not be taken on those 350 individuals.
Statistical Analysis
This study provides simple descriptive statistics (trait frequencies) for the nominal and
ordinal traits by rank. For each bilateral trait, frequencies are given for both sides and a
combined frequency for each side is also presented. Traits that are not bilateral (chin shape and
chin prominence) have their frequencies presented for each rank.
The Wilcoxon Signed Ranks Test is a non-parametric procedure that can be used to
compare two ordinal or nominal variables. This test is used on the non-metric traits to see if
there is a relationship between trait frequency and side. The null hypothesis is that there is no
difference in bilateral trait expression.
An analysis of covariance (ANCOVA) is used for the continuous measurements. The
effects that ancestry, sex, age, and the interaction between sex and ancestry (the independent
variables) have on each measurement (the dependent variable) are measured separately.
Ancestry, sex, and their interaction are categorical independent variables, while age is a
44
continuously varying independent variable (the covariate). The model tested is as follows:
Expression of a trait = Ancestry + Sex + Ancestry*Sex + Age + error
where “Ancestry*Sex” is the interaction between those two variables. The amount of variation
in the expression of a trait that is not attributable to the independent variables is represented by
the error term.
For each non-metric trait, an ordinal regression model identical to that presented above is
used, which produces significance values for each independent variable that are analogous to
those produced by ANCOVA (which normally is only used on continuous dependent variables).
This test is utilized to determine the effect, if any, that age, sex, ancestry, and the interaction
between sex and ancestry has on any given ordinal trait.
Ordinal regression is also used to determine if there is any difference between individuals
of African ancestry from the two continents and between individuals of European ancestry from
the two continents. The dependent variable is the trait; the independent variables are sex,
ancestry, and the interaction between sex and ancestry. The covariate is age.
The following null hypotheses are tested in this study:
Hn1: There are no differences in trait expression between individuals of European and African ancestry.
Hn2: Sex does not affect the expression of the traits. Hn3: The age of the individual does not affect the expression of the traits. Hn4: Side does not affect the expression of the bilateral traits. Hn5: There is no difference in trait expression between African American individuals and
Native African individuals. Hn6: There is no difference in trait expression between European American individuals and European African individuals.
45
Discrete traits have been noted to have varying degrees of intra-observer error
(DeStefano et al., 1984); therefore, intra-observer tests were conducted on 21 of the 22
individuals in the Florida sample using Wilcoxon Signed Ranks Test. Observations taken in
May 2004 were compared to those taken three months later in August. This test determines if
there is a significant difference between the first and second scorings of each mandible. The null
hypothesis is that there is a difference between the first and second scoring methods of the trait.
All statistical tests are run using Statistical Package for the Social Sciences 13.0 (SPSS,
2004).
46
CHAPTER 4: RESULTS
Descriptive Statistics
Frequency distributions were calculated for all traits analyzed. Tables 4.1 through 4.36
present the frequency distributions for each trait analyzed. For each trait, three tables are shown.
The first table shows the frequency distribution for each side, sex, and ancestry separated by
country of origin. The second table shows combined raw frequencies of each trait. In these
tables, the sides and ancestral groups are combined. The third table shows each trait combined
by side, sex, and ancestral groups. Table 4.37 presents trait frequencies for males versus
females. All percentages were also determined from raw counts rather than by averaging the
percentages across groups.
Test for Side Differences
All bilateral traits (inversion, gonial eversion, mandibular border, mandibular torus,
muscle attachments, mylohyoid bridging, accessory mandibular foramen, number of mental
foramina, and position of the mental foramen) were tested using Wilcoxon Signed Ranks Test to
see if there was a significant difference between the left and right expressions of the trait (see
Table 4.38). Inversion, location of inversion, gonial eversion, mandibular tori, accessory
mandibular foramen, and mental foramen position were found to be significantly different
(at p < 0.05) between the two sides analyzed. Traits that showed no significant difference
between left and right sides include mandibular border, muscle attachments, mylohyoid bridging,
and number of mental foramina.
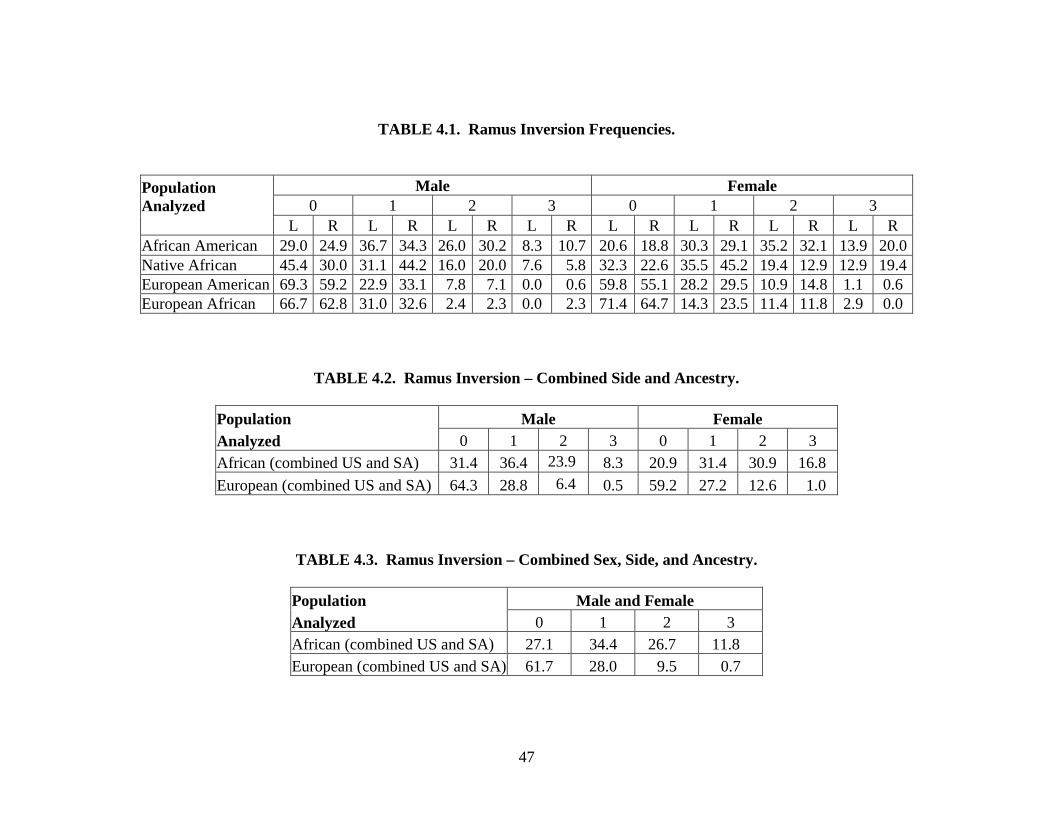
47
TABLE 4.1. Ramus Inversion Frequencies.
Male Female
0 1 2 3 0 1 2 3 Population Analyzed L R L R L R L R L R L R L R L R African American 29.0 24.9 36.7 34.3 26.0 30.2 8.3 10.7 20.6 18.8 30.3 29.1 35.2 32.1 13.9 20.0Native African 45.4 30.0 31.1 44.2 16.0 20.0 7.6 5.8 32.3 22.6 35.5 45.2 19.4 12.9 12.9 19.4European American 69.3 59.2 22.9 33.1 7.8 7.1 0.0 0.6 59.8 55.1 28.2 29.5 10.9 14.8 1.1 0.6 European African 66.7 62.8 31.0 32.6 2.4 2.3 0.0 2.3 71.4 64.7 14.3 23.5 11.4 11.8 2.9 0.0
TABLE 4.2. Ramus Inversion – Combined Side and Ancestry.
Population Male Female Analyzed 0 1 2 3 0 1 2 3 African (combined US and SA) 31.4 36.4 23.9 8.3 20.9 31.4 30.9 16.8 European (combined US and SA) 64.3 28.8 6.4 0.5 59.2 27.2 12.6 1.0
TABLE 4.3. Ramus Inversion – Combined Sex, Side, and Ancestry.
Population Male and Female Analyzed 0 1 2 3 African (combined US and SA) 27.1 34.4 26.7 11.8 European (combined US and SA) 61.7 28.0 9.5 0.7
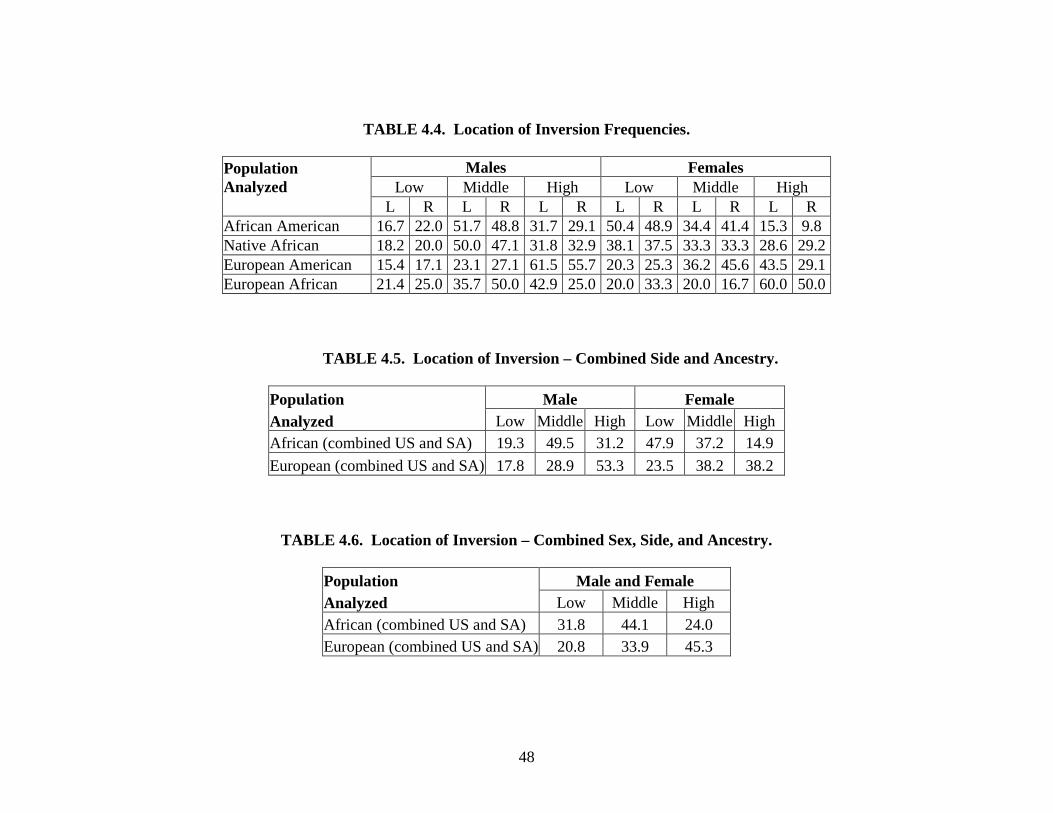
48
TABLE 4.4. Location of Inversion Frequencies.
Males Females Low Middle High Low Middle High
Population Analyzed L R L R L R L R L R L R African American 16.7 22.0 51.7 48.8 31.7 29.1 50.4 48.9 34.4 41.4 15.3 9.8 Native African 18.2 20.0 50.0 47.1 31.8 32.9 38.1 37.5 33.3 33.3 28.6 29.2European American 15.4 17.1 23.1 27.1 61.5 55.7 20.3 25.3 36.2 45.6 43.5 29.1European African 21.4 25.0 35.7 50.0 42.9 25.0 20.0 33.3 20.0 16.7 60.0 50.0
TABLE 4.5. Location of Inversion – Combined Side and Ancestry.
Population Male Female Analyzed Low Middle High Low Middle High African (combined US and SA) 19.3 49.5 31.2 47.9 37.2 14.9 European (combined US and SA) 17.8 28.9 53.3 23.5 38.2 38.2
TABLE 4.6. Location of Inversion – Combined Sex, Side, and Ancestry.
Population Male and Female Analyzed Low Middle High African (combined US and SA) 31.8 44.1 24.0 European (combined US and SA) 20.8 33.9 45.3
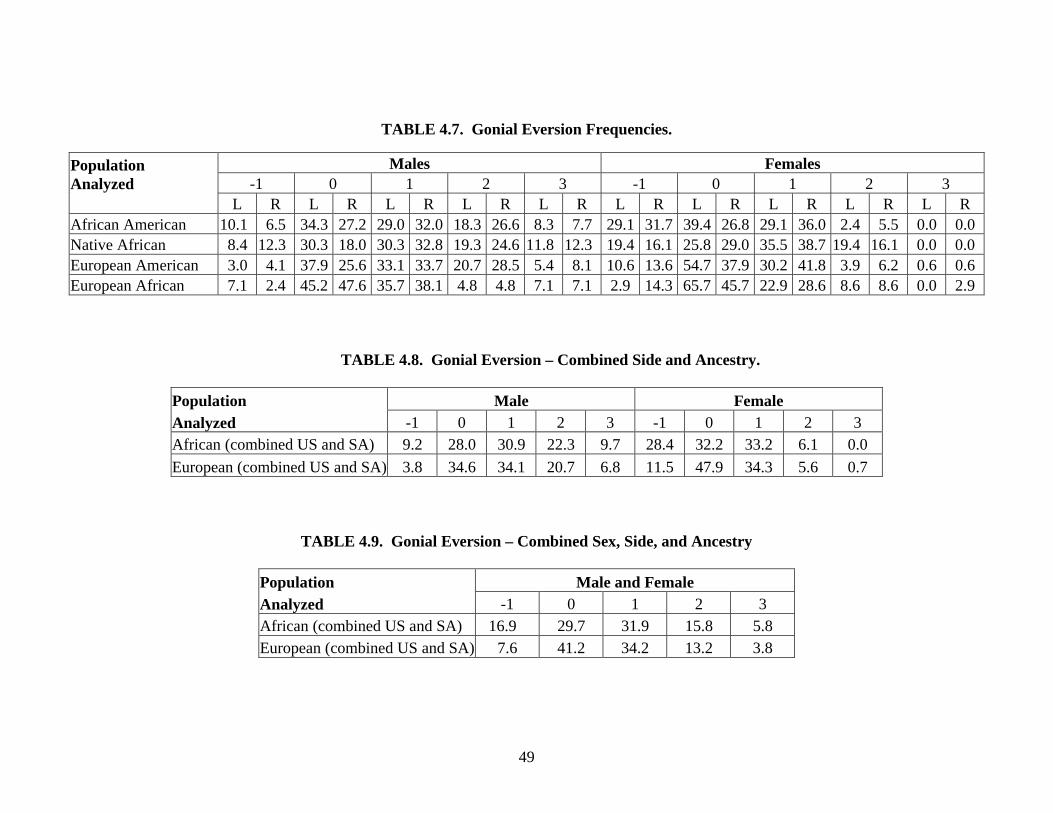
49
TABLE 4.7. Gonial Eversion Frequencies.
TABLE 4.8. Gonial Eversion – Combined Side and Ancestry.
Population Male Female Analyzed -1 0 1 2 3 -1 0 1 2 3 African (combined US and SA) 9.2 28.0 30.9 22.3 9.7 28.4 32.2 33.2 6.1 0.0 European (combined US and SA) 3.8 34.6 34.1 20.7 6.8 11.5 47.9 34.3 5.6 0.7
TABLE 4.9. Gonial Eversion – Combined Sex, Side, and Ancestry
Population Male and Female Analyzed -1 0 1 2 3 African (combined US and SA) 16.9 29.7 31.9 15.8 5.8 European (combined US and SA) 7.6 41.2 34.2 13.2 3.8
Males Females -1 0 1 2 3 -1 0 1 2 3
Population Analyzed L R L R L R L R L R L R L R L R L R L R African American 10.1 6.5 34.3 27.2 29.0 32.0 18.3 26.6 8.3 7.7 29.1 31.7 39.4 26.8 29.1 36.0 2.4 5.5 0.0 0.0 Native African 8.4 12.3 30.3 18.0 30.3 32.8 19.3 24.6 11.8 12.3 19.4 16.1 25.8 29.0 35.5 38.7 19.4 16.1 0.0 0.0 European American 3.0 4.1 37.9 25.6 33.1 33.7 20.7 28.5 5.4 8.1 10.6 13.6 54.7 37.9 30.2 41.8 3.9 6.2 0.6 0.6 European African 7.1 2.4 45.2 47.6 35.7 38.1 4.8 4.8 7.1 7.1 2.9 14.3 65.7 45.7 22.9 28.6 8.6 8.6 0.0 2.9
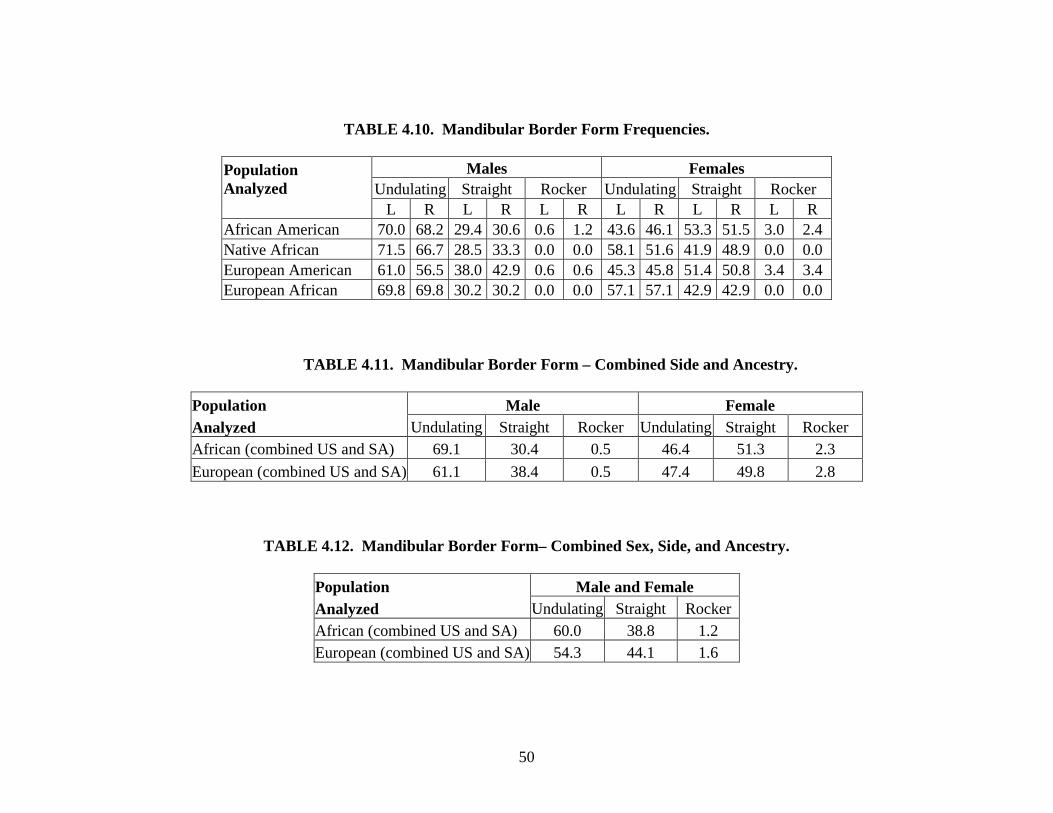
50
TABLE 4.10. Mandibular Border Form Frequencies.
Males Females Undulating Straight Rocker Undulating Straight Rocker
Population Analyzed L R L R L R L R L R L R African American 70.0 68.2 29.4 30.6 0.6 1.2 43.6 46.1 53.3 51.5 3.0 2.4 Native African 71.5 66.7 28.5 33.3 0.0 0.0 58.1 51.6 41.9 48.9 0.0 0.0 European American 61.0 56.5 38.0 42.9 0.6 0.6 45.3 45.8 51.4 50.8 3.4 3.4 European African 69.8 69.8 30.2 30.2 0.0 0.0 57.1 57.1 42.9 42.9 0.0 0.0
TABLE 4.11. Mandibular Border Form – Combined Side and Ancestry.
Population Male Female Analyzed Undulating Straight Rocker Undulating Straight Rocker African (combined US and SA) 69.1 30.4 0.5 46.4 51.3 2.3 European (combined US and SA) 61.1 38.4 0.5 47.4 49.8 2.8
TABLE 4.12. Mandibular Border Form– Combined Sex, Side, and Ancestry.
Population Male and Female Analyzed Undulating Straight RockerAfrican (combined US and SA) 60.0 38.8 1.2 European (combined US and SA) 54.3 44.1 1.6
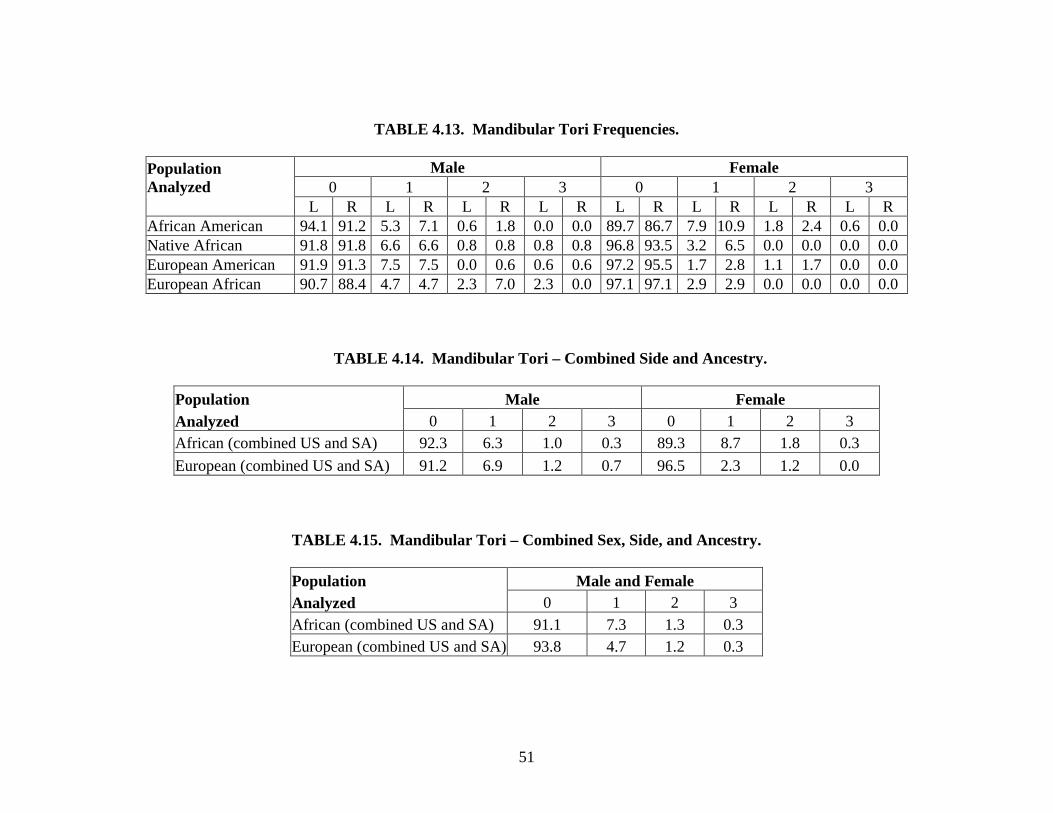
51
TABLE 4.13. Mandibular Tori Frequencies.
Male Female 0 1 2 3 0 1 2 3
Population Analyzed L R L R L R L R L R L R L R L R African American 94.1 91.2 5.3 7.1 0.6 1.8 0.0 0.0 89.7 86.7 7.9 10.9 1.8 2.4 0.6 0.0 Native African 91.8 91.8 6.6 6.6 0.8 0.8 0.8 0.8 96.8 93.5 3.2 6.5 0.0 0.0 0.0 0.0 European American 91.9 91.3 7.5 7.5 0.0 0.6 0.6 0.6 97.2 95.5 1.7 2.8 1.1 1.7 0.0 0.0 European African 90.7 88.4 4.7 4.7 2.3 7.0 2.3 0.0 97.1 97.1 2.9 2.9 0.0 0.0 0.0 0.0
TABLE 4.14. Mandibular Tori – Combined Side and Ancestry.
Population Male Female Analyzed 0 1 2 3 0 1 2 3 African (combined US and SA) 92.3 6.3 1.0 0.3 89.3 8.7 1.8 0.3 European (combined US and SA) 91.2 6.9 1.2 0.7 96.5 2.3 1.2 0.0
TABLE 4.15. Mandibular Tori – Combined Sex, Side, and Ancestry.
Population Male and Female Analyzed 0 1 2 3 African (combined US and SA) 91.1 7.3 1.3 0.3 European (combined US and SA) 93.8 4.7 1.2 0.3
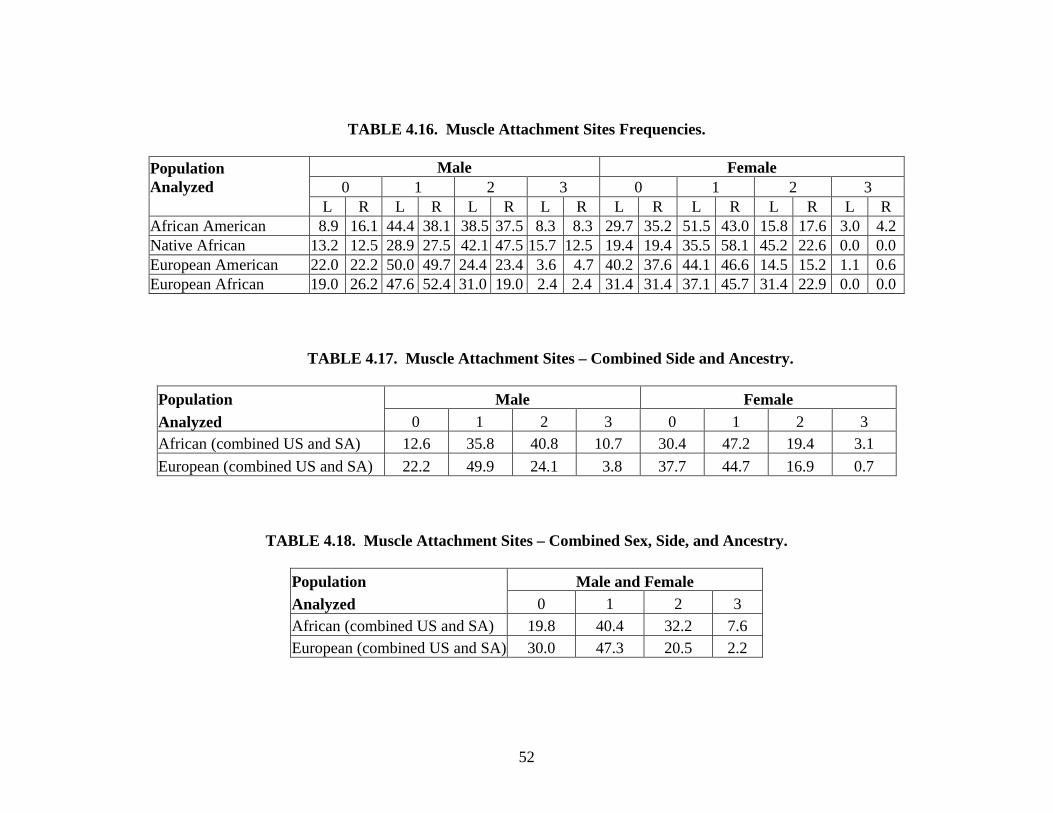
52
TABLE 4.16. Muscle Attachment Sites Frequencies.
Male Female 0 1 2 3 0 1 2 3
Population Analyzed L R L R L R L R L R L R L R L R African American 8.9 16.1 44.4 38.1 38.5 37.5 8.3 8.3 29.7 35.2 51.5 43.0 15.8 17.6 3.0 4.2Native African 13.2 12.5 28.9 27.5 42.1 47.5 15.7 12.5 19.4 19.4 35.5 58.1 45.2 22.6 0.0 0.0European American 22.0 22.2 50.0 49.7 24.4 23.4 3.6 4.7 40.2 37.6 44.1 46.6 14.5 15.2 1.1 0.6European African 19.0 26.2 47.6 52.4 31.0 19.0 2.4 2.4 31.4 31.4 37.1 45.7 31.4 22.9 0.0 0.0
TABLE 4.17. Muscle Attachment Sites – Combined Side and Ancestry.
Population Male Female Analyzed 0 1 2 3 0 1 2 3 African (combined US and SA) 12.6 35.8 40.8 10.7 30.4 47.2 19.4 3.1 European (combined US and SA) 22.2 49.9 24.1 3.8 37.7 44.7 16.9 0.7
TABLE 4.18. Muscle Attachment Sites – Combined Sex, Side, and Ancestry.
Population Male and Female Analyzed 0 1 2 3 African (combined US and SA) 19.8 40.4 32.2 7.6 European (combined US and SA) 30.0 47.3 20.5 2.2
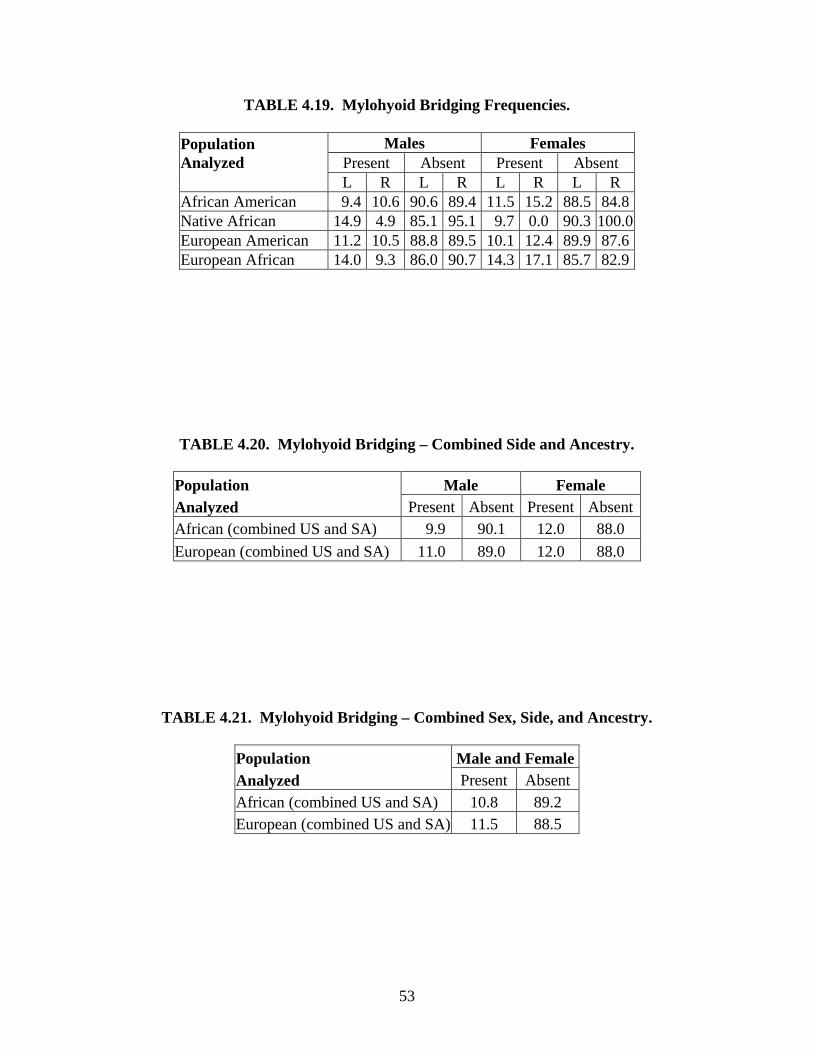
53
TABLE 4.19. Mylohyoid Bridging Frequencies.
Males Females Present Absent Present Absent
Population Analyzed L R L R L R L R African American 9.4 10.6 90.6 89.4 11.5 15.2 88.5 84.8 Native African 14.9 4.9 85.1 95.1 9.7 0.0 90.3 100.0 European American 11.2 10.5 88.8 89.5 10.1 12.4 89.9 87.6 European African 14.0 9.3 86.0 90.7 14.3 17.1 85.7 82.9
TABLE 4.20. Mylohyoid Bridging – Combined Side and Ancestry.
Population Male Female Analyzed Present Absent Present Absent African (combined US and SA) 9.9 90.1 12.0 88.0 European (combined US and SA) 11.0 89.0 12.0 88.0
TABLE 4.21. Mylohyoid Bridging – Combined Sex, Side, and Ancestry.
Population Male and Female Analyzed Present Absent African (combined US and SA) 10.8 89.2 European (combined US and SA) 11.5 88.5
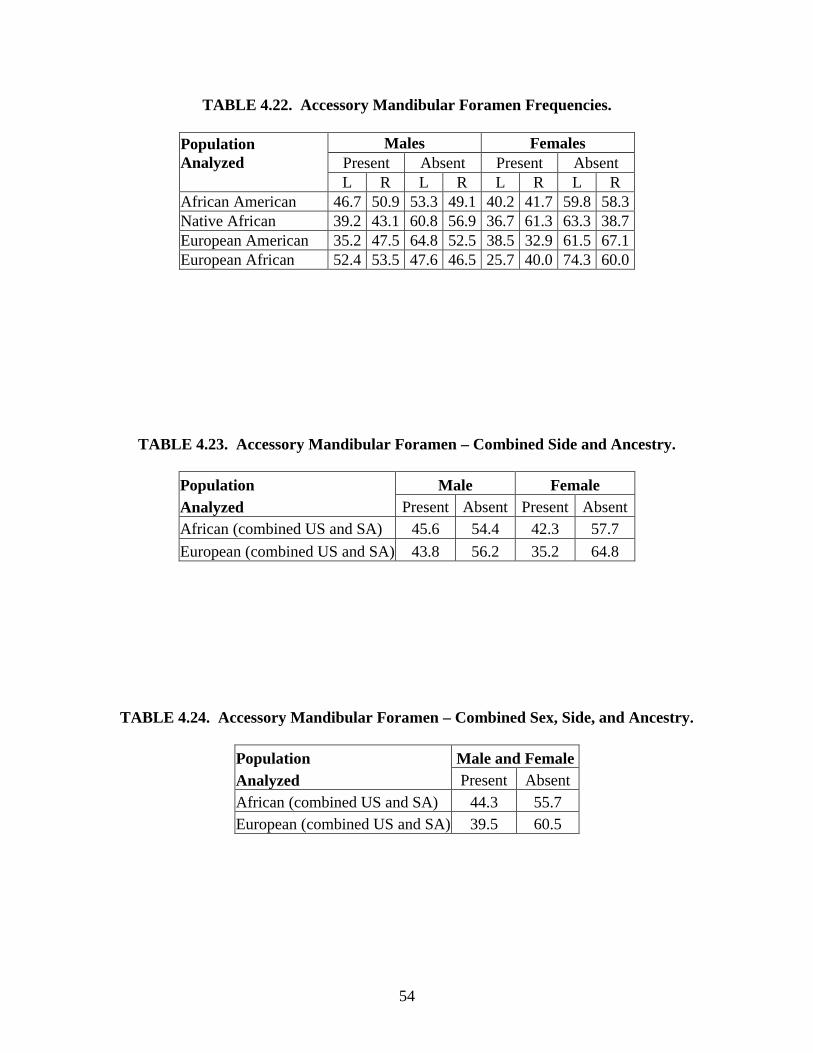
54
TABLE 4.22. Accessory Mandibular Foramen Frequencies.
Males Females Present Absent Present Absent
Population Analyzed L R L R L R L R African American 46.7 50.9 53.3 49.1 40.2 41.7 59.8 58.3 Native African 39.2 43.1 60.8 56.9 36.7 61.3 63.3 38.7 European American 35.2 47.5 64.8 52.5 38.5 32.9 61.5 67.1 European African 52.4 53.5 47.6 46.5 25.7 40.0 74.3 60.0
TABLE 4.23. Accessory Mandibular Foramen – Combined Side and Ancestry.
Population Male Female Analyzed Present Absent Present Absent African (combined US and SA) 45.6 54.4 42.3 57.7 European (combined US and SA) 43.8 56.2 35.2 64.8
TABLE 4.24. Accessory Mandibular Foramen – Combined Sex, Side, and Ancestry.
Population Male and Female Analyzed Present Absent African (combined US and SA) 44.3 55.7 European (combined US and SA) 39.5 60.5
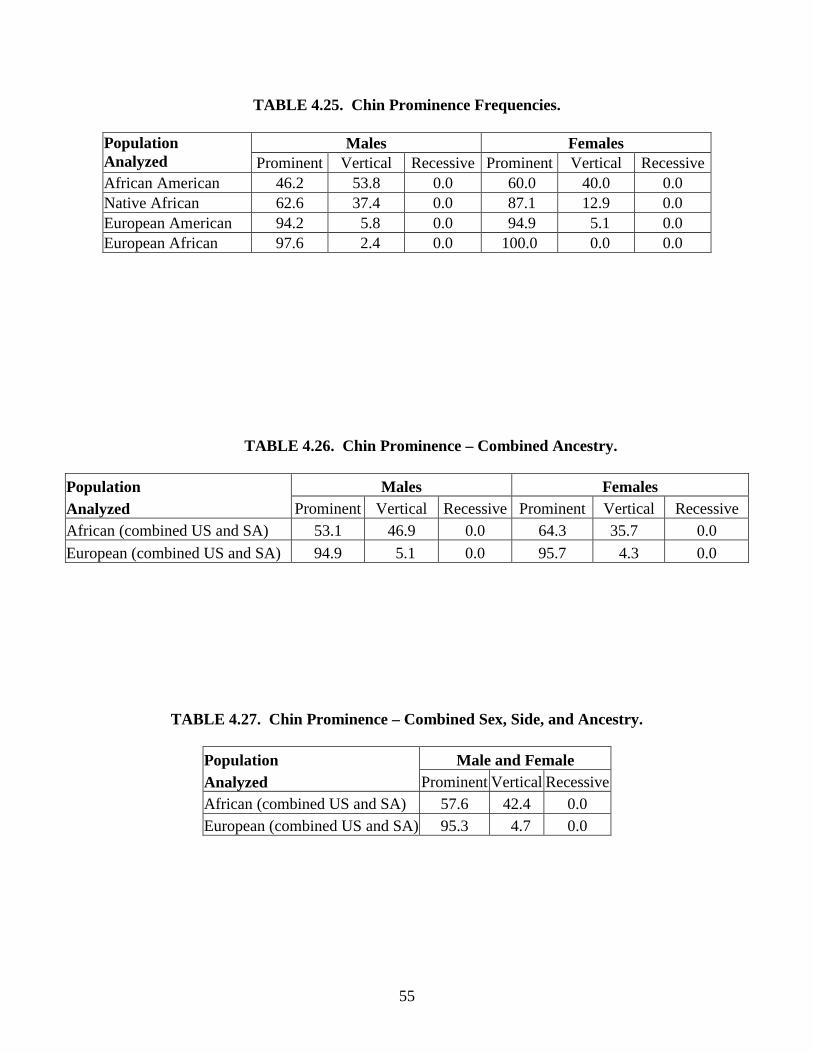
55
TABLE 4.25. Chin Prominence Frequencies.
Males Females Population Analyzed Prominent Vertical Recessive Prominent Vertical RecessiveAfrican American 46.2 53.8 0.0 60.0 40.0 0.0 Native African 62.6 37.4 0.0 87.1 12.9 0.0 European American 94.2 5.8 0.0 94.9 5.1 0.0 European African 97.6 2.4 0.0 100.0 0.0 0.0
TABLE 4.26. Chin Prominence – Combined Ancestry.
Population Males Females Analyzed Prominent Vertical Recessive Prominent Vertical Recessive African (combined US and SA) 53.1 46.9 0.0 64.3 35.7 0.0 European (combined US and SA) 94.9 5.1 0.0 95.7 4.3 0.0
TABLE 4.27. Chin Prominence – Combined Sex, Side, and Ancestry.
Population Male and Female Analyzed Prominent Vertical Recessive African (combined US and SA) 57.6 42.4 0.0 European (combined US and SA) 95.3 4.7 0.0
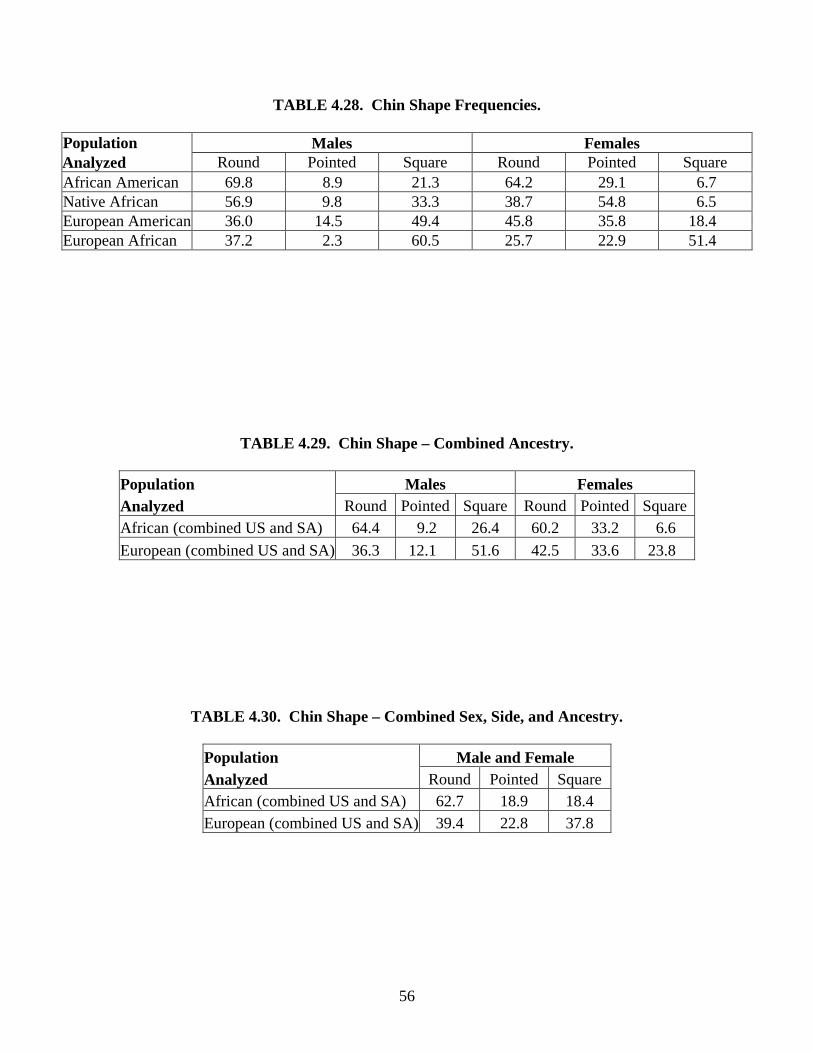
56
TABLE 4.28. Chin Shape Frequencies.
Population Males Females Analyzed Round Pointed Square Round Pointed Square African American 69.8 8.9 21.3 64.2 29.1 6.7 Native African 56.9 9.8 33.3 38.7 54.8 6.5 European American 36.0 14.5 49.4 45.8 35.8 18.4 European African 37.2 2.3 60.5 25.7 22.9 51.4
TABLE 4.29. Chin Shape – Combined Ancestry. Population Males Females Analyzed Round Pointed Square Round Pointed SquareAfrican (combined US and SA) 64.4 9.2 26.4 60.2 33.2 6.6 European (combined US and SA) 36.3 12.1 51.6 42.5 33.6 23.8
TABLE 4.30. Chin Shape – Combined Sex, Side, and Ancestry.
Population Male and Female Analyzed Round Pointed Square African (combined US and SA) 62.7 18.9 18.4 European (combined US and SA) 39.4 22.8 37.8
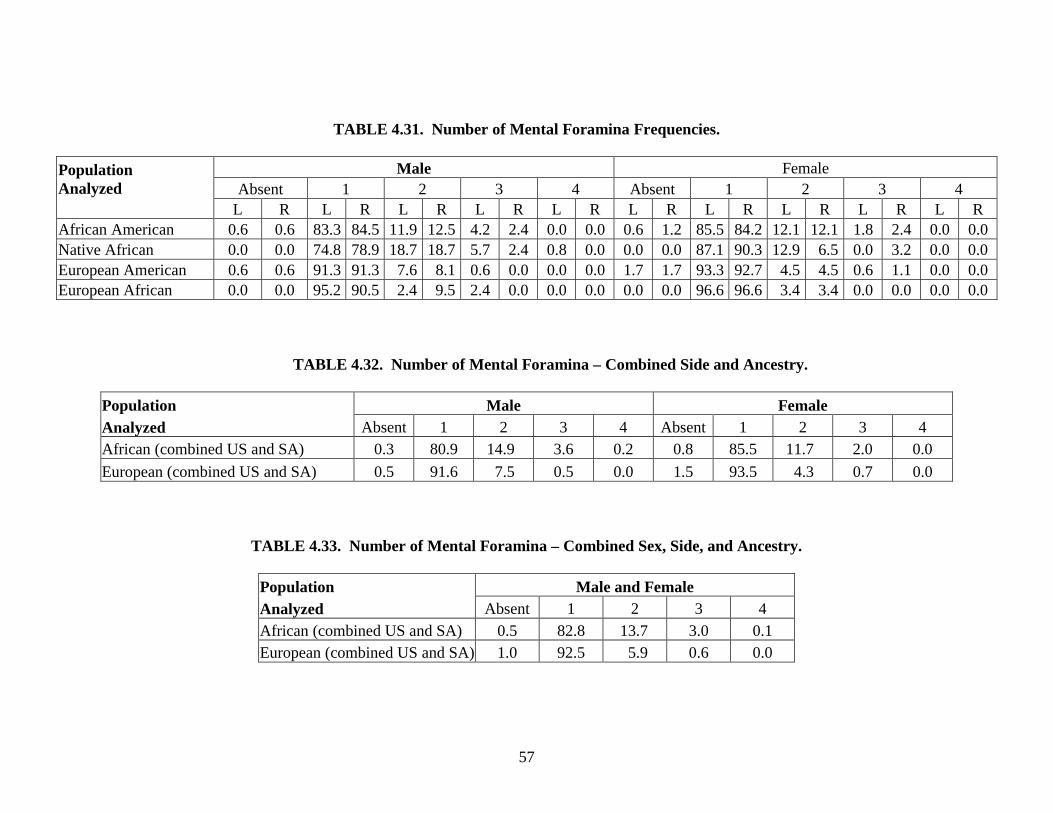
57
TABLE 4.31. Number of Mental Foramina Frequencies.
Male Female Absent 1 2 3 4 Absent 1 2 3 4
Population Analyzed L R L R L R L R L R L R L R L R L R L R African American 0.6 0.6 83.3 84.5 11.9 12.5 4.2 2.4 0.0 0.0 0.6 1.2 85.5 84.2 12.1 12.1 1.8 2.4 0.0 0.0 Native African 0.0 0.0 74.8 78.9 18.7 18.7 5.7 2.4 0.8 0.0 0.0 0.0 87.1 90.3 12.9 6.5 0.0 3.2 0.0 0.0 European American 0.6 0.6 91.3 91.3 7.6 8.1 0.6 0.0 0.0 0.0 1.7 1.7 93.3 92.7 4.5 4.5 0.6 1.1 0.0 0.0 European African 0.0 0.0 95.2 90.5 2.4 9.5 2.4 0.0 0.0 0.0 0.0 0.0 96.6 96.6 3.4 3.4 0.0 0.0 0.0 0.0
TABLE 4.32. Number of Mental Foramina – Combined Side and Ancestry.
Population Male Female Analyzed Absent 1 2 3 4 Absent 1 2 3 4 African (combined US and SA) 0.3 80.9 14.9 3.6 0.2 0.8 85.5 11.7 2.0 0.0 European (combined US and SA) 0.5 91.6 7.5 0.5 0.0 1.5 93.5 4.3 0.7 0.0
TABLE 4.33. Number of Mental Foramina – Combined Sex, Side, and Ancestry.
Population Male and Female Analyzed Absent 1 2 3 4 African (combined US and SA) 0.5 82.8 13.7 3.0 0.1 European (combined US and SA) 1.0 92.5 5.9 0.6 0.0
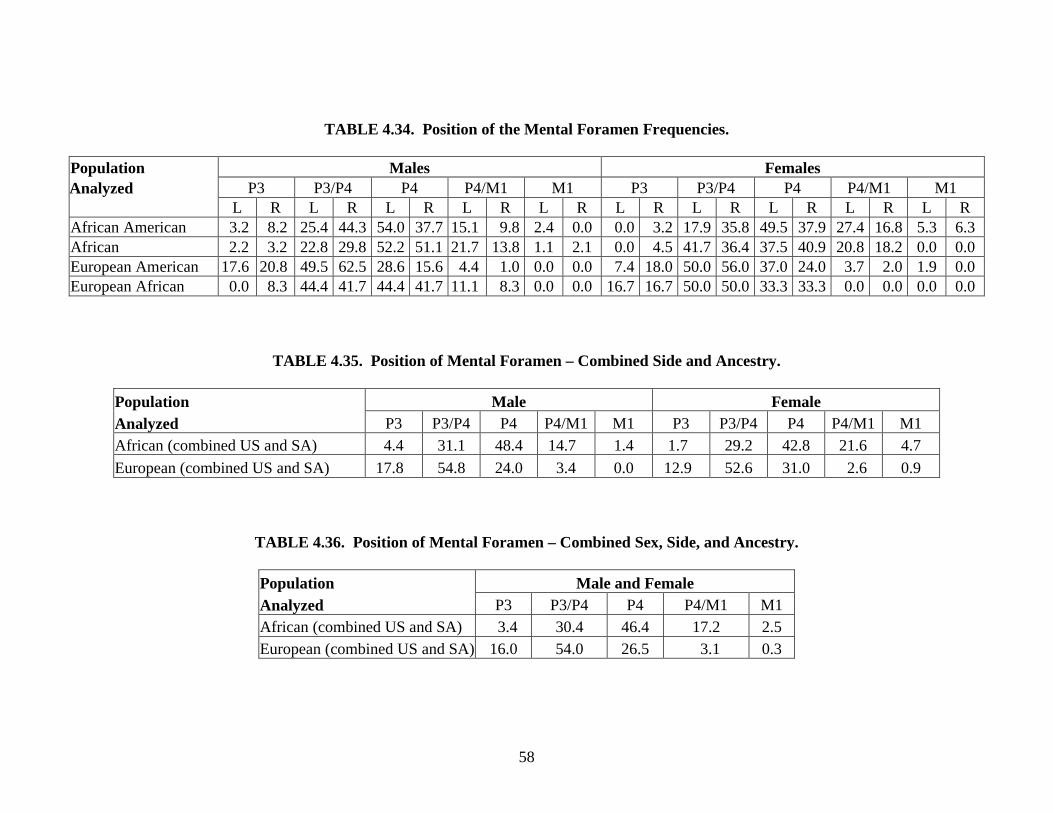
58
TABLE 4.34. Position of the Mental Foramen Frequencies.
Population Males Females Analyzed P3 P3/P4 P4 P4/M1 M1 P3 P3/P4 P4 P4/M1 M1 L R L R L R L R L R L R L R L R L R L R African American 3.2 8.2 25.4 44.3 54.0 37.7 15.1 9.8 2.4 0.0 0.0 3.2 17.9 35.8 49.5 37.9 27.4 16.8 5.3 6.3 African 2.2 3.2 22.8 29.8 52.2 51.1 21.7 13.8 1.1 2.1 0.0 4.5 41.7 36.4 37.5 40.9 20.8 18.2 0.0 0.0 European American 17.6 20.8 49.5 62.5 28.6 15.6 4.4 1.0 0.0 0.0 7.4 18.0 50.0 56.0 37.0 24.0 3.7 2.0 1.9 0.0 European African 0.0 8.3 44.4 41.7 44.4 41.7 11.1 8.3 0.0 0.0 16.7 16.7 50.0 50.0 33.3 33.3 0.0 0.0 0.0 0.0
TABLE 4.35. Position of Mental Foramen – Combined Side and Ancestry.
Population Male Female Analyzed P3 P3/P4 P4 P4/M1 M1 P3 P3/P4 P4 P4/M1 M1 African (combined US and SA) 4.4 31.1 48.4 14.7 1.4 1.7 29.2 42.8 21.6 4.7 European (combined US and SA) 17.8 54.8 24.0 3.4 0.0 12.9 52.6 31.0 2.6 0.9
TABLE 4.36. Position of Mental Foramen – Combined Sex, Side, and Ancestry.
Population Male and Female Analyzed P3 P3/P4 P4 P4/M1 M1 African (combined US and SA) 3.4 30.4 46.4 17.2 2.5 European (combined US and SA) 16.0 54.0 26.5 3.1 0.3
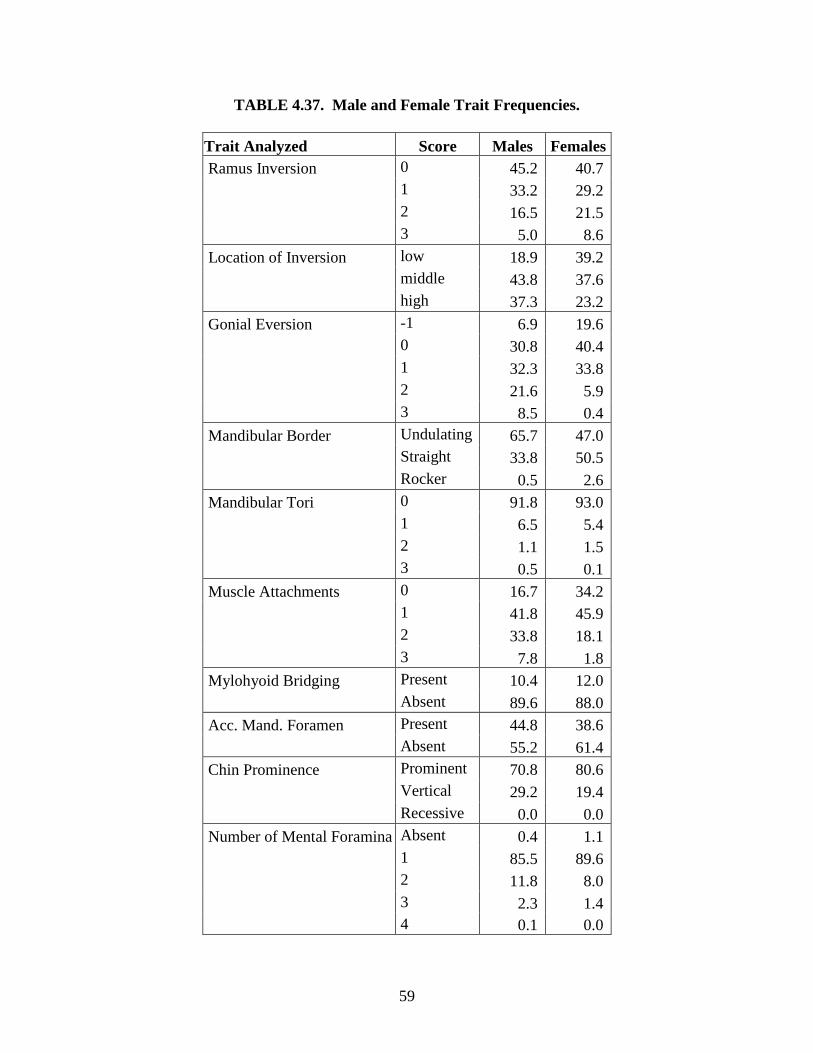
59
TABLE 4.37. Male and Female Trait Frequencies.
Trait Analyzed Score Males Females Ramus Inversion 0 45.2 40.7 1 33.2 29.2 2 16.5 21.5 3 5.0 8.6 Location of Inversion low 18.9 39.2 middle 43.8 37.6 high 37.3 23.2 Gonial Eversion -1 6.9 19.6 0 30.8 40.4 1 32.3 33.8 2 21.6 5.9 3 8.5 0.4 Mandibular Border Undulating 65.7 47.0 Straight 33.8 50.5 Rocker 0.5 2.6 Mandibular Tori 0 91.8 93.0 1 6.5 5.4 2 1.1 1.5 3 0.5 0.1 Muscle Attachments 0 16.7 34.2 1 41.8 45.9 2 33.8 18.1 3 7.8 1.8 Mylohyoid Bridging Present 10.4 12.0 Absent 89.6 88.0 Acc. Mand. Foramen Present 44.8 38.6 Absent 55.2 61.4 Chin Prominence Prominent 70.8 80.6 Vertical 29.2 19.4 Recessive 0.0 0.0 Number of Mental Foramina Absent 0.4 1.1 1 85.5 89.6 2 11.8 8.0 3 2.3 1.4 4 0.1 0.0
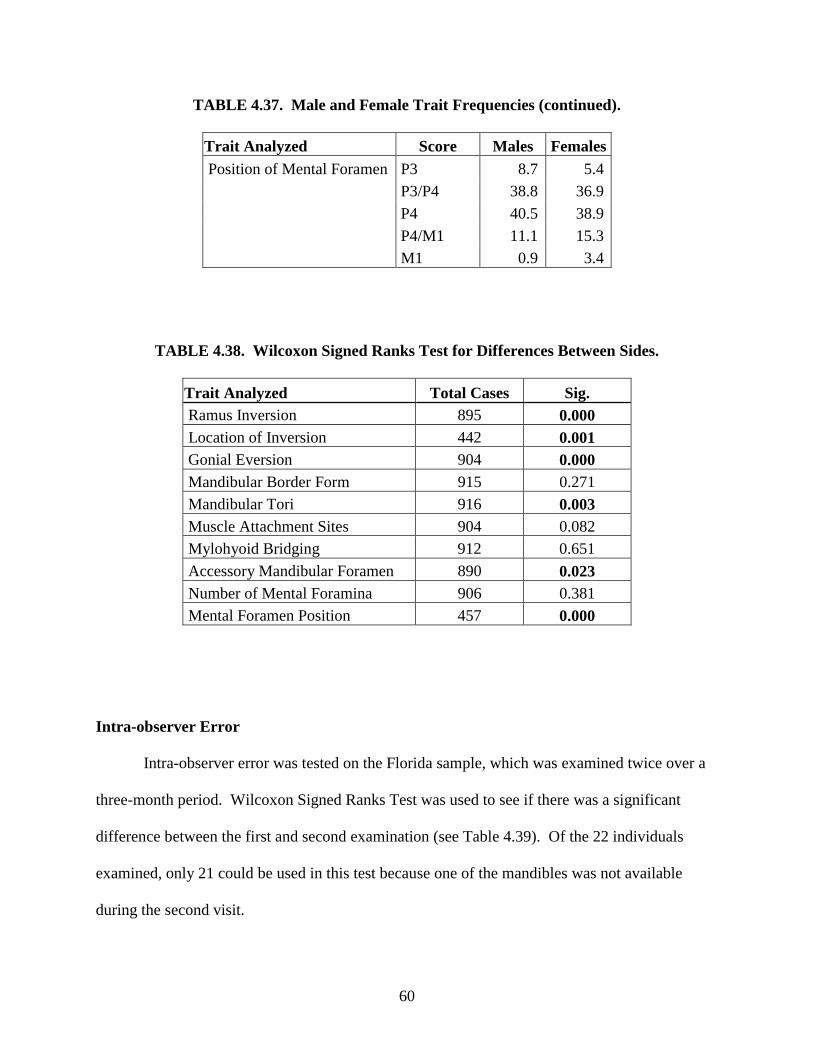
60
TABLE 4.37. Male and Female Trait Frequencies (continued).
Trait Analyzed Score Males Females Position of Mental Foramen P3 8.7 5.4 P3/P4 38.8 36.9 P4 40.5 38.9 P4/M1 11.1 15.3 M1 0.9 3.4
TABLE 4.38. Wilcoxon Signed Ranks Test for Differences Between Sides.
Trait Analyzed Total Cases Sig. Ramus Inversion 895 0.000 Location of Inversion 442 0.001 Gonial Eversion 904 0.000 Mandibular Border Form 915 0.271 Mandibular Tori 916 0.003 Muscle Attachment Sites 904 0.082 Mylohyoid Bridging 912 0.651 Accessory Mandibular Foramen 890 0.023 Number of Mental Foramina 906 0.381 Mental Foramen Position 457 0.000
Intra-observer Error
Intra-observer error was tested on the Florida sample, which was examined twice over a
three-month period. Wilcoxon Signed Ranks Test was used to see if there was a significant
difference between the first and second examination (see Table 4.39). Of the 22 individuals
examined, only 21 could be used in this test because one of the mandibles was not available
during the second visit.
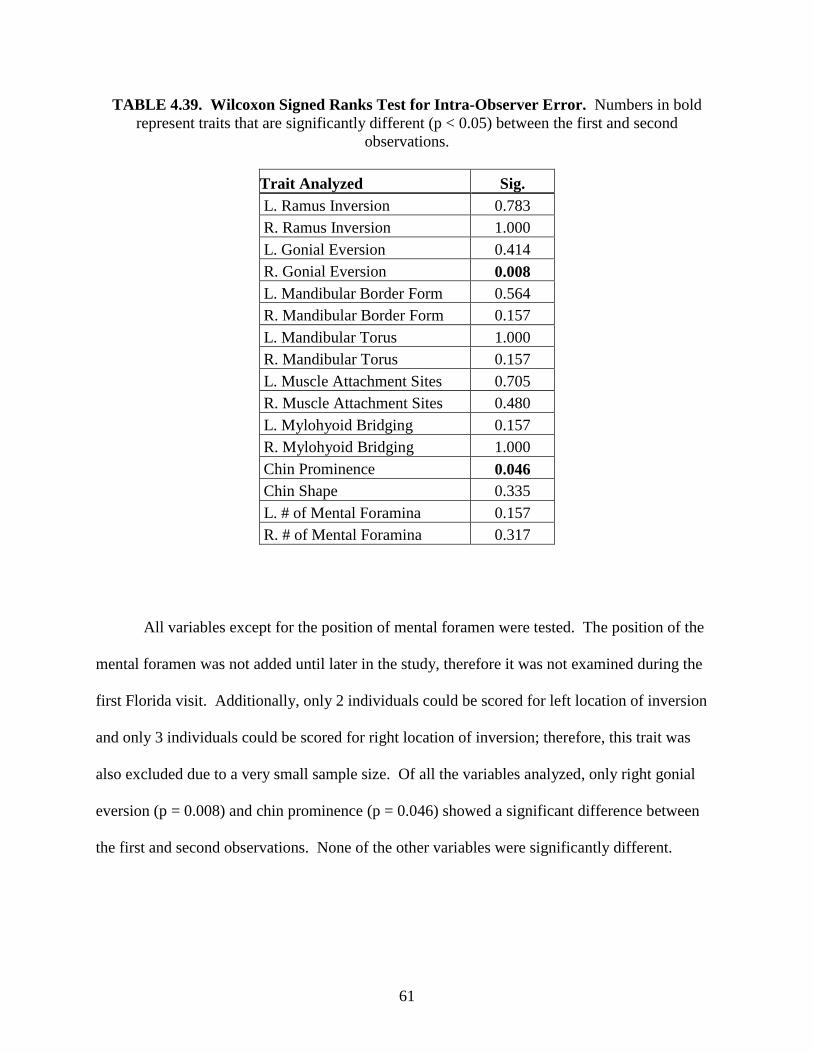
61
TABLE 4.39. Wilcoxon Signed Ranks Test for Intra-Observer Error. Numbers in bold represent traits that are significantly different (p < 0.05) between the first and second
observations.
Trait Analyzed Sig. L. Ramus Inversion 0.783 R. Ramus Inversion 1.000 L. Gonial Eversion 0.414 R. Gonial Eversion 0.008 L. Mandibular Border Form 0.564 R. Mandibular Border Form 0.157 L. Mandibular Torus 1.000 R. Mandibular Torus 0.157 L. Muscle Attachment Sites 0.705 R. Muscle Attachment Sites 0.480 L. Mylohyoid Bridging 0.157 R. Mylohyoid Bridging 1.000 Chin Prominence 0.046 Chin Shape 0.335 L. # of Mental Foramina 0.157 R. # of Mental Foramina 0.317
All variables except for the position of mental foramen were tested. The position of the
mental foramen was not added until later in the study, therefore it was not examined during the
first Florida visit. Additionally, only 2 individuals could be scored for left location of inversion
and only 3 individuals could be scored for right location of inversion; therefore, this trait was
also excluded due to a very small sample size. Of all the variables analyzed, only right gonial
eversion (p = 0.008) and chin prominence (p = 0.046) showed a significant difference between
the first and second observations. None of the other variables were significantly different.
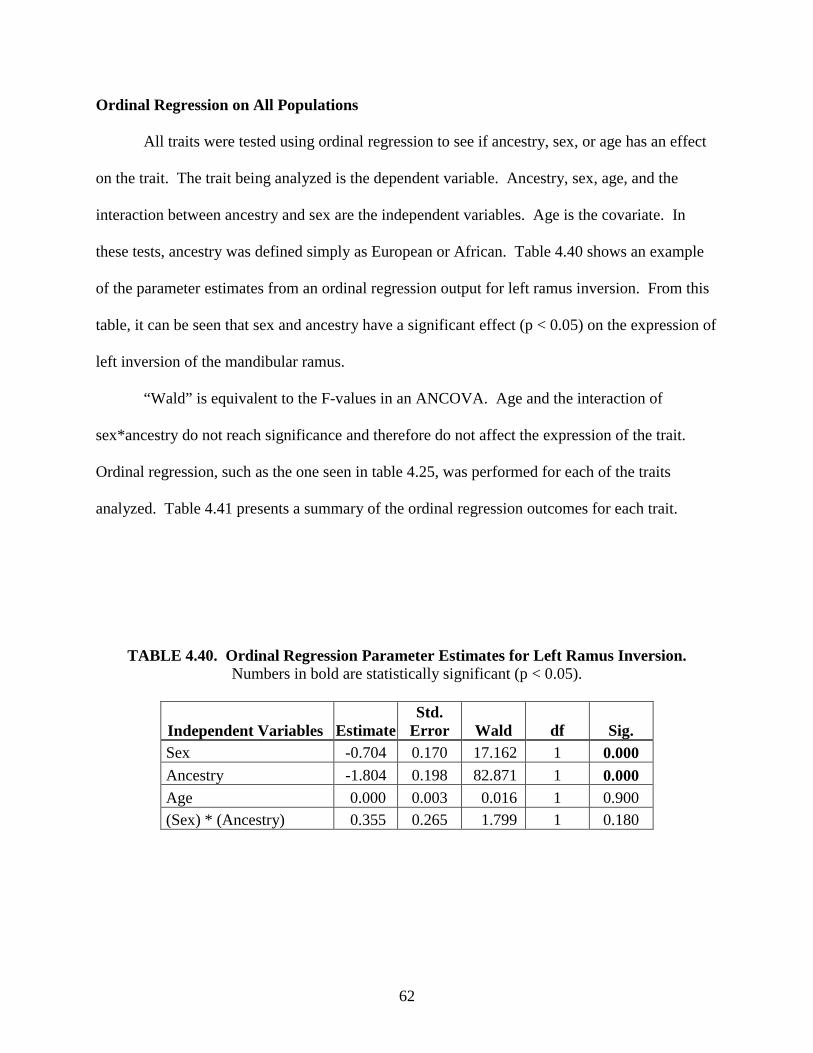
62
Ordinal Regression on All Populations
All traits were tested using ordinal regression to see if ancestry, sex, or age has an effect
on the trait. The trait being analyzed is the dependent variable. Ancestry, sex, age, and the
interaction between ancestry and sex are the independent variables. Age is the covariate. In
these tests, ancestry was defined simply as European or African. Table 4.40 shows an example
of the parameter estimates from an ordinal regression output for left ramus inversion. From this
table, it can be seen that sex and ancestry have a significant effect (p < 0.05) on the expression of
left inversion of the mandibular ramus.
“Wald” is equivalent to the F-values in an ANCOVA. Age and the interaction of
sex*ancestry do not reach significance and therefore do not affect the expression of the trait.
Ordinal regression, such as the one seen in table 4.25, was performed for each of the traits
analyzed. Table 4.41 presents a summary of the ordinal regression outcomes for each trait.
TABLE 4.40. Ordinal Regression Parameter Estimates for Left Ramus Inversion. Numbers in bold are statistically significant (p < 0.05).
Independent Variables EstimateStd.
Error Wald df Sig. Sex -0.704 0.170 17.162 1 0.000 Ancestry -1.804 0.198 82.871 1 0.000 Age 0.000 0.003 0.016 1 0.900 (Sex) * (Ancestry) 0.355 0.265 1.799 1 0.180
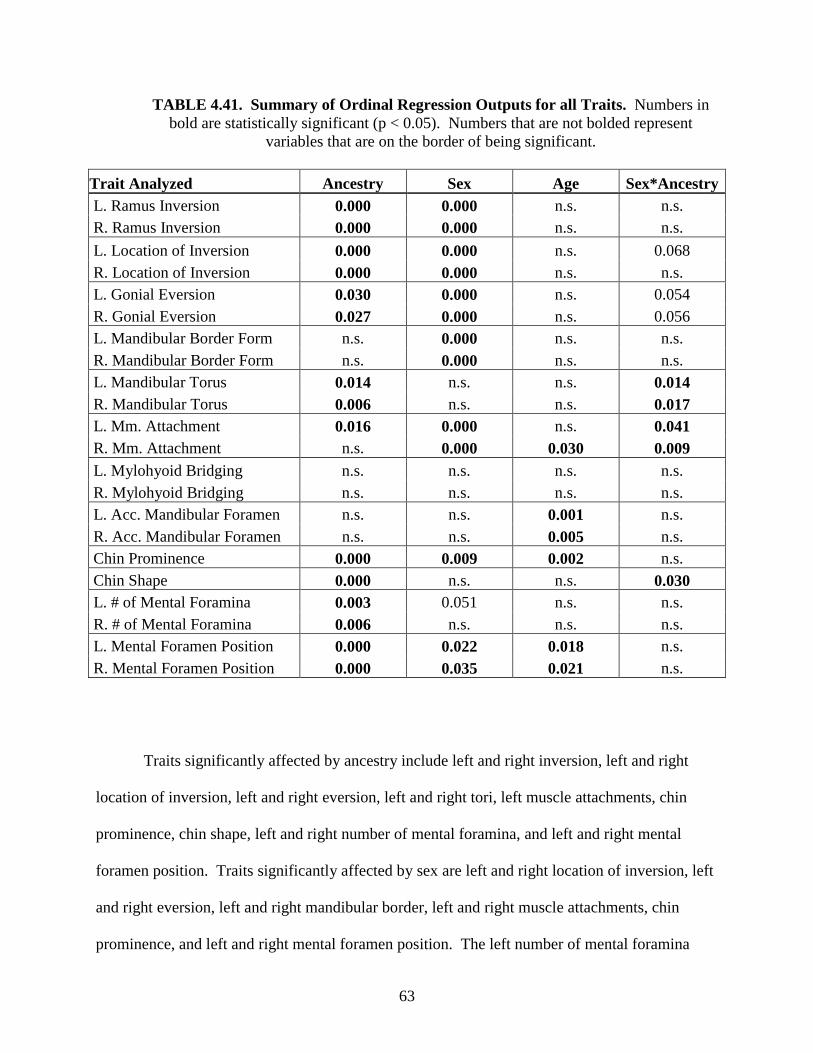
63
TABLE 4.41. Summary of Ordinal Regression Outputs for all Traits. Numbers in bold are statistically significant (p < 0.05). Numbers that are not bolded represent
variables that are on the border of being significant.
Trait Analyzed Ancestry Sex Age Sex*Ancestry L. Ramus Inversion 0.000 0.000 n.s. n.s. R. Ramus Inversion 0.000 0.000 n.s. n.s. L. Location of Inversion 0.000 0.000 n.s. 0.068 R. Location of Inversion 0.000 0.000 n.s. n.s. L. Gonial Eversion 0.030 0.000 n.s. 0.054 R. Gonial Eversion 0.027 0.000 n.s. 0.056 L. Mandibular Border Form n.s. 0.000 n.s. n.s. R. Mandibular Border Form n.s. 0.000 n.s. n.s. L. Mandibular Torus 0.014 n.s. n.s. 0.014 R. Mandibular Torus 0.006 n.s. n.s. 0.017 L. Mm. Attachment 0.016 0.000 n.s. 0.041 R. Mm. Attachment n.s. 0.000 0.030 0.009 L. Mylohyoid Bridging n.s. n.s. n.s. n.s. R. Mylohyoid Bridging n.s. n.s. n.s. n.s. L. Acc. Mandibular Foramen n.s. n.s. 0.001 n.s. R. Acc. Mandibular Foramen n.s. n.s. 0.005 n.s. Chin Prominence 0.000 0.009 0.002 n.s. Chin Shape 0.000 n.s. n.s. 0.030 L. # of Mental Foramina 0.003 0.051 n.s. n.s. R. # of Mental Foramina 0.006 n.s. n.s. n.s. L. Mental Foramen Position 0.000 0.022 0.018 n.s. R. Mental Foramen Position 0.000 0.035 0.021 n.s.
Traits significantly affected by ancestry include left and right inversion, left and right
location of inversion, left and right eversion, left and right tori, left muscle attachments, chin
prominence, chin shape, left and right number of mental foramina, and left and right mental
foramen position. Traits significantly affected by sex are left and right location of inversion, left
and right eversion, left and right mandibular border, left and right muscle attachments, chin
prominence, and left and right mental foramen position. The left number of mental foramina
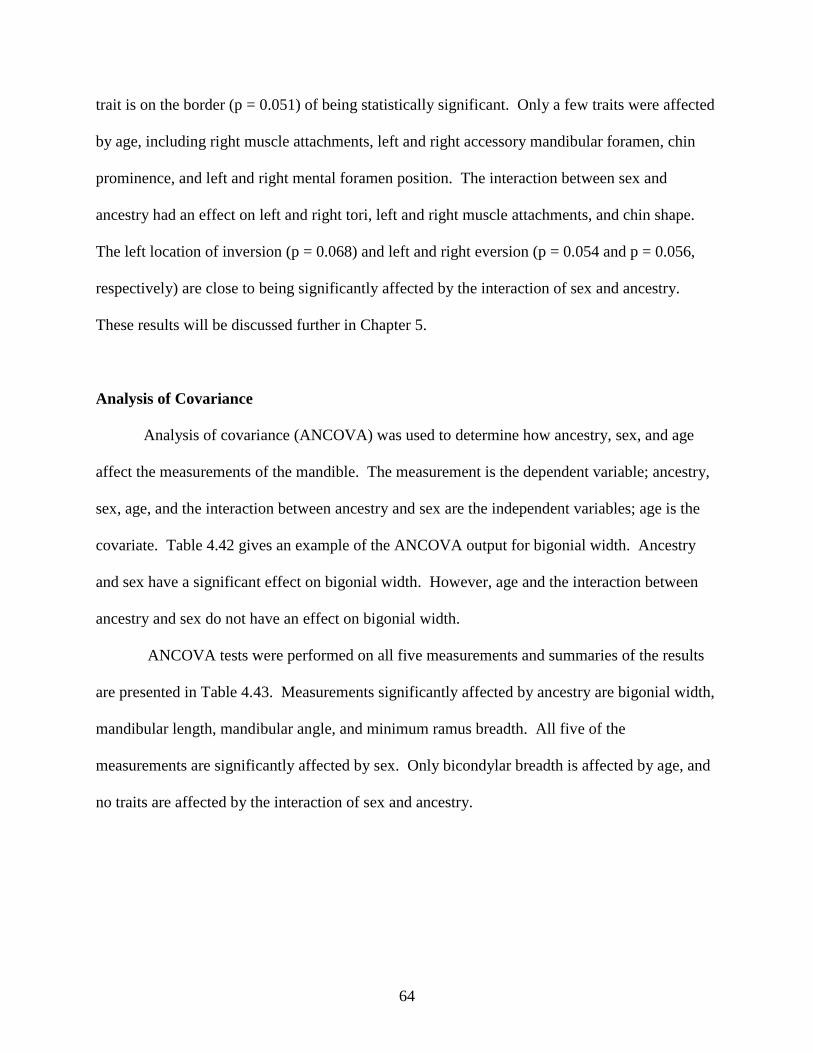
64
trait is on the border (p = 0.051) of being statistically significant. Only a few traits were affected
by age, including right muscle attachments, left and right accessory mandibular foramen, chin
prominence, and left and right mental foramen position. The interaction between sex and
ancestry had an effect on left and right tori, left and right muscle attachments, and chin shape.
The left location of inversion (p = 0.068) and left and right eversion (p = 0.054 and p = 0.056,
respectively) are close to being significantly affected by the interaction of sex and ancestry.
These results will be discussed further in Chapter 5.
Analysis of Covariance
Analysis of covariance (ANCOVA) was used to determine how ancestry, sex, and age
affect the measurements of the mandible. The measurement is the dependent variable; ancestry,
sex, age, and the interaction between ancestry and sex are the independent variables; age is the
covariate. Table 4.42 gives an example of the ANCOVA output for bigonial width. Ancestry
and sex have a significant effect on bigonial width. However, age and the interaction between
ancestry and sex do not have an effect on bigonial width.
ANCOVA tests were performed on all five measurements and summaries of the results
are presented in Table 4.43. Measurements significantly affected by ancestry are bigonial width,
mandibular length, mandibular angle, and minimum ramus breadth. All five of the
measurements are significantly affected by sex. Only bicondylar breadth is affected by age, and
no traits are affected by the interaction of sex and ancestry.
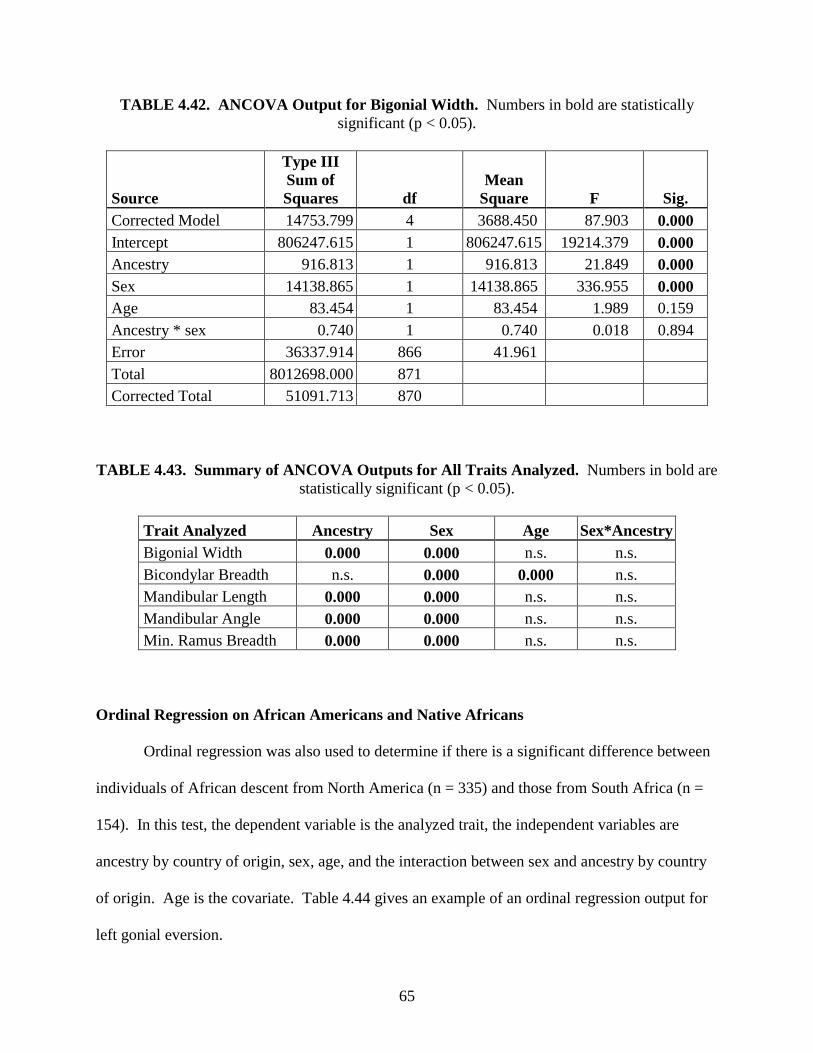
65
TABLE 4.42. ANCOVA Output for Bigonial Width. Numbers in bold are statistically significant (p < 0.05).
Source
Type III Sum of Squares df
Mean Square F Sig.
Corrected Model 14753.799 4 3688.450 87.903 0.000 Intercept 806247.615 1 806247.615 19214.379 0.000 Ancestry 916.813 1 916.813 21.849 0.000 Sex 14138.865 1 14138.865 336.955 0.000 Age 83.454 1 83.454 1.989 0.159 Ancestry * sex 0.740 1 0.740 0.018 0.894 Error 36337.914 866 41.961 Total 8012698.000 871 Corrected Total 51091.713 870
TABLE 4.43. Summary of ANCOVA Outputs for All Traits Analyzed. Numbers in bold are
statistically significant (p < 0.05).
Trait Analyzed Ancestry Sex Age Sex*Ancestry Bigonial Width 0.000 0.000 n.s. n.s. Bicondylar Breadth n.s. 0.000 0.000 n.s. Mandibular Length 0.000 0.000 n.s. n.s. Mandibular Angle 0.000 0.000 n.s. n.s. Min. Ramus Breadth 0.000 0.000 n.s. n.s.
Ordinal Regression on African Americans and Native Africans
Ordinal regression was also used to determine if there is a significant difference between
individuals of African descent from North America (n = 335) and those from South Africa (n =
154). In this test, the dependent variable is the analyzed trait, the independent variables are
ancestry by country of origin, sex, age, and the interaction between sex and ancestry by country
of origin. Age is the covariate. Table 4.44 gives an example of an ordinal regression output for
left gonial eversion.
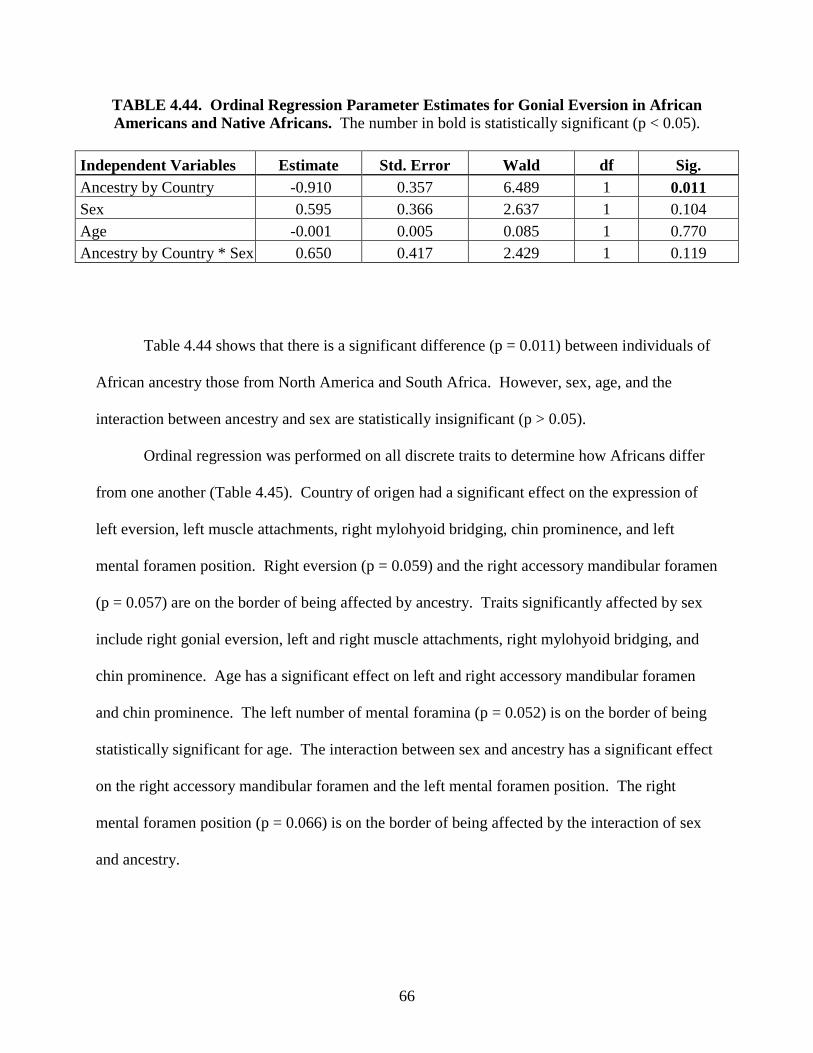
66
TABLE 4.44. Ordinal Regression Parameter Estimates for Gonial Eversion in African Americans and Native Africans. The number in bold is statistically significant (p < 0.05).
Independent Variables Estimate Std. Error Wald df Sig. Ancestry by Country -0.910 0.357 6.489 1 0.011 Sex 0.595 0.366 2.637 1 0.104 Age -0.001 0.005 0.085 1 0.770 Ancestry by Country * Sex 0.650 0.417 2.429 1 0.119
Table 4.44 shows that there is a significant difference (p = 0.011) between individuals of
African ancestry those from North America and South Africa. However, sex, age, and the
interaction between ancestry and sex are statistically insignificant (p > 0.05).
Ordinal regression was performed on all discrete traits to determine how Africans differ
from one another (Table 4.45). Country of origen had a significant effect on the expression of
left eversion, left muscle attachments, right mylohyoid bridging, chin prominence, and left
mental foramen position. Right eversion (p = 0.059) and the right accessory mandibular foramen
(p = 0.057) are on the border of being affected by ancestry. Traits significantly affected by sex
include right gonial eversion, left and right muscle attachments, right mylohyoid bridging, and
chin prominence. Age has a significant effect on left and right accessory mandibular foramen
and chin prominence. The left number of mental foramina (p = 0.052) is on the border of being
statistically significant for age. The interaction between sex and ancestry has a significant effect
on the right accessory mandibular foramen and the left mental foramen position. The right
mental foramen position (p = 0.066) is on the border of being affected by the interaction of sex
and ancestry.
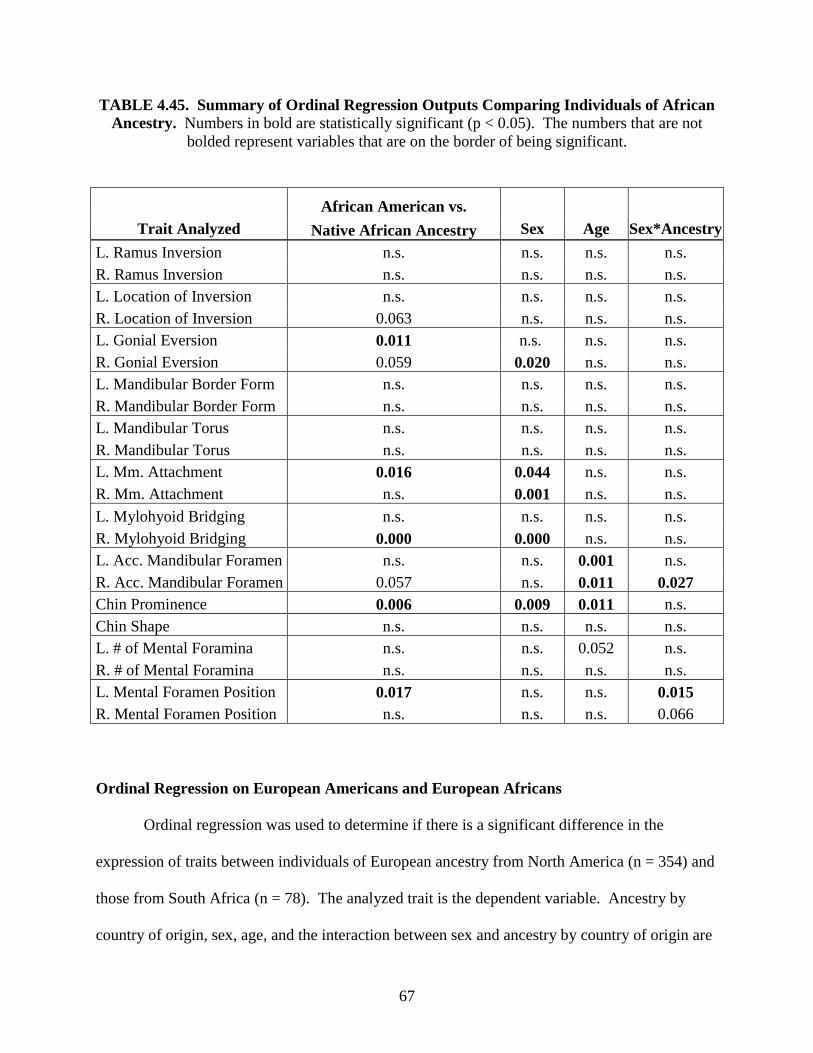
67
TABLE 4.45. Summary of Ordinal Regression Outputs Comparing Individuals of African Ancestry. Numbers in bold are statistically significant (p < 0.05). The numbers that are not
bolded represent variables that are on the border of being significant.
African American vs. Trait Analyzed Native African Ancestry Sex Age Sex*Ancestry
L. Ramus Inversion n.s. n.s. n.s. n.s. R. Ramus Inversion n.s. n.s. n.s. n.s. L. Location of Inversion n.s. n.s. n.s. n.s. R. Location of Inversion 0.063 n.s. n.s. n.s. L. Gonial Eversion 0.011 n.s. n.s. n.s. R. Gonial Eversion 0.059 0.020 n.s. n.s. L. Mandibular Border Form n.s. n.s. n.s. n.s. R. Mandibular Border Form n.s. n.s. n.s. n.s. L. Mandibular Torus n.s. n.s. n.s. n.s. R. Mandibular Torus n.s. n.s. n.s. n.s. L. Mm. Attachment 0.016 0.044 n.s. n.s. R. Mm. Attachment n.s. 0.001 n.s. n.s. L. Mylohyoid Bridging n.s. n.s. n.s. n.s. R. Mylohyoid Bridging 0.000 0.000 n.s. n.s. L. Acc. Mandibular Foramen n.s. n.s. 0.001 n.s. R. Acc. Mandibular Foramen 0.057 n.s. 0.011 0.027 Chin Prominence 0.006 0.009 0.011 n.s. Chin Shape n.s. n.s. n.s. n.s. L. # of Mental Foramina n.s. n.s. 0.052 n.s. R. # of Mental Foramina n.s. n.s. n.s. n.s. L. Mental Foramen Position 0.017 n.s. n.s. 0.015 R. Mental Foramen Position n.s. n.s. n.s. 0.066
Ordinal Regression on European Americans and European Africans
Ordinal regression was used to determine if there is a significant difference in the
expression of traits between individuals of European ancestry from North America (n = 354) and
those from South Africa (n = 78). The analyzed trait is the dependent variable. Ancestry by
country of origin, sex, age, and the interaction between sex and ancestry by country of origin are
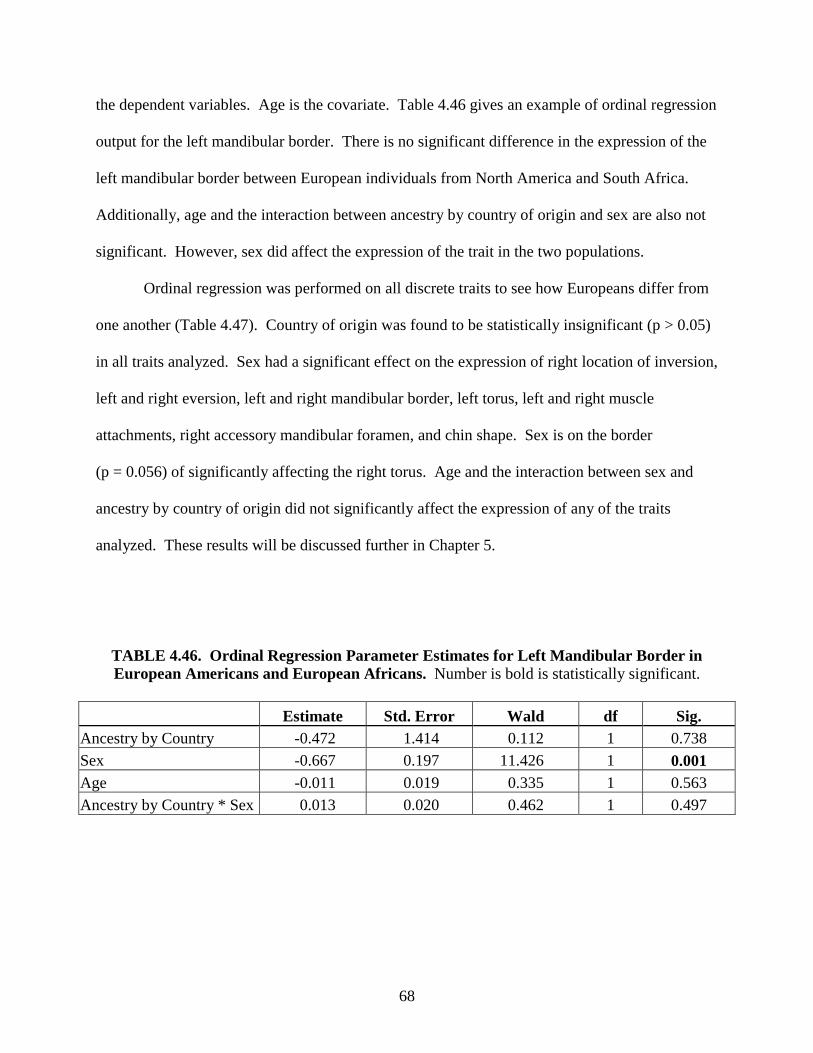
68
the dependent variables. Age is the covariate. Table 4.46 gives an example of ordinal regression
output for the left mandibular border. There is no significant difference in the expression of the
left mandibular border between European individuals from North America and South Africa.
Additionally, age and the interaction between ancestry by country of origin and sex are also not
significant. However, sex did affect the expression of the trait in the two populations.
Ordinal regression was performed on all discrete traits to see how Europeans differ from
one another (Table 4.47). Country of origin was found to be statistically insignificant (p > 0.05)
in all traits analyzed. Sex had a significant effect on the expression of right location of inversion,
left and right eversion, left and right mandibular border, left torus, left and right muscle
attachments, right accessory mandibular foramen, and chin shape. Sex is on the border
(p = 0.056) of significantly affecting the right torus. Age and the interaction between sex and
ancestry by country of origin did not significantly affect the expression of any of the traits
analyzed. These results will be discussed further in Chapter 5.
TABLE 4.46. Ordinal Regression Parameter Estimates for Left Mandibular Border in European Americans and European Africans. Number is bold is statistically significant.
Estimate Std. Error Wald df Sig. Ancestry by Country -0.472 1.414 0.112 1 0.738 Sex -0.667 0.197 11.426 1 0.001 Age -0.011 0.019 0.335 1 0.563 Ancestry by Country * Sex 0.013 0.020 0.462 1 0.497
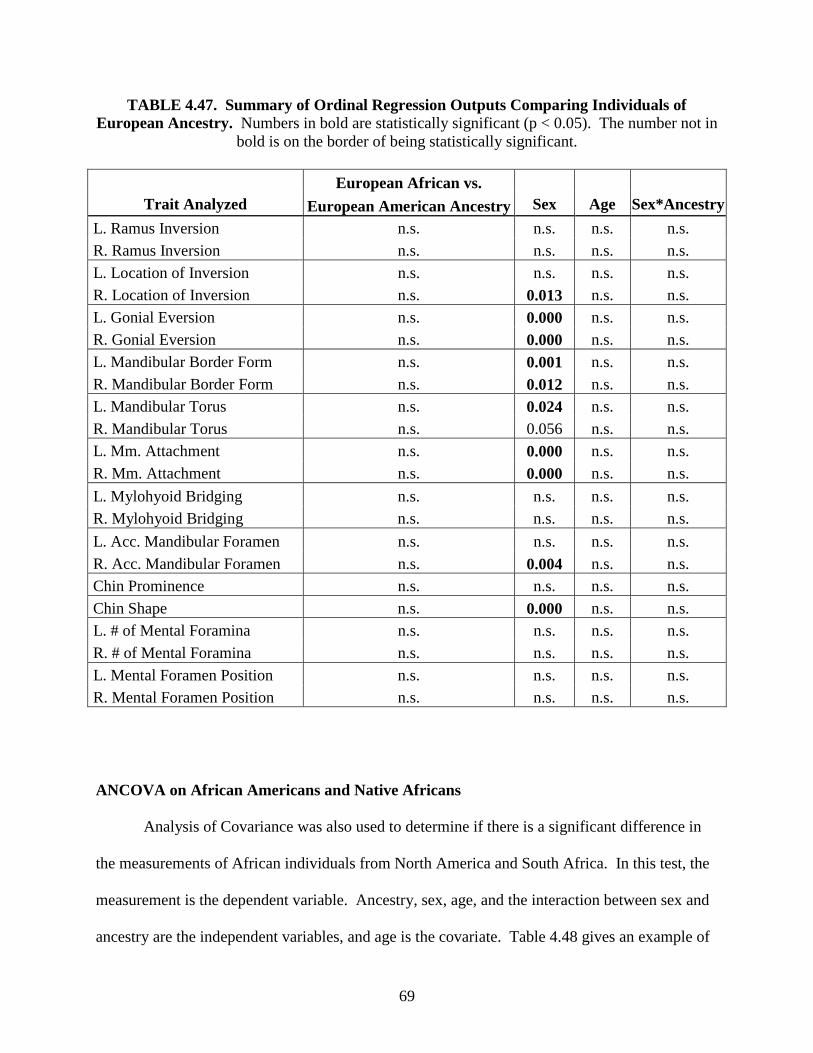
69
TABLE 4.47. Summary of Ordinal Regression Outputs Comparing Individuals of European Ancestry. Numbers in bold are statistically significant (p < 0.05). The number not in
bold is on the border of being statistically significant.
European African vs. Trait Analyzed European American Ancestry Sex Age Sex*Ancestry
L. Ramus Inversion n.s. n.s. n.s. n.s. R. Ramus Inversion n.s. n.s. n.s. n.s. L. Location of Inversion n.s. n.s. n.s. n.s. R. Location of Inversion n.s. 0.013 n.s. n.s. L. Gonial Eversion n.s. 0.000 n.s. n.s. R. Gonial Eversion n.s. 0.000 n.s. n.s. L. Mandibular Border Form n.s. 0.001 n.s. n.s. R. Mandibular Border Form n.s. 0.012 n.s. n.s. L. Mandibular Torus n.s. 0.024 n.s. n.s. R. Mandibular Torus n.s. 0.056 n.s. n.s. L. Mm. Attachment n.s. 0.000 n.s. n.s. R. Mm. Attachment n.s. 0.000 n.s. n.s. L. Mylohyoid Bridging n.s. n.s. n.s. n.s. R. Mylohyoid Bridging n.s. n.s. n.s. n.s. L. Acc. Mandibular Foramen n.s. n.s. n.s. n.s. R. Acc. Mandibular Foramen n.s. 0.004 n.s. n.s. Chin Prominence n.s. n.s. n.s. n.s. Chin Shape n.s. 0.000 n.s. n.s. L. # of Mental Foramina n.s. n.s. n.s. n.s. R. # of Mental Foramina n.s. n.s. n.s. n.s. L. Mental Foramen Position n.s. n.s. n.s. n.s. R. Mental Foramen Position n.s. n.s. n.s. n.s.
ANCOVA on African Americans and Native Africans
Analysis of Covariance was also used to determine if there is a significant difference in
the measurements of African individuals from North America and South Africa. In this test, the
measurement is the dependent variable. Ancestry, sex, age, and the interaction between sex and
ancestry are the independent variables, and age is the covariate. Table 4.48 gives an example of
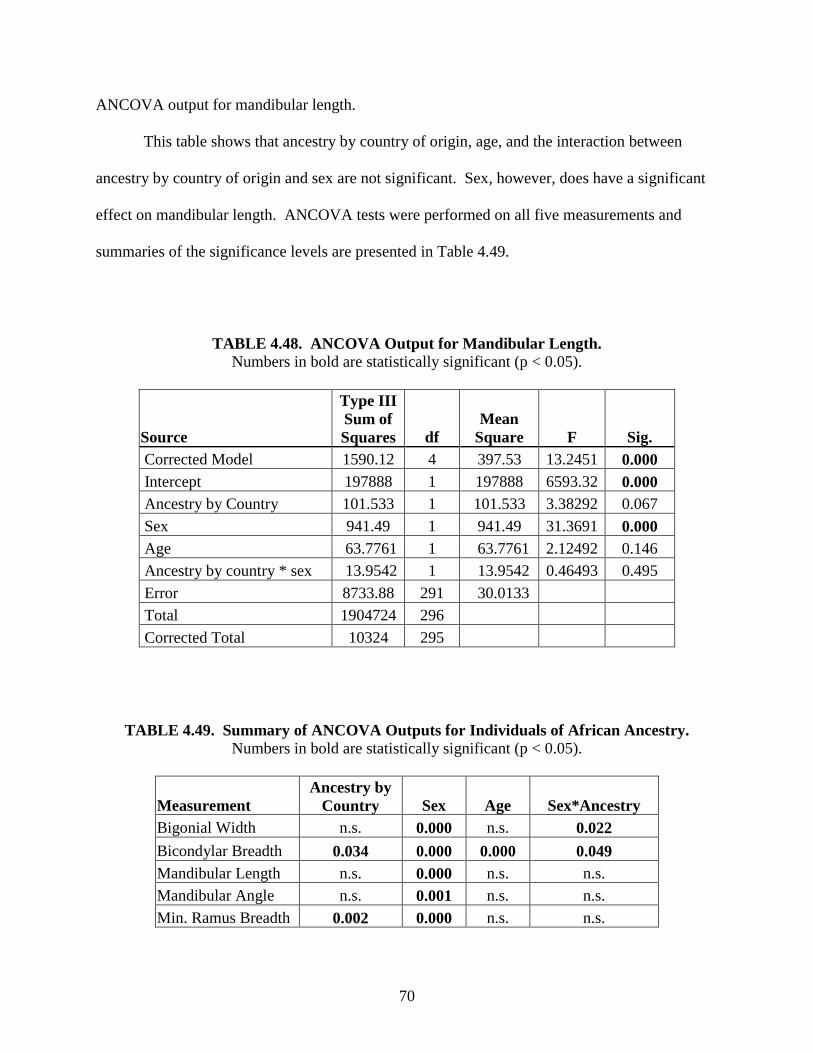
70
ANCOVA output for mandibular length.
This table shows that ancestry by country of origin, age, and the interaction between
ancestry by country of origin and sex are not significant. Sex, however, does have a significant
effect on mandibular length. ANCOVA tests were performed on all five measurements and
summaries of the significance levels are presented in Table 4.49.
TABLE 4.48. ANCOVA Output for Mandibular Length.
Numbers in bold are statistically significant (p < 0.05).
Source
Type III Sum of Squares df
Mean Square F Sig.
Corrected Model 1590.12 4 397.53 13.2451 0.000 Intercept 197888 1 197888 6593.32 0.000 Ancestry by Country 101.533 1 101.533 3.38292 0.067 Sex 941.49 1 941.49 31.3691 0.000 Age 63.7761 1 63.7761 2.12492 0.146 Ancestry by country * sex 13.9542 1 13.9542 0.46493 0.495 Error 8733.88 291 30.0133 Total 1904724 296 Corrected Total 10324 295
TABLE 4.49. Summary of ANCOVA Outputs for Individuals of African Ancestry. Numbers in bold are statistically significant (p < 0.05).
Measurement Ancestry by
Country Sex Age Sex*Ancestry Bigonial Width n.s. 0.000 n.s. 0.022 Bicondylar Breadth 0.034 0.000 0.000 0.049 Mandibular Length n.s. 0.000 n.s. n.s. Mandibular Angle n.s. 0.001 n.s. n.s. Min. Ramus Breadth 0.002 0.000 n.s. n.s.
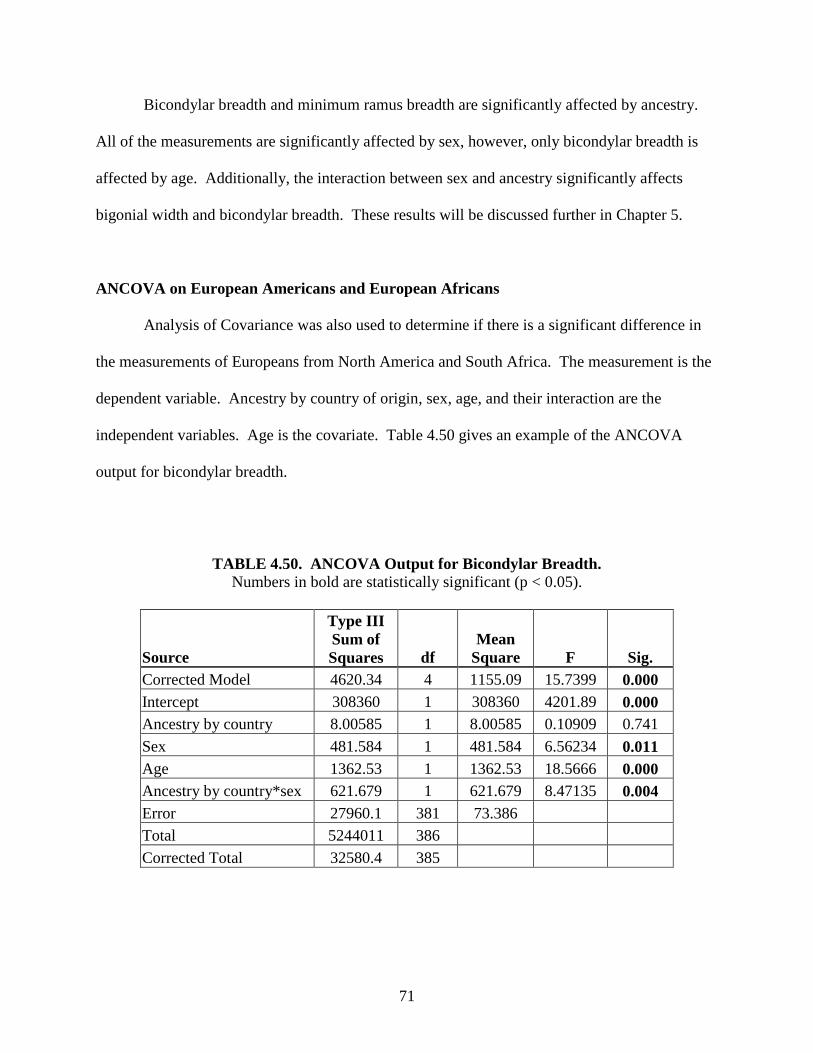
71
Bicondylar breadth and minimum ramus breadth are significantly affected by ancestry.
All of the measurements are significantly affected by sex, however, only bicondylar breadth is
affected by age. Additionally, the interaction between sex and ancestry significantly affects
bigonial width and bicondylar breadth. These results will be discussed further in Chapter 5.
ANCOVA on European Americans and European Africans
Analysis of Covariance was also used to determine if there is a significant difference in
the measurements of Europeans from North America and South Africa. The measurement is the
dependent variable. Ancestry by country of origin, sex, age, and their interaction are the
independent variables. Age is the covariate. Table 4.50 gives an example of the ANCOVA
output for bicondylar breadth.
TABLE 4.50. ANCOVA Output for Bicondylar Breadth.
Numbers in bold are statistically significant (p < 0.05).
Source
Type III Sum of Squares df
Mean Square F Sig.
Corrected Model 4620.34 4 1155.09 15.7399 0.000 Intercept 308360 1 308360 4201.89 0.000 Ancestry by country 8.00585 1 8.00585 0.10909 0.741 Sex 481.584 1 481.584 6.56234 0.011 Age 1362.53 1 1362.53 18.5666 0.000 Ancestry by country*sex 621.679 1 621.679 8.47135 0.004 Error 27960.1 381 73.386 Total 5244011 386 Corrected Total 32580.4 385
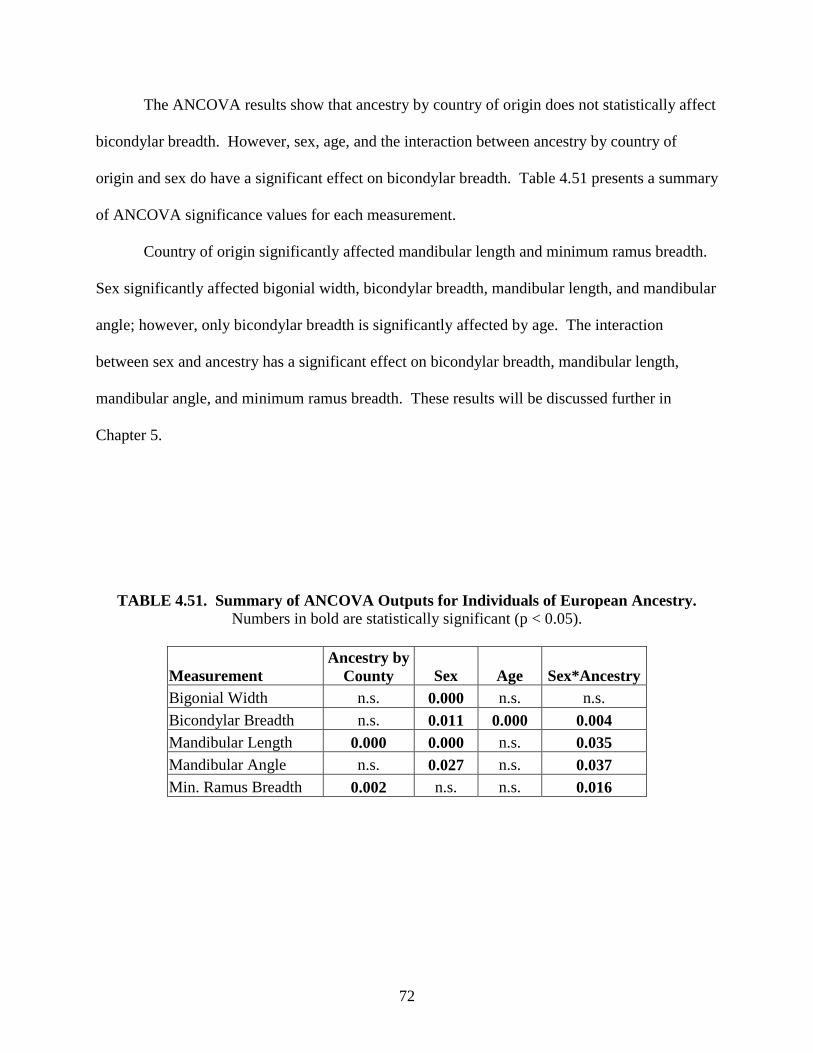
72
The ANCOVA results show that ancestry by country of origin does not statistically affect
bicondylar breadth. However, sex, age, and the interaction between ancestry by country of
origin and sex do have a significant effect on bicondylar breadth. Table 4.51 presents a summary
of ANCOVA significance values for each measurement.
Country of origin significantly affected mandibular length and minimum ramus breadth.
Sex significantly affected bigonial width, bicondylar breadth, mandibular length, and mandibular
angle; however, only bicondylar breadth is significantly affected by age. The interaction
between sex and ancestry has a significant effect on bicondylar breadth, mandibular length,
mandibular angle, and minimum ramus breadth. These results will be discussed further in
Chapter 5.
TABLE 4.51. Summary of ANCOVA Outputs for Individuals of European Ancestry. Numbers in bold are statistically significant (p < 0.05).
Measurement Ancestry by
County Sex Age Sex*Ancestry Bigonial Width n.s. 0.000 n.s. n.s. Bicondylar Breadth n.s. 0.011 0.000 0.004 Mandibular Length 0.000 0.000 n.s. 0.035 Mandibular Angle n.s. 0.027 n.s. 0.037 Min. Ramus Breadth 0.002 n.s. n.s. 0.016
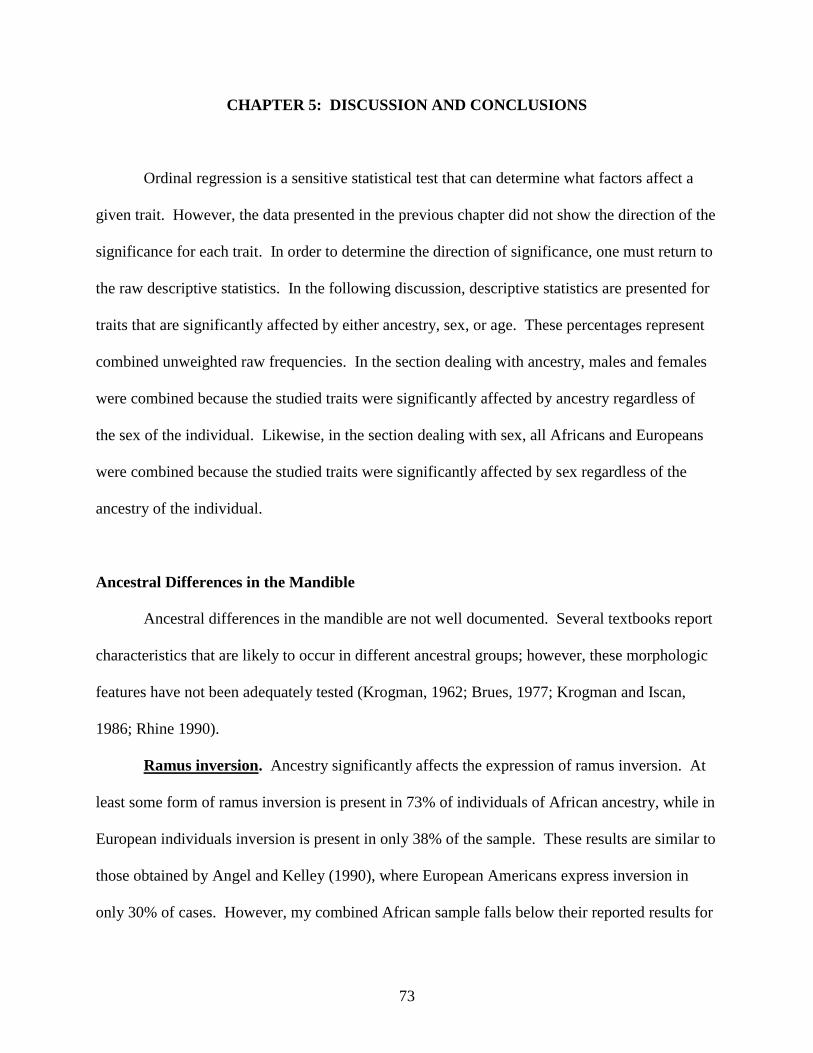
73
CHAPTER 5: DISCUSSION AND CONCLUSIONS
Ordinal regression is a sensitive statistical test that can determine what factors affect a
given trait. However, the data presented in the previous chapter did not show the direction of the
significance for each trait. In order to determine the direction of significance, one must return to
the raw descriptive statistics. In the following discussion, descriptive statistics are presented for
traits that are significantly affected by either ancestry, sex, or age. These percentages represent
combined unweighted raw frequencies. In the section dealing with ancestry, males and females
were combined because the studied traits were significantly affected by ancestry regardless of
the sex of the individual. Likewise, in the section dealing with sex, all Africans and Europeans
were combined because the studied traits were significantly affected by sex regardless of the
ancestry of the individual.
Ancestral Differences in the Mandible
Ancestral differences in the mandible are not well documented. Several textbooks report
characteristics that are likely to occur in different ancestral groups; however, these morphologic
features have not been adequately tested (Krogman, 1962; Brues, 1977; Krogman and Iscan,
1986; Rhine 1990).
Ramus inversion. Ancestry significantly affects the expression of ramus inversion. At
least some form of ramus inversion is present in 73% of individuals of African ancestry, while in
European individuals inversion is present in only 38% of the sample. These results are similar to
those obtained by Angel and Kelley (1990), where European Americans express inversion in
only 30% of cases. However, my combined African sample falls below their reported results for
74
African Americans (96%). From these data, we can surmise that if an individual has ramus
inversion, she is most likely of African descent.
Location of inversion. The location of ramus inversion is significantly affected by
ancestry. For those Europeans with inversion, most (45%) display inversion high on the
mandibular ramus. African descendents are more likely to show inversion in the middle of the
ramus (41%). Therefore, if a European mandible does display inversion, the higher location of
that inversion may help to prevent its accidental classification as African.
Gonial eversion. Gonial eversion displays significant ancestral variation. Inversion is
present in 17% of the African sample; however, it is much less common in the European
population, with only 8% displaying inversion. Additionally, Africans show a slightly higher
degree of the more extreme forms of eversion (16% have moderate eversion, 6% have extreme
eversion), while Europeans posses moderate and extreme eversion in 13% and 4% of the cases,
respectively. A total of 41% of the European sample has a straight ramus, that is, individuals
show neither inversion nor eversion, while only 30% of the Africans display a straight ramus.
On the other hand, Rhine’s data show an opposite trend, where 22% of European Americans and
50% of African Americans display straight gonia. However, Rhine only analyzed one African
mandible, making his results meaningless. Additionally, Angel and Kelley (1990) showed that
European Americans were more likely to possess straight rami than Africans. Therefore, these
data show that Europeans are more likely to display a straight gonia. However, for gonial
eversion, the frequency distributions between the two ancestral groups are not substantial enough
to discriminate between Africans and Europeans on a case-by-case basis.
Mandibular border form. Mandibular border form is not significantly influenced by
ancestry; therefore, it is not a useful trait for ancestry determination.
75
Mandibular tori. Ancestry significantly affects the expression of mandibular tori. Both
Africans and Europeans have a low incidence, of mandibular tori, with 9% and 6% displaying
any form of tori, respectively. However, Africans are slightly more likely to display small tori
with an incidence of 7%, while only 5 % of Europeans display small tori. Sonnier and
colleagues (1999) report a higher incidence of mandibular tori in African individuals. My
overall results are similar to Berg’s (2001) study, which reports an absence of mandibular tori in
over 90% of European Americans and Africans. While there is a slight difference in tori
expression between the two groups, a two percent difference is too trivial to warrant using for
ancestral studies.
Muscle attachment sites. Ancestry only significantly affected the development of
muscle attachments on the left side. Europeans are more likely to display minimal ridging from
muscle attachment sites (30%), while only 20% of the Africans displayed such gracile muscle
attachments. On the other hand, Africans are more likely to have moderate (32%) to extreme
(8%) muscle attachment sites. Europeans show only moderate to extreme ridging in 21% and
2% of the cases, respectively. From these data, it can be surmised that Africans have more
robust muscle attachment sites than Europeans.
Mylohyoid bridging. Mylohyoid bridging is not significantly affected by ancestry;
therefore, it is not a useful trait for ancestry determination.
Accessory mandibular foramen. The accessory mandibular foramen is not significantly
affected by ancestry; therefore, it is not a useful trait for ancestry determination.
Chin prominence. Ancestry significantly affects chin prominence. A prominent chin is
the most common form in both Europeans (95%) and Africans (57%). However, only 5% of
Europeans displayed a vertical chin, while 42% of Africans exhibited this trait. In comparison
76
with Rhine (1990), 69% of the European American sample possessed a prominent chin, while
100% of the African American sample displayed a vertical chin (n = 3). Even though a
prominent chin is the most common form for both ancestral groups, it can be assumed that if an
individual displays a vertical chin, she is most probably of African descent. While there was
some difficulty scoring this trait, the results still show that there are differences in the expression
of chin prominence between Africans and Europeans.
Chin shape. Ancestry significantly affects chin shape. In both Africans and Europeans,
a round chin is the most common form. However, a round chin is more often found in Africans
(63%) than in Europeans (39%). Europeans also have a high incidence of square chins (38%),
whereas only 18% of Africans display a square chin. These percentages are quite different from
those seen in Rhine’s (1990) study, which reports a round chin in 31% of European Americans
and 100% of African Americans. Once again, this discrepancy may be due to Rhine’s small
sample in both populations. In summary, the presence of a square chin is evidence that the
individual is European.
Number of mental foramina. Ancestry significantly affects the number of mental
foramina. A single foramen is the most common form in both Europeans (93%) and Africans
(83%). However, Africans, at 17%, are more likely to display multiple mental foramina than
Europeans (7%). These results are similar to those obtained by Simonton (1923), who reported a
16% rate of multiple foramina in Africans, and Montagu (1954), who found a low frequency of
multiple foramina in Europeans (2%). Likewise, Sawyer and colleagues (1998) reported a
higher incidence of mental foramina in African Americans (4%) than European Americans (1%).
Therefore, Africans are more likely to posses multiple mental foramina than Europeans
77
Position of the mental foramen. The position of the mental foramen is significantly
affected by ancestry. In the European sample, 54% have their mental foramina positioned
beneath the junction between the second and third premolar, whereas 46% of the African sample
has their mental foramina beneath the second premolar. Additionally, 20% of Africans have
their mental foramina placed even further back on the mandible, beneath the junction of the
second premolar and the first molar or beneath the first molar. Similarly, Zivanovic (1970)
found that 32% of his East African sample had the mental foramen beneath the junction of the
second premolar and the first molar. Therefore, it can be assumed that Europeans have a more
anteriorly placed mental foramen and Africans have a more posteriorly placed mental foramen.
Mandibular measurements. Ancestry significantly affects the measurements of
bigonial width, mandibular length, mandibular angle, and minimum ramus breadth. Europeans
tend to have a slightly larger bigonial width than Africans. However, the more extreme forms of
gonial eversion are more common in Africans. This discrepancy may be due to Africans having
stronger muscle attachments at the gonia and therefore creating more eversion, while Europeans
have generally wider mandibles, regardless of gonial eversion. Africans have a longer mandible,
smaller (more acute) gonial angle, and wider minimum ramus width in comparison to Europeans.
In contrast, Europeans have a shorter mandible, more obtuse gonial angle, and a thinner
mandibular ramus width than Africans. These measurements could be used to generate
discriminant functions that can distinguish between different ancestral groups.
Sexual Dimorphism in the Mandible
The skull is the second most sexually dimorphic region of the human skeleton, behind the
pelvis. As a component of the skull, the mandible may also be considered sexually dimorphic
78
(Giles, 1964). In fact, Hunter and Garn (1972) report that the mandible is the most dimorphic
part of the skull. In general, as with most other skeletal elements, male mandibles are large and
slightly more robust than the more gracile female mandibles. Size differences account for the
majority of the sexual dimorphism seen in the mandible, with males having larger, more robust
jaws and more developed muscle attachment sites (St. Hoyme and Iscan, 1989). Giles (1964)
reports eight measurements of the mandible that are useful for sexing and individual. These
measurements are: symphysis height, body height, body length, body thickness, minimum ramus
breadth, maximum ramus breadth, ramus height, and bigonial diameter. Additionally, several
non-metric traits of the mandible have been associated with sex. Male characteristics include
gonial flaring, a broad ascending ramus, a large, high symphysis, a large mental eminence, and
flexure (obtuseness) of the mandibular ramus. Females, on the other hand, have no gonial flare,
a narrow ascending ramus, a small, low symphysis, and a small mental eminence (Krogman and
Iscan, 1986; St. Hoyme and Iscan, 1989; Buikstra and Ubelaker, 1994; Loth and Henneberg,
1996). In the following section, raw percentages for all ancestral groups are pooled in order to
more clearly see the effect that sex has on each trait.
Ramus inversion. Sex has a significant effect on the expression of ramus inversion.
However, when looking at the raw data, this difference is not readily apparent. For any given
score, the difference between males and females varies from three to five percent. Overall,
females display more extreme amounts of inversion, with 22% showing moderate inversion and
9% showing extreme inversion. On the other hand, 17% of males display moderate inversion and
5% have extreme inversion. Additionally, more males show no inversion (45%) than females
(41%). While sex may statistically affect the expression of ramus inversion, this trait may not be
practical to use for differentiating males and females.
79
Location of inversion. Sex has a significant effect on the location of ramus inversion.
In males, 44% display inversion in the middle portion of the ramus, while females are more
likely to display inversion in the lower portion of the ramus (39%). However, this frequency is
very close to the 38% of the female sample who show inversion in the middle portion of the
ramus. While there is a statistical difference in the location of inversion between the sexes, it
may not be practically useful in differentiating between male and female individuals.
Gonial eversion. Sex has a significant effect on the expression of gonial flare. Only
6.8% of the males in this study display gonial inversion. Females, however, display gonial
inversion in 17.2% of the cases. On the other hand, males are more likely to possess moderate to
extreme gonial flare (18.5% and 8.5%) than females (8.9% and 0.05% respectively). Thus, one
can assume that a mandible with gonial inversion most likely belongs to a female individual,
while a mandible with eversion is probably male.
Mandibular border form. The expression of mandibular border shape is significantly
affected by the sex of an individual. Males posses an undulating mandibular border in 66% of
the analyzed cases, while females display undulation in only 47% of the individuals. While a
straight mandibular border is not as common as an undulating one in females, it is still more
likely to occur in females (50%) than in males (34%). Therefore, it can be surmised that a
mandible with a straight border is most probably female.
Mandibular tori. Mandibular tori are not significantly affected by sex; therefore, it is
not a useful trait for the determination of the sex of an individual.
Muscle attachment sites. The robusticity of muscle attachment sites is significantly
affected by sex. Little muscle robusticity is present in 17% of the male cases and 34% of the
female cases. Conversely, 8% of the males possess extreme robusticity, while only 2% of the

80
female sample displays robust muscle attachment sites. Hence, an individual with small muscle
attachments is more likely to be female and an individual with large muscle attachment sites is
more likely to be male.
Mylohyoid bridging. Mylohyoid bridging is not statistically affected by sex of an
individual; therefore, it is not a useful trait for the determination of sex.
Chin prominence. The prominence of the chin is significantly affected by the sex of an
individual. Both males and females have a very high incidence of chin prominence (71% and
81%, respectively). However, 29% of the males posses a vertical chin while only 19% of
females have a vertical chin. Therefore, it can be assumed that an individual with a vertical chin
is most likely male.
Chin shape. Chin shape is not statistically affected by the sex of an individual;
therefore, it is not a useful trait for the determination of sex.
Number of mental foramen. The number of mental foramina is not statistically affected
by the sex of an individual; therefore, it is not a useful trait for the determination of sex.
Position of the mental foramen. The effect of sex on the position of the mental foramen
is significant. However, when looking at the raw data, this difference between the sexes is not
readily apparent, with the sexes differing on average by only three percent. Males tend to have
their foramen positioned more anteriorly. Nine percent of the male sample have the foramen
beneath P3, 39% beneath the junction of P3 and P4, and 41% beneath P4. In comparison with
the female sample, 5% of the sample has the mental foramen located under P3, 37% under the
junction between P3 and P4, and 39% under P4. On the other hand, females are more likely than
males to have the mental foramen positioned more posteriorly; 15% of the sample has the mental
foramen situated under the junction of P4 and M1 and 3% are under M1. However, 11% of the
81
male sample have their mental foramen under the junction of P4 and M1 while only 1% have the
foramen beneath M1. While these percentages are statistically significant, the differences are too
small to warrant using this trait to discriminate between males and females.
Accessory mandibular foramen. The number of mental foramina is not statistically
affected by the sex of an individual; therefore, it is not a useful trait for the determination of sex.
Mandibular measurements. As expected, all mandibular measurements are
significantly effected by the sex of an individual. For each measurement taken, males were
larger than females. These measurements could be used to generate discriminant functions that
can distinguish between the sexes.
Age Changes in the Mandible
One interesting phenomenon that occurs as an individual ages is an increase in density of
the bones due to continual bone deposition throughout an individual’s lifetime. Meindl and
colleagues (1985) reported that morphological characteristics of the skull become increasingly
more “male-like” with age. Several studies have shown that while the cross-sectional area of the
mandible becomes smaller with age, the mandibular bone density increases with age, particularly
in edentulous individuals (Atkinson & Woodhead, 1968; Kingsmill & Boyde,1998)
Tooth-loss accounts for the greatest shape changes in the mandible. As teeth are lost, the
mandible enters a state of resorption where the corpus becomes remodeled due to lack of use.
The alveolus of the mandible may become so resorbed that the mandibular corpus is reduced to a
mere sliver of bone and the ramus thins and becomes more gracile. In such cases, the gonial
angle also changes shape by becoming more obtuse (Atkinson & Woodhead, 1968; Schwartz,
1995). Additionally, the lateral portion of the ramus becomes resorbed with age, while the
82
mandibular corpus increases in length (Enlow et al., 1976).
Ramus inversion, location of inversion, gonial eversion, mandibular border form,
mandibular tori, mylohyoid bridging, chin shape, number of mental foramina, bigonial width,
mandibular length, mandibular angle, and minimum ramus breadth are not statistically affected
by age. Only the four traits and one measurement that are affected by age will be discussed in
the following sections.
Muscle attachment sites. Age has a significant effect on the robusticity of muscle
attachment sites on the left side only. Gracile muscle attachments are most common in the
youngest age group, occurring in 56% of the cases. Slight muscle attachments are most common
in the 70-79 years and 90 years and older age groups (both with an incidence of 50%). Moderate
muscle attachments occur in 36% of the 90 years and older age group, but only occur in 8% of
the youngest age group. Extreme robusticity of muscle attachment points does not occur in
either the youngest age group (0%) or the oldest age group (0%). Extreme muscle robusticity
tends to occur most frequently in the middle-aged groups, ranging from 3% to 9%. In sum, early
in life, individuals are more gracile and then become more robust as they grow older. However,
in very old age, this robusticity stops and begins to decrease, perhaps due to resorption
associated with tooth loss. Therefore, the investigator should keep in mind the possible age of
the individual when using muscle attachment sites to determine ancestry and sex.
Accessory mandibular foramen. Age significantly affects the presence of the accessory
mandibular foramen. The younger the individual, the more likely he is to posses an accessory
mandibular foramen. For example, in the 15-19 year old age group, 81% possessed an accessory
mandibular foramen. Older individuals tend to have an accessory mandibular foramen much less
often. The oldest age range (90 years and older) displayed an accessory mandibular foramen in
83
only 35% of the cases, while in the majority of this group the foramen was missing (65%). This
absence of accessory mandibular foramen in the older age group corresponds to similar studies
that found a decrease in hypostatic traits (traits characterized by a localized deficiency of bone)
as age increases (Molto, 1983; Ossenberg, 1969).
Chin prominence. Age has a significant effect on chin prominence. In the younger age
range of 15-19 years, 58% of the sample displays a vertical chin. During senescence, the
frequency of chin prominence is much increased. Up to 86% of the individuals in the 80-89 age
range display chin prominence. This may be due to alveolar resorption and recession creating
the appearance of a more prominent chin. Additionally, continual deposition of bone on the chin
as an individual ages can account for an increase prominence in the older age groups.
Position of the mental foramen. The position of the mental foramen is significantly
affected by the age of an individual. This effect is probably due to the extreme degree of
remodeling that occurs in the mandible as teeth are lost. One problem with analyzing this trait is
that it can only be performed on dentate individuals, and only one individual in the 90+ age
category had teeth (for whom the foramen was located under the junction of the third and fourth
premolar). Given this dilemma, the effects of old age on this trait are difficult to interpret. In
general, the position of the mental foramen is beneath the junction of the second and third
premolar or beneath the fourth premolar for all age groups. Additionally, none of the youngest
age group or of the three oldest age groups (70-79, 80-89, and 90+) have their foramina
positioned under the first molar. A mental foramen beneath the first molar occurs most
frequently between the ages of 20 to 69 years, ranging from 1% to 3%.
Bicondylar breadth. Bicondylar breadth is significantly affected by age. Individuals in
the youngest age group have the smallest bicondylar breadths, while those in the 60-69 category
84
have the largest bicondylar breadths. All other age groups range between 110 to 116
millimeters.
The Interaction Between Sex and Ancestry
An interaction between two main effects (independent variables) in ANCOVA or ordinal
regression indicates that one specific subgroup (such as African males, or European females) is
significantly different from the other groups and therefore stands out. Very few interactions
were detected in this study, and only those three variables that produced interactions are
discussed below.
Mandibular tori. The interaction between sex and ancestry has a significant effect on
the expression of mandibular tori. Small mandibular tori are more likely to be expressed in
African females (9%) than in any other group. Values for the other three subgroups vary from
2% to 7%.
Muscle attachment sites. Muscle attachment sites are significantly affected by the
interaction between sex and ancestry. African males have the highest incidence of extreme
robusticity at the muscle attachment sites (11%). The other three groups display extreme
robusticity in only 1% to 4% of the cases.
Chin shape. The interaction between sex and ancestry has a significant affect on the
appearance of chin shape. African males are least likely to have a pointed chin, with an
incidence of 9%, while African females have an incidence of 33%, European males have an
incidence of 12% and European females have an incidence of 34%. A square chin is least likely
in African females, with an incidence of 7%, while African males have an incidence of 26%.
European males have a square chin in 52% of the cases, while European females have an
85
incidence of 24%. Both African males and females have the highest percent of round chins, with
an incidence of 64% and 60%, respectively. On the other hand, European males display a round
chin in 36% of the cases and European females display a round chin in 43% of the cases. In
sum, a mandible with a square chin is most likely to be a European male, while a mandible with
a round chin is most likely to an African male or female.
Side Differences
Mandibular border form, muscle attachment sites, mylohyoid bridging, and the number of
mental foremina were not statistically different between the right and left sides. The six traits
with a significant difference between sides will be discussed in detail in the following sections.
Ramus inversion. Side significantly affects the appearance of ramus inversion. Both
the left and right sides are most likely to show no inversion, with incidences of 47% and 40%,
respectively. However, in cases where inversion is present, the right side has a higher incidence
in each rank. The right side shows slight inversion in 33% of the sample, moderate inversion in
19% of the sample, and extreme inversion in 7% of the sample. On the other hand, inversion is
less frequent on the left side with slight inversion in 29% of the cases, moderate inversion in
18% of the cases, and extreme inversion in 6% of the cases.
Location of inversion. The location of inversion is significantly affected by the side it is
on. While both left and right sides are most likely to show inversion in the middle portion of the
ramus (40% and 42%, respectively), the left side shows displays inversion high on the ramus in
33% of the cases. The right side only displays high inversion in 29% of the cases.
Gonial eversion. Side significantly affects the expression of gonial eversion. The left
side is more likely to show no eversion, or straight gonia, in 41% of the cases. The right side
86
displays predominately slight eversion in 35% of the cases.
Mandibular tori. Mandibular torus expression is significantly affected by the side on
which it is located. Both the left and right side have a low incidence of mandibular tori (93%
and 92% respectively). However, the right side is slightly more likely to display varying degrees
of mandibular tori, with incidences of 7% for small tori and 2% for moderate tori, while the left
side has incidences of 6% for small tori and 1% for moderate tori.
Accessory mandibular foramen. Side significantly affects the presence of accessory
mandibular foramen. The right side is more likely to possess a foramen, with an incidence of
44%, versus 40% on the left side.
Mental foramen position. The position of the mental foramen is significantly affected
by the side on which it is located. The left mental foramen is most likely to be positioned further
back on the mandible with incidences of 16% (under the junction of P4 and M1), while the right
foramen is located under the junction of P4 and M1 in only 10% of the cases. Likewise, the right
side has a higher incidence of a more anteriorly placed foramen, with 10% of the foramina under
P3 and 44% of the foramina under the junction of P3 and P4. The right side shows incidences of
5% of the foramen under P3 and 32% of the foramen under the junction of P3 and P4.
Intra-observer Error
The Wilcoxon Signed Ranks Test was used on the Florida sample to determine if there
was a significant amount of intra-observer error in trait scoring. Ten traits were analyzed on up
to 21 individuals. Two traits were found to be significantly different between the first and
second analyses. Right gonial eversion was analyzed in 15 individuals and was found to vary
significantly between visits. In the seven individuals where there was a difference between the
87
two observations, each individual was given a lesser score on the second observation. However,
the differences in score only varied by one rank in all cases. For example, in the first
observation, one individual was given a score of “3” and in the second observation he was given
a score of “2.” The difference in the scoring method may be due to a learning curve that
occurred between the two observations. The initial observation of the Florida sample was the
first time these methods were used on any sample. Between the first and second observations,
the analyst had been to both the Terry and Hamann-Todd Collections. It is possible that after
performing the method on over 600 individuals that the analyst had a better understanding of the
traits and therefore was actually scoring the second Florida sample more accurately.
Chin prominence was also found significantly different between the first and second
observations. In Chapter 3, the author noted that this trait might be problematic due to a fine line
between a prominent and a vertical chin. This shortcoming apparently had an effect on my
ability to score this trait. In the 19 individuals analyzed, four were scored differently between
the first and second observations. In each of these cases, the chin was originally scored as
vertical and upon the second observation it was scored as prominent. This discrepancy may be
due to a combination of problematic scoring method and also due to the aforementioned learning
curve.
The remainder of the traits failed to demonstrate any significant differences between the
first and second observations. In fact, for right ramus inversion, left mandibular torus, and right
mylohyoid bridging, there were no differences at all between the two observations. Therefore,
while the intra-observer tests were fairly limited, the scoring methods used in this study appear to
be reasonably reliable and replicable.
88
African American vs. Native Africans
Ordinal regression demonstrated that African Americans and Native Africans showed a
statistically significant difference in five of the analyzed traits: gonial eversion, muscle
attachment sites, mylohyoid bridging, chin prominence, and position of the mental foramen. No
statistical difference was found in ramus inversion, location of inversion, mandibular border
form, mandibular tori, accessory mandibular foramina, chin shape, and number of mental
foramina; therefore, these traits will not be discussed below.
ANCOVA results showed a statistically significant difference in two of the
measurements: bicondylar breadth and minimum ramus breadth. No statistical difference was
found for bigonial width, mandibular length, or mandibular angle; therefore, these traits will not
be discussed.
Gonial eversion. Gonial eversion is statistically affected by country of origin in
Africans. African Americans tend to have more straight rami (37%), while only 29% of the
Native Africans display straight rami. The overall trend is for Native Africans to have more
eversion than African Americans. Native Africans have slight eversion at an incidence of 31%,
moderate eversion at 19%, and extreme eversion at 9%. In contrast, African Americans display
slight eversion in 29% of the cases, moderate eversion in 11% of the cases, and extreme eversion
in 4% of the cases. Additionally, African Americans display more gonial inversion (20%) than
Native Africans (11%).
Muscle attachment sites. Country of origin has a significant effect on the robusticity of
muscle attachment sites in Africans. African Americans tend to have more gracile muscle
attachment sites, with incidences of 19% and 48% for no ridging to slight ridging, respectively.
In contrast, Native Africans show no to slight ridging in 15% and 30% of the cases, respectively.
89
Additionally, Native Africans have more robust muscle attachments, displaying extreme ridging
in 13% of the cases, while only 6% of African Americans display extreme ridging.
Mylohyoid bridging. Mylohyoid bridging is significantly affected by country of origin
in Africans. African Americans are more likely to show bridging, with an incidence of 13%,
while only 4% of the Native African sample displays bridging.
Chin prominence. Country of origin significantly affects the expression of chin
prominence in Africans. Native Africans (68%) are more likely to display chin prominence than
African Americans (53%).
Position of the mental foramen. Position of the mental foramen is significantly affected
by country of origin in Africans. African Americans show a higher incidence (4%) of a more
posteriorly positioned mental foramen (beneath the first molar), while only 1% of Native
Africans have their mental foramina positioned beneath the first molar. Additionally, 27% of the
Native African group has the mental foramen positioned beneath the junction of the second and
third premolar, while 22% of the African Americans have their foramina similarly positioned.
Mandibular measurements. Country of origin has a significant effect on bicondylar
width and minimum ramus breadth in Africans. Unweighted means of each group show that
African Americans tend to have a larger bicondylar width than Native Africans. Sex and the
interaction between sex and country of origin also have a significant effect on bicondylar width.
As expected, males also have a larger bicondylar width. Additionally, the interaction shows that
African American males have the largest bicondylar width of all the four subgroups (African
American males, African American females, Native African males, and Native African females).
Unweighted means of each group show that Native Africans have a wider minimum
ramus breadth than African Americans. Sex also has a significant effect on minimum ramus
90
breadth. As expected, males have a wider minimum ramus breadth than females.
European American vs. European Africans
Ordinal regression shows that there are no statistical differences between any of the non-
metric traits of European Americans and European Africans. However, ANCOVA results did
reveal some statistically significant differences in the measurements of mandibular length and
minimum ramus breadth. Bigonial width, bicondylar breadth, and mandibular angle were not
significantly different between the two groups; therefore, these measurements will not be
discussed.
Mandibular measurements. Country of origin for Europeans has a significant effect on
mandibular length and minimum ramus breadth. Unweighted means for each group show that
European Africans have longer mandibles than European Americans. Sex and the interaction
between country of origin and sex are also statistically significant. As expected, male mandibles
are longer than female mandibles. Additionally, the interaction shows that European African
males have the longest mandibles of all the four subgroups (European African male, European
African female, European American male, and European American female).
Unweighted means for each group show that European Africans have a wider minimum
ramus breadth than European Americans. The interaction between country of origin and sex also
significantly affects minimum ramus breadth; sex, however, does not significantly affect the
measurement. European American females have the most narrow minimum ramus breadth.
Hypothesis Testing
Several hypotheses were tested in this study. Each hypothesis is discussed individually
91
below.
Ho1: There are no differences in trait expression between individuals of European
and African ancestry. Ordinal regression shows that there are significant differences in the
expression of non-metric traits between European and African mandibles. This difference was
found in 75% (9 of 12) of the traits analyzed: ramus inversion, location of inversion, gonial
eversion, mandibular tori, muscle attachment sites, chin prominence, chin shape, number of
mental foramina, and mental foramen position. These traits can be used to varying degrees in the
determination of ancestry. The null hypothesis of no difference between ancestral groups cannot
be rejected for mandibular border form, mylohyoid bridging, and the presence of an accessory
mandibular foramen. Therefore, these traits cannot be used in the determination of ancestry.
ANCOVA shows that there are significant differences in the measurements of European
and African mandibles. This difference was found in 80% (4 of 5) of the measurements:
bigonial width, mandibular length, mandibular angle, and minimum ramus breadth. These
measurements can be used to varying degrees in the determination of ancestry. The null
hypothesis of no difference between ancestral groups cannot be rejected for bicondylar breadth.
This measurement cannot be used in the determination of ancestry.
Ho2: Sex does not affect the expression of the traits. Ordinal regression showed that
sex was found to significantly affect the expression of some traits. This effect was found in 58%
(7 of 12) of the traits analyzed: ramus inversion, location of inversion, gonial eversion,
mandibular border form, muscle attachment sites, chin prominence, and mental foramen
position. These traits can be used to varying degrees in the determination of sex and must be
taken into account when trying to determine ancestry. The null hypothesis of no difference
between the sexes cannot be rejected for mandibular tori, mylohyoid bridging, the presence of an
92
accessory mandibular foramen, chin shape, and the number of mental foramina. These traits
cannot be used in the determination of sex and sex can be ignored when using these traits to
determine ancestry.
Ordinal regression showed that sex significantly affected the measurements of the traits.
This effect was found in 100% of the measurements taken: bigonial width, bicondylar breadth,
mandibular length, mandibular angle, and minimum ramus breadth. These measurements can be
used to varying degrees in the determination of sex and must be taken into account when trying
to determine ancestry.
Ho3: The age of the individual does not affect the expression of the traits. In
comparison with ancestry and sex, age does not have as much of an influence on the appearance
of the non-metric traits. Only 33% (4 of 12) of the analyzed traits were affected by age: muscle
attachment sites, the presence of an accessory mandibular foramen, chin prominence, and mental
foramen position. The youngest age group tends to vary significantly in trait expression in
comparison to all other groups. In all cases, trait expression changes upon entering old age, and
the investigator may have to take age into account when attempting to determine ancestry or sex.
The null hypothesis of no difference due to age cannot be rejected for ramus inversion, location
of inversion, gonial eversion, mandibular border form, mandibular tori, mylohyoid bridging, chin
shape, and number of mental foramina.
Age has a significant effect on only one of the five mandibular measurements (bicondylar
breadth). The null hypothesis of no difference according to age cannot be rejected for bigonial
width, mandibular length, mandibular angle, and minimum ramus breadth.
Ho4: Side does not affect the expression of the bilateral traits. The side of the trait
was statistically significant in 60% (6 of 10) of the bilateral traits. This effect was found for
93
ramus inversion, location of inversion, gonial eversion, mandibular tori, accessory mandibular
foramen, and position of the mental foramen. The null hypothesis of no difference in side cannot
be rejected for mandibular border form, muscle attachment sites, mylohyoid bridging, and
number of mental foramina.
Ho5: There is no difference in trait expression between African American
individuals and Native African individuals. The difference in trait expression between
African American and Native African individuals was found to be statistically significant in 42%
(5 of 12) of the analyzed traits. This effect was found in gonial eversion, muscle attachment
sites, mylohyoid bridging, chin prominence, and position of mental foramen. The null
hypothesis of no difference between country of origin cannot be rejected for ramus inversion,
location of inversion, mandibular border form, mandibular tori, accessory mandibular foramen,
chin shape, and number of mental foramina.
In the original ordinal regression between Africans and Europeans, the two groups were
not separated by continent. Instead the ancestral groups (Native African/African American and
European African/European American) were grouped together. It could be possible that the
difference between the European and African ancestral groups could by caused by marked
differences between African Americans and Native Africans. Both African Americans and
Native Africans possess a mixture of typically European and African traits. Typically European
traits displayed by African Americans include straighter rami, less eversion, gracile muscle
attachment points, and a narrower minimum ramus breadth. Typically African traits displayed
by African Americans include more inversion, a vertical chin, and a more posteriorly placed
mental foramen. On the other hand, Native Africans display two typically European traits: a
more prominent chin and a more anteriorly placed mental foramen. Typically African traits
94
displayed by Native Africans include more eversion, more robust muscle attachments, and a
wider minimum ramus breadth.
Given the discrepancy of the expression of these traits in the two African groups, it is
possible that the differences seen between the Africans and Europeans in general may not be as
simple as has been assumed. Therefore, it may not always be appropriate to group African
Americans and Native Africans. Furthermore, the guidelines for distinguishing between
Africans and Europeans in the United States may be different from guidelines for distinguishing
between Africans and Europeans in South Africa.
Ho6: There is no difference in trait expression between European American
individuals and European African individuals. The difference in trait expression between
European American and European African individuals is statistically insignificant in 100% of the
analyzed traits, although (as expected), some differences were found between the sexes. Thus,
individuals of European descent from different continents may be pooled into one group, and in
general, one could use the same guidelines developed here for identifying Europeans regardless
of the continent of origin.
Conclusions
Since the early 1900’s anthropologists have been looking for a means of distinguishing
different ancestral groups from their skeletal remains. In the United States, studies of ancestral
populations have generally focused on the skull, more specifically the cranium, given that this
area is considered the most reliable for determining ancestry. Only a few studies have been
performed utilizing the mandible for ancestral determination, some of which have been
inconclusive and suffer from small sample sizes. Additionally, non-metric traits of the mandible
95
are often used qualitatively without being put through rigorous testing.
The purpose of this study was to determine if ancestry has an affect on the expression of
non-metric traits of the mandible. The results of the ordinal regression tests suggest that ancestry
and sex have a significant affect on the expression of certain mandibular traits. Nine of the
twelve traits can be used to assist in the determination of ancestry. This investigation supports
the previous studies that state that the mandible can be useful for the purpose of ancestry
determination (Angel and Kelley, 1990; Parr, 2003; Rhine, 1990; Schulz, 1933). Age and the
interaction between sex and ancestry are less likely to affect non-metric traits of the mandible,
although as expected, there are significant differences by sex alone.
Ordinal regression is a highly sensitive statistical test that was used to determine which
traits could be used to assist in the determination of ancestry. One caveat with this test is that it
is so sensitive that it can detect minute differences in trait occurrence that may not be practical to
use in real-life circumstances. Ramus inversion, location of inversion, gonial eversion,
mandibular tori, muscle attachment sites, chin prominence, chin shape, number of mental
foramina, and mental foramen position were found to be statistically significant. However, due
to the effects of other factors and the sensitivity of ordinal regression, some traits may be more
useful than others. Ramus inversion, gonial inversion, muscle attachment sites, chin shape,
number of mental foramina, and position of mental foramina are the most appropriate traits to
use when determining ancestry. However, caution must be taken when using these traits because
all of them except the number of mental foramen are significantly affected by sex. The location
of inversion and mandibular tori are statistically significant but not practically useful when
looking at the overall trait frequencies. Additionally, chin prominence had a high degree of
intra-observer error; therefore it may be inherently problematic and not useful for the
96
determination of ancestry. The number of mental foramina may be the most reliable trait
because it is statistically and practically significant and it is not affected by sex, age, or the
interaction between sex and ancestry.
In sum, European individuals are most likely to posses little to no ramus inversion, no
gonial eversion (or straight gonia), gracile attachment sites, a round or square chin, one mental
foramen, a more anteriorly placed mental foramen, wide bigonial width, short mandibles, obtuse
gonial angle, and narrow minimum ramus breadth. Individuals of African descent are more
likely to display moderate to extreme ramus inversion, gonial inversion, a round chin, multiple
mental foramina, a more posteriorly placed mental foramen, narrow bigonial width, long
mandibles, less obtuse gonial angle, and a wide minimum ramus width (Table 5.1). However,
one should be cautioned that African Americans and Native South Africans do appear somewhat
different.
This study is the first multivariate study conducted on discrete mandibular traits used for
the determination of ancestry. By using a large sample of identified individuals, this study
controls for sex and age to determine whether these variables may have an effect on the
incidence of each trait.
Additionally, this study is performed on individuals from two separate continents;
therefore, the findings are applicable for worldwide use. While ancestry determination from the
cranium has been readily studied, no one trait can be utilized diagnostically; instead, a suite of
characteristics is preferred. Inclusion of mandibular traits to this group of characteristics builds
on previous non-metric studies and helps increase the reliability of ancestral determination from
the skull.
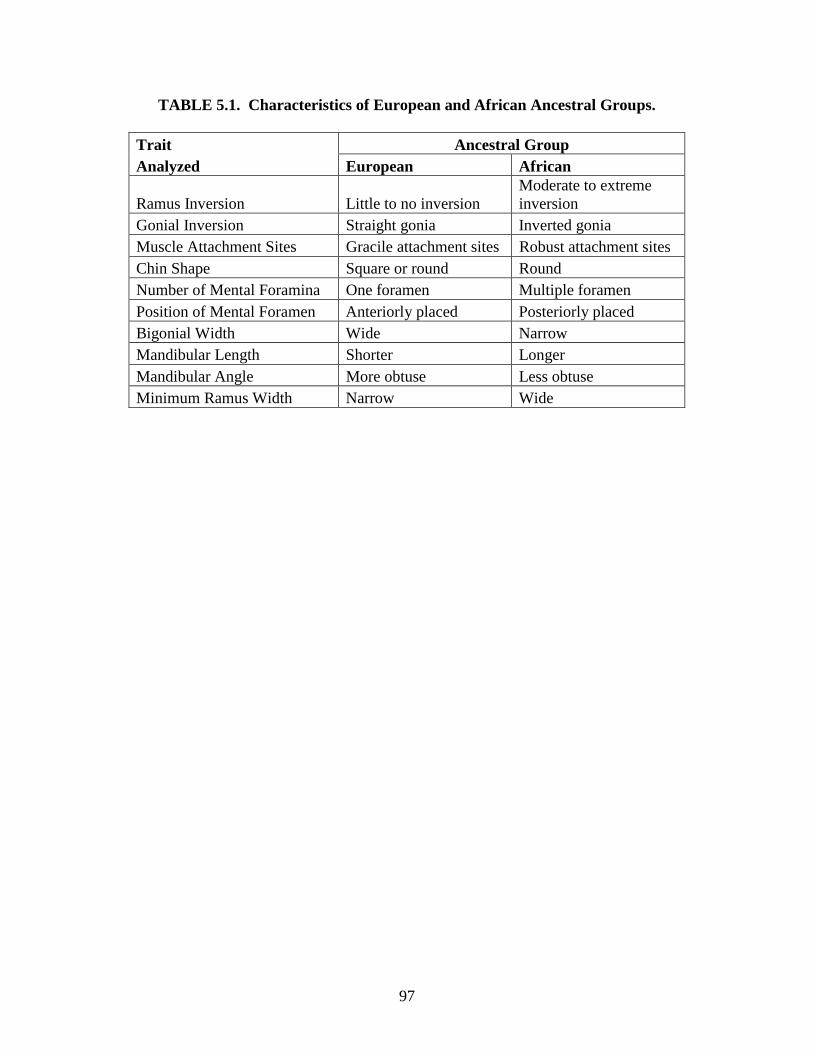
97
TABLE 5.1. Characteristics of European and African Ancestral Groups.
Trait Ancestral Group Analyzed European African
Ramus Inversion Little to no inversion Moderate to extreme inversion
Gonial Inversion Straight gonia Inverted gonia Muscle Attachment Sites Gracile attachment sites Robust attachment sites Chin Shape Square or round Round Number of Mental Foramina One foramen Multiple foramen Position of Mental Foramen Anteriorly placed Posteriorly placed Bigonial Width Wide Narrow Mandibular Length Shorter Longer Mandibular Angle More obtuse Less obtuse Minimum Ramus Width Narrow Wide
98
LITERATURE CITED Akabori K (1934) Crania Nipponica recentia. Jap. J. Med. Sci., Sect. 1, Anat. 4: 296-303. Angel JL and Kelley, JO (1990) Inversion of the posterior edge of the jaw ramus: new race trait.
In GW Gill and S Rhine (eds.): Skeletal Attribution of Race. Maxwell Museum Anthropology, Anthropology Papers 4: 33-39.
Ardito G (1977) The Epigenic variants of the skull in some ancient and recent Italian
populations. J. Hum. Evol. 6: 689-695. Arensburg B & Nathan H (1979) Anatomical observations on the mylohyoid groove, and the
course of the mylohyoid nerve and vessels. J. Oral Surg. 37: 93-96. Atkinson PJ and Woodhead C (1968) Changes in human mandibular structure with age. Archs.
Oral. Biol. 13: 1453-1463. Bass WM (1964) The variation in physical types of the prehistoric plains Indians. Plains
Anthropol. 9: 65-145. Berg GE (2001) Four chins and a funeral or racial affinity as determined by mandibular
morphology. Paper presented at the 53rd annual meeting of the Academy of Forensic Sciences, Seattle, OR.
Berry AC (1975) Factors affecting the incidence of non-metrical skeletal variants. J. Antat. 120:
519-535. Berry AC & Berry RJ (1967) Epigenic variation in the human cranium. J. Anat. 101: 361-379. Berry AC & Berry RJ (1972) Origins and relationships of the ancient Egyptians. Based on a
study of non-metrical variations of the skull. J. Hum. Evol. 1: 199-208. Birkby WH (1973) Discontinuous morphological traits of the skull as population markers in the
prehistoric Southwest. Ph.D. dissertation, Univ. Arizona. Brasili P, Zaccagni L, Gualdi-Russo E (1999) Scoring of nonmetric cranial traits: A population
study. J. Anat. 195: 551-562. Brasili-Gualandi and Gualdi-Russo (1989) Discontinuous traits of the skull: Variation on sex,
age, laterality. Anthrop. Anz. 47: 239-250. Brothwell DR (1981) Digging Up Bones. 3rd Edition. Ithaca, NY: Cornell University Press. Brues AM (1977) People and Races. New York: Macmillan, Inc.
99
Buikstra JE (1972) Techniques for coping with the age-regressive nature of non-metric traits. Am. J. Phys. Anthrop. 37: 431-432.
Buikstra JE and Ubelaker DH (1994) Standards for Data Collection from Human Skeletal
Remains. Arkansas Archeological Survey, Research Series No. 44. Byers, SN (2002) Introduction to Forensic Anthropology. Allyn & Bacon: Boston. Cesnys GV (1982) Side difference of non-metric cranial traits in the 1st-2nd millennia A.D.
Lithuanian materials. Homo. 33: 201-210. Christensen AF (1997) Cranial non-metric variation in North and Central Mexico. Anthrop. Anz.
55: 15-32. Church MS (1995) Determination of race from the skeleton through Forensic Anthropological
methods. Forensic Sci. Rev. 7: 2-39. Cooprider KB, Rubison RM, Finnegan M (1980) Racial classification based on non-metric
skeletal traits. Homo. 31(1): 1-21. Corruccini RS (1974) An examination of the meaning of cranial discrete traits for human skeletal
biological studies. Am. J. Phys. Anthrop. 40: 425-446. Cosseddu GG, Floris G, Vona G (1979) Sex and side differences in the minor non-metrical
cranial variants. J. Hum. Evol. 8: 685-692. Dahinten SL, Pucciarelli HM (1981) Effect of age, sex and nutrition on discontinuous traits of
the rat skull. Acta Anat. 110: 159-163. Danelli J (1884) I perostosi in mandible umani specialmente di Ostiacchi ed anche in mascellare
superiore. Arch. Anthrop. And Etnol. 14: 333-346. DeFreitas V, Maderia MC, Toledo Filho JL, Chagas CF (1979) Absence of the mental foramen
in dry human mandibles. Acta Anat. 104: 353-355. DeStefano GF, Hauser G, Guidotti A, Rossi S, Gualdi-Russo, E, Brasili-Gualandi P (1984)
Reflections on interobserver differences in scoring non-metric cranial traits (with practical examples). J. Hum. Evol. 13: 349-355.
DeVilliers H (1968) The Skull of the South African Negro: A Biometrical and Morphological
Study. Witwatersrand University Press. Johannesburg, Africa. Drennan MR (1937) The torus mandibularis in the bushman. J. Anat. 72: 66-71. Eggen S and Natvig B (1994) Concurrence of torus mandibularis and torus palatinus. Scand. J.
Dent. Res. 60, 3: 60-63.
100
Enlow DH, Bianco HJ, Eklund S (1976) The remodeling of the d=edentulous mandible. J. Prosthetic Dentistry. 36: 685-693.
Fenner FJ (1939) Observations on the mandibular torus. Trans. Roy. Soc. S.A. 63: 224-229. Finnegan M (1972) Population definitionon the Northwest coast by analysis of discrete character
variation. Ph.D. dissertation, University of Colorado. Finnegan M and Marcsik A (1979) A non-metric examination of the relationships between
osteological remains from Hungary representing population of Avar period. Acta. Biol. Szeged. 25; 97-118.
Finnegan M and McGuire SA (1979) Classification systems for discrete variables used in
Forensic Anthropology. Am. J. Phys. Anthrop. 51: 547-554. Finnegan M and Rubison RM (1984) Multivariate distances and multivariate classification
systems using non-metric traits in biological studies. In GN van Vark and WW Howells (eds.), Multivariate Statistical Methods in Physical Anthropology, 69-80. D. Reidel Publishing Company: Holland.
Finnegan M and Marcsik A (1989) Biological distance in the 5-11th centuries populations using
non-metric frequency data. Acta Biol. Szeged. 35: 163-174. Finnegan M, Ery K (2000) Biological distance among six population samples excavated in the
environs around Szekesfehervar, Hungary, as derived by non-metric trait variation. Annls. Hist.-Nat. Mus. Natn. Hung. 92: 455-476.
Furst C (1908) Torus mandibularis bei den Eskimos und anderen rassen. Anat. Anz. Ergangungs,
Heft zu. 32: 295-296. Gershenson A, Nathan H, Luchansky E (1986) Mental foramen and mental nerve: changes with
age. Acta Anat. 126: 21-28. Giles E (1964) Sex determination by discriminant function analysis of the mandible. Am. J.
Phys. Anthrop. 22: 129-136. Green RF, Suchey JM, Gokhale DV (1979) The statistical treatment of correlated bilateral traits
in the analysis of cranial material. Am. J. Phys. Anthrop. 50 : 629-634. Green RM, Darvell BW (1988) Tooth wear and the position of the mental foramen. Am. J. Phys.
Anthrop. 77: 69-75. Gualdi-Russo E, Tasca MA, Brasili P (1999) Scoring of nonmetric cranial traits : A
methodological approach. J. Anat. 195: 543-550. Hansen S (1887) Sur les hyperostoses de la mandibule. Revue d’Anthrop. 2: 114.
101
Hansen S (1895) Bitrag til Eskimoernes Kraniologi. Medd. om Gronland. 17: 356. Hefner JT (2003) Assessing Non-Metric Traits Currently Used in Forensic Determination of
Ancestry. M.A. Thesis, University of Florida. Hooton EA (1918) On certain Eskimoid characters in Icelandic skulls. Am. J. Phys. Anthrop. 1:
53-79. Hooton EA (1946) Up from the Ape. 2nd ed. Macmillan Company: New York. Houghton P (1978) Polynesian mandibles. J. Anat. 127: 251-260. Hrdlicka A (1940) Mandibular and maxillary hyperostoses. Am. J. Phys. Anthrop. 27 : 1-67. Hunter WS, Garn SM. 1972. Disproportionate sexual dimorphism in the human face. Am. J.
Phys. Anthrop. 36: 133-138. Jankowsky W (1930) Uber unterkiefermasse und ihren rassendiagnostischen wert. Zeitschrift fur
Morphol und Anthropol. 28: 347-359. Jantz RL (1970) Change and variation in skeletal populations of Arikara Indians. Ph.D.
dissertation, Univ. Kansas. Johnson CC, Gorlin RH, Anderson VE (1965) Torus Mandibularis: A genetic study. Am. J.
Hum. Genet. 17: 433-439. Kaul SS & Pathak RK (1984) The mylohyoid bridge in four population samples from India, with
observations on its suitability as a genetic marker. Am. J. Phys. Anthropol. 65: 213-218. Kellock WL, Parsons PA (1970) A comparison of the incidence of minor nonmetrical cranial
variants in Australian Aborigines with those of Melanesia and Polynesia. Am. J. Phys. Anthrop. 33: 235-240.
Kingsmill VJ, Boyde A (1998) Variation in the apparent density of human mandibular bone with
age and dental status. J. Anat. 192: 233-244. Klatsky M (1956) The incidence of six anomalies of the teeth and jaws. Hum. Biol. 28: 420-428. Krogman WM, Iscan MY (1986) The Human Skeleton in Forensic Medicine. 2nd ed.
Springfield: Charles C. Thomas. Laughlin WS & Jorgensen JB (1956) Isolate variation in Greenlandic Eskimo crania. Acta
Genet. 6: 3-12. Loth SR, Henneberg M (1996) Mandibular ramus flexure: A new morphologic indicator of
sexual dimorphism in the human skeleton. Am. J. Phys. Anthrop. 99:473-485.
102
Lundy, JK (1980) The mylohyoid bridge in the Khoisan of Southern Africa and its unsuitability as a genetic marker. Am. J. Phys. Anthrop. 53: 43-48.
Mathews GP (1933) Mandibular and palatine tori, and their etiology. J. of Dent. Res. 13: 57. Manjunath KY (2003) Mylohyoid bridging in South Indian mandibles. Indian J. Dent. Res. 14:
206-209. Mayhall JT, Dahlberg AA, Owen DG (1970) Torus mandibularis in an Alaskan Eskimo
population. Am. J. Phys. Anthrop. 33: 57-60. Mays S (1998) The Archaeology of Human Bones. Routledge: New York. Meindl RS, Lovejoy CO, Mensforth RP, L Don Carlos (1985) Accuracy and direction in the
sexing of the skeleton: implications for paleodemography. 68: 79-85. Miller JA (1955) Studies on the location of the lingual, mandibular foramen, and mental
foramen. Anat. Rec. 115: 349. Milne N, Schmitt LH, Freedman L (1983) Discrete trait variation in Western Australian
Aboriginal skulls. J. Hum. Evol. 12: 157-168. Molto JE (1983) Biological Relationships of Soluthern Ontario Woodland Peoples: The
Evidence of Discontinuous Cranial morphology. Ottawa: National Museums of Canada, Archaeological Survey of Canada, Paper No. 117.
Montagu MFA (1954) The direction and position of the mental foramen in the great apes and
man. Am. J. Phys. Anthropol. 12: 503-518. Moore-Jansen PH & Jantz RL (1990) Data Collection Procedures for Forensic Skeletal Material.
Report of Investigations No. 48. University of Tennessee, Knoxville. Moorrees CFA, Osborne RH & Wilde E (1952) Torus mandibularis; its occurrence in Aleut
children and its genetic determinants. Am. J. Phys. Anthrop. 10: 319-330. . Morant GM (1923) A First Study of the Tibetan Skull. 14: 193-260 Morant GM, Collett M, Akyanthaya NK (1936) A biometric study of the human mandible.
Biometrika. 28: 84-122. Muller TP & Mayhall JT (1971) Analysis of contingency table data on torus mandibularis using
a log linear model. Am. J. Phys. Anthropol. 34: 149-154. Murphy T (1957) The chin region of the Australian Aboriginal mandible. Am. J. Phys. Anthrop.
15:517-535.
103
Novotny V, Iscan MY, Loth SR (1993) Morphologic and osteometric assessment of age, sex, and race from the skull. In MY Iscan and RP Helmer (eds.) Forensic Analysis of the Skull. New York: Wiley-Liss, Inc., 71-88.
Ossenberg NS (n.d.) The mylo-hyoid bridge: A case study of a discontinuous variant of the skull.
As cited in Ossenberg (1974). Ossenberg NS (1969) Discontinuous morphological variation in the human cranium. Ph.D.
dissertation, University of Toronto. Ossenberg NS (1974) The mylohyoid bridge: An anomalous derivative of Meckel’s cartilage. J.
Dent. Res. 53: 77-82. Ossenberg NS (1976) Within and between race distances in population studies based on discrete
traits of the human skull. Am. J. Phys. Anthrop. 45: 701-716. Pal GP Routal RV, Bhagwat SS (1988) A study of non-metric (qualitative) variation in Gujarati
crania. Anthrop. Anz. 46: 64-74. Parr NM (2003) Posterior Inversion of the Mandibular Ramus in Native Americans. Paper
presented at the 10th Annual Meeting of the Bioarcheology and Forensic Anthropology Association, Chicago, IL.
Pathak RK & Kaul SS (1991) Nonmetric cranial variation and biological distances between
samples of six non-tribal populations of India. Int. J. Anthropol. 6: 81-87. Penteado CV, Santo Neto H, De Carvalho VC, Porrelli RN (1989) Non-metric cranial variants
in Brazilian skulls. Anat. Anz. Jena. 169: 175-178. Perizonius WRK (1979) Non-metric cranial traits: Sex difference and age dependence. J. Hum.
Evol. 8: 679-684. Rathbun TA, Buikstra JE (1984) Human Identification: Case Studies in Forensic Anthropology.
Springfield: Charles C. Thomas. Reichs KJ (1986) Forensic Osteology: Advances in the Identification of Human Remains.
Springfield: Charles C. Thomas. Rhine S (1990) Non-Metric Skull Racing. In GW Gill and S Rhine (eds.): Skeletal Attribution of
Race. Maxwell Museum Anthropology, Anthropology Papers 4:9-20. Reisenfeld A (1956) Multiple infraorbital, ethmoidal, and mental foramina in the races of man.
Am. J. Phys. Anthropol. 14: 85-100. Rightmire GP (1972) Cranial measurements and discrete traits compared in distance studies of
African Negro skulls. Hum. Biol. 44: 263-276.
104
Rosing FW (1984) Discreta of the human skeleton: a critical review. J. Hum. Evol. 13: 319-323. Russell F (1900) Studies in cranial variation. Am. Nat. 34: 737-745. Saunders SR (1989) Nonmetric skeletal variation. In MY Iscan and KAR Kennedy (eds.)
Reconstruction of Life from the Skeleton. Alan R. Liss: New York, pp. 95-108. Saxena SK, Balal BL, Chowdhary DS, Jain SP (1986) A non-metrical study of Nigerian cranium.
Anat. Anaz. 162: 171-174. Sawyer DR, Allison MJ, Elzay RP, Pezzia J (1978) The mylohyoid bridge of Pre-Columbian
Peruvians. Am. J. Phys. Anthrop. 48: 9-16. Sawyer DR, Allison MJ, Elzay RP, Pezzia A (1979) A study of torus palatinus and torus
mandibularis in Pre-Columbian Peruvians. Am. J. Phys. Anthrop. 50: 525-526. Sawyer Dr, Gianfortune V, Kiely ML, Allison MJ (1990) Mylohyoid and jugular foramen
bridging in pre-Coumbian Chileans. Am. J. Phys. Anthropol. 82: 179-181. Sawyer DR & Kiely ML (1987) Jugular foramen and mylohyoid bridging in an Asian Indian
population. Am. J. Phys. Anthropol. 72: 473-477. Sawyer DR, Kiely ML, Pyle MA (1998) The frequency of accessory mental foramina in four
ethnic groups. Achives of Oral Biol. 43: 417-420. Schulz HE (1933) Ein beitrag zur rassenmorphologie des unterkiefers. Zeitschrift fur Morphol
und Anthropol. 32: 275-366. Schwartz JH (1995) Skeleton Keyes: An Introduction to Human Skeletal Morphology,
Development, and Analysis. Oxford University Press: New York. Sciullli PW (1990) Cranial metric and discrete trait variation and biological differentiation in the
Terminal Late Archaic of Ohio: The Duff Site Cemetery. Am. J. Phys. Anthrop. 82: 19-29. Sellevold BJ (1980) Mandibular torus morphology. Am. J. Phys. Anthrop. 53: 569-572. Serman NJ (1989) The mandibular incisive foramen. J. Anat. 167: 195-198. Shankland WE (1994) The position of the mental foramen in Asian Indians. J. Oral Implantol.
20,2 118-123. Simonton FV (1923) Mental foramen in the Anthropoids and in man. Am. J. Phys. Anthrop. 6:
413-421.
105
Snow CC, Hartman S, Giles E, Young FA (1979) Sex and race determination of crania by calipers and computer: A test of the Giles and Elliot discriminant functions in 52 forensic science cases. J. Forens. Sciences. 24: 448-460.
Sonnier KE, Horning GM, Cohen ME (1999) Palatal tubercles, palatal tori, and mandibular tori:
Prevalence and anatomical features in a U.S. population. J. Periodontol. 70: 329-336. SPSS Inc. (2004) Statistical Package for the Social Sciences for Windows, Rel.13.0.0. Chicago. St. Hoyme LE & Iscan MY (1989) Determination of sex and race: accuracy and assumptions. In
MY Iscan and KAR Kennedy (eds.) Reconstruction of Life from the Skeleton. Alan R. Liss: New York, pp. 53-93.
Suchey JM. 1975. Biological Distance of Prehistoric Central California Populations Derived
from Non-Metric Traits of the Cranium. Ph.D. dissertation, University of California, Riverside.
Sutton RN (1974) The practical significance of mandibular accessory foramina. Aust. Dent. J.
19: 167-173. Suzuki M, Sakai T (1960) A familial study of torus palatinus and torus mandibularis. Am. J.
Phys. Anthrop. 18: 263-272. Thomson A (1916) On the presence of genial tubercles on the mandible of man and their
suggested association with the faculty of speech. J. Anat. Lond. 50: 43-74. Toh H, Kodama J, Yanagisako M, Ohmori T (1992) Anatomical study of the accessory mental
foramen and the distribution of its nerve. Okajimas Folia Anat. Jpn. 69: 85-88. Weidenreich (1936) The mandibles of Sinathropus Pekinensis: a comparative study.
Palaeontologia Sinica. Peking. Woo JK (1950) Torus palatinus. Am. J. Phys. Anthropol. 8: 81-111. Wood-Jones F (1930a) The non-metrical morphological characters of the skull as criteria for
racial diagnosis. I. Journal of Anatomy, 65: 179-195. Wood-Jones F (1930b) The non-metrical morphological characters of the skull as criteria for
racial diagnosis. II. Journal of Anatomy, 65: 368-378. Wood-Jones F (1930c) The non-metrical morphological characters of the skull as criteria for
racial diagnosis. III. Journal of Anatomy, 65: 438-445 Wood-Jones F (1933) The non-metrical morphological characters of the skull as criteria for
racial diagnosis. IV. Journal of Anatomy, 68: 96-108.

106
Zivanovic S (1970) Some morphological characters of the East African mandible. Acta anat. 77: 107-199.