Embed Size (px)
Citation preview
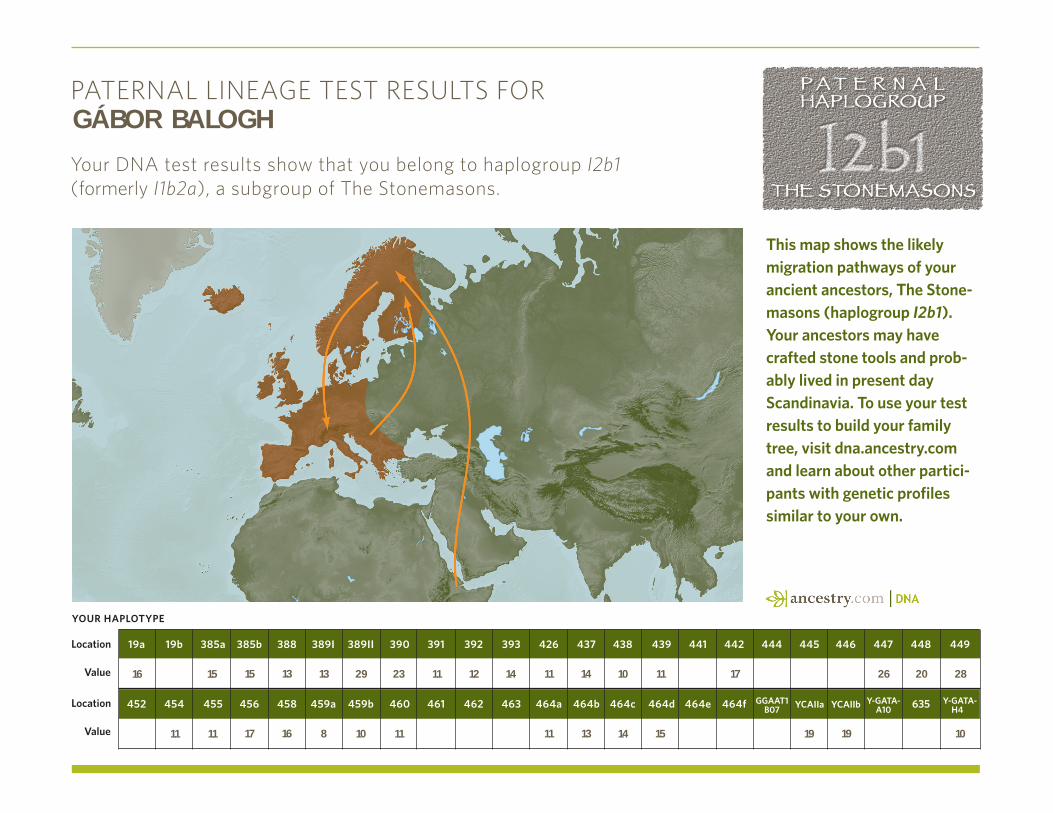
This map shows the likely migration pathways of your ancient ancestors, The Stone-masons (haplogroup I2b1). Your ancestors may have crafted stone tools and prob-ably lived in present day Scandinavia. To use your test results to build your family tree, visit dna.ancestry.com and learn about other partici-pants with genetic profiles similar to your own.
Paternal lineage test results for
Your Dna test results show that you belong to haplogroup I2b1 (formerly I1b2a), a subgroup of the stonemasons.
Your HaploTYpe
location
Value
19a 19b 385a 385b 388 389I 389II 390 391 392 393 426 437 438 439 441 442 444 445 446 447 448 449
452 454 455 456 458 459a 459b 460 461 462 463 464a 464b 464c 464d 464e 464f GGaaT1 YCaIIa YCaIIb Y-GaTa- 635 Y-GaTa- B07 a10 H4
location
Value 14
15
16
23
1019
1216 11
11
2826
11 1513
GÁBOR BALOGH
11
11 11
10
19
2013 14 1713 29
8
11
17 10
15 14
paGe 1
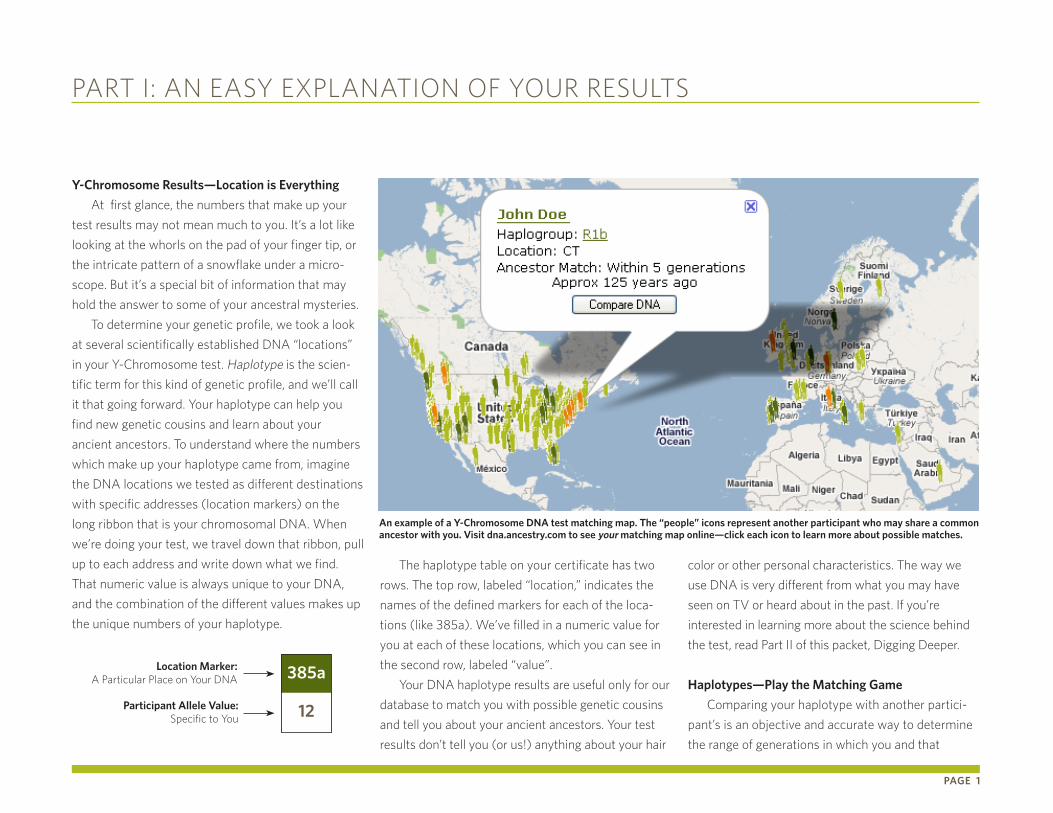
Y-Chromosome results—location is everything
at first glance, the numbers that make up your
test results may not mean much to you. it’s a lot like
looking at the whorls on the pad of your finger tip, or
the intricate pattern of a snowflake under a micro-
scope. But it’s a special bit of information that may
hold the answer to some of your ancestral mysteries.
to determine your genetic profile, we took a look
at several scientifically established Dna “locations”
in your Y-Chromosome test. Haplotype is the scien-
tific term for this kind of genetic profile, and we’ll call
it that going forward. Your haplotype can help you
find new genetic cousins and learn about your
ancient ancestors. to understand where the numbers
which make up your haplotype came from, imagine
the Dna locations we tested as different destinations
with specific addresses (location markers) on the
long ribbon that is your chromosomal Dna. When
we’re doing your test, we travel down that ribbon, pull
up to each address and write down what we find.
that numeric value is always unique to your Dna,
and the combination of the different values makes up
the unique numbers of your haplotype.
the haplotype table on your certificate has two
rows. the top row, labeled “location,” indicates the
names of the defined markers for each of the loca-
tions (like 385a). We’ve filled in a numeric value for
you at each of these locations, which you can see in
the second row, labeled “value”.
Your Dna haplotype results are useful only for our
database to match you with possible genetic cousins
and tell you about your ancient ancestors. Your test
results don’t tell you (or us!) anything about your hair
color or other personal characteristics. the way we
use Dna is very different from what you may have
seen on tV or heard about in the past. if you’re
interested in learning more about the science behind
the test, read Part ii of this packet, Digging Deeper.
Haplotypes—play the Matching Game
Comparing your haplotype with another partici-
pant’s is an objective and accurate way to determine
the range of generations in which you and that
Part i: an easY exPlanation of Your results
an example of a Y-Chromosome DNa test matching map. The “people” icons represent another participant who may share a common ancestor with you. Visit dna.ancestry.com to see your matching map online—click each icon to learn more about possible matches.
385a
12
location Marker: a Particular Place on Your Dna
participant allele Value:specific to You
participant may have shared a common ancestor.
our database automatically compares your
results with all other participants and lets you know
about possible matches. even if you have only a few
close matches now, we automatically compare your
results against each new entry in our continually
growing database.
Your list of matches starts with participants who
are most closely related to you. You’ll be able to view
the general home locations of participants in a map
like the one on page 1 and see matches between
2-70 generations, as well as an estimate of the Most
recent Common ancestor (MrCa) that you share
with your matches. Your MrCa is an approximate
number of years since you had a direct ancestor in
common. an ancestor match of “approximately 550
years ago” could mean you shared a great-great-
great-great-great-great grandfather.
Genetic Cousins—exploring the possibilities
You can unlock your new connections whenever
you like. Visit your results on dna.ancestry.com and
click on the “Paternal Matches” button, then click on
the names of matching participants to see how you
are related. We’ll notify you by email when a new
participant matching your haplotype is added to
our database.
When you find a match, you can contact your
genetic cousins and compare family trees using the
secure ancestry.com Connection service to protect
your email address. if you’re fortunate, our common
ancestor analysis will narrow your search to a time
frame, and together, you and your genetic cousin will
discover the ancestor who joins your two family trees.
You may be contacted by someone as well. an
opportunity to collaborate with your genetic cousins
depends on the level of participation you designate
online. You may elect to share only your contact
name with others or remain entirely anonymous.
these preferences are available under “My account”.
Your ancient ancestors—Where It all Started
We determine your haplogroup based on your
haplotype. Your haplogroup then gives you clues
about the life and times of your ancient ancestors
from tens of thousands of years ago.
starting from the point in human history when
many ancient ancestral groups migrated out of africa,
discrete populations began to settle in different parts
of the world. over generations, as they adapted to
their unique environments, each population’s genes
became slightly different from the original african
group. some of those differences were random, while
others provided genes for characteristics which let
groups thrive in their environments. taken together,
those genetic differences define haplogroups.
Your haplogroup is described by a letter, a
through t. numbers and lowercase letters may also
subdivide your haplogroup. everyone in a haplogroup
shares a certain number of values at definitive
locations on their Y-chromosomal Dna. We took a
look at those locations on your Dna and matched
you to a haplogroup.
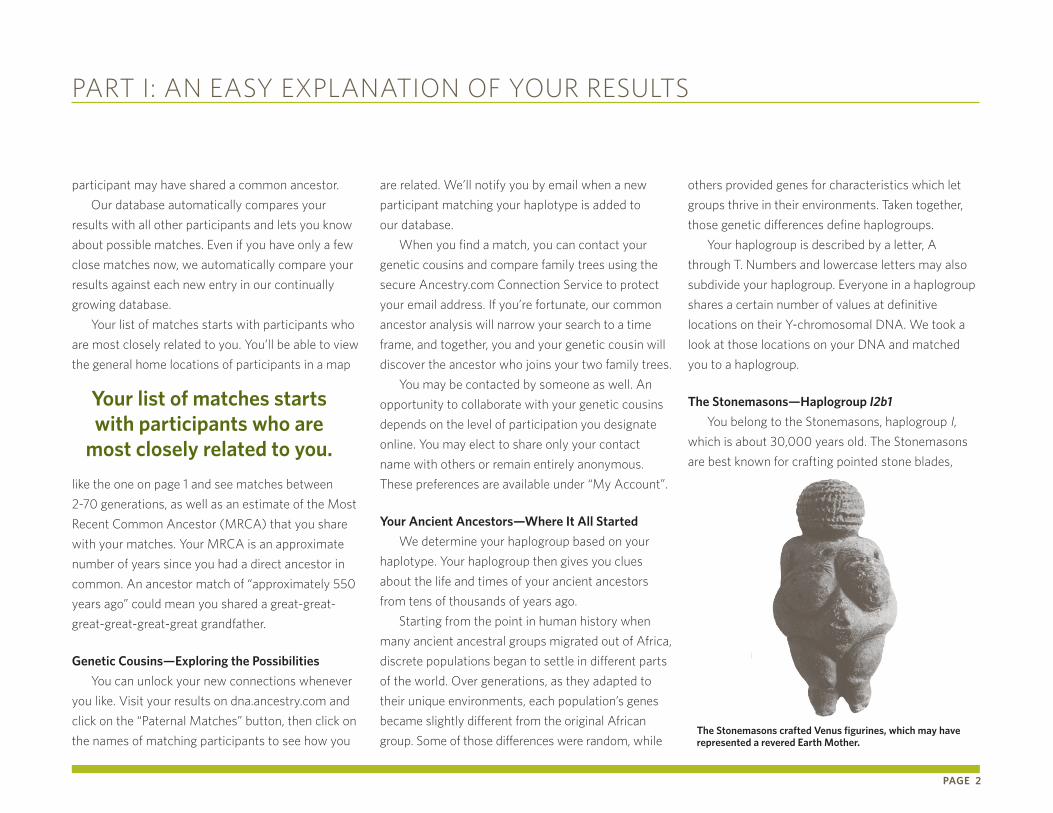
The Stonemasons—Haplogroup I2b1
You belong to the stonemasons, haplogroup i,
which is about 30,000 years old. the stonemasons
are best known for crafting pointed stone blades,
Part i: an easY exPlanation of Your results
paGe 2
The Stonemasons crafted Venus figurines, which may have represented a revered earth Mother.
Fpo
Your list of matches starts with participants who are
most closely related to you.
known as gravette Points, to hunt bison, horse,
reindeer and mammoths.
stone played both a functional and religious role
for the stonemasons, who crafted voluptuous Venus
figurines, possibly out of steatite, calcite, limestone or
other soft stone. although the exact significance of
the figurines is not known, they may represent
fertility or the earth Mother goddess, a concept
which prevails in many cultural mythologies. the
stonemasons could have regarded the earth Mother
as a symbol of security or as a deity who enabled
plentiful harvests and numerous offspring.
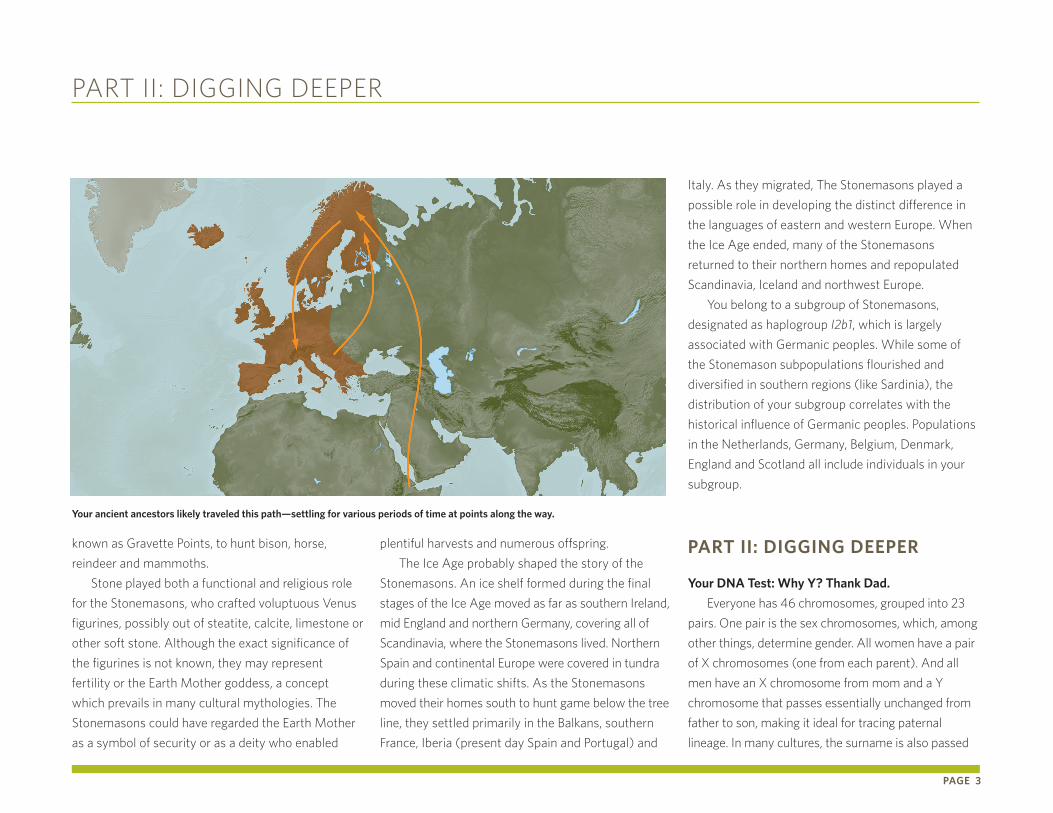
the ice age probably shaped the story of the
stonemasons. an ice shelf formed during the final
stages of the ice age moved as far as southern ireland,
mid england and northern germany, covering all of
scandinavia, where the stonemasons lived. northern
spain and continental europe were covered in tundra
during these climatic shifts. as the stonemasons
moved their homes south to hunt game below the tree
line, they settled primarily in the Balkans, southern
france, iberia (present day spain and Portugal) and
italy. as they migrated, the stonemasons played a
possible role in developing the distinct difference in
the languages of eastern and western europe. When
the ice age ended, many of the stonemasons
returned to their northern homes and repopulated
scandinavia, iceland and northwest europe.
You belong to a subgroup of stonemasons,
designated as haplogroup I2b1, which is largely
associated with germanic peoples. While some of
the stonemason subpopulations flourished and
diversified in southern regions (like sardinia), the
distribution of your subgroup correlates with the
historical influence of germanic peoples. Populations
in the netherlands, germany, Belgium, Denmark,
england and scotland all include individuals in your
subgroup.
parT II: DIGGING Deeper
Your DNa Test: Why Y? Thank Dad.
everyone has 46 chromosomes, grouped into 23
pairs. one pair is the sex chromosomes, which, among
other things, determine gender. all women have a pair
of x chromosomes (one from each parent). and all
men have an x chromosome from mom and a Y
chromosome that passes essentially unchanged from
father to son, making it ideal for tracing paternal
lineage. in many cultures, the surname is also passed
Part ii: Digging DeePer
paGe 3
Your ancient ancestors likely traveled this path—settling for various periods of time at points along the way.
from father to son. this fortunate coincidence is what
makes tracing your paternal lineage through genetic
similarities so powerful for genealogy.
location markers on the Y chromosome from your
Dna sample were analyzed and compared against
other ancestry.com participants’ results to automati-
cally find people closely related to you. so, the first
application of your results is to contact possible
relatives you wouldn’t have otherwise known about.
see page 2 for more about how to do this through our
service. additionally, if your traditional genealogy work
has led you to potential living relatives—particularly
those who share your surname—and you’d like to
confirm a connection with those individuals, encour-
age them to take a Y-Dna test as well. Comparing
your results will provide you with an objective and
scientific basis for confirming your familial ties.
alleles & location Markers—the DNa Details
What is it that makes your information unique?
and if it’s so unique, why do other people have some
of the same information?
imagine your Dna as a long set of Morse code
instructions. Just like one “short” signal and one “long”
signal give you a Morse code value (a), your Dna
repeats its “signal” in unique ways. Your haplotype has
different values based on the number of times your
Dna repeats its code in the different locations.
the numeric value given for each location repre-
sents a count of repeating sequences of Dna building
blocks called bases. Dna is comprised of four bases:
adenine (a), Cytosine (C), guanine (g), and thymine
(t). those four bases line up to create a code, much
like the kind of code computer programmers use.
Your Y-chromosome test measures the pattern of
base repeats in your Dna code at specific locations.
for example, a pattern of aaCg aaCg aaCg would
result in a value of “3”, because the sequence “aaCg”
repeats three times.
Your test results, therefore, represent a unique
pattern of repeating Dna which is inherited from
your paternal lineage.
We record the Dna repeats in each of either 33
or 46 locations—depending on which Dna test you
chose—and end up with a very rich message which is
your haplotype. Because we look at so many locations,
we have many points of comparison. You may match
with someone in 15 different locations and you’ll would
still have 18 or 31 values which are unique to you. By
looking at so many different locations, we can say
something about the degree to which you match with
another participant. so, are you related? You get more
than a “yes” or “no” answer.
When comparing haplotypes, your closest
matches will differ at fewer than 2 or 3 marker
locations. a “good” match will yield a likely common
ancestor only a few generations back. But you can
match up to someone at fewer locations and still
discover that you’re part of the same haplogroup;
your common ancestor may have lived tens of
thousands of years ago, or at any point in between.
rates of Mutation—The Brains Behind Matching
figuring out how your haplotype matches up with
someone else’s is more involved than a simple one-
to-one comparison of location values. each of the
haplotype locations has a value which is unique to
you. and finding that same value at that same
location on someone else’s haplotype is meaningful.
But matching certain location values can be more
significant than matching at others.
Why’s that?
Certain bits of Dna are passed along relatively
untouched from father to son, but other bits of Dna
tend to change (mutate) each time they are passed
down. the changes are completely harmless, but
they’re still identifiable. so the Dna at some of the
locations we look at tends to change a lot from
generation to generation, while Dna at other locations
changes very little when it’s passed along from father
Part ii: Digging DeePer
paGe 4
The first application of your results is to pursue
possible relatives you wouldn’t have otherwise
known about.
to son. although they can’t know how the Dna will
change, scientists do know the constant rate at which
Dna changes at each of the locations. and every
location has a different rate of change.
a match in two participant results at a location
known to have a high rate of change indicates a
closer relationship than a match at a location known
to have a low rate of change. statisticians and
geneticists have figured out fairly exact odds for
change (mutation rates) in the Dna in each of the
locations. By using those odds in a calculation, we
can tell you just how meaningful a match is, and how
closely related you are to another participant.
We’re constantly updating our data and statistics
to keep them as current as research allows, giving
you the most precise matching information available.
MrCa—a potential link
MrCa stands for Most recent Common ancestor.
it’s an important genealogical term and gives you an
idea of how many generations in the past you and
another participant may have shared an ancestor.
MrCa calculations are based on the number of
location markers tested (either 33 or 46), the number
of matching values, and the mutation rate of the
markers. this provides you with a starting point from
which you can compare respective family pedigrees
with other participants to discover if you indeed share
an identical ancestor.
our MrCa report provides a confidence range
from 50% to 95%. at 50% confidence, you have an
equal chance that the generational range might be
greater than what is stated. the higher the confidence
level is set, the broader the generational range. this
information can spark a new trail to a branch of your
family tree or confirm or negate a lead you already
had. see Part i for more about how to apply your
results to build your family tree.
Still Have Questions?
if you have questions about your results, the
science behind our tests, or how to connect with
potential matches, our website’s live chat and email
features allow you to contact us directly. for more
information, visit our blog at dna.ancestry.com and
visit the ancestry.com learning Center to see videos
about our services.
Part ii: Digging DeePer
paGe 5


![Report on the Paternal Ancestry Of [Name] on the Paternal Ancestry Of [Name] Trace Your Ancestry Christine Wibberley, LL.B. (Hons), Genealogist and Family Historian, AGRA Member,](https://img.pdfslide.net/doc/110x75/5ae36fcc7f8b9a5b348d734b/report-on-the-paternal-ancestry-of-name-on-the-paternal-ancestry-of-name-trace.jpg)
![Report on the Paternal Ancestry Of [Name] · Christine Wibberley, LL.B. (Hons), Genealogist and Family Historian, AGRA Member, (non practising Solicitor), ... Mary Ann JONES 1884-1960](https://img.pdfslide.net/doc/110x75/5b6591fc7f8b9a345c8bd393/report-on-the-paternal-ancestry-of-name-christine-wibberley-llb-hons.jpg)

![Lesson 86 Birth and Childhood. [1] The paternal and maternal ancestry of the Prophet (SAWS)](https://img.pdfslide.net/doc/110x75/56649da85503460f94a94363/lesson-86-birth-and-childhood-1-the-paternal-and-maternal-ancestry-of-the.jpg)