Embed Size (px)
Citation preview
Analytica Chimica Acta, 2&l (1994) 573-586 Elsevier Science B.V., Amsterdam
573
Determination of copper speciation in marine waters by competitive ligand equilibration/liquid-liquid extraction:
an evaluation of the technique
Lisa A. Miller
Lkpartment of Chemistry and Biochemistry, University of Califomia, Santa Gnu, CA 95064 OJSA)
Kenneth W. Bruland
Institute of Marine Sciences, University of California, Santa Gnu, CA 95064 (USA)
(Received 21st October 1992; revised manuscript received 11th January 1993)
Abstmet
A technique for determining organic complexation of copper using a competitive ligand equilibration coupled with liquid-liquid extraction was evaluated with respect to its applicability in marine waters. Particular attention was paid to the equilibration times required, extractability of naturally occurring organic copper complexes, and consistency with results from electrochemical techniques. In general, it was found that although this approach produces results that agree well with those from other analyses of the open ocean, there are unresolved discrepancies when it is applied to copper analyses in estuarine samples. The ability to use the technique for analysis of a single sample at different competition strengths, or analytical windows, was also examined. In open ocean waters, it was possible to identify two discrete ligand classes with three different windows, although the determined extent of binding did increase with increasing competition strength.
IGeywordr: Atomic absorption spectrometry; Stripping voltammetry; Copper; Metal speciation; Sea water; Solvent extraction
The study of chemical speciation involves iden- tification of the various forms of an element within a system. For a given oxidation state of a metal cation such as copper011 in natural waters, the likely species will include the “free” hydrated ion, relatively weak and labile inorganic com- plexes, generally stronger and more inert organic complexes, and particulate forms associated with colloids and suspended particles, either surface adsorbed or within the lattice. Among the truly dissolved forms in sea water, thermodynamic cal- culations have been successful in identifying the important complexes with major inorganic anions
Correspondence to: K.W. Bruland, Institute of Marine Sci- ences, University of California, Santa Crux, CA 95064 (USA).
[1,2]. Although it is known that organic complexa- tion of metal cations may influence steps in their biogeochemical cycles, including biological assim- ilation and adsorption onto particles, e.g. [3,4], we are just beginning to understand the organic spe- ciation of metals in marine waters. Recent data suggest that for at least a few metals, very strong organic complexes with unidentified ligands exist- ing at low concentrations can be significant or even dominant [5-111. Although important ad- vances have been made in the field, critical evalu- ation of existing techniques followed by their extensive application to the systematic study of the oceans is still necessary.
A number of analytical techniques which iden- tify some part of the organically complexed frac-
fK103-2670/94/$07.00 0 1994 - Elsevier Science B.V. All rights reserved SSDI 0003-2670(93)E0099-S
574 L.A. Miller and R W Bruhd /Anal. Chim. Acta 284 (1994) 573-586
tion of metals in natural waters have been re- ported over the last decade [6,12-N]. tie funda- mentally different approaches have been used to determine metal-organic ligand complexation, depending on the extent of sample manipulation. One of these approaches, utilized by several tech- niques, is based upon the direct detection of a metal species under ambient conditions, or with minimal sample perturbation. If the dissolved speciation of a generic metal, M”+, can be repre- sented by
M, = M”++ MX, + ML, (1)
where naturally occurring ligands are represented by Xi (inorganic) and Li (organic), these tech- niques determine M”+ [13], M’ (where [M’] = [M”+l + [MX,]) [14-161, or ML, 1181. Such direct techniques are often limited by the low concen- trations at which many metals occur, particularly in sea water. Total metal concentrations can ap- proach the detection limits of available instru- mentation, and speciation analyses require the ability to determine just a fraction of that.
The second approach used to examine trace metal speciation involves a controlled and well- characterized competition for the metal between the native ligands and an added metal binding agent which also allows concentration of the sam- ple, thus circumventing detection limitations [6,121. In these techniques, the sample is per- turbed by the addition of a competing ligand, A, and allowed to come to equilibrium before analy- sis of the metal in the competing complex, MA. Theoretically, any method that will quantify MA could serve as the final detection step. Both ad- sorptive cathodic stripping voltammetry (ACSV) [6] and liquid-liquid extraction coupled with graphite furnace atomic absorption spectrometry (GFAAS) [12] have been used as concentration/ detection systems in these techniques. Titration with the metal allows determination of the natu- ral ligand concentration(s), [L,], and the condi- tional stability constant(s) at the ionic strength and major ion composition of the sample, K&,,+ for the natural complex(es). With this informa- tion, the original unperturbed speciation can be calculated.
Recent work by van den Berg et al. [19,20] has
shown that the degree of complexation deter- mined can be strongly influenced by the analyti- cal technique used. Each technique can identify only a limited range (or window) of ligand bind- ing. For the natural ligand, the extent of binding can be defined as the product of the excess ligand concentration (that fraction not bound by the metal) and the stability constant of its complex with the metal,
Q~L= [MLI/[M"+I = F'IG,,, (2)
In the direct techniques, such as anodic strip- ping voltammetry, one limit for the determination 0f [ML]/[M”+] is set by the sensitivity and detec- tion limit (e.g. the smallest quantity of [M’] ob- servable) and the other by the precision and accuracy ([ML,] is determined from [MT] - [M’]). If the extent of organic complexation (Eqn. 2) is too large, [M’] falls below the detection limit for the technique, and if [MLl/[M’] is too small, it is not possible to distinguish between the presence or absence of the organic ligand. With competi- tive techniques, if either the natural or the com- peting ligand system overwhelmingly dominates, the natural ligand cannot be conclusively identi- fied. When ML predominates, the detection limit for MA precludes analysis at low metal additions (below [L]) and only the ligand concentration can be determined, not Kknd. Conversely, excessive competition by the added ligand can draw all of the metal out of the natural complexes and the titration behaves as though the native ligand is not present.
If there were only one ligand present, it would be possible to choose a technique with a suitable window and proceed. In a sample where more than one ligand class or even a continuum of binding sites exits, however, a single analytical window can give an incomplete, and often mis- leading, picture of the metal speciation. There- fore, in order to gain a realistic picture of the in situ speciation, either multiple techniques or those that can be modified easily to examine a number of detection windows are needed.
Although a number of techniques are available to study copper complexation, examination of copper speciation by new techniques can prove useful in evaluating their suitability to environ-
LA. Miller and K W Bruland /Anal Chim. Acta 284 (19941573-586 575
mental analyses. In this study, we have taken a closer look at a method for copper speciation reported by Moffett and Zika [12] with a view to eventually applying the approach to the analyses of other metals. The Moffett and Zika technique involves a competitive equilibration of the sample with acetylacetonate followed by extraction of the copper diacetylacetone complex and GFAAS of copper associated with the organic phase. The concentration of the natural copper-binding lig- ands and the stabilities of their complexes can be identified .from titrations with copper. With the multi-element flexibility of GFAAS, this ap- proach can potentially be adapted to study a wide range of metals, using a variety of competing ligands and modifying the concentration factors as necessary. Also, because this is a competitive equilibration technique, the lability of the metal complexes is less likely to influence the deter- mined stability constants, provided sufficient time is allowed for the sample to reach equilibrium during the analysis. We have examined the appli- cability of the copper technique to both open ocean and estuarine samples, particularly with regards to equilibration kinetics, extractability of the naturally occurring organic complexes, and consistency with results from electrochemical analyses.
The competitive ligand equilibration/liquid- liquid (solvent) extraction (CLE-SE) approach also has a great capacity for modifying the detec- tion window by changing both the added ligand concentration and the solvent ratio. We took advantage of this potential, examined a range of analytical windows, and attempted to distinguish between discrete ligand classes and a continuum of binding sites in both central Pacific and San Francisco Bay samples.
THEORY
The competitive ligand equilibration/solvent extraction (CLE-SE) technique for copper in- volves the’ addition of acetylacetone (acac) and toluene to a sample which is allowed to come to equilibrium before the phases are separated. Ide- ally, the acac is added at a concentration that
establishes a competition between the added and natural ligands, rather than forcing complexation and extraction of all the C&I) present. The neutrally charged, dissolved copper diacetylaceto- nate complex, Cu(acac),, is partitioned between the water and toluene, while other copper species ideally remain in the aqueous phase. The sea water phase is discarded, and the copper in the toluene is quantitatively back extracted into di- lute nitric acid. Ultimately, Cu in the acid frac- tion is determined by GFAAS.
The equilibrium speciation in the perturbed sample may be represented by
[CUT] = [Cu”] + [CUX,] + [CuLi]
+ [Cuacac+] + [Cu(acac),]
+[&*I (3) where the inorganic complexes are given by CuXi, CuLi are the naturally occurring organic com- plexes strong enough to compete with the acac, and [Cu*] the quantity of Cu(acac), removed from the aqueous sample into the toluene. The values of [Cur] and [Cu*] are independently measured and, in theory, the remaining quantities in Eqn. 3 can be calculated using the equations in Table 1.
A titration curve is generated by incrementally increasing the total metal concentration, and the speciation is calculated at each point. As shown in Fig. 1, the signal response is linear after the natural ligand is fully saturated, and extrapola-
TABLE 1
Equations for calculating speciation in a perturbed sample from one analysis
(V, I volume of the phase x, KNcII,= distribution coefficient of Cu(acac),, & = formation constant for Cu(acac),, K, = formation constant for Cuacac+, acut = inorganic side reac- tion coefficient for copper in sea water [21], [acac-I calcu- lated from total [acac] and side reactions with major cations, [Cu,] from an independent analysis)
1 [Cu * I= l.cU_l,,V~~i~ / Q 2 [Cu(acac)J = Ku* IV, /(Kd(Cu&J 3 [Cu’+ ] = [Cu(acac),]/(&[acac- 1’) 4 [Cuacac + J = KIICuZ+ Iacac- I 5 1cux,1= noJcuZ+ 1 6 [CuL,]=[Cu,]-([CuZ+]+~CuX,l+~Cuacac+l
+ [Cu(acac),] + [Cu* D
576 L.A. M&r and K. U? Brukznd /Anal. Chim. Acta 284 (1994) 573-586
7 Y
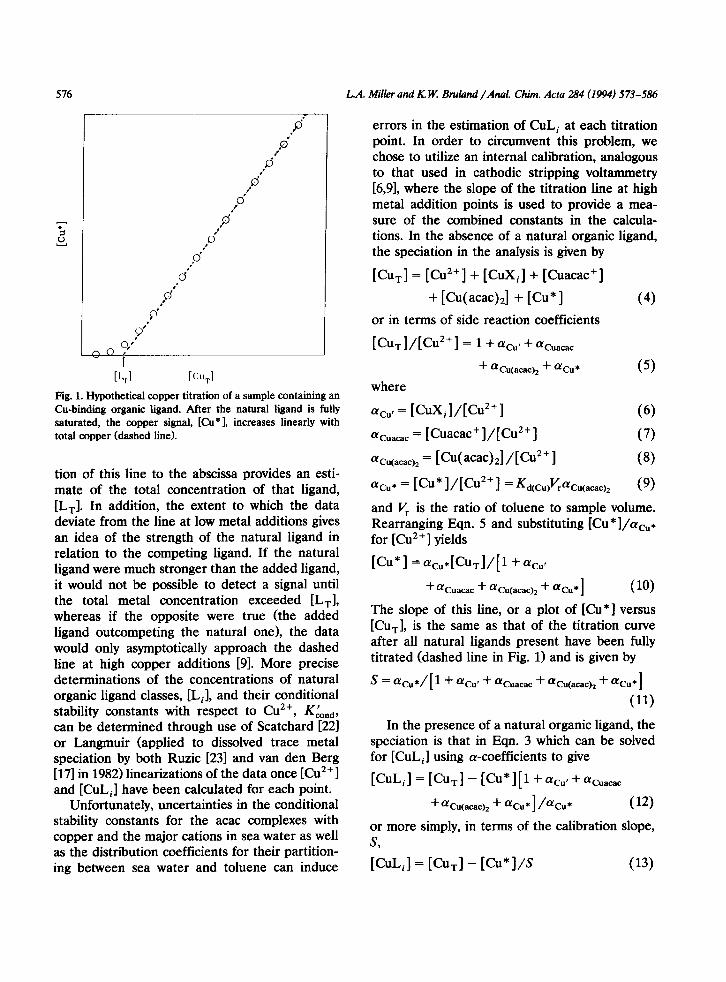
Fig. 1. Hypothetical copper titration of a sample containing an Cu-binding organic ligand. After the natural ligand is fully saturated, the copper signal, [Cu*], increases linearly with total copper (dashed line).
tion of this line to the abscissa provides an esti- mate of the total concentration of that ligand, [Lr]. In addition, the extent to which the data deviate from the line at low metal additions gives an idea of the strength of the natural ligand in relation to the competing ligand. If the natural ligand were much stronger than the added ligand, it would not be possible to detect a signal until the total metal concentration exceeded [Lrl, whereas if the opposite were true (the added ligand outcompeting the natural one), the data would only asymptotically approach the dashed line at high copper additions [91. More precise determinations of the concentrations of natural organic ligand classes, [L,], and their conditional stability constants with respect to Cu2+, Kknd, can be determined through use of Scatchard [22l or Langmuir (applied to dissolved trace metal speciation by both Ruzic [23] and van den Berg [17] in 1982) linearizations of the data once [Cu2+ 1 and [CuLJ have been calculated for each point.
Unfortunately, uncertainties in the conditional stability constants for the acac complexes with copper and the major cations in sea water as well as the distribution coefficients for their partition- ing between sea water and toluene can induce
errors in the estimation of CuL, at each titration point. In order to circumvent this problem, we chose to utilize an internal calibration, analogous to that used in cathodic stripping voltammetry [6,9], where the slope of the titration line at high metal addition points is used to provide a mea- sure of the combined constants in the calcula- tions. In the absence of a natural organic ligand, the speciation in the analysis is given by
[Cur] = [Cu”‘] + [CuX,] + [Cuacac+]
+ [Cu(acac)2] + [Cu*]
or in terms of side reaction coefficients
D,1/D2’1 = 1+ %“’ + %uacac
(4)
+cU Cu(acac)* + %u* (5) where
c+“‘= [CLlxi]/[cu’+] (6)
%uacac = [Cuacac+]/[Cu2+] (7)
%“(a+* = [Cu(acac),] /[Cu’+] (8)
UC”* = Ku* l/D”1 = &(Cu)K~Cu(acac)* (9) and V, is the ratio of toluene to sample volume. Rearranging Eqn. 5 and substituting [Cu*]/cu,* for [Cu2+] yields
Ku* 1 = %*Dw[ 1+ %“’
+ff Cuacac + ~C”(acac)2 + %“*I (10)
The slope of this line, or a plot of [Cu* ] versus [Cur], is the same as that of the titration curve after all natural ligands present have been fully titrated (dashed line in Fig. 1) and is given by
s = %*/[ 1 + %“’ + acuacac + ~C”(acac)2 + %*I
(11)
In the presence of a natural organic ligand, the speciation is that in Eqn. 3 which can be solved for [CuL,] using cy-coefficients to give
lIcuLiI = [&*I - icu*l[l +aCu’ +aCuacac
+a cu(acac)z + %*] /%J* (12)
or more simply, in terms of the calibration slope, s,
[CULi] = [Cur] - [cu*]/s (13)
LA M&r and R W. Bnrland/A~l. Chitn. Acta 284 (1994) 573-586 577
Solving for [Cu*+], the other quantity necessary to linearize the titration data, is somewhat more complicated. Rearranging Eqn. 9, we get
D2’l= [a* l/~d(cu)K~cu(acac) (14) Determination of this value requires the actual calculation of aW,,C)z and the direct invocation of the uncertain constants in Table 1. In order to do this, we used the experimental calibration slope and literature values for all the stability constants to estimate the distribution coefficient of the acetylacetonate complex. That value was calculated from the calibration slope using Eqn. 11 after substituting from Eqn. 9,
K d(Cu) = s [ 1 + %I’ + %wxac + “Cu(acac),]
/K/l”cu(acac),(l - 9 (15)
The quantities aCuacac and aW._+ were calcu- lated from 4 and 3 in Table 1, respectively,
ff cuacac = K,[acac-] (16)
aWacacjz = B2bcac-12 (17) It is important to note that this calculation
may not be an accurate determination of the distribution coefficient, KNc,,), for Cu(acac), be- tween sea water and toluene. Rather, it is a calibration accounting for the errors in all of the constants. The correction was made to only KNti) for simplicity, but K,, /3*, or any of the other constants could also have been adjusted. Since this is an internal calibration applied to each and every titration, it can effectively account for the variations between samples (i.e. potential salinity and surfactant differences) as well as the uncer- tainties in the thermodynamic constants. Esti- mates of K, carried out in this manner varied between 3 and 26, with an average of 7. Stary and Liljenzin’s review of acetylacetone constants re- port a best value of 7.08 for K, [24], and Moffett and Zika determined a distribution coefficient of 6.2 in artificial sea water [12].
The internal calibration approach used in this study is limited by the assumption that all of the ligands are fully titrated at the high metal addi- tion points. Great care must also be taken in choosing the calibration line as the final results are strongly dependent on the slope of that line.
Moffett and Zika [12] calibrated the technique in UV-oxidized sea water using NTA and EDTA as model ligands. Because copper binding by these ligands is relatively weak in a sea water matrix, large concentrations were needed and full titra- tions were not practical. In that study, aacaC-= [acac,]/[acac-] was determined from the distri- bution of copper between the model ligand and acetylacetonate. That experimentally determined value of a,,- was applied to actual titrations in natural water samples with calculations analagous to those in Table 1. Using a Kd of 6.2 for the copper-acetylacetonate complex, they found a acaC- to be (2.1 f 0.1) X lo*. In the absence of the model organic ligands, a,- was much more variable, underscoring the limitation of applying a single calibration to different samples. Here, we used literature values for acetylacetonate binding with major cations and protons [12,24-261, in- cluding Moffett and Zika’s determination of K as well as the distribution of Hacac be%gn water and toluene [24] to calculate an a BCBC- value of 2.2 X lo* at pH 8.1, in excellent agreement with the previous study.
The constants used in this study were taken from the literature [12,24-261 and corrected where necessary to sea water ionic strength using the Davies approximation. The inorganic side re- action coefficients for copper at the experimental pH values were calculated using Titrator [27] and constants from Smith and Martell [28]. An acu, of 33 was calulated at pH 8.10.
Both Scatchard and Langmuir linearizations were used in this study, since each has limitations when applied to scattered data. Averages of the results from each linearization technique were used whenever possible. The Langmuir lineariza- tion sometimes gave a negative intercept, thereby not allowing an estimate of the stability constant. In such cases, only the Scatchard linearizations were used.
EXPERIMENTAL
All analyses were conducted in class 100 clean areas. Separatory funnels and reagent bottles were initially cleaned by soaking for at least one
578 LA Mller and K W. Brukd /Anal. Chim. Acta 284 (1994) 573486
week each in 6 M HCl, 7.5 M HNO,, and aqua regia (reagent grade) and sat for at least a month filled with dilute quarts distilled nitric acid (Q- HNO,) before use. Reagents were made up in quartz distilled water which was also used for all rinses with the exception of extractions per- formed at sea which used water purified in a Millipore ion exchange system (Mill&Q water). Copper standards were made from Baker aque- ous atomic spectral standards, HPLC-grade toluene (Fisher) was redistilled in a quartz sub- boiling still, and Aldrich gold-label acetylacetone and diethylenetriaminepentaacetic acid (DTPA, G. Frederick Smith) were used without further purification.
In each extraction, a known quantity of sample was added to a Teflon separatory funnel with the appropriate amount of additional copper, shaken for 1 min, and allowed to sit for at least 15 min. Acetylacetone and toluene were added and the sample was equilibrated with intermittent shak- ing. Sample and toluene volumes, as well as acac concentrations and maximum total copper added are shown for each titration in Table 2. The aqueous phase was drained and disposed of after
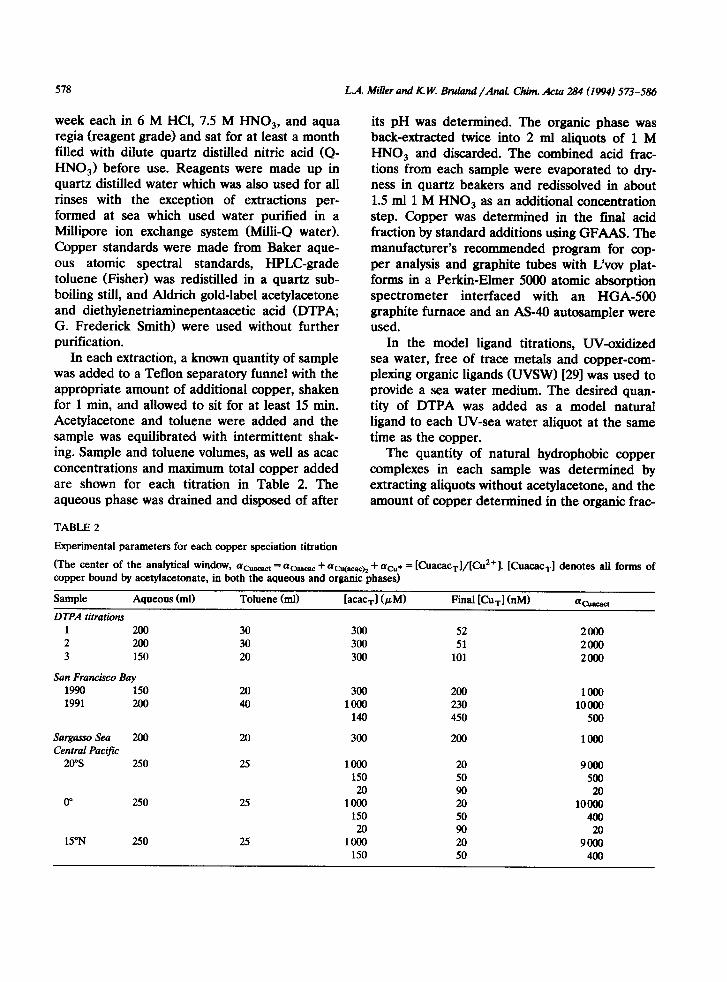
TABLE 2
Experimental parameters for each copper speciation titration
its pH was determined. The organic phase was back-extracted twice into 2 ml aliquots of 1 M HNO, and discarded. The combined acid frac- tions from each sample were evaporated to dry- ness in quartz beakers and redissolved in about 1.5 ml 1 M HNO, as an additional concentration step. Copper was determined in the final acid fraction by standard additions using GFAAS. The manufacturer’s recommended program for cop- per analysis and graphite tubes with L’vov plat- forms in a Perkin-Elmer 5CKKl atomic absorption spectrometer interfaced with an HGA-500 graphite furnace and an AS-40 autosampler were used.
In the model ligand titrations, UV-oxidized sea water, free of trace metals and copper-com- plexing organic ligands (UVSW) [291 was used to provide a sea water medium. The desired quan- tity of DTPA was added as a model natural ligand to each UV-sea water aliquot at the same time as the copper.
The quantity of natural hydrophobic copper complexes in each sample was determined by extracting aliquots without acetylacetone, and the amount of copper determined in the organic frac-
(The center of the analytical window, aCuaeaet = aCuaeae + aWacach + (Ye* = lCuacac,l/lCu*‘l. lCuacac,l denotes alI forms of copper bound by acetylacetonate, in both the aqueous and organic phases)
Sample Aqueous (ml) Toluene (ml) [acac,l (PM) Final [t&l (nM) %Iacacl
DTPA titration
1 200 2 200 3 150
San Francisco Bay
1990 150 1991 200
30 300 52 2000 30 300 51 2000 20 300 101 2Olm
20 300 200 loo0 40 loo0 230 10000
140 450 500
SargassoSea 200 20 300 Central Pacijii
20”s 250 25 loo0 150 20
0” 250 25 1000 150 20
15”N 250 2s 1000 150
200
20 50 90 20 50 90 20 50
1000
9000 500
20 10000
400 20
9ooo 400
LA. MiUer and K W. Bruhd/Anal. Chh Acta 284 (1994) 573486 579
tion was subtracted from the extracted copper signal, [Cu*], in the titration calculations. Proce- dural blanks were less than 1 nM for the open ocean and UVSW titrations and less than 5 nM for the San Francisco Bay titrations. These blank values were determined by subjecting Milli- wa- ter to the full extraction procedure and added to the known total copper in the speciation calcula- tions.
Total copper in the San Francisco Bay samples was determined by the pyrollidine dithiocarba- mate-diethylolithiocarbamate extraction method while those from the central Pacific were ana- lyzed by Chelex-100 preconcentration [30]. The Sargasso Sea sample was analyzed for total cop- per by CSV after UV-oxidation [31].
Samples Estuarine samples were collected at a depth of
1 m from the South San Francisco Bay in September of 1990 and October of 1991 in the central channel, just south of the Dumbarton bridge. As a region, South San Francisco Bay is highly contaminated with trace metals, including Cu [32]. In contrast, samples were also taken from the Sargasso Sea in April of 1989 (32”N, f#‘W at 90 m) and the central Pacific in August of 1991 (135”W, 20”s at 50 m; 145”W, 0” at 40 m; 153”W, 15”N at 30 m). These were open ocean waters and include a station in the high nutrient region of the equatorial Pacific as well as three central gyre locations. All samples were collected cleanly and immediately filtered through 0.4-pm polycarbonate membrane filters (open ocean) or 0.45~pm filter cartridges (San Francisco Bay). The Sargasso Sea and 1990 San Francisco Bay sam- ples were stored frozen prior to analysis, but those from the central Pacific were analysed at sea within three days of collection, and the 1991 San Francisco Bay sample was immediately taken back to UCSC, stored at 4°C in the dark, and analysed that same week.
RESULTS AND DISCUSSION
iUo&l titrations In order to evaluate the ability of CLE-SE to
characterize the complexation of copper by or-
I I I I
0 10 20 30 40 50 60 70
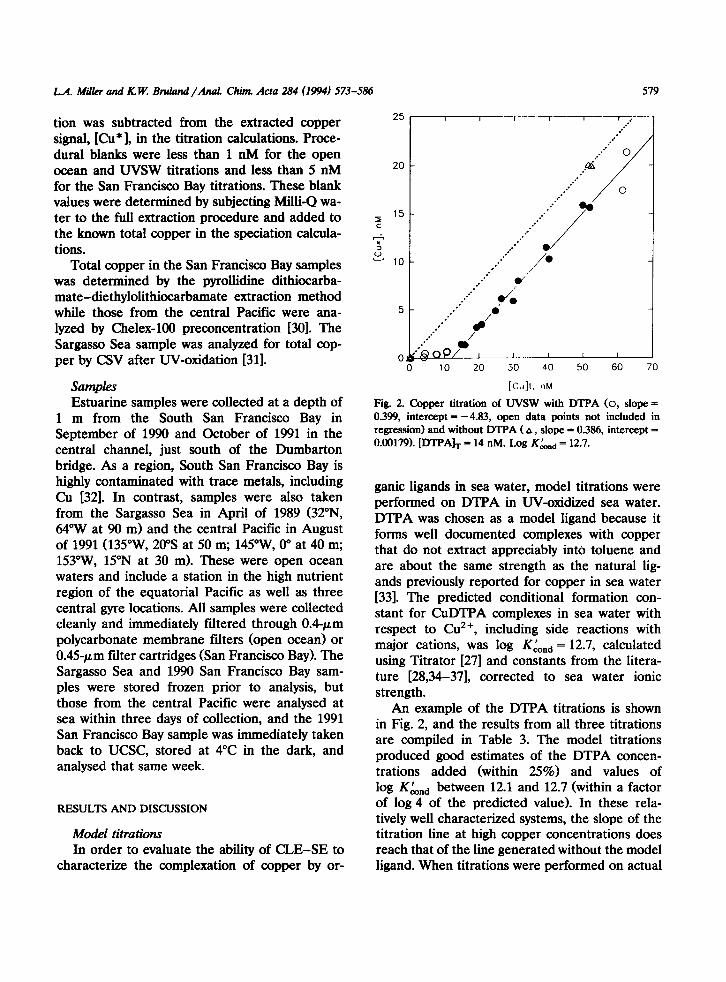
Fig. 2. Copper titration of WSW with DTPA (0, slope = 0.399, intercept = -4.83, open data points not included in regression) and without DTPA (A, slope = 0.386, intercept = 0.00179). [DTPA], = 14 nM. Log K&,,,, = 12.7.
ganic ligands in sea water, model titrations were performed on DTPA in W-oxidized sea water. DTPA was chosen as a model ligand because it forms well documented complexes with copper that do not extract appreciably into toluene and are about the same strength as the natural lig- ands previously reported for copper in sea water [33]. The predicted conditional formation con- stant for CuDTPA complexes in sea water with respect to Cu2+, including side reactions with major cations, was log Kknd = 12.7, calculated using Titrator [27] and constants from the litera- ture [28,34-371, corrected to sea water ionic strength.
An example of the DTPA titrations is shown in Fig. 2, and the results from all three titrations are compiled in Table 3. The model titrations produced good estimates of the DTPA concen- trations added (within 25%) and values of
log K&d between 12.1 and 12.7 (within a factor of log 4 of the predicted value). In these rela- tively well characterized systems, the slope of the titration line at high copper concentrations does reach that of the line generated without the model ligand. When titrations were performed on actual
580 L.A. Miller and K. W Brukmd /Ad Chim. Acta 284 (1994) 573486
TABLE 3 Kinetics Results from model titrations of DTPA in sea water
(Predicted log KLnd = 12.7, from Titrator [261)
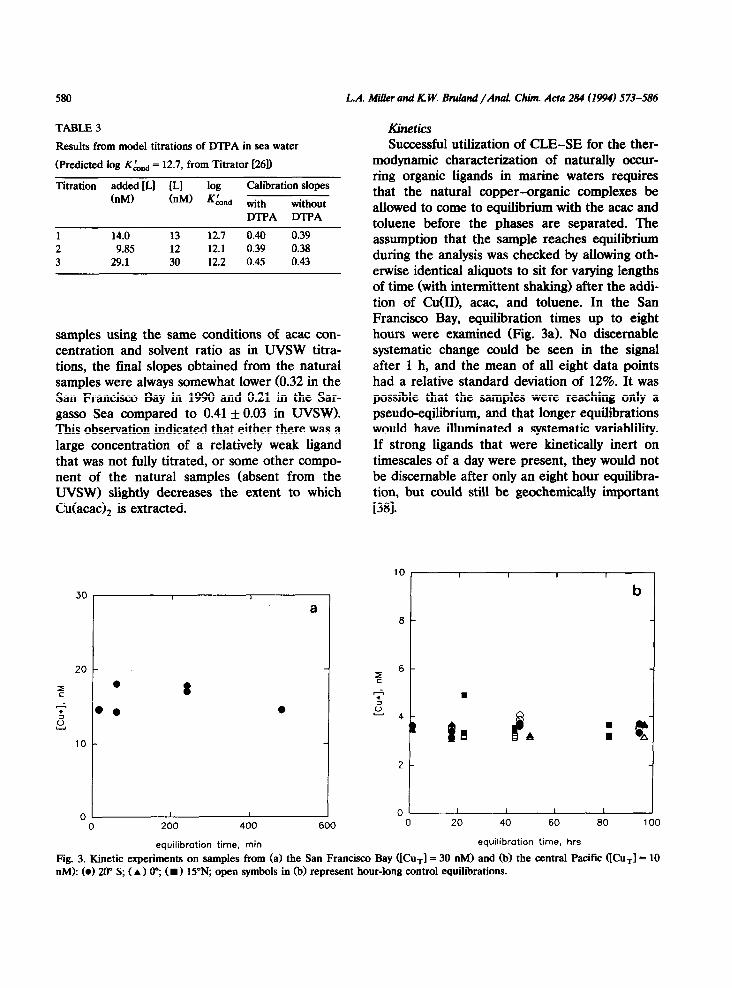
Successful utilization of CLE-SE for the ther- modynamic characterization of naturally occur- ring organic ligands in marine waters requires that the natural copper-organic complexes be allowed to come to equilibrium with the acac and toluene before the phases are separated. The assumption that the sample reaches equilibrium during the analysis was checked by allowing oth- erwise identical aliquots to sit for varying lengths of time (with intermittent shaking) after the addi- tion of C&II), acac, and toluene. In the San Francisco Bay, equilibration times up to eight hours were examined (Fig. 3a). No discemable systematic change could be seen in the signal after 1 h, and the mean of all eight data points had a relative standard deviation of 12%. It was possible that the samples were reaching only a pseudo-eqilibrium, and that longer equilibrations would have illuminated a systematic variablility. If strong ligands that were kinetically inert on timescales of a day were present, they would not be discemable after only an eight hour equilibra- tion, but could still be geochemically important
Titration added [LI [LI log Calibration slopes (nM) (nM) K&d with without
DTPA DTPA
1 14.0 13 12.7 0.40 0.39 2 9.85 12 12.1 0.39 0.38 3 29.1 30 12.2 0.45 0.43
samples using the same conditions of acac con- centration and solvent ratio as in UVSW titra- tions, the final slopes obtained from the natural samples were always somewhat lower (0.32 in the San Francisco Bay in 1990 and 0.21 in the Sar- gasso Sea compared to 0.41 f 0.03 in UVSW). This observation indicated that either there was a large concentration of a relatively weak ligand that was not fully titrated, or some other compo- nent of the natural samples (absent from the UVSW) slightly decreases the extent to which Cu(acac), is extracted.
30
20
z
7 g
10
0
a
I
I I
0 200 400
equilibration time, min
600
1381.
b
01 I I I I J 0 20 40 60 80 100
equilibration time, hrs
Fig. 3. Kinetic experiments on samples from (a) the San Francisco Bay ([Cu,] = 30 nM) and (b) the central Pacific UCu,] = 10 nM): (01 20” S; (A) o”, (B) 15”N, open symbols in (b) represent hour-long control equilibrations.
LA. iUiIkr and K W. Btuhd /AnaL Chim. Acta 284 (1994) 573-586 581
Therefore, samples from the central Pacific were equilibrated for up to four days (Fig. 3b). Control extractions with hour-long equilibrations were conducted when the long-term extractions were completed. These controls indicated that significant speciation changes, independent of the analyses, were not occurring in the samples dur- ing the longer equilibrations. The values of [Cu* I determined in this experiment were identical within a relative standard deviation (R.S.D.) of 9% and demonstrate that the natural copper- organic complexes are labile on timescales of an hour and that the experimental protocol outlined above gives sufficient time for the samples to reach at least a psuedo-equilibrium that persists for several days. There still remains a possibility
that ligands may be present that would be signifi- cant at true equilibrium but are inert on timescales up to a week. However, when such long timescales come into play, it is doubtful that a true equilibrium would be representative of the important processes occurring in natural waters such as the open ocean and estuaries.
Extractability of complexes occurnng in the en- vironment
The amount of copper in natural organic com- plexes that extracts into toluene in the absence of acetylacetone varied between samples and was 2-7% of the total Cu. In general, the open ocean waters had a small fraction of directly extractable copper, consistent with what was seen by Donat
TABLE 4
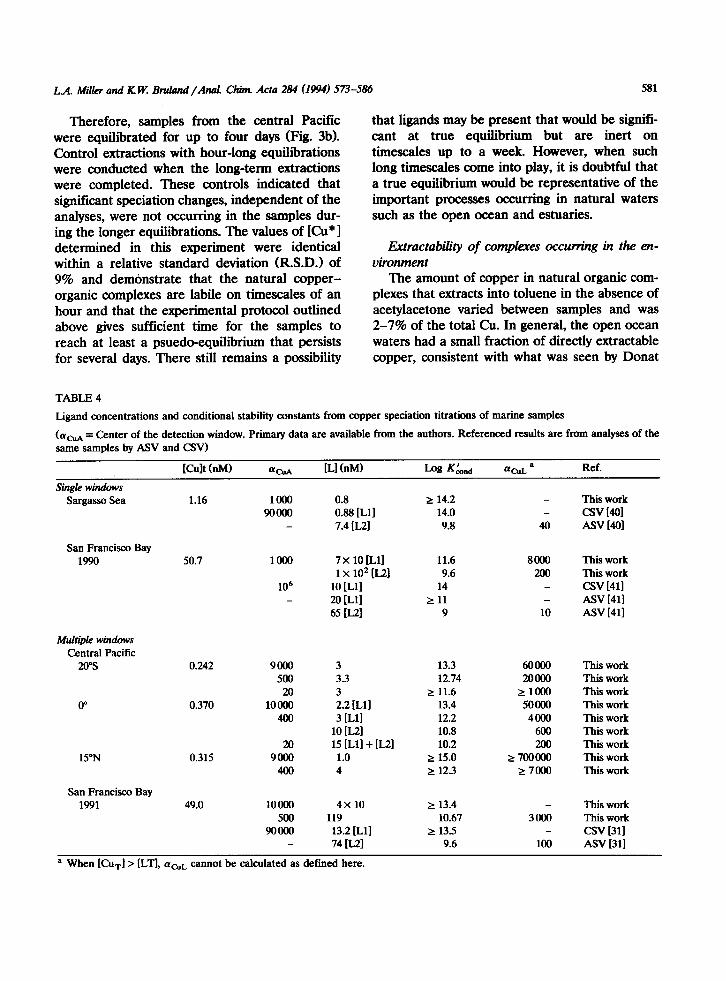
Ligand concentrations and conditional stability constants from copper speciation titrations of marine samples
(ucuA = Center of the detection window. Primary data are available from the authors. Referenced results are Born analyses of the same samples by A!W and CSV)
KMtW4 acLA IL1 (nM) Log G,,,,i Ref.
single windows Sargasso Sea
San Francisco Bay 1990
Multiple windows Central Pacific
20%
0”
15”N
San Francisco Bay 1991
1.16 1000 90000
-
50.7 loo0
106 -
0.242 9000 500
20 0.370 loo00
400
20 0.315 9tHm
400
49.0 10000 500
90000
::k [Lll 7.4 [L21
7 x 10 [Lll 11.6 1 x 10² [L21 9.6
10 [Lll 14 20 D-11 r 11 65 B-21 9
3 13.3 3.3 12.74 3 2 11.6 2.2 [Lll 13.4 3 D-11 12.2
10 D-21 10.8 15 [Lll + [L21 10.2 1.0 r 15.0 4 r 12.3
4x 10 2 13.4 119 10.67
13.2 [Ll] t 13.5 74 IL21 9.6
2 14.2 14.0 9.8
8CKKI 200
10
6oalo This work 2otmO This work
ZlOOO This work 50000 This work
4000 This work 600 This work 200 This work
;?: 7OOcmO This work 27000 This work
3am
100
This work CW WI ASV HOI
This work This work CSV 1411 ASV 1411 ASV [411
This work This work csv [311 Asv 1311
a When [Curl > [LTI, ~'CUL cannot be calculated as defined here.
582 L.A. Miller and K W. B&and /Am! Chim. Acta 284 (1994) 573-586
et al. 1391 using C,, solid phase extraction. The gyre stations averaged 2% extractable, while in the equatorial Pacific sample, 7% of the copper extracted into toluene without acetylacetone, in- dicating a possibly greater preponderance of hy- drophobic ligands in the equatorial waters. In the autumn samples from the San Francisco Bay, approximately 4% of the total copper was directly extractable. This is a smaller fraction than that found by C,, solid phase extraction in Narra- gansett Bay on the east coast of North America, where values ranging from 8 to 56% of the total copper were isolated on the resin [181. At this point, the source of this difference cannot be distinguished between effects of the type of bind- ing material in the San Francisco and Narra- gansett Bays or the hydrophobicity of the differ- ent extraction media.
It is also possible that this naturally extractable fraction does not represent copper binding in hydrophobic complexes, rather it may be indica- tive of inefficient phase separation. At this stage, it is difficult to determine which is the correct interpretation. If the extracted copper were due to physical entrainment of water in the organic phase, more variablity within titrations and less between samples would be expected. In addition, although extractable copper was observed in WSW, it was near the detection limit and much lower than the amount seen in the actual sam- ples. On the other hand, if there were an actual hydrophobic class of copper complexes present, the extractable fraction would be expected to level off eventually at high total copper concen- trations. Regardless, it is essential to perform extractions of each sample without acac at Cu(II) concentrations covering the range of the titra- tions in order to accurately correct the titration data.
Single window titrations of marine samples Initially, two samples, one from the San Fran-
cisco Bay and the other from the Sargasso Sea, were examined by single titrations at one analyti- cal window. Table 4 gives the results from these titrations. Because of the large sample volumes required for analysis, replicate titrations were not performed. However, it was possible to estimate
the uncertainties associated with the lineariza- tions and, thereby, the determined ligand concen- trations and stability constants. At the 95% confi- dence interval, the uncertainties were within 48% for [L] and 1 order of magnitude for KLnd. These are maximum uncertainties which apply to all the values reported in Table 4.
For both the Sargasso Sea and the Fall 1990 San Francisco Bay samples, the analytical window was centered at acuacact = 1000, where aCuacact is defined as in Table 2. The results from the Sar- gasso Sea by CLE-SE are fully consistent with those by cathodic and anodic stripping voltamme- try (CSV and ASV). Both CLE-SE and CSV were able to identify the same ligand class, al- though the former technique established a weaker competition, and we were only able to determine a minimum value for the stability constant. On the other hand, acU,_ observed by ASV is defi- nitely below the win%ow of the CLE-SE tech- nique, and L, was outcompeted by the acac- toluene extraction system and could not be recog- nixed by the analysis. In general, natural ligands with aCuL within an order of magnitude in either direction of the center of an analytical window 1191 can be identified by that window.
The San Francisco Bay data, however, are more difficult to reconcile with the results from ASV and CSV. The ligand class determined by CSV is too strong to have been resolved by CLE- SE in this analysis. Although the stability con- stants determined here agree well with those found by ASV, the ligand concentrations from CLE-SE are larger than those from the ASV analyses by factors of 2-3.
ASV can underestimate the ligand concentra- tions and stability constants if the metal-organic complexes are labile on the timescale of their residence in the diffusion layer about the elec- trode 1331. The ASV analyses of the San Fran- cisco Bay sample from 1990 utilized a thin mer- cury film-rotating glassy carbon disc electrode at 5000 rpm, giving a residence time in the diffusion layer of about 10 ms. Copper complexes with dissociation rate constants, k,, less than 1 s-l will be inert on this timescale [31]. Copper bind- ing material with k, up to 2 s-l has been identi- fied in coastal waters [421, and if such complexes
LA Millet and KW. Bruland/AnaL Chim. Acta 284 (1994) 573-586 583
were present in our samples, they could be mak- ing a small contribution to the ASV copper signal and causing a minor underestimation of the lig- and concentrations and/or stability constants.
There are two other possible explanations for the lack of agreement between CLE-SE and electrochemical techniques in the San Francisco Bay. It is conceivable that the former approach
5
4
z3
7
z2
1 - 0
I , I
a
0
0
0
0
20
15
:
T lo z
5
5 10 15 20
[Cult. nM
v-1 1 4
C
0
0
0 20 40 60 80 100
[Cu]!. nM
cannot be applied to the study of estuarine sam- ples. Surface active materials could influence the extraction of Wacac), despite the small quantity of directly extractable CuL complexes detected. In addition, the more complex composition of the estuarine waters could lead to the formation of mixed ligand complexes with acac that may or may not extract, giving an apparently lower or
12 1 I , I b
0
0 10 20 30 40 50
[Cult. nM
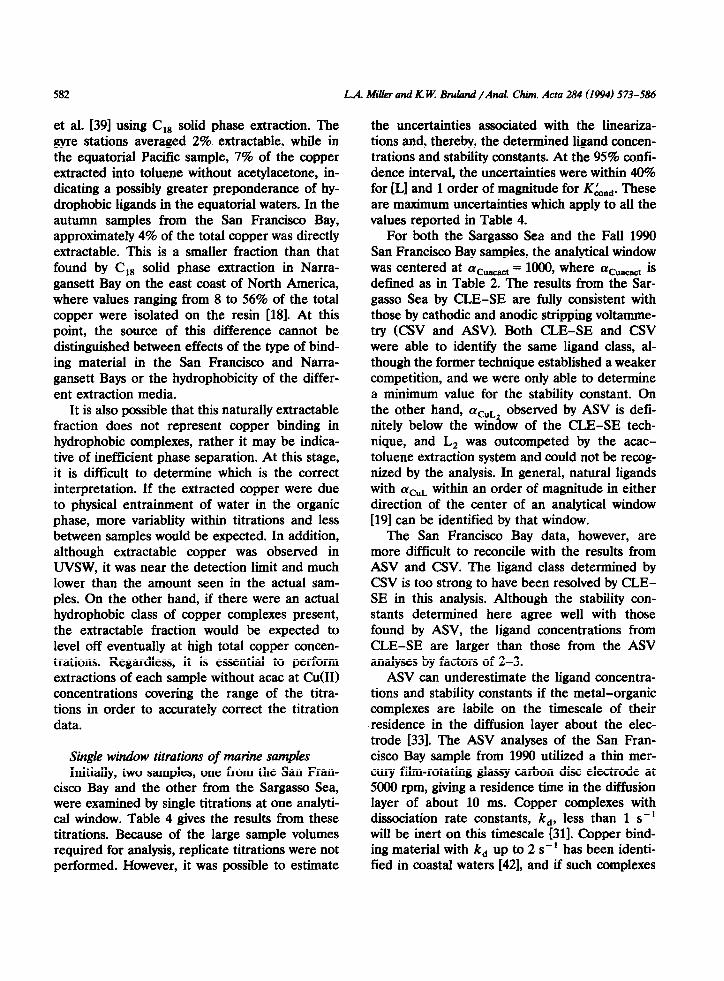
Fig. 4. Titrations of the equatorial Pacific sample at three different analytical windows. (a) acusact = lOOMI. (b) acuscact = 400. (c) (I~_~ = 20. Note different axis scales.
584 L.A. Miller and K W. Bruhi /AnaL Chim. Acta 284 (N94) 573-586
higher binding capacity, respectively. Another possibility is that we are simply seeing the results of applying analytical techniques at varying detec- tion windows to a sample with a complex mixture or even a continuum of binding sites.
Multiple window titrations Results from the examination of both open
ocean and San Francisco Bay samples with more than one detection window are shown in Table 4, along with the single window analyses. As an example, titration curves at the three analytical windows for the equatorial Pacific sample are shown in Fig. 4. Analyses of the open ocean samples were internally consistent, indicating the presence of only 1 or 2 distinct ligand classes in the range of windows examined (20 ZG acUacati < 10000). In all three samples, a strong ligand
(log KL”d 2 13) at a concentration of about 3 nM was indicated. At the equator, an additional lig- and was seen at a concentration of 10 nM with a weaker binding constant of nearly 10” M-‘.
In view of the central Pacific data, it is appar- ently possible to identify a single ligand class in natural waters, even with different analytical win- dows. Within the uncertainties of the method,
5.0 3
4.5
4.0 .f e
CI W- $ 3.5
3.0
2.5
2.0
A
I , I L I I
1.0 1.5 2.0 2.5 3.0 3.5 4.0 4.5
log %u*CAC t
ligands with the same characteristics are identi- fied with windows centered at values of (ycuacact differing by orders of magnitude. Even in samples where it was only possible to determine a mini- mum limit for the stability constant (because the window was too weak to fully characterize it), that minimum is consistent with the values deter- mined using stronger windows.
On the other hand, two titrations of a San Francisco Bay sample (in fall of 1991) by CLE-SE, in which aCuacsct differed by nearly two orders of magnitude, gave disparate results which also con- tradicted those from two other analytical tech- niques [31]. As shown in Table 4, the two CLE-SE titrations produced evidence of two different lig- and classes, a relatively strong ligand at a concen- tration lower than [Cur] and a weaker one at a higher concentration. If taken alone, these results would indicate that there were either two differ- ent ligands present, or we were simply observing different parts of a binding continuum. However, when the results from analyses of the same sam- ples by other techniques are also considered, it becomes clear that the interpretation cannot be so simple. A study using CSV and ASV [31] identified two distinct ligand classes, a very low
A
-11
-12
+- as Y
-13
$
-14
-15 ._
A
0 A
0
I I I I I 1
1.0 1.5 2.0 2.5 3.0 3.5 4.0 4.
log a CUACAC,
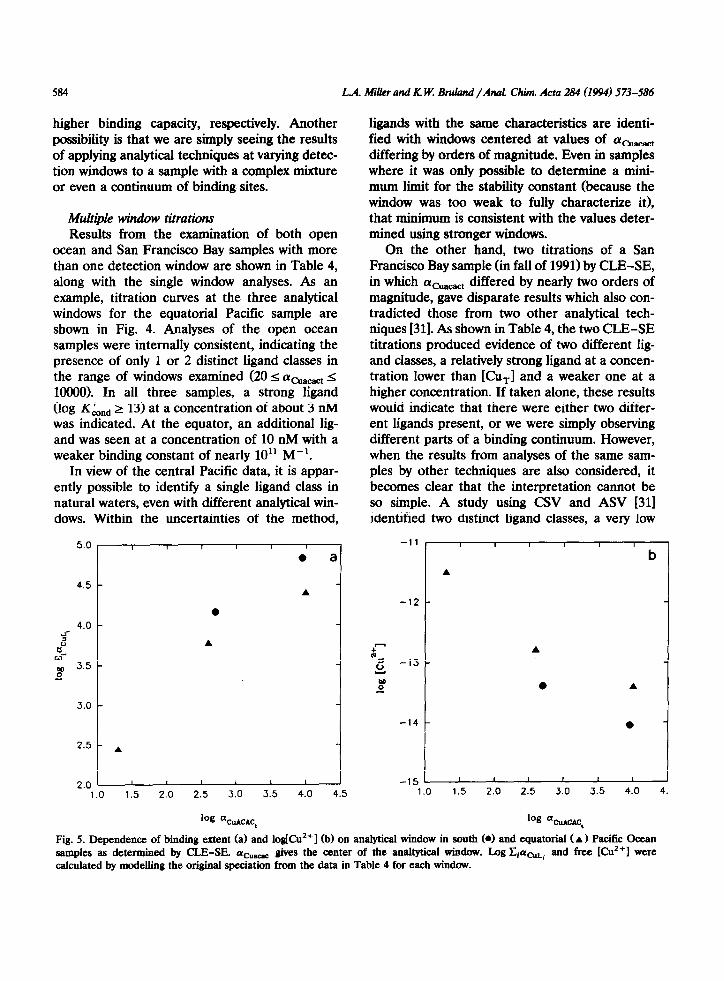
Fig. 5. Dependence of binding extent (a) and logjCuz’] (b) on analytical window in south (0) and equatorial ( A) Pacific Ocean samples as determined by CLE-SE. ati_ go ‘ves the center of the analtytical window. Log CiacuLi and free [Cu’+] were calculated by modelling the original speciation from the data in Table 4 for each window.
LA. Miller and K W. Bdand /Anal. Chh. Acta 284 (1994) 573-586 585
concentration of a strong ligand and a weaker ligand at a higher concentration with aaL = 100 (Table 4). Both of these ligand classes are at lower concentrations and, with the exception of the CSV results, form weaker copper complexes than those found by CLE-SE. The different re- sults cannot be attributed solely to the use of varying analytical detection windows. Although CLE-SE and CSV examined very different win- dows in the 1990 sample, the windows used for the 1991 study were quite similar, within an order of magnitude of each other. At this point, we cannot positively identify the source of the dis- crepancy in the CLE-SE San Francisco Bay re- sults, but it is clear that there remain some unre- solved questions in applying this technique to the study of copper speciation in estuarine waters.
An important point to be made from the mul- tiple window titrations is that the determined speciation does vary with the detection window, even when the same ligand class is identified. The dependence of the estimated copper speciation on the location of the detection window is shown graphically in Fig. 5. The ordinate in Fig. 5a
and [Cu2’] in Fig. 5b were determined by model- ing the initial copper speciation in the unper- turbed sample using Titrator [27] and the charac- teristics for each window shown in Table 4 (those determined by CLE-SE, only). Only titrations from the southern and equatorial Pacific, those where both [L] and log KLnd could be deter- mined, were used to generate these plots. It is evident from Fig. 5 that weaker analytical win- dows generally result in the determination of a lower total extent of binding and higher [Cu2+].
In the South Pacific where only one ligand class could be identified by the two titrations, it is certainly possible to explain the decrease in cal- culated [Cu2+] as indicative of a much more complex ligand mixture, and we may be calculat- ing average ligand concentrations and stability constants for the range detectable by the windows we used. It seems more likely, however, in view of the similarity between the ligand parameters de- termined with the two windows, that the ligand is
actually best described as a class with some nar- row distribution of stability constants, and each window emphasizes either the lower or stronger stability side of the distribution.
A similar explanation can be applied to the results from the equatorial Pacific where two ligands were determined by three analytical win- dows. Here, the influence of the detection win- dow on the calculated free copper concentration is particlularly strong because the strongest and weakest windows were each only able to identify one of the ligands. In other words, since the stronger ligand class could not be seen conclu- sively in the weak titration (Fig. 4c), the [Cu”] determined from those results was high, and vice versa for the strong titration.
These observations emphasize the importance of conducting multiple titrations at varying win- dows if one wishes to realistically model the in situ speciation. Using only one titration to extrap- olate the original speciation could prove mislead- ing, particularly in complex samples.
Conclusions In this study, we have carefully evaluated the
suitability of competitive equilibration coupled with solvent extraction to determine the extent of copper-organic binding in marine waters. A fun- damental requirement for the use of CLE-SE is that only a small fraction, and preferably none, of the natural organic complexes extract into the solvent used. We found that 2-7% of the natural complexes extract into toluene, regardless of where the sample originated. Although this frac- tion cannot be characterized by CLE-SE, it is small enough that the data can be corrected, allowing the determination of the dominant hy- drophilic copper complexes. In addition, within 1 h, the analytically perturbed system reaches at least a pseudo-equilibrium that is significant on timescales of a day to a week.
Analysis of samples that were also examined by ASV and CSV gave results that were consis- tent with those from the electrochemical tech- niques in the Sargasso Sea. However, our specia- tion results from the San Francisco Bay were irreconciliable with those from other techniques. Although only a small fraction of the natural
586 LA. M&r and R W Bruhd/Anal. Chitn. Acta 284 (1994) 573-586
organic copper extracted into toluene, there could have been some other phenomenon, such as mixed ligand complexes or surface active materials in- terfering with the solvent exchange.
Because CLE-SE combines a competitive equilibration with a liquid-liquid extraction, it can be used to examine analytical windows vary- ing over at least three orders of magnitude with- out changing the experimental protocol or the reagents used. In samples from the central Pa- cific, it was possible to identify a distinct ligand class with more than one window. However, ex- amination of stronger detection windows results in the determination of higher total complexa- tion. This is not inconsistent with the identifica- tion of discrete ligand classes, but it does recom- mend caution when modelling speciation in natu- ral waters with the results from only one titration.
We would like to thank Geoffrey Smith, Dr. John Donat, Kathy Lao, and Genine Scelfo for sample collection and total copper analyses. In addition, Dr. Robert Hudson and Professors Stanley Williamson and Stan van den Berg, as well as an anonymous reviewer, provided ex- tremely useful comments on the manuscript. This research was funded by grants from NSF (447610-21670) and ONR (447610-230871, and University of California Regent’s and NSF Grad- uate Research Fellowships to L. Miller.
REFERENCES
1 D.R. Turner, M. Whitfield and A.G. Dickson, Geochim. Cosmochim. Acta, 45 (1981) 855.
2 R.H. Byrne, L.R. Kump and K.J. Cantreil, Mar. Chem., 25 (1988) 163.
3 D.M. Anderson and F.M.M. Morel, Limnol. Oceanogr., 23 (1978) 283.
4 M.M. Benjamin and J.O. Leckie, Environ. Sci. Technol., 15 (19811 1050.
5 C.M.G. van den Berg, Mar. Chem., 14 (19841201. 6 C.M.G. van den Berg, Mar. Chem., 15 (1984) 1. 7 P.J.M. Buckley and C.M.G. van den Berg, Mar. Chem., 19
(1986) 281. 8 KH. Coale and KW. Bmland, Deep-Sea Res., 34 (1990)
317. 9 J.R. Donat and K.W. Bruland, Mar. Chem., 28 (1990) 301.
10 G. Capodagiio, K.H. CoaIe and KW. Bruland, Mar. Chem., 29 (1990) 221.
11 KW. Bruland, Limnol. Gceanogr., 37 (1992) 1008. 12 J.W. Moffett and R.G. Zika, Mar. Chem., 210987) 301. 13 W.G. Sunda, D. Klaveness and A.V. Pahunbo, in C.J.M.
Dramer and J.C. Duinker (Eds.1, Complexation of Trace Metals in Natural Waters, Nijhoff/Junk, The Hague, 1984, p. 393.
14 M. Plavsic, D. Krznaric and M. Branica, Mar. Chem., 11 (1982) 17.
15 T.D. Waite and F.M.M. Morel, Anal. Chem., 55 (1983) 1268.
16 W.G. Sunda, Mar. Chem., 14 (1984) 365. 17 C.M.G. van den Berg, Mar. Chem., ll(1982) 307. 18 G.L. Mills and J.G. Quinn, Mar. Chem., 10 (1981) 93. 19 C.M.G. van den Berg, M. Nimmo, P. DaIy and D.R.
Turner, Anal. Chii. Acta, 232 (1990) 149. 20 C.M.G. van den Berg and J.R. Donat, Anal. Chim. Acta,
257 (1992) 281. 21 A. Ringbom and E. Still, Anal. Chim. Acta, 59 (1972) 143. 22 G. Scatchard, Ann. N.Y. Acad. Sci., 51 (19491660. 23 I. Ruaic, Anal Chim. Acta, 140 (1982) 99. 24 J. Stary and J.O. Liljenzin, Pure Appl. Chem., 54 (1982)
2557. 25 J.O. Liljenzin, J. Stary and J. Rydberg, in AS. Kertes and
Y. Marcus (Eds.) SoIvent Extraction Research, Wiley New York, 1969, p. 21.
26 R.D. Hancock and B.S. Nakani, S. Afr. l’ydskr. Chem., 35 (1982) 153.
27 S.E. Cabaniss, Environ. Sci. Technol., 21 (1987) 209. 28 M. Smith and A.E. Martell, Critical Stability Constants,
Vols. 3-6, Plenum Press, New York, 1976-1989. 29 J.R. Donat and KW. B&and, Anal. Chem., 60 (1988) 240. 30 KW. Bruland, KH. C&e and L. Mart, Mar. Chem., 17
(1985) 285. 31 J.R. Donat, K.A. Lao and KW. Bruland, Anal. Chim.
Acta, 284 (1994) 547. 32 AR. Flegal, G.J. Smith, G.A. Gill, S. Saimdo-Wilheimy,
G. SceIfo and L.C.D. Anderson, Mar. Chem., 36 (1991) 329.
33 KH. Coale and KW. Bruland, Limnol. Oceanogr., 33 (1988) 1084.
34 MA. Anderson and F.M.M. Morel, Liiol. Gceanogr., 27 (1982) 789.
35 S. Chaberek, A.E. Frost, MA. Doran and N.J. Bicknell, J. Inorg. Nucl. C&em., 11 (1959) 184.
36 E. Wiinninen, Acta Aced. Abe. Ser. B, 21 (1960) 17. 37 P.P Nenova, D.S. Kuncheva and B.P. Karadakov, CR
Acad. Bulg. Sci., 31 (1978) 445. 38 J.G. Hering and F.M.M. Morel, Geochim. Cosmochim.
Acta, 53 (1989) 611. 39 J.R. Donat, P.J. Statham and KW. Bruland, Mar. Chem.,
18 (1986) 85. 40 J.R. Donat and K.W. Bruland, Eos, 72 (1992) 44. 41 J.R. Donat and K.W. Bruland, unpublished results. 42 M.S. Shuman and L.C. Michael, Environ. Sci. Technol., 12
(1978) 1069.


![BE ASSURED. 2018 WATERS KOREA 사용자교육 안내 … · BE ASSURED. 2018 WATERS KOREA 사용자교육 안내 [[[[사용자교육사용자교육 카다로그카다로그]]]] Waters](https://img.pdfslide.net/doc/110x75/5bfe34e509d3f297368cb7b0/be-assured-2018-waters-korea-be-assured-2018-waters.jpg)