Embed Size (px)
Citation preview
Determination of Fatigue as Assessed by Mechanomyogram and Electromyogram Following Maximal Loaded Exercise in Exercise Trained Men
Gürkan Bilgin1, 5, İ. Ethem Hindistan2, Y. Gül Özkaya2, Etem Köklükaya3, Övünç Polat4, Ömer H. Çolak4*
1 Vocational School of Technical Sciences, Mehmet Akif Ersoy University, Burdur, Turkey. 2 School of Physical Education and Sports, Akdeniz University, Antalya, Turkey. 3 Faculty of Engineering, Department of Electrical and Electronics Engineering, Gazi University, Ankara, Turkey. 4 Faculty of Engineering, Department of Electrical and Electronics Engineering, Akdeniz University, Antalya, Turkey. 5 Institute of Natural Science, Department of Electrical and Electronics Engineering, Sakarya University, Turkey. * Corresponding author. Tel.: 02423106361; email: [email protected] Manuscript submitted July 10, 2015; accepted October 15, 2015. doi: 10.17706/ijcee.2015.7.5.305-315
Abstract: In this study, determination of fatigue at the onset, and following maximal loaded exercise was
evaluated from mechanomyography (MMG) and electromyography (EMG) recordings in exercise trained
men. Twenty four recreationally active men were participated into this study. Participants were performed
a fatiguing Bruce Protocol which is widely-used maximal loading treadmill test. EMG and MMG recordings
were obtained from rectus femoris muscle during maximal isometric contractions both at the onset, and
following Bruce Protocol. Following pre-training measurements, volunteers were subjected to sprint
running exercise involved 3 sessions per week for 8 weeks. MMG and EMG recordings were repeated
following 8 weeks of sprint running training. Recordings were decomposed in 8 levels by using the wavelet
packet transform and so windows with 15 nodes and 5 sliding nodes were created. Then the mean energy
values at each window were obtained from the 24 persons group and were applied to the input of
Multilayer Perceptron Neural Network (MLPNN). In the output, the classification process was performed
both before and after fatiguing exercise, and the success rate of the test was evaluated for fatigue. In the
post-training measurements, MMG has been failed to determine fatigue with decreased success rate,
whereas EMG results were shown that success rate is increased by 20 percent compared to pre-training
measurements.
Key words: Electromyogram (EMG), fatigue, mechanomyogram (MMG), wavelet packet transform.
1. Introduction
Physical fatigue or muscle fatigue is the decrease in ability of a muscle to generate force. The
determination of muscle fatigue adds important information to the fields of sport performance and injuries.
Owing to the changeability of the muscle characteristics from person to person, there is no simple function
of muscle load and timing which defines a precise muscle fatigue threshold [1]. Usually, researchers have
used techniques that affected by the performance and activity of whole body. These include changes in the
International Journal of Computer and Electrical Engineering
305 Volume 7, Number 5, October 2015

lactate production, respiratory oxygen consumption and carbon dioxide emission amount, ECG
(electrocardiogram) measurements, et cetera. At the present time, the studies of detecting the acute fatigue
in the muscles gradually increase. Myoelectric indications of muscle fatigue can be determined by
measuring electric signal in the muscle and refer to changes in amplitude and signal frequency and in the
muscle conduction velocity (CV), while the mechanical factors relate to a loss in the applied force [2]. EMG
(Electromyogram) is one of these methods which is often used in identifying muscle fatigue. Previous
studies demonstrated that muscle fatigue can be determined by using several parameters such as variations
in action potential conduction velocity, variations of EMG amplitudes and inclining to low frequencies at
power spectrum analysis [3]-[9]. Muscle fatigue was also estimated by calculating of mean power frequency
of EMG recordings and then pursuant to the results of a previous study, a sliding from the high frequency
spectrum to low frequency spectrum was observed when the muscle is fatigued [10]. In a further study,
researchers were tried to estimate the amount of fatigue during the static muscle contraction by using
analysis of variance of surface electromyogram (sEMG) [11].
The other method for determination of muscle fatigue is mechanomyogram (MMG). The recordings are
taken on the skin of the involved muscles when the muscle is contracted. Generally the accelerometer uses
for signal records of MMG. MMG can be described which the sum of the mechanical activity of the individual
motor units as EMG [12]. Shinohara et al. evaluated the MMG behavior of the quadriceps muscles during
increasing power output and rising up to the maximal bicycle ergometer and the results were compared
with when the sEMG and analysis demonstrated that a linear correlation between the MMG of the
quadriceps muscle and work load during the maximal incremental cycle ergometer [13]. A study was done
scientific study to detect the correlation between MMG, EMG and Torque records of quadriceps muscles
response. The study results indicated that the MMG amplitude may be useful for estimating force
production during fatiguing dynamic contractions [14]. Beck et al. have tried to solve time—frequency
events of MMG signals obtained from vastus lateralis, rectus femoris and vastus medialis muscles by using
nonlinear scaling of the wavelet during maximal movements. They determined different spectral bands for
maximal movements on MMG [15].
The purpose of the present study is to determine muscle fatigue following a maximal exercise loading in
exercise trained persons. We used wavelet packet transform and MLPNN to analyze the MMG and EMG
recordings obtained by surface electrodes of thigh muscle.
2. Methods
2.1. Participants
Twenty four healthy, recreationally active men aged 18-23 years were voluntarily participated into this
study. The exercise training program and all measurements were performed in Akdeniz University, Sport
Science Research and Application Center. The inclusion criteria were non-user of alcohol, without medical
illness, non-smoker, the body mass index (BMI) ranged 20 to 25, not receiving medication or vitamins, and
willing to participate. In the selection of volunteers, it was ensured that the participants do not to exercise
at least one week before the experimental period. The subjects provided informed consent, and a
standardized individual information session was organized by an exercise specialist to instruct the
participants on how to apply the exercise session. Descriptive information for the participants are
presented at Table 1.
2.2. Exercise Training
All participants were performed repeated maximal sprints, after completion of a 20-minute warm-up. An
outdoor track was used that was covered with tartan surface. The participants performed 4 sets of 4
International Journal of Computer and Electrical Engineering
306 Volume 7, Number 5, October 2015
maximal repetitions of 25-m sprints 3 times a week, where the active recovery time was 2.5 minutes
between repetitions, and 5 minutes between sets which was sufficient for the participants to recover fully
[16]. This training program continued until the fourth week. For each of the remaining 2 weeks, 2
repetitions were added to first and third sets, and finally, additional 2 repetitions were added to second and
four sets at the 7th and 8th weeks. As a result, exercise training was completed as 4 sets of 5 repetitions at
the end of the 8 weeks of training program.
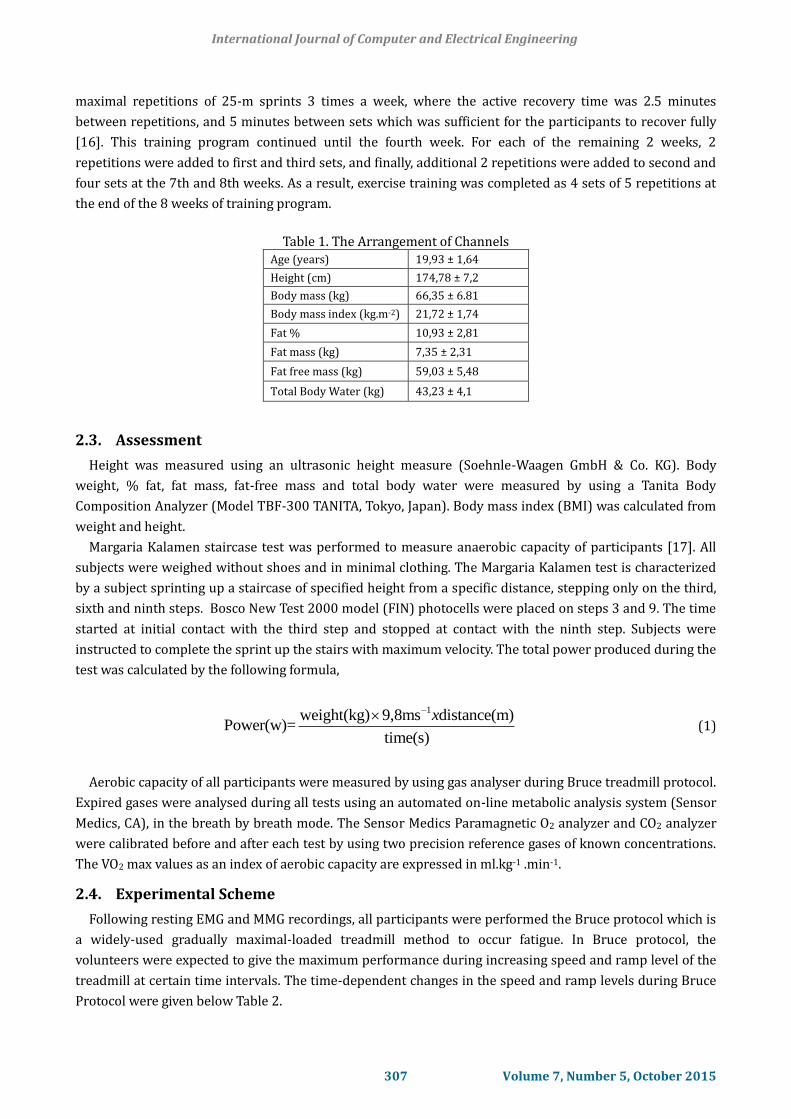
Table 1. The Arrangement of Channels Age (years) 19,93 ± 1,64
Height (cm) 174,78 ± 7,2
Body mass (kg) 66,35 ± 6.81
Body mass index (kg.m-2) 21,72 ± 1,74
Fat % 10,93 ± 2,81
Fat mass (kg) 7,35 ± 2,31
Fat free mass (kg) 59,03 ± 5,48
Total Body Water (kg) 43,23 ± 4,1
2.3. Assessment
Height was measured using an ultrasonic height measure (Soehnle-Waagen GmbH & Co. KG). Body
weight, % fat, fat mass, fat-free mass and total body water were measured by using a Tanita Body
Composition Analyzer (Model TBF-300 TANITA, Tokyo, Japan). Body mass index (BMI) was calculated from
weight and height.
Margaria Kalamen staircase test was performed to measure anaerobic capacity of participants [17]. All
subjects were weighed without shoes and in minimal clothing. The Margaria Kalamen test is characterized
by a subject sprinting up a staircase of specified height from a specific distance, stepping only on the third,
sixth and ninth steps. Bosco New Test 2000 model (FIN) photocells were placed on steps 3 and 9. The time
started at initial contact with the third step and stopped at contact with the ninth step. Subjects were
instructed to complete the sprint up the stairs with maximum velocity. The total power produced during the
test was calculated by the following formula,
1weight(kg) 9,8ms distance(m)Power(w)=
time(s)
x (1)
Aerobic capacity of all participants were measured by using gas analyser during Bruce treadmill protocol.
Expired gases were analysed during all tests using an automated on-line metabolic analysis system (Sensor
Medics, CA), in the breath by breath mode. The Sensor Medics Paramagnetic O2 analyzer and CO2 analyzer
were calibrated before and after each test by using two precision reference gases of known concentrations.
The VO2 max values as an index of aerobic capacity are expressed in ml.kg-1 .min-1.
2.4. Experimental Scheme
Following resting EMG and MMG recordings, all participants were performed the Bruce protocol which is
a widely-used gradually maximal-loaded treadmill method to occur fatigue. In Bruce protocol, the
volunteers were expected to give the maximum performance during increasing speed and ramp level of the
treadmill at certain time intervals. The time-dependent changes in the speed and ramp levels during Bruce
Protocol were given below Table 2.
International Journal of Computer and Electrical Engineering
307 Volume 7, Number 5, October 2015

Table 2. Bruce Protocol Time-dependent changes in the speed and ramp levels according to
Bruce Protocol Steps Time (Minutes) Km/h Ramp (Degree)
1 0 2,74 10
2 3 4,02 12
3 6 5,47 14
4 9 6,76 16
5 12 8,05 18
6 15 8,85 20
7 18 9,65 22
8 21 10,46 24
9 24 11,26 26
10 27 12,07 28
In this study, EMG and MMG recordings were obtained from each subject for analysis at the onset
(volunteers who are not fatigued), and following Bruce protocol (fatigued volunteers). Afterwards, all
volunteers have participated in the repeated sprint training 3 days per week for 8 weeks. At the end of the
sprint training program, EMG and MMG recordings were repeated from each subject for analysis at the
onset, and following Bruce protocol.
For EMG recordings, a surface electrode was fixed as on the belly of the rectus femoris (RF) muscle of
dominant thigh of the volunteers. Additionally, simultaneous recordings of MMG and EMG were taken by
placing accelerometer above the center of the RF muscle.
Following a 10 min warm-up period, volunteers were asked to sit in a chair with hips and knees flexed at
90° with the arms were crossed with hands placed on the opposite shoulder. Each subject performed
maximal voluntary isometric fatiguing contractions with dominant knee extensor muscles. Periodic
metronome was used to stability of contractions at 1 Hz.
Surface EMG recordings were obtained from ProComp Infiniti TM (Model SA7500, Thought Technology
Ltd. 2180 Belgrave Avenue, Montreal, QC H4A 2L8 Canada) EMG recorder by using self-adhesive, 10 mm in
diameter, silver-silver chloride triode electrodes (T3404, Thought Technology Ltd. Montreal, Canada) in the
laboratory environment. Before the recordings, the skin surface where the electrodes are placed were
cleaned and shaved in order not to cause any unwanted noises. In order to obtain a better signal, conductive
gel was used between the electrode and the skin surface.
Accelerometer and all equipment used in the experiments for MMG recordings were purchased from
Company Benair [(Beandevice AX-3D wireless accelerometer, Bean Gateway wireless sensor Networks
(WSN) coordinator (wireless sensor network coordinator), Beanscape Real time wireless sensor networks
supervision (real-time wireless sensor network control software)].
2.5. Wavelet Packet Transform
As a modified version of the standard wavelet, the Wavelet Packet Transform (WPT) defines a
generalization of the multi-resolution analysis and use the entire family of sub-band decomposition. This
multi-resolution analysis technique has been used with good results in many studies, such as biomedical
signal classification [18], detection [19] etc.
Differently from classical wavelet transform which is realized only by a low-pass filter, wavelet packet
transform is implemented by a basic two-channel filter (low-pass and high-pass filters). Using the WPT, the
information in high frequencies can be analyzed as well as that in low frequencies and as a result, finer
frequency bands can be gained by WPT than by wavelet transform.
In the analysis made by using the discrete wavelet transform (DWT), the signal must be decomposed into
coefficients at different levels. In the DWT analysis at all levels decomposition process is applied only
approximation coefficients. Wavelet packet transform (WPT) is a special form of DWT, which offers more
International Journal of Computer and Electrical Engineering
308 Volume 7, Number 5, October 2015

potential decomposition. Differently from DWT, decomposition processes are applied to both
approximation and detail coefficients. The decomposition process of coefficients is performed by using low
and high pass filters. Approximation coefficients in the low-pass filter output and detail coefficients in the
high-pass filter output are obtained. WPT mathematically can be described as,
2 1
2
0
( ) 2 ( ) (2 )j
j j
k
W t h k W t k
(2)
2 1
2 1
0
( ) 2 ( ) (2 )j
j j
k
W t g k W t k
(3)
As in (1) and (2), h(k) and g(k) are implemented as a high pass filter and low-pass filter coefficients.
( ) is defined as a high-pass filter as in (1), and ( ) is defined as a low-pass filter as in (2). In
here, ( ) ( ) refers to the scaling function. ( ) ( ) symbolizes the wavelet function [20].
If ( ) is considered as a three indexed function,
/2
, , ( ) 2 (2 )m m
m j n jW t W t n (4)
where ( ) and “j” is the node index in each level, “n” is the shifting parameter in time axis
and “m” is the scaling parameter.
The mean energy values of nodes are calculated as
2
mean _energy, , ,
1( )m j m jW W r
N (5)
“r” is the interested number of data and “N” total number of data in mth level.
The frequency values of WP can be found follows,
1
( 1), 1,..., 1
2
sm m
j ff m M
(6)
In here, “ ” is sampling frequency, “ ” is frequency in mth level. Interval of “ ” is indicated as
for WP [21], [22].
WP decomposition tree can be created as shown in Fig. 1 with indexes.
W0,0
W1,0
W1,1
W2,0
W2,1
W2,2
W2,3
W3,0
W3,1
W3,2
W3,3
W3,4
W3,5
W3,6
W3,7
(m=0) (m=1) (m=2) (m=3) Fig. 1. The Decomposition of the wavelet packets depending on level.
International Journal of Computer and Electrical Engineering
309 Volume 7, Number 5, October 2015

2.6. Multilayer Perceptron Neural Network (MLPNN)
The purpose of this study is the determination of fatigue following Bruce protocol. A specific network
structure is chosen for this study. This specific feed forward neural network consists of four layers that
contain an input layer, two hidden layers with 10 and 20 neurons, and output layer with one neuron. The
Levenberg-Marquardt (LM) algorithm is used as the training algorithm.
The structure of Multilayer Perceptron Neural Network for this study is shown in Fig. 2.
.
.
.
.
.
.
.
.
.
.
.
Mean Energy
Values
Input Layer(1 Neuron)
First Hidden Layer(10 Neurons) Second
Hidden Layer(20 Neurons)
Output Layer(1 Neuron)
0 or 1
(Decision of fatigue)
Fig. 2. The feed forward neural network structure for the estimation of acute muscle fatigue.
2.7. Data Processing
2.7.1. Pre-processing
In the first instance obtained EMG and MMG records were passed through a pre-processing stage in order
to make ready for analysis. In this pre-processing stage, EMG values taken at the 2 kHz sampling frequency
were filtered through 50 Hz notch filter and this process was applied to all harmonics up to the 14th.
Afterwards EMG recordings have been made ready for analysis by passing the second degree FIR filter in
the 3-450 Hz band. In the pre-processing part of MMG recordings, they were re-sampled to 2 kHz by using
cubic spline interpolation.
2.7.2. Analysis
In this study, WPT was used for feature extraction of EMG and MMG. EMG and MMG recordings were
decomposed in 8 levels. At the end of the 8th level, 256 nodes occurred and each energy value of the node
was calculated for 24 volunteers. The energy of each node was normalized by dividing the energy values to
the maximum energy value for each volunteer. Normalized energy matrix of MMG and EMG was created at
nodes along the 10th-115th node range (39-450 Hz frequency range) and the mean energy value of the
nodes were calculated in the remaining windows for each volunteers as in Fig. 3. Then, a multilayer neural
network was designed which the input values was chosen as this calculated average energy values.
The Occuring Nodes After The Wavelet Packet Transform
1. 10. 11. 12. 13. 14. 15. 16. 17. 18. 19. 20. 21. 22. 23. 24. 25. 26. 27. 28. 29. 30. 31. 32. 33. 34. 35. 36. 37. 38. 39. 40. .115.
10-25 nodes range
15-30 nodes range
20-35 nodes range
Fig. 3. Sliding windows.
International Journal of Computer and Electrical Engineering
310 Volume 7, Number 5, October 2015
size 24×256. A window length which is long enough to cover 15 nodes was selected. This window was slid 5

The output was defined as “0” before Bruce Protocol and as “1” after the Bruce Protocol. In the analysis,
14 records were used for training data, and the remaining 10 records were used as test data.
At first, the average window energy values of obtained from the EMG group are given to the input of the
network. Training and test success rates were evaluated in the end of the process. The same procedure was
also repeated for MMG data. The flow chart of this study was shown in Fig. 4.
8 Weeks Ago (Without Exercise) 8 Weeks Later (Following Exercise)
Obtaining Of
EMG Signals
Before And After
The Bruce
Protocol
Obtaining Of
MMG Signals
Before And After
The Bruce
Protocol
Obtaining Of
EMG Signals
Before And After
The Bruce
Protocol
Preprocessing
50 Hz Notch Filter
3-450 Bandpass
(FIR) Filter
Preprocessing
Cubic Spline
Interpolation
Obtaining Of
MMG Signals
Before And After
The Bruce
Protocol
Preprocessing
Cubic Spline
Interpolation
8 Level Wavelet
Packet Transform
Decomposition
(256 Nodes)
8 Level Wavelet
Packet Transform
Decomposition
(256 Nodes)
Creating 5 Node
Sliding Window That
Contains 15 Nodes
The Average Energy
Value Of Each In 21
Obtained Windows
MLPNN
2x14 Training Input
2x10 Test Input
The Average Energy
Value Of Each In 21
Obtained Windows
MLPNN
2x14 Training Input
2x10 Test Input
MLPNN
2x14 Training Input
2x10 Test Input
MLPNN
2x14 Training Input
2x10 Test Input
Appreciations And The Determination Of Muscle Fatigue
Creating 5 Node
Sliding Window That
Contains 15 Nodes
Creating 5 Node
Sliding Window That
Contains 15 Nodes
The Average Energy
Value Of Each In 21
Obtained Windows
Creating 5 Node
Sliding Window That
Contains 15 Nodes
The Average Energy
Value Of Each In 21
Obtained Windows
8 Level Wavelet
Packet Transform
Decomposition
(256 Nodes)
8 Level Wavelet
Packet Transform
Decomposition
(256 Nodes)
Preprocessing
50 Hz Notch Filter
3-450 Bandpass
(FIR) Filter
Fig. 4. Flow chart of this study.
2.8. Statistical Analysis
Data are expressed as means +S.D., and the statistical significance of the aerobic and anaerobic capacity of
the pre- and post-training measurements were assessed by t-test. A level of p<0.05 was accepted as
statistically significant.
3. Results
The aerobic and anaerobic capacities of participants were presented at Table 3. Repeated sprint training
for 8 weeks resulted significantly increased aerobic (p<0.001) and anaerobic (p<0.05) capacity of all
volunteers.
Table 3. Pre- and Post-training Aerobic and Anaerobic Capacity Results of Participants Aerobic Capacity
(ml.kg-1.dk-1) Anaerobic Capacity
(Watts) Pre-training 50,20 ± 6,031 1389 ± 191 Post-training 61,34 ±10,49 *** 1433 ± 187 *
Values are expressed as mean +SD, *p<0.05, ***p<0.001, significant difference from pre-training measurement.
In pre-training measurements obtained from the MMG recordings, the achieved highest test success rate
was 77%, and overall test successes rates were found between 65% and 77%. In the fatigue analysis, test
success rates were determined between 63% and 77% by using the EMG recordings alone taken from the
same people. The test success rates over 75% were seen in 136.72 Hz-195.31 Hz, 234.37 Hz-292.97 Hz,
273.44 Hz-332.03 Hz, 292.97 Hz-351.56 Hz, 312.50 Hz-371.09 frequency ranges. After 8 weeks of sprint
International Journal of Computer and Electrical Engineering
311 Volume 7, Number 5, October 2015

training, a significant decrease was observed in the muscle fatigue analysis using just MMG recordings, and
test success rates were found between 55% and 65%. The bands that having high success rate (65%)
exhibited differences from the bands of pre-training measurements. The test success rate reached 90% in
the muscle fatigue analysis with EMG records obtained from trained volunteers. The successes in 273.44
Hz-332.03 Hz and 332.03 Hz-390.62 Hz frequency ranges were 85% and 90%. The success rate in the
present study showed an alteration between 70% and 90%. Thus, in exercise trained person, MMG data will
not be alone decisive for determining fatigue and EMG data has been demonstrated to operate better
performance in determining fatigue.
4. Discussion
Fig. 5. a). The test accuracy rates by using MMG records analysis for determination of fatigue in pre (at the
onset of exercise) and post (following exercise) exercise training. b). The test accuracy rates by using EMG
records analysis for determination of fatigue in pre (at the onset of exercise) and post (following exercise)
exercise training.
This study evaluated the usage of MMG and EMG as a tool on detection of fatigue following maximal
exercise loading in exercise trained men. The results of the present study clearly demonstrated that MMG
and EMG recordings are useful, and detectable tools in pre-training period. However, in exercise trained
state, MMG fails to detect fatigue, although EMG becomes a more powerful method following exercise
training.
In the present study, MMG recordings were obtained during maximal isometric fatiguing contractions by
using an accelerometer which detects muscle displacements in three dimensions. In contrast to EMG, MMG
reflects both motor unit activation strategy and contractile properties of motor units [23].
In the Fig. 5 seen that MMG records cannot be alone determinative for detecting of fatigue but EMG
records have been demonstrated to operate better performance in detecting of fatigue. After 8 weeks of
sprint training, the test success rates were found between 55% and 65% by using MMG recordings analysis,
but the test success rates in the same study showed an alteration between 70% and 90% by using EMG
recordings.
Motor unit recruitment and discharge rate are two main factors in an increased muscle force in voluntary
contractions [12], [23]. In the fatiguing isometric contractions, MMG alterations has been shown to persist
in low to high intensity voluntary contractions [24]. In the previous studies, increased motor unit
recruitment and decreased discharge rate of motor units has been shown to increase MMG activity [23]. In
contrast, decreased motor unit discharge rate has been shown to decrease EMG activity. Our results suggest
that motor unit activation strategy is one of the prominent factor for the determination of fatigue during
10-25 15-30 20-35 25-40 30-45 35-50 40-55 45-60 50-65 55-70 60-75 65-80 70-85 75-90 80-95 85-100 90-105 95-110100-11550%
55%
60%
65%
70%
75%
80%
85%
90%
95%
100%
All Interested Nodes
Test
Accura
cy
Pre-training MMG recordings (At the onset of exercise)
10-25 15-30 20-35 25-40 30-45 35-50 40-55 45-60 50-65 55-70 60-75 65-80 70-85 75-90 80-95 85-100 90-105 95-110100-11550%
55%
60%
65%
70%
75%
80%
85%
90%
95%
100%
All Interested Nodes
Pre-training EMG recordings (At the onset of exercise)
10-25 15-30 20-35 25-40 30-45 35-50 40-55 45-60 50-65 55-70 60-75 65-80 70-85 75-90 80-95 85-100 90-105 95-110100-11550%
55%
60%
65%
70%
75%
80%
85%
90%
95%
100%
All Interested Nodes
Test
Accura
cy
Post-training MMG recordings (Following exercise)
10-25 15-30 20-35 25-40 30-45 35-50 40-55 45-60 50-65 55-70 60-75 65-80 70-85 75-90 80-95 85-100 90-105 95-110100-11550%
55%
60%
65%
70%
75%
80%
85%
90%
95%
100%
All Interested Nodes
Post-training EMG recordings (Following exercise)
International Journal of Computer and Electrical Engineering
312 Volume 7, Number 5, October 2015

maximal fatiguing contractions.
In the present study, although we did not intend, or measure muscle hypertrophy or muscle force,
increased aerobic and anaerobic capacity values of participants has been showed that the training-induced
adaptations has been effectively achieved. Limonta et al. investigated motor unit activation pattern in
climbers, and showed increased EMG and MMG activities following fatiguing contractions. The researcher
concluded that higher force generation capacity of climbers is attributed to increased number of large and
less fatigable motor units [25]. The conflicting results could be due to the methodological differences, since
in our study, participants were applied an exercise training program lasted in 8 weeks, in contrast to the
participants climbing for several years in the study conducted by Limonta et al. [25].
The original finding of the present study is that the MMG has been failed to detect fatigue following
repeated sprint training could be resulted from several physiological adaptations. One of these adaptations
could be altered motor unit activation strategy following exercise training. As mentioned previously, there is
an inverse correlation between MMG activity and discharge rate of motor units [23]. On the other hand,
Yosithake et al. demonstrated that, when the discharge rate of motor units increase, force fluctuations result
a decrement on MMG activity [26].
Another potential mechanism for explaining the finding that MMG has been failed to detect following
exercise is altered intrinsic mechanical properties of muscles following exercise training. Blazevich et al.
have showed the altered architecture of quadriceps muscle with an increase in fascicle length following 10
weeks of resistance training [27].
Several limitations should be mentioned into this study. We did not measure muscle strength which could
give additional information to distinguish motor unit activation patterns and contractile properties of
muscles following fatiguing contractions. We also did not measure antagonist muscle activities which could
be given additional information on motor unit activation pattern following fatiguing exercise. Future
research on different exercise training methods such as aerobic, resistance, or complex exercise could be
conduct to elucidate the motor unit behavior following fatiguing exercise.
5. Conclusion
In conclusion, the present study demonstrated that whereas MMG failed, EMG is a useful tool to detect
fatigue following maximal loaded exercise in exercise trained state.
Acknowledgment
The research has been supported with project number: 2014.01.0102.001 by the Research Project
Department of Akdeniz University, Antalya, Turkey. This study was approved as ethically by Akdeniz
University, Faculty of Medicine, Scientific Research Assessing Authority with date/number:21.12.2010/220.
References
[1] Kumar, S., & Mital, A. (1996). Electromyography in Ergonomics. London, UK: Taylor and Francis Ltd,
Publisher.
[2] Asghari, O. M., Hu H., & Gan J. Q. (2008). Manifestation of fatigue in myoelectric signals of dynamic
contractions produced during playing PC games. Proceedings of the 30th Annual International IEEE
EMBS Conference (pp. 315–318). Vancouver, BS, Canada.
[3] Comi, G., Leocani, L., Rossi, P., & Colombo, B. (2001). Physiopathology and treatment of fatigue in
multiple sclerosis. J. Neurol, 248, 174-179.
[4] Mathur, S., Eng, J. J., & MacIntyre, D. L. (2005). Reliability of surface EMG during sustained contractions
of the quadriceps. Journal of Electromyography and Kinesiology, 15, 102-110.
[5] Strimpakos, N., et al. (2005). Issues in relation to the repeatability of and correlation between EMG and
International Journal of Computer and Electrical Engineering
313 Volume 7, Number 5, October 2015
International Journal of Computer and Electrical Engineering
314 Volume 7, Number 5, October 2015
Borg scale assessments of neck muscle fatigue. J. of Electromyography and Kinesiology, 15 (5), 452-465.
[6] Ravier, P., Buttelli, O., Jennane, R., & Couratier, P. (2005). An EMG fractal indicator having different
sensitivities to changes in force and muscle fatique during voluntary static muscle contractions. Journal
of Electromyography and Kinesiology, 15, 210-221.
[7] De Luca, C. J. (1997). The use of surface electromyography in Biomech. J. Appl. Biomech, 13, 135–163.
[8] Lindstrom, L., Kadefors, R., & Petersen, I. (1977). An electromyographic index for localized muscle
fatigue. J. Appl. Physiol, 43, 750–754.
[9] Marras, W. S. (1990). Industrial electromyography (EMG). Int. J. Ind. Ergon, 6, 89–74.
[10] Sakurai, T., et al. (2010). Detection of muscle fatigue by the surface electromyogram and its application.
Proceedings of 9th IEEE/ACIS Int. Conference on Computer and Information Science (pp. 43-47).
[11] Soo, Y., et al. (2009). Quantative estimation of muscle fatigue using surface electromyography during
static muscle contraction. Proceedings of Annual Int. Conference of the IEEE EMBS (pp. 2975–2978).
[12] Orizio, C., et al. (2003). The surface mechanomyogram as a tool to describe the influence of fatigue on
biceps brachii motor unit activation strategy. Eur J. Appl Physiol, 90(3-4), 326–336.
[13] Shinohara, M., Kouzaki, M., et al. (1997). Mechanomyography of the human quadriceps muscle during
incremental cycle ergometry. Eur. J. Appl. Physiol. Occup. Physiol, 76, 314–319.
[14] Perry-Rana, S. R., Housh, et al. (2002). MMG and EMG responses during fatiguing isokinetic muscle
contractions at different velocities. Muscle Nerve, 26, 367–373.
[15] Beck, T. W., et al. (2008). Time/frequency events of surface mechanomyographic signals resolved by
nonlinearly scaled wavelets. Biomedical Signal Processing and Control, 3(3), 255-266.
[16] McArdle, W. D., Katch, F. I., & Katch, V. L. (2010). Exercise Physiology: Nutrition, Energy, and Human
Performance. Lippincott Williams & Wilkins.
[17] Huskey, T., Mayhew, J. L., Ball, T. E., & Arnold, M. D. (1989). Factors affecting anaerobic power output in
the Margaria-Kalamen test. Ergonomics, 32(8), 959-965.
[18] Behroozmand, R., & Almasganj, F. (2007). Optimal selection of wavelet-packet-based features using
genetic algorithm in pathological assessment of patients’ speech signal with unilateral vocal fold
paralysis. Computers in Biology and Medicine, 37(4), 474-485.
[19] Chendeb, M., Khalil, M., & Duchêne, J. (2006). Methodology of wavelet packet selection for event
detection. Signal Processing, 86(12), 3826-3841.
[20] Misiti, M., Misiti, Y., Oppenheim, G., & Poggi, J. (1997-2002). Wavelet toolbox for use with MATLAB. The
Mathworks Inc. User’s Guide.
[21] Bilgin, S., Çolak, O. H., Koklukaya, E., & Arı, N. (2008). Efficient solution for frequency band
decomposition problem using wavelet packet in HRV. Digital Signal Processing, 18(6), 892-899.
[22] Bilgin, S., Çolak, O. H., Polat, O., & Koklukaya, E. (2010). Determination of a new VLF band in HRV for
ventricular tachyarrhythmia patients. Journal of Medical Systems, 34(2), 155-160.
[23] Shinohara, M., & Søgaard, K. (2006). Mechanomyography for studying force fluctuations and muscle
fatigue. Exercise and Sport Sciences Reviews, 34(2), 59-64.
[24] Blangsted, A. K., Sjøgaard, G., Madeleine, P., Olsen, H. B., & Søgaard, K. (2005). Voluntary low-force
contraction elicits prolonged low-frequency fatigue and changes in surface electromyography and
mechanomyography. Journal of electromyography and kinesiology, 15(2), 138-148.
[25] Limonta, E., et al. (2015). Motor unit activation strategy during a sustained isometric contraction of
finger flexor muscles in elite climbers. Journal of Sports Sciences, 1-10.
[26] Yoshitake, Y., et al. (2002). Characteristics of surface mechanomyogram are dependent on
development of fusion of motor units in humans. Journal of Applied Physiology, 93(5), 1744-1752.
[27] Blazevich, A. J., et al. (2007). Influence of concentric and eccentric resistance training on architectural

adaptation in human quadriceps muscles. Journal of Applied Physiology, 103(5), 1565-1575.
Gurkan Bilgin received the B.S. degree in 2007 and the M.S. degree in 2009 from the
Department of Electrical and Electronic Engineering, Sakarya University, Turkey. He is a
Ph.D. student in same university and he is working about signal processing.
İ. Etem Hindistan received the B.S. degree in 1992 and the M.Sc. degree in 1995 from the
Dept. of Physical Education Teaching, Marmara University,. He received his Ph.D. degree in
2015 from the School of Physical Education and Sports, Akdeniz University. He is a
member of Akdeniz University, School of Physical Education and Sports. His research area
is sport sciences.
Y. Gul Ozkaya got the M.D. degree in 1994 from Akdeniz University, Faculty of Medicine.
She is a member of Akdeniz University, School of Physical Education and Sports as an
associate professor. Her research areas are exercise physiology and physiology.
Etem Koklukaya received the B.S. degree in 1978 from I.T.U. Istanbul, Turkey in
electronics and communication engineering, the M.S. degree in 1982 from Y.T.U. Istanbul,
Turkey, in electronics and communication engineering, and the Ph.D. degree from I.T.U. in
1990 Istanbul, Turkey, in control and computer engineering. He has been a member of
Gazi University, Turkey, as a professor at the Electrical and Electronics Engineering
Department. His research areas are biomedical signal processing, control systems and
artificial intelligence.
Ovunc Polat received the B.S. degree in 1999 and M.S. degree in 2003 from S.D.U. Isparta,
Turkey, in electronics and communication engineering and the Ph.D. degree in 2007 from
Yildiz Technical University, Turkey, in electrical and electronics engineering. He has been
a member of Akdeniz University, Turkey, as an assistant professor at the Electrical and
Electronics Engineering Department. His research areas are pattern recognition, signal
detection and classification and image processing.
Omer H. Çolak received the B.S. degree in 1999 and the M.S. degree in 2003 from S.D.U.
Isparta, Turkey, in electronics and communication engineering and the Ph.D. degree in
2006 from Sakarya University, Adapazari, Turkey, in electrical and electronics
engineering. He has worked as an postdoctoral researcher in the Department of R&D,
University of Technology Zurich in 2008 and Universite Rene Descartes, Medicine
Faculty, Paris in 2011. He has been a member of Akdeniz University, Turkey, as an
associate professor at the Electrical and Electronics Engineering Department. His research areas are time
frequency signal analysis, wavelet transform and applications, bioelectrical signal processing, neuroscience
signal detection and classification.
International Journal of Computer and Electrical Engineering
315 Volume 7, Number 5, October 2015