Embed Size (px)
Citation preview
separations
Article
Determination of N-Nitrosamines by GasChromatography Coupled to Quadrupole–Time-of-Flight Mass Spectrometry in Water Samples
Benigno José Sieira, Inmaculada Carpinteiro, Rosario Rodil *, José Benito Quintana andRafael Cela
Department of Analytical Chemistry, Nutrition and Food Sciences, Institute of Food Analysis andResearch (IIAA), Universidade de Santiago de Compostela, R/Constantino Candeira S/N,15782 Santiago de Compostela, Spain; [email protected] (B.J.S.); [email protected] (I.C.);[email protected] (J.B.Q.); [email protected] (R.C.)* Correspondence: [email protected]; Tel.: +34-8-8181-6035
Received: 25 November 2019; Accepted: 31 December 2019; Published: 3 January 2020
Abstract: An analytical method based on high-resolution quadrupole–time-of-flight (QToF) massspectrometry has been developed as an alternative to the classical method, using a low-resolutionion trap (IT) analyzer to reduce interferences in N-nitrosamines determination. Extraction of thetargeted compounds was performed by solid-phase extraction (SPE) following the United StatesEnvironmental Protection Agency (USEPA) -521 method. First, both electron impact (EI) and positivechemical ionization (PCI) using methane as ionization gas were compared, along with IT and QToFdetection. Then, parameters such as limits of detection (LOD) and quantification (LOQ), linearity, andrepeatability were assessed. The results showed that the QToF mass analyzer combined with PCI wasthe best system for the determination of the N-nitrosamines, with instrumental LOD and LOQ in theranges of 0.2–4 and 0.6–11 ng mL−1, respectively, which translated into method LOD and LOQ in theranges of 0.2–1.3 and 0.6–3.9 ng L−1, respectively. The analysis of real samples showed the presenceof 6 of the N-nitrosamines in influent, effluent, and tap water. N-nitrosodimethylamine (NDMA) wasquantified in all the analyzed samples at concentrations between 1 and 27 ng L−1. Moreover, fouradditional nitrosamines were found in tap and wastewater samples.
Keywords: gas chromatography–mass spectrometry (GC-MS); high-resolution mass spectrometry(HRMS); N-nitrosamines; water samples; positive chemical ionization (PCI)
1. Introduction
The occurrence of N-nitrosamines in surface water, wastewater, and finished drinking water isa relevant issue of environmental and public health significance because many N-nitrosamines areprobable human carcinogens, mutagens, and teratogens [1]. Many industrial manufacturing processes,such as those for rubber, cosmetics, food, and detergent, are sources of these compounds. In addition,potential sources of nitrosamines include postcombustion CO2 capture using amine-based scrubbingsystems, tobacco smoke, and disinfection of drinking water. Nitrosamines have been found in surfaceand groundwater, in wastewater treatment plant influents and effluents, as well as in drinking water [2].The occurrence of N-nitrosamines in drinking water or treated wastewater may be caused by thepollution of raw waters by nitrosamines or their formation during water treatment processes, such aschloramination or chlorination. They have been found in water as by-products of oxidized aminesafter chlorination treatment in wastewater treatment plants (WWTPs) [3]. In California, United States,N-nitrosodimethylamine (NDMA) has been found at concentrations over 100 ng L−1 in effluent waters
Separations 2020, 7, 3; doi:10.3390/separations7010003 www.mdpi.com/journal/separations
Separations 2020, 7, 3 2 of 12
and below 10 ng L−1 in surface waters, both after chlorination treatments [4]. Nevertheless, the reactionof chloramines with amine precursors is likely the dominant mechanism responsible for NDMAformation in water [5–7]. Specific NDMA precursors in wastewater-impacted source waters mayinclude tertiary amine-containing pharmaceuticals or other quaternary amine-containing constituentsof personal care products [8]. Recent studies have demonstrated that NDMA formation by chlorinationis a low-yield process, resulting in concentrations below 12% compared to the total chlorine loss afterthe treatment at a pH in the range of 6 to 8 [8].
Due to the high carcinogenic activity of some nitrosamines, the World Health Organization(WHO) has included NDMA in its guidelines for drinking water quality, with a guideline value of100 ng L−1 [9]. Nitrosamines are on the chemical contaminants candidate list of the U.S. EnvironmentalProtection Agency (EPA), however to date, major regulations are still at a regional scale. For instance,the government of California set a notification level of 10 ng L−1 and response level of 100 ng L−1 forNDMA, N-nitrosodiethylamine (NDEA), and N-nitrosodipropylamine (NDPA), on the basis of the10−6 risk level estimates, which ranges from 1 to 15 ng L−1 for seven nitrosamines [10].
Research on nitrosamine occurrence in waters would not be possible without the development ofsensitive methods and analytical procedures, particularly considering the low concentration levels thatneed to be determined. The methods currently used for the determination of nitrosamines are mostlybased on enrichment of nitrosamines by solid-phase extraction (SPE) [11,12], solid-phase microextraction(SPME) [13], or dispersive SPE [14] and chromatographic analysis with mass spectrometry (MS)detection, either gas chromatography (GC) [12,15] or liquid chromatography (LC) [16]. The U.S.EPA-521 method [11] for the determination of seven nitrosamines in drinking water proposes an SPEusing coconut charcoal as the sorbent, dichloromethane as the elution solvent, concentration of theextract to less than 1 mL, and GC coupled to tandem MS (GC-MS/MS) detection by chemical ionizationsource operating in positive (PCI) mode and using an ion trap mass analyzer (GC-PCI–MS/MS). Electronimpact (EI) sources could also be used, however nitrosamine fragmentation in EI sources providessmaller ions that could be interfered with by background ions, misleading the identification [12]. Thus,a softer ionization source such as PCI is recommended in the literature [11–14,17–21], with whichfragmentation would be lower. However, even without fragmentation, due to the low molecularweight of nitrosamines, background ions can interfere with their determination. Such ion interferencecould theoretically be solved by using high-resolution mass spectrometry (MS).
Thus, the aim of this work is to develop an alternative to low-resolution ion trap (IT) massanalyzers. The hypothesis to be tested is whether a high-resolution quadrupole–time-of-flight (QToF)instrument can lead to better performance due to its selectivity and overcome the abovementionedproblems of low-resolution MS. Although a methodology based on magnetic sector high-resolutionmass spectrometry was already published some years ago [22], we herein would like to demonstratethat GC-QToF instruments, often used for qualitative purpose [23–25], can compete with such oldertechnologies also for quantitative applications. Therefore, a comparison between IT and QToFanalyzers and both EI and PCI MS ionization sources was performed. Finally, real water samples,including wastewater and tap water, were analyzed to determine the considered compounds withGC-PCI-QToF after SPE following the U.S. EPA-521 method. The nitrosamines considered werethose amenable by GC-MS, reported previously in drinking, surface, and wastewater [18,26,27] andincluded in the U.S. EPA-521 method, i.e., NDMA, N-nitrosomethylethylamine (NMEA), NDEA,NDPA, N-nitrosodibutylamine (NDBA), N-nitrosopiperidine (NPIP), N-nitrosopyrrolidine (NPYR),and N-nitrosomorpholine (NMOR).
2. Materials and Methods
2.1. Chemicals
NDMA, NMEA, NDEA, NDPA, NDBA, NPIP, and NPYR were purchased from Sigma-Aldrich(Steinheim, Germany) as a mixed (EPA-521 Mix) 2000 µg mL−1 solution in dichloromethane (DCM).
Separations 2020, 7, 3 3 of 12
NMOR was individually purchased from Sigma-Aldrich as 5000 µg mL−1 solutions in methanol(MeOH). The properties and structures of these compounds are shown in Table S1 (SupportingInformation). Surrogate standards (NDEA-d10 and NPYR-d8) were individually purchased fromCambridge Isotope Laboratories (Tewksbury, MA, USA) as 1000 µg mL−1 solutions in deuterateddichloromethane. Mixed stock solutions of 100 µg mL−1 were prepared in MeOH and diluted asnecessary in MeOH for water fortification or in ethyl acetate (AcOEt) for injection in the GC-MSsystem. All standards solutions were kept at −20 C. Coconut charcoal SPE cartridges (2 g) weresupplied from Supelco (Sigma-Aldrich, Milwaukee, WI, USA). Ultrapure deionized water (18.2 MΩcm−1) was obtained from a Milli-Q Gradient A-10 system (Millipore, Bedford, MA, USA). MeOH(Reagent European Pharmacopoeia, gradient grade for liquid chromatography) and AcOEt (for gaschromatography MS) were supplied by Merck (Damstard, Germany). Dichloromethane (DCM) forpesticide residue analysis (>99.8%) was obtained from VWR Prolabo (Fontenay-sous-Bois, France).
2.2. Samples
Grab samples were obtained from the influent and effluent of an urban wastewater treatmentplant (WWTP) in Galicia (Spain) equipped with a primary and secondary treatment. These sampleswere stored at 4 C for 24–48 h until analysis. Tap water was obtained from the laboratory at threedifferent times and analyzed immediately after collection. All samples were filtered before analysisthrough 0.45 µm nitrocellulose filters (Millipore, Milford, MA, USA) to remove particulate matter.
2.3. Sample Preparation
Extraction of nitrosamines from water samples was carried out according to the U.S. EPA-521method [11]. Briefly, 500 mL of filtered water was taken and then 20 ng of NDEA-d10 (as surrogatestandards for NDMA, NMEA, and NDEA) and 20 ng of NPYR-d8 (surrogate for the remainingnitrosamines) were added. Samples were percolated through the coconut charcoal (2 g) SPE cartridgesat a flow rate of 10 mL min−1. SPE cartridges were dried under nitrogen stream for 45 min. After drying,compounds were eluted by gravity using 15 mL of DCM, and the resultant extract was concentrated ina Syncore (Büchi Labortechnik AG, Meierseggstrasse, Switzerland) system (water bath at 50 C, kept at175 r.p.m. and 50,000 Pa pressure) down to approximately 0.3 mL. AcOEt was added to the extract andtransferred to graduated glass tubes for further concentration to 100 µL by a gentle nitrogen stream,with the precaution of avoiding dryness of the extract in order to minimize the loss of nitrosaminesby volatilization. Therefore, the solvent of the extract was changed to AcOEt thanks to the highervolatility of DCM. Finally, this extract was injected in the GC-MS system.
2.4. Determination Conditions
Determination of nitrosamines was carried out using two GC-MS instruments: an Agilent 7890Agas chromatograph (Agilent Technologies, Santa Clara, CA, USA) with an Agilent 7693 automaticsampler combined with an Agilent 7200 QToF MS instrument; and a Varian (Walnut Creek, CA, USA)450-GC coupled to an ion trap (Varian 240MS).
In both instruments, the volume injected was 2 µL in the splitless mode of operation, withan injector temperature established at 250 C with a splitless time of 1 min. Three GC capillarycolumns were tested: HP-5MS (5% phenyl-methylpolysiloxane, 30 m × 0.25 mm × 0.25 µm filmthickness, Agilent Technologies), a DB-WAXetr (extended temperature range high polarity polyethyleneglycol, 30 m × 0.25 mm, 0.50 µm film thickness), and HP-35MS (35% phenyl-methylpolysiloxane,30 m × 0.25 mm, 0.25 µm film thickness, Agilent Technologies). Under final conditions, the DB-WAXetrcolumn was used for the sample analysis. The solvent delay was set at 6 min. The oven temperatureprogram was as follows: 60 C kept for 1 min; then ramped to 100 C at 10 C min−1 and kept for1 min; and a final ramp to 245 C at 15 C min−1 and held for 2 min. Helium (99.9999%, Praxair, Spain)was used as carrier gas at a constant flow rate of 1 mL min−1.
Separations 2020, 7, 3 4 of 12
The GC-QToF-MS was operated in the 2 GHz extended dynamic range mode, which provides afull width half maximum (FWHM) resolution of ca. 4000 at m/z 75 and ca. 6000 at m/z 187. The MSspectra were acquired and stored in the profile mode. MS sources conditions were: PCI using methane(99.95%) as ionization gas (20% pressure) at 150 µA of filament emission current and EI workingat 70 eV with the filament emission set at 30 µA. The transfer line, PCI source, EI source, and MSquadrupole temperatures were set at 245 C, 300 C, 230 C, and 150 C, respectively. Full-scanacquisition mode was set in the range of 40–650 m/z with an acquisition rate of 5 spectrum s−1.For the high-resolution mass spectrometry (HRMS) calibration to be maintained during the analysissequence, perfluorotributylamine (PFTBA) was infused in the MS every 4 injections, according to themanufacturer specifications.
In the GC-IT-MS instrument, an external ionization configuration of the MS source was used.The transfer line, MS source, manifold, and ion trap temperatures were 280 C, 200 C, 50 C, and 150 C,respectively. Full-scan mode of acquisition was set in the range of 40–230 m/z, with an acquisition rateof 2 spectrum s−1, average scans of 3 µScans, and target total ion chromatogram (TIC) of 20,000 counts.For EI, the filament emission current was set at 30 µA, while in PCI, using methane as an ionizationgas, it was set at 100 µA. The damping gas was set at 2.5 mL min−1. MS/MS experiments were alsotested with spectra acquired in the GC-(PCI)-IT-MS system at 3 spectra s−1.
2.5. Method Validation
Analytes were quantified using NDEA-d10 as surrogate internal standards (IS) for NDMA, NMEA,and NDEA; and NPYR-d8 for the rest of the nitrosamines.
Linearity was assessed by a 9-point (1, 2, 5, 10, 20, 50, 100, 200, 500 ng mL−1) calibrationcurve ranging from the instrumental quantification limits (IQL) to 500 ng mL−1 (IS concentration:200 ng mL−1). Instrumental detection limits (IDL) and IQL were estimated from the lowest calibrationstandards as the concentrations providing a signal to noise ratio (S/N) of 3 and 10, respectively. Intra-dayand inter-day instrumental precision were assessed from the relative standard deviation (%RSD) of sixinjections of a standard of 50 ng mL−1 performed over 24 h (intra-day precision) or over three weeks(inter-day precision).
Validation of the SPE-GC-MS method was performed in wastewater samples spiked at two levelswith 5 ng and 100 ng of all the analytes (10 and 200 ng L−1 referred to the sample, respectively) and 20 ngof IS before extraction. Additional aliquots were spiked only with IS and processed simultaneouslyin order to account for the background levels. Method detection and quantification limits (MDLand MQL) were estimated from the measured concentrations in spiked wastewater samples (n = 3),downscaling the levels for which the S/N values are 3 (MDL) and 10 (MQL). Accuracy—determinedfor the wastewater samples spiked with 5 ng and 100 ng of all the analytes—was expressed as theaverage recovery, calculated from calibrations performed with standards in AcOEt by the internalstandard method from the nominal spiking value. Precision was expressed as the %RSD from theaverage concentration measured (n = 3).
3. Results and Discussion
3.1. Capillary Column Selection
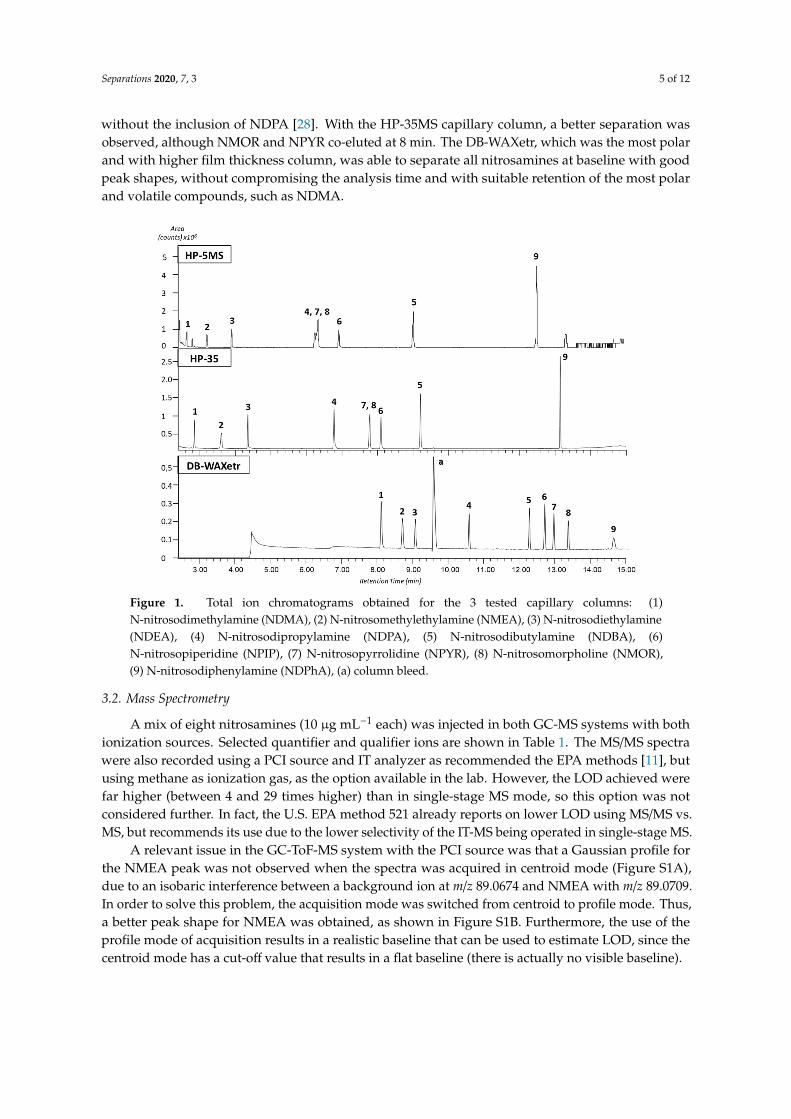
Three different capillary columns were tested using the temperature program described inSection 2.4 to obtain the best chromatographic separation. In order from less to more polar, thecolumns were: HP-5MS, HP-35MS, and DB-WAXetr. A 10 µg mL−1 mix standard was injected in allthree cases. The compounds were identified based on their EI spectra using the National Instituteof Standards and Technology (NIST) library. As shown in Figure 1, by using the HP-5MS capillarycolumn, all compounds eluted before 13 min, with a co-elution of NPYR, NMOR, and NDPA at 6.5 min.Jurado-Sánchez et al. obtained a separation at baseline for seven common nitrosamines using the sameHP-5MS capillary column, but a longer oven program was used, with a total runtime of 22 min and
Separations 2020, 7, 3 5 of 12
without the inclusion of NDPA [28]. With the HP-35MS capillary column, a better separation wasobserved, although NMOR and NPYR co-eluted at 8 min. The DB-WAXetr, which was the most polarand with higher film thickness column, was able to separate all nitrosamines at baseline with goodpeak shapes, without compromising the analysis time and with suitable retention of the most polarand volatile compounds, such as NDMA.
Separations 2020, 7, x FOR PEER REVIEW 5 of 12
good peak shapes, without compromising the analysis time and with suitable retention of the most polar and volatile compounds, such as NDMA.
Figure 1. Total ion chromatograms obtained for the 3 tested capillary columns: (1) N-nitrosodimethylamine (NDMA), (2) N-nitrosomethylethylamine (NMEA), (3) N-nitrosodiethylamine (NDEA), (4) N-nitrosodipropylamine (NDPA), (5) N-nitrosodibutylamine (NDBA), (6) N-nitrosopiperidine (NPIP), (7) N-nitrosopyrrolidine (NPYR), (8) N-nitrosomorpholine (NMOR), (9) N-nitrosodiphenylamine (NDPhA), (a) column bleed.
3.2. Mass Spectrometry
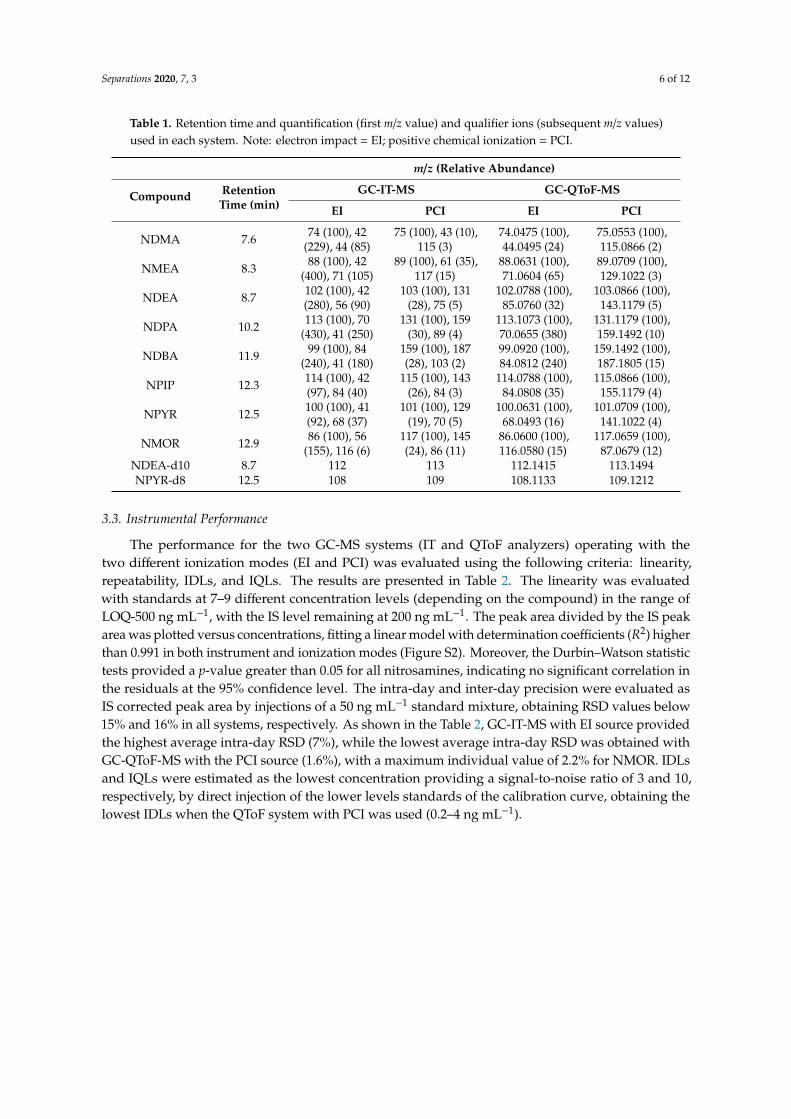
A mix of eight nitrosamines (10 µg mL−1 each) was injected in both GC-MS systems with both ionization sources. Selected quantifier and qualifier ions are shown in Table 1. The MS/MS spectra were also recorded using a PCI source and IT analyzer as recommended the EPA methods [11], but using methane as ionization gas, as the option available in the lab. However, the LOD achieved were far higher (between 4 and 29 times higher) than in single-stage MS mode, so this option was not considered further. In fact, the U.S. EPA method 521 already reports on lower LOD using MS/MS vs. MS, but recommends its use due to the lower selectivity of the IT-MS being operated in single-stage MS.
Table 1. Retention time and quantification (first m/z value) and qualifier ions (subsequent m/z values) used in each system. Note: electron impact = EI; positive chemical ionization = PCI.
m/z (Relative Abundance)
Compound Retention Time
(min) GC-IT-MS GC-QToF-MS
EI PCI EI PCI
NDMA 7.6 74 (100), 42
(229), 44 (85) 75 (100), 43 (10), 115 (3)
74.0475 (100), 44.0495 (24)
75.0553 (100), 115.0866 (2)
NMEA 8.3 88 (100), 42
(400), 71 (105) 89 (100), 61
(35), 117 (15) 88.0631 (100), 71.0604 (65)
89.0709 (100), 129.1022 (3)
NDEA 8.7 102 (100), 42 (280), 56 (90)
103 (100), 131 (28), 75 (5)
102.0788 (100), 85.0760 (32)
103.0866 (100), 143.1179 (5)
NDPA 10.2 113 (100), 70
(430), 41 (250) 131 (100), 159
(30), 89 (4) 113.1073 (100), 70.0655 (380)
131.1179 (100), 159.1492 (10)
Figure 1. Total ion chromatograms obtained for the 3 tested capillary columns: (1)N-nitrosodimethylamine (NDMA), (2) N-nitrosomethylethylamine (NMEA), (3) N-nitrosodiethylamine(NDEA), (4) N-nitrosodipropylamine (NDPA), (5) N-nitrosodibutylamine (NDBA), (6)N-nitrosopiperidine (NPIP), (7) N-nitrosopyrrolidine (NPYR), (8) N-nitrosomorpholine (NMOR),(9) N-nitrosodiphenylamine (NDPhA), (a) column bleed.
3.2. Mass Spectrometry
A mix of eight nitrosamines (10 µg mL−1 each) was injected in both GC-MS systems with bothionization sources. Selected quantifier and qualifier ions are shown in Table 1. The MS/MS spectrawere also recorded using a PCI source and IT analyzer as recommended the EPA methods [11], butusing methane as ionization gas, as the option available in the lab. However, the LOD achieved werefar higher (between 4 and 29 times higher) than in single-stage MS mode, so this option was notconsidered further. In fact, the U.S. EPA method 521 already reports on lower LOD using MS/MS vs.MS, but recommends its use due to the lower selectivity of the IT-MS being operated in single-stage MS.
A relevant issue in the GC-ToF-MS system with the PCI source was that a Gaussian profile forthe NMEA peak was not observed when the spectra was acquired in centroid mode (Figure S1A),due to an isobaric interference between a background ion at m/z 89.0674 and NMEA with m/z 89.0709.In order to solve this problem, the acquisition mode was switched from centroid to profile mode. Thus,a better peak shape for NMEA was obtained, as shown in Figure S1B. Furthermore, the use of theprofile mode of acquisition results in a realistic baseline that can be used to estimate LOD, since thecentroid mode has a cut-off value that results in a flat baseline (there is actually no visible baseline).
Separations 2020, 7, 3 6 of 12
Table 1. Retention time and quantification (first m/z value) and qualifier ions (subsequent m/z values)used in each system. Note: electron impact = EI; positive chemical ionization = PCI.
m/z (Relative Abundance)
Compound RetentionTime (min)
GC-IT-MS GC-QToF-MS
EI PCI EI PCI
NDMA 7.6 74 (100), 42(229), 44 (85)
75 (100), 43 (10),115 (3)
74.0475 (100),44.0495 (24)
75.0553 (100),115.0866 (2)
NMEA 8.3 88 (100), 42(400), 71 (105)
89 (100), 61 (35),117 (15)
88.0631 (100),71.0604 (65)
89.0709 (100),129.1022 (3)
NDEA 8.7 102 (100), 42(280), 56 (90)
103 (100), 131(28), 75 (5)
102.0788 (100),85.0760 (32)
103.0866 (100),143.1179 (5)
NDPA 10.2 113 (100), 70(430), 41 (250)
131 (100), 159(30), 89 (4)
113.1073 (100),70.0655 (380)
131.1179 (100),159.1492 (10)
NDBA 11.9 99 (100), 84(240), 41 (180)
159 (100), 187(28), 103 (2)
99.0920 (100),84.0812 (240)
159.1492 (100),187.1805 (15)
NPIP 12.3 114 (100), 42(97), 84 (40)
115 (100), 143(26), 84 (3)
114.0788 (100),84.0808 (35)
115.0866 (100),155.1179 (4)
NPYR 12.5 100 (100), 41(92), 68 (37)
101 (100), 129(19), 70 (5)
100.0631 (100),68.0493 (16)
101.0709 (100),141.1022 (4)
NMOR 12.9 86 (100), 56(155), 116 (6)
117 (100), 145(24), 86 (11)
86.0600 (100),116.0580 (15)
117.0659 (100),87.0679 (12)
NDEA-d10 8.7 112 113 112.1415 113.1494NPYR-d8 12.5 108 109 108.1133 109.1212
3.3. Instrumental Performance
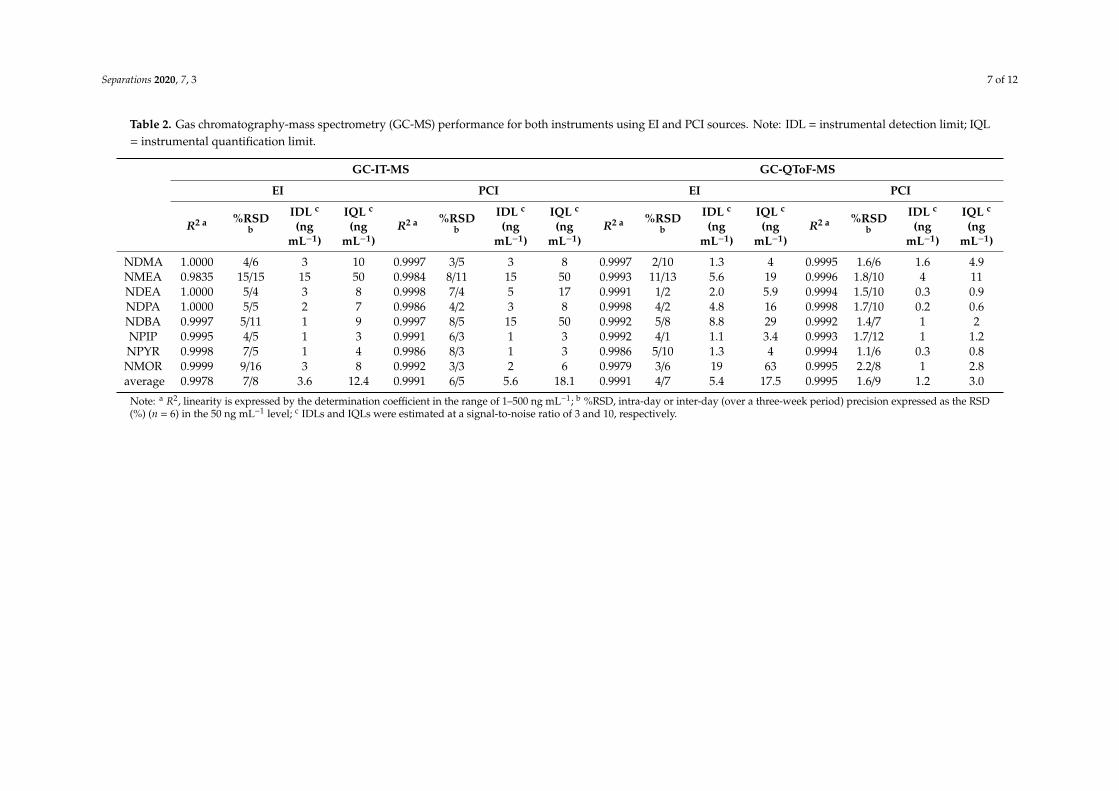
The performance for the two GC-MS systems (IT and QToF analyzers) operating with thetwo different ionization modes (EI and PCI) was evaluated using the following criteria: linearity,repeatability, IDLs, and IQLs. The results are presented in Table 2. The linearity was evaluatedwith standards at 7–9 different concentration levels (depending on the compound) in the range ofLOQ-500 ng mL−1, with the IS level remaining at 200 ng mL−1. The peak area divided by the IS peakarea was plotted versus concentrations, fitting a linear model with determination coefficients (R2) higherthan 0.991 in both instrument and ionization modes (Figure S2). Moreover, the Durbin–Watson statistictests provided a p-value greater than 0.05 for all nitrosamines, indicating no significant correlation inthe residuals at the 95% confidence level. The intra-day and inter-day precision were evaluated asIS corrected peak area by injections of a 50 ng mL−1 standard mixture, obtaining RSD values below15% and 16% in all systems, respectively. As shown in the Table 2, GC-IT-MS with EI source providedthe highest average intra-day RSD (7%), while the lowest average intra-day RSD was obtained withGC-QToF-MS with the PCI source (1.6%), with a maximum individual value of 2.2% for NMOR. IDLsand IQLs were estimated as the lowest concentration providing a signal-to-noise ratio of 3 and 10,respectively, by direct injection of the lower levels standards of the calibration curve, obtaining thelowest IDLs when the QToF system with PCI was used (0.2–4 ng mL−1).
Separations 2020, 7, 3 7 of 12
Table 2. Gas chromatography-mass spectrometry (GC-MS) performance for both instruments using EI and PCI sources. Note: IDL = instrumental detection limit; IQL= instrumental quantification limit.
GC-IT-MS GC-QToF-MS
EI PCI EI PCI
R2 a %RSDb
IDL c
(ngmL−1)
IQL c
(ngmL−1)
R2 a %RSDb
IDL c
(ngmL−1)
IQL c
(ngmL−1)
R2 a %RSDb
IDL c
(ngmL−1)
IQL c
(ngmL−1)
R2 a %RSDb
IDL c
(ngmL−1)
IQL c
(ngmL−1)
NDMA 1.0000 4/6 3 10 0.9997 3/5 3 8 0.9997 2/10 1.3 4 0.9995 1.6/6 1.6 4.9NMEA 0.9835 15/15 15 50 0.9984 8/11 15 50 0.9993 11/13 5.6 19 0.9996 1.8/10 4 11NDEA 1.0000 5/4 3 8 0.9998 7/4 5 17 0.9991 1/2 2.0 5.9 0.9994 1.5/10 0.3 0.9NDPA 1.0000 5/5 2 7 0.9986 4/2 3 8 0.9998 4/2 4.8 16 0.9998 1.7/10 0.2 0.6NDBA 0.9997 5/11 1 9 0.9997 8/5 15 50 0.9992 5/8 8.8 29 0.9992 1.4/7 1 2NPIP 0.9995 4/5 1 3 0.9991 6/3 1 3 0.9992 4/1 1.1 3.4 0.9993 1.7/12 1 1.2NPYR 0.9998 7/5 1 4 0.9986 8/3 1 3 0.9986 5/10 1.3 4 0.9994 1.1/6 0.3 0.8NMOR 0.9999 9/16 3 8 0.9992 3/3 2 6 0.9979 3/6 19 63 0.9995 2.2/8 1 2.8average 0.9978 7/8 3.6 12.4 0.9991 6/5 5.6 18.1 0.9991 4/7 5.4 17.5 0.9995 1.6/9 1.2 3.0
Note: a R2, linearity is expressed by the determination coefficient in the range of 1–500 ng mL−1; b %RSD, intra-day or inter-day (over a three-week period) precision expressed as the RSD(%) (n = 6) in the 50 ng mL−1 level; c IDLs and IQLs were estimated at a signal-to-noise ratio of 3 and 10, respectively.
Separations 2020, 7, 3 8 of 12
3.4. Performance with Real Samples after SPE
The different GC-MS systems were also compared in terms of overall method LOD (MDL) andLOQ (MQL) using 500 mL of effluent wastewater as real matrix after the SPE following the U.S. EPA521 method (see Experimental). As presented in Table 3, GC-PCI-QToF-MS clearly provided the lowestaverage MDL (0.5 ng L−1) and MQL (1.6 ng L−1) values, being approximately 1 order of magnitudebetter than those obtained with the other 3 approaches.
Table 3. Accuracy of the method detection limit (MDL) and method quantification limit (MQL),expressed as recoveries (R%), intra-day precision (expressed as RSD), and mass accuracy (average errorin mDa) obtained from a spiked (10 ng L−1 and 200 ng L−1) wastewater effluent sample.
MDLs (ng L−1) MQLs (ng L−1) R% RSD Mass Accuracy(mDa)
10 ngL−1
200 ngL−1
10 ngL−1
200 ngL−1
10 ngL−1
200 ngL−1
GC-IT-MS GC-QToF-MS GC-IT-MS GC-QToF-MS GC-QToF-MS
EI PCI EI PCI EI PCI EI PCI PCI
NDMA 7.2 1.3 1.7 0.4 21.6 3.9 5.1 1.2 119 62 3.2 5.2 0.20 0.15NMEA 20 24 2.2 1.3 60 72 6.6 3.9 65 66 0.75 6.5 0.35 0.90NDEA 2.0 1.8 1.2 0.2 6 5.4 3.6 0.6 119 89 2.1 5.2 0.20 0.10NDPA 5.8 7.6 3.9 0.4 17.4 22.8 11.7 1.2 101 109 5.6 4.2 0.32 0.13NDBA 12 6.7 5.4 0.6 36 20.1 16.2 1.8 107 113 5.1 4.6 0.35 0.35NPIP 3.6 1.2 1.0 0.4 10.8 3.6 3 1.2 117 106 2.1 2.5 0.20 0.55NPYR 4.8 1.2 3.9 0.4 14.4 3.6 11.7 1.2 118 105 4.5 6.7 0.65 0.45NMOR 10 3.9 22 0.6 30 11.7 66 1.8 92 106 0.97 5.0 0.52 0.70
average 8.2 6.0 5.2 0.5 24.5 17.9 15.5 1.6 105 95 3.0 5.0 0.35 0.42
The estimated MDLs obtained by GC-PCI-QTOF were in the range of 0.2 ng L−1 (NDEA)–1.3 ng L−1
(NMEA). These values are comparable to those reported in the literature (Table S2). Cheng et al., usinga 500 mL of sample, reported MDLs in the range of 0.3–1.8 ng L−1, using SPE and a GC-PCI-MS/MSsystem with a slightly different protocol from the EPA-521 method [17]. The U.S. EPA-521 method [11]reported MDLs in the range of 0.3–0.7 ng L−1, also considering a volume of 500 mL and exactly the sameSPE protocol, but via large-volume injection of 20 µL of extract then GC-PCI-IT-MS/MS. The proposedGC-PCI-QTOF-MS method can provide MDLs at the same order of magnitude as the U.S. EPA methodby injecting 10 times less extract, thus being a good alternative to that method, particularly consideringthat IT instruments are losing popularity and that using methanol or acetonitrile as the reaction gasis not feasible with all instruments. Furthermore, the method proposed here was validated with amore complex matrix than the EPA method (effluent wastewater vs. tap water), demonstrating itshigh selectivity.
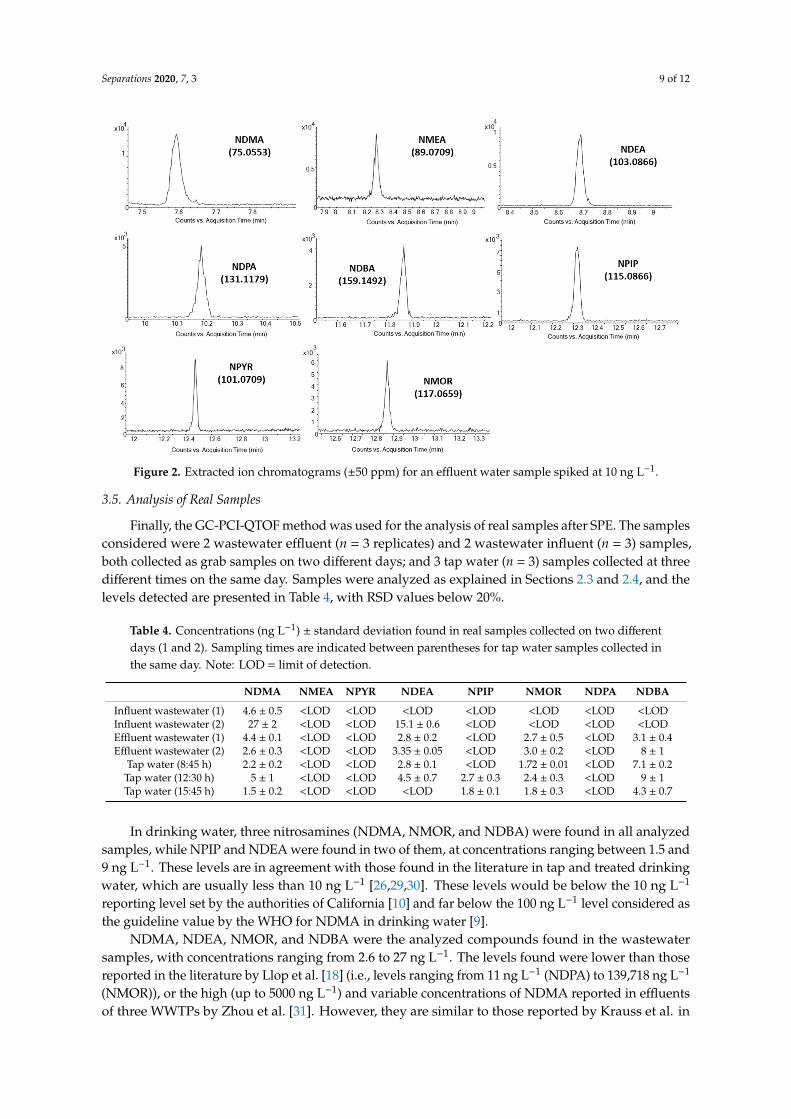
Overall accuracy and precision for the method were assessed with the GC-PCI-QTOF systemusing effluent water that was spiked at 10 ng L−1 and 200 ng L−1, so as to verify its performance beforeits application in real samples. A chromatogram of an effluent water sample spiked at 10 ng L−1 isshown in Figure 2. Results are shown in Table 3, in which all compounds show recoveries in the rangeof 90–120%, except for NDMA and NMEA, with relative standard deviations below 7% and massaccuracies exhibiting an error below 1 mDa.
Separations 2020, 7, 3 9 of 12Separations 2020, 7, x FOR PEER REVIEW 9 of 12
Figure 2. Extracted ion chromatograms (±50 ppm) for an effluent water sample spiked at 10 ng L−1.
3.5. Analysis of Real Samples
Finally, the GC-PCI-QTOF method was used for the analysis of real samples after SPE. The samples considered were 2 wastewater effluent (n = 3 replicates) and 2 wastewater influent (n = 3) samples, both collected as grab samples on two different days; and 3 tap water (n = 3) samples collected at three different times on the same day. Samples were analyzed as explained in Sections 2.3 and 2.4, and the levels detected are presented in Table 4, with RSD values below 20%.
Table 4. Concentrations (ng L−1) ± standard deviation found in real samples collected on two different days (1 and 2). Sampling times are indicated between parentheses for tap water samples collected in the same day. Note: LOD = limit of detection.
NDMA NMEA NPYR NDEA NPIP NMOR NDPA NDBA
Influent wastewater (1) 4.6 ± 0.5 <LOD <LOD <LOD <LOD <LOD <LOD <LOD
Influent wastewater (2) 27 ± 2 <LOD <LOD 15.1 ± 0.6 <LOD <LOD <LOD <LOD
Effluent wastewater (1) 4.4 ± 0.1 <LOD <LOD 2.8 ± 0.2 <LOD 2.7 ± 0.5 <LOD 3.1 ± 0.4
Effluent wastewater (2) 2.6 ± 0.3 <LOD <LOD 3.35 ± 0.05 <LOD 3.0 ± 0.2 <LOD 8 ± 1
Tap water (8:45 h) 2.2 ± 0.2 <LOD <LOD 2.8 ± 0.1 <LOD 1.72 ± 0.01 <LOD 7.1 ± 0.2
Tap water (12:30 h) 5 ± 1 <LOD <LOD 4.5 ± 0.7 2.7 ± 0.3 2.4 ± 0.3 <LOD 9 ± 1
Tap water (15:45 h) 1.5 ± 0.2 <LOD <LOD <LOD 1.8 ± 0.1 1.8 ± 0.3 <LOD 4.3 ± 0.7
In drinking water, three nitrosamines (NDMA, NMOR, and NDBA) were found in all analyzed samples, while NPIP and NDEA were found in two of them, at concentrations ranging between 1.5 and 9 ng L−1. These levels are in agreement with those found in the literature in tap and treated drinking water, which are usually less than 10 ng L−1 [26,29,30]. These levels would be below the 10 ng L−1 reporting level set by the authorities of California [10] and far below the 100 ng L−1 level considered as the guideline value by the WHO for NDMA in drinking water [9].
Figure 2. Extracted ion chromatograms (±50 ppm) for an effluent water sample spiked at 10 ng L−1.
3.5. Analysis of Real Samples
Finally, the GC-PCI-QTOF method was used for the analysis of real samples after SPE. The samplesconsidered were 2 wastewater effluent (n = 3 replicates) and 2 wastewater influent (n = 3) samples,both collected as grab samples on two different days; and 3 tap water (n = 3) samples collected at threedifferent times on the same day. Samples were analyzed as explained in Sections 2.3 and 2.4, and thelevels detected are presented in Table 4, with RSD values below 20%.
Table 4. Concentrations (ng L−1) ± standard deviation found in real samples collected on two differentdays (1 and 2). Sampling times are indicated between parentheses for tap water samples collected inthe same day. Note: LOD = limit of detection.
NDMA NMEA NPYR NDEA NPIP NMOR NDPA NDBA
Influent wastewater (1) 4.6 ± 0.5 <LOD <LOD <LOD <LOD <LOD <LOD <LODInfluent wastewater (2) 27 ± 2 <LOD <LOD 15.1 ± 0.6 <LOD <LOD <LOD <LODEffluent wastewater (1) 4.4 ± 0.1 <LOD <LOD 2.8 ± 0.2 <LOD 2.7 ± 0.5 <LOD 3.1 ± 0.4Effluent wastewater (2) 2.6 ± 0.3 <LOD <LOD 3.35 ± 0.05 <LOD 3.0 ± 0.2 <LOD 8 ± 1
Tap water (8:45 h) 2.2 ± 0.2 <LOD <LOD 2.8 ± 0.1 <LOD 1.72 ± 0.01 <LOD 7.1 ± 0.2Tap water (12:30 h) 5 ± 1 <LOD <LOD 4.5 ± 0.7 2.7 ± 0.3 2.4 ± 0.3 <LOD 9 ± 1Tap water (15:45 h) 1.5 ± 0.2 <LOD <LOD <LOD 1.8 ± 0.1 1.8 ± 0.3 <LOD 4.3 ± 0.7
In drinking water, three nitrosamines (NDMA, NMOR, and NDBA) were found in all analyzedsamples, while NPIP and NDEA were found in two of them, at concentrations ranging between 1.5 and9 ng L−1. These levels are in agreement with those found in the literature in tap and treated drinkingwater, which are usually less than 10 ng L−1 [26,29,30]. These levels would be below the 10 ng L−1
reporting level set by the authorities of California [10] and far below the 100 ng L−1 level considered asthe guideline value by the WHO for NDMA in drinking water [9].
NDMA, NDEA, NMOR, and NDBA were the analyzed compounds found in the wastewatersamples, with concentrations ranging from 2.6 to 27 ng L−1. The levels found were lower than thosereported in the literature by Llop et al. [18] (i.e., levels ranging from 11 ng L−1 (NDPA) to 139,718 ng L−1
(NMOR)), or the high (up to 5000 ng L−1) and variable concentrations of NDMA reported in effluentsof three WWTPs by Zhou et al. [31]. However, they are similar to those reported by Krauss et al. in
Separations 2020, 7, 3 10 of 12
WWTPs in Switzerland, where in primary effluents, NDMA, NMOR, NDBA, NPIP, and NDEA werefound at concentrations typically in the range of 5–25 ng L−1, while in the secondary effluent NDMAconcentrations were usually lower than 10 ng L−1 [27].
4. Conclusions
Results show that GC-PCI-QToF-MS can provide sufficiently low LODs for the determination ofnitrosamines in water samples, with excellent selectivity as compared to existing methods. Thus, theGC-QToF can be a valuable alternative to the EPA method 521, as it does not require large-volumeinjection. The method was finally applied to real drinking and wastewater samples, where severalnitrosamines were detected at the 1–27 ng L−1 level.
Supplementary Materials: The following are available online at http://www.mdpi.com/2297-8739/7/1/3/s1.Table S1. Structure and properties of the N-nitrosamines considered in this work. Table S2: Compilation of MDLsreported in the literature for the determination of nitrosamines in water. Figure S1. Isobaric interference forNMEA in PCI acquisition in centroid (A) and profile modes (B). Extracted ion chromatograms (EIC) with ±50 ppm.Figure S2: Calibration curves obtained by: (a) GC-EI—MS (IT), (b) GC-PCI—MS (IT), (c) GC-EI-MS(QTOF), and(d) GC-PCI-MS(QTOF).
Author Contributions: Conceptualization, J.B.Q. and R.R.; methodology, J.B.Q. and R.R.; validation, B.J.S. andI.C.; formal analysis, B.J.S.; investigation, B.J.S.; resources, R.C.; writing—original draft preparation, B.J.S. andI.C.; writing—review and editing, R.R. and J.B.Q.; visualization, R.C.; supervision, R.R. and J.B.Q.; projectadministration, R.R., J.B.Q. and R.C.; funding acquisition, R.R., J.B.Q. and R.C. All authors have read and agreedto the published version of the manuscript.
Funding: This research was funded by Xunta de Galicia (references EM2014/004 and ED431C2017/36), SpanishAgencia Estatal de Investigación (reference CTM2017-84763-C3-R-2), and European Regional Development Fund(FEDER/ERDF) funds. I.C. acknowledges her postdoctoral formation grant from Xunta de Galicia government.
Conflicts of Interest: The authors declare no conflict of interest.
References
1. Choi, J.; Valentine, R.L. Formation of N-nitrosodimethylamine (NDMA) from reaction of monochloramine:A new disinfection by-product. Water Res. 2002, 36, 817–824. [CrossRef]
2. Nawrocki, J.; Andrzejewski, P. Nitrosamines and water. J. Hazard. Mater. 2011, 189, 1–18. [CrossRef][PubMed]
3. Mitch, W.A.; Sedlak, D.L. Formation of N -Nitrosodimethylamine (NDMA) from Dimethylamine duringChlorination. Environ. Sci. Technol. 2002, 36, 588–595. [CrossRef] [PubMed]
4. Mitch, W.A.; Gerecke, A.C.; Sedlak, D.L. A N-Nitrosodimethylamine (NDMA) precursor analysis forchlorination of water and wastewater. Water Res. 2003, 37, 3733–3741. [CrossRef]
5. Le Roux, J.; Gallard, H.; Croue, J. Chloramination of nitrogenous contaminants (pharmaceuticals andpesticides): NDMA and halogenated DBPs formation. Water Res. 2011, 45, 3164–3174. [CrossRef]
6. Chen, B.; Qian, Y.; Wu, M.; Zhu, L.; Hu, B.; Li, X. Identification of Precursors and Mechanisms ofTobacco-Specific Nitrosamine Formation in Water during Chloramination. Environ. Sci. Technol. 2015, 49,459–466. [CrossRef]
7. Park, S.H.; Padhye, L.P.; Wang, P.; Cho, M.; Kim, J.-H.; Huang, C.-H. N-nitrosodimethylamine (NDMA)formation potential of amine-based water treatment polymers: Effects of in situ chloramination, breakpointchlorination, and pre-oxidation. J. Hazard. Mater. 2015, 282, 133–140. [CrossRef]
8. Krasner, S.W.; Shirkhani, R.; Westerhoff, P.; Hanigan, D.; Mitch, W.A.; McCurry, D.L.; Chen, C.; Skadsen, J.;Von Gunten, U. Controlling the Formation of Nitrosamines During Water Treatment; Report No 4370; WaterResearch Foundation: Denver, CO, USA, 2015.
9. World Health Organization. Guidelines for Drinking Water Quality; WHO: Geneva, Switzerland, 2004; Volume3, ISBN 978-92-4-154815-1.
10. Boards, C.W. NDMA and Other Nitrosamines—Drinking Water Issues. Available online: https://www.waterboards.ca.gov/drinking_water/certlic/drinkingwater/NDMA.html (accessed on 11 June 2018).
Separations 2020, 7, 3 11 of 12
11. Munch, J.; Bassett, M. Solid Phase Extraction and Capillary Column Gas Chromatography with Large VolumeInjection and Chemical Ionization Tandem Mass Spectrometry (MS/MS). EPA Rep. 2004, 182, 1–47.
12. Pozzi, R.; Bocchini, P.; Pinelli, F.; Galletti, G.C. Determination of nitrosamines in water by gaschromatography/chemical ionization/selective ion trapping mass spectrometry. J. Chromatogr. A 2011,1218, 1808–1814. [CrossRef]
13. Grebel, J.E.; Young, C.C.; Suffet, I.H. (Mel) Solid-phase microextraction of N-nitrosamines. J. Chromatogr. A2006, 1117, 11–18. [CrossRef]
14. Fu, S.C.; Tzing, S.H.; Chen, H.C.; Wang, Y.C.; Ding, W.H. Dispersive micro-solid phase extraction combinedwith gas chromatography-chemical ionization mass spectrometry for the determination of N-nitrosamines inswimming pool water samples. Anal. Bioanal. Chem. 2012, 402, 2209–2216. [CrossRef] [PubMed]
15. Chen, W.; Li, X.; Huang, H.; Zhu, X.; Jiang, X.; Zhang, Y.; Cen, K.; Zhao, L.; Liu, X.; Qi, S. Comparison ofgas chromatography-mass spectrometry and gas chromatography-tandem mass spectrometry with electronionization for determination of N-nitrosamines in environmental water. Chemosphere 2017, 168, 1400–1410.[CrossRef] [PubMed]
16. Zhao, Y.; Boyd, J.; Hrudey, S.E.; Li, X. Characterization of New Nitrosamines in Drinking Water UsingLiquid Chromatography Tandem Mass Spectrometry. Environ. Sci. Technol. 2006, 40, 7636–7641. [CrossRef][PubMed]
17. Cheng, R.C.; Hwang, C.J.; Andrews-Tate, C.; Yingbo, G.; Carr, S.; Suffet, I.H. Alternative methods for theanalysis of NDMA and other nitrosamines in water. Am. Water Work. Assoc. 2006, 98, 82–96. [CrossRef]
18. Llop, A.; Borrull, F.; Pocurull, E. Fully automated determination of N-nitrosamines in environmental watersby headspace solid-phase microextraction followed by GC-MS-MS. J. Sep. Sci. 2010, 33, 3692–3700. [CrossRef]
19. Yurchenko, S.; Mölder, U. N-nitrosodimethylamine analysis in Estonian beer using positive-ion chemicalionization with gas chromatography mass spectrometry. Food Chem. 2005, 89, 455–463. [CrossRef]
20. Yurchenko, S.; Mölder, U. Volatile N-nitrosamines in various fish products. Food Chem. 2006, 96, 325–333.[CrossRef]
21. Yurchenko, S.; Mölder, U. The occurrence of volatile N-nitrosamines in Estonian meat products. Food Chem.2007, 100, 1713–1721. [CrossRef]
22. Planas, C.; Palacios, Ó.; Ventura, F.; Rivera, J.; Caixach, J. Analysis of nitrosamines in water by automatedSPE and isotope dilution GC/HRMS. Occurrence in the different steps of a drinking water treatment plant,and in chlorinated samples from a reservoir and a sewage treatment plant effluent. Talanta 2008, 76, 906–913.[CrossRef]
23. Moschet, C.; Lew, B.M.; Hasenbein, S.; Anumol, T.; Young, T.M. LC-and GC-QTOF-MS as ComplementaryTools for a Comprehensive Micropollutant Analysis in Aquatic Systems. Environ. Sci. Technol. 2017, 51,1553–1561. [CrossRef]
24. Wang, Y.; Gao, W.; Wang, Y.; Jiang, G. Suspect screening analysis of the occurrence and removal ofmicropollutants by GC-QTOF MS during wastewater treatment processes. J. Hazard. Mater. 2019, 376,153–159. [CrossRef] [PubMed]
25. Abushareeda, W.; Lyris, E.; Kraiem, S.; Al Wahaibi, A.; Alyazidi, S.; Dbes, N.; Lommen, A.; Nielen, M.;Horvatovich, P.L.; Alsayrafi, M.; et al. Gas chromatographic quadrupole time-of-flight full scan highresolution mass spectrometric screening of human urine in antidoping analysis. J. Chromatogr. B Anal.Technol. Biomed. Life Sci. 2017, 1063, 74–83. [CrossRef] [PubMed]
26. Charrois, J.W.A.; Boyd, J.M.; Froese, K.L.; Hrudey, S.E. Occurrence of N-nitrosamines in Alberta publicdrinking-water distribution systems. J. Environ. Eng. Sci. 2007, 6, 103–114. [CrossRef]
27. Krauss, M.; Longrée, P.; Dorusch, F.; Ort, C.; Hollender, J. Occurrence and removal of N-nitrosamines inwastewater treatment plants. Water Res. 2009, 43, 4381–4391. [CrossRef]
28. Jurado-Sánchez, B.; Ballesteros, E.; Gallego, M. Comparison of the sensitivities of seven N-nitrosamines inpre-screened waters using an automated preconcentration system and gas chromatography with differentdetectors. J. Chromatogr. A 2007, 1154, 66–73. [CrossRef]
29. Krasner, S.W.; Mitch, W.A.; Mccurry, D.L.; Hanigan, D.; Westerhoff, P. Formation, precursors, control, andoccurrence of nitrosamines in drinking water: A review. Water Res. 2013, 47, 4433–4450. [CrossRef]
Separations 2020, 7, 3 12 of 12
30. Luo, Q.; Wang, D.; Wang, Z. Occurrences of nitrosamines in chlorinated and chloraminated drinking waterin three representative cities, China. Sci. Total Environ. 2012, 437, 219–225. [CrossRef]
31. Zhou, Q.; McCraven, S.; Garcia, J.; Gasca, M.; Johnson, T.A.; Motzer, W.E. Field evidence of biodegradationof N-Nitrosodimethylamine (NDMA) in groundwater with incidental and active recycled water recharge.Water Res. 2009, 43, 793–805. [CrossRef]
© 2020 by the authors. Licensee MDPI, Basel, Switzerland. This article is an open accessarticle distributed under the terms and conditions of the Creative Commons Attribution(CC BY) license (http://creativecommons.org/licenses/by/4.0/).
![Sensitive Determination of Anticancer Drug Methotrexate ... · chromatography (IC) [19], high performance liquid chromatography (HPLC) [20,21], ... they usually require cumbersome](https://img.pdfslide.net/doc/110x75/5f61c7747a80615db8104052/sensitive-determination-of-anticancer-drug-methotrexate-chromatography-ic.jpg)