Embed Size (px)
Citation preview
Estimated Exposure Risks from Carcinogenic Nitrosamines in UrbanAirborne Particulate MatterNaomi J. Farren,† Noelia Ramírez,‡ James D. Lee,§ Emanuela Finessi,∥ Alastair C. Lewis,§
and Jacqueline F. Hamilton*,†
†Wolfson Atmospheric Chemistry Laboratories, Department of Chemistry, University of York, York YO10 5DD, United Kingdom‡Metabolomics Platform, CIBERDEM, IISPV, University Rovira i Virgili, Sescelades Campus, Tarragona 43007, Spain§National Centre for Atmospheric Science, University of York, York YO10 5DD, United Kingdom∥Ecotoxicology and Models Laboratories, Environment Department, University of York, York YO10 5DD, United Kingdom
*S Supporting Information
ABSTRACT: Organic nitrogen (ON) compounds are present inatmospheric particulate matter (PM), but compared to theirinorganic, hydrocarbon, and oxygenated counterparts, they aredifficult to characterize due to their low concentrations in complexmatrices. Nitrosamines are a class of ON compounds known to behighly carcinogenic and include species formed from nicotinedegradation, but there are no detailed estimates of their abundancein ambient air. We use a highly sensitive analytical method, which iscapable of separating over 700 ON compounds, to determine dailyvariability in nicotine, and 8 nonspecific and 4 tobacco-specificnitrosamines in ambient PM from central London over two periods inwinter and summer. The average total nitrosamine concentration was5.2 ng m−3, substantially exceeding a current public recommendation of 0.3 ng m−3 on a daily basis. The lifetime cancer risk fromnitrosamines in urban PM exceeded the U.S. Environmental Protection Agency guideline of 1 excess cancer case per 1 millionpopulation exposed after 1 h of exposure to observed concentrations per day over the duration of an adult lifetime. A clearrelationship between ambient nitrosamines and total PM2.5 was observed with 1.9 ng m−3 ± 2.6 ng m−3 (total nitrosamine) per10 μg m−3 PM2.5.
■ INTRODUCTION
Particulate matter less than 2.5 μm in diameter, termed PM2.5,lies within the respirable size range for humans and is thereforeconsidered an important air quality standard.1 The depositionof particles upon inhalation is largely dependent on size; ingeneral, smaller particles tend to reach lower parts of therespiratory tract, such as the alveolar region where gas exchangeoccurs. Larger particles, however, are normally trapped in theupper respiratory tract and removed more rapidly.2 As a result,inhalation of PM2.5 has particularly adverse effects on humanhealth, contributing to both lung and heart disease and alsopremature mortality and morbidity, particularly among moresensitive population groups, such as asthmatics, children, andthe elderly.3
Within the respirable and often toxic chemical constituents inPM2.5 exist a range of organic nitrogen (ON) compounds.Atmospheric ON is difficult to characterize due to its variouscomplexities; it spans a wide range of volatilities and polarities,originates from both biogenic and anthropogenic sources, andcan undergo many biological and photochemical trans-formations. Although there are extensive studies and reviewsof atmospheric ON, there is still no full description of itschemical composition.4−7 This may be due to the lack of
comparable studies; many different measurement techniqueshave been used, often targeting different classes of ONcompounds. The environmental implications of ON com-pounds are also important.8,9 Many species are recognized asessential nutrient sources for marine and terrestrial ecosystems,yet little is known about their potential toxicity.10 Overall, it isclear that a better understanding of ON chemical compositionis required.Nitrosamines are a particular class of ON compounds that
have been classified by the International Agency for Researchon Cancer (IARC) as extremely potent human carcinogens11
and have been highlighted in recent studies as environmentalcontaminants of increasing health concern.12−15 Although theterm “nitrosamine” can incorporate an array of N-nitrosocompounds, there is one particular group referred to asnonspecific nitrosamines (N-nitrosamines), which are N-nitroso derivatives of secondary amine precursors.16 They canbe emitted to the atmosphere directly, for example, from
Received: March 31, 2015Revised: June 29, 2015Accepted: July 24, 2015Published: July 24, 2015
Article
pubs.acs.org/est
© 2015 American Chemical Society 9648 DOI: 10.1021/acs.est.5b01620Environ. Sci. Technol. 2015, 49, 9648−9656
This is an open access article published under a Creative Commons Attribution (CC-BY)License, which permits unrestricted use, distribution and reproduction in any medium,provided the author and source are cited.
Dow
nloa
ded
by U
NIV
OF
YO
RK
on
Sept
embe
r 3,
201
5 | h
ttp://
pubs
.acs
.org
P
ublic
atio
n D
ate
(Web
): A
ugus
t 10,
201
5 | d
oi: 1
0.10
21/a
cs.e
st.5
b016
20
tobacco smoke, cooking, or vehicle emissions; alternatively,they are formed in the atmosphere through oxidation ornitrosation reactions of their precursor amines.6 N-Nitros-amines have been determined in food products,17 cosmeticproducts,18 house dust,12 and water,19 as well as in PMsamples.13,14 Nicotine is the most abundant organic compoundemitted during smoking and can react with nitrous acid andother atmospheric oxidants to form a class of special interestnitrosamines, tobacco-specific nitrosamines (TSNAs).20
TSNAs are some of the most commonly occurring carcinogensin tobacco smoke and can induce lung, oral, esophageal, andpancreatic cancer.21 In a previous study, Ramirez et al.15
measured nitrosamines in house dust (which is oftencontaminated with residual smoke gases and particles, knownas third-hand smoke) collected from homes occupied by bothsmokers and nonsmokers, and reported an increased humancancer risk from exposure to nitrosamines. Interestingly, thepresence of N-nitrosamines in nonsmokers’ homes, and its lackof correlation with nicotine, indicated that the main source ofthese compounds was likely to be outdoor ambient airpollution.15
To determine trace level compounds such as nitrosamines incomplex atmospheric matrices, an extraction method offeringhigh recovery and reproducibility coupled with a highly specificand sensitive measurement method is required. Pressurizedliquid extraction (PLE) is suitable for compounds that aresensitive, thermolabile or present in low concentrations. It hasbeen used previously as a suitable technique for atmosphericPM samples, demonstrated by the extraction of contaminantssuch as N-nitrosamines,14 PAHs,22 phthalates, and organo-phosphate esters.23 The use of comprehensive two-dimensional
gas chromatography (GC × GC) as an analytical measurementtechnique provides increased separation power, and offersbetter peak resolution and sensitivity compared to one-dimensional GC.24 GC × GC has been successfully coupledto both time-of-flight MS (TOF/MS) and nitrogen chem-iluminescence detection (NCD) to analyze ON compounds inurban aerosol, the latter technique offering higher sensitivityand selectivity toward ON, and greater ease of calibration.25,26
To extend upon studies which have simply identified thepresence of N-nitrosamines in ambient air,13,14,26 we presentmore extensive time-resolved measurements of both N-nitrosamines and TSNAs in ambient air. Time-resolvedsampling is essential to capture variability in concentration,enabling reasonable estimates of exposure to be calculated. Theaim of this study is to develop a PLE-GC × GC-NCD methodcapable of time-resolved measurement of N-nitrosamines andTSNAs in ambient air PM samples collected during intensiveobservations in London, as part of the 2012 Clean Air forLondon (ClearfLo) campaign. The first comparisons betweenobserved ambient nitrosamine levels and recommendedguidelines have been made, allowing for an exposure assess-ment to be carried out to determine the human cancer riskthrough inhalation of these species.
■ EXPERIMENTAL SECTION
Standards and Solutions. A mixed standard solution of 9N-nitrosamines (EPA 8270/Appendix IX Nitrosamines Mix)containing N-nitrosodimethylamine (NDMA), N-nitrosome-thylethylamine (NMEA), N-nitrosodiethylamine (NDEA), N-nitrosodi-n-propylamine (NDPA), N-nitrosopyrrolidine(NPyr), N-nitrosomorpholine (NMor), N-nitrosopiperidine
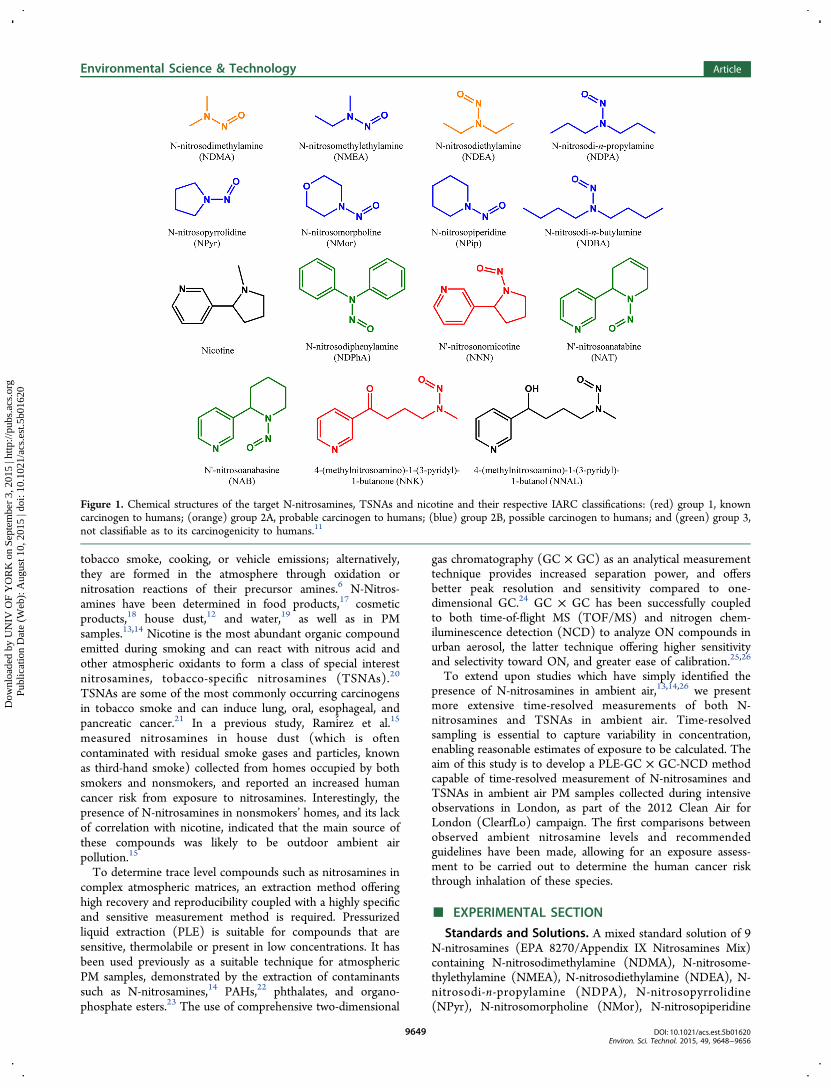
Figure 1. Chemical structures of the target N-nitrosamines, TSNAs and nicotine and their respective IARC classifications: (red) group 1, knowncarcinogen to humans; (orange) group 2A, probable carcinogen to humans; (blue) group 2B, possible carcinogen to humans; and (green) group 3,not classifiable as to its carcinogenicity to humans.11
Environmental Science & Technology Article
DOI: 10.1021/acs.est.5b01620Environ. Sci. Technol. 2015, 49, 9648−9656
9649
Dow
nloa
ded
by U
NIV
OF
YO
RK
on
Sept
embe
r 3,
201
5 | h
ttp://
pubs
.acs
.org
P
ublic
atio
n D
ate
(Web
): A
ugus
t 10,
201
5 | d
oi: 1
0.10
21/a
cs.e
st.5
b016
20
(NPip), N-nitrosodi-n-butylamine (NDBA), and N-nitro-sodiphenylamine (NDPhA) was used (2000 mg L−1 inmethanol). Individual standards of nicotine, N′-nitrosonorni-cotine (NNN), N′-nitrosoanatabine (NAT), N′-nitrosoanaba-sine (NAB), 4-(methylnitrosoamino)-1-(3-pyridyl)-1-butanone(NNK) and 4-(methylnitrosoamino)-1-(3-pyridyl)-1-butanol(NNAL) were also used. All standards were purchased fromSigma-Aldrich, Ltd. (Dorset, U.K.) and had a minimal purity of97% except for NNAL, which was ≥92%. Standard solutionswere prepared in ethyl acetate (GC grade, 99.9% purity) fromVWR International, Ltd. (Leicestershire, U.K.). The chemicalstructures of the target compounds and their respectivecarcinogen classifications set out by the IARC are shown inFigure 1.11
Sample Collection and Preparation. As part of the U.K.Natural Environment Research Council (NERC) fundedClearfLo project, 77 PM2.5 filter samples were collected at theNorth Kensington site (51°31′16″ N, 0°12′48″ W) using aHigh Volume Air Sampler (Ecotech HiVol 3000, Victoria,Australia) operating at 1.13 m3 min−1. 52 samples werecollected during winter 2012 between 10/01/2012 and 08/02/2012 throughout both the daytime (09:00−17:00) and thenighttime (17:00−09:00). The remaining 25 samples collectedin summer 2012 (July 22−August 16, 2012) were changed atmidday and represent 24 h sampling intervals. Further detailsand a map of the site are provided in the SupportingInformation (Figure S1). The PM2.5 quartz filters (20.3 ×25.4 cm) supplied by Whatman (Maidstone, U.K.) wereprebaked at 550 °C for a minimum of 12 h prior to samplecollection. After sample collection, the filters were wrapped inaluminum foil and stored at −18 °C until analysis.Additional Measurements. HONO was measured using a
highly sensitive, long-path absorption photometer (LOPAP)instrument from the University of Wuppertal, Germany.27 Theinstrument was successfully validated against the spectroscopicDOAS technique under urban conditions and in a smogchamber.28 During the campaign, a detection limit of 1 pptV fora time resolution of 5 min, a precision of 1%, and an accuracy of10% was obtained. The PM2.5 filter samples were analyzed forOC and EC using a Sunset thermal-optical carbon analyzer(Sunset Laboratory, Inc.), following the EUSAAR2 thermalprotocol.29 Hourly PM2.5 data, which was measured at theNorth Kensington site using a TEOM-FDMS, was supplied byUK-AIR.30
Pressurized Liquid Extraction. A quarter of each PM2.5sample was extracted using an accelerated solvent extractionsystem (ASE 350, Dionex, Sunnyvale, CA). The base of each 5mL stainless steel extraction cell was lined with two glassmicrofibre filter papers (Fisher Scientific, U.K.) and thenpacked with the sample. Extractions were carried out in ethylacetate (GC grade, 99.9% purity) at 80 °C and 1500 psi forthree consecutive 5 min cycles. A 50% flush volume and 60 spurge time were used. Extracts obtained were held at 0 °Cwhile evaporated under nitrogen to 1 mL and stored at −18 °Cprior to analysis. Recovery and optimization tests wereperformed using a 9 cm2 portion of the collected PM2.5samples, which were heated (300 °C, 1 h) to removesemivolatile compounds and then spiked with a mixednitrosamine standard (100 μL, 50 ppm). The remaining deadvolume in the extraction cell was filled with blank filter paperand extracted under the same conditions previously described.Procedural blanks were carried out, and no detectable amountsof target compounds were found.
Chromatographic Analysis. Chromatographic analysiswas carried out on a GC × GC-NCD system comprised ofan Agilent 7890 gas chromatograph and an Agilent 255 NCDsystem (Palo Alto, CA). The first column was a nonpolar UltraInert DB5 (30 m × 0.32 mm i.d. × 0.25 μm film thickness)from Agilent Technologies, Ltd. (Stockport, U.K.) and thesecond column a midpolarity BPX50 (2 m × 0.10 mm i.d. ×0.10 μm film thickness) from SGE Analytical Science (MiltonKeynes, U.K.). The initial temperature of the first dimensioncolumn was 40 °C for 2 min, followed by a heating rate of 7 °Cmin−1 to 100 °C for 8 min and then further heating at 7 °Cmin−1 until 270 °C was reached and held isothermally for afurther 5 min. A temperature offset of 30 °C was applied to thesecond dimension column throughout the GC temperatureprogram. A liquid nitrogen two-stage cold jet modulationsystem was used, with a modulation period of 5 s and a +15 °Coffset from the primary GC oven temperature. Data wascollected at 200 Hz over the entire course of the analysis, andhydrogen was used as a carrier gas at 1.4 mL min−1. Injectionsof 1 μL were performed in splitless mode at an injectiontemperature of 200 °C using an automated liquid injector(Gerstel, Mulheim an der Ruhr, Germany). Pyrolysis of theanalytes in the NCD was carried out at 900 °C under ahydrogen flow rate of 4 mL min−1 and an oxygen flow rate of10 mL min−1.
Cancer Risk Assessment. The cumulative lifetime cancerrisk associated with exposure to the target nitrosamine specieswas determined according to the Superfund Program’s updatedapproach for the determination of inhalation risk; theconcentration of the target chemical in air (μg m−3) is usedas the exposure metric, rather than the intake of a contaminantin air based on inhalation rate and body weight (mg kg−1
day−1).31
Initially, the exposure concentration (EC), which is a time-weighted average concentration, is calculated for eachindividual contaminant according to eq 1:31
= × × ×EC (CA ET EF ED)/ATi i (1)
where ECi is the EC (μg m−3) specific for each carcinogen; CAiis the target contaminant concentration in air (μg m−3); ET isthe exposure time (hours day−1); EF is the exposure frequency(days year−1); ED is the exposure duration (years); and AT isthe averaging time (lifetime in years × 365 days year−1 × 24 hday−1).The cumulative lifetime cancer risk is then calculated using
eq 2:31
∑= ×=
risk IUR ECi
n
i iinhalation1 (2)
where IURi is the inhalation unit risk specific for eachcarcinogen (μg m−3). The IUR can be defined as the upper-bound excess lifetime cancer risk estimated to result fromcontinuous exposure to an agent at a concentration of 1 μg m−3
in air. IUR values were taken from databases provided by theIntegration Risk Information System (IRIS)32 and the Office ofEnvironmental Health Hazard Assessment (OEHHA);33 prior-ity was given to IRIS values. As toxicological values have onlybeen officially established for NDMA, NDEA, NDPA, NPyr,NMor, NPip, NDBA, NDPhA and NNN, the cumulativecancer risk presented is a sum of the risks from these ninecompounds only.
Environmental Science & Technology Article
DOI: 10.1021/acs.est.5b01620Environ. Sci. Technol. 2015, 49, 9648−9656
9650
Dow
nloa
ded
by U
NIV
OF
YO
RK
on
Sept
embe
r 3,
201
5 | h
ttp://
pubs
.acs
.org
P
ublic
atio
n D
ate
(Web
): A
ugus
t 10,
201
5 | d
oi: 1
0.10
21/a
cs.e
st.5
b016
20
Chemicals sometimes cause cancer by a mutagenic mode ofaction (MOA) and therefore pose a higher risk of cancer tohumans when exposure occurs during early life. In these cases,
age-dependent adjustment factors (ADAFs) can be applied toassess the additional risk.34 Eq 2 is altered to include theADAFs, as shown in eq 3:31
Table 1. Median, Mean, and Maximum Nitrosamine Concentrations in PM2.5 in Winter and Summer
winter summer
compd median (ng m−3) mean (ng m−3) maximum (ng m−3) %Qta median (ng m−3) mean (ng m−3) maximum (ng m−3) %Qt %RSDb
NDMA 0.45 1.36 6.37 83 0.24 0.49 3.54 92 8.6NDEA 0.62 0.89 3.51 96 1.13 2.08 12.33 100 8.7NDPA 0.05 0.07 0.25 42 0.04 0.05 0.18 72 8.3NPyr 0.01 0.08 0.48 39 0.02 0.04 0.24 36 8.3NMor 0.10 0.32 2.27 56 0.13 0.23 1.35 96 11.1NPip 0.03 0.04 0.28 15 0.03 0.05 0.36 40 8.6NDBA 0.15 0.18 0.72 60 0.22 0.33 1.26 100 8.5NDPhA 0.95 1.22 4.08 94 0.34 0.60 2.58 88 9.1NNN 0.12 0.21 0.75 54 0.14 0.20 0.58 96 7.8NAT 0.18 0.31 1.94 58 0.14 0.16 0.91 68 6.8NAB 0.03 0.14 1.21 39 0.06 0.11 0.86 56 7.5NNK 0.41 0.57 2.35 79 0.25 0.29 0.98 100 13.8
aPercentage of samples in which the target species were above the LOQ. bTotal error associated with each compound.
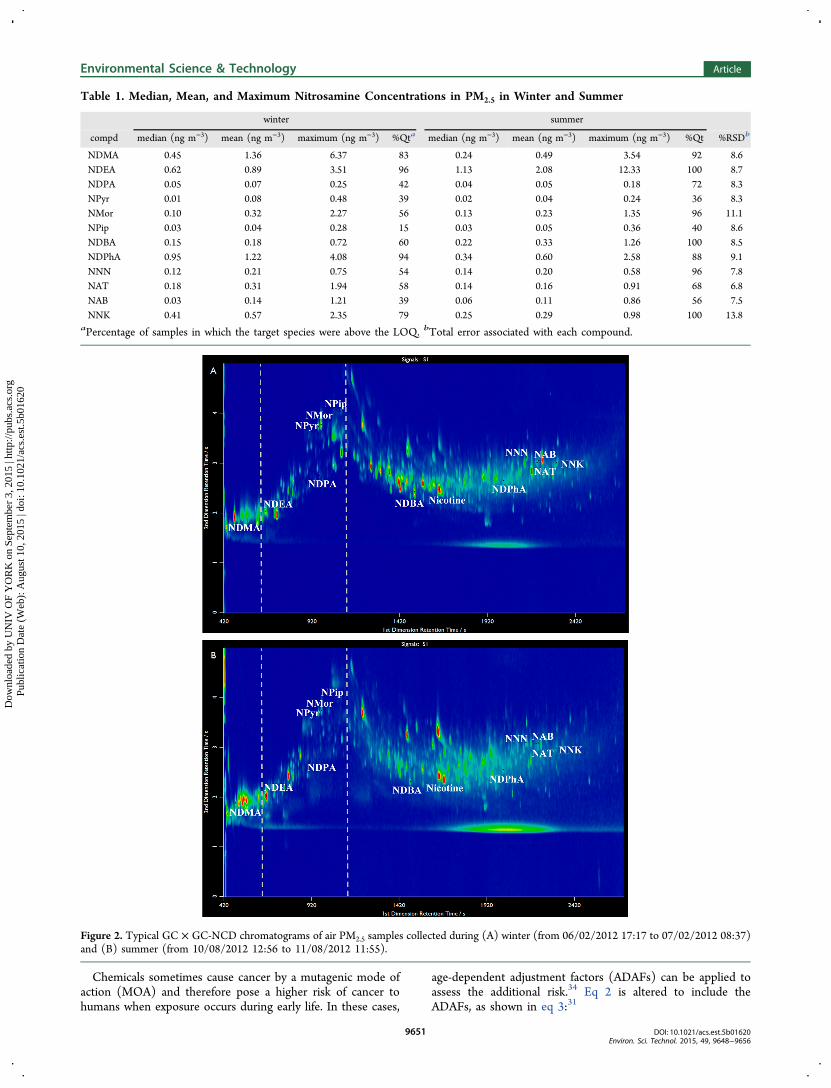
Figure 2. Typical GC × GC-NCD chromatograms of air PM2.5 samples collected during (A) winter (from 06/02/2012 17:17 to 07/02/2012 08:37)and (B) summer (from 10/08/2012 12:56 to 11/08/2012 11:55).
Environmental Science & Technology Article
DOI: 10.1021/acs.est.5b01620Environ. Sci. Technol. 2015, 49, 9648−9656
9651
Dow
nloa
ded
by U
NIV
OF
YO
RK
on
Sept
embe
r 3,
201
5 | h
ttp://
pubs
.acs
.org
P
ublic
atio
n D
ate
(Web
): A
ugus
t 10,
201
5 | d
oi: 1
0.10
21/a
cs.e
st.5
b016
20
∑= × ×=
risk IUR EC ADAFi
n
i i jinhalation1 (3)
where ADAFj is the age-dependent adjustment factor specificfor the age group under consideration.Values for all parameters and chosen age intervals are
recommended by the U.S. EPA and are provided in theSupporting Information, Table S1.35 Nitrosamine concentra-tions below the limits of detection (LODs) and limits ofquantification (LOQs) were replaced with a value equal to halfthe LOD or half the LOQ, respectively, for all risk assessmentcalculations, as recommended by the U.S. EPA.36
Statistical Analyses. Correlations between differentvariables were assessed by performing multiple linear regressionanalyses, using RStudio (Boston, MA).
■ RESULTS AND DISCUSSION
PLE Conditions. In line with previous studies, ethyl acetatewas used as the extraction solvent12,14 and tested at threetemperatures (70, 80, and 100 °C) under the chosen PLEconditions. Recovery levels were low at 70 °C, ranging from 1%for nicotine to 20% for NNN, but were considerably higher atboth 80 and 100 °C, averaging 66 and 62% respectively. Asecond set of recovery tests was performed at 80 °C under thesame PLE conditions, but the extraction vial was stored at −18°C before and after the extraction. Furthermore, the extractswere held at 0 °C (rather than previously at room temperature)during evaporation under nitrogen to a final volume of 1 mL.Recovery levels at 80 °C improved dramatically to an average of91% under the newly modified extraction procedure; recoverylevels and the associated errors are provided in SupportingInformation, Table S2. Evaporating samples to dryness wasavoided as according to previous studies, this can lead toexcessive compounds loss, especially those with low vaporpressures.23
Method Validation. The main instrumental parameters ofthe GC × GC-NCD system were evaluated and are detailed inthe Supporting Information, Table S3. Instrumental LODs andLOQs were calculated according to the EPA protocol 40 CFR136;36 multiplying the standard deviation (10 pg, N = 10) bythe Student t-value (N = 10, 95% confidence interval) gave theLOD, and multiplying the standard deviation by 10 gave theLOQ. The LODs and LOQs obtained ranged from 2.0 to 10.5pg and from 7.2 to 37.2 pg, respectively, with the exception ofNNAL, which exhibited significantly higher levels of detection.It is clear that combining the GC × GC with the elementspecific NCD is a successful way of measuring trace levelnitrogen-containing compounds. Good correlation coefficientvalues (R2) were obtained for the stated linear ranges (0.9697to 0.9999).Instrument repeatability was monitored over the course of
the sample analysis period using a mixed nitrosamine standard(100 pg, N = 19). The precision (%RSD) remained below 13%for all compounds except nicotine and NNAL; this can possiblybe attributed to the lack of equimolar response for these speciesor degradation during pyrolysis. Total errors were estimated bycombining errors associated with the instrument and therecovery process and remained below 14% for all compoundsexcept nicotine and NNAL (Table 1).Analysis of Ambient Particulate Matter in London.
The UK NERC funded ClearfLo project was set up to providelong-term integrated measurements of the meteorology,
composition, and particulate loading of London’s urbanatmosphere at both street level and elevated sites. The PM2.5filter samples were collected as part of the two 5 week intensiveoperation periods (IOPs) in the winter and summer of 2012, atthe Sion Manning School in North Kensington, London(classified as an urban background site).The PLE-GC × GC-NCD method was applied to measure
ambient N-nitrosamine, nicotine, and TSNA concentrations inthe collected PM2.5 samples. To ensure accurate quantificationof all target compounds, we used individual calibration curvesfor each compound. GC × GC-NCD chromatograms areshown in Figure 2 for typical samples in both winter andsummer 2012. The chromatograms show the complexity of ONin London, and more than over 700 compounds were observedin both samples.Peak identification was based on direct comparison of
retention times on both GC × GC columns to those ofindividual standards. The method successfully separated andidentified the majority of the target compounds; an isothermalperiod (highlighted within the gray lines on each chromato-gram) was introduced to the method to separate NPyr andNMor, which caused some loss of the typical structuredchromatograms associated with GC × GC. Although it waspossible to detect NMEA, coelution with other ON compoundsmeant that it was not possible to accurately determine theconcentration. It was also difficult to confirm the concentrationof NNAL because the levels were close to the LOD andprecision was low (RSD = 45%).Nicotine was the most abundant target compound and was
found in all PM2.5 samples in both winter and summer, withaverage concentrations of 21.1 and 6.8 ng m−3, respectively.Nicotine reached a maximum concentration of 118.1 ng m−3 inwinter and 30.6 ng m−3 in summer. Although nicotine itself isnot classified as carcinogenic,11 it can undergo a series ofatmospheric oxidation reactions to form TSNAs, which arecarcinogenic.20 Elevated exposure of the public to nicotine inambient PM is primarily of concern due to the potential forcoinhalation of its more harmful degradation products.The median, mean, and maximum nitrosamine concen-
trations in PM2.5 in winter and summer are shown in Table 1(the frequency of occurrence of each compound is alsoincluded). Of the eight N-nitrosamines measured during thewinter, NDMA and NDPhA had the highest averageconcentrations of 1.36 and 1.22 ng m−3, respectively. Averageconcentrations were slightly lower for NDEA and NMor, butmaximum concentrations reached 3.51 and 2.27 ng m−3,respectively. In summer, the highest average concentration wasseen for NDEA at 2.08 ng m−3, followed by NDPhA at 0.60 ngm−3 and NDMA at 0.49 ng m−3. NNK was the most abundantTSNA measured in both winter (0.58 ng m−3) and summer(0.30 ng m−3). The concentrations of the other three TSNAsaveraged 0.22 and 0.16 ng m−3 in winter and summer,respectively, but the frequency of occurrence of TSNAs washigher in the summer (56−100%) compared to winter (39−79%).
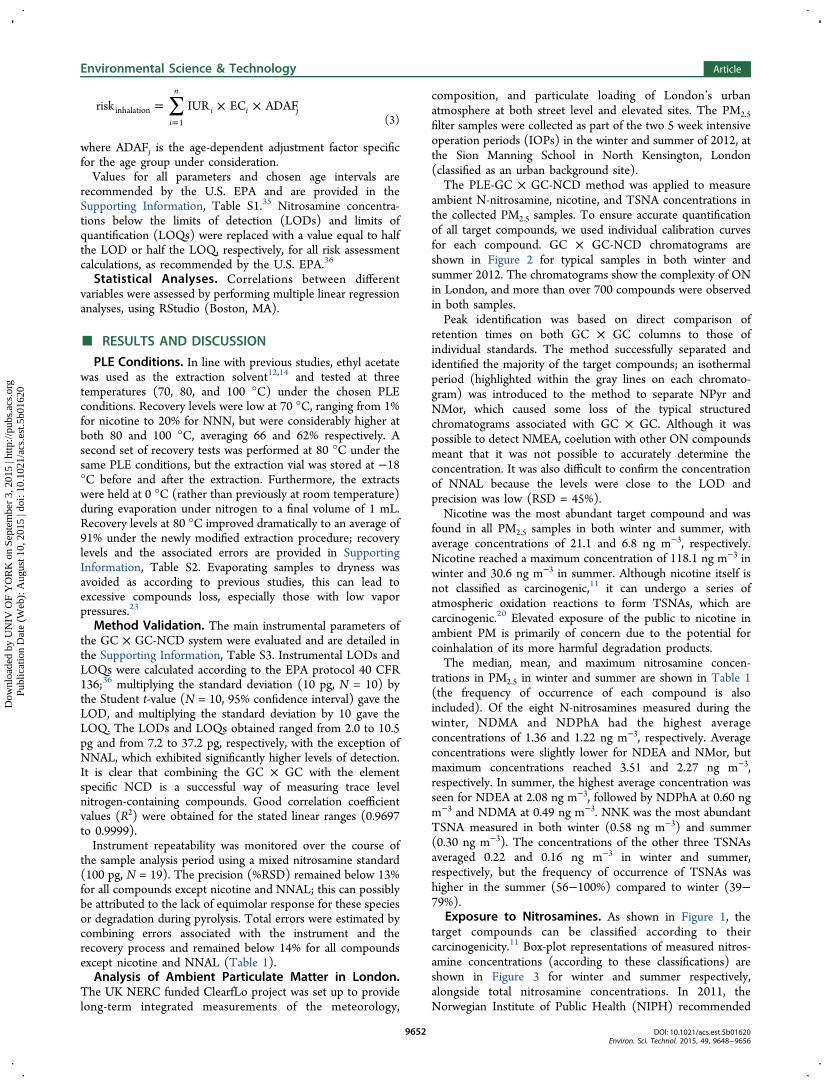
Exposure to Nitrosamines. As shown in Figure 1, thetarget compounds can be classified according to theircarcinogenicity.11 Box-plot representations of measured nitros-amine concentrations (according to these classifications) areshown in Figure 3 for winter and summer respectively,alongside total nitrosamine concentrations. In 2011, theNorwegian Institute of Public Health (NIPH) recommended
Environmental Science & Technology Article
DOI: 10.1021/acs.est.5b01620Environ. Sci. Technol. 2015, 49, 9648−9656
9652
Dow
nloa
ded
by U
NIV
OF
YO
RK
on
Sept
embe
r 3,
201
5 | h
ttp://
pubs
.acs
.org
P
ublic
atio
n D
ate
(Web
): A
ugus
t 10,
201
5 | d
oi: 1
0.10
21/a
cs.e
st.5
b016
20
that the total amount of nitrosamines in ambient air should notexceed 0.3 ng m−3.37
In both seasons, the lowest recorded total nitrosamineconcentration exceeded 0.3 ng m−3, with average totalnitrosamine concentrations of 5.40 and 4.63 ng m−3 for winterand summer, respectively. Furthermore, in both winter andsummer, average nitrosamine concentrations of compounds ineach IARC group classification exceeded 0.3 ng m−3. Of thefour different classifications, group 2A carcinogens wereobserved at the highest levels, with average concentrations of2.24 and 2.57 ng m−3, and maximum concentrations of 9.29and 12.78 ng m−3 in winter and summer, respectively. Thisdirect comparison of measured ambient atmospheric nitros-amine concentrations with recommended air quality guidelinesindicates that the ambient concentrations, at least in London,are currently at levels that are likely to pose a significant long-term cancer risk. We find no obvious reason why Londonwould be an abnormal or unrepresentative urban environmentfor ON in general or nitrosamines specifically.The nitrosamine concentrations observed in London
demonstrate a prima facie case that a cancer risk assessmentof exposure via inhalation is necessary. The World HealthOrganization (WHO) states that inhalation is the onlyconcernable route of exposure when considering the directeffects of atmospheric PM on human health.38 Toxicologicaldata is only available for nine of the target nitrosamines;
therefore, the carcinogenic risk assessed here using IRISguidelines only accounts for these compounds.The original approach used to estimate exposure to inhaled
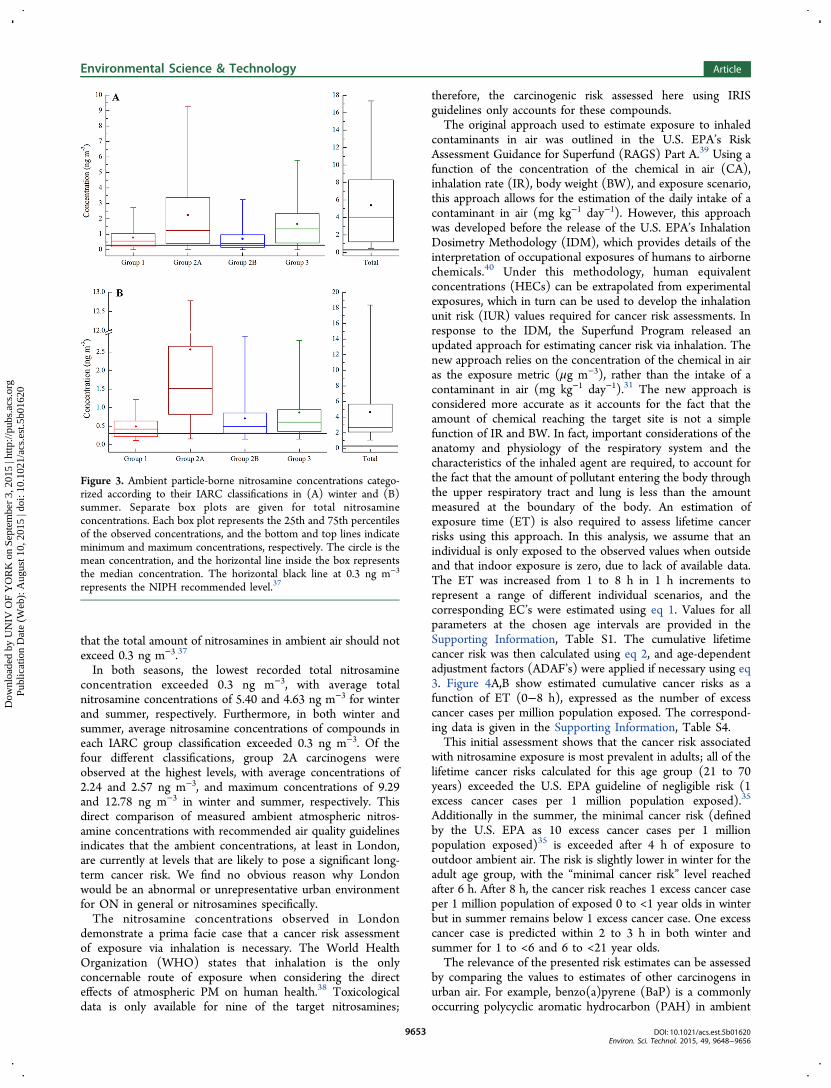
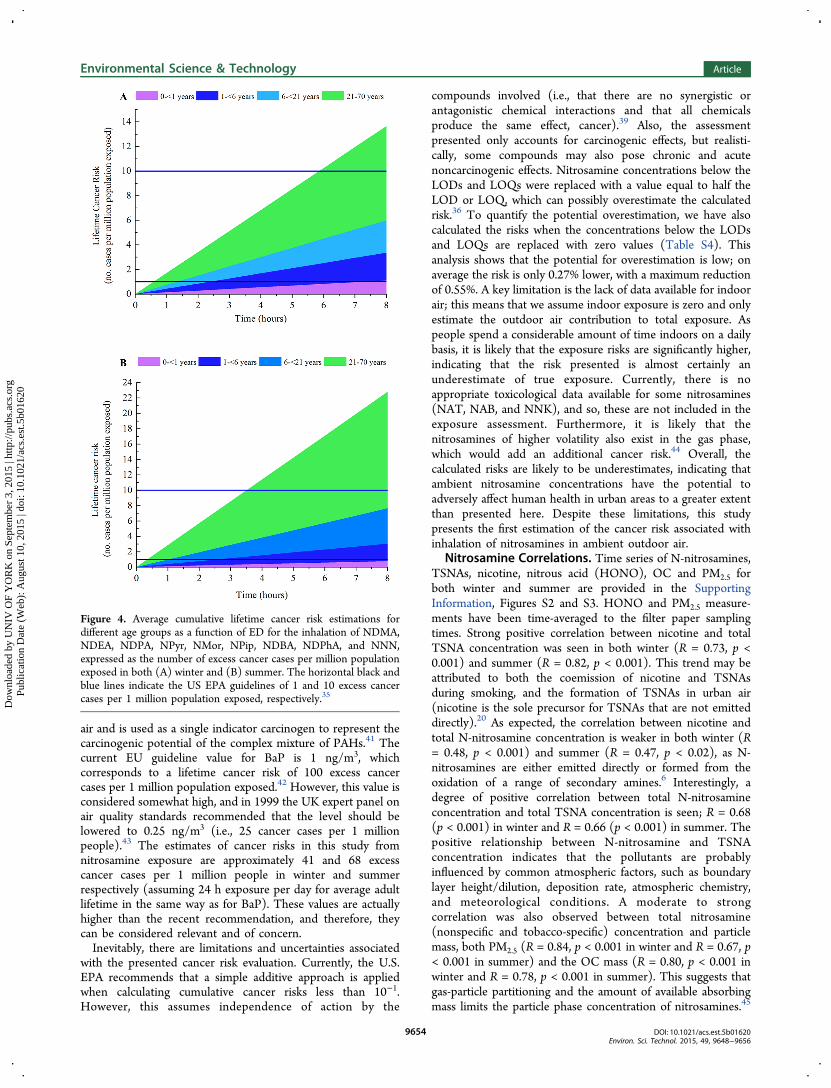
contaminants in air was outlined in the U.S. EPA’s RiskAssessment Guidance for Superfund (RAGS) Part A.39 Using afunction of the concentration of the chemical in air (CA),inhalation rate (IR), body weight (BW), and exposure scenario,this approach allows for the estimation of the daily intake of acontaminant in air (mg kg−1 day−1). However, this approachwas developed before the release of the U.S. EPA’s InhalationDosimetry Methodology (IDM), which provides details of theinterpretation of occupational exposures of humans to airbornechemicals.40 Under this methodology, human equivalentconcentrations (HECs) can be extrapolated from experimentalexposures, which in turn can be used to develop the inhalationunit risk (IUR) values required for cancer risk assessments. Inresponse to the IDM, the Superfund Program released anupdated approach for estimating cancer risk via inhalation. Thenew approach relies on the concentration of the chemical in airas the exposure metric (μg m−3), rather than the intake of acontaminant in air (mg kg−1 day−1).31 The new approach isconsidered more accurate as it accounts for the fact that theamount of chemical reaching the target site is not a simplefunction of IR and BW. In fact, important considerations of theanatomy and physiology of the respiratory system and thecharacteristics of the inhaled agent are required, to account forthe fact that the amount of pollutant entering the body throughthe upper respiratory tract and lung is less than the amountmeasured at the boundary of the body. An estimation ofexposure time (ET) is also required to assess lifetime cancerrisks using this approach. In this analysis, we assume that anindividual is only exposed to the observed values when outsideand that indoor exposure is zero, due to lack of available data.The ET was increased from 1 to 8 h in 1 h increments torepresent a range of different individual scenarios, and thecorresponding EC’s were estimated using eq 1. Values for allparameters at the chosen age intervals are provided in theSupporting Information, Table S1. The cumulative lifetimecancer risk was then calculated using eq 2, and age-dependentadjustment factors (ADAF’s) were applied if necessary using eq3. Figure 4A,B show estimated cumulative cancer risks as afunction of ET (0−8 h), expressed as the number of excesscancer cases per million population exposed. The correspond-ing data is given in the Supporting Information, Table S4.This initial assessment shows that the cancer risk associated
with nitrosamine exposure is most prevalent in adults; all of thelifetime cancer risks calculated for this age group (21 to 70years) exceeded the U.S. EPA guideline of negligible risk (1excess cancer cases per 1 million population exposed).35
Additionally in the summer, the minimal cancer risk (definedby the U.S. EPA as 10 excess cancer cases per 1 millionpopulation exposed)35 is exceeded after 4 h of exposure tooutdoor ambient air. The risk is slightly lower in winter for theadult age group, with the “minimal cancer risk” level reachedafter 6 h. After 8 h, the cancer risk reaches 1 excess cancer caseper 1 million population of exposed 0 to <1 year olds in winterbut in summer remains below 1 excess cancer case. One excesscancer case is predicted within 2 to 3 h in both winter andsummer for 1 to <6 and 6 to <21 year olds.The relevance of the presented risk estimates can be assessed
by comparing the values to estimates of other carcinogens inurban air. For example, benzo(a)pyrene (BaP) is a commonlyoccurring polycyclic aromatic hydrocarbon (PAH) in ambient
Figure 3. Ambient particle-borne nitrosamine concentrations catego-rized according to their IARC classifications in (A) winter and (B)summer. Separate box plots are given for total nitrosamineconcentrations. Each box plot represents the 25th and 75th percentilesof the observed concentrations, and the bottom and top lines indicateminimum and maximum concentrations, respectively. The circle is themean concentration, and the horizontal line inside the box representsthe median concentration. The horizontal black line at 0.3 ng m−3
represents the NIPH recommended level.37
Environmental Science & Technology Article
DOI: 10.1021/acs.est.5b01620Environ. Sci. Technol. 2015, 49, 9648−9656
9653
Dow
nloa
ded
by U
NIV
OF
YO
RK
on
Sept
embe
r 3,
201
5 | h
ttp://
pubs
.acs
.org
P
ublic
atio
n D
ate
(Web
): A
ugus
t 10,
201
5 | d
oi: 1
0.10
21/a
cs.e
st.5
b016
20
air and is used as a single indicator carcinogen to represent thecarcinogenic potential of the complex mixture of PAHs.41 Thecurrent EU guideline value for BaP is 1 ng/m3, whichcorresponds to a lifetime cancer risk of 100 excess cancercases per 1 million population exposed.42 However, this value isconsidered somewhat high, and in 1999 the UK expert panel onair quality standards recommended that the level should belowered to 0.25 ng/m3 (i.e., 25 cancer cases per 1 millionpeople).43 The estimates of cancer risks in this study fromnitrosamine exposure are approximately 41 and 68 excesscancer cases per 1 million people in winter and summerrespectively (assuming 24 h exposure per day for average adultlifetime in the same way as for BaP). These values are actuallyhigher than the recent recommendation, and therefore, theycan be considered relevant and of concern.Inevitably, there are limitations and uncertainties associated
with the presented cancer risk evaluation. Currently, the U.S.EPA recommends that a simple additive approach is appliedwhen calculating cumulative cancer risks less than 10−1.However, this assumes independence of action by the
compounds involved (i.e., that there are no synergistic orantagonistic chemical interactions and that all chemicalsproduce the same effect, cancer).39 Also, the assessmentpresented only accounts for carcinogenic effects, but realisti-cally, some compounds may also pose chronic and acutenoncarcinogenic effects. Nitrosamine concentrations below theLODs and LOQs were replaced with a value equal to half theLOD or LOQ, which can possibly overestimate the calculatedrisk.36 To quantify the potential overestimation, we have alsocalculated the risks when the concentrations below the LODsand LOQs are replaced with zero values (Table S4). Thisanalysis shows that the potential for overestimation is low; onaverage the risk is only 0.27% lower, with a maximum reductionof 0.55%. A key limitation is the lack of data available for indoorair; this means that we assume indoor exposure is zero and onlyestimate the outdoor air contribution to total exposure. Aspeople spend a considerable amount of time indoors on a dailybasis, it is likely that the exposure risks are significantly higher,indicating that the risk presented is almost certainly anunderestimate of true exposure. Currently, there is noappropriate toxicological data available for some nitrosamines(NAT, NAB, and NNK), and so, these are not included in theexposure assessment. Furthermore, it is likely that thenitrosamines of higher volatility also exist in the gas phase,which would add an additional cancer risk.44 Overall, thecalculated risks are likely to be underestimates, indicating thatambient nitrosamine concentrations have the potential toadversely affect human health in urban areas to a greater extentthan presented here. Despite these limitations, this studypresents the first estimation of the cancer risk associated withinhalation of nitrosamines in ambient outdoor air.
Nitrosamine Correlations. Time series of N-nitrosamines,TSNAs, nicotine, nitrous acid (HONO), OC and PM2.5 forboth winter and summer are provided in the SupportingInformation, Figures S2 and S3. HONO and PM2.5 measure-ments have been time-averaged to the filter paper samplingtimes. Strong positive correlation between nicotine and totalTSNA concentration was seen in both winter (R = 0.73, p <0.001) and summer (R = 0.82, p < 0.001). This trend may beattributed to both the coemission of nicotine and TSNAsduring smoking, and the formation of TSNAs in urban air(nicotine is the sole precursor for TSNAs that are not emitteddirectly).20 As expected, the correlation between nicotine andtotal N-nitrosamine concentration is weaker in both winter (R= 0.48, p < 0.001) and summer (R = 0.47, p < 0.02), as N-nitrosamines are either emitted directly or formed from theoxidation of a range of secondary amines.6 Interestingly, adegree of positive correlation between total N-nitrosamineconcentration and total TSNA concentration is seen; R = 0.68(p < 0.001) in winter and R = 0.66 (p < 0.001) in summer. Thepositive relationship between N-nitrosamine and TSNAconcentration indicates that the pollutants are probablyinfluenced by common atmospheric factors, such as boundarylayer height/dilution, deposition rate, atmospheric chemistry,and meteorological conditions. A moderate to strongcorrelation was also observed between total nitrosamine(nonspecific and tobacco-specific) concentration and particlemass, both PM2.5 (R = 0.84, p < 0.001 in winter and R = 0.67, p< 0.001 in summer) and the OC mass (R = 0.80, p < 0.001 inwinter and R = 0.78, p < 0.001 in summer). This suggests thatgas-particle partitioning and the amount of available absorbingmass limits the particle phase concentration of nitrosamines.45
Figure 4. Average cumulative lifetime cancer risk estimations fordifferent age groups as a function of ED for the inhalation of NDMA,NDEA, NDPA, NPyr, NMor, NPip, NDBA, NDPhA, and NNN,expressed as the number of excess cancer cases per million populationexposed in both (A) winter and (B) summer. The horizontal black andblue lines indicate the US EPA guidelines of 1 and 10 excess cancercases per 1 million population exposed, respectively.35
Environmental Science & Technology Article
DOI: 10.1021/acs.est.5b01620Environ. Sci. Technol. 2015, 49, 9648−9656
9654
Dow
nloa
ded
by U
NIV
OF
YO
RK
on
Sept
embe
r 3,
201
5 | h
ttp://
pubs
.acs
.org
P
ublic
atio
n D
ate
(Web
): A
ugus
t 10,
201
5 | d
oi: 1
0.10
21/a
cs.e
st.5
b016
20
Scatter plots of these correlations can be found in theSupporting Information, Figures S4 and S5.The time series show that the temporal variation of HONO
is similar to the nitrosamine observations. Correlations betweenHONO and N-nitrosamine concentrations were observed inwinter (R = 0.62, p < 0.001) and summer (R = 0.74, p < 0.001).Stronger positive correlation was found between HONO andTSNA concentrations; R = 0.88 (p < 0.001) in winter and R =0.79 (p < 0.001) in summer; it is possible that this correlationarises from the fact that HONO is thought to be a keyatmospheric oxidant for nitrosamine formation.20
The observed correlations may be useful in predictingnitrosamine levels and the resulting exposure to human health.The relatively strong correlation to PM2.5 in winter, a pollutantwhich is continually monitored at various urban sites in Londonand indeed very many other cities around the world, couldallow for nitrosamine levels to be estimated at other urbanlocations over different periods of time. Where directmeasurements of nitrosamines are not available, a value of1.88 ± 2.60 ng m−3 (total nitrosamine) per 10 μg m−3 PM2.5 isrecommended for estimates of exposure.
■ ASSOCIATED CONTENT*S Supporting InformationThe Supporting Information is available free of charge on theACS Publications website at DOI: 10.1021/acs.est.5b01620.
Details of the ClearfLo project and sampling site;location of the North Kensington site; parameters usedfor the cancer risk assessment; recovery levels under thefinal PLE conditions; instrumental parameters for theGC × GC-NCD system; cancer risk estimations; timeseries of N-nitrosamines, TSNAs and nicotine; timeseries of HONO, OC and PM2.5; correlations for winter2012 measurements; correlations for summer 2012measurements (PDF)
■ AUTHOR INFORMATIONCorresponding Author*Phone: 44 (0)1904 324076. E-mail: [email protected].
NotesThe authors declare no competing financial interest.
■ ACKNOWLEDGMENTSThe financial support of the U.K. Natural EnvironmentResearch Council (N. Farren, PhD studentship NE/L501751/1) is gratefully acknowledged. All authors wouldlike to acknowledge NERC for funding the ClearfLo project,and the efforts of all participants in the field experiment insupporting these measurements. We would like to acknowledgeStephen Belcher for project coordination. The GC × GC-NCDwas developed as part of the Investigation of Organic Nitrogenin Aerosols project, also funded by NERC (NE/F01905X/1).
■ REFERENCES(1) Finlayson-Pitts, B. J.; Pitts, J. N. Chemistry of the Upper and LowerAtmosphere; Academic Press: London, 2000.(2) Phalen, R. F.; Cuddihy, R. G.; Fisher, G. L.; Moss, O. R.;Schlesinger, R. B.; Swift, D. L.; Yeh, H. C. Main Features of theProposed Ncrp Respiratory Tract Model. Radiat Prot Dosim 1991, 38(1−3), 179−184.
(3) Pui, D. Y. H.; Chen, S. C.; Zuo, Z. L. PM2.5 in China:Measurements, sources, visibility and health effects, and mitigation.Particuology 2014, 13, 1−26.(4) Milne, P. J.; Zika, R. G. Amino-Acid Nitrogen in AtmosphericAerosols - Occurrence, Sources and Photochemical Modification. J.Atmos. Chem. 1993, 16 (4), 361−398.(5) Harrison, M. A. J.; Barra, S.; Borghesi, D.; Vione, D.; Arsene, C.;Olariu, R. L. Nitrated phenols in the atmosphere: a review. Atmos.Environ. 2005, 39 (2), 231−248.(6) Ge, X. L.; Wexler, A. S.; Clegg, S. L. Atmospheric amines - Part I.A review. Atmos. Environ. 2011, 45 (3), 524−546.(7) Cape, J. N.; Cornell, S. E.; Jickells, T. D.; Nemitz, E. Organicnitrogen in the atmosphere - Where does it come from? A review ofsources and methods. Atmos. Res. 2011, 102 (1−2), 30−48.(8) Neff, J. C.; Holland, E. A.; Dentener, F. J.; McDowell, W. H.;Russell, K. M. The origin, composition and rates of organic nitrogendeposition: A missing piece of the nitrogen cycle? Biogeochemistry2002, 57 (1), 99−136.(9) Cornell, S. E.; Jickells, T. D.; Cape, J. N.; Rowland, A. P.; Duce,R. A. Organic nitrogen deposition on land and coastal environments: areview of methods and data. Atmos. Environ. 2003, 37 (16), 2173−2191.(10) Seitzinger, S. P.; Sanders, R. W. Atmospheric inputs of dissolvedorganic nitrogen stimulate estuarine bacteria and phytoplankton.Limnol. Oceanogr. 1999, 44 (3), 721−730.(11) IARC (International Agency for Research on Cancer) AgentsClassified by the IARC Monographs; http://monographs.iarc.fr/ENG/Classification/ClassificationsAlphaOrder.pdf (last accessed 15/03/2015).(12) Ramírez, N.; Ozel, M. Z.; Lewis, A. C.; Marce, R. M.; Borrull, F.;Hamilton, J. F. Determination of nicotine and N-nitrosamines in housedust by pressurized liquid extraction and comprehensive gaschromatography-Nitrogen chemiluminiscence detection. J. Chroma-togr. A 2012, 1219, 180−187.(13) Akyuz, M.; Ata, A. Seasonal variations of particle-associatednitrosamines by gas chromatography-mass spectrometry in theatmospheric environment of Zonguldak, Turkey. Environ. Sci. Pollut.Res. 2013, 20 (10), 7398−7412.(14) Aragon, M.; Marce, R. M.; Borrull, F. Determination of N-nitrosamines and nicotine in air particulate matter samples bypressurised liquid extraction and gas chromatography-ion trap tandemmass spectrometry. Talanta 2013, 115, 896−901.(15) Ramírez, N.; Ozel, M. Z.; Lewis, A. C.; Marce, R. M.; Borrull, F.;Hamilton, J. F. Exposure to nitrosamines in thirdhand tobacco smokeincreases cancer risk in non-smokers. Environ. Int. 2014, 71, 139−147.(16) Nitrosamines. In Encyclopedia of Analytical Science, 2nd ed.;Fernandez-Alba, A. R., Aguera, A., Eds. Academic Press: London,2005; pp 197−202.(17) Kocak, D.; Ozel, M. Z.; Gogus, F.; Hamilton, J. F.; Lewis, A. C.Determination of volatile nitrosamines in grilled lamb and vegetablesusing comprehensive gas chromatography - Nitrogen chemilumines-cence detection. Food Chem. 2012, 135 (4), 2215−2220.(18) Schothorst, R. C.; Somers, H. H. J. Determination of N-nitrosodiethanolamine in cosmetic products by LC-MS-MS. Anal.Bioanal. Chem. 2005, 381 (3), 681−685.(19) Grebel, J. E.; Suffet, I. H. M. Nitrogen-phosphorus detectionand nitrogen chemiluminescence detection of volatile nitrosamines inwater matrices: Optimization and performance comparison. J.Chromatogr. A 2007, 1175 (1), 141−144.(20) Sleiman, M.; Gundel, L. A.; Pankow, J. F.; Jacob, P.; Singer, B.C.; Destaillats, H. Formation of carcinogens indoors by surface-mediated reactions of nicotine with nitrous acid, leading to potentialthirdhand smoke hazards. Proc. Natl. Acad. Sci. U. S. A. 2010, 107 (15),6576−6581.(21) Hecht, S. S.; Hoffmann, D. N-Nitroso Compounds andTobacco-Induced Cancers in Man. IARC Sci. Publ. 1991, 105, 54−61.(22) Frenich, A. G.; Ocana, R. M.; Vidal, J. L. M. Determination ofPolycyclic Aromatic Hydrocarbons in Airborne Particulate Matter by
Environmental Science & Technology Article
DOI: 10.1021/acs.est.5b01620Environ. Sci. Technol. 2015, 49, 9648−9656
9655
Dow
nloa
ded
by U
NIV
OF
YO
RK
on
Sept
embe
r 3,
201
5 | h
ttp://
pubs
.acs
.org
P
ublic
atio
n D
ate
(Web
): A
ugus
t 10,
201
5 | d
oi: 1
0.10
21/a
cs.e
st.5
b016
20
Gas Chromatography-Triple Quadrupole Tandem Mass Spectrometry.J. AOAC Int. 2010, 93 (1), 284−294.(23) Aragon, M.; Marce, R. M.; Borrull, F. Determination ofphthalates and organophosphate esters in particulated material fromharbour air samples by pressurised liquid extraction and gaschromatography-mass spectrometry. Talanta 2012, 101, 473−478.(24) Adahchour, M.; Beens, J.; Brinkman, U. A. T. Recentdevelopments in the application of comprehensive two-dimensionalgas chromatography. J. Chromatogr. A 2008, 1186 (1−2), 67−108.(25) Ozel, M. Z.; Ward, M. W.; Hamilton, J. F.; Lewis, A. C.;Raventos-Duran, T.; Harrison, R. M. Analysis of Organic NitrogenCompounds in Urban Aerosol Samples Using GCxGC-TOF/MS.Aerosol Sci. Technol. 2010, 44 (2), 109−116.(26) Ozel, M. Z.; Hamilton, J. F.; Lewis, A. C. New Sensitive andQuantitative Analysis Method for Organic Nitrogen Compounds inUrban Aerosol Samples. Environ. Sci. Technol. 2011, 45 (4), 1497−1505.(27) Heland, J.; Kleffmann, J.; Kurtenbach, R.; Wiesen, P. A newinstrument to measure gaseous nitrous acid (HONO) in theatmosphere. Environ. Sci. Technol. 2001, 35 (15), 3207−3212.(28) Kleffmann, J.; Lorzer, J. C.; Wiesen, P.; Kern, C.; Trick, S.;Volkamer, R.; Rodenas, M.; Wirtz, K. Intercomparison of the DOASand LOPAP techniques for the detection of nitrous acid (HONO).Atmos. Environ. 2006, 40 (20), 3640−3652.(29) Cavalli, F.; Viana, M.; Yttri, K. E.; Genberg, J.; Putaud, J. P.Toward a standardised thermal-optical protocol for measuringatmospheric organic and elemental carbon: the EUSAAR protocol.Atmos. Meas. Tech. 2010, 3 (1), 79−89.(30) Department of Environment Food & Rural Affairs, UK-AIRData Archive; http://uk-air.defra.gov.uk/data/data_selector (lastaccessed 15/03/15).(31) Risk Assessment Guidance for Superfund Vol. 1: Human HealthEvaluation Manual (Part F, Supplemental Guidance for InhalationRisk Assessment); Office of Superfund Remediation and TechnologyInnovation, U.S. Environmental Protection Agency: Washington, D.C.,2009; http://www.epa.gov/oswer/riskassessment/ragsf/pdf/partf_200901_final.pdf (last accessed 10/03/2015).(32) IRIS (Integrated Risk Information System) A−Z List ofSubstances; http://cfpub.epa.gov/ncea/iris/index.cfm?fuseaction=iris.showSubstanceList (last accessed 01/03/2015).(33) OEHHA (California Office of Environmental Health HazardAssessment) Toxicity Criteria Database; http://oehha.ca.gov/risk/ChemicalDB/index.asp (last accessed 01/03/2015).(34) Implementation of the Cancer Guidelines and AccompanyingSupplemental GuidanceScience Policy Council Cancer GuidelinesImplementation Workgroup Communication 1: Application of theMode of Action Framework in Mutagenicity Determinations forCarcinogenicity; U.S. Environmental Protection Agency: Washington,D.C., 2005; http://www.epa.gov/stpc/pdfs/canguid1.pdf (last ac-cessed 15/03/2015).(35) Environmental Protection Agency, U.S., Exposure FactorsHandbook: 2011 ed. National Center for Environmental Assessment:Washington, D.C., 2011. http://www.epa.gov/ncea/efh/pdfs/efh-complete.pdf (last accessed 10/03/2015).(36) Assigning Values to Non-Detected/Non-Quantified PesticideResidues in Human Health Food Exposure Assessments; U.S. Environ-mental Protection Agency: Washington, D.C., 2000; http://www.epa.gov/oppfead1/trac/science/trac3b012.pdf (last accessed 15/03/2015).(37) Health Effects of Amines and Derivatives Associated with CO2
Capture; Division of Environmental Medicine, The NorwegianInstitute of Public Health: Oslo, Norway, 2011; http://www.fhi.no/dokumenter/ca838717be.pdf (last accessed 01/03/2015).(38) WHO Air Quality Guidelines for Europe; WHO RegionalPublications: Copenhagen, Denmark, 2000.(39) Risk Assessment Guidance for Superfund Vol. 1 Human HealthEvaluation Manual (Part A); Office of Emergency and RemedialResponse: Washington, DC, 1989; http://www.epa.gov/oswer/riskassessment/ragsa/pdf/rags_a.pdf (last accessed 10/03/2015).
(40) Methods for Derivation of Inhalation Reference Concentrations andApplication of Inhalation Dosimetry; Office of Research and Develop-ment: Research Triangle Park, NC, 1994; http://cfpub.epa.gov/ncea/cfm/recordisplay.cfm?deid=71993.(41) Review of evidence on health aspects of air pollution - REVIHAAPProject; World Health Organization (WHO): WHO Regional Officefor Europe, Copenhagen, Denmark, 2013; http://www.euro.who.int/__data/assets/pdf_fi le/0004/193108/REVIHAAP-Final-technical-report-final-version.pdf?ua=1.(42) Air quality standards; http://ec.europa.eu/environment/air/quality/standards.htm (last accessed 14th June).(43) Polycyclic Aromatic Hydrocarbons.; http://webarchive.nationalarchives.gov.uk/20060715141954/http:/www.defra.gov.uk/environment/airquality/aqs/poly/index.htm (last accessed 14th June).(44) Mahanama, K. R. R.; Daisey, J. M. Volatile N-nitrosamines inenvironmental tobacco smoke: Sampling, analysis, emission factors,and indoor air exposures. Environ. Sci. Technol. 1996, 30 (5), 1477−1484.(45) Pankow, J. F. An Absorption-Model of the Gas AerosolPartitioning Involved in the Formation of Secondary Organic Aerosol.Atmos. Environ. 1994, 28 (2), 189−193.
Environmental Science & Technology Article
DOI: 10.1021/acs.est.5b01620Environ. Sci. Technol. 2015, 49, 9648−9656
9656
Dow
nloa
ded
by U
NIV
OF
YO
RK
on
Sept
embe
r 3,
201
5 | h
ttp://
pubs
.acs
.org
P
ublic
atio
n D
ate
(Web
): A
ugus
t 10,
201
5 | d
oi: 1
0.10
21/a
cs.e
st.5
b016
20