Embed Size (px)
Citation preview
280 Analytica Chimica Acta, 283 (1993) 280-286 Elsevier Science Publishers B.V., Amsterdam
Determination of organochlorines in sea water: an assessment
Isabel Cruz and David E. Wells
SOAFD Marine Laboratory, P.O. Box 101, Victoria Road, Aberdeen AB9 SDB, Scotland (UK)
Iain L. Marr
Chemistry Department, Universiry of Aberdeen, Old Aberdeen, Scotland (UK)
(Received 16th September 1992; revised manuscript received 11th January 1993)
Multi-matrix multi-determinand methods of analysis are needed when studying the fate and transport of trace organic compounds in the aquatic environment. These methods are cost effective and provide information about the distribution of the determinands within the sample. The current method of this laboratory for the determination of persistent organochlorine contaminants was extended to the analysis of large volumes of sea water (28 1) and suspended particles. The method was validated in each stage of the analysis by a series of experiments using spiked samples, reference materials and replicates. The results showed that the precision for the determination of the organochlorines in the aqueous and particulate fractions were similar, at the sub-nanogram per litre level, whilst the initial extraction from the sample matrix contributed over 80% of the total variance in the analysis.
Keywords: Gas chromatography; Organochlorines; Sea water; Ultra-trace analysis; Waters
Natural waters are ultimately contaminated from inputs from all other compartments of the environment. Effluents are discharged into rivers, lakes and seas, whilst ground waters receive leachates and run off from the land which are contaminated with persistent organic contami- nants. The oceans of the world constitute the main environmental repository of persistent an- thropogenic chemicals 111.
An understanding of the behaviour of pollu- tants in aquatic systems is necessary to assess their distribution, their fate and their ultimate environmental impact. Organochlorine pesticides (OCPs) and chlorobiphenyls (CBS) are generally hydrophobic in nature, having low solubilities in
Correrpc&ence to: I. Cruz, SOAPD Marine Lab., P.O. Box 101, Victoria Road, Aberdeen AB9 8DB Scotland (UK).
water. They tend to associate with organic-rich sedimentary particles and are concentrated in fatty biological tissues.
In the sea water column the organochlorine (OC) contaminants are distributed between the water and the particulate material. In estuaries the bulk of the CBS are associated with the sus- pended solids, this fraction accounting for as much as 80% of the total CBS, on a mass to volume basis [2,3]. However, in open waters the distribution can vary with the change in particu- late loading.
Any assessment of the occurrence and fate of OCs in the marine environment requires a de- tailed understanding of the partitioning and the dynamics of the sorption/desorption processes [4], particularly as sewage sludge or dredge spoil dumped at sea constitute a major source of an- thropogenic contamination.
ooO3-2670/93/$06.00 0 1993 - Elsevier Science Publishers B.V. All rights reserved
I. Cruz et aL /Anal. Chim. Acta 283 (1993) 280-286 281
Reliable analytical methods are required to separate the sea water and particulate fractions and to determine organochlorines at the sub- nanogram per litre level in both fractions.
In this study, the accuracy and precision of an analytical method was investigated, and the source of errors identified.
mm diameter) [6]. This process took lo-15 min, depending on the particle loading. The filtrate was collected in the second container, and the OCs were extracted in pentane (500 ml) with the addition of sulphuric acid (5 M, 20 ml) to assist the extraction of acidic compounds, such as pen- tachlorophenol [7] (PCP). The water and extrac- tion mixture were stirred rapidly with an air- driven stirrer (3000 rpm, 5 mm). After the two phases had separated (15 min), the container was pressurised and the aqueous and organic phases were collected separately. The water was dis- carded, while the extract in pentane was refriger- ated (ST) prior to analysis.
METHODS
Sampk preparation The particulate and aqueous fractions of the
sea water samples were separated with a stainless steel pressurised extraction and filtration system (PEFS) designed and built in this laboratory, and described in detail elsewhere [5,61. In brief, the PEFS system comprises of two containers, (28 1) and a filtration holder (stainless steel) which is suitable for operation under pressure, and pro- vides a closed system in which all separations are carried out.
Water samples were collected in the first con- tainer. The water was filtered by pressurising the system (30-40 psi N2) to force the sample through the glass fibre filter (0.7 pm pore size and 142
The pentane extract was dried with anhydrous sodium sulphate and the solvent volume reduced in a clean air stream, prior to the clean-up and group separation. The filters containing the par- ticulate material were acidified with sulphuric acid (0.2 M, 1.5 ml) and extracted in a soxhlet with hexane-acetone (40 : 60) (100 ml) for 4 h, at a syphon rate of 20 cycles per hour. When the extraction cycle was completed, the water- acetone phase was washed with dilute sulphuric acid (pH 2, 250 ml), and the hexane separated and dried with anhydrous sodium sulphate. The
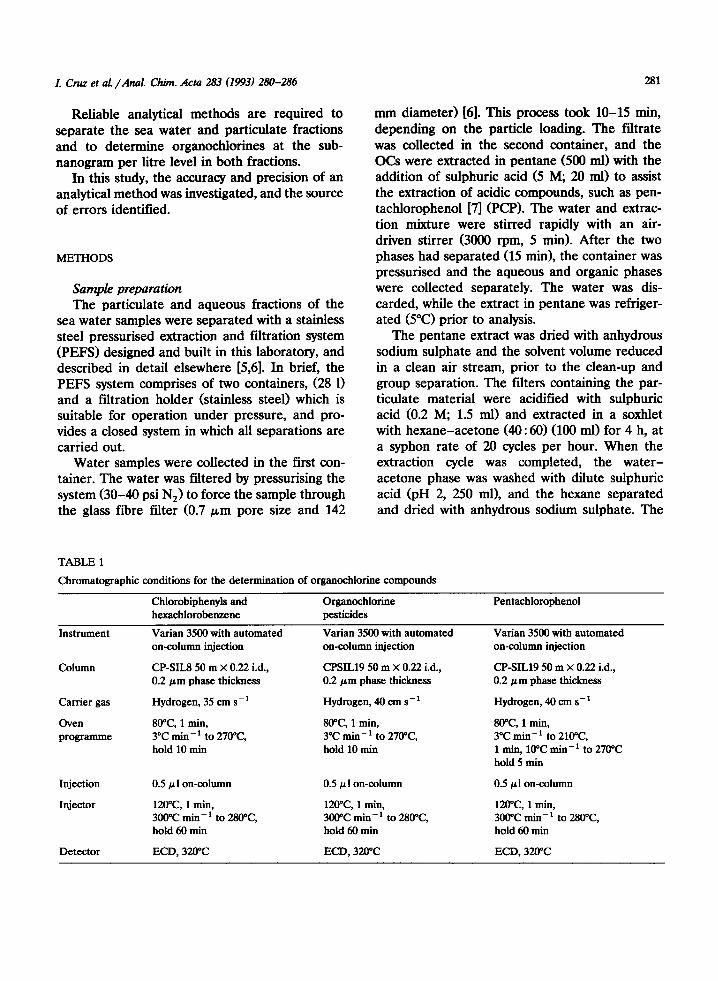
TABLE I
Chromatographic conditions for the determination of organochlorine compounds
Chlorobiphenyls and Organochlorine Pentachlorophenol
Instrument
Column
Carrier gas
Oven programme
hexachlorobenzene
Varian 3500 with automated on-column injection
CP-SK8 50 m X 0.22 i.d., 0.2 pm phase thickness
Hydrogen, 35 cm s-r
8o”C, 1 min, 3°C min - i to 270°C hold 10 min
pesticides
Varian 3500 with automated on-column injection
CPSIL19 50 m x 0.22 i.d., 0.2 pm phase thickness
Hydrogen, 40 cm s-i
80°C 1 min, 3°C min - ’ to 27o”C, hold 10 min
Varian 3500 with automated on-column injection
CP-SIL19 50 m x 0.22 i.d., 0.2 pm phase thickness
Hydrogen, 40 cm s-’
WC, 1 mm, 3°C mitt-’ to 21WC, 1 min, 10°C min-’ to 270°C hold 5 min
Injection
Injector
Detector
0.5 ~1 on-column
12WC, 1 min, 300°C nun - i to 2gO”C, hold 60 min
ECD, 320°C
0.5 ~1 on-column
12O”C, 1 min, 300°C mill-l to ZSOT, hold 60 min
ECD, 324I’C
0.5 ~1 on-column
120°C 1 min, 300°C mm-’ to 280°C hold 60 min
ECD, 320°C

I I
Dedvatise with i-I Mel a TSAOH Flk.thacuon F + t analyse by GC-ECD:
analyse by GC-ECD:
1 Pantachbrophenol 1
1 CBsandHCH 1
Fig. 1. Schematic diagram for the extraction, clean-up, group separation and GC-ECD determination of OCs in sea water and suspended solids.
extracts from the particles were then treated in the same manner as the water extracts.
The clean-up and group separation for CBS, hexachlorobenzene (HCB), hexachlorocyclohex- ane (wHCH and y-HCH), DDT, dieldrin, endrin and PCP are based on the method used in this laboratory [8], and have been extended to include this particular study [5,8]. The outlines of the methodology are presented in Figure 1. Details of instrumental and chromatographic conditions for the final determination are listed in Table 1.
Recovery of OCs from the aqueous fraction Filtered sea water (28 11, was spiked with a
multi-component solution containing a mixture of
I. Gnu et al. /Anal. Chim Acta 283 (1993) 280-286
CBS and pesticides in methanol (20 ml) in the PEFS vessel. The OCs had a range of water solubilities covering four orders of magnitude. The spiked sea water was extracted, and the OCs analysed to determine the recovery of the method.
The experiment was carried out at three con- centration levels: 4-3 ng l-r, 0.6-0.4 ng 1-r and 0.3-0.2 ng 1-r for CBS, HCB, PCP, 2,4-DDE and 4,4-DDE and 1.6-1.4 ng l-‘, 0.3-0.2 ng 1-l and 0.2-0.1 ng 1-l for a-HCH, y-HCH, dieldrin, en- drin, 2,4-DDT and 4,4-DDT.
There were 10 recovery trials in total, three were replicates at the highest and the lowest levels and four at the intermediate level.
The same batch of filtered sea water was also extracted to determine the background concen- trations of the contaminants.
&traction of OCs from the particulate fraction The comparability of the analysis of the sus-
pended particles for OC determination was stud- ied using a contaminated sediment (Laboratory Reference Material, LRM 125 [9]). It was as- sumed that the mechanisms of the extraction matrix effects were comparable. The dried sedi- ment was wetted with dilute sulphuric acid and allowed to equilibrate with the electrolyte for a minimum of 2-4 h to reconstitute the wet sedi- ment and improve the extraction of pen- tachlorophenol [7].
LRM 125 (1 g portions) were analysed using the described method. The mean concentrations and coefficient of variation for the individual organochlorines were calculated, and compared with the results of the on-going quality control in this laboratory which employs soxhlet extraction (dichloromethane) of dry material.
Precision of the aYetermination of OCs by gas chromatography with electron capture detection (GC-ECD)
The variability of the GC-ECD determination was assessed by the repeated analysis of the GC- ECD calibration solutions corresponding to the three fractions [91. This test determined the short-term coefficient of variations associated with the instrumental errors.
I. Cruz et aL /Anal. Chim. Acta 283 (1993) 280-286 283
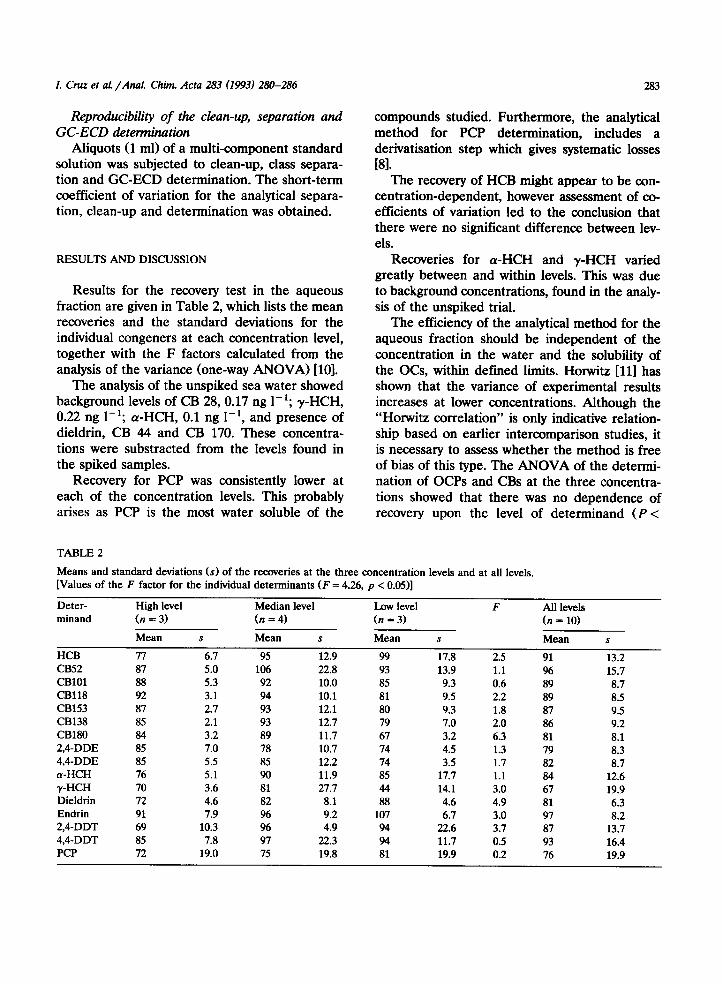
Reproducibdity of the clean-up, separation and GC-ECD akterminution
Aliquots (1 ml) of a multi-component standard solution was subjected to clean-up, class separa- tion and GC-ECD determination. The short-term coefficient of variation for the analytical separa- tion, clean-up and determination was obtained.
RESULTS AND DISCUSSION
Results for the recovery test in the aqueous fraction are given in Table 2, which lists the mean recoveries and the standard deviations for the individual congeners at each concentration level, together with the F factors calculated from the analysis of the variance (one-way ANOVA) [lo].
The analysis of the unspiked sea water showed background levels of CB 28,0.17 ng 1-t; JJ-HCH, 0.22 ng 1-l; a-HCH, 0.1 ng I-‘, and presence of dieldrin, CB 44 and CB 170. These concentra- tions were substracted from the levels found in the spiked samples.
Recovery for PCP was consistently lower at each of the concentration levels. This probably arises as PCP is the most water soluble of the
compounds studied. Furthermore, the analytical method for PCP determination, includes a derivatisation step which gives systematic losses M.
The recovery of HCB might appear to be con- centration-dependent, however assessment of co- efficients of variation led to the conclusion that there were no significant difference between lev- els.
Recoveries for a-HCH and y-HCH varied greatly between and within levels. This was due to background concentrations, found in the analy- sis of the unspiked trial.
The efficiency of the analytical method for the aqueous fraction should be independent of the concentration in the water and the solubility of the OCs, within defined limits. Horwitz [ll] has shown that the variance of experimental results increases at lower concentrations. Although the “Horwitz correlation” is only indicative relation- ship based on earlier intercomparison studies, it is necessary to assess whether the method is free of bias of this type. The ANOVA of the determi- nation of OCPs and CBS at the three concentra- tions showed that there was no dependence of recovery upon the level of determinand (P <
TABLE 2
Means and standard deviations (s) of the recoveries at the three concentration levels and at all levels. [Values of the F factor for the individual determinants (F = 4.26, p < O.OS)]
Deter- minand
HCB
CBS2 CBlOl CB118
CB153 CB138 CB180
2,4-DDE 4,4-DDE a-HCH
y-HCH Dieldrin
Endrin
2,4-DDT 4,4-DDT PCP
High level Median level Low level F All levels (n = 3) (n = 4) (n =3) (n = 10)
Mean s Mean s Mean s Mean s
77 6.7 95 12.9 99 17.8 2.5 91 13.2
87 5.0 106 22.8 93 13.9 1.1 96 15.7
88 5.3 92 10.0 85 9.3 0.6 89 8.7
92 3.1 94 10.1 81 9.5 2.2 89 8.5
87 2.7 93 12.1 80 9.3 1.8 87 9.5
85 2.1 93 12.7 79 7.0 2.0 86 9.2
84 3.2 89 11.7 67 3.2 6.3 81 8.1
85 7.0 78 10.7 74 4.5 1.3 79 8.3
85 5.5 85 12.2 74 3.5 1.7 82 8.7
76 5.1 90 11.9 85 17.7 1.1 84 12.6
70 3.6 81 27.7 44 14.1 3.0 67 19.9
72 4.6 82 8.1 88 4.6 4.9 81 6.3
91 7.9 96 9.2 107 6.7 3.0 97 8.2
69 10.3 96 4.9 94 22.6 3.7 87 13.7
85 7.8 97 22.3 94 11.7 0.5 93 16.4
72 19.0 75 19.8 81 19.9 0.2 76 19.9

284 I. Gnu et al. /Anal. Chim. Acta 283 (1993) 280-286
0.05). The two apparent exceptions were for CB180 (F = 6.3) and dieldrin (F = 4.9). There is no apparent explanation for this except for the small sample size and the relatively low concen- trations. There is no reason to suspect these compounds should selectively have a concentra- tion-recovery dependence over this concentration range (Table 2).
Table 3 compares the results for the wet soxh- let extraction of sediment, in presence of sul- phuric acid, with the results obtained using the standard laboratory method for the determina- tion of OCs in the sediment, LRM 125. The material used for this test was the LRM125 nor- mally analysed as part of the quality control for sediment analysis in this laboratory. The main differences in the magnitude of the coefficients of variation between the two data sets arise because the values for the standard method are derived from a large data set obtained over a period of months by different workers. Taking this into account, the data sets did not appear to be signif- icantly different from each other.
The variance for the GC-ECD determinations should always be kept as low as possible, and
TABLE 3
Means (pg kg-‘) and coefficients of variation for the sedi- ment LRM 125
Deter- Standard method a Wet extraction with minand (dry) WO4
HCB CB28 CB52 CBlOl CB118 CB153 CB138 CB180 y-HCH Dieldrin 2,4-DDE 4,4-DDE 4,4-DDD 4,4-DDT
Mean (n = 10)
2.5 30 51 32 25 38 33 33 5
88 15 12 36 24
Cv (%I
40.8 22.1 28.9 19.0 15.0 18.0 11.7 14.1 38.6 25.6 35.4 21.9 43.0 53.1
Mean (n = 4)
2 34 37 39 29 47 40 38
6 55 13 13 41 27
Cv (%)
10.5 16.6 10.8 9.0 5.8 7.5 3.0 6.1
13.1 11.2 9.6
11.1 8.7 9.0
a Method used in this laboratory using soxhlet extraction with dichloromethane under dry conditions.
TABLE 4
Coefficients of variation associated with the GC-ECD deter- mination (CV& and with the analytical separation, clean-up and GC-ECD determination CC&,)
Determinand
HCB 3.5 7.1 CB52. 3.5 8.3 CBlOl 4.5 4.8 CB118 3.4 4.2 CB153 0.4 4.0 CB138 1.9 2.6 CB180 3.2 3.9 a-HCH 4.5 8.9 y-HCH 4.5 6.7 Dieldrin 2.7 3.8 Endrin 4.9 2,4-DDT 4.3 11.0 4,4-DDD 4.4 6.8 PCP 2.2 3.5
always less than other steps in the method in order to make a valid assessment of the contribu- tion of recovery and sample preparation to the overall method precision (Table 4). A high vari- ance for the final determination would clearly indicate that the instrument was not optimised.
Statistical analysis of the coefjkients of varia- tion
There are three main stages in the analytical method:
(i) the extraction of the sample from the ma- trix,
(ii) the clean-up, compound class separation and, where necessary, derivatisation;
(iii) the determination by CC-ECD. The coefficients of variation (CV%) associated
with each of the three stages were estimated from the experimental results. For these calculations it has been assumed that the CV% were indepen- dent of the concentration for the concentration range tested, and that there was no covariance between the different stages.
Hence the coefficient of variation of the whole method, CV,, was expressed as a function of the coefficients of variation associated with each of the three stages:

I. Gnu et al./Anal. Chim. Acta 283 (1993) 280-286 285
CV, for the aqueous and for the particulate fractions were derived from the mean values in Table 2 (Cv,) water, in Table 3 (Cv,) particles and CViii from Table 4.
The coefficients of variation associated with the second stage was calculated from Table 4.
Finally, CVi which is a measure of the coeffr- cient of variation of the initial extraction plus the matrix effect, was obtained from:
CVf=CV?=CVaz,
The results from these calculations are listed in Tables 5 and 6 for the analyses of the aqueous (AF) and part icu a e rat ion (PF) respectively. 1 t f t
The estimated coefficients of variation showed that the weakest link of the whole method was the initial extraction of the determinands from the sample matrix and accounted for over 80% of the total variance for both the AF and the PF. The coefficients of variation for the whole analy- ses averaged 11% for PF and 14% for AF. The exceptions were PCP in the PF (29%) and y-HCH in the AF (30%).
The high coefficient of variation for the deter- mination of PCP in solid matrices was due, in
TABLE 5
Statistical analysis of the coeffkients of variation associated with each step of the water analysis, extraction (CVi>, clean-up and separation (CVJ and GC-ECD determination (CV,,)
Detenninand CV, (n = 10)
cvi cvii -iii
HCB 14.6 12.8 6.2 3.4 CBS2 16.3 14.0 7.5 3.5 CBlOl 9.8 8.5 1.7 4.5 CB118 9.5 8.5 2.5 3.4 CB153 10.8 10.0 4.0 0.4 CB138 10.7 10.4 1.8 1.9 CB180 10.0 9.2 2.2 3.2 IY-HCH 15.0 12.1 7.7 4.5 y-HCH 29.9 29.1 5.0 4.5 Dieldrin 8.9 8.1 2.7 2.7 Endrin 8.4 6.8 4.9 - 2,4-DDT 15.6 11.1 10.1 4.3 4,4-DDD 17.7 16.3 5.2 4.4 PCP 26.1 25.9 2.7 2.2
TABLE 6
Statistical analysis of the coefficients of variation associated with each step of the solids analysii, extraction CcVi>, clean-up and separation (CVa> and GC-ECD determination (cviii)
Determinand
HCB 10.5 7.7 6.2 3.4 CB52 10.8 7.0 7.5 3.5 CBlOl 9.0 7.7 1.7 4.5 CB118 5.8 4.0 2.5 3.4 CB153 7.5 6.3 4.0 0.4 CB138 3.1 1.6 1.8 1.9 CB180 6.7 5.4 2.2 3.2 y-HCH 18.0 16.7 5.0 4.5 Dieldrin 11.0 10.3 2.7 2.7 4,4-DDD 10.0 7.3 5.2 4.4 PCP 29.0 28.8 2.7 2.2
cvi cv, cvGi
part, to the nature of the solid-PCP chemical adsorptive and ionic interactions within the sam- ple matrix [5]. The chemical interactive forces binding the PCP are partially overcome by the addition of sulphuric acid, but the variability of the recovery suggests that further soaking or soni- cation with acid prior to extraction might be advantageous.
The relatively high values of the coefficients of variation for the determination of y-HCH and PCP of AF are largely due to the relatively high water solubilities of these compounds. A general observation is that the variance of the method increases with increasing water solubilities (Table 2).
Conclusions The method described here is suitable for the
determination of individual OCs in sea water at the sub-nanogram per litre concentration level. The mean recovery of the OCs was 88% (range 67 to 97%) for different compounds with a range of water solubilities covering four orders of mag- nitude, and a range of water concentrations from 0.1 to 4 ng 1-l. Other methods describing sam- pling apparatus for large volumes of water (over 20 11, followed by liquid-liquid extraction of the organochlorines into an organic solvent, quote recoveries below 80% for individual organochlo-
286 I. Gnu et 01. /And. 0th. Acto 283 (1993) 280-286
rines at similar concentrations in sea water [12- 141. Some workers have investigated the effi- ciency of the extraction by comparison with ad- sorption onto resins. It was concluded that liquid-liquid extraction yielded higher concentra- tions for hydrocarbons in sea water than adsorp- tion onto resins [15].
The analytical method for the determination of OCs on particulate material was comparable to that used for the analysis of similar compounds in contaminated sediments. The wet soxhlet method was suitable for further studies on these contami- nants in the sea water column.
Random errors (measured as CV,> for the analysis of the aqueous and particulate fractions were of the same order, giving a consistency for the analytical methods for the determination of these compounds in sea water.
The weakest link in the methodology, for both the aqueous and the particulate fraction, was the initial extraction from the sample matrix, espe- cially for those compounds with higher water solubilities. This must be borne in mind if other determinands are included in the analysis, with different physico-chemical properties from those of the compounds studied here.
We wish to thank the Ministerio de Education y Ciencia of Spain for the financial support, and the colleagues at the Marine Laboratory in par-
ticular Lesley Campbell, Douglas Campbell and Alan Kelly for their support in this work.
REFERENCES
1 S. Tanabe and R. Tatsukawa, in J.S. Waid (Ed.), PCBs and the Environment, CRC Press, Boca Raton, FL, 1986.
2 J.S. Latimer, L.A. Leblanc, J.T. Ellis, J. Zheng and J.G. Quinn, Sci. Total Environ., 97/98 (1990) 155.
3 R. Van Zoest, and G.T.M. van Eck, Neth. J. Sea. Res., 26 (1990) 89.
4 S.W. Karickhoff, J. Hydraul. Eng., 110 (1984) 707. 5 I. Cruz, PhD Thesis, University of Aberdeen 1992. 6 A.G. Kelly, I. Cruz and D.E. Wells, Anal. Chim. Acta, in
press. 7 I. Cruz and D.E. Wells, Int. J. Environ. Anal. Chem., 48
(1992) 1001. 8 D.E. Wells, A.E. Cowan and E.G. Christie, J. Chromatogr.,
328 (1985) 372. 9 D.E. Wells and A.G. Kelly, Mikrochim. Acta., III (19911
23. 10 J.C.Miller and J.N. Miller, Statistical Analysis for Analyti-
cal Chemistry, Ellis Honvood, Cbichester, 1989. 11 W. Horwitz, Anal. Chem., 54 (1982167A. 12 B. Stachel, K. Baetjer, M. Cetinkaga, J. Dueszeln, U. Lahl,
K. Lierse, W. Thieman, B. Gabel, R. Kozicki and A. Podbielski, Anal. Chem., 53 (19811 1469.
13 J.C. Duinker and M.T.J. Hillebrand, in K. Grasshoff, M. Ehrhardt and K. Kremling (Eds.), Methods of Seawater Analysis, VCH, Weinheim, 1983, pp. 290-309.
14 B.G. Oliver and K.D. Nicol, Int. J. Environ. Anal. Chem., 25 (19861275.
15 J.I. Gomez-Belinchon, J.O. Grimalt and J. Albaiges, Envi- ron. Sci. Technol., 22 (1988) 677.