Embed Size (px)
Citation preview
DETERMINATION OF RELATIVE METABOLIZABLE ENERGY VALUES FOR FATS
AND OILS VIA THE SLOPE-RATIO PRECISION-FED ROOSTER ASSAY
BY
MATTHEW PHILLIP AARDSMA
THESIS
Submitted in partial fulfillment of the requirements
for the degree of Master of Science in Animal Sciences
in the Graduate College of the
University of Illinois at Urbana-Champaign, 2015
Urbana, Illinois
Adviser:
Professor Carl M. Parsons
ii
ABSTRACT
Eight experiments were conducted to determine if the precision-fed rooster assay could be
combined with a slope-ratio type assay to generate useful information on the nitrogen-corrected
true metabolizable energy (TMEn) content of fats and oils (lipids) for poultry. In Experiment 1,
refined corn oil (RCO) was fed to both conventional (CONV) and cecectomized (CEC) roosters.
Lipids were fed in ground corn diets to CONV roosters in Experiments 2 through 6. Palomys®,
stearidonic (SDA) soybean (soy) oil, three commercial animal/vegetable (A/V) blends (A/V blend
1, 2 and 3) and corn oil from distillers dried grains with solubles (DDGS) were evaluated.
Experiments 7 and 8 were conducted to compare the measured available energy content of lipids
generated from roosters (slope-ratio precision-fed rooster assay) and young growing broiler chicks
(slope-ratio chick growth assay) to determine if values obtained from the roosters were applicable
for use with broiler chicks. A variety of lipids that were expected to have low, medium, and high
available energy contents were obtained. Lipids tested in each experiment were from the same
batches, and were RCO, a 2:1 blend of stearic acid with RCO (Blend A), a 1:1 blend of stearic acid
with RCO (Blend B), tallow, poultry fat, and DDGS corn oil. In the slope-ratio precision-fed
rooster assays, roosters were tube-fed diets containing graded levels of supplemental lipid that
were included at the expense of a ground corn basal. In the chick growth assay, diets consisted of
graded levels of supplemental lipid added to a corn-soy basal diet at the expense of cellulose.
Chicks were limit-fed from 10 to 20 d of age to ensure equal feed intake among treatment groups
and to maintain energy as the growth-limiting factor. The TMEn of diets or body weight gain of
chicks were regressed on supplemental lipid level or intake using multiple linear regression.
Relative bioavailability values (RBV) for each lipid were calculated as the regression coefficient
of the test lipid divided by the regression coefficient of the reference lipid (refined soy oil or RCO).
iii
The RCO was found to be a suitable reference material for use in the slope-ratio method as TMEn
linearly increased up to 20% RCO inclusion in Experiment 1. Furthermore, there were no
significant differences in TMEn of RCO between CONV and CEC bird types. Based on regression
coefficients, Palomys® was found to have a lower (P < 0.05) RBV than RCO. There were no
significant difference between SDA soy oil and refined soy oil. The RBV of A/V blend 2 was
lower (P < 0.05) than RCO, while the RBV of A/V blend 1 was not significantly different than
RCO. The RBV of DDGS corn oil was higher (P < 0.05) than RCO. The RBV of A/V blend 3 was
lower (P < 0.001) than RCO; however, an interaction (P < 0.01) between lipid type and lipid
supplementation level was observed, indicating that the RBV for A/V blend 3 may underestimate
its available energy at low levels of inclusion. Excellent agreement was obtained for RBV between
Experiments 7 and 8, with rooster and chick values being similar and the ranking of the lipids
being similar for both bird types. Overall, these data indicate that the slope-ratio precision-fed
rooster assay was able to detect and quantify differences in available energy among lipid types,
and yielded values that were similar to those obtained with growing broiler chicks.

iv
Dedicated to Dr. Gerald E. Aardsma
v
ACKNOWLEDGEMENTS
This work is a reflection of the support of many individuals and their investment into my
life and work. I am appreciative of the financial support provided by the College of ACES through
a Jonathan Baldwin Turner Graduate Fellowship. Many thanks to my advisor and committee chair,
Dr. Carl Parsons, for his guidance and mentoring as well as the very memorable fishing trips. I
would like to thank Dr. Ryan Dilger and Dr. Kenneth Koelkebeck for serving on my committee.
Thank you to undergraduate student Sofia Yotis for her reliable help with my chick trials, to Laura
Bauer for her able technical assistance, and to Samuel Rochell for his advice, support, and
statistical expertise. I would also like to acknowledge the Parsons’ lab group and the UIUC Poultry
Research Farm staff for their assistance in conducting my many experiments.
This section would not be complete without a mention of my amazing family. A very
special thanks to my wife, Esther, for her constant encouragement and love, and for believing in
me when the going got tough. Thank you to my two kids, Gerald and Eldora, for breaking up my
long days with smiles and fun. Thank you to my parents, Helen and Gerald Aardsma, who have
modeled a life of integrity and love, and whose advice and encouragement have been critical to
the completion of this degree.
vi
TABLE OF CONTENTS
CHAPTER 1 FATS AND OILS IN POULTRY DIETS: A LITERATURE REVIEW ......... 1
INTRODUCTION ...................................................................................................................... 1
CHEMICAL AND BIOCHEMICAL PROPERTIES OF LIPIDS ............................................. 1
ROLES OF LIPID IN POULTRY NUTRITION ....................................................................... 3
LIPID DIGESTION AND ABSORPTION IN THE CHICKEN ............................................. 13
IMPACTS OF BIRD AGE ON DIGESTION AND ABSORPTION ...................................... 14
LIPID CHARACTERISTICS THAT IMPACT DIGESTION AND ABSORPTION ............. 21
MEASUREMENT OF AVAILABLE ENERGY CONTENT ................................................. 31
THE CHALLENGES OF MEASURING ENERGY CONTENT OF LIPIDS ........................ 38
CONCLUSION ......................................................................................................................... 59
LITERATURE CITED ............................................................................................................. 61
TABLES ................................................................................................................................... 83
CHAPTER 2 DEVELOPMENT OF THE SLOPE-RATIO PRECISION-FED ROOSTER
ASSAY FOR ESTIMATING RELATIVE METABOLIZABLE ENERGY VALUES OF
FATS AND OILS ........................................................................................................................ 84
ABSTRACT .............................................................................................................................. 84
INTRODUCTION .................................................................................................................... 85
MATERIALS AND METHODS .............................................................................................. 86
RESULTS AND DISCUSSION ............................................................................................... 89
LITERATURE CITED ............................................................................................................. 95
TABLES AND FIGURES ........................................................................................................ 99
vii
CHAPTER 3 COMPARISON OF SLOPE-RATIO PRECISION-FED ROOSTER AND
CHICK GROWTH ASSAYS FOR ESTIMATING THE RELATIVE BIOAVAILABLE
ENERGY VALUES OF FATS AND OILS ............................................................................ 107
ABSTRACT ............................................................................................................................ 107
INTRODUCTION .................................................................................................................. 108
MATERIALS AND METHODS ............................................................................................ 109
RESULTS AND DISCUSSION ............................................................................................. 112
LITERATURE CITED ........................................................................................................... 119
TABLES ................................................................................................................................. 123
CHAPTER 4 FUTURE DIRECTIONS AND CONCLUSIONS .......................................... 130
FUTURE DIRECTIONS ........................................................................................................ 130
CONCLUSIONS..................................................................................................................... 130
1
CHAPTER 1
FATS AND OILS IN POULTRY DIETS: A LITERATURE REVIEW
INTRODUCTION
In human nutrition, consumption of substantial amounts of fats and oils (lipids) has been
viewed in a negative light due to health concerns (Gurr, 1997; Phan and Tso, 2001); however,
lipids are an important source of essential fatty acids, fat-soluble vitamins, and energy for poultry.
If all lipids were equally utilized by poultry, this would simplify discerning how much energy a
certain lipid source can provide to poultry; however, this is not the case. Lipids vary in available
energy content and their ability to promote growth and egg production (Whitehead et al., 1993;
Blanch et al., 1995; Zollitsch et al., 1997; Kim et al., 2013). This necessitates methods to reliably
measure how much of a lipid source can be utilized for maintenance or production, versus how
much is excreted unutilized. Many seemingly small factors can influence lipid utilization in
dramatic ways, complicating the generation of useful and repeatable estimates of utilization (Dale
and Fuller, 1982b). As a result, supplemental lipids are some of the most difficult ingredients in
poultry diets to evaluate in terms of energy content (Mateos and Sell, 1981a). This review is
intentionally broad in scope in an attempt to provide the background information needed to
understand the many factors that can complicate or confound efforts to generate and interpret
available energy values for lipids.
CHEMICAL AND BIOCHEMICAL PROPERTIES OF LIPIDS
There are a variety of biologically important molecules that are classified as lipids. These
can be broken down into the main categories of fatty acids, triacylglycerols, sphingolipids,
phosphoacylglycerols, glycolipids, and sterols (Campbell and Farrell, 2012). Of primary
2
importance to poultry nutrition are fatty acids and triacylglycerols, and these two main classes of
lipid will be the focus of this review.
Free fatty acids consist of a carboxyl group and a hydrocarbon chain. The length of the
hydrocarbon chain and the number of double bonds create distinct characteristics that are used to
classify fatty acids. Fatty acids have common names and formal chemical names, and are
frequently described by the number of carbons and double bonds in the molecule (Campbell and
Farrell, 2012). In this review, fatty acids will be referred to by their common names (Table 1.1).
Triglycerides are composed of a glycerol backbone, with fatty acids attached by ester bonds in
three locations, sn-1, sn-2, and sn-3 (Gropper et al., 2009). The types of fatty acids that are attached
to the glycerol molecule have significant implications for the available energy content of a lipid
source (Leeson and Summers, 2001a).
Lipids originating from animal sources generally are more saturated (have fewer double
bonds) than lipids from vegetable sources. This difference is mirrored in the melting point of lipids,
with more saturated lipids having higher melting points (Campbell and Farrell, 2012). Animal fats
generally have lower available energy content than vegetable-based oils, and this may result in
reduced bird performance (Zollitsch et al., 1997). Though melting point has implications for
energy availability in the chicken, this is really just a reflection of fatty acid profile, and energy
differences are due to more complex factors than simply melting point (Duckworth et al., 1950).
In particular, the ratios of unsaturated to saturated (U:S) fatty acids within a lipid source are more
important than simply the presence or absence of saturated fatty acids (Blanch et al., 1995;
Zollitsch et al., 1997).
Lipids, especially phosphoglycerides, are key components of biological membranes such
as cellular plasma membranes and membranes of cellular organelles. These membranes create
3
selectively permeable barriers that are critical to the life of the organism (Campbell and Farrell,
2012). The critical importance of lipids in maintaining the integrity of biological barriers can be
seen in cases of essential fatty acid deficiency (Whitehead, 1984).
Lipids provide concentrated sources of energy (Gurr, 1997). Typical lipids contain about
2.25 times the gross energy as carbohydrates. This can be explained by the higher ratios of carbon
and hydrogen to oxygen contained in lipids than in carbohydrates (Leeson and Summers, 2001b).
Due to this concentrated energy, lipids play an important role as sources of energy to sustain life,
and this energy can be in several forms. Dietary energy is provided when lipids are ingested and
digested to meet the needs of the organism for maintenance, growth, or production (Gropper et al.,
2009). Stored energy is where excess nutrients are stored in the organism as adipose tissue, which
acts as a safeguard against periods of energy restriction (Pethick et al., 1984; Gurr, 1997). Lipids
indirectly sustain life by providing mechanical energy when lipids and their derivatives are used
to power the machinery of the modern world (Bockisch, 1998a). Energy supplied by lipids is
indistinguishable from energy supplied by carbohydrates on a per unit energy basis (Plavnik et al.,
1997), but the increased concentration of energy per unit weight as compared to carbohydrates is
a distinct advantage in many situations.
ROLES OF LIPID IN POULTRY NUTRITION
All species of animals require certain fatty acid(s) in the diet to prevent a wide range of
negative consequences to the health and wellbeing of the organism; these are termed essential fatty
acids (Enser, 1984). Poultry are not able to synthesize the essential fatty acid linoleic acid, but if
provided adequate amounts of linoleic acid are able to synthesize linolenic acid, which is also an
essential fatty acid. Thus, a source of dietary linoleic acid is required (Leeson and Summers,
2001b) and is viewed as the only fatty acid required in the diet of poultry (Whitehead, 1984).
4
Supplemental lipids in the diet, especially those originating from plant sources, are an usually
excellent source of linoleic acid (Whitehead, 1984). The detrimental effects of linoleic deficiency
on growth and performance of poultry have been documented (Miller et al., 1963), with perhaps
the most drastic results seen in terms of reproductive success. Pullets were raised from 0 to 25
weeks of age on a purified diet containing 0.005% linoleic acid and were then fed graded levels of
linoleic acid from week 25 onward. As linoleic acid content of the diet increased, egg production,
egg mass, fertility, and hatchability also increased; however, hatchability was 0% at 0 and 10mg
per hen per day of supplemental linoleic acid intake (Menge et al., 1965).
Early work reporting positive impacts of dietary lipid inclusion on production parameters
that was attributed to energy content may have actually taken place due to increased linoleic acid
content of lipid-supplemented diets (Shutze and Jensen, 1963). Increasing linoleic acid
concentrations above requirements has been linked with benefits such as short-term increases in
egg weight (Balnave, 1987), though it has been debated whether this is a result of linoleic acid per
se, or rather simply increased energy concentration of the diet. There is some evidence that the
response is at least in part due to linoleic acid. Egg weight responded to graded levels of linoleic
acid up to 2.75 g of linoleic acid per bird per day, and changes in egg weight were independent of
energy provided by vegetable oils (Scragg et al., 1987). Also, it was reported that linoleic acid may
be needed at higher levels to maximize egg mass than the requirement for egg production would
indicate (Pérez-Bonilla et al., 2011). Therefore, there may be economic incentives to provide
linoleic acid at higher levels than those required for maximum egg production.
It has been estimated that linoleic acid contents of practical diets may never be low enough
to cause deficiencies (Balnave and Brown, 1968; Balnave, 1969), but this depends on the
composition of the diets being fed, as different cereal grains vary in linoleic acid content
5
(Whitehead, 1984; Leeson and Summers, 2001a). As a result, nearly all poultry diets contain at
least 1% supplemental lipid regardless of economic considerations to ensure the essential fatty
acid requirement has been met (Leeson and Summers, 2001a). The importance of dietary lipid as
a source of the essential linoleic fatty acid is evident.
Supplemental lipids are important sources of fat soluble vitamins, especially A and E (Gurr,
1984), and dietary lipid digestion aids in the absorption of all fat soluble vitamins (Kormann and
Weiser, 1984). The importance of supplemental lipid as an aid to the absorption of fat soluble
vitamins was demonstrated when hens fed crystalline carotene in a very low fat diet had reduced
carotene absorption as compared to hens fed carotene in a diet that contained normal levels of fat
(Russell et al., 1942).
Though supplemental lipid as a source of nutrients such as linoleic acid and fat soluble
vitamins is undeniably important, the main characteristic of lipids that is of interest in commercial
poultry production is that lipids are concentrated sources of energy (Leeson and Summers, 2001b).
The addition of lipids to poultry diets is generally recognized to increase weight gain and improve
feed efficiency for poultry (Fuller and Rendon, 1977). Higher lipid content of feedstuffs has been
significantly correlated with higher metabolizable energy (ME) of the feedstuffs, and as a result,
lipid content of the diet is one of the three components needed to predict growth and feed efficiency
in broilers (Pesti and Smith, 1984). Not all lipids are equal in their ability to promote growth and
improve feed efficiency (Zollitsch et al., 1997), but in general supplemental lipids are viewed as
holding an important role in increasing the efficiency of poultry production.
It has not always been accepted that lipids are a desirable component of poultry diets, as
early work with lipids as an energy source led to mixed results on growth performance. When
chicks were fed soybean (soy) oil in 2% increments from 0 to 22% of the diet at the expense of
6
corn meal, growth depressions were observed for chicks fed soy oil at or greater than 10%
(Henderson and Irwin, 1940). It was concluded that the chick had a maximum tolerance of 10%
soy oil. Similar results were observed by Fraps (1943) that as cottonseed oil was increased at the
expense of corn, growth decreased. Negative effects of tallow inclusion on performance were also
demonstrated (Duckworth et al., 1950). This concept of an intolerance of chicks to dietary lipids
was challenged by the work of Davidson (1956), who found that when the ratio between energy
and crude protein was allowed to increase as vegetable oil was added to a basal diet, chicks fed
vegetable oil had poorer weight gains and feed conversion rates than chicks fed the basal diet with
no vegetable oil. When the ratio between energy and crude protein was held constant as vegetable
oil was added, chicks gained more weight and had better feed conversion rates compared to chicks
that were fed the basal diet with no vegetable oil (Davidson, 1956). This was the first evidence of
the value of lipids for promoting growth and increasing efficiency.
With our current understanding of the amino acid needs of poultry, is clear that what was
being observed by Henderson and Irwin (1940) was not a lack of tolerance for soy oil, but rather
the limiting factor of an amino acid or protein deficiency. The chicks were eating to meet their
energy requirement (Young and Garrett, 1963), and when the energy concentration of the diet was
increased by adding lipids, the chicks ate less feed (Fraps, 1943), and thus had reduced intake of
essential amino acids and reduced growth as a result (Young and Garrett, 1963). This was
demonstrated very clearly when lipid was fed up to 33.8% of the diet to growing chicks without
any negative effects on growth, simply by increasing the protein concentration as lipid was added
(Donaldson et al., 1957). The latter results are supported by the work of Renner and Hill, (1960).
When protein is supplied in sufficient quantities, lipids (in the form of triglycerides) can
7
completely replace carbohydrates without negatively affecting the growth rate of chicks (Renner,
1964).
Supplemental lipids are an important way of increasing the efficiency by which feed is
converted into a product such as meat or eggs (feed efficiency). The main reason for this increased
efficiency is that since lipids contain higher energy concentrations than other components of the
diet (Gurr, 1997), and poultry generally eat to meet their energy requirement (Young and Garrett,
1963; Renner, 1964), diets containing supplemental lipid will have more energy per unit feed
consumed than diets without supplemental lipid. As a result, less feed will have to be consumed
per unit of production (Leeson and Summers, 2001b). This was demonstrated when chicks that
were fed diets containing up to 34% supplemental lipid had significantly improved feed efficiency
as a result of the higher energy density of the lipid containing diets (Donaldson et al., 1957).
Supplemental lipids may also promote increased energy intake due to increased palatability of
diets (Sunde, 1956; Brue and Latshaw, 1985), which decreases the percentage of daily caloric
intake required for maintenance and increases the percentage available for production (Leeson and
Summers, 2001b), but this is generally believed to be of minor importance.
Supplemental lipid has been shown to improve the production performance of laying hens.
Addition of supplemental lipid significantly improves feed efficiency in laying hens (Treat et al.,
1960; Jackson et al., 1969; Horani and Sell, 1977; Sell et al., 1979). Improved egg weight has also
been observed as a result of supplementation of a variety of lipid types (Treat et al., 1960; Jackson
et al., 1969; Keshavarz and Nakajima, 1995), though results are somewhat complicated by possible
effects of supplemental linoleic acid independent of supplemental energy. Increases in egg weight
associated with feeding vegetable oils may simply be a reflection of increases in linoleic acid
content of the diets. The addition of corn oil to hen diets increased egg weight independent of
8
increased energy (Edwards and Morris, 1967), and the conclusion was reached that the corn oil
contained something other than energy that was stimulating egg weight. Further support for this
hypothesis was generated when corn oil, tall oil, safflower oil, methyl linoleate, and 95% pure
linoleic acid provided similar linoleic acid levels in diets fed to laying hens and all yielded similar
improvements in egg weight (Shutze and Jensen, 1963). Also, when corn oil was substituted on an
isocaloric basis for corn starch, there was an increase in egg weight that was not able to be
accounted for by energy alone (Balnave, 1971, 1972). Therefore, work reporting the impacts of
lipids on egg mass may actually be reflecting linoleic acid content of the diets, although this is not
a conclusion accepted by all (Balnave and Brown, 1968).
There is some evidence that egg weight may respond to supplemental vegetable oil
independently of linoleic concentration of the diet (Whitehead, 1981). Hens supplemented with
2% soy oil had greater egg production and egg mass than hens without supplemented soy oil. As
calculated linoleic acid concentration between diets was similar, this seems to be a response to
dietary energy (Shafey et al., 1992). Furthermore, supplemental lipid fed to laying hens
significantly improved egg weight of young hens, but not of older hens, and the effect was
independent of linoleic acid content of the diet (Grobas et al., 1999b). Also, supplemental lipid
throughout one laying cycle increased egg weight independent of linoleic acid content of diets fed
(Grobas et al., 1999a). A possible explanation for this effect was hypothesized when feeding hens
diets containing 5.5% corn oil resulted in a rapid increase in egg weight. This increase in young
hens was accounted for by increases in yolk and albumen weights, and in older hens was only due
to increases in albumen weight (Whitehead et al., 1991). As estrogen is known to regulate protein
synthesis in the oviduct, a possible explanation of the effects of supplemental lipid on egg weight
could involve estrogen.
9
An experiment was conducted to determine if supplemental lipid impacted plasma estrogen
levels in laying hens (Whitehead et al., 1993). Corn oil, tallow, coconut oil, and fish oil were fed
in graded levels, and egg weights and plasma estrogen were measured. Egg weight was found to
increase with supplemental lipid in a quadratic fashion, with an apex around 4% inclusion;
however, not all lipids had equal impacts on egg weight with maximum egg weight attained with
corn oil. Plasma estrogen was found to be highly correlated with egg weight (r = 0.96), thus it was
concluded that some of the impact of supplemental lipid on egg weight may be due to impacts on
estrogen levels, which in turn regulate oviduct protein synthesis (Whitehead et al., 1993).
Supplemental lipid stimulating egg production has also been reported (Oluyemi and Okunuga,
1975; Shafey et al., 1992), although to a much lesser degree than egg weight.
Not all studies demonstrated improvements in production parameters of layers fed diets
containing supplemental lipid. Neither 5 nor 10% supplemental tallow improved production
characteristics of laying hens as measured over an 8 month period (March and Biely, 1963). No
significant impacts of 3% corn oil on egg production or egg weight were observed (Balnave, 1970),
and no effects of 2 to 6% supplemental yellow grease on egg production or egg mass were seen
(Sell et al., 1979).
Supplemental lipid frequently increases feed efficiency of growing broiler chickens (Sell
and Hodgson, 1962; Coon et al., 1981; Golian and Maurice, 1992; Vieira et al., 1997), though not
all lipids have equal effects on feed efficiency. Increases in efficiency are mostly due to increased
energy density of lipid-containing diets (Leeson and Summers, 2001b); however, this effect can
even be seen in some instances of isocaloric diets fed in equal amounts (Griffiths et al., 1977). Soy
oil was identified as improving feed efficiency the most compared to other lipid sources from a
10
statistical review of the literature (Vermeersch and Vanschoubroek, 1968) as well as replicated
research trials (Vanschoubroek et al., 1971).
Supplemental lipid may also increase weight gains of growing broilers (Fuller and Rendon,
1979; Vieira et al., 1997; Barbour et al., 2006), and growing turkeys (Sell and Owings, 1981; Sell
et al., 1986) but the causes of this effect are much more difficult to identify than the causes of
increased feed efficiency. This can be illustrated by an experiment where the addition of 10%
yellow grease at the expense of corn, while maintaining constant energy to protein ratios, resulted
in increased body weight over chicks without supplemental fat (Donaldson, 1962). Theoretically,
the chicks should have gained similar amounts of weight, as the diets only differed in the
concentration of energy per unit of feed, and the chicks should have eaten to meet their energy
requirement (Young and Garrett, 1963; Renner, 1964). When isocaloric diets were fed with or
without soy or corn oil in diets that varied in energy concentration due to added sand or cellulose,
improved growth rates of chicks fed soy or corn oil over chicks fed the basal diet were observed
regardless of energy density (Carew et al., 1963). Thus, some aspect of oil inclusion resulted in
improved growth that could not be explained by differences in energy concentrations of the diets.
Carew et al. (1963) postulated that the differences observed may have been due to increased
palatability as birds fed diets containing supplemental fat had increased intake of ME despite
similar energy density between dietary treatments. This hypothesis remains as one of the ways that
supplemental lipid increases body weight gain, with birds fed supplemental lipid having increased
energy and nutrient intake (Fuller and Rendon, 1977; Golian and Maurice, 1992).
Improved growth may also be a result of less energy lost as heat for broilers fed diets
containing supplemental lipid (extra caloric effect), or increased digestibility on the non-
supplemental portions of the diet when in the presence of supplemental lipid. The latter is known
11
as the extra metabolic effect (EME) of lipid. It is certainly evident that lipids are able to be
converted into retained energy in the body with a higher degree of efficiency than carbohydrates
or protein, believed to be mostly due to the lower heat increment of lipids (De Groote et al., 1971;
Farrell, 1978; Fuller and Rendon, 1979). It is also the case that the EME has been demonstrated
repeatedly, and is due in part to decreases in rate of passage when lipid is supplemented (Mateos
and Sell, 1981c; Mateos et al., 1982). Evidence to support the theory that improved growth may
be due to factors other than increased palatability was demonstrated when broilers were fed equal
amounts of isocaloric diets that contained supplemental corn oil or poultry fat at 0, 3, 6 or 9%.
Both corn oil and poultry fat significantly increased body weight gain as compared to the 0% levels
(Griffiths et al., 1977). Thus, the factor of palatability was removed due to equalizing intakes,
leaving the possibility of extra caloric effects, EME, or an unidentified factor as the cause. The
extra caloric and EME will be discussed in further detail later in this review.
Whether the growth stimulating effects of supplemental lipid are due to increased
palatability of diets, extra caloric effects, EME, or unidentified factors can be debated (Lipstein
and Bornstein, 1975), but it is clear that supplemental lipid can provide a stimulatory effect on
growth rate. Likewise, the origin of the stimulatory effect of supplemental lipid on egg weight can
be argued, but it is clear that supplementation can be beneficial.
There does seem to be evidence that lipids may play a role in increasing diet palatability.
When chicks were simultaneously offered corn and soy meal-based diets with and without added
lipid (unreported inclusion rates and lipid types), chicks preferentially ate twice as much of the
feed that contained added lipid than the feed without added lipid (Sunde, 1956). There is also
evidence that lipid supplementation may impact voluntary feed consumption independent of
energy density. When hens were switched from a medium-energy diet to a high-energy lipid-
12
supplemented diet, hens did not reduce their feed intake for about two weeks. When hens that had
been fed the high-energy fat-supplemented diet for several weeks were offered a low-energy
cellulose-containing diet, there was a drastic decline in feed intake that took several days to
overcome (Cherry, 1982). Feeding poultry fat, tallow, or a hydrolyzed animal/vegetable (A/V)
blend versus a low-fat basal diet did not result in decreased feed intake as would be expected if
birds were simply eating to meet their caloric needs, and suggests a palatability effect (Brue and
Latshaw, 1985). Growing broilers consumed more energy when fed diets containing supplemental
poultry fat than when fed diets without supplemental poultry fat (Golian and Maurice, 1992),
indicating a failure to reduce intake of the higher-energy poultry-fat diets, possibly due to increased
palatability. Turkey poults offered diets with supplemental lipid had significantly increased feed
intake from 3 to 11 days of age compared to diets with no supplemental lipid (Turner et al., 1999).
However, another study reported the opposite effect; linseed oil or mutton tallow fed at levels
greater than 6% resulted in decreased feed intake for the first two weeks of a three-week feeding
study which the authors attributed to low palatability of the diets (Duckworth et al., 1950).
Generally, the results of these studies may indicate a preference for diets containing added lipid
driven by palatability, and indicate that increased palatability is one of the roles of supplemental
lipid in poultry diets
Though not always recognized in the past, lipids play important roles in commercial
poultry production. Lipids provide the essential nutrient linoleic acid, aid in the absorption of fat
soluble vitamins, and are a high-concentration energy source. Lipids improve the efficiency of
production of meat or eggs, and can provide a stimulatory effect on egg mass and body weight
gain. Supplemental lipid may also improve feed intake by making diets more palatable, and there
are no significant negative impacts of supplemental lipids on product quality.
13
LIPID DIGESTION AND ABSORPTION IN THE CHICKEN
The mechanisms behind lipid digestion and absorption in birds and mammals have been
the subject of excellent reviews, and much of the information on this subject is now widely
available in condensed formats. The review by Krogdahl (1985) and the texts by Leeson and
Summers (2001b) and Gropper et al. (2009) provided foundational information for this brief
description of lipid digestion and absorption in poultry.
Since the intestine is primarily an aqueous environment, lipids, which are insoluble in
water, require specific molecules and enzymes in order to be digested and absorbed from the
intestine. The transformation of large lipid droplets into emulsions with water may start in the
gizzard; however, the primary site of lipid digestion and absorption is the small intestine. The
formation of emulsions is aided by bile salts, which are released from the gall bladder into the
duodenum and act as surfactants. Formation of emulsions is a crucial step, as pancreatic lipase
requires a water-lipid interface to be effective. Pancreatic lipase is released into the small intestine
from the pancreas along with colipase, a molecule required for optimal lipase activity. Pancreatic
lipase preferentially cleaves the fatty acids esterified to the glycerol molecule at the sn-1 and sn-3
positions, releasing two free fatty acids and a monoglyceride into the intestinal lumen. Insufficient
amounts of pancreatic lipase and bile salts in the very young chicken may limit lipid digestibility.
Short-chain fatty acids and glycerol are directly absorbed while medium-chain fatty acids, long-
chain unsaturated fatty acids, and monoglycerides spontaneously form micelles with the aid of bile
salts. These mixed-composition micelles disperse throughout the intestinal lumen and are able to
integrate saturated fatty acids and other lipid materials that are not able to spontaneously form
micelles. The micelles are then able to penetrate the unstirred water layer and the lipid contents of
the micelle enter the enterocyte, primarily through passive diffusion but possibly with the aid of
14
binding and transport proteins (Iqbal and Hussain, 2009), where they are re-esterified and
packaged into lipoproteins. The bile salts return to the lumen of the intestine, and either repeat the
process, or are absorbed and sent to the liver via the process of entero-hepatic recirculation, or are
excreted in the feces. The lipoproteins are stable enough for transport in the aqueous environment
of the circulatory system, and are transported to the liver via the portal vein. The liver will either
catabolize the lipid material to meet the immediate needs of the bird, or re-direct it to storage via
incorporation into adipose tissue.
IMPACTS OF BIRD AGE ON DIGESTION AND ABSORPTION
Lipid digestion can be impacted by physiological mechanisms and processes within the
bird. This was demonstrated when chicks that were given a three week acclimation period to a diet
containing 20% lard fatty acids had significantly higher apparent lipid digestibility compared to
chicks of the same age who were only given two weeks of acclimation time to the same diet (Young
et al., 1963). It seems likely that the increased acclimation time allowed for increased physiological
adaptation to the diet which permitted greater utilization of the lard fatty acids.
Chicks and turkey poults are not hatched with digestive systems that are fully optimized
for nutrient digestion and absorption (Jin et al., 1998). Thus, the ability of young poultry to utilize
dietary nutrients tends to increase with age, especially over the first several weeks of life (Batal
and Parsons, 2002; Thomas et al., 2008). The utilization of practical diets as measured by nitrogen-
corrected apparent metabolizable energy (AMEn) demonstrated that utilization of the diet changed
drastically during the first 14 days of age, and from 14 days of age onward there were small
increases in AMEn until chicks were about 50 days of age (Zelenka, 1968). The ability of the
newly hatched chick to utilize lipids, especially highly saturated lipids such as tallow, is somewhat
15
compromised in the first week of life, but rapidly increases in the second and third weeks of age
(Polin and Hussein, 1982).
A tallow mixture containing 80% beef tallow and 20% pork fat was not absorbed by
growing chicks to an equal extent as adult hens until the chicks reached 8 weeks of age.
Standardized lipid digestibility at 2 weeks of age was 70%, and increased steadily over time until
8 weeks of age when it reached 82% absorbability. However, corn oil and lard absorbability were
not impacted by bird age and were fairly constant from 2 weeks of age to 8 weeks of age (Renner
and Hill, 1960). Apparent lipid digestibility for corn oil, soy oil, lard, and tallow were not affected
by age when 3 to 4 week old chicks were compared to 7 to 8 week old chicks (Young, 1961).
When linseed oil or mutton tallow were fed to chicks from 14 to 32 days of age, digestibility for
linseed oil was fairly constant over the trial duration; however, digestibility for mutton tallow
increased 11% over the course of the trial (Duckworth et al., 1950). Chicks fed corn oil at 20% of
the diet had increased standardized lipid digestibility at 23 to 26 days of age as compared to 10 to
13 days of age (96 and 78%, respectively) (Carew et al., 1963). Thus, age impacted the available
energy content of some, but not all lipids, further complicating the generation of available energy
values for lipids. Therefore, available energy values determined with younger birds may not be
accurate for older birds, and vice versa (Sibbald and Slinger, 1963).
However, there is a somewhat consistent pattern that emerges from the data. The majority
of studies that reported a significant effect of age on lipid utilization were only for lipids high in
saturated fatty acids. When the standardized lipid digestibility of corn oil, tallow, and lard were
measured in turkeys at 2, 4, and 8 weeks of age, the digestibility of corn oil and lard did not change
significantly, however, the digestibility of tallow changed dramatically, and was 57, 70, and 74%
at 2, 4, and 8 weeks of age, respectively (Whitehead and Fisher, 1975). When standardized fatty
16
acid digestibility was calculated for palmitic, stearic, oleic, and linoleic acids for each of the lipid
types, it became clear that the majority of the improvement in lipid digestibility with age resulted
from improvements in the absorption of palmitic and stearic acid (Whitehead and Fisher, 1975).
Tallow, poultry fat, and an animal fat fed at 7% to adults or chicks at 2 or 6 weeks age demonstrated
increasing standardized lipid digestibility with increasing age, most dramatically for tallow
(Lessire et al., 1982). Apparent lipid digestibility of tallow or an A/V blend fed up to 12% to 0 to
8 week-old growing turkeys increased with age. The differences were primarily associated with
increases in the absorption of stearic and palmitic acids. Intestinal fatty acid binding protein was
markedly increased in older poults, and may help explain the effect of age on lipid absorption (Sell
et al., 1986). Adults were shown to have better apparent fatty acid digestibility of stearic and
palmitic acids as compared to chicks (Wiseman and Lessire, 1987a).
Some studies reported an effect for both saturated and unsaturated lipids, though generally
the effect was largest for the saturated lipids. Standardized lipid digestibility was measured for
corn oil and tallow in chicks from 2 to 7 and 8 to 15 days of age and was found to increase with
age for both lipids. Digestibility of corn oil increased from 84 to 95%, and digestibility of tallow
increased from 40 to 75% (Carew et al., 1972). Apparent digestibility of corn oil or mixtures of
corn oil with A/V blends increased significantly from 1 to 3 weeks of age in chicks, and was
reflected by significantly lower AMEn and nitrogen-corrected true metabolizable energy (TMEn)
values at 1 week than 3 weeks of age (Laurin et al., 1985). When the effect of age on tallow or
vegetable oil apparent digestibility was measured at 1.5, 3.5, 5.5, and 7.5 weeks of age in broiler
chicks, there was a pronounced improvement between 1.5 and 3.5 weeks, particularly for the
tallow, and a less dramatic improvement between subsequent time points (Wiseman and Salvador,
1989). Adult birds had significantly higher AMEn of a variety of diets containing 4% of either
17
tallow or soy oil than 3 to 4 week old chicks, and this difference was greater than the difference in
AMEn between adults and chicks of diets without supplemental lipid (Bourdillon et al., 1990). An
effect of age was also reported for soy oil (Whitson et al., 1943).
Some studies did not demonstrate an effect of age. There were no clear impacts of bird age
on true metabolizable energy (TME) values of tallow or rapeseed oil when fed at 10% of a diet to
chicks at 24, 38, or 58 days of age, as well as to adult roosters (Sibbald, 1978b). No significant
effect of age was observed when 1, 3, and 10 day old chicks were tube-fed coconut oil, tallow, or
safflower oil (Sulistiyanto et al., 1999). No effect of age was observed for turkey poults from 3 to
11 days of age that were fed a diet containing an A/V blend; however, apparent digestibility was
consistently low for palmitic (53%) and stearic (27%) acids throughout the test period (Turner et
al., 1999).
Age has also been shown to impact the ability of poultry to tolerate and utilize free fatty
acids. In a very methodical study of the effect of free fatty acids, it was shown that apparent lipid
digestibility linearly decreased with increasing free fatty acids, and that this decrease was most
pronounced with younger chicks (1.5 weeks versus 7.5 weeks of age). The older birds had
digestibility values that were 28% higher for tallow acid oil, 46% higher for palm acid oil, and 6%
higher for soy acid oil, demonstrating that there may be an interaction between degree of saturation
and free fatty acid content (Wiseman and Salvador, 1991). The presence of a negative interaction
between degree of saturation, free fatty acid content, and level of inclusion in the diet has been
supported, with the most negative effects seen on young birds (Wiseman et al., 1991, 1998).
The impacts of age on lipid utilization seem to be greatest with highly saturated lipids. This
may be due in part to insufficient bile salt production or recycling. Bile is required in sufficient
quantities for optimal absorption of lipids, and is viewed as the limiting factor in lipid digestion
18
by very young chicks (Krogdahl, 1985). Lipids in the intestine cannot form micelles without the
aid of bile salts, and without micelles, lipid absorption is drastically impaired. This was
demonstrated clearly when chickens were fed olive oil before and after their bile ducts were
cannulated so as to eliminate bile reaching the intestine. Before the cannulation, the standardized
lipid digestibility was 97%; after the cannulation it dropped to 41% (Garrett and Young, 1975).
The ability of the cannulated birds to absorb a fraction of the lipid provided may reflect the relative
importance of bile on the uptake of different fatty acid types. Though bile is important, it is not
equally important for the digestion of all fatty acids. Bile is not required at all for the absorption
of short-chain fatty acids (Gropper et al., 2009), and bile salts are more important for the absorption
of long-chain fatty acids than medium-chain fatty acids (Mabayo et al., 1995). Thus, it is to be
expected that the absorption of different fatty acid types will vary with age if bile salts are a limiting
factor.
Evidence for bile salts being a limiting factor has been provided by research on improving
lipid digestibility by supplementing bile salts. Chicks supplemented with 0.2% cholic acid from 2
to 4 weeks of age resulted in small but significant increases in the utilization of corn oil, lard,
tallow, and hydrogenated soy oil (Gomez and Polin, 1974). The increase was greatest for the
hydrogenated soy oil, and averaged across all lipid types equaled a 2.1% increase. The apparent
lipid digestibility for an animal fat blend was significantly improved by bile salt supplementation
in 3 week old chicks, and improvement was maximized at 2.5 g bile salt per kg of diet. These
differences were primarily the results of increased utilization of stearic and palmitic fatty acids
(Kussaibati et al., 1982b). Supplementation of bile salts at 5 g per kg of the diet in young chicks
resulted in slight increases in AMEn and TMEn values for diets containing 15% animal fat
(Kussaibati et al., 1982a). Chicks at 1, 2, or 3 weeks of age fed diets containing 6 or 8% of highly
19
saturated fat sources had improved apparent lipid digestibility when supplemented with 0.04%
sodium taurocholate; however, the impact of the bile salt was most pronounced in the 1 week old
chicks (Polin and Hussein, 1982). Supplementation of lysophosphatidylcholine to diets fed to
young growing broiler chicks containing tallow, poultry fat, or soy oil improved body-weight gain
of broilers during the starter period (Zhang et al., 2011). In contrast, apparent lipid digestibility in
adult hens was not impacted by bile salt supplementation (Gomez and Polin, 1976). Thus, bile
salts were not a limiting factor in the adult hen in contrast to the young chick. These results indicate
clearly that insufficient bile salt production or recycling is a limiting factor of lipid digestibility in
the very young chick.
Efforts to improve lipid digestibility also provide evidence that bile salts are not the only
limiting factor. Chicks were fed tallow at 4 to 7 and 14 to 19 days of age with or without
supplemental bile salts at 0.025 or 0.05%. Without supplemental bile salts, apparent lipid
digestibility of the chicks was 40% at 4 to 7 days of age and 68% at 14 to 19 days of age. With
supplemental bile salts, lipid digestibility increased significantly for both age groups, with lipid
digestibility at 47% for 4 to 7 day old chicks and 78% for 14 to19 days old chicks (Gomez and
Polin, 1976). If bile salts were the only limiting factor in lipid utilization, then it would have been
expected to see the 4 to 7 day old chicks supplemented with bile salts obtain similar lipid digestion
as the 14 to 19 day old un-supplemented chicks. Since that did not occur, there may be another
factor other than bile salts that is limiting lipid absorption of highly saturated lipids by young
chicks.
The increased ability of poultry to utilize lipids as they age is now generally believed to be
due to increasing levels of pancreatic lipase and bile salts (Jin et al., 1998). The importance of
lipase was clearly demonstrated when chickens were fed olive oil before and after their pancreatic
20
ducts were ligated. Before the ligation, the standardized lipid digestibility of olive oil was greater
than 90%, after the ligation it dropped to 7-20% (Garrett and Young, 1975). When free fatty acids
originating from olive oil were fed to birds that had their pancreatic ducts ligated, standardized
lipid digestibility was greater than 60% (Garrett and Young, 1975), indicating that it is the
breakdown of triglycerides into absorbable units that is the key role of pancreatic lipase.
Interestingly, the effect of age has been reported to be less pronounced with the turkey
poult than with the young chick. Some lipid sources varied by age when assayed for AMEn content
in 22 to 24 versus 43 to 45 day old chicks, while the age of turkey poult had no effect on AMEn
(Halloran and Sibbald, 1979). It has been reported that the 1 week old poult has a markedly greater
ability to utilize lipids, especially unsaturated saturated lipids, than the 1 week old chick; however,
these differences disappear by 3 weeks of age (Mossab et al., 2000). It is also interesting that the
effect of age seems to be much less pronounced with pigs than with broiler chickens (Wiseman et
al., 1998). Ducklings are also less impacted by age than chicks. The apparent lipid digestibility of
diets with no supplemental lipid, but with supplemental rice bran, increased with age from 3 to 28
days of age when fed to growing broilers. In the same study, ducklings were better able to utilize
the lipid in the rice bran than chicks at equivalent ages (Martin and Farrell, 1998).
Therefore, the ability of young poultry to utilize lipid generally increases rapidly over the
first few weeks of life, but this effect is most dramatically seen with highly saturated lipids, high
levels of free fatty acids in the diet, and with a combination of both highly saturated lipid and high
levels of free fatty acids in the diet. This effect of age is most likely due to insufficient amounts of
bile salts and pancreatic lipase in very young poultry. The young turkey appears to have an ability
to better utilize lipids at a younger age as compared to chicks, and thus may have the ability to
generate sufficient quantities of bile salts and/or pancreatic lipase at earlier ages.
21
LIPID CHARACTERISTICS THAT IMPACT DIGESTION AND ABSORPTION
Not all fatty acids in a lipid source are utilized equally. This was shown when rats were fed
a diet containing 18% of a 2:1 stearic to oleic acid blend. Fat digestibility averaged 39.9%, and the
fecal lipid contained 82% stearic acid (Mattil and Higgins, 1945). Chicks fed 5% stearic acid in a
basal diet from 0 to 14 days of age over a two week period had 8% fat in their excreta (feces plus
urine), while chicks fed solely the basal diet over the same time frame only had 0.5% fat in their
excreta (Sunde, 1956). This indicates virtually no absorption of stearic acid from the intestine of
the chick. Duckworth et al. (1950) refuted the idea that differences in digestibility of oils (liquid
at room temperature) and fats (solid at room temperature) was due to the ability of the fat to melt
in the intestines, and rather argued that differences in melting point and digestibility between fats
and oils were due to differences in fatty acid profile. This was supported by findings that young
chicks have a limited ability to utilize saturated long-chain fatty acids but not unsaturated long-
chain fatty acids (Zollitsch et al., 1997).
Fatty acid profile
Fatty acid profile has profound effects on the available energy content of lipids, due in part
to the synergistic and antagonistic relationships that different fatty acids display towards each other
that impact total fatty acid absorption from the intestine. Young and Garrett (1963) demonstrated
this when they varied the ratios of the unsaturated fatty acids oleic and linoleic to the ratios of the
saturated fatty acids palmitic and stearic. The absorption of palmitic acid when fed alone was 25%,
but was impacted significantly by as little as a 0.1:1 ratio of oleic acid to palmitic acid, and the
absorbability of palmitic acid reached 80% when the ratio of oleic to stearic acid reached 0.8:1.
Linoleic acid also had a stimulatory effect on the absorption of palmitic acid, but was not nearly
as pronounced as the effects of oleic acid. In contrast, when stearic acid was fed alone its
22
absorbability was 14%; however, when fed in a mixture with palmitic acid, the absorbability of
stearic and palmitic acids dropped to 2 and 12%, respectively. Thus, there was an antagonistic
interaction between stearic and palmitic acid that decreased the absorbability of both fatty acids.
When linoleic and oleic acid were fed in combination with either palmitic or stearic acid, the
increase in the absorption of palmitic or stearic acid appeared to be primarily due to oleic acid
(Young and Garrett, 1963). This demonstrates that there are complex relationships that exist
between the fatty acids. These results differed from the work of Artman (1964) who indicated that
linoleic acid was just as effective as oleic acid at stimulating uptake of palmitic acid, further
demonstrating the complexity of fatty acid interactions.
Due to the complex synergistic and antagonistic interactions among fatty acids, digestion
and absorption of specific fatty acids can be impacted by the profile of surrounding fatty acids. As
a result, the fatty acid profiles of lipid mixtures, as well of complete diets, become important.
When the standardized fatty acid digestibility of corn oil, lard and tallow were measured in
growing turkey poults, the digestibility of palmitic and stearic acids were greatly improved in corn
oil and lard as compared to tallow (Whitehead and Fisher, 1975), indicating that the uptake of
those fatty acids was highly dependent on the fatty acid context in which they are fed. The fatty
acid profile of the complete diet (supplied from supplemental plus non-supplemental lipid) has
been shown to account for about 75% of the variation of AMEn values for lipids (Ketels and De
Groote, 1989), and thus is a major determinant of available energy content of lipids.
Chain length
Long-chain fatty acids have been shown to be superior to medium-chain fatty acids such
as 8:0 in terms of feed efficiency, weight gain, and feed intake. However, long-chain fatty acids
may promote carcasses with higher retained fat (Mabayo et al., 1994), possibly due to differences
23
in metabolism between long-chain and medium-chain fatty acids (Gurr, 1984). Since the majority
of commercially fed lipids in the United States do not contain significant quantities of medium-
chain fatty acids, this does not have much impact on U.S. poultry production. In areas of the world
where palm oil is readily available, this may be more important, as palm oil has high levels of
medium chain fatty acids and is also very highly saturated, making this an undesirable lipid source
(Leeson and Summers, 2001a). However, synthetic sources of medium-chain fatty acids such as
8:0 have been shown to have very high apparent digestibility (>95%) in young turkey poults
(Turner et al., 1999) and may hold potential for use in diets for young poultry.
Free fatty acid content
Most lipid sources predominantly contain triglycerides (Gurr, 1997), but may also contain
varying levels of free fatty acids depending on factors such as inclusion of acidulated soapstocks
which originate from chemical processing of lipids (Howard, 1984). High levels of free fatty acids
are generally viewed as having negative effects on the available energy content of diets and on
bird performance; however, there are many conflicting reports. Generally, studies where chicks
were fed high levels of free fatty acids in the diet reported negative effects on either lipid
digestibility, metabolizable energy (ME), or growth performance. For example, when chicks were
fed soy oil, lard, or tallow as either triglycerides or as triglyceride-derived free fatty acids at 11 to
16% in the diet, there was an average decrease in apparent lipid digestibility of 8% for free fatty
acids compared to triglycerides (Young and Artman, 1961). Similar negative impacts of high free
fatty acid content have been observed (Shannon, 1971; Wiseman et al., 1991; Blanch et al., 1995).
Additionally, though several lipids have been shown to reduce mineral availability for poultry, this
effect was found to be exacerbated with free fatty acids (Whitehead et al., 1971).
24
In contradiction, some studies where high levels of free fatty acids were fed showed no
impacts on available energy or performance characteristics. When chicks were fed 15% of a lipid
or the lipid’s hydrolyzed fatty acids, there were no significant differences in apparent lipid
digestibility between the lipid and the lipid’s fatty acids for soy oil, corn oil, lard, or beef tallow
(Young, 1961). Similar observations have been made (Lewis and Payne, 1963).
Generally, low levels of free fatty acids in the diet have little to no negative effects. Diets
containing 3% free fatty acids of choice white grease origin, and 3 or 6% of greases and tallows
that varied in free fatty acid content from 2.9 to 58.5% did not result in any significant differences
in growth or feed efficiency when fed to chicks from 0 to 10 weeks of age (Siedler et al., 1955).
No impacts on mortality, egg production, egg weight, or feed efficiency were observed when hens
were fed 2.5 or 5% of lipids ranging in FFA content from 14 to 91% (Treat et al., 1960). When
neutralized soapstock was included at 4% of the diet, it resulted in similar growth performance
and feed conversion as compared to broilers fed a commercial A/V feed grade blend (Menge and
Beal, 1973).
Part of the reason that large amounts of free fatty acids can depress lipid utilization may be
explained by the lack of monoglycerides in the diet. During normal digestion, triglycerides are
cleaved by pancreatic lipase at the sn-1 and sn-3 positions, releasing two fatty acids and a
monoglycerol molecule (Gropper et al., 2009). Monoglycerol molecules, especially monoolein
(oleic acid attached to glycerol), have a profound impact on the absorption of saturated fatty acids.
In the absence of bile, monoolein had 2 to 5 times as much impact on palmitic acid uptake as oleic
acid (Garrett and Young, 1975). Given the dramatic impacts that oleic acid has been shown to have
on palmitic acid uptake, (Young and Garrett, 1963), this effect of monoolein is striking. As a result,
when large amounts of free fatty acids are fed, the uptake of saturated fatty acids may be
25
compromised by lack of monoglycerides. It has also been shown that apparent lipid digestibility
linearly decreased with increasing free fatty acids, and the effect was exacerbated in the presence
of increasing saturation (Wiseman and Salvador, 1991). This was further supported when a variety
of lipids and lipid mixtures varying in saturation and fatty acid content were fed to growing
broilers. The worst performance was observed when supplemental lipid was both highly saturated
and contained high levels of free fatty acids (Zumbado et al., 1999). Furthermore, free fatty acids
from tallow resulted in significantly lower AMEn values as compared to soy or sunflower free
fatty acids (Vilà and Esteve-Garcia, 1996a).
Thus, the impacts of free fatty acids on available energy and bird performance are complex
and affected by a number of factors. Possibly uppermost is the saturated fatty acid content of the
lipid and the presence of sufficient quantities of triglycerides. When free fatty acids were increased
while the degree of saturation of the fat mixture also increased, the apparent lipid digestibility
decreased dramatically (30%). However, when the amount of free fatty acids increased while the
degree of saturation of the fat mixture decreased, the apparent lipid digestibility increased (6%)
(Wiseman et al., 1991). It should be noted that in this study there was always a minimum of 25%
of the supplemental lipid that consisted of a lipid source containing mostly intact triglycerides. In
a 42 day feeding trial with broilers fed diets containing 4, 6, or 8% supplemental lipids that were
selected to be similar in fatty acid profile and U:S ratio but varying widely in free fatty acid content,
there were no significant effects of fatty acid content on body weight gain or feed efficiency
(Waldroup et al., 1995).
Unfortunately, the results are not consistent here either. The inclusion of palmitic or stearic
fatty acids mixed in varying proportions in either a tallow or a sunflower oil resulted in significant
reductions in standardized lipid digestibility of the mixtures. Unlike other studies, there were no
26
significant differences between tallow or sunflower oil mixtures (Vilà and Esteve-Garcia, 1996b)
which, due to differences in saturation level, would have been expected to differentially affect the
uptake of the saturated fatty acids. Inclusion of several types of lipids containing a wide range of
free fatty acid content resulted in highly variable standardized lipid digestibility values, and it was
concluded that free fatty acid content was not a good predictor of available energy (Vilà and
Esteve-Garcia, 1996c).
Though generally worse in younger birds, the detrimental effects of high free fatty acid
content are not limited to young birds. Free fatty acid content had a highly significant impact on
the AMEn and standardized lipid digestibility values of tallows fed to laying hens (Shannon,
1971). As free fatty acid content increased from 0 to 98% of the tallow, there was a linear decrease
in AMEn and standardized lipid digestibility. Additionally, there was a significant interaction
between free fatty acid content and dietary tallow inclusion rate. AMEn and standardized lipid
digestibility decreased more than expected when expected when high levels of tallow containing
high concentrations of free fatty acids were fed. This is likely a reflection of increased saturated
free fatty acid content of the complete diet.
Despite the contradictory results, it can be concluded that bird performance and available
energy can be maximized when lipids or lipid mixtures contain low concentrations of free fatty
acids and saturated fatty acids, and at least moderate levels of intact triglycerides. When sources
containing free fatty acids are available at economically favorable prices, these may be
incorporated into commercial diets reasonably safely if attention is paid to several factors. First,
free fatty acids should be fed along with significant portions of intact triglycerides. Second, the
U:S ratio needs to be controlled. Third, as the concentration of free fatty acids increases in the
27
lipid, the amount of total lipid mixture fed should decrease or be assigned a lower energy value in
formulation.
Degree of saturation
As documented above, chicks have been shown to have reduced utilization of saturated
fats as compared to unsaturated fats (Duckworth et al., 1950; Renner and Hill, 1960). Saturation
can be relatively easily measured by generating iodine values, melting points, or fatty acid profiles.
Animal derived fats are generally more saturated, and thus have lower iodine values, than
vegetable derived oils (Wan, 2000; Azain, 2001). Degree of saturation of a lipid does provide
useful, through somewhat crude (Gunstone, 2008), information about the potential available
energy content of a lipid source. It was demonstrated that as the iodine values for tallow increased
(less saturated), AMEn values also increased (Sibbald et al., 1962). Iodine values were shown to
be correlated with both AMEn and TME, with r = 0.7 to 0.8, but the authors cautioned that the
complexity of lipid utilization by the chicken made iodine values only an approximate estimate of
availability (Halloran and Sibbald, 1979), a conclusion supported by others (Wiseman et al., 1991).
This conclusion is further supported by findings that lipid sources of similar saturation level may
be utilized very differently based on factors such as the arrangement of fatty acids on the glycerol
portion of triglycerides (Sibbald and Kramer, 1977; Smink et al., 2008), which will be discussed
in further detail in a subsequent section of this review.
When many extraneous factors were removed by hydrogenating soy oil and feeding both
hydrogenated and regular soy oil separately and in blends to broiler chicks, body weight gain and
feed efficiency were reduced as the degree of saturation increased (Dvorin et al., 1998). Broiler
performance was generally reduced when highly saturated lipids were fed at 10% of the diet
(Zumbado et al., 1999). Apparent lipid digestibility was significantly affected by saturation level
28
in 7 to 35 day old broiler chicks (Preston et al., 2001). Thus, saturation can have large impacts on
bird performance, but is only one factor of many that determines the available energy from
complex blends of lipids used in modern poultry production (Blanch et al., 1995).
These results are not without contradiction. No significant impacts on broiler performance
were noted when diets were fed differing only in saturation level of supplemental lipid (Sanz et
al., 2000). Also, body weight was improved for broilers receiving animal based fats over those
receiving vegetable based oil (Józefiak et al., 2014).
The ability of poultry to utilize saturated fatty acids is determined at least in part by the
other fatty acids in the diet, while unsaturated fatty acids are utilized independent of the
surrounding fatty acids. The apparent lipid digestibility of saturated fatty acids is markedly altered
by the fatty acid profile of the lipid source, as saturated soy oil fatty acids are much better absorbed
than saturated tallow fatty acids, but unsaturated fatty acids from either source were equally well
utilized (Tancharoenrat et al., 2014). Thus, the presence of saturated fatty acids is not a negative
per se, as utilization of saturated fatty acids can be improved by altering the fatty acid context in
which they are fed.
The utilization of saturated lipids can be enhanced by ensuring adequate amounts of
unsaturated fatty acids relative to saturated fatty acids in the diet. Tallow mixed with various highly
unsaturated oils frequently, but not always, led to a synergistic response as indicated by weight
gain of chicks fed the mixtures being greater than the sum of weight gain of chicks fed the
constituent parts of the mixture (Sibbald et al., 1962). Similar results were obtained when
unsaturated lipids were combined with tallow (Artman, 1964). It was also determined that the fatty
acids contained in the non-lipid ingredients of the diet had a synergistic effect on supplemental
lipid utilization (Fuller and Dale, 1982). With the knowledge that the basal portion of the diet
29
contributes fatty acids of varying saturation, it was determined that the AMEn and standardized
lipid digestibility of lipids was maximized when the U:S ratio in the total diet was slightly greater
than 4. When U:S dropped below 4, the utilization of the lipid decreased in an exponential fashion
(Ketels and De Groote, 1989). This was further supported when the degree of saturation was shown
to have significant effects on AMEn and apparent lipid digestibility when the U:S ratio was not
controlled (Blanch et al., 1995). Thus, saturated fatty acids are best utilized in an environment
consisting predominantly of unsaturated fatty acids.
Position of fatty acid attachment on the glycerol molecule
Available energy differences among lipid samples of very similar fatty acid profile may be
explained in part by differences in the location of fatty acid attachment to the glycerol portion of
triglycerides (Mu and Porsgaard, 2005). Fatty acids can be attached at the sn-1, sn-2, or sn-3
position, and it has been demonstrated that when a higher proportion of highly saturated fatty acids
predominantly occupy the sn-2 position, such as is common in lards, a greater proportion of
saturated fatty acids are absorbed than when unsaturated fatty acids predominantly occupy the sn-
2 position (Sibbald and Kramer, 1977; Smink et al., 2008). This may be explained in part by the
improved absorption of monoglycerides containing saturated fatty acids over that of the saturated
fatty acids alone (Sibbald and Kramer, 1977). The position of fatty acids on the glycerol moiety
have been shown to impact the uptake of lipids in situations where pancreatic lipase is limiting
(Christensen et al., 1995), and thus may have implications for the young chick. However, not all
researchers have been able to demonstrate an effect of fatty acid position on growth or lipid
absorption (Vilarrasa et al., 2014).
30
Quality characteristics
There are a variety of commonly measured characteristics of lipids that are used to estimate
the quality or available energy content of lipids. Among these are moisture, unsaponifiables, and
impurities (which are commonly reported together as MIU values), as well as peroxide values, and
stability values (Wan, 2000; Gunstone, 2008). MIU content is important, as these components
dilute the energy content of the lipid (Leeson and Summers, 2001a). When a variety of quality
factors were correlated with AMEn and standardized lipid digestibility for a number of lipids
varying widely in a quality estimates, MIU was found to be highly correlated, and most of that
correlation was associated with the unsaponifiable component of the lipids tested (Vilà and Esteve-
Garcia, 1996c).
Peroxide values are a measure of how much oxidation (rancidity) has already occurred,
and stability values, often generated using the active oxygen test method (Wan, 2000), indicate
how susceptible the sample is to further oxidation (Gunstone, 2008). Samples indicating a high
potential for further oxidation should be stabilized by the addition of an antioxidant to prevent
oxidation both during storage of the lipid and during storage of mixed feed (Howard, 1984; Wan,
2000). Oxidation of lipids results in reduced available energy content (Howard, 1984) as well as
the generation of unpleasant tastes and odors. Lipid samples with peroxide values above 10 are
deemed unacceptable for human food use (Wan, 2000). Oxidative damage can have large impacts
on the available energy content of lipids, of which unsaturated fatty acids are most susceptible
(Leeson and Summers, 2001a). Lipid samples containing varying amounts of oxidative damage
were assayed for AMEn and apparent lipid digestibility in roosters, and resulting values decreased
with increasing oxidative damage (Squires et al., 1991). Lipids used in the preparation of human
food via practices such as deep frying are particularly susceptible to oxidation due to heat coupled
31
with repeated exposure to oxygen (Bockisch, 1998b). Thus, lipids used in poultry diets that contain
used cooking oils should receive additional testing for advanced oxidation products such as
ketones and aldehydes that peroxide values cannot detect (Wan, 2000).
An attempt to measure MIU content and include this information in predictive equations
has been made with a measure of success (Huyghebaert et al., 1988). However, another attempt at
generating predictive equations for AME and growth performance demonstrated poor agreement
(Pesti et al., 2002). Oxidative stability was correlated with measured AMEn for several lipid types,
but MIU was not, while only MIU was significantly correlated with growth performance of broilers
(Pesti et al., 2002). Thus, the ability of quality parameters to predict AMEn and subsequently
growth performance seems to be poor. The absence of high MIU or oxidative damage does not
guarantee high available energy content and should only be considered along with other measures
such as fatty acid profile; however, the presence of high MIU or oxidative damage in a lipid source
does mean that the available energy content will likely be reduced.
MEASUREMENT OF AVAILABLE ENERGY CONTENT
To maximize production efficiency, accurate data on available energy of lipids and lipid
mixtures must be determined (Sibbald et al., 1961). As least-cost formulation has become standard
and inclusion of an energy containing ingredient is largely based on its cost per unit available
energy (Leeson and Summers, 2001a), this need for accurate available energy determination has
grown (De Groote et al., 1971). Furthermore, it is sometimes advantageous to make research diets
isocaloric, and since lipids have high energy concentrations, they are convenient for this purpose.
However, due to the complexities of lipid utilization, diets may still have different available energy
contents, thus making an accurate understanding of the energy content of lipids under various
conditions important for research purposes (Dale and Fuller, 1982b).
32
Gross energy can easily be determined for lipids, but only measures the total energy stored
in the chemical bonds of the lipid (Leeson and Summers, 2001b). Thus, gross energy measures the
maximum amount of energy that a substance contains. Since most lipids are not completely utilized
(Blanch et al., 1995), other measurement techniques are needed to determine how much of the
gross energy is able to be used by the animal, and thus gross energy is of limited use in poultry
nutrition (Sibbald et al., 1960).
Metabolizable energy is calculated as the energy consumed minus the energy excreted in
excreta divided by the amount of feed consumed (Sibbald et al., 1960), and can be determined by
total collection or indigestible marker methods (Renner and Hill, 1960; Han et al., 1976; Halloran
and Sibbald, 1979; Muztar et al., 1981). It is traditionally held that ME is apparent (AME) when
the endogenous losses of energy are not taken into account, and true (TME) when endogenous
energy losses are taken into account. Both AME and TME are frequently corrected to a zero
nitrogen balance, and are then referred to a nitrogen-corrected ME (AMEn and TMEn,
respectively). It has been noted that TME values are generally somewhat higher than AME values
due to accounting for endogenous energy losses, but differences are minimized when AME is
measured at reasonably high levels of feed intake (Guillaume and Summers, 1970; Sibbald, 1975;
Wolynetz and Sibbald, 1984). The ME of energy containing ingredients is the preferred measure
of available energy for poultry nutrition (Hill and Anderson, 1958; Potter et al., 1960). Also, ME
is much easier to measure for most feed ingredients than digestible energy, as feces and urine are
excreted together making digestibility studies of energy containing feed ingredients very difficult
(Sibbald et al., 1960). In many ways, TMEn values are believed to be the most practical estimators
of available energy (Wolynetz and Sibbald, 1984). Both TME and AME values have been
generated for many lipids and lipid mixtures, and all energy values for lipids reported by the
33
National Research Council (1994) for poultry are expressed in terms of ME. There are many
factors that complicate the determination and interpretation of ME values. Perhaps the most serious
of these are interactions between supplemental lipids and the diet components in which they are
fed. These complicating factors will be discussed in subsequent sections of this review.
Lipid digestibility, defined as the amount of lipid ingested minus the amount of lipid in the
excreta divided by the amount of lipid ingested, can be used to estimate the energy content of
lipids. Lipid digestibility can also be corrected to account for the endogenous losses of lipid not
originating from the diet (Tancharoenrat et al., 2014). Terminology is inconsistent in the literature,
and frequently both corrected and uncorrected lipid digestibility are referred to as “digestibility”.
For the sake of consistency “apparent lipid digestibility” will be used to refer to uncorrected lipid
digestibility, and “standardized lipid digestibility” will be used to refer to endogenous-corrected
lipid digestibility throughout this text. Studies that did not indicate if lipid digestibility was
apparent or standardized will be assumed to be apparent.
Since lipids are not excreted in the urine, the digestibility of a lipid is directly related to its
ME value (Leeson and Summers, 2001b). Thus, the ME content for a lipid can be estimated by
multiplying its digestibility by the gross energy of the lipid (Young and Artman, 1961; Whitehead
and Fisher, 1975; Mateos and Sell, 1981a). The validity and accuracy of this method was
demonstrated experimentally by Renner and Hill (1960) who showed excellent agreement between
standardized lipid digestibility and traditionally determined AMEn for corn oil, lard, and tallow.
Good agreement between growth data from energy restricted chicks, traditional ME
determinations using indigestible markers, and apparent lipid digestibility has also been
demonstrated (Young, 1961; Young and Artman, 1961). Further evidence to support this method
has also been demonstrated (Artman, 1964; Cuppett and Soares, 1972; Dale and Fuller, 1982b;
34
Dvorin et al., 1998). In some cases, apparent lipid digestibility data has been able to detect
differences between lipid sources where AME was not able to (Blanch et al., 1995).
Lipid digestibility data deviates from calculated AME or TME data when EME are
observed. When corn oil was fed to growing turkeys, standardized digestibility showed that about
98% of the corn oil was digested, indicating that the available energy value should be about 98%
of 9.4 kcal/g, or 9.2 kcal/g; however, when AME was calculated using the total collection method,
the resulting values averaged 10.8 kcal/g (Whitehead and Fisher, 1975). This was also
demonstrated by the data of Cullen et al. (1962), where AMEn values that were calculated for
prime steam lard, poultry fat, and yellow grease using an indigestible marker yielded 8.635,
10.186, and 9.517 kcal/g, respectively. The measured AMEn by the marker method for the poultry
fat and yellow grease exceeded the gross energy of those two lipids, which is theoretically
impossible even if the lipids were 100% digested. Thus, lipid digestibility can deviate from AME
or TME values if there is an EME observed, where part of the energy measured in the classical
AME or TME assays is derived from a source other than the supplemental lipid (Lessire et al.,
1982). One positive of the lipid digestibility method is that results are not confounded by EME
(Wiseman and Salvador, 1991).
Lipid digestibility from total collection methods has been used to generate useful data on
available energy of lipids for poultry. When chicks were fed 6, 9, or 12% linseed oil or mutton
tallow from 14 to 32 days of age, linseed oil was found to have an apparent lipid digestibility that
ranged from 95 to 100% while mutton tallow apparent digestibility varied with age, but ranged
from 70 to 88% (Duckworth et al., 1950). Chicks fed diets containing 22% corn oil, lard, or a
mixture of 80% beef tallow and 20% pork fat yielded standardized digestibility values of 96, 92,
and 75%, respectively (Renner and Hill, 1960). Apparent digestibility of corn oil was found to be
35
91% by growing chicks (Sheppard et al., 1971). Lipid digestibility can also be calculated using an
indigestible marker method (Whitson et al., 1943) rather than total collection methods.
An alternate method for indirectly estimating ME of a feedstuff involves energy restricting
young growing animals. The assumption behind this assay is that young growing animals that are
supplied adequate amounts of all nutrients but restricted in energy will grow in direct proportion
to added available energy, irrespective of the source of energy. These assumptions have been
verified to hold true for practical purposes (Artman, 1964; Plavnik et al., 1997). Energy restricted
broiler chicks that have been given graded levels of supplemental energy have been shown to have
fairly constant ratios of energy deposited as fat or protein, indicating that body weight gains of
energy restricted chicks should not be affected by differential tissue formation (Boekholt et al.,
1994). Since chicks will eat to meet their energy requirements, (Young and Garrett, 1963; Renner,
1964), it is necessary to restrict feed intake of chicks when using this type of method (Young and
Artman, 1961).
One of the earliest instances of this technique being successfully applied was with
laboratory rats (Rice et al., 1957). Young growing rats were fed diets containing all nutrients in
excess of requirements but restricted in energy, which was limited via feed restriction. Rats gained
in direct proportion to energy added to the diet in the form of prime steam lard. Using standardized
fat digestibility of prime steam lard multiplied by its gross energy, the ME was estimated. When
other ingredients such as sucrose or casein were added to the diet, the ME of that ingredient was
estimated as compared to the amount of prime steam lard that would have resulted in equivalent
growth (Rice et al., 1957). The accuracy of this method was checked using growth data and
apparent lipid digestibility data generated from the same set of chicks fed several types of fats with
soy oil as the reference material. On average, there was an energy difference of only 0.2 kcal/g
36
between the two estimation methods for each lipid type, demonstrating the accuracy of using the
restricted energy growth method for the estimation of ME value for fats (Young and Artman,
1961). Good agreement between the restricted-energy growth assay and AMEn values calculated
from ad libitum feeding has also been documented (Artman, 1964).
A variation of this method has been used to generate estimates of available energy for
situations where a very small amount of sample is available to be tested (Yoshida and Morimoto,
1970). This model has been used successfully to estimate the available energy of a variety of
feedstuffs using the growing chick as a model, and has demonstrated excellent repeatability
between experiments (Squibb, 1971). However, one shortcoming of the work of Squibb (1971) is
that the method used to calculate the ME value for the reference material was not given. Since this
value will be used to calculate the ME value for all other ingredients tested, the derivation of this
value is crucial to the accuracy of this method. Benefits of using the available energy by growth
assay include simplicity of data generation via eliminating the laboratory analysis of tissues or
excreta (Squibb, 1971).
Near infrared reflectance spectroscopy (NIR) has potential for the routine analysis of lipids.
NIR has many advantages, as it is non-destructive, simple, and very fast (Gunstone, 2008). NIR
has been used to estimate the AMEn of lipids with some measure of success, with the ability to
predict AMEn to within 0.31 kcal/g for a variety of lipids and lipid mixtures varying widely in
traditionally measured AMEn content (Valdes and Leeson, 1994a). NIR has also been used to
predict the AMEn content of mixed diets containing graded levels of lipids. Calibration was done
on 62 samples, and validation on 143 samples. There was generally good agreement between NIR
predicted and traditionally calculated AMEn values (R2 = 0.90); however, the use of NIR to
calculate the AMEn of the lipid contained in the diets was poor (R2 = 0.23) (Valdes and Leeson,
37
1994b). This indicates that NIR does have application for the analysis of available energy values
of lipids, but a weakness is that large numbers of in vivo assays are still required to calibrate the
machines (Gunstone, 2008).
It has been shown that ME underestimates the amount of energy available for maintenance
and growth from lipids as compared to carbohydrates (Farrell, 1978), and thus it has been proposed
that net energy is a more appropriate measure of the energy value of lipids (Nitsan et al., 1997).
This is primarily due to lower heat increments for lipids as compared to carbohydrates, and is
responsible in part for the extra caloric effect of lipids (Carew and Hill, 1964; Rising et al., 1989).
The amount of energy lost as the measured heat increment decreased from 22% of measured ME
for glucose to 12% of the measured ME of corn oil (De Groote et al., 1971). The reduction in heat
increment appears to be relatively similar among commonly fed lipids (De Groote et al., 1971;
Farrell, 1978; Laurin et al., 1985). Similar conclusions have been made for a number of other lipid
sources, with the exception that poultry fat seems to have a lower heat increment than most other
lipid sources (Fuller and Rendon, 1977).
Though ME fails to account for this lower heat increment of lipids and thus underestimates
the energy available for maintenance or production, efforts to implement net energy systems into
commercial poultry production have not been successful, possibly due to the complexity of
determination of net energy, and the many factors such as stage of production that affect net energy
(Leeson and Summers, 2001b). When isocaloric diets that varied in lipid content were formulated
based on ME or NE, growth performance and feed efficiency were poorer for chicks fed diets
formulated for NE than for ME (Griffiths et al., 1977). Hill and Anderson (1958) demonstrated
that AMEn is more precise than productive energy (a form of net energy), with AMEn energy
values having a standard deviation that was a factor of 10 lower than productive energy values for
38
the same diet. AME was found to be a better predictor of feed efficiency in broilers than productive
energy (Potter et al., 1960). Net energy may come into more widespread use in the future, but
currently AME and TME are preferred (Leeson and Summers, 2001b).
THE CHALLENGES OF MEASURING ENERGY CONTENT OF LIPIDS
Attempts to measure the ME content of lipids directly by feeding them alone (diet
containing 100% of the test lipid) using methods such as tube-feeding have not been successful.
When 0.6 to 8.4 grams of corn oil were placed directly into the crops of roosters, regurgitation of
corn oil was noted in 20% of the birds (Sibbald, 1975), indicating that this method may not be
practical. Furthermore, there are several biological and methodological problems with this method
(Sibbald and Price, 1977). Thus, the majority of studies where available energy values were
generated for lipids used a basal diet as a carrier for the lipid. The basal diet and inclusion rate of
Sibbald (1977) are typical of this method, though the complexity of the basal diets have varied
widely (Dale and Fuller, 1981, 1982b; Lee et al., 1995).
Since lipid cannot be fed alone and must be fed in diets containing other energy containing
ingredients, this complicates the generation of available energy values for lipids. Methods to
calculate and separate the energy contributions of the components of the diet are available, but
require the assumption of additivity of components. This means that ingredients must not have
significant synergistic or antagonist effects when combined together into a diet. A lack of additivity
would mean that measured energy values are only accurate under the set of conditions that they
were measured. This would drastically complicate the generation and application of energy values
for feed ingredients (Sibbald et al., 1960). Energy values assigned to feed ingredients that are used
in poultry diets are assumed to be additive, and this holds true for practical purposes for all
ingredients except lipids (Dale and Fuller, 1982a); lipids have been known to violate this
39
assumption for many years. There is both a lack of additivity among lipid sources (Sibbald et al.,
1961), as well as among lipid and non-lipid portions of the diet (Sibbald and Price, 1977). This
lack of additivity drastically complicates the generation and interpretation of available energy
values for lipids determined in diets containing energy or lipid containing ingredients.
Consequently, Sibbald and Slinger (1962) concluded that ME was useful for all energy-containing
ingredients except for lipids.
Interaction between basal diet and supplemental lipid
Standardized lipid digestibility data has demonstrated that the AME or TME of lipids
cannot be explained in some cases by digestibility values, and thus some of the energy attributed
to the lipid source derives from the basal diet (Lessire et al., 1982). This occurs in part due to
increased digestion and absorption of the basal diet in the presence of supplemental lipid, which
will be discussed more in depth in subsequent sections. Support for this theory was demonstrated
when the AMEn of corn was found to increase significantly when assayed as part of a diet with
5% poultry fat (Pesti, 1984).
The extent of interactions between basal diet and supplemental lipid has been shown to
vary by basal diet type, with a corn-based basal resulting in higher TME values for tallow than
several wheat-based basal diets (Sibbald and Kramer, 1978). When 20% lard fatty acids were fed
in a practical diet versus a purified diet, apparent lipid digestibility was greater when fed in the
practical diet (Young et al., 1963). Diets with or without wheat middlings that were supplemented
with yellow grease resulted in AME values for the lipid that varied by diet type (Sell et al., 1979).
The TME of tallow fed to laying hens varied widely based on ingredient used as carrier, with a
range of 7.19 kcal/g for a soybean meal carrier to 13.62 kcal/g for a wheat bran carrier (Maiorino
et al., 1986). Since the ingredients varied widely in nitrogen content and values were not corrected
40
to nitrogen balance, the extreme nature of the variation might be at least partially accounted for by
the lack of nitrogen correction. The TME of tallow included at 0, 5, 10, or 15% in four different
diets was found to vary significantly by basal diet type, with the corn-based diet yielding higher
TME values for the tallow than the three wheat-based diets (Sibbald and Kramer, 1978). AMEn
values for tallow and yellow grease were found to vary substantially when fed in semi-practical
versus semi-purified diets, while the AMEn of choice white grease did not vary by diet type
(Cullen et al., 1962). When synthetic low fat diets or practical diets were used to assay a large
number of lipids for AME, there was no significant effect of diet type (Wiseman et al., 1986). This
indicates that not all lipid sources will interact with the diet in predictable ways, further increasing
the difficulty of predicting the impact that diet types will have on AMEn values for various lipids.
Some of the latter effect may be due to the lipid content and profile of the basal diet. The
ratio of lipid contained in the basal diet to the amount of supplemental lipid also has large impacts
on lipid utilization. When extracted lipid from a corn-soybean meal basal diet was re-incorporated
into the basal along with supplemental lipid in specific ratios, the TME of tallow increased 18%
when the ratio of basal to supplemental fat was increased from 1:4.5 to 1:1. Increasing the ratios
above 1:1 did not improve utilization further (Fuller and Dale, 1982). This may be explained in
part by alterations of the U:S ratio as discussed earlier.
Some attempts to remove the effect of the interactions between the supplemental lipid and
the basal diet have been made, mostly with completely digestible purified carriers. This method
has been somewhat questionable in its effectiveness. Attempts to measure corn oil TME values
using glucose or starch were ineffective due to poor digestion of either the starch in the presence
of oil, or the corn oil in the presence of glucose (Dale and Fuller, 1981). Further work with mixtures
of glucose and starch resulted in a higher level of success, and the measured TME of corn oil was
41
8.90 kcal/g (Dale and Fuller, 1981, 1982b). As this value is somewhat lower than would be
normally attributed to corn oil based on estimates of digestibility (Renner and Hill, 1960; Sheppard
et al., 1971; Whitehead and Fisher, 1975), it is questionable that the starch and/or glucose was
consistently 100% absorbed as was assumed.
Non-additivity between lipid sources
Non-additivity between ME values determined for various lipids and fatty acids has been
demonstrated. When soy oil, tallow, and a 1:1 mixture of the two lipids were assayed for AMEn,
the value for the mixture was higher than the average of the AMEn values for the soy oil and tallow
(Sibbald et al., 1961), indicating a synergistic non-additive relationship between soy oil and beef
tallow. The utilization of specific fatty acids by the chicken has been shown to vary based on the
types and amounts of other fatty acids in the diet. Saturated fatty acids such as palmitic and stearic
are increasingly well utilized as the amounts of unsaturated fatty acids increases in the diet (Young,
1961). Thus, the data of Sibbald et al. (1961) may be explained by increased utilization of the
saturated fatty acids in beef tallow (iodine value 56) when in the presence of the highly unsaturated
fatty acids present in soy oil (iodine value 132). This indicates that it is not the fatty acid profile
of individual lipid sources that influences energy availability, but rather the fatty acid profile of
the total combination of lipids fed. This greatly complicates the determination of useful and
repeatable energy values for lipids, as values must be obtained for any mixture of lipid types in
addition to the main lipid types themselves.
Many additional studies support the later statement. It was found that as the content of
linoleic acid increased, the AMEn of tallow linearly increased (Sibbald et al., 1962). Substantial
evidence of synergism between lipid sources was demonstrated by feed efficiency, apparent lipid
digestibility, and AMEn when various unsaturated lipids or fatty acids were blended with tallow;
42
however, the unsaturated lipid had to make up 25% of the lipid mixture for this synergism to be
detectable (Artman, 1964). A synergistic effect was observed between tallow and rapeseed oil, as
well as between mixtures of palmitic and stearic acids with rapeseed oil (Lall and Slinger, 1973).
Mixtures of several types of vegetable oils with either tallow or lard frequently resulted in
synergism where TME values of the mixtures were greater than the sum of the constituent parts;
however, this difference was only statistically significant in about half of the mixtures (Sibbald
and Kramer, 1977). Non-additivity between TME values for tallow and soy oil was observed when
as little as two parts soy oil were added to 98 parts tallow resulting in a synergism between the
lipid sources; however, when lard was combined with tallow, the TME values were additive
(Sibbald, 1978a). A synergistic relationship between yellow grease and soy oil was observed when
AMEn was measured in a practical-type diet (Mateos and Sell, 1980b). Synergism between tallow
and rapeseed oil soapstock were observed when the lipids were combined in 1:1 ratios. The
synergism represented an increase in AME or TME of 4 to 6% (Muztar et al., 1981). Maximum
synergism was obtained when lipid contained in the ingredients of the basal diet was at a 1:1 ratio
with supplemental lipid (Fuller and Dale, 1982), which is similar to ratios found in commercial
diets. Synergism was observed when rapeseed oil was blended with tallow and apparent fatty acid
digestibility was measured. This effect was most pronounced for palmitic and stearic acid
(Wiseman and Lessire, 1987a). In a similar experiment with the same treatments where AMEn
was measured, synergism was only detected a the highest rate of lipid inclusion (12%), and only
in broiler chicks, not in adult roosters (Wiseman and Lessire, 1987b). Synergism was observed
between tallow and soy oil, with mixtures of tallow and soy oil having apparent lipid digestibility
and AME values equivalent to soy oil alone (Blanch et al., 1995). The apparent lipid digestibility
and AMEn of hydrogenated soy oil was improved when fed in a mixture containing at least 23%
43
regular soy oil (Dvorin et al., 1998). Synergism between unsaturated and saturated fats was also
observed with broiler chicks (Zumbado et al., 1999).
Synergism between supplemental palmitic or stearic acids was not seen when fed to
broilers in mixtures with either sunflower oil or tallow (Vilà and Esteve-Garcia, 1996b). Thus,
synergism does not seem to be a predictable phenomenon, with notable instances where synergism
was predicted but not observed (Wiseman et al., 1998). Also, synergism does not occur equally
for all lipid sources (Sibbald, 1978a). Generally, greater synergism occurs when highly unsaturated
lipids are combined with highly saturated lipids, and may be explained in part by changes in the
U:S ratio.
Effects of age
Another difficulty encountered with generating estimates of available energy for lipids is
that, as discussed previously, the ability of poultry to utilize lipids can vary with age. It has been
stated that one of the essential assumptions that must be met for energy values for feed ingredients
to be useful is that the energy value determined does not vary significantly with age of the bird
(Sibbald et al., 1960). If this assumption is not met, then energy values for a feed ingredient are
only valid for use in diets for poultry that are the same age as the poultry used to determine the
energy values. This would obviously complicate the generation and use of energy values for
ingredients used in poultry diets. Most ingredients meet this assumption closely enough to have
negligible impacts; however, some types of lipids do not as we have seen previously.
Available energy values for lipids can vary by inclusion level of the lipid, particularly for
younger chicks. One of the earliest studies documenting this was conducted by Duckworth (1950).
When linseed oil or mutton tallow replaced glucose in the diet and were fed to chicks from 14 to
44
32 days of age at 0, 6, 9, or 12% of the diet, apparent lipid digestibility was generally lower at
higher levels of lipid inclusion. This effect decreased as chicks got older with mutton tallow only
differing by about 4% digestibility between the 6% and 12% inclusion rates (Duckworth et al.,
1950).
The majority of studies report an effect of level of inclusion with only saturated lipids, and
with most drastic effects seen with young birds. When soy oil, tallow, or a 1:1 mixture of the two
were fed to chicks at either 10 or 20%, tallow had lower ME values at 20% inclusion level
compared to the 10% inclusion level, but neither the soy oil or the mixture were affected by
inclusion level. The apparent lipid digestibility of tallow, but not for vegetable oil, was found to
decrease in a quadratic manner for broiler chicks as lipid inclusion increased from 2.5 to 12.5%
(Wiseman and Salvador, 1989). The effects of level of inclusion were found to be present mainly
in young chicks (1.5 weeks of age) and only in lipids containing high amounts of free fatty acids
and saturated fats (Wiseman and Salvador, 1991). No reduction in apparent lipid absorbability of
soy oil was observed when fed at levels up to 17.8% of the diet to 8 to 12 week old chicks (Whitson
et al., 1943). There was no significant effect of level of corn oil or poultry fat inclusion from 0 to
20% of diets fed to older broilers (Fuller and Rendon, 1979). Standardized digestibility of stearic
and palmitic acids decreased with inclusion when fed with either sunflower oil or tallow to broilers.
However, there was no effect of inclusion rate of oleic or linoleic acids when fed with either
sunflower oil or tallow (Vilà and Esteve-Garcia, 1996b). Further evidence documenting decreases
in available energy with increasing levels of saturated fats has been documented (Sibbald and
Kramer, 1978; Halloran and Sibbald, 1979; Wiseman and Lessire, 1987a; Dei et al., 2006).
However, there are instances where older birds have also demonstrated an effect of
inclusion level. When yellow grease was fed to laying hens in 3% increments from 0 to 15% of
45
the diet, the AMEn and TME were both observed to decrease with increasing inclusion of yellow
grease (Mateos and Sell, 1980a). As measured in adult roosters, the TME of beef tallow decreased
as amount of tallow fed increased regardless of basal diet composition (Sibbald and Kramer,
1980a; b).
As discussed previously, the negative effects of free fatty acids increase at high levels of
inclusion in the diet. When tallows contained less than 20% free fatty acids, there was no
significant effect of tallow inclusion level on ME or standardized lipid digestibility from 0 to 9%
of the diet; however, the effect of tallow inclusion level was significant when tallows contained
more than 20% free fatty acids (Shannon, 1971). Thus, samples containing moderate to high levels
of free fatty acids will likely decrease in available energy content with increasing inclusion level.
Level of supplemental lipid inclusion
As level of inclusion increases, the ratio between the lipids in the basal diet and the
supplemental lipids decreases. This may partially explain the impacts of supplementation level, as
TME of tallow was increased by as much as 18% simply by increasing the ratio of the basal diet
lipid to the supplemental lipid to similar proportions as would be encountered in a commercial
broiler diet (Fuller and Dale, 1982). Thus, at least some of this effect of level of inclusion in the
case of highly saturated supplemental lipids can be explained by changing ratios of U:S fatty acids.
A U:S ratio of at least 4 is required for optimal digestion of the saturated fatty acids. Fatty acids
contained in the basal portion of a corn-soybean meal or similar diet are predominantly unsaturated
and when low levels of saturated fatty acids are included in the diet the U:S ratio will be relatively
high. However, as more saturated fatty acids are included in the diet, the U:S will decrease, and
lipid utilization will drop dramatically (Ketels and De Groote, 1989). This may help explain the
lack of differences at low levels of lipid supplementation that were observed among lipid types
46
that vary widely in saturation (Bourdillon et al., 1990). Therefore, some of the effect of level of
inclusion may be able to be controlled by careful attention to U:S ratios.
Wiseman et al. (1986) demonstrated clearly that the AME of a variety of commercially
available lipids did not always respond in a linear fashion to increases in level of inclusion, and
argued that energy values for lipids should be obtained at several levels of inclusion to accurately
account for this effect. It has also been suggested that the relationship between available energy
and inclusion level needs to be incorporated into least-cost formulation software to maximize
economy (Miller et al., 1983). This would more closely model the actual energy contribution of a
lipid at a specific level of inclusion, rather than a single energy value for all levels. However, the
effect of level of inclusion on available energy of lipids is specific to each unique lipid or lipid
mixture (Wiseman et al., 1986), making this effect difficult to predict.
Since available energy of some lipids vary with inclusion rate, it would seem important to
test lipids at the inclusion level used in practical feeding situations; however, testing lipids at these
low levels requires large amounts of replication to attain reasonable error terms (Dale and Fuller,
1982b), and thus many assays include lipids at levels much higher than practical diets (Brown et
al., 1993) so as to reduce the replication needed for statistical significance (Sibbald et al., 1963;
Sibbald and Price, 1977). Thus, while lipids are evaluated at higher levels than practical inclusion
rates to reduce the inflation of errors, this may lead to inaccuracies due to differences associated
with level of inclusion, and the accuracy of the resulting values can be questioned (Sibbald et al.,
1963). However, it could also be argued that if U:S ratios are maintained and free fatty acid levels
are low as is desirable in commercial poultry nutrition, the majority of lipids will not vary
significantly with inclusion level. Currently, the National Research Council (1994) for poultry
does not separate lipid ME values by the inclusion level that they were determined at, although the
47
importance of inclusion level is hinted at by reporting the level or range of levels that individual
ME values were determined at.
Extra metabolic effect
As suggested by Horani and Sell (1977), the EME will be used in this review to refer to
the phenomenon of lipid inclusion appearing to increase the amount of diet metabolized
(improvements in energy utilization related to increased digestion and absorption). This is to
distinguish this effect from the effects of reduced heat increment and/or increased feed intake,
which will be referred to as the extra caloric effect and will be discussed in a subsequent section.
Evidence for the EME was first provided when measured ME values for lipids were in excess of
the gross energy of the lipids, which is theoretically impossible. This finding stimulated interest in
understanding this effect, and significant work has been done on this topic. Lipid digestibility data
have been of considerable help in determining the mechanisms behind the EME.
Perplexing results have been obtained under a variety of experimental conditions. Poultry
fat and yellow grease yielded AMEn values in excess of their gross energies when fed at 14%,
while the apparent lipid digestibility of poultry fat and yellow grease were only 94 and 93%,
respectively (Cullen et al., 1962). Thus, while the vast majority of the lipid material seems to have
been absorbed, this cannot explain the AMEn values exceeding 100% of the gross energy of the
lipids. It has been reported that the AMEn of soy oil in chicks has been found to be higher than
can be explained by the apparent lipid digestibility of soy oil (Artman, 1964). This effect has also
been seen in turkeys, with the calculated AME for corn oil, and to a lesser degree, lard, resulting
in energy values greater than their gross energies by as much as 1.4 kcal/g (Whitehead and Fisher,
1975). Feed grade fat fed to hens at 2 or 4% of the diet resulted in measured AME values that
48
exceeded the sum of the component parts of the diet, especially for diets containing ground corn
with 4% supplemental fat (Horani and Sell, 1977).
Further complicating the understanding of this effect, the EME is not equally detectable
for all lipids, and thus probably varies from lipid to lipid in magnitude. The AMEn values for an
A/V blend, yellow grease, and soy oil were in excess of their gross energies when fed to young
growing broiler chicks; however, the AMEn of 5 other lipid types in the same experiment were
below their gross energies (Pesti et al., 2002). The EME is not always demonstrated, with soy oil,
tallow, lard, or mixtures of soy oil and lard with tallow yielding TME values for all that were
below their gross energies (Sibbald, 1978a). When several lipid sources were fed at 5, 10 or 15%,
only a few lipids exhibited TME values greater than their gross energy values (Halloran and
Sibbald, 1979).
One of the observations frequently made is that the EME is often greatest at relatively low
levels of lipid inclusion. The TME values for soy oil and tallow were observed to be higher than
their gross energies when fed to roosters at 5% of the diet, but not at 10 or 15% of the diet (Sibbald
and Price, 1977). When tallow was fed at 0, 5, 10, or 15%, the TME for tallow exceeded its gross
energy only for tallow fed at 5% (Sibbald and Kramer, 1978). When several lipid sources were fed
at 5, 10 or 15%, a few lipids exhibited TME values greater than their gross energy values, but only
at the 5% level (Halloran and Sibbald, 1979). A follow-up experiment also suggested a reduction
in the impacts of the EME as inclusion rates increase (Sibbald and Kramer, 1980b). The EME
effect was observed from the first increment of added lipid, but not from the second (Dale and
Fuller, 1981). Using practical corn-soy carriers, TME values for corn oil and tallow fed at 2.5%
yielded values higher than their gross energies, indicating that this level of inclusion is enough to
trigger the EME (Dale and Fuller, 1982b). These data support the position that the impacts of the
49
extra caloric effect decrease as lipid inclusion increases. This tends to indicate that the EME may
be due to some sort of limited synergism between the basal diet and the supplemental lipid.
The EME was found to be affected by the cereal grains in the basal diet, with diets that
contained corn more likely to display the EME for lipids than diets containing wheat. Horani and
Sell (1977) found that corn-based diets tended to favor the EME. When fed in a corn-based diet,
both tallow and tallow mixed with rapeseed oil soapstock resulted in TME values greater than their
gross energies (Muztar et al., 1981). When tallow was fed at 0, 5, 10, or 15% in a wheat-based or
a corn-based diet, the TME for tallow exceeded its gross energy only for tallow fed at 5% in the
corn-based basal (Sibbald and Kramer, 1978) . Efforts to determine what portion of the corn kernel
was responsible for the EME were unsuccessful, but it was shown that corn oil was just as effective
as ground corn in eliciting the EME (Sibbald and Kramer, 1980b).
The latter gave rise to the theory that the EME was due to synergism between the fatty
acids in the basal diet and the fatty acids in the supplemental lipid (Horani and Sell, 1977). The
standardized lipid digestibility and TME of tallow were determined in either a wheat or a corn-
based diet. The lipid digestibility was calculated based on the extracted lipid content of the mixed
diets, not just on calculated tallow input, and so the digestibility measured the disappearance of
tallow plus the disappearance of lipids from the ingredients of the basal diet. This allowed the total
uptake of lipid to be measured, and differences between basal diets quantified. The corn-based diet
resulted in higher TME and higher standardized lipid digestibility values than the wheat-based
diet, indicating that part of the measured EME was indeed due to increased utilization of total
dietary lipid in the corn-based diet (Sibbald and Kramer, 1980a). As corn has higher concentrations
of unsaturated fatty acids than wheat (National Research Council, 1994; Serna-Saldivar, 2010), it
can be postulated that this effect may be due to the synergism between unsaturated and saturated
50
fatty acids (Mateos and Sell, 1980b) that has been discussed previously. This is further supported
by the evidence that the ratio of basal lipid to supplemental lipid will have large effects on lipid
utilization, with TME of tallow and an A/V blend maximized at a 1:1 ratio of basal to supplemental
lipid (Fuller and Dale, 1982). When lipids are assayed at low levels of inclusion in practical-type
diets containing large amounts of corn, this ratio may be attained, and contribute to observed EME
due to the synergism between fatty acids. However, this is not consistent with results where yellow
grease was fed in a corn-based basal to hens and did not result in EME, but EME was seen when
the same grease was fed to hens in the corn-based basal plus 8% wheat middlings (Sell et al.,
1979). Thus, the EME is complex, but seems to be explained in part due to synergism between
fatty acids contained in the basal and fatty acids supplemented to the diet.
An alternate theory is that supplemental lipid interacts with the non-lipid portions of the
basal diet in such a way as to increase the digestibility of basal components such as starch and
protein. As discussed previously, it is known that such an interaction can occur; however,
convincing evidence that this contributes to the EME has been provided by Mateos and Sell
(1981b). When the AMEn of yellow grease fed to laying hens was estimated using the apparent
lipid digestibility of the entire diet and traditional inter marker methods, the values differed by
calculation method and by carbohydrate source in the diets. In diets containing starch, the apparent
lipid digestibility method and the inert marker method yielded estimates of 8.5 and 9.7 kcal/g,
respectively. In sucrose containing diets, the apparent lipid digestibility method and the inert
marker method yielded values of 8.2 and 10.1 kcal/g, respectively. Thus, the difference between
the digestibility derived AMEn and the inert marker AMEn allows the energy originating from the
basal diet to be quantified. Per gram of supplemental lipid, the basal diet provided 1.2 kcal/g for
starch diets and 1.9 kcal/g for sucrose diets (Mateos and Sell, 1981b). Further support for this
51
theory was generated when a commercial broiler feed was ether-extracted to contain 0.95% total
lipid and was used as a carrier for corn oil. The TME values for the corn oil were in excess of its
gross energy (Dale and Fuller, 1981). Since there were minimal amounts of fatty acids present in
the extracted diet, it removed the factor of fatty acid synergism, and demonstrated that at least
some of the EME effect was due to interactions between the non-lipid portions of the basal diet
and the supplemental lipid. Further support for this conclusion has been demonstrated (Gomez and
Polin, 1974; Mateos and Sell, 1980b; c, 1981a; Lessire et al., 1982).
The effect of lipid supplementation on carbohydrate utilization was theorized to be due to
changes in the rate of passage of digesta in the presence of the supplemental lipid (Mateos and
Sell, 1980b). Yellow grease at 7% inclusion in a semi-purified diet resulted in 11.3% decreased
rate of passage as compared to the basal diet (Mateos and Sell, 1981c). This effect varied by
carbohydrate source of the basal, with sucrose basals supplemented with lipid resulting in greater
reductions in rate of passage than starch basals supplemented with lipid. When yellow grease was
fed to laying hens from 0 to 30% of the diet in 5% increments, there was a significant linear
decrease in rate of passage with increasing yellow grease. The reduction from 0 to 5% inclusion
was 12% (Mateos et al., 1982). This reduced rate of passage may allow more time for digestive
processes to liberate additional energy from the basal diet (Mateos and Sell, 1980c). This may help
explain how lipids are able to increase utilization of basal components of the diet. Not all lipids
impact passage rate equally, with corn oil having a longer transit time than poultry fat, which in
turn had a longer transit time than a low quality A/V blend (Squires et al., 1991). Also, there have
been instances where effects of supplemental lipid on rate of passage have not been detected
(Golian and Maurice, 1992). However, the evidence is clear that lipid supplementation can reduce
52
rate of passage, and this may provide an explanation for the increased utilization of non-lipid
portions of the basal diet in the presence of supplemental lipid (Mateos and Sell, 1980c).
That the EME is a result of both synergism between fatty acids and interactions of the
supplemental lipid with the non-lipid basal diet has been demonstrated. Standardized lipid
digestibility and TME were calculated for the tallow in corn or wheat-based diets and standardized
lipid digestibility was also calculated based on extracted lipid content of the mixed diets. Total
lipid digestibility of the complete diet (lipid in the basal ingredients plus supplemental lipid) was
higher for tallow in the corn diet, indicating that part of the measured EME was indeed due to
increased utilization of total lipid. However, the TME values for tallow in the corn basal were still
12.5% higher than could be explained by the difference in lipid digestibility (Sibbald and Kramer,
1980a), and thus there was an interaction between the lipid and the non-lipid components of the
basal diet that resulted in increased utilization of the basal diet. This indicates that both the non-
lipid as well as the lipid portions of the basal diet contribute to the EME.
When yellow grease was fed to laying hens in 3% increments from 0 to 15% of a corn-
based diet, TME values, but not AMEn values, for the yellow grease were above its gross energy
for all non-zero supplemental grease levels except 15% inclusion, and was highest at 3% inclusion,
at 11.6 kcal/g (Mateos and Sell, 1980a). This raises the interesting question of how often are AME
values higher than they should be due to EME, but are still below their gross energies and so the
overestimation is not detected. Since TME values are corrected for endogenous losses, it is normal
for TME values to be slightly higher than AME values (Guillaume and Summers, 1970), and thus
EME are more readily detected. It should be noted that though it is easier to observe EME in TME
values, it does not mean that EME occur less frequently in AME measurements. This can be
illustrated by the results of when 0.62 to 8.41 grams of corn oil was placed directly into the crops
53
of fasted roosters. When the values from birds that had regurgitated oil were removed, the average
TME of corn oil was 9.4 kcal/g (Sibbald, 1975). Since this value was not nitrogen corrected it is
likely that the TMEn value would be closer to 9.2 kcal/g (Parsons et al., 1982); however, this
indicates that even without any complications from a basal diet, corn oil is still almost completely
utilized by the adult rooster. Thus, any slight improvement in digestibility of the basal during lipid
assays with highly utilizable lipids will likely result in TMEn values higher than the theoretical
maximum value of 9.4 kcal/g (Leeson and Summers, 2001b). Thus, EME are likely impacting both
AME and TME values; however, TME values are more likely to exceed the gross energy of the
lipid, and as a result, TME values for lipids may be viewed as inferior to AME values. It is clear
that EME are likely affecting all ME values derived with practical-type diets, and thus the
usefulness of these values can be questioned. However, an alternate argument is that EME should
be accounted for and utilized in commercial diet formulations, as it is a real source of available
energy for the bird.
Extra caloric effect
The extra caloric effect can be defined as improvements in growth or feed efficiency due
to more efficient utilization of absorbed energy for growth, either from reduced heat increment or
increased feed intake of diets containing supplemental lipid. Many unexplained instances of bird
performance in the literature have been termed “extra caloric” effects, but not all instances thus
termed are truly instances of extra caloric effects. In particular there has been considerable
confusion about the differences between EME and extra caloric effects. The main difference is
that the EME can be measured by changes in ME, and extra caloric effects are largely due to the
efficiency with which the absorbed energy is transformed into a measurable product such as body
weight gain. In some instances of unexplained growth performance where measured ME data are
54
not presented, it may be very difficult to determine if unexplained growth is truly a result of extra
caloric effects or simply EME that were not recognized as such. Only data that used direct or
indirect calorimetry or tissue energy retention to support claims of unexplained growth are able to
be identified as instances of true extra caloric effects.
Based on the body of published data available at the time, it was found that inclusion of
lipids, especially those of vegetable origin, led to increases in weight gain or improvements in feed
efficiency that were not able to be fully explained based on measured ME or lipid digestibility,
with soy oil having the greatest impact on feed efficiency of several different lipid sources
(Vermeersch and Vanschoubroek, 1968). When 10 or 20% corn oil replaced glucose on an
isocaloric basis, significantly greater retention of tissue energy was observed for the chicks fed the
20% corn oil than chicks fed a basal diet, and this effect increased with increasing corn oil inclusion
(Carew and Hill, 1964). Beef tallow, corn oil, and soy oil increased the efficiency with which ME
was converted into retained tissue energy in a similar study; however, coconut oil did not (Carew
et al., 1964).
The majority of evidence points to the lower heat increment of lipids being responsible for
most of the extra caloric effect. When lard was fed to growing rats at 2, 10 and 30% of the diet
over a 70 day metabolism trial, the heat increment was significantly decreased with increasing
levels of lipid (Forbes et al., 1946a). In an identical experiment with adult rats, similar results were
obtained (Forbes et al., 1946b). The measured heat increment decreased from 22% of measured
ME of glucose to 12% of the measured ME of corn oil (De Groote et al., 1971), which means about
10% less of the total ME content of glucose than of corn oil was available to the bird to meet
maintenance and growth energy requirements. The heat increment plus heat of activity (measured
together) was found to represent a decreased fraction of energy intake when either corn oil or
55
poultry fat were fed in the diet regardless of inclusion level; however, this decrease was only
significant for poultry fat (Fuller and Rendon, 1979). When closed-circuit calorimetry combined
with whole-body energy retention were used to estimate the efficiency with which ME was utilized
by broiler chickens fed supplemental tallow or corn oil, the efficiency of utilization (energy
retention divided by energy intake) was 77% for the diets containing no supplemental lipid, and
82% for the diets containing lipid, and did not differ significantly by lipid inclusion rate (Farrell,
1978). Thus, the proportion of energy that was not utilized for production (heat increment,
assuming equal maintenance requirements) was decreased when birds were fed lipid containing
diets. Using indirect calorimetry to measure the effect of 3% animal fat supplementation of laying
hen diets, it was determined that energy retention (defined as ME intake minus heat production)
was significantly improved for all diets containing fat as compared to diets containing no fat
(Rising et al., 1989). This was due in part to decreased heat increment per unit energy intake, and
partly due to increased ME intake of diets containing supplemental lipid. This raises the question
of increased palatability of diets containing lipids as discussed earlier, which tends to plague
attempts to understand the extra caloric effect. When chicks were fed isocaloric diets with or
without 3% soy oil, chicks receiving the soy oil diet had significantly increased weight gain (7%),
and net energy deposition (17%); however, levels of soy oil above 3% did not result in increasingly
greater differences (Nitsan et al., 1997). The addition of corn oil, coconut oil, acidulated cottonseed
soapstock, palm oil, tallow, poultry fat, and a feed grade animal fat at 10, 12 or 20% of the diet
significantly decreased the heat increment of broilers; however, heat increment was minimized to
the greatest extent at the 10% inclusion level of lipid (Fuller and Rendon, 1977). Poultry fat
consistently demonstrated the lowest heat increment, possibly due to the close match between fatty
56
acid profile of the poultry fat and the fat deposited by the bird, while other lipid sources had similar
heat increments (Fuller and Rendon, 1977).
Protein content of the diet
There is some evidence that protein level of the diet may influence fat digestibility. When
adult rats were maintained on semi-purified diets that were low (14%) or high (30%) protein and
contained 18% fat, apparent fat digestibility varied by protein content (Barnes et al., 1944). Rats
on the low protein diet had higher fecal fat content and thus lower fat digestibility than rats on high
protein diets. This effect was most pronounced with poorly utilized fats, while more highly utilized
fats were less sensitive to protein level. Similar results were obtained with chicks when soy oil,
tallow, and 1:1 mixture of the two were assayed for AME in diets that contained either 24 or 34%
protein. The higher protein containing basal yielded higher AME values than the lower protein
basal, and this effect was most pronounced with the tallow (Sibbald et al., 1961). Lard fatty acids
had significantly higher apparent lipid digestibility when fed in a diet containing 28 or 30% protein
as compared to a 24% protein diet (Young et al., 1963). There is no obviously evident reason why
protein level would directly impact available energy content of lipids, and limited instances where
this has been observed. As a result, the effect of protein level of the diet on lipid utilization in
poultry may be viewed as having minor impacts.
Interactions with dietary minerals
There is evidence that the mineral level of the diet may impact lipid utilization, likely
through the formation of insoluble soaps (Edwards et al., 1960). When tallow or soy oil were fed
in diets containing 0.96 or 3.42% calcium, the TME for the lipids was observed to decrease in the
higher calcium diets, especially for the tallow, and the negative effect was maximized at high
57
levels of lipid inclusion (Sibbald and Price, 1978). The addition of 3.8% calcium in the form of
ground limestone to wheat diets containing 3, 6, and 9% animal fat resulted in a 14% decrease in
apparent lipid digestibility of the animal fat (Rising et al., 1990). On a contradictory note, it has
been reported that linseed and palm oil can increase apparent calcium digestibility and tibia
calcium content (Zhong et al., 2014).
Interactions with enzymes
Beneficial enzyme by supplemental lipid interactions have been documented. When tallow
or soy oil were fed to broilers at 10% of the diet with or without xylanase, there was a significant
lipid source by enzyme interaction. Enzyme supplementation improved apparent lipid digestibility
for diets containing supplemental fat, but the effect was most pronounced for tallow (Dänicke et
al., 1997, 1999). Weight gain, feed efficiency, and apparent lipid digestibility were improved
significantly when an endo-xylanase was added to a diet containing a mixed A/V blend, but not
when added to a diet containing soy oil (Langhout et al., 1997). Xylanase supplementation in a
wheat-containing diet with either soy oil or tallow had the greatest effect on AME and apparent
lipid digestibility in tallow-containing diets (Preston et al., 2001). It is likely that the beneficial
effects of enzyme supplementation on lipid utilization are related to decreases in viscosity of the
intestinal contents (Preston et al., 2001). Supplementation of wheat or corn diets fed to young
broilers with phytase resulted in increased apparent ileal digestibility of lipid as well as for all
individual fatty acids (Zaefarian et al., 2013). Supplementation with a variety of combined enzyme
types resulted in increased apparent ileal digestibility of lipid in broiler diets, but was most
pronounced with wheat-containing diets (Romero et al., 2014).
58
Miscellaneous factors
There are a variety of other less important factors that may impact measurements of
available energy content of lipids. The lipid contained within cereal grains is believed to be less
utilized than supplemental lipid. The fiber matrix encapsulating corn oil has been hypothesized to
explain the lower apparent lipid digestibility for high oil corn versus regular dent corn with
supplemental corn oil (Vieira et al., 1997). Lipase supplementation was not able to improve the
apparent lipid digestibility of a diet with no supplemental lipid but containing supplemental rice
bran, indicating that the lipid in the bran was not able to be accessed by the lipase (Martin and
Farrell, 1998). There is some evidence to support the theory that the sex of broiler chickens impacts
lipid utilization. Sexed broilers fed diets containing either soy oil or tallow resulted in significantly
better growth performance of males fed soy oil diets, where females had significantly better
performance on tallow diets (Hebert and Cerniglia, 1981). Heat stress may reduce apparent lipid
digestibility (Bonnet et al., 1997). Supplemental lipids may positively interact with antibiotic
supplementation, and negatively interact with probiotic supplementation in terms of growth
performance and nutrient digestibility (Sharifi et al., 2012).
Illustration of the complexity of lipid utilization
An attempt to develop prediction equations for available energy content of lipid was made
(Huyghebaert et al., 1988). The parameters of gross energy, moisture, impurities, percent free fatty
acids, saponification, unsaponification, melting point, peroxide value, iodine value, nonpolar and
polar fractions, and fatty acid profile were measured for 23 lipids which were also assayed for
AMEn. The conclusion was reached that the derivation of prediction equations was quite difficult
due to the complexity of the large number of interactions and variables that impact lipid utilization,
but that a fairly good model could be obtained by using seven chemical parameters (Huyghebaert
59
et al., 1988). However, some types of lipids did not fit the model as well as others, and the authors
recommended that the equations be used with caution. To further increase the accuracy of the
equation, it was recommended that even more variables beyond what were measured (such as basal
diet composition, level of lipid inclusion, etc.) would have to be included in the model
(Huyghebaert et al., 1988). This demonstrates the huge number of factors that impact the available
energy content of a specific lipid, and highlights the daunting task of trying to predict available
energy content. More simple models have been attempted, (Wiseman et al., 1991; Vilà and Esteve-
Garcia, 1996c; Pesti et al., 2002), but are only applicable under controlled settings where the lipids
tested vary in predictable ways (Wiseman et al., 1998), and are not adequate to deal with the
complex mixtures of lipids of poorly described quality and origin (Blanch et al., 1995) that are
commonly used in poultry nutrition today.
Commercial poultry nutrition is not advanced to a degree where the vast complexity of
lipid utilization be accounted for in practical diet formulation, but neither are simple prediction
equations satisfactory. Thus, measured energy values are needed to generate information on
available energy that can be used in commercial diet formulation. However, since there are so
many factors that can impact the available energy content of lipids, the practical value of absolute
ME values for lipids can justifiably be questioned.
CONCLUSION
Lipids play central roles in poultry nutrition by providing important nutrients and by being
a concentrated source of energy. There are differences in chemical composition among lipid
sources that have large impacts on how much energy will be available to meet the needs of the
bird. Since not all lipid sources are utilized to the same extent, there is a need to measure the
available energy of lipid sources to maximize the efficiency and economy of commercial poultry
60
production. These values can be determined by several methods; however, there are many factors
that can impact these values and nullify the results. Some of the main factors include interactions
between the components of the basal diet and supplemental lipid, interactions between fatty acids,
effects of bird age, and effects of level of inclusion of supplemental lipid. Possibly the single most
important factor in overcoming these challenges is maintaining appropriate U:S ratios. Current
methods of determining available energy are fraught with complicating and limiting factors. Thus,
there is a need for more simple and rapid alternative methods of measuring the available energy
content of lipid sources.
An attempt was made in the current study (thesis) to develop an in vivo assay that is simple
in nature, and will detect relative differences in available energy content among lipids. Rather than
attempt to account for and control all the factors that may influence lipid availability, this assay
would measure utilization of commercially relevant lipids while only controlling factors that might
reduce the available energy content of the lipids. Using an approach where available energy
content of lipids is determined under close to ideal circumstances may likely result in absolute
energy values that are most likely greater than would be obtained in commercial feeding situations.
However, any reduction in utilization of a lipid source relative to a highly digested lipid such as
corn or soy oil under these ideal conditions may reasonably be expected to indicate a lipid source
with inferior lipid content that will also yield lower available energy in commercial diets. Thus,
lipids having inferior available energy content relative to a high quality reference lipid (corn or
soy oil) can be identified and the degree of inferiority quantified. This information would be simple
enough to be useful in meeting the needs of the commercial poultry industry. Thus, a combination
of the slope-ratio method and the precision-fed rooster assay was developed in an attempt to create
a simple and rapid biological assay for the estimation of relative ME values for lipids.
61
LITERATURE CITED
Artman, N. R. 1964. Interactions of fats and fatty acids as energy sources for the chick. Poult. Sci.
43:994–1004.
Azain, M. J. 2001. Fat in swine nutrition. Pages 95–106 in Swine Nutrition. Lewis, A. J., Southern,
L. L., eds. 2nd ed. CRC Press, Boca Raton, FL.
Balnave, D. 1969. Response of laying hens fed on a restricted isocaloric intake basis to oil
supplementation of a low-fat ration. J. Sci. Food Agric. 20:556–560.
Balnave, D. 1970. The influence of energy intake and dietary maize oil supplementation of layers’
rations containing maize, wheat or barley as the sole cereal ingredient. Poult. Sci. 49:1197–
1202.
Balnave, D. 1971. Response of laying hens to dietary supplementation with energetically
equivalent amounts of maize starch or maize oil. J. Sci. Food Agric. 22:125–128.
Balnave, D. 1972. Egg weight and other production responses resulting from the supplementation
of a semi-purified layers’ ration with energetically equivalent amounts of maize starch or
maize oil. J. Sci. Food Agric. 23:1305–1311.
Balnave, D. 1987. Short-term manipulation of egg weight. J. Sci. Food Agric. 40:195–203.
Balnave, D., and W. O. Brown. 1968. A study of the separate effects of energy intake and dietary
corn oil on egg production and egg size in essential fatty acid-deficient hens fed a semi-
purified diet. Poult. Sci. 47:1212–1218.
Barbour, G. W., M. T. Farran, N. N. Usayran, A. H. Darwish, M. G. Uwayjan, and V. M.
Ashkarian. 2006. Effect of soy oil supplementation to low metabolizable energy diets on
production parameters of broiler chickens. J. Appl. Poult. Res. 15:190–197.
62
Barnes, R. H., M. F. Primrose, and G. O. Burr. 1944. The influence of the protein content of the
diet upon fat digestibility. J. Nutr. 27:179–184.
Batal, A. B., and C. M. Parsons. 2002. Effects of age on nutrient digestibility in chicks fed different
diets. Poult. Sci. 81:400–407.
Blanch, A., A. C. Barroeta, M. D. Baucells, and F. Puchal. 1995. The nutritive value of dietary fats
in relation to their chemical composition. Apparent fat availability and metabolizable energy
in two-week-old chicks. Poult. Sci. 74:1335–1340.
Bockisch, M. 1998a. Importance of fats. Pages 1–52 in Fats and Oils Handbook. AOCS Press,
Champaign, IL.
Bockisch, M. 1998b. Fat as food. Pages 719–802 in Fats and Oils Handbook. AOCS Press,
Champaign, IL.
Boekholt, H. A., P. van der Grinten, V. V. A. M. Schreurs, M. J. N. Los, and C. P. Leffering. 1994.
Effect of dietary energy restriction on retention of protein, fat and energy in broiler chickens.
Br. Poult. Sci. 35:603–614.
Bonnet, S., P. A. Geraert, M. Lessire, B. Carre, and S. Guillaumin. 1997. Effect of high ambient
temperature on feed digestibility in broilers. Poult. Sci. 76:857–863.
Bourdillon, A., B. Carré, L. Conan, M. Francesch, M. Fuentes, G. Huyghebaert, W. Janssen, B.
Leclercq, M. Lessire, J. McNab, M. Rigoni, and J. Wiseman. 1990. European reference
method of in vivo determination of metabolisable energy in poultry: Reproducibility, effect
of age, comparison with predicted values. Br. Poult. Sci. 31:567–576.
Brown, P. K., L. M. Potter, and B. A. Watkins. 1993. Metabolizable energy values of soy oil and
hydrogenated soy oil for broilers. Poult. Sci. 72:794–797.
63
Brue, R. N., and J. D. Latshaw. 1985. Energy utilization by the broiler chicken as affected by
various fats and fat levels. Poult. Sci. 64:2119–2130.
Campbell, M., and S. Farrell. 2012. Lipids and proteins are associated in biological membranes.
Pages 193–225 in Biochemistry. 7th ed. Brooks/Cole, Belmont, CA.
Carew, L. B., and F. W. Hill. 1964. Effect of corn oil on metabolic efficiency of energy utilization
by chicks. J. Nutr. 83:293–299.
Carew, L. B., D. T. Hopkins, and M. C. Nesheim. 1964. Influence of amount and type of fat on
metabolic efficiency of energy utilization by the chick. J. Nutr. 83:300–306.
Carew, L. B., R. H. Machemer, R. W. Sharp, and D. C. Foss. 1972. Fat absorption by the very
young chick. Poult. Sci. 51:738–742.
Carew, L. B., M. C. Nesheim, and F. W. Hill. 1963. The relationship of dietary energy level and
density to the growth response of chicks to fats. Poult. Sci. 42:710–718.
Cherry, J. A. 1982. Noncaloric effects of dietary fat and cellulose on the voluntary feed
consumption of white leghorn chickens. Poult. Sci. 61:345–350.
Christensen, M., A. Müllertz, and C.-E. Høy. 1995. Absorption of triglycerides with defined or
random structure by rats with biliary and pancreatic diversion. Lipids 30:521–526.
Coon, C. N., W. A. Becker, and J. V. Spencer. 1981. The effect of feeding high energy diets
containing supplemental fat on broiler weight gain, feed efficiency, and carcass composition.
Poult. Sci. 60:1264–1271.
Cullen, M. P., O. G. Rasmussen, and O. H. M. Wilder. 1962. Metabolizable energy value and
utilization of different types and grades of fat by the chick. Poult. Sci. 41:360–367.
Cuppett, S. L., and J. H. Soares. 1972. The metabolizable energy values and digestibilities of
menhaden fish meal, fish solubles, and fish oils. Poult. Sci. 51:2078–2083.
64
Dale, N. M., and H. L. Fuller. 1981. Effect of carrier on the true metabolizable energy of corn oil.
Poult. Sci. 60:1504–1508.
Dale, N. M., and H. L. Fuller. 1982a. Applicability of the true metabolizable energy system in
practical feed formulation. Poult. Sci. 61:351–356.
Dale, N. M., and H. L. Fuller. 1982b. True metabolizable energy of fats at low level dietary
inclusion. Poult. Sci. 61:2415–20.
Dänicke, S., O. Simon, H. Jeroch, and M. Bedford. 1997. Interactions between dietary fat type and
xylanase supplementation when rye-based diets are fed to broiler chickens 2. Performance,
nutrient digestibility and the fat-soluble vitamin status of livers. Br. Poult. Sci. 38:546–556.
Dänicke, S., O. Simon, H. Jeroch, K. Keller, K. Gläser, H. Kluge, and M. R. Bedford. 1999. Effects
of dietary fat type, pentosan level and xylanase supplementation on digestibility of nutrients
and metabolizability of energy in male broilers. Arch. Anim. Nutr. 52:245–261.
Davidson, A. L. 1956. Fat in poultry nutrition. I.-The chick from hatching to five weeks of age. J.
Sci. Food Agric. 7:240–244.
De Groote, G., N. Reyntens, and J. Amich-Gali. 1971. Fat studies: 2. The metabolic efficiency of
energy utilization of glucose, soy oil and different animal fats by growing chicks. Poult. Sci.
50:808–819.
Dei, H. K., S. P. Rose, and A. M. MacKenzie. 2006. Apparent metabolisable energy and
digestibility of shea (Vitellaria paradoxa) fat, cocoa (Theobroma cacao) fat and soy oil in
broiler chicks. Br. Poult. Sci. 47:607–612.
Donaldson, W. E. 1962. The response of chicks to dietary animal fat in new and old environments.
Poult. Sci. 41:1106–1108.
65
Donaldson, W. E., G. F. Combs, G. L. Romoser, and W. C. Supplee. 1957. Studies on energy
levels in poultry rations: 2. Tolerance of growing chicks to dietary fat. Poult. Sci. 36:807–
815.
Duckworth, J., J. M. Naftalin, and A. C. Dalgarno. 1950. The digestibility of linseed oil and mutton
fat by chicks. J. Agric. Sci. 40:39–43.
Dvorin, A., Z. Zoref, S. Mokady, and Z. Nitsan. 1998. Nutritional aspects of hydrogenated and
regular soy oil added to diets of broiler chickens. Poult. Sci. 77:820–825.
Edwards, H. M., W. S. Dunahoo, J. L. Carmon, and H. L. Fuller. 1960. Effect of protein, energy
and fat content of the ration on calcium utilization. Poult. Sci. 39:1389–1394.
Edwards, D. G., and T. R. Morris. 1967. The effect of maize and maize oil on egg weight. Br.
Poult. Sci. 8:163–168.
Enser, M. 1984. The chemistry, biochemistry and nutritional importance of animal fats. In Fats in
Animal Nutrition. Wiseman, J., ed. Butterworth-Heinemann, London, UK.
Farrell, D. J. 1978. Efficiency of utilisation by growing chickens of the energy of dietary fat and
oil. Br. Poult. Sci. 19:105–109.
Forbes, E. B., R. W. Swift, W. H. James, J. W. Bratzler, and A. Black. 1946a. Further experiments
on the relation of fat to economy of food utilization: I. By the growing albino rat. J. Nutr.
32:387–396.
Forbes, E. B., R. W. Swift, E. J. Thacker, V. F. Smith, and C. E. French. 1946b. Further
experiments on the relation of fat to economy of food utilization: II. By the mature albino rat.
J. Nutr. 32:397–403.
Fraps, G. S. 1943. Relation of the protein, fat, and energy of the ration to the composition of
chickens. Poult. Sci. 22:421–424.
66
Fuller, H. L., and N. M. Dale. 1982. Effect of ratio of basal diet fat to test fat on the true
metabolizable energy of the test fat. Poult. Sci. 61:914–918.
Fuller, H. L., and M. Rendon. 1977. Energetic efficiency of different dietary fats for growth of
young chicks. Poult. Sci. 56:549–557.
Fuller, H. L., and M. Rendon. 1979. Energetic efficiency of corn oil and poultry fat at different
levels in broiler diets. Poult. Sci. 58:1234–1238.
Garrett, R. L., and R. J. Young. 1975. Effect of micelle formation on the absorption of neutral fat
and fatty acids by the chicken. J. Nutr. 105:827–838.
Golian, A., and D. V Maurice. 1992. Dietary poultry fat and gastrointestinal transit time of feed
and fat utilization in broiler chickens. Poult. Sci. 71:1357–1363.
Gomez, M. X., and D. Polin. 1974. Influence of cholic acid on the utilization of fats in the growing
chicken. Poult. Sci. 53:773–781.
Gomez, M. X., and D. Polin. 1976. The use of bile salts to improve absorption of tallow in chicks,
one to three weeks of age. Poult. Sci. 55:2189–2195.
Griffiths, L., S. Leeson, and J. D. Summers. 1977. Influence of energy system and level of various
fat sources on performance and carcass composition of broilers. Poult. Sci. 56:1018–1026.
Grobas, S., J. Mendez, C. De Blas, and G. G. Mateos. 1999a. Laying hen productivity as affected
by energy, supplemental fat, and linoleic acid concentration of the diet. Poult. Sci. 78:1542–
1551.
Grobas, S., J. Mendez, C. De Blas, and G. G. Mateos. 1999b. Influence of dietary energy,
supplemental fat and linoleic acid concentration on performance of laying hens at two ages.
Br. Poult. Sci. 40:681–687.
67
Gropper, S., J. Smith, and J. Groff. 2009. Lipids. Pages 131–175 in Advanced Nutrition and
Human Metabolism. 5th ed. Wadsworth, Belmont, CA.
Guillaume, J., and J. D. Summers. 1970. Maintenance energy requirement of the rooster and
influence of plane of nutrition on metabolizable energy. Can. J. Anim. Sci. 50:363–369.
Gunstone, F. 2008. Analytical parameters. Pages 37–58 in Fats and Oils in the Food Industry.
Blackwell Publishing Ltd, West Sussex, UK.
Gurr, M. 1984. The chemistry and biochemistry of plant fats and their nutritional importance.
Pages 3–22 in Fats in Animal Nutrition. Wiseman, J., ed. Butterworth-Heinemann, London,
UK.
Gurr, M. 1997. Lipids and Nutrition. Pages 79–112 in Lipid Technologies and Applications.
Gunstone, F. D., Padley, F. B., eds. Marcel Dekker Inc., New York, NY.
Halloran, H. R., and I. R. Sibbald. 1979. Metabolizable energy values of fats measured by several
procedures. Poult. Sci. 58:1299–1307.
Han, I. K., H. W. Hochstetler, and M. L. Scott. 1976. Metabolizable energy values of some poultry
feeds determined by various methods and their estimation using metabolizability of the dry
matter. Poult. Sci. 55:1335–1342.
Hebert, J. A., and G. J. Cerniglia. 1981. The effect of tallow and soy oil on growth of sexed broilers.
Poult. Sci. 60:1082–1085.
Henderson, E. W., and W. E. Irwin. 1940. The tolerance of growing chicks for soy oil in their
ration. Poult. Sci. 19:389–395.
Hill, F. W., and D. L. Anderson. 1958. Comparison of metabolizable energy and productive energy
determinations with growing chicks. J. Nutr. 64:587–603.
68
Horani, F., and J. L. Sell. 1977. Effect of feed grade animal fat on laying hen performance and on
metabolizable energy of rations. Poult. Sci. 56:1972–1980.
Howard, A. J. 1984. Blend sources and quality control. Pages 480–494 in Fats in Animal Nutrition.
Wiseman, J., ed. Butterworth-Heinemann, London, UK.
Huyghebaert, G., G. De Munter, and G. De Groote. 1988. The metabolisable energy (AMEn) of
fats for broilers in relation to their chemical composition. Anim. Feed Sci. Technol. 20:45–
58.
Iqbal, J., and M. M. Hussain. 2009. Intestinal lipid absorption. Am. J. Physiol. - Endocrinol. Metab.
296:E1183–E1194.
Jackson, N., H. R. Kirkpatrick, and R. B. Fulton. 1969. An experimental study of the utilisation,
by the laying hen, of dietary energy partially supplied as animal fat. Br. Poult. Sci. 10:115–
126.
Jin, S.-H., A. Corless, and J. L. Sell. 1998. Digestive system development in post-hatch poultry.
Worlds. Poult. Sci. J. 54:335–345.
Józefiak, D., B. Kierończyk, M. Rawski, M. Hejdysz, A. Rutkowski, R. M. Engberg, and O.
Højberg. 2014. Clostridium perfringens challenge and dietary fat type affect broiler chicken
performance and fermentation in the gastrointestinal tract. Animal 8:912–922.
Keshavarz, K., and S. Nakajima. 1995. The effect of dietary manipulations of energy, protein, and
fat during the growing and laying periods on early egg weight and egg components. Poult.
Sci. 74:50–61.
Ketels, E., and G. De Groote. 1989. Effect of ratio of unsaturated to saturated fatty acids of the
dietary lipid fraction on utilization and metabolizable energy of added fats in young chicks.
Poult. Sci. 68:1506–1512.
69
Kim, E. J., J. L. Purswell, J. D. Davis, R. E. Loar, and K. Karges. 2013. Live production and
carcass characteristics of broilers fed a blend of poultry fat and corn oil derived from distillers
dried grains with solubles. Poult. Sci. 92:2732–2736.
Kormann, A., and H. Weiser. 1984. Protective functions of fat-soluble vitamins. Pages 201–222
in Fats in Animal Nutrition. Wiseman, J., ed. Butterworth-Heinemann, London, UK.
Krogdahl, Å. 1985. Digestion and absorption of lipids in poultry. J. Nutr. 115:675–685.
Kussaibati, R., J. Guillaume, and B. Leclercq. 1982a. The effects of age, dietary fat and bile salts,
and feeding rate on apparent and true metabolisable energy values in chickens. Br. Poult. Sci.
23:393–403.
Kussaibati, R., J. Guillaume, and B. Leclercq. 1982b. The effects of endogenous energy, type of
diet, and addition of bile salts on true metabolizable energy values in young chicks. Poult.
Sci. 61:2218–2223.
Lall, S. P., and S. J. Slinger. 1973. The metabolizable energy content of rapeseed oils and rapeseed
oil foots and the effect of blending with other fats. Poult. Sci. 52:143–151.
Langhout, D. J., J. B. Schutte, C. Geerse, A. K. Kies, J. De Jong, and M. W. A. Verstegen. 1997.
Effects on chick performance and nutrient digestibility of an endo-xylanase added to a wheat
and rye-based diet in relation to fat source. Br. Poult. Sci. 38:557–563.
Laurin, D. E., S. P. Touchburn, E. R. Chavez, and C. W. Chan. 1985. Methods of measuring energy
utilization in broilers: Effect of genetic line and presence of supplemental dietary fat. Poult.
Sci. 64:969–978.
Lee, K., G.-H. Qi, and J. S. Sim. 1995. Metabolizable energy and amino acid availability of full-
fat seeds, meals, and oils of flax and canola. Poult. Sci. 74:1341–1348.
70
Leeson, S., and J. D. Summers. 2001a. Feed ingredients and feed formulation. Pages 473–510 in
Nutrition of the Chicken. 4th ed. University Books, Guelph, Ontario, Canada.
Leeson, S., and J. D. Summers. 2001b. Energy. Pages 34–99 in Nutrition of the Chicken. 4th ed.
University Books, Guelph, Ontario, Canada.
Lessire, M., B. Leclercq, and L. Conan. 1982. Metabolisable energy value of fats in chicks and
adult cockerels. Anim. Feed Sci. Technol. 7:365–374.
Lewis, D., and C. G. Payne. 1963. Fats and amino acids in broiler rations. Br. Poult. Sci. 4:13–18.
Lipstein, B., and S. Bornstein. 1975. “Extra-caloric” properties of acidulated soybean-oil
soapstock for broilers during hot weather. Poult. Sci. 54:396–404.
Mabayo, R., M. Furuse, A. Murai, and J. Okumura. 1994. Interactions between medium-chain and
long-chain triacylglycerols in lipid and energy metabolism in growing chicks. Lipids 29:139–
144.
Mabayo, R., M. Furuse, A. Murai, and J. Okumura. 1995. Cholestyramine alters the lipid and
energy metabolism of chicks fed dietary medium-or long-chain triacylglycerol. Lipids
30:839–845.
Maiorino, P. M., A. A. Al-hozab, R. Mitchell, and B. L. Reid. 1986. Animal fat effects on nutrient
utilization. Poult. Sci. 65:2304–2313.
March, B. E., and J. Biely. 1963. The effects of dietary fat and energy levels on the performance
of caged laying birds. Poult. Sci. 42:20–24.
Martin, E. A., and D. J. Farrell. 1998. Strategies to improve the nutritive value of rice bran in
poultry diets. II. Changes in oil digestibility, metabolisable energy and attempts to increase
the digestibility of the oil fraction in the diets of chickens and ducklings. Br. Poult. Sci.
39:555–559.
71
Mateos, G. G., and J. L. Sell. 1980a. True and apparent metabolizable energy value of fat for laying
hens: Influence of level of use. Poult. Sci. 59:369–373.
Mateos, G. G., and J. L. Sell. 1980b. Influence of carbohydrate and supplemental fat source on the
metabolizable energy of the diet. Poult. Sci. 59:2129–2135.
Mateos, G. G., and J. L. Sell. 1980c. Influence of graded levels of fat on utilization of pure
carbohydrate by the laying hen. J. Nutr. 110:1894–1903.
Mateos, G. G., and J. L. Sell. 1981a. Metabolizable energy of supplemental fat as related to dietary
fat level and methods of estimation. Poult. Sci. 60:1509–1515.
Mateos, G. G., and J. L. Sell. 1981b. Nature of the extrametabolic effect of supplemental fat used
in semipurified diets for laying hens. Poult. Sci. 60:1925–1930.
Mateos, G. G., and J. L. Sell. 1981c. Influence of fat and carbohydrate source on rate of food
passage of semipurified diets for laying hens. Poult. Sci. 60:2114–2119.
Mateos, G. G., J. L. Sell, and J. A. Eastwood. 1982. Rate of food passage (transit time) as
influenced by level of supplemental fat. Poult. Sci. 61:94–100.
Mattil, K. F., and J. W. Higgins. 1945. The relationship of glyceride structure to fat digestibility:
I. Synthetic glycerides of stearic and oleic acids. J. Nutr. 29:255–260.
Menge, H., and R. E. Beal. 1973. The use of neutralized soy oil soapstock for broilers. Poult. Sci.
52:219–222.
Menge, H., C. C. Calvert, and C. A. Denton. 1965. Further studies of the effect of linoleic acid on
reproduction in the hen. J. Nutr. 86:115–119.
Miller, E. C., H. Menge, and C. A. Denton. 1963. Effects of long-term feeding of a fat-free diet to
laying hens. J. Nutr. 80:431–440.
72
Miller, B. R., G. M. Pesti, and C. C. J. Chou. 1983. Two methods of including the extra-caloric
effect of fat in minimum cost feed formulations. Poult. Sci. 62:1734–1740.
Mossab, A., J. M. Hallouis, and M. Lessire. 2000. Utilization of soy oil and tallow in young turkeys
compared with young chickens. Poult. Sci. 79:1326–1331.
Mu, H., and T. Porsgaard. 2005. The metabolism of structured triacylglycerols. Prog. Lipid Res.
44:430–448.
Muztar, A. J., S. Leeson, and S. J. Slinger. 1981. Effect of blending and level of inclusion on the
metabolizable energy of tallow and tower rapeseed soapstocks. Poult. Sci. 60:365–372.
National Research Council. 1994. Nutrient Requirements of Poultry. 9th rev. e. Natl. Acad. Press,
Washington, DC.
Nitsan, Z., A. Dvorin, Z. Zoref, and S. Mokady. 1997. Effect of added soyabean oil and dietary
energy on metabolisable and net energy of broiler diets. Br. Poult. Sci. 38:101–106.
Oluyemi, J. A., and K. O. Okunuga. 1975. The effects of dietary palm oil and energy on the
performance of white rock breeders in Nigeria. Poult. Sci. 54:305–307.
Parsons, C. M., L. M. Potter, and B. A. Bliss. 1982. True metabolizable energy corrected to
nitrogen equilibrium. Poult. Sci. 61:2241–2246.
Pérez-Bonilla, A., M. Frikha, S. Mirzaie, J. García, and G. G. Mateos. 2011. Effects of the main
cereal and type of fat of the diet on productive performance and egg quality of brown-egg
laying hens from 22 to 54 weeks of age. Poult. Sci. 90:2801–2810.
Pesti, G. M. 1984. Influence of substitution method and of food intake on bioassays to determine
metabolisable energy with chickens. Br. Poult. Sci. 25:495–504.
Pesti, G. M., R. I. Bakalli, M. Qiao, and K. G. Sterling. 2002. A comparison of eight grades of fat
as broiler feed ingredients. Poult. Sci. 81:382–390.
73
Pesti, G. M., and C. F. Smith. 1984. The response of growing broiler chickens to dietary contents
of protein, energy and added fat. Br. Poult. Sci. 25:127–138.
Pethick, D., A. Bell, and E. Annison. 1984. Fats as energy sources in animal tissues. Pages 221–
248 in Fats in Animal Nutrition. Wiseman, J., ed. Butterworth-Heinemann, London, UK.
Phan, C. T., and P. Tso. 2001. Intestinal lipid absorption and transport. Front. Biosci. 6:299–319.
Plavnik, I., E. Wax, D. Sklan, I. Bartov, and S. Hurwitz. 1997. The response of broiler chickens
and turkey poults to dietary energy supplied either by fat or carbohydrates. Poult. Sci.
76:1000–1005.
Polin, D., and T. H. Hussein. 1982. The effect of bile acid on lipid and nitrogen retention, carcass
composition, and dietary metabolizable energy in very young chicks. Poult. Sci. 61:1697–
1707.
Potter, L. M., L. D. Matterson, and E. P. Singsen. 1960. The value of corn versus fat and wheat
bran in a practical broiler ration compared to their predicted energy values. Poult. Sci.
39:1178–1182.
Preston, C. M., K. J. McCracken, and M. R. Bedford. 2001. Effect of wheat content, fat source and
enzyme supplementation on diet metabolisability and broiler performance. Br. Poult. Sci.
42:625–632.
Renner, R. 1964. Factors affecting the utilization of “carbohydrate-free” diets by the chick: I. Level
of protein. J. Nutr. 84:322–326.
Renner, R., and F. W. Hill. 1960. The utilization of corn oil, lard and tallow by chickens of various
ages. Poult. Sci. 39:849–854.
74
Rice, E. E., W. D. Warner, P. E. Mone, and C. E. Poling. 1957. Comparison of the metabolic
energy contributions of foods by growth under conditions of energy restriction. J. Nutr.
61:253–266.
Rising, R., P. M. Maiorino, J. Alak, and B. L. Reid. 1989. Indirect calorimetry evaluation of dietary
protein and animal fat effects on energy utilization of laying hens. Poult. Sci. 68:258–264.
Rising, R., P. M. Maiorino, R. Mitchell, and B. L. Reid. 1990. The utilization of calcium soaps
from animal fat by laying hens. Poult. Sci. 69:768–773.
Romero, L. F., J. S. Sands, S. E. Indrakumar, P. W. Plumstead, S. Dalsgaard, and V. Ravindran.
2014. Contribution of protein, starch, and fat to the apparent ileal digestible energy of corn-
and wheat-based broiler diets in response to exogenous xylanase and amylase without or with
protease. Poult. Sci. 93:2501–2513.
Russell, W. C., M. W. Taylor, H. A. Walker, and L. J. Polskin. 1942. The absorption and retention
of carotene and vitamin A by hens on normal and low fat rations: One figure. J. Nutr. 24:199–
211.
Sanz, M., A. Flores, and C. J. Lopez-Bote. 2000. The metabolic use of energy from dietary fat in
broilers is affected by fatty acid saturation. Br. Poult. Sci. 41:61–68.
Scragg, R. H., N. B. Logan, and N. Geddes. 1987. Response of egg weight to the inclusion of
various fats in layer diets. Br. Poult. Sci. 28:15–21.
Sell, J. L., and G. C. Hodgson. 1962. Comparative value of dietary rapeseed oil, sunflower seed
oil, soy oil and animal tallow for chickens. J. Nutr. 76:113–118.
Sell, J. L., A. Krogdahl, and N. Hanyu. 1986. Influence of age on utilization of supplemental fats
by young turkeys. Poult. Sci. 65:546–554.
75
Sell, J. L., and W. J. Owings. 1981. Supplemental fat and metabolizable energy-to-nutrient ratios
for growing turkeys. Poult. Sci. 60:2293–2305.
Sell, J. L., L. G. Tenesaca, and G. L. Bales. 1979. Influence of dietary fat on energy utilization by
laying hens. Poult. Sci. 58:900–905.
Serna-Saldivar, S. 2010. Chemical composition of cereal grains. Pages 81–108 in Cereal Grains:
Properties, Processing, and Nutritional Attributes. CRC Press, Boca Raton, FL.
Shafey, T. M., J. G. Dingle, and M. W. McDonald. 1992. Comparison between wheat, triticale,
rye, soyabean oil and strain of laying bird on the production, and cholesterol and fatty acid
contents of eggs. Br. Poult. Sci. 33:339–346.
Shannon, D. W. F. 1971. The effect of level of intake and free fatty acid content on the
metabolizable energy value and net absorption of tallow by the laying hen. J. Agric. Sci.
76:217–221.
Sharifi, S. D., A. Dibamehr, H. Lotfollahian, and B. Baurhoo. 2012. Effects of flavomycin and
probiotic supplementation to diets containing different sources of fat on growth performance,
intestinal morphology, apparent metabolizable energy, and fat digestibility in broiler
chickens. Poult. Sci. 91:918–927.
Sheppard, A. J., J. C. Fritz, W. H. Hooper, T. Roberts, W. D. Hubbard, A. R. Prosser, and J. W.
Boehne. 1971. Crambe and rapeseed oils as energy sources for rats and chicks and some
ancillary data on organ weights and body cavity fat composition. Poult. Sci. 50:79–84.
Shutze, J. V, and L. S. Jensen. 1963. Influence of linoleic acid on egg weight. Poult. Sci. 42:921–
924.
Sibbald, I. R. 1975. The effect of level of feed intake on metabolizable energy values measured
with adult roosters. Poult. Sci. 54:1990–1997.
76
Sibbald, I. R. 1977. The true metabolizable energy values for poultry of rapeseed and of the meal
and oil derived therefrom. Poult. Sci. 56:1652–1656.
Sibbald, I. R. 1978a. The true metabolizable energy values of mixtures of tallow with either soy
oil or lard. Poult. Sci. 57:473–477.
Sibbald, I. R. 1978b. The effect of the age of the assay bird on the true metabolizable energy values
of feedingstuffs. Poult. Sci. 57:1008–1012.
Sibbald, I. R., and J. K. G. Kramer. 1977. The true metabolizable energy values of fats and fat
mixtures. Poult. Sci. 6:2079–2086.
Sibbald, I. R., and J. K. G. Kramer. 1978. The effect of the basal diet on the true metabolizable
energy value of fat. Poult. Sci. 57:685–691.
Sibbald, I. R., and J. K. G. Kramer. 1980a. The effect of the basal diet on the utilization of fat as a
source of true metabolizable energy, lipid, and fatty acids. Poult. Sci. 59:316–324.
Sibbald, I. R., and J. K. G. Kramer. 1980b. The effects of fractions of yellow corn on the true
metabolizable energy value of beef tallow. Poult. Sci. 59:1505–1509.
Sibbald, I. R., and K. Price. 1977. The effects of level of dietary inclusion and of calcium on the
true metabolizable energy values of fats. Poult. Sci. 56:2070–2078.
Sibbald, I. R., and K. Price. 1978. The metabolic and endogenous energy losses of adult roosters.
Poult. Sci. 57:556–557.
Sibbald, I. R., and S. J. Slinger. 1962. Factors affecting the metabolizable energy content of poultry
feeds: 9. Sodium chloride. Poult. Sci. 41:573–578.
Sibbald, I. R., S. J. Slinger, and G. C. Ashton. 1961. Factors affecting the metabolizable energy
content of poultry feeds: 2. Variability in the M.E. values attributed to samples of tallow, and
undegummed soy oil. Poult. Sci. 40:303–308.
77
Sibbald, I. R., S. J. Slinger, and G. C. Ashton. 1962. The utilization of a number of fats, fatty
materials and mixtures thereof evaluated in terms of metabolizable energy, chick weight gains
and gain:feed ratios. Poult. Sci. 41:46–61.
Sibbald, I. R., and S. J. Slinger. 1963. A biological assay for metabolizable energy in poultry feed
ingredients together with findings which demonstrate some of the problems associated with
the evaluation of fats. Poult. Sci. 42:313–325.
Sibbald, I. R., J. D. Summers, and S. J. Slinger. 1960. Factors affecting the metabolizable energy
content of poultry feeds. Poult. Sci. 39:544–556.
Siedler, A. J., H. E. Scheid, and B. S. Schweigert. 1955. Effects of different grades of animal fats
on the performance of chicks. Poult. Sci. 34:411–414.
Smink, W., W. J. J. Gerrits, R. Hovenier, M. J. H. Geelen, H. W. J. Lobee, M. W. A. Verstegen,
and A. C. Beynen. 2008. Fatty acid digestion and deposition in broiler chickens fed diets
containing either native or randomized palm oil. Poult. Sci. 87:506–513.
Squibb, R. L. 1971. Estimating the metabolizable energy of foodstuffs with an avian model. J.
Nutr. 101:1211–1215.
Squires, E. J., E. V. Valdes, J. Wu, and S. Leeson. 1991. Research note: Utility of the thiobarbituric
acid test in the determination of the quality of fats and oils in feeds. Poult. Sci. 70:180–183.
Sulistiyanto, B., Y. Akiba, and K. Sato. 1999. Energy utilisation of carbohydrate, fat and protein
sources in newly hatched broiler chicks. Br. Poult. Sci. 40:653–659.
Sunde, M. L. 1956. The effect of fats and fatty acids in chick rations. Poult. Sci. 35:362–368.
Tancharoenrat, P., V. Ravindran, F. Zaefarian, and G. Ravindran. 2014. Digestion of fat and fatty
acids along the gastrointestinal tract of broiler chickens. Poult. Sci. 93:371–379.
78
Thomas, D. V, V. Ravindran, and G. Ravindran. 2008. Nutrient digestibility and energy utilisation
of diets based on wheat, sorghum or maize by the newly hatched broiler chick. Br. Poult. Sci.
49:429–435.
Treat, C. M., B. L. Reid, R. E. Davies, and J. R. Couch. 1960. Effect of animal fat and mixtures of
animal and vegetable fats containing varying amounts of free fatty acids on performance of
cage layers. Poult. Sci. 39:1550–1555.
Turner, K. A., T. J. Applegate, and M. S. Lilburn. 1999. Effects of feeding high carbohydrate or
fat diets. 2. Apparent digestibility and apparent metabolizable energy of the posthatch poult.
Poult. Sci. 78:1581–1587.
Valdes, E. V, and S. Leeson. 1994a. Measurement of metabolizable energy, gross energy, and
moisture in feed grade fats by near infrared reflectance spectroscopy. Poult. Sci. 73:163–171.
Valdes, E. V, and S. Leeson. 1994b. Determination of metabolizable energy of feed grade fats
based on the application of near infrared reflectance to the multilevel test diets. Poult. Sci.
73:172–178.
Vanschoubroek, F., G. Vermeersch, and R. De Schrijver. 1971. A comparison of the effect of lard
and soyabean oil on food and water intake, body weight, food conversion efficiency and
mortality of broiler chicks. Poult. Sci. 50:495–501.
Vermeersch, G., and F. Vanschoubroek. 1968. The quantification of the effect of increasing levels
of various fats on body weight gain, efficiency of food conversion and food intake of growing
chicks. Br. Poult. Sci. 9:13–30.
Vieira, S. L., A. M. Penz, A. M. Kessler, and J. V Ludke. 1997. Broiler utilization of diets
formulated with high oil corn and energy from fat. J. Appl. Poult. Res. 6:404–409.
79
Vilà, B., and E. Esteve-Garcia. 1996a. Studies on acid oils and fatty acids for chickens. I. Influence
of age, rate of inclusion and degree of saturation on fat digestibility and metabolisable energy
of acid oils. Br. Poult. Sci. 37:105–117.
Vilà, B., and E. Esteve-Garcia. 1996b. Studies on acid oils and fatty acids for chickens. II. Effect
of free fatty acid content and degree of saturation of free fatty acids and neutral fat on fatty
acid digestibility. Br. Poult. Sci. 37:119–130.
Vilà, B., and E. Esteve-Garcia. 1996c. Studies on acid oils and fatty acids for chickens. III. Effect
of chemical composition on metabolisable energy of by-products of vegetable oil refining.
Br. Poult. Sci. 37:131–144.
Vilarrasa, E., A. Tres, L. Bayés-García, T. Parella, E. Esteve-Garcia, and A. C. Barroeta. 2014.
Re-esterified palm oils, compared to native palm oil, do not alter fat absorption, postprandial
lipemia or growth performance in broiler chicks. Lipids 49:795–805.
Waldroup, P. W., S. E. Watkins, and E. A. Saleh. 1995. Comparison of two blended animal-
vegetable fats having low or high free fatty acid content. J. Appl. Poult. Res. 4:41–48.
Wan, P. 2000. Properties of fats and oils. Pages 20–48 in Introduction to Fats and Oils
Technologies. O’Brien, R., Farr, W., Wan, P., eds. 2nd ed. AOCS Press, Champaign, IL.
Whitehead, C. C. 1981. The response of egg weight to the inclusion of different amounts of
vegetable oil and linoleic acid in the diet of laying hens. Br. Poult. Sci. 22:525–532.
Whitehead, C. C. 1984. Essential fatty acids in poultry nutrition. Pages 150–166 in Fats in Animal
Nutrition. Wiseman, J., ed. Butterworth-Heinemann, London, UK.
Whitehead, C. C., A. S. Bowman, and H. D. Griffin. 1991. The effects of dietary fat and bird age
on the weights of eggs and egg components in the laying hen. Br. Poult. Sci. 32:565–574.
80
Whitehead, C. C., A. S. Bowman, and H. D. Griffin. 1993. Regulation of plasma oestrogen by
dietary fats in the laying hen: Relationships with egg weight. Br. Poult. Sci. 34:999–1010.
Whitehead, C. C., W. A. Dewar, and J. N. Downie. 1971. Effect of dietary fat on mineral retention
in the chick. Br. Poult. Sci. 12:249–254.
Whitehead, G. C., and C. Fisher. 1975. The utilisation of various fats by turkeys of different ages.
Br. Poult. Sci. 16:481–485.
Whitson, D., C. W. Carrick, R. E. Roberts, and S. M. Hauge. 1943. Utilization of fat by chickens—
a method for determining the absorption of nutrients. Poult. Sci. 22:137–141.
Wiseman, J., D. J. A. Cole, F. G. Perry, B. G. Vernon, and B. C. Cooke. 1986. Apparent
metabolisable energy values of fats for broiler chicks. Br. Poult. Sci. 27:561–576.
Wiseman, J., and M. Lessire. 1987a. Interactions between fats of differing chemical content:
Apparent availability of fatty acids. Br. Poult. Sci. 28:677–691.
Wiseman, J., and M. Lessire. 1987b. Interactions between fats of differing chemical content:
Apparent metabolisable energy values and apparent fat availability. Br. Poult. Sci. 28:663–
676.
Wiseman, J., J. Powles, and F. Salvador. 1998. Comparison between pigs and poultry in the
prediction of the dietary energy value of fats. Anim. Feed Sci. Technol. 71:1–9.
Wiseman, J., and F. Salvador. 1989. Influence of age, chemical composition and rate of inclusion
on the apparent metabolisable energy of fats fed to broiler chicks. Br. Poult. Sci. 30:653–662.
Wiseman, J., and F. Salvador. 1991. The influence of free fatty acid content and degree of
saturation on the apparent metabolizable energy value of fats fed to broilers. Poult. Sci.
70:573–582.
81
Wiseman, J., F. Salvador, and J. Craigon. 1991. Prediction of the apparent metabolizable energy
content of fats fed to broiler chickens. Poult. Sci. 70:1527–1533.
Wolynetz, M. S., and I. R. Sibbald. 1984. Relationships between apparent and true metabolizable
energy and the effects of a nitrogen correction. Poult. Sci. 63:1386–1399.
Yoshida, M., and H. Morimoto. 1970. Biological assay of available energy with growing chicks.
Agric. Biol. Chem. 34:684–691.
Young, R. J. 1961. The energy value of fats and fatty acids for chicks: I. Metabolizable energy.
Poult. Sci. 40:1225–1233.
Young, R. J., and N. R. Artman. 1961. The energy value of fats and fatty acids for chicks: 2.
Evaluated by controlled feed intake. Poult. Sci. 40:1653–1662.
Young, R. J., and R. L. Garrett. 1963. Effect of oleic and linoleic acids on the absorption of
saturated fatty acids in the chick. J. Nutr. 81:321–329.
Young, R. J., R. L. Garrett, and M. Griffith. 1963. Factors affecting the absorbability of fatty acid
mixtures high in saturated fatty acids. Poult. Sci. 42:1146–1154.
Zaefarian, F., L. F. Romero, and V. Ravindran. 2013. Influence of a microbial phytase on the
performance and the utilisation of energy, crude protein and fatty acids of young broilers fed
on phosphorus-adequate maize and wheat-based diets. Br. Poult. Sci. 54:653–660.
Zelenka, J. 1968. Influence of the age of chicken on the metabolisable energy values of poultry
diets. Br. Poult. Sci. 9:135–142.
Zhang, B., L. Haitao, D. Zhao, Y. Guo, and A. Barri. 2011. Effect of fat type and
lysophosphatidylcholine addition to broiler diets on performance, apparent digestibility of
fatty acids, and apparent metabolizable energy content. Anim. Feed Sci. Technol. 163:177–
184.
82
Zhong, X., S. Gao, J. J. Wang, L. Dong, J. Huang, L. L. Zhang, and T. Wang. 2014. Effects of
linseed oil and palm oil on growth performance, tibia fatty acid and biomarkers of bone
metabolism in broilers. Br. Poult. Sci. 55:335–342.
Zollitsch, W., W. Knaus, F. Aichinger, and F. Lettner. 1997. Effects of different dietary fat sources
on performance and carcass characteristics of broilers. Anim. Feed Sci. Technol. 66:63–73.
Zumbado, M. E., C. W. Scheele, and C. Kwakernaak. 1999. Chemical composition, digestibility,
and metabolizable energy content of different fat and oil by-products. J. Appl. Poult. Res.
8:263–271.
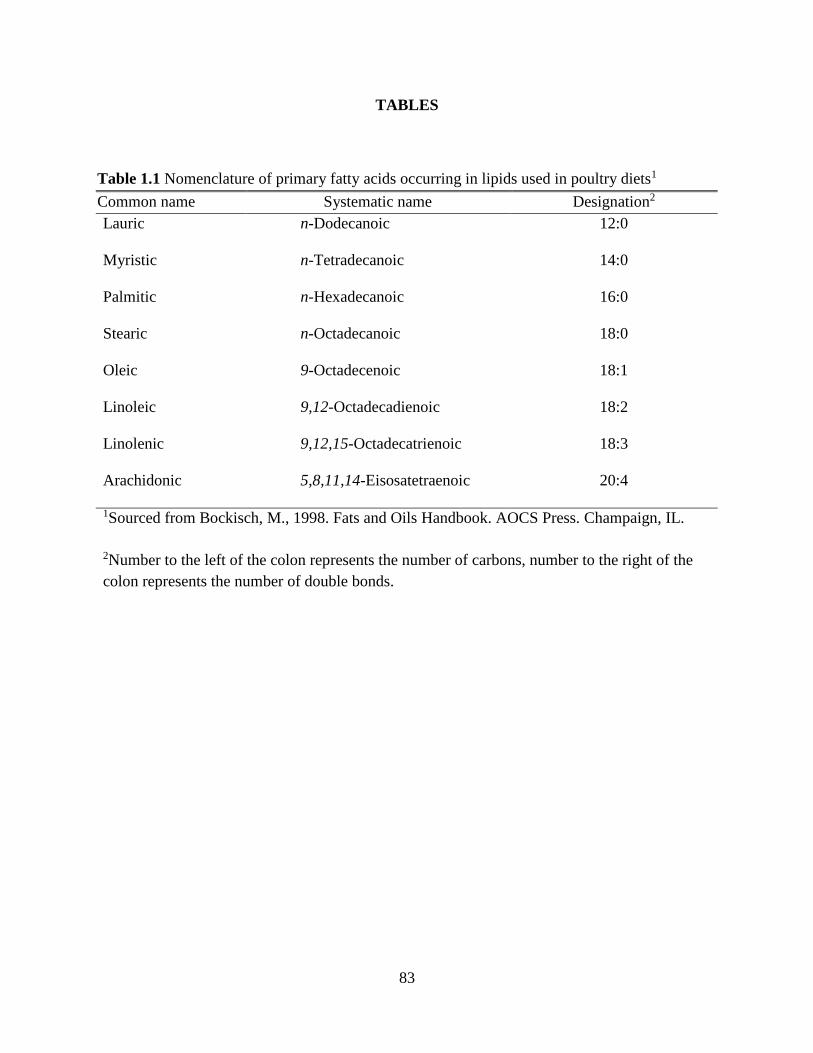
83
TABLES
Table 1.1 Nomenclature of primary fatty acids occurring in lipids used in poultry diets1
Common name Systematic name Designation2
Lauric n-Dodecanoic 12:0
Myristic n-Tetradecanoic 14:0
Palmitic n-Hexadecanoic 16:0
Stearic n-Octadecanoic 18:0
Oleic 9-Octadecenoic 18:1
Linoleic 9,12-Octadecadienoic 18:2
Linolenic 9,12,15-Octadecatrienoic 18:3
Arachidonic 5,8,11,14-Eisosatetraenoic 20:4
1Sourced from Bockisch, M., 1998. Fats and Oils Handbook. AOCS Press. Champaign, IL.
2Number to the left of the colon represents the number of carbons, number to the right of the
colon represents the number of double bonds.
84
CHAPTER 2
DEVELOPMENT OF THE SLOPE-RATIO PRECISION-FED ROOSTER ASSAY FOR
ESTIMATING RELATIVE METABOLIZABLE ENERGY VALUES OF FATS AND
OILS
ABSTRACT
Six experiments were conducted to determine if the precision-fed rooster assay could be
combined with a slope-ratio type assay to generate useful information on the nitrogen-corrected
true metabolizable energy (TMEn) content of fats and oils (lipids) for poultry. In Experiment 1,
refined corn oil batch 1 (RCO1) was fed to both conventional (CONV) and cecectomized (CEC)
roosters at 0, 5, 10, 15, and 20% of a ground corn diet. Lipids were fed at 0, 5, and 10% in a ground
corn diet to CONV roosters in Experiments 2 through 6. Palomys® (a novel lipid source),
stearidonic (SDA) soybean (soy) oil, three commercial animal/vegetable (A/V) blends (A/V blend
1, 2 and 3) and corn oil from distillers dried grains with solubles (DDGS) were evaluated. The
RCO1, refined soy oil, and refined corn oil batch 2 (RCO2) were used as the reference lipid source
in Experiments 2 through 6. Multiple linear regression was conducted with TMEn of diets
regressed on supplemental lipid level and relative bioavailability values (RBV) were calculated as
the regression coefficient of the test lipid divided by the regression coefficient of the reference
lipid (RCO1, RCO2, or soy oil). RCO1 was found to be a suitable reference material for use in the
slope-ratio method as TMEn linearly increased up to 20% RCO1 inclusion in Experiment 1.
Furthermore, there were no significant differences in TMEn of RCO1 between CONV and CEC
bird types. Palomys® was found to have a lower (P < 0.05) RBV than RCO1. There were no
significant difference between SDA soy oil and refined soy oil. The RBV of A/V blend 2 was
lower (P < 0.05) than RCO1, while the RBV of A/V blend 1 was not significantly different than
85
RCO1. The RBV of DDGS corn oil was higher (P < 0.05) than RCO1. The A/V blend 3 was lower
(P < 0.001) than RCO2; however, an interaction (P < 0.01) between lipid type and lipid
supplementation level was observed, indicating that the RBV for A/V blend 3 may underestimate
its available energy at low levels of inclusion. These results indicate that the combination of the
precision-fed rooster assay with the slope-ratio method was able to detect differences among lipid
types. The importance of a high quality reference material for the slope-ratio method was
demonstrated. The TMEn of one lipid source was affected by inclusion level, and this effect, if
occurring, needs to be considered when interpreting the results of the slope-ratio precision-fed
rooster assay.
INTRODUCTION
Lipids are important components of poultry diets due to being sources of essential nutrients
(Gurr, 1984; Whitehead, 1984) and concentrated energy (Leeson and Summers, 2001). As not all
lipid sources are utilized equally well, methods to estimate available energy are needed. The most
commonly used measure of available energy in feed ingredients is metabolizable energy (ME)
(National Research Council, 1994); however, the generation and interpretation of ME values for
lipids can be influenced and confounded by many factors. Some of the major factors include the
inability to feed lipids without a basal diet as a carrier (Sibbald, 1975), synergistic interactions
among supplemental lipids and both lipid and non-lipid containing components of the basal diet
(Sibbald and Kramer, 1978, 1980; Lessire et al., 1982), impacts of lipid supplementation on rate
of passage of intestinal contents (Mateos and Sell, 1980b; Mateos et al., 1982), variation of ME
values with level of lipid inclusion (Halloran and Sibbald, 1979; Wiseman and Salvador, 1989,
1991; Dei et al., 2006), and variation of ME values with the age of the assay bird (Laurin et al.,
1985; Wiseman and Salvador, 1989; Bourdillon et al., 1990). Due to the correction for endogenous
86
energy losses, TMEn values for lipids tend to exceed their gross energies more frequently than
nitrogen-corrected apparent metabolizable energy (AMEn) values (Mateos and Sell, 1980a),
making TMEn values of lipids of limited practical use. Slope-ratio type assays have yielded useful
relative bioavailability information for many nutrients that have proven difficult to measure in
absolute values or have presented other challenges (Ammerman et al., 1995). Therefore, the
objective of the following studies was to develop a slope-ratio assay that would yield relative
TMEn bioavailability values for lipids that would be more useful for practical feed formulation
and would also allow for the detection and quantification of inferior lipid sources.
MATERIALS AND METHODS
The protocols used in conducting these experiments were approved by the Institutional
Animal Care and Use Committee of the University of Illinois at Urbana-Champaign.
Experimental design
Six experiments were conducted with fairly similar designs that determined TMEn via the
precision-fed rooster assay (Parsons et al., 1982). All diets consisted of ground corn with lipids
added at varying levels at the expense of ground corn. In Experiment 1, RCO1 was fed at 0, 5, 10,
15, and 20% of the diet to both CONV and CEC roosters with 4 roosters per treatment. In all other
experiments, lipids were fed at 0, 5, and 10% of the diet to CONV roosters only. In Experiment 2,
soy oil and Palomys® were fed with 5 roosters per treatment. In Experiment 3, soy oil and SDA
soy oil were fed with 8 roosters per treatment. In Experiment 4, RCO1, A/V blend 1, and A/V
blend 2 were fed with 4 roosters per treatment. In Experiment 5, RCO1 and DDGS corn oil were
fed with 4 roosters per treatment. In Experiment 6, RCO2 and A/V blend 3 were fed with 4 roosters
per treatment.
87
The reference lipids, RCO1, RCO2, and refined soy oil, were obtained from a commercial
grocery retail outlet. Palomys® (Elanco Animal Health, Greenfield, IN) is a vegetable-based lipid
rich in medium chain fatty acids. The SDA soy oil (Monsanto Company, St. Louis, MO) contains
higher levels of the polyunsaturated stearidonic fatty acid than regular soy oil. The A/V blend 1,
A/V blend 2, and A/V blend 3 were commercially produced blends for use in poultry production.
The DDGS corn oil originated from an ethanol plant of unknown location.
Treatment diets were tube-fed to adult Single Comb White Leghorn roosters according to
the general methods of Sibbald and Wolynetz (1986). Briefly, roosters were housed individually
in cages with wire floors in an environmentally controlled room with a 16 hour light to 8 hour dark
cycle and had ad libitum access to water. Roosters were fasted for 26 h to allow their digestive
tracts to empty, and then were then tube-fed 30 g of diet, returned to their individual cages, and
excreta (feces plus urine) were quantitatively collected for 48 hours on plastic trays.
Chemical Analysis
The collected excreta were frozen, freeze-dried, weighed, and ground in a coffee grinder
to pass through a 14 mesh screen. Subsamples of lipids, excreta, and feed samples were analyzed
according to procedures of the Association of Official Analytical Chemists International (AOAC
International, 2006). Lipids, feed, and excreta were analyzed for gross energy in an adiabatic
bomb calorimeter (Model 1261, Parr Instruments, Moline, IL) that had been standardized with
benzoic acid. Excreta and feed were analyzed for total nitrogen via combustion (AOAC
International, 2006; method 990.03). Feed samples were also analyzed for dry matter (AOAC
International, 2006; method 934.01). The excreta and feed from birds fed RCO1 in Experiment 4
were analyzed for acid hydrolyzed ether extract (AOAC International, 2006; method 922.06).
88
Statistical Analysis
The TMEn of the diets was calculated according to Parsons et al. (1982), and the TMEn of
the lipids were calculated by difference using the formula presented by Han et al. (1976). The RBV
for each test lipid was calculated as the regression coefficient of the test lipid divided by the
regression coefficient of the reference lipid (Littell et al., 1995). The standardized lipid digestibility
of RCO1 was calculated as the mg of lipid ingested minus the mg of lipid excreted, all divided by
the mg of lipid ingested, and was corrected for the mg of lipid excreted by roosters fed the corn
carrier only.
Each experiment was analyzed individually using the GLM or REG Procedures of SAS
(SAS Institute Inc, 2011). Multiple linear regression of TMEn (Y) on supplemental lipid inclusion
level (X) was conducted according to the methods of Littell et al. (1995, 1997) for the slope-ratio
method. Pair-wise comparisons were made between the regression coefficients of test lipids and
the reference lipid using the coding of Littell et al. (1995) to determine if test lipids were
significantly different than the reference lipid (refined corn oil (RCO) or soy oil). It was assumed
that if regression coefficients were significantly different then RBV were also significantly
different as the RBV is simply a ratio of the test coefficients (Littell et al., 1995). All experiments
were completely randomized designs and were analyzed as factorials. Experiment 1 was a 2 x 5
factorial and had bird type (CONV and CEC) and RCO1 level (0, 5, 10, 15, 20%) as factors.
Experiments 2, 3, 5, and 6 were 2 x 2 factorials with lipid source and lipid level (5 and 10%) as
factors. Experiment 4 was a 3 x 2 factorial with lipid type and lipid level (5 and 10%) as factors.
Tukey’s Multiple Comparison Test was used to separate means unless otherwise noted. Statistical
significance was accepted at a probability of P < 0.05. Influential outliers were identified using
the Diagnostic Plots of the GLM Procedure with the Unpack and Label options of SAS. Cook’s D
89
test was used as an objective measure of outlier influence (Cook, 1977). Outlying data points were
removed if careful analysis of the original data revealed a methodological or biological explanation
for the aberrant data according to described methods (Freund and Littell, 2000).
RESULTS AND DISCUSSION
Experiment 1
The results of Experiment 1 are presented in Figures 2.1 and 2.2. The TMEn of one CONV
rooster fed 0% RCO1 was identified as an influential outlier and was removed from the analysis
due to abnormally low excreta weight. Low excreta weight can be explained in part by incomplete
clearance of the digestive tract by the rooster or excreta being lost during the collection process
(Dale et al., 1985). No interactions between bird type and level were significant (P > 0.05), and
there was no significant main effect of bird type (P > 0.05). This indicates that CONV and CEC
roosters utilized RCO1-containing diets equally well. In addition, to our knowledge these are the
first data on lipid utilization in the CEC rooster that have been published. These results further
suggest that either CONV or CEC roosters can be used to evaluate lipid utilization, at least for
highly utilized lipids. This is important for a laboratory such as ours wherein both types of birds
are present and one type may not be available as soon as another for a particular experiment.
Further validation with lipids of lower quality than refined vegetable oils may be needed before
CEC and CONV birds may be used interchangeably. As expected, there was a significant main
effect of RCO1 inclusion level (P < 0.001) with TMEn of the diet increasing as RCO1 inclusion
increased. Simple linear regression of TMEn of the diet on RCO1 inclusion yielded R2 values of
0.97 and 0.96 for CONV and CEC roosters, respectively.
90
The TMEn values of the RCO1 in Experiment 1 that were calculated by difference (Figure
2.2) were all in excess of the gross energy of RCO1 (9.469 kcal/g); thus substantial extra metabolic
effects (EME) were observed for RCO1 when assayed for TMEn. Similar results for corn oil have
been reported by others (Dale and Fuller, 1981, 1982). The extent of the EME tended to decrease
with increasing inclusion as has been reported previously (Sibbald and Price, 1977; Sibbald and
Kramer, 1980). Contradictory to expectations, TMEn values for the RCO1 were above the gross
energy of RCO1 for all levels of inclusion, whereas most published data only demonstrate large
EME at inclusion levels of 5% or lower (Sibbald and Price, 1977; Sibbald and Kramer, 1978;
Halloran and Sibbald, 1979).
The results of this experiment indicate that TMEn responds to RCO1 inclusion in a linear
fashion up to at least 20% of the corn diet regardless of bird type, and thus RCO and probably
similar vegetable-based oils are suitable as reference lipids in a slope-ratio type assay.
Furthermore, the high lipid TMEn values observed verify that EME are occurring in this assay,
and provide evidence that the conditions of the assay are allowing the lipid to be highly utilized.
Experiment 2
The results of Experiment 2 are presented in Table 2.1. The TMEn of one rooster fed 0%
RCO1 was identified as an influential outlier and was removed from the analysis due to abnormally
low excreta weight. Palomys® yielded lower (P < 0.05) TMEn values for the diets than for soy oil
as demonstrated by both the main effect of lipid type and the comparison of regression coefficients.
The R2 of the multiple regression was 0.95, indicating excellent linearity of TMEn as lipid level
increased. The RBV value of 87% for Palomys® was lower than soy oil, which indicates that
though not as good as soy oil, Palomys® is still highly utilized. As Palomys® contains much
higher levels of saturated fatty acids than soy oil, the moderate difference may be due to saturation
91
level. Reductions in available energy content of lipids have been reported due to increased
saturation (Duckworth et al., 1950; Halloran and Sibbald, 1979). The TMEn values of the lipids
were predominantly in excess of their gross energies, again indicating EME, though this was most
pronounced for soy oil.
Experiment 3
The results of Experiment 3 are presented in Table 2.2. The TMEn values of three roosters
were identified as influential outliers and were removed from the analysis. One rooster fed 10%
SDA soy oil had an abnormally low excreta weight. One additional rooster fed 10% SDA soy oil
and one rooster fed 10% soy oil had abnormally high excreta weights and gross energies, indicating
possible undetected regurgitation. There were no significant differences between lipid types for
either the factorial or slope-ratio regression calculation methods. The RBV of 100% indicated that
SDA soy oil is equivalent to soy oil as an energy source. This is as might be expected, as there are
only minor differences between the two lipid types in characteristics such as degree of saturation
that largely determine available energy content (Huyghebaert et al., 1988; Ketels and De Groote,
1989). All TMEn values of the lipids were in excess of their gross energies.
Experiment 4
The results of Experiment 4 are presented in Tables 2.3 and 2.4. The TMEn of A/V blend
2 was lower (P < 0.05) than RCO1 as determined by the main effect of lipid type and comparison
of the regression coefficients. The A/V blend 1 was not different than RCO1 by either calculation
method. The RBV of 79% for A/V blend 2 indicates that this lipid type may not be ideal for use in
poultry diets, while the RBV of 102% for A/V blend 1 indicates that it is an excellent source of
available energy. These results agree well with findings that the available energy content of
92
blended lipid sources can vary widely (Pesti et al., 2002). The TMEn values of the lipids were only
in excess of the gross energies of the lipids for RCO1 and A/V blend 1.
The standardized lipid digestibility of RCO1 (Table 2.4) was consistently high, indicating
almost complete absorption of RCO1 from the intestine. Calculating the TMEn of RCO1 from the
digestibility data gives an objective way of transforming the RBV values of test lipids to actual
energy values. For example, the RBV of A/V blend 2 was 79% of RCO1. The calculated
digestibility TMEn value of RCO1 is approximately 9.3 kcal/g. Thus, 9.3 kcal/g multiplied by 0.79
yields an estimated TMEn of 7.3 kcal/g for A/V blend 2.
Experiment 5
The results of Experiment 5 are presented in Table 2.5. The TMEn of one rooster fed 10%
DDGS corn oil was identified as an influential outlier and was removed from the analysis due to
abnormally low excreta weight. The available energy content of DDGS corn oil was higher (P <
0.05) than for RCO1 regardless of calculation method. The latter difference was mostly due to the
lower TMEn values for the RCO1 in this experiment compared to the earlier experiments. Since
this was the same batch of RCO as was used in Experiment 4, the decrease in TMEn seen in
Experiment 5 was unexpected. Since this batch of RCO had been used for several experiments
over the course of a number of months, concerns of oxidative rancidity that may have reduced the
available energy content of RCO1, such as has been observed by Squires et al. (1991); prompted
the use of a new batch (batch 2) of RCO (RCO2) for subsequent experiments. The results of
Experiment 6 tend to support the hypothesis of rancidity of RCO1. This demonstrates that one
shortcoming of this assay method is that any changes in the available energy content of the
reference lipid will impact the results dramatically; however, using a reference lipid that has been
stored for minimal amounts of time should prevent this problem, and analytical tests can detect
93
rancidity if suspected (Wan, 2000; Gunstone, 2008). Only the TMEn lipid values of the DDGS
corn oil were in excess of its gross energy.
Experiment 6
The results of Experiment 6 are presented in Table 2.6. The TMEn of one rooster fed 5%
RCO2 was identified as an influential outlier and was removed from the analysis due to abnormally
high excreta weight. The TMEn of one rooster fed 10% A/V blend 3 was removed for the same
reason. There was a significant (P < 0.01) lipid type by lipid level interaction. This seems to be
due to a reduction in TMEn at the 10% level of A/V blend 3 compared to the 5% level, and may
indicate that this sample has high levels of free fatty acids (Shannon, 1971; Wiseman et al., 1991).
The decrease with inclusion rate may also be attributed to decreases in the EME as inclusion rate
increases as has been reported previously for some lipid types (Sibbald and Price, 1977; Sibbald
and Kramer, 1980). Despite the interaction, the statistical assumptions of the slope-ratio were still
met; however, if the interaction had been slightly more pronounced the assumptions would not
have held. The RBV of A/V blend 3 was lower (P < 0.001) than RCO2; however, the RBV of 84%
may underestimate the energy value of A/V blend at levels of inclusion of 5% or less. Indeed, the
TMEn of the 5% A/V blend 3 diet was actually numerically higher than the 5% RCO2 diet. The
use of a standard curve approach (Littell et al., 1995) may be useful in instances where there are
significant interactions between lipid type and lipid supplementation level, as this method could
be used to obtain relative energy estimates at each supplementation level. Only the TMEn lipid
value of the 10% A/V blend 3 failed to exceed its gross energy.
94
Conclusion
Cecectomy had no impact on the TMEn of RCO1, though further work is needed with other
lipid sources to fully elucidate the effects of cecectomy on the utilization of lipids. If cecectomy
has no effect on lipid utilization as is expected, this would allow greater flexibility for laboratories
such as ours that contain both CONV and CEC bird types. In general, results from the various lipid
sources were consistent with published literature, indicating that the assay yielded accurate results.
The overall design of two non-zero levels of supplemental lipid seems to be generally satisfactory,
though with some lipid sources where there may be an interaction between supplemental lipid and
lipid type, having greater than two non-zero levels of supplemental lipid may yield more clear
results. Either RCO or soy oil are suitable as reference standards for use in this assay; however,
care must be taken to ensure the quality of the reference standard. Considerable EME were
observed, indicating that this phenomenon does occur with some predictability in the precision-
fed rooster assay. The use of RBV enhanced the value of the results by reducing the impacts of the
EME, and the use of digestibility data allows the RBV to be objectively translated into absolute
energy terms. Though the precision-fed rooster assay is not ideal for the generation of absolute
energy values for lipids, the slope-ratio modification of this assay provides an excellent way for
inferior lipids to be identified, and may be of considerable benefit to commercial poultry producers
in the future.
95
LITERATURE CITED
Ammerman, C. B., D. H. Baker, and A. J. Lewis (Eds). 1995. Bioavailability of Nutrients for
Animals. Academic Press, San Diego, CA.
AOAC International. 2006. Official Methods of Analysis. 18th ed. Assoc. AOAC Int.,
Gaithersburg, MD.
Bourdillon, A., B. Carré, L. Conan, M. Francesch, M. Fuentes, G. Huyghebaert, W. Janssen, B.
Leclercq, M. Lessire, J. McNab, M. Rigoni, and J. Wiseman. 1990. European reference
method of in vivo determination of metabolisable energy in poultry: Reproducibility, effect
of age, comparison with predicted values. Br. Poult. Sci. 31:567–576.
Cook, R. D. 1977. Detection of influential observations in linear regression. Technometrics 19:15–
18.
Dale, N. M., and H. L. Fuller. 1981. Effect of carrier on the true metabolizable energy of corn oil.
Poult. Sci. 60:1504–1508.
Dale, N. M., and H. L. Fuller. 1982. True metabolizable energy of fats at low level dietary
inclusion. Poult. Sci. 61:2415–2420.
Dale, N. M., H. L. Fuller, G. M. Pesti, and R. D. Phillips. 1985. Freeze drying versus oven drying
of excreta in true metabolizable energy, nitrogen-corrected true metabolizable energy, and
true amino acid availability bioassays. Poult. Sci. 64:362–365.
Dei, H. K., S. P. Rose, and A. M. MacKenzie. 2006. Apparent metabolisable energy and
digestibility of shea (Vitellaria paradoxa) fat, cocoa (Theobroma cacao) fat and soybean oil
in broiler chicks. Br. Poult. Sci. 47:607–612.
Duckworth, J., J. M. Naftalin, and A. C. Dalgarno. 1950. The digestibility of linseed oil and mutton
fat by chicks. J. Agric. Sci. 40:39–43.
96
Freund, R., and R. C. Littell. 2000. SAS Systems for Regression. 3rd ed. SAS Institute Inc., Cary,
NC.
Gunstone, F. 2008. Analytical parameters. Pages 37–58 in Fats and Oils in the Food Industry.
Blackwell Publishing Ltd, West Sussex, UK.
Gurr, M. 1984. The chemistry and biochemistry of plant fats and their nutritional importance.
Pages 3–22 in Fats in Animal Nutrition. Wiseman, J., ed. Butterworth-Heinemann, London,
UK.
Halloran, H. R., and I. R. Sibbald. 1979. Metabolizable energy values of fats measured by several
procedures. Poult. Sci. 58:1299–1307.
Han, I. K., H. W. Hochstetler, and M. L. Scott. 1976. Metabolizable energy values of some poultry
feeds determined by various methods and their estimation using metabolizability of the dry
matter. Poult. Sci. 55:1335–1342.
Huyghebaert, G., G. De Munter, and G. De Groote. 1988. The metabolisable energy (AMEn) of
fats for broilers in relation to their chemical composition. Anim. Feed Sci. Technol. 20:45–
58.
Ketels, E., and G. De Groote. 1989. Effect of ratio of unsaturated to saturated fatty acids of the
dietary lipid fraction on utilization and metabolizable energy of added fats in young chicks.
Poult. Sci. 68:1506–1512.
Laurin, D. E., S. P. Touchburn, E. R. Chavez, and C. W. Chan. 1985. Methods of measuring energy
utilization in broilers: Effect of genetic line and presence of supplemental dietary fat. Poult.
Sci. 64:969–978.
Leeson, S., and J. D. Summers. 2001. Energy. Pages 34–99 in Nutrition of the Chicken. 4th ed.
University Books, Guelph, Ontario, Canada.
97
Lessire, M., B. Leclercq, and L. Conan. 1982. Metabolisable energy value of fats in chicks and
adult cockerels. Anim. Feed Sci. Technol. 7:365–374.
Littell, R. C., P. R. Henry, A. J. Lewis, and C. B. Ammerman. 1997. Estimation of relative
bioavailability of nutrients using SAS procedures. J. Anim. Sci. 75:2672–2683.
Littell, R. C., A. J. Lewis, and P. R. Henry. 1995. Statistical evaluation of bioavailability assays.
Pages 5–33 in Bioavailability of Nutrients for Animals. Ammerman, C. B., Baker, D. H.,
Lewis, A. J., eds. Academic Press, San Diego, CA.
Mateos, G. G., and J. L. Sell. 1980a. True and apparent metabolizable energy value of fat for laying
hens: Influence of level of use. Poult. Sci. 59:369–373.
Mateos, G. G., and J. L. Sell. 1980b. Influence of graded levels of fat on utilization of pure
carbohydrate by the laying hen. J. Nutr. 110:1894–1903.
Mateos, G. G., J. L. Sell, and J. A. Eastwood. 1982. Rate of food passage (transit time) as
influenced by level of supplemental fat. Poult. Sci. 61:94–100.
National Research Council. 1994. Nutrient Requirements of Poultry. 9th rev. e. Natl. Acad. Press,
Washington, DC.
Parsons, C. M., L. M. Potter, and B. A. Bliss. 1982. True metabolizable energy corrected to
nitrogen equilibrium. Poult. Sci. 61:2241–2246.
Pesti, G. M., R. I. Bakalli, M. Qiao, and K. G. Sterling. 2002. A comparison of eight grades of fat
as broiler feed ingredients. Poult. Sci. 81:382–390.
SAS Institute Inc. 2011. SAS/STAT 9.3 User’s Guide. SAS Institute Inc., Cary, NC.
Shannon, D. W. F. 1971. The effect of level of intake and free fatty acid content on the
metabolizable energy value and net absorption of tallow by the laying hen. J. Agric. Sci.
76:217–221.
98
Sibbald, I. R. 1975. The effect of level of feed intake on metabolizable energy values measured
with adult roosters. Poult. Sci. 54:1990–1997.
Sibbald, I. R., and J. K. G. Kramer. 1978. The effect of the basal diet on the true metabolizable
energy value of fat. Poult. Sci. 57:685–691.
Sibbald, I. R., and J. K. G. Kramer. 1980. The effect of the basal diet on the utilization of fat as a
source of true metabolizable energy, lipid, and fatty acids. Poult. Sci. 59:316–324.
Sibbald, I. R., and K. Price. 1977. The effects of level of dietary inclusion and of calcium on the
true metabolizable energy values of fats. Poult. Sci. 56:2070–2078.
Sibbald, I. R., and M. S. Wolynetz. 1986. Comparison of three methods of excreta collection used
in estimation of energy and nitrogen excretion. Poult. Sci. 65:78–84.
Squires, E. J., E. V. Valdes, J. Wu, and S. Leeson. 1991. Research note: Utility of the thiobarbituric
acid test in the determination of the quality of fats and oils in feeds. Poult. Sci. 70:180–183.
Wan, P. 2000. Properties of fats and oils. Pages 20–48 in Introduction to Fats and Oils
Technologies. O’Brien, R., Farr, W., Wan, P., eds. 2nd ed. AOCS Press, Champaign, IL.
Whitehead, C. C. 1984. Essential fatty acids in poultry nutrition. Pages 150–166 in Fats in Animal
Nutrition. Wiseman, J., ed. Butterworth-Heinemann, London, UK.
Wiseman, J., and F. Salvador. 1989. Influence of age, chemical composition and rate of inclusion
on the apparent metabolisable energy of fats fed to broiler chicks. Br. Poult. Sci. 30:653–662.
Wiseman, J., and F. Salvador. 1991. The influence of free fatty acid content and degree of
saturation on the apparent metabolizable energy value of fats fed to broilers. Poult. Sci.
70:573–582.
Wiseman, J., F. Salvador, and J. Craigon. 1991. Prediction of the apparent metabolizable energy
content of fats fed to broiler chickens. Poult. Sci. 70:1527–1533.
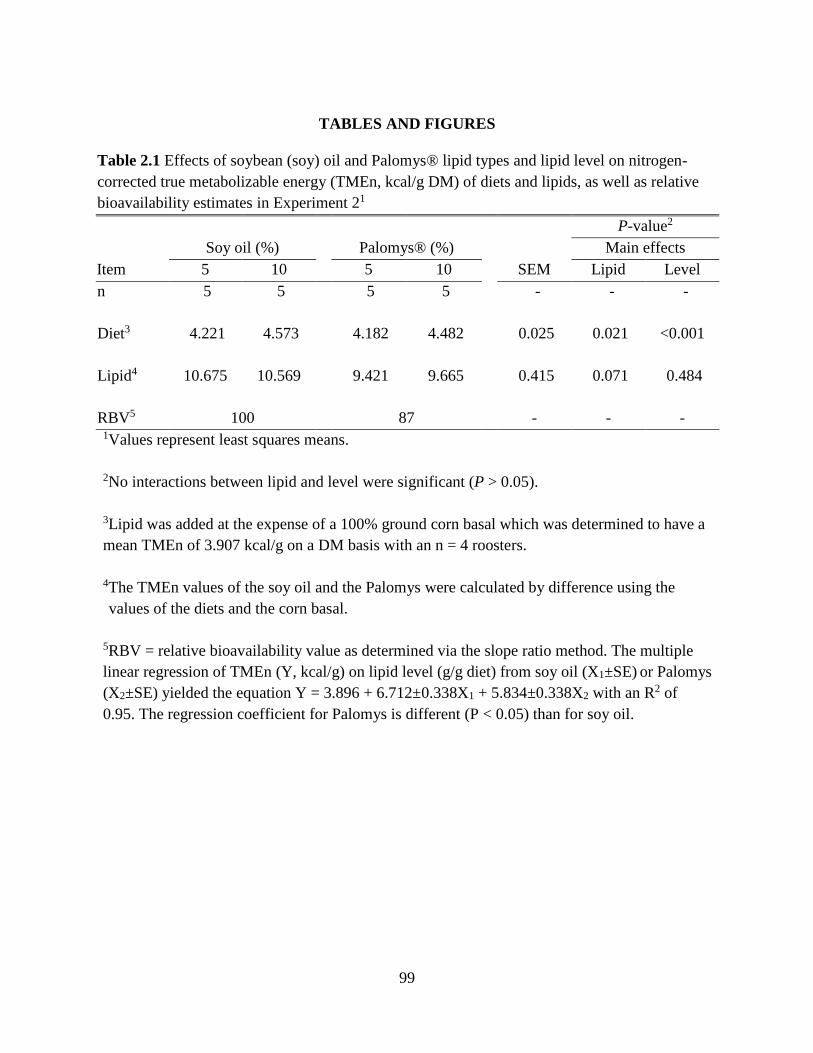
99
TABLES AND FIGURES
Table 2.1 Effects of soybean (soy) oil and Palomys® lipid types and lipid level on nitrogen-
corrected true metabolizable energy (TMEn, kcal/g DM) of diets and lipids, as well as relative
bioavailability estimates in Experiment 21
P-value2
Soy oil (%) Palomys® (%) Main effects
Item 5 10 5 10 SEM Lipid Level
n 5 5 5 5 - - -
Diet3 4.221 4.573 4.182 4.482 0.025 0.021 <0.001
Lipid4 10.675 10.569 9.421 9.665 0.415 0.071 0.484
RBV5 100 87 - - - 1Values represent least squares means.
2No interactions between lipid and level were significant (P > 0.05).
3Lipid was added at the expense of a 100% ground corn basal which was determined to have a
mean TMEn of 3.907 kcal/g on a DM basis with an n = 4 roosters.
4The TMEn values of the soy oil and the Palomys were calculated by difference using the
values of the diets and the corn basal.
5RBV = relative bioavailability value as determined via the slope ratio method. The multiple
linear regression of TMEn (Y, kcal/g) on lipid level (g/g diet) from soy oil (X1±SE) or Palomys
(X2±SE) yielded the equation Y = 3.896 + 6.712±0.338X1 + 5.834±0.338X2 with an R2 of
0.95. The regression coefficient for Palomys is different (P < 0.05) than for soy oil.
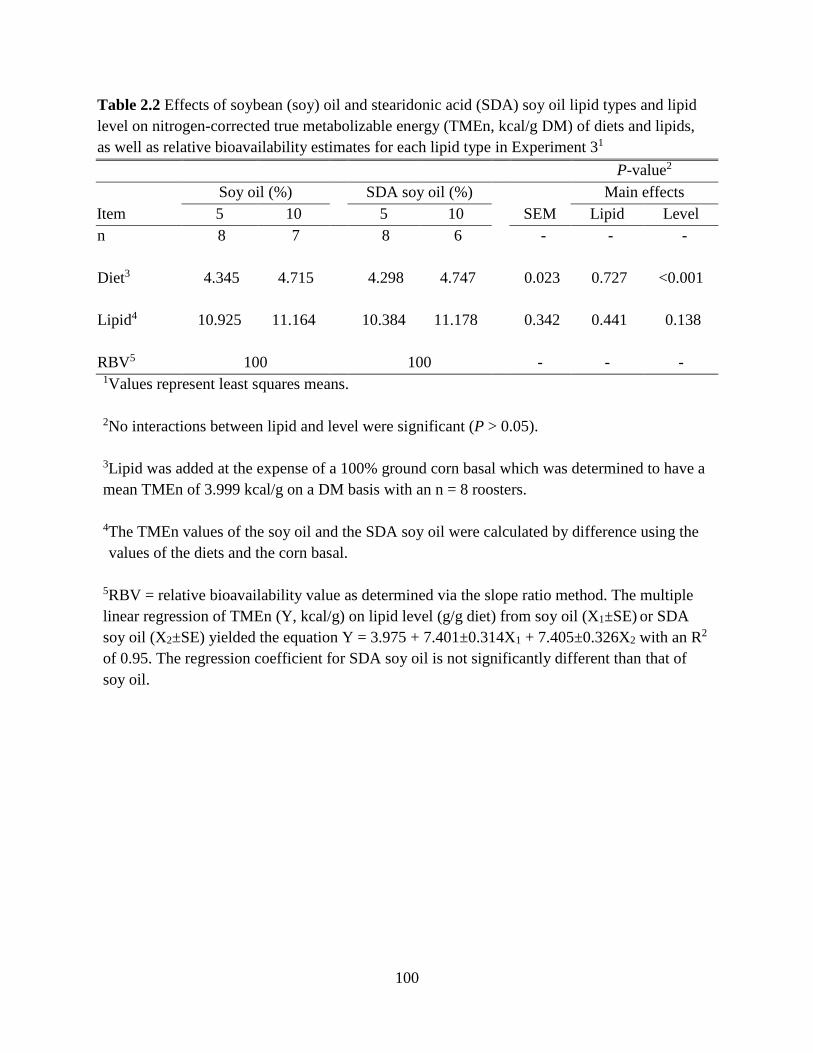
100
Table 2.2 Effects of soybean (soy) oil and stearidonic acid (SDA) soy oil lipid types and lipid
level on nitrogen-corrected true metabolizable energy (TMEn, kcal/g DM) of diets and lipids,
as well as relative bioavailability estimates for each lipid type in Experiment 31
P-value2
Soy oil (%) SDA soy oil (%) Main effects
Item 5 10 5 10 SEM Lipid Level
n 8 7 8 6 - - -
Diet3 4.345 4.715 4.298 4.747 0.023 0.727 <0.001
Lipid4 10.925 11.164 10.384 11.178 0.342 0.441 0.138
RBV5 100 100 - - - 1Values represent least squares means.
2No interactions between lipid and level were significant (P > 0.05).
3Lipid was added at the expense of a 100% ground corn basal which was determined to have a
mean TMEn of 3.999 kcal/g on a DM basis with an n = 8 roosters.
4The TMEn values of the soy oil and the SDA soy oil were calculated by difference using the
values of the diets and the corn basal.
5RBV = relative bioavailability value as determined via the slope ratio method. The multiple
linear regression of TMEn (Y, kcal/g) on lipid level (g/g diet) from soy oil (X1±SE) or SDA
soy oil (X2±SE) yielded the equation Y = 3.975 + 7.401±0.314X1 + 7.405±0.326X2 with an R2
of 0.95. The regression coefficient for SDA soy oil is not significantly different than that of
soy oil.
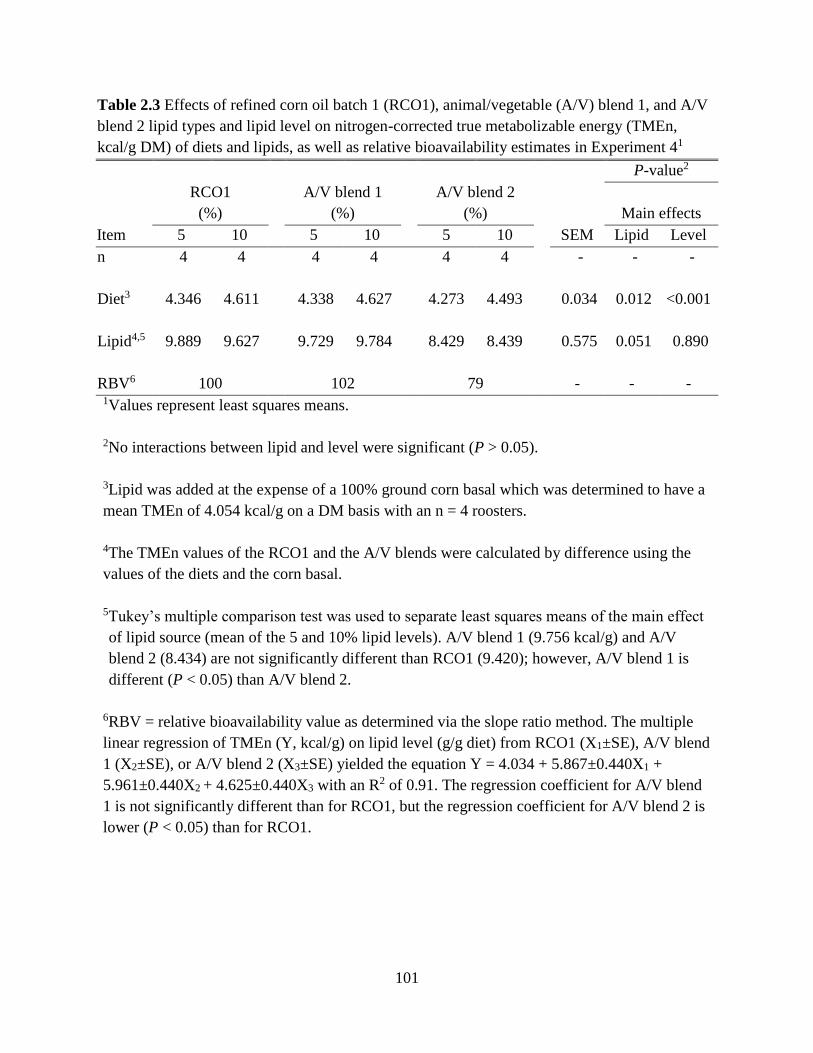
101
Table 2.3 Effects of refined corn oil batch 1 (RCO1), animal/vegetable (A/V) blend 1, and A/V
blend 2 lipid types and lipid level on nitrogen-corrected true metabolizable energy (TMEn,
kcal/g DM) of diets and lipids, as well as relative bioavailability estimates in Experiment 41
P-value2
RCO1
(%)
A/V blend 1
(%)
A/V blend 2
(%)
Main effects
Item 5 10 5 10 5 10 SEM Lipid Level
n 4 4 4 4 4 4 - - -
Diet3 4.346 4.611 4.338 4.627 4.273 4.493 0.034 0.012 <0.001
Lipid4,5 9.889 9.627 9.729 9.784 8.429 8.439 0.575 0.051 0.890
RBV6 100 102 79 - - - 1Values represent least squares means.
2No interactions between lipid and level were significant (P > 0.05).
3Lipid was added at the expense of a 100% ground corn basal which was determined to have a
mean TMEn of 4.054 kcal/g on a DM basis with an n = 4 roosters.
4The TMEn values of the RCO1 and the A/V blends were calculated by difference using the
values of the diets and the corn basal.
5Tukey’s multiple comparison test was used to separate least squares means of the main effect
of lipid source (mean of the 5 and 10% lipid levels). A/V blend 1 (9.756 kcal/g) and A/V
blend 2 (8.434) are not significantly different than RCO1 (9.420); however, A/V blend 1 is
different (P < 0.05) than A/V blend 2.
6RBV = relative bioavailability value as determined via the slope ratio method. The multiple
linear regression of TMEn (Y, kcal/g) on lipid level (g/g diet) from RCO1 (X1±SE), A/V blend
1 (X2±SE), or A/V blend 2 (X3±SE) yielded the equation Y = 4.034 + 5.867±0.440X1 +
5.961±0.440X2 + 4.625±0.440X3 with an R2 of 0.91. The regression coefficient for A/V blend
1 is not significantly different than for RCO1, but the regression coefficient for A/V blend 2 is
lower (P < 0.05) than for RCO1.
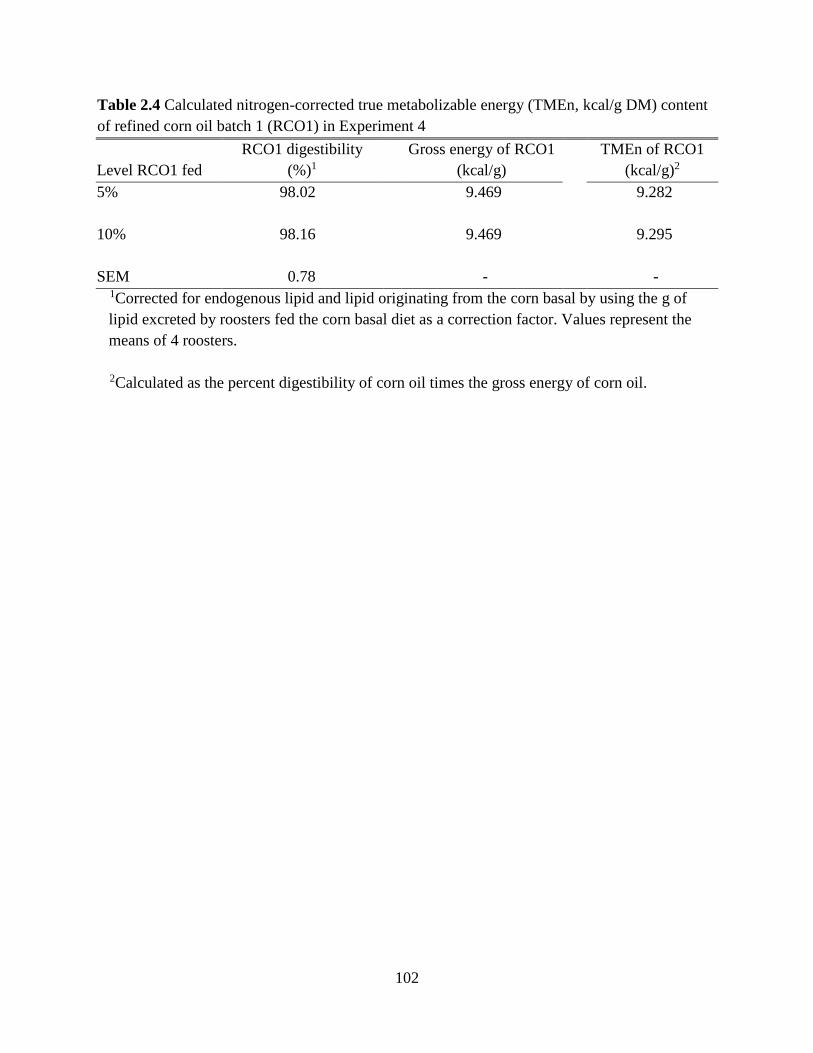
102
Table 2.4 Calculated nitrogen-corrected true metabolizable energy (TMEn, kcal/g DM) content
of refined corn oil batch 1 (RCO1) in Experiment 4
Level RCO1 fed
RCO1 digestibility
(%)1
Gross energy of RCO1
(kcal/g)
TMEn of RCO1
(kcal/g)2
5% 98.02 9.469 9.282
10% 98.16 9.469 9.295
SEM 0.78 - - 1Corrected for endogenous lipid and lipid originating from the corn basal by using the g of
lipid excreted by roosters fed the corn basal diet as a correction factor. Values represent the
means of 4 roosters.
2Calculated as the percent digestibility of corn oil times the gross energy of corn oil.
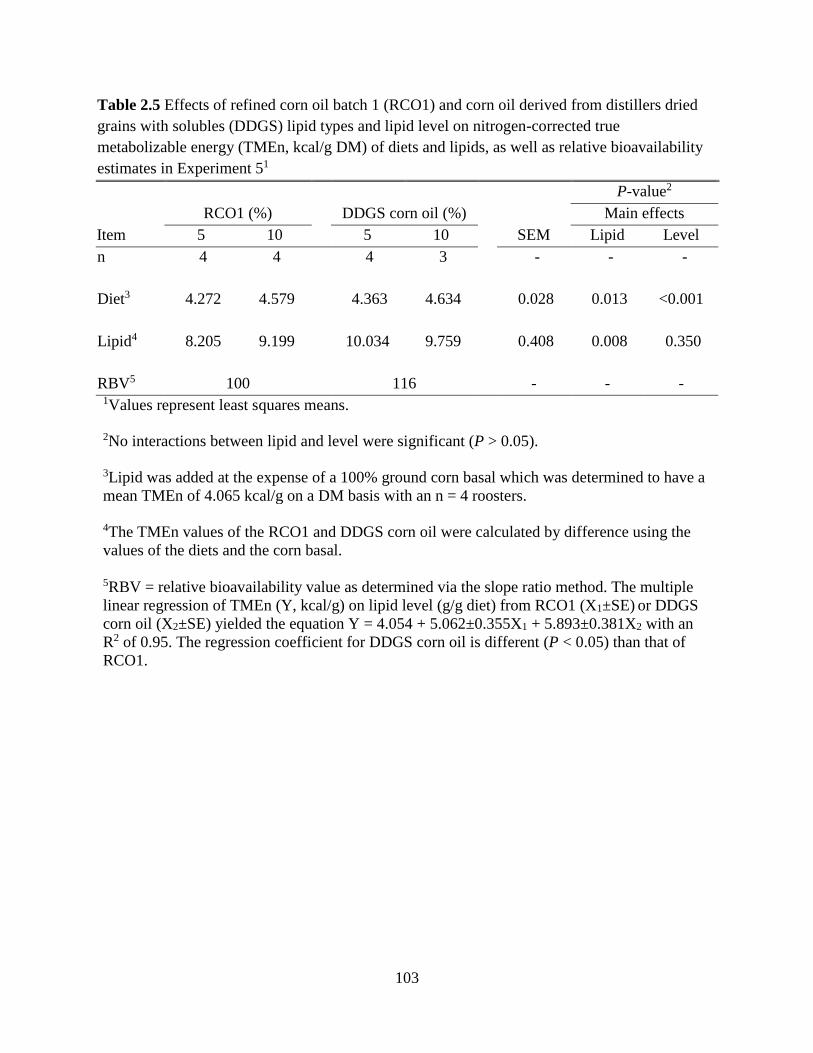
103
Table 2.5 Effects of refined corn oil batch 1 (RCO1) and corn oil derived from distillers dried
grains with solubles (DDGS) lipid types and lipid level on nitrogen-corrected true
metabolizable energy (TMEn, kcal/g DM) of diets and lipids, as well as relative bioavailability
estimates in Experiment 51
P-value2
RCO1 (%) DDGS corn oil (%) Main effects
Item 5 10 5 10 SEM Lipid Level
n 4 4 4 3 - - -
Diet3 4.272 4.579 4.363 4.634 0.028 0.013 <0.001
Lipid4 8.205 9.199 10.034 9.759 0.408 0.008 0.350
RBV5 100 116 - - - 1Values represent least squares means. 2No interactions between lipid and level were significant (P > 0.05).
3Lipid was added at the expense of a 100% ground corn basal which was determined to have a
mean TMEn of 4.065 kcal/g on a DM basis with an n = 4 roosters.
4The TMEn values of the RCO1 and DDGS corn oil were calculated by difference using the
values of the diets and the corn basal.
5RBV = relative bioavailability value as determined via the slope ratio method. The multiple
linear regression of TMEn (Y, kcal/g) on lipid level (g/g diet) from RCO1 (X1±SE) or DDGS
corn oil (X2±SE) yielded the equation Y = 4.054 + 5.062±0.355X1 + 5.893±0.381X2 with an
R2 of 0.95. The regression coefficient for DDGS corn oil is different (P < 0.05) than that of
RCO1.
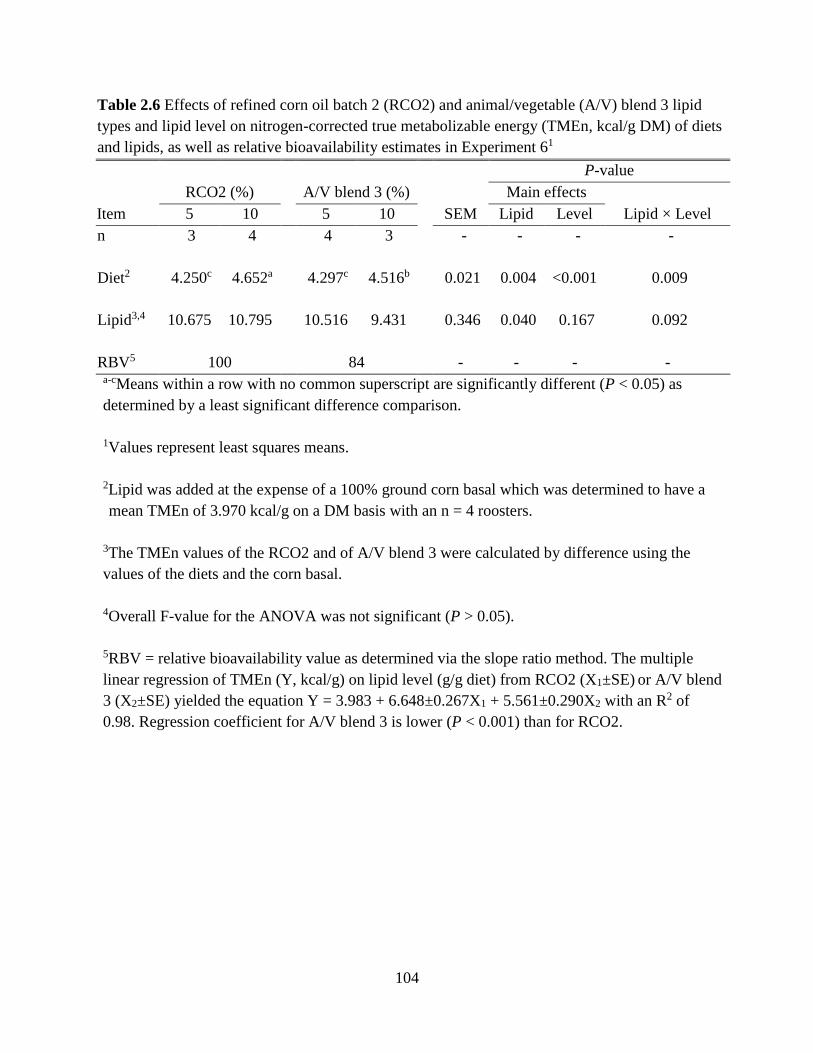
104
Table 2.6 Effects of refined corn oil batch 2 (RCO2) and animal/vegetable (A/V) blend 3 lipid
types and lipid level on nitrogen-corrected true metabolizable energy (TMEn, kcal/g DM) of diets
and lipids, as well as relative bioavailability estimates in Experiment 61
P-value
RCO2 (%) A/V blend 3 (%) Main effects
Item 5 10 5 10 SEM Lipid Level Lipid × Level
n 3 4 4 3 - - - -
Diet2 4.250c 4.652a 4.297c 4.516b 0.021 0.004 <0.001 0.009
Lipid3,4 10.675 10.795 10.516 9.431 0.346 0.040 0.167 0.092
RBV5 100 84 - - - - a-cMeans within a row with no common superscript are significantly different (P < 0.05) as
determined by a least significant difference comparison.
1Values represent least squares means.
2Lipid was added at the expense of a 100% ground corn basal which was determined to have a
mean TMEn of 3.970 kcal/g on a DM basis with an n = 4 roosters.
3The TMEn values of the RCO2 and of A/V blend 3 were calculated by difference using the
values of the diets and the corn basal.
4Overall F-value for the ANOVA was not significant (P > 0.05).
5RBV = relative bioavailability value as determined via the slope ratio method. The multiple
linear regression of TMEn (Y, kcal/g) on lipid level (g/g diet) from RCO2 (X1±SE) or A/V blend
3 (X2±SE) yielded the equation Y = 3.983 + 6.648±0.267X1 + 5.561±0.290X2 with an R2 of
0.98. Regression coefficient for A/V blend 3 is lower (P < 0.001) than for RCO2.
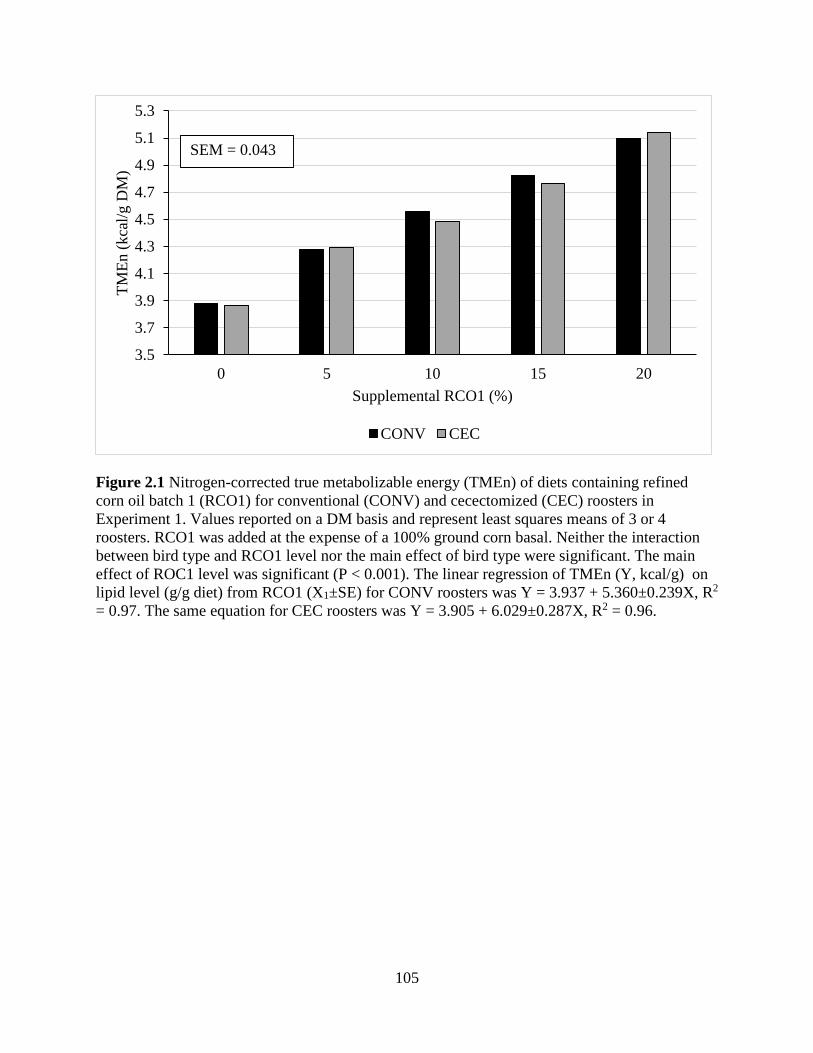
105
Figure 2.1 Nitrogen-corrected true metabolizable energy (TMEn) of diets containing refined
corn oil batch 1 (RCO1) for conventional (CONV) and cecectomized (CEC) roosters in
Experiment 1. Values reported on a DM basis and represent least squares means of 3 or 4
roosters. RCO1 was added at the expense of a 100% ground corn basal. Neither the interaction
between bird type and RCO1 level nor the main effect of bird type were significant. The main
effect of ROC1 level was significant (P < 0.001). The linear regression of TMEn (Y, kcal/g) on
lipid level (g/g diet) from RCO1 (X1±SE) for CONV roosters was Y = 3.937 + 5.360±0.239X, R2
= 0.97. The same equation for CEC roosters was Y = 3.905 + 6.029±0.287X, R2 = 0.96.
3.5
3.7
3.9
4.1
4.3
4.5
4.7
4.9
5.1
5.3
0 5 10 15 20
TM
En (
kca
l/g D
M)
Supplemental RCO1 (%)
CONV CEC
SEM = 0.043
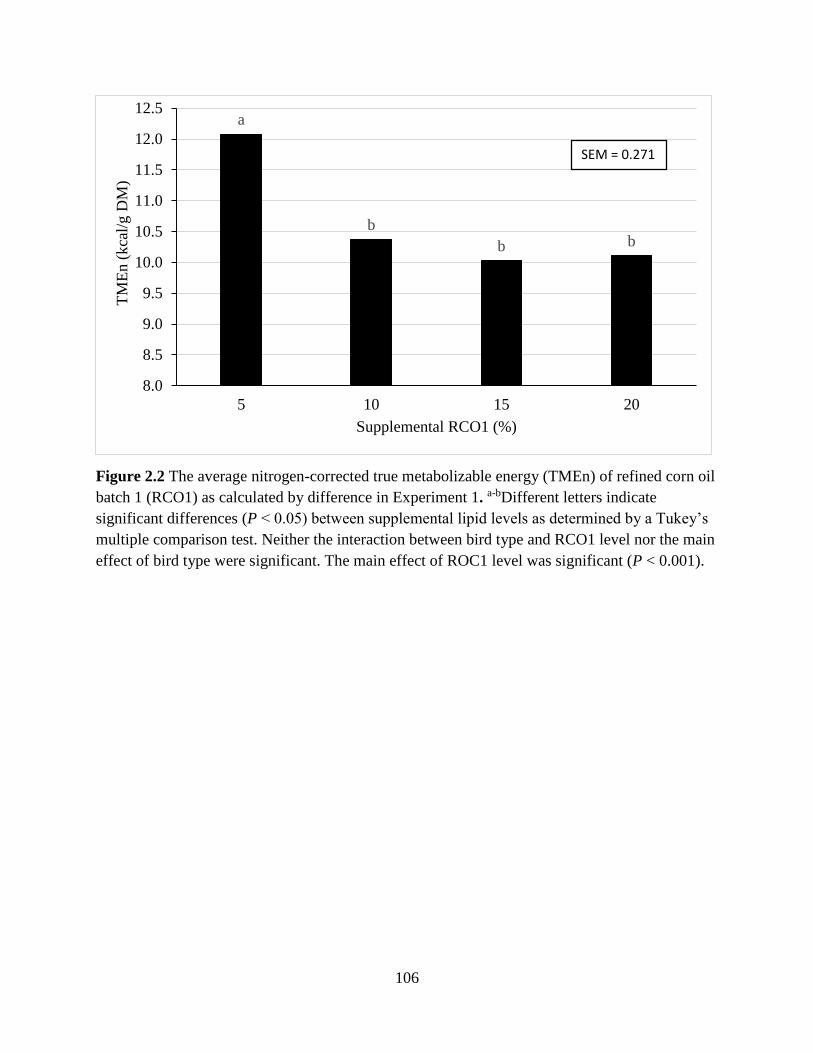
106
Figure 2.2 The average nitrogen-corrected true metabolizable energy (TMEn) of refined corn oil
batch 1 (RCO1) as calculated by difference in Experiment 1. a-bDifferent letters indicate
significant differences (P < 0.05) between supplemental lipid levels as determined by a Tukey’s
multiple comparison test. Neither the interaction between bird type and RCO1 level nor the main
effect of bird type were significant. The main effect of ROC1 level was significant (P < 0.001).
a
b
b b
8.0
8.5
9.0
9.5
10.0
10.5
11.0
11.5
12.0
12.5
5 10 15 20
TM
En (
kca
l/g D
M)
Supplemental RCO1 (%)
SEM = 0.271
107
CHAPTER 3
COMPARISON OF SLOPE-RATIO PRECISION-FED ROOSTER AND CHICK
GROWTH ASSAYS FOR ESTIMATING THE RELATIVE BIOAVAILABLE ENERGY
VALUES OF FATS AND OILS
ABSTRACT
Two experiments were conducted to compare the measured available energy content of fats
and oils (lipids) generated from adult conventional (CONV) roosters (slope-ratio precision-fed
rooster assay) and young growing broiler chicks (slope-ratio chick growth assay). The objectives
were to further validate the slope-ratio precision-fed rooster assay and to determine if values
obtained from it were applicable for use with broiler chicks. Lipids were obtained that were
expected to have low, medium, and high available energy content. Lipids tested in each experiment
were from the same batches, and were refined corn oil batch 2 (RCO2), a 2:1 blend of stearic acid
with RCO2 (Blend A), a 1:1 blend of stearic acid with RCO2 (Blend B), tallow, poultry fat, and
corn oil originating from distillers dried grains with solubles (DDGS). In the precision-fed rooster
experiment, roosters were tube-fed diets containing 0, 5, and 10% of supplemental lipid that was
included at the expense of a ground corn basal. In the chick growth assay, diets consisted of 0, 5,
and 10% supplemental lipid added to a corn-soybean basal diet at the expense of cellulose. Chicks
were limit-fed from 10 to 20 d of age to maintain energy as the growth-limiting component.
Nitrogen-corrected true metabolizable energy (TMEn) of diets or body weight gain of chicks were
regressed on supplemental lipid level or intake using multiple linear regression. Relative
bioavailability values (RBV) for each lipid were calculated as the regression coefficient of the test
lipid divided by that of RCO2. The slope-ratio precision-fed rooster assay was able to detect and
quantify inferior lipid types in predictable ways. The use of the stearic acid blends as low energy
108
lipid sources was not without complication; however, the RBV from Blend A (22%) (low energy
source), tallow (72%) (medium energy source), and poultry fat (96%) and DDGS corn oil (90%)
(high energy sources) are strong evidence that the assay is able to accurately detect and quantify
the available energy content of lipids. The regression coefficients of Blend A and tallow were
lower (P < 0.001) than RCO2, while poultry fat and DDGS corn oil were not different than RCO2.
The available energy by growth chick assay indicated that growth was a sensitive indicator of
available energy content. The RBV increased from 22% for Blend A to 97% for DDGS corn oil
indicating that energy was the limiting factor in this study. The regression coefficients of Blend A,
Blend B, and tallow were lower (P < 0.001) than RCO2, while poultry fat and DDGS corn oil were
not different than RCO2. Excellent agreement was obtained for RBV between the two assays, with
rooster and chick values being similar and the ranking of the lipids being similar for both bird type.
Overall, these data indicate that the slope-ratio precision-fed rooster assay was able to predictably
detect and quantify differences in available energy among lipid types, and yielded values that were
similar to those obtained with growing broiler chicks.
INTRODUCTION
Traditionally determined metabolizable energy (ME) values may be confounded in a
variety of ways (Sibbald et al., 1961; Cullen et al., 1962; Horani and Sell, 1977; Wiseman et al.,
1986); however, there is still a need for practical ways to measure available energy content of
lipids so as to provide useful information to the commercial poultry industry. The precision-fed
rooster assay is probably the easiest method for the generation of in vivo ME values (Wolynetz
and Sibbald, 1984), and holds considerable potential for the evaluation of lipids as it is a rapid and
simple procedure (Sibbald, 1976). However, the precision-fed rooster assay uses adult chickens,
and it has been shown that adult chickens may utilize some lipids better than young chicks,
109
especially for highly saturated lipids (Polin and Hussein, 1982; Lessire et al., 1982; Wiseman and
Salvador, 1989). Therefore, one potential problem with the precision-fed rooster assay is that
values obtained may not be relevant for use in young poultry. Thus, the primary objectives of these
studies were to determine if there were differences in the RBV of lipids between adult chickens
(slope-ratio precision-fed rooster assay) and young chicks (available energy by growth chick
assay), while further evaluating and validating the slope-ratio precision-fed rooster assay.
MATERIALS AND METHODS
The protocols used in conducting these experiments were approved by the Institutional
Animal Care and Use Committee of the University of Illinois at Urbana-Champaign.
Experimental design
Two experiments were conducted that assayed the same batch of lipids for available energy
content using two different methods. The first experiment was for TMEn values via the precision-
fed rooster assay (Parsons et al., 1982) with adult roosters that was modified to fit a slope-ratio
approach (Ammerman et al., 1995). The second experiment was for available energy by a slope-
ratio growth assay with young growing broiler chicks. The methods used in the chick growth assay
were a modified version of the methods of Squibb (1971). The diets for the slope-ratio precision-
fed rooster assays consisted of ground corn with lipids added at 0, 5, and 10% at the expense of
ground corn. In the chick growth assay, diets consisted of a basal diet (Table 3.1) with lipid added
at 0, 5, and 10% at the expense of cellulose. The basal diet was supplemented with amino acids to
achieve levels that were 30% higher than the breeder recommendation to ensure that amino acids
were not more limiting than energy. Lipids evaluated in both experiments were from the same
batches and varied widely in degree of saturation and other characteristics that are predictors of
110
available energy content. Lipids analyzed were RCO2, a 2:1 blend of stearic acid (Sigma-Aldrich
Co. LLC) with RCO2 (Blend A), a 1:1 blend of stearic acid with RCO2 (Blend B), tallow, poultry
fat, and DDGS corn oil. RCO2 was purchased from a commercial grocery retail outlet, tallow and
poultry fat were obtained from a commercial rendering company, and the DDGS corn oil
originated from a dry-grind ethanol plant and was from a different source than used in Experiment
5 of Chapter 2.
The precision-fed rooster assay was conducted similarly as presented in Chapter 2, with
the exception that the experimental design was a randomized complete block design. Due to the
large number of treatments and replications, the trial was replicated over time, with 4 replicates of
each treatment in each of two trials (total of 8 roosters per treatment) and each trial was considered
a block. The TMEn of the diets and the RBV were calculated as in Chapter 2.
The chick growth assay was conducted with male Ross 308 broiler chicks which were
purchased from a commercial hatchery (Hoover’s Hatchery, Rudd, IA) on the day of hatch. Chicks
were housed in an environmentally controlled room with a 24 hour light cycle in heated Petersime
battery brooders with ad libitum access to water and a nutritionally complete common starter diet.
Prior to the start of the experiment at 10 d of age, chicks were fasted for 12 hours overnight and
then weighed individually. Chicks closest to the center of the weight distribution were then
selected, individually wing banded, and allotted to treatment groups. Chicks were allotted to
treatments in such a way as to equalize initial body weight across treatments. Treatment replicate
groups consisted of 5 chicks, and were placed into individual pens of battery brooders in a
completely randomized design with 5 replicates per dietary treatment and 13 dietary treatments.
The battery brooders were in an environmentally controlled room with a 24 hour light cycle and
the heaters of the battery brooders were thermostatically controlled. Trough-style feeders were
111
altered with fitted poster-board inserts that limited the feeder space to 20 cm to help chicks
consume all feed present each day.
Chicks were fed treatment diets once per day at approximately the same time each morning,
and feed given was measured to within ± 0.5 g of the daily allotment (Table 3.2). Feed allotment
for the first feeding (study day 0) was determined by multiplying published daily intakes (Aviagen,
2012) of birds of equivalent weight by 0.7 (30% feed restriction). Each subsequent day’s allotment
was calculated as the next published day’s intake multiplied by 0.7, and thus increased in amount
each day. As feed allotment was calculated per chick per day, any mortality was carefully
accounted for before each feeding so as to ensure the correct feed allotment. On study day 10 (20
d old), chicks were weighed individually 24 hours after their previous feeding. Body weight gain,
total feed intake, and feed efficiency were calculated, with individual pens of birds as experimental
units. The RBV of test lipids were calculated by dividing the regression coefficient of the test lipids
by the regression coefficient of RCO2.
Chemical Analysis
Chemical analyses (gross energy, dry matter, and total nitrogen) were the same as in
Experiment 1 of Chapter 2 for diets and excreta (feces + urine) for the TMEn assay; there were no
chemical analyses required for the chick growth assay.
Statistical Analysis
Each experiment was analyzed individually using the GLM Procedures of SAS (SAS
Institute Inc, 2011). Multiple linear regression of TMEn or body weight gain (Y) on supplemental
lipid inclusion level or intake (X) was conducted according to Littell et al. (1995, 1997) for the
slope-ratio and standard curve methods. Pair-wise comparisons were made between the regression
112
coefficients of test lipids and RCO2 using the coding of Littell et al. (1995) to determine if test
lipids were significantly different than RCO2. It was assumed that if regression coefficients were
significantly different then RBV were also significantly different as the RBV is simply a ratio of
the test coefficients (Littell et al., 1995). Tukey’s Multiple Comparison Test was used to separate
means. Statistical significance was accepted at a probability of P < 0.05. Influential outliers were
identified using the Diagnostic Plots of the GLM Procedure with the Unpack and Label options.
Outlying data points were removed if careful analysis of the original data revealed a
methodological or biological explanation for the aberrant data according to described methods
(Freund and Littell, 2000).
RESULTS AND DISCUSSION
Precision-fed rooster assay
The results of the slope-ratio precision-fed rooster assay are presented in Table 3.3. There
was no significant effect of trial (block) (P > 0.05); thus, the data were combined for analysis.
Adding 5 or 10% lipid to the ground corn basal diet yielded significant (P < 0.05) increases in diet
TMEn for all lipid types except the Blend A. When TMEn of the diets was regressed on lipid level
(multiple linear regression), the regression coefficients of Blend A and tallow were lower (P <
0.001) than the regression coefficient for RCO2 while poultry fat and DDGS corn oil were not
significantly different than RCO2. The Blend B was not included in the regression due to non-
linearity of the response of TMEn to increasing lipid level, rather, the RBV for Blend B were
calculated for each inclusion level (5 and 10%) using the reference curve method (Littell et al.,
1995). The resulting RBV for Blend B were not included in the statistical comparison for the RBV.
The calculated RBV of the stearic acid Blend A, tallow, poultry fat, and DDGS corn oil were 22,
72, 96, and 90%, respectively. The stearic acid blends were included in the experiment with the
113
intention to provide lipid types that would have lower available energy content, as stearic acid has
been shown to be very poorly digested (Sunde, 1956; Young and Garrett, 1963). Thus, the stearic
acid blends were included as poorly utilized lipids to validate that the slope-ratio precision-fed
rooster assay would be able to detect and quantify the lower available energy content.
The results for the stearic acid blends were not as anticipated. There was little change in
the TMEn of the diets containing the stearic acid blends when the inclusion level changed from 5
to 10% unlike all of the other lipid sources. This may have been due in part to the stearic acid
blends having similar TMEn content as the ground corn it was replacing, assuming stearic acid
when fed in a carrier of ground corn has a TMEn of 0.8 kcal/g (M. Aardsma, unpublished data). It
was hypothesized that the stearic acid would be absorbed to a greater degree in the presence of the
highly unsaturated RCO2 present in the stearic blends (Ketals and De Groote, 1989), but this may
not have occurred. Results may have been impacted by varying amounts of synergistic and/or
antagonistic interactions among fatty acids (Young and Garrett, 1963) as ratios between
unsaturated and saturated (U:S) fatty acids of the complete diet changed at the different
supplementation levels. The overall U:S ratio has been shown to be very important for the uptake
of saturated fatty acids (Ketels and De Groote, 1989; Blanch et al., 1995). As interactions between
fatty acids have been shown to be unpredictable (Young and Garrett, 1963; Artman, 1964; Vilà
and Esteve-Garcia, 1996), perhaps it should not be surprising that TMEn did not respond in
predictable ways to the stearic acid blends. The Blend A did not violate the assumptions of the
slope ratio method (Littell et al., 1995) unlike Blend B and thus an RBV was able to be calculated
for Blend A using the slope-ratio method. Though the stearic acid apparently interacted with the
RCO2 in the blends and did not yield the expected additive responses, the overall results indicate
that the assay was able to identify poorly utilized lipid sources.
114
The results with the tallow further support the above conclusion. Tallow is not commonly
used in poultry diets as it is relatively poorly utilized (Sibbald et al., 1962; Halloran and Sibbald,
1979), and thus was included in this experiment for validation of the assay method similar to the
stearic acid blends. Unlike the stearic acid blends, the results are not complicated with unpredicted
synergism or antagonism. As tallow is highly saturated, the expected available energy content is
much lower than RCO2. The RBV of 72% for tallow indicates that the assay was able to detect
that this lipid source was less well utilized by poultry.
Poultry fat and DDGS corn oil were well utilized as demonstrated by high RBV values.
This is in agreement with previous findings that poultry fat is an excellent source of energy for
poultry (Cullen et al., 1962), and that corn oil and poultry fat are equivalent in available energy
content (Squires et al., 1991). That DDGS corn oil is a good source of available energy for young
poultry has also been demonstrated, though it was found to be inferior to poultry fat with older
broilers (Kim et al., 2013).
The TMEn values of the lipids calculated by difference were variable and were very high
for RCO2, poultry fat, and DDGS corn oil. Indeed, the TMEn values of the latter lipids exceeded
their gross energy values, indicating that extra metabolic effects (EME) were occurring. The values
were highest for RCO2, poultry fat, DDGS corn oil, and tallow, and lowest for the stearic acid
blends. There were numerical reductions in TMEn for Blend A, Blend B, tallow, and DDGS corn
oil as supplemental lipid increased, though this trend was reversed for poultry fat. In general these
results indicate decreasing EME with increasing supplemental lipid as has been observed
previously (Sibbald and Kramer, 1977; Halloran and Sibbald, 1979).
115
Chick growth assay
The diets used in the chick growth assay (Table 3.1) contained lower amounts of vitamins
and minerals than anticipated due to a formulation error; however, when the vitamin and mineral
contributions from the dietary ingredients (National Research Council, 1994; Leeson and
Summers, 2001a) were included into the calculations of the total vitamin and mineral intake per
chick per day, the majority of the requirements of the chick (National Research Council, 1994)
were still met. The nutrients most deficient in the diet were selenium (42% of requirement), niacin
(51% of requirement), riboflavin (55% of requirement) and manganese (61% of requirement), with
all others close to or in excess of requirements. As the chicks were fed a diet containing excess
vitamins and mineral from 0 to 9 d of age, and the experimental diets were fed for a short time, it
seems unlikely that the results of this study were impacted. The latter conclusion is supported in
that no vitamin or mineral deficiency symptoms were observed, and excellent linear increases in
growth were obtained by increasing lipid supplementation, indicating that the growth-limiting
factor in this study was energy. Additionally, due to the short duration of these experiments, this
type of assay is believed to be somewhat robust to dietary deficiencies of some nutrients (Rice et
al., 1957).
The calculation method for the feed allotment (Table 3.2) was deemed adequate. There
were no feed refusals, and a linear increase in growth was obtained from the highly digestible
RCO2, indicating that birds were energy restricted (Young and Garrett, 1963; Renner, 1964). In a
preliminary experiment conducted in our lab, both 20% and 30% feed restriction were evaluated
and 20% restriction was not adequate because several pens of chicks did not consume all of their
daily feed allotment. Thus, a 30% feed restriction seems to be acceptable for running this type of
assay with commercial broiler chicks.
116
The results of the chick growth study are presented in Table 3.4. Mortality was very low
(0.9%) and primarily occurred in the first few days of the study. Two pens of chicks were identified
as being influential outliers. One pen of chicks fed 10% DDGS corn oil was found to contain a
very small chick, and thus the remaining chicks in the pen were receiving more feed than
anticipated and may have led to differential tissue formation with more energy being deposited as
fat than other treatments. One pen of chicks fed the 0% supplemental lipid diet had markedly lower
growth as compared to other pens on that treatment and was excluded from the analysis. There
were no feed refusals throughout the study, thus feed intakes were identical for all pens.
Chick growth generally increased with increasing supplemental lipid inclusion, indicating
that energy was the limiting factor as is required in this type of assay (Rice et al., 1957; Squibb,
1971). The RBV of the lipids increased in order of expected available energy content, indicating
that chick growth was accurately reflecting available energy content. The regression coefficients
for Blend A, Blend B, and tallow were lower (P < 0.001) than RCO2, while those for poultry fat
and DDGS corn oil were not significantly different than RCO2. The Blend A and Blend B are not
commercially available and were included solely as low quality lipids for validation purposes. The
very low RBV for Blend A indicates that the high levels of stearic acid were poorly utilized. While
the RBV of Blend B is still low as expected, it was more than twice as high as Blend A, reflecting
the lower stearic acid and higher RCO2 content of Blend B than of Blend A. Based on the high
utilization of corn oil (Renner and Hill, 1960; Whitehead and Fisher, 1975) and the low utilization
of stearic acid (Sunde, 1956; Young and Garrett, 1963), these data are as expected. This indicates
that the assay was able to accurately detect and quantify the inferiority of the stearic acid blends.
Tallow is commercially available and has been used in poultry diets for many years
(Leeson and Summers, 2001b). Today, tallow is not used frequently in poultry diets as it has been
117
shown to be poorly absorbed by growing poultry (Wiseman and Salvador, 1989), likely due to it
low U:S ratio (Artman, 1964; Ketels and De Groote, 1989). The RBV of 76% for tallow is further
evidence of its inferiority and is very close to the standardized digestibility of tallow of 74% that
was determined in 8 week old turkey poults (Whitehead and Fisher, 1975).
The RBV of poultry fat and DDGS corn oil were very similar to RCO2, and the very high
RBV indicate that these lipids are excellent energy sources for the young growing chick. This is
as expected, as poultry fat is considered the ideal lipid for use in poultry diets (Leeson and
Summers, 2001b), and no differences in growth performance were seen in 0 to 18 day-old broiler
chicks fed either poultry fat or DDGS corn oil (Kim et al., 2013).
Comparison of the precision-fed rooster and chick growth assays
In general, there was a marked similarity among the RBV for the precision-fed rooster
assay and the chick growth assay. Unlike the TMEn values for Blend B, the chick growth data did
not violate any statistical assumptions, and thus RBV were calculated for all lipid types using the
slope-ratio method. The RBV for both Blend A and poultry fat were numerically identical between
assays, with Blend A at 22%, and poultry fat at 96%. The RBV of tallow was slightly lower (4%)
in the roosters than in the chicks. The largest difference between the rooster and the chick assays
was for DDGS corn oil, where RBV was 7% lower in the roosters than in the chicks. Both assays,
however, yielded high RBV values (90-97%) for the DDGS corn oil. That the values would be
numerically equal or lower in roosters than in chicks is opposite of the trend that was expected, as
most reported studies have shown that older chickens utilize lipids better than younger chickens
(Renner and Hill, 1960; Polin and Hussein, 1982; Lessire et al., 1982; Wiseman and Lessire, 1987).
Adaptation time to the diet has been shown to impact lipid utilization (Young et al., 1963).
Therefore, one possible explanation is that the chicks were fed treatment diets for a longer period
118
of time than the roosters and may have adapted better to the diet, resulting in better utilization of
the lipids. If this occurred, it might have been enough to at least partially counteract any effect of
age. Regardless of the explanation, it is evident that there is excellent agreement between the two
assays, and thus RBV values derived in the slope-ratio precision-fed rooster assay seem to be
appropriate for use in growing chicks.
The slope-ratio precision-fed rooster assay was shown to accurately reflect the available
energy content of lipids varying widely in composition. This has a lot of practical applications for
the commercial poultry industry into the future. Inferior lipids can quickly and easily be identified
and changes in purchasing and formulation made to ensure both maximum economy and bird
performance. As the slope-ratio chick growth assay yielded very similar results as the slope-ratio
precision-fed rooster assay, results from the slope-ratio precision-fed rooster assay appear to be
suitable for use with young broiler chickens. This precludes the use of correction factors and
greatly increases the usefulness of values obtained via the slope-ratio precision-fed rooster assay
in commercial poultry nutrition. Thus, the slope-ratio precision-fed rooster assay may be an
important tool for lipid analysis for commercial poultry nutrition in the future.
119
LITERATURE CITED
Ammerman, C. B., D. H. Baker, and A. J. Lewis (Eds). 1995. Bioavailability of Nutrients for
Animals. Academic Press, San Diego, CA.
Artman, N. R. 1964. Interactions of fats and fatty acids as energy sources for the chick. Poult. Sci.
43:994–1004.
Aviagen. 2012. Ross 308 Broiler Performance Objectives. Aviagen Inc, Huntsville, AL.
Blanch, A., A. C. Barroeta, M. D. Baucells, and F. Puchal. 1995. The nutritive value of dietary fats
in relation to their chemical composition. Apparent fat availability and metabolizable energy
in two-week-old chicks. Poult. Sci. 74:1335–1340.
Cullen, M. P., O. G. Rasmussen, and O. H. M. Wilder. 1962. Metabolizable energy value and
utilization of different types and grades of fat by the chick. Poult. Sci. 41:360–367.
Freund, R., and R. C. Littell. 2000. SAS Systems for Regression. 3rd ed. SAS Institute Inc., Cary,
NC.
Halloran, H. R., and I. R. Sibbald. 1979. Metabolizable energy values of fats measured by several
procedures. Poult. Sci. 58:1299–1307.
Horani, F., and J. L. Sell. 1977. Effect of feed grade animal fat on laying hen performance and on
metabolizable energy of rations. Poult. Sci. 56:1972–1980.
Ketels, E., and G. De Groote. 1989. Effect of ratio of unsaturated to saturated fatty acids of the
dietary lipid fraction on utilization and metabolizable energy of added fats in young chicks.
Poult. Sci. 68:1506–1512.
Kim, E. J., J. L. Purswell, J. D. Davis, R. E. Loar, and K. Karges. 2013. Live production and
carcass characteristics of broilers fed a blend of poultry fat and corn oil derived from distillers
dried grains with solubles. Poult. Sci. 92:2732–2736.
120
Leeson, S., and J. D. Summers. 2001a. Nutrition of the Chicken. 4th ed. University Books, Guelph,
Ontario, Canada.
Leeson, S., and J. D. Summers. 2001b. Feed ingredients and feed formulation. Pages 473–510 in
Nutrition of the Chicken. 4th ed. University Books, Guelph, Ontario, Canada.
Lessire, M., B. Leclercq, and L. Conan. 1982. Metabolisable energy value of fats in chicks and
adult cockerels. Anim. Feed Sci. Technol. 7:365–374.
Littell, R. C., P. R. Henry, A. J. Lewis, and C. B. Ammerman. 1997. Estimation of relative
bioavailability of nutrients using SAS procedures. J. Anim. Sci. 75:2672–2683.
Littell, R. C., A. J. Lewis, and P. R. Henry. 1995. Statistical evaluation of bioavailability assays.
Pages 5–33 in Bioavailability of Nutrients for Animals. Ammerman, C., Baker, D., Lewis,
A., eds. Academic Press, San Diego, CA.
National Research Council. 1994. Nutrient Requirements of Poultry. 9th rev. e. Natl. Acad. Press,
Washington, DC.
Parsons, C. M., L. M. Potter, and B. A. Bliss. 1982. True metabolizable energy corrected to
nitrogen equilibrium. Poult. Sci. 61:2241–2246.
Polin, D., and T. H. Hussein. 1982. The effect of bile acid on lipid and nitrogen retention, carcass
composition, and dietary metabolizable energy in very young chicks. Poult. Sci. 61:1697–
1707.
Renner, R. 1964. Factors affecting the utilization of “carbohydrate-free” diets by the chick: I. Level
of protein. J. Nutr. 84:322–326.
Renner, R., and F. W. Hill. 1960. The utilization of corn oil, lard and tallow by chickens of various
ages. Poult. Sci. 39:849–854.
121
Rice, E. E., W. D. Warner, P. E. Mone, and C. E. Poling. 1957. Comparison of the metabolic
energy contributions of foods by growth under conditions of energy restriction. J. Nutr.
61:253–266.
SAS Institute Inc. 2011. SAS/STAT 9.3 User’s Guide. SAS Institute Inc., Cary, NC.
Sibbald, I. R. 1976. A bioassay for true metabolizable energy in feedingstuffs. Poult. Sci. 55:303–
308.
Sibbald, I. R., and J. K. G. Kramer. 1977. The true metabolizable energy values of fats and fat
mixtures. Poult. Sci. 6:2079–2086.
Sibbald, I. R., S. J. Slinger, and G. C. Ashton. 1961. Factors affecting the metabolizable energy
content of poultry feeds: 2. Variability in the M.E. values attributed to samples of tallow, and
undegummed soybean oil. Poult. Sci. 40:303–308.
Sibbald, I. R., S. J. Slinger, and G. C. Ashton. 1962. The utilization of a number of fats, fatty
materials and mixtures thereof evaluated in terms of metabolizable energy, chick weight gains
and gain:feed ratios. Poult. Sci. 41:46–61.
Squibb, R. L. 1971. Estimating the metabolizable energy of foodstuffs with an avian model. J.
Nutr. 101:1211–1215.
Squires, E. J., E. V. Valdes, J. Wu, and S. Leeson. 1991. Research note: Utility of the thiobarbituric
acid test in the determination of the quality of fats and oils in feeds. Poult. Sci. 70:180–183.
Sunde, M. L. 1956. The effect of fats and fatty acids in chick rations. Poult. Sci. 35:362–368.
Vilà, B., and E. Esteve-Garcia. 1996. Studies on acid oils and fatty acids for chickens. II. Effect of
free fatty acid content and degree of saturation of free fatty acids and neutral fat on fatty acid
digestibility. Br. Poult. Sci. 37:119–130.
122
Whitehead, G. C., and C. Fisher. 1975. The utilisation of various fats by turkeys of different ages.
Br. Poult. Sci. 16:481–485.
Wiseman, J., D. J. A. Cole, F. G. Perry, B. G. Vernon, and B. C. Cooke. 1986. Apparent
metabolisable energy values of fats for broiler chicks. Br. Poult. Sci. 27:561–576.
Wiseman, J., and M. Lessire. 1987. Interactions between fats of differing chemical content:
Apparent availability of fatty acids. Br. Poult. Sci. 28:677–691.
Wiseman, J., and F. Salvador. 1989. Influence of age, chemical composition and rate of inclusion
on the apparent metabolisable energy of fats fed to broiler chicks. Br. Poult. Sci. 30:653–662.
Wolynetz, M. S., and I. R. Sibbald. 1984. Relationships between apparent and true metabolizable
energy and the effects of a nitrogen correction. Poult. Sci. 63:1386–1399.
Young, R. J., and R. L. Garrett. 1963. Effect of oleic and linoleic acids on the absorption of
saturated fatty acids in the chick. J. Nutr. 81:321–329.
Young, R. J., R. L. Garrett, and M. Griffith. 1963. Factors affecting the absorbability of fatty acid
mixtures high in saturated fatty acids. Poult. Sci. 42:1146–1154.
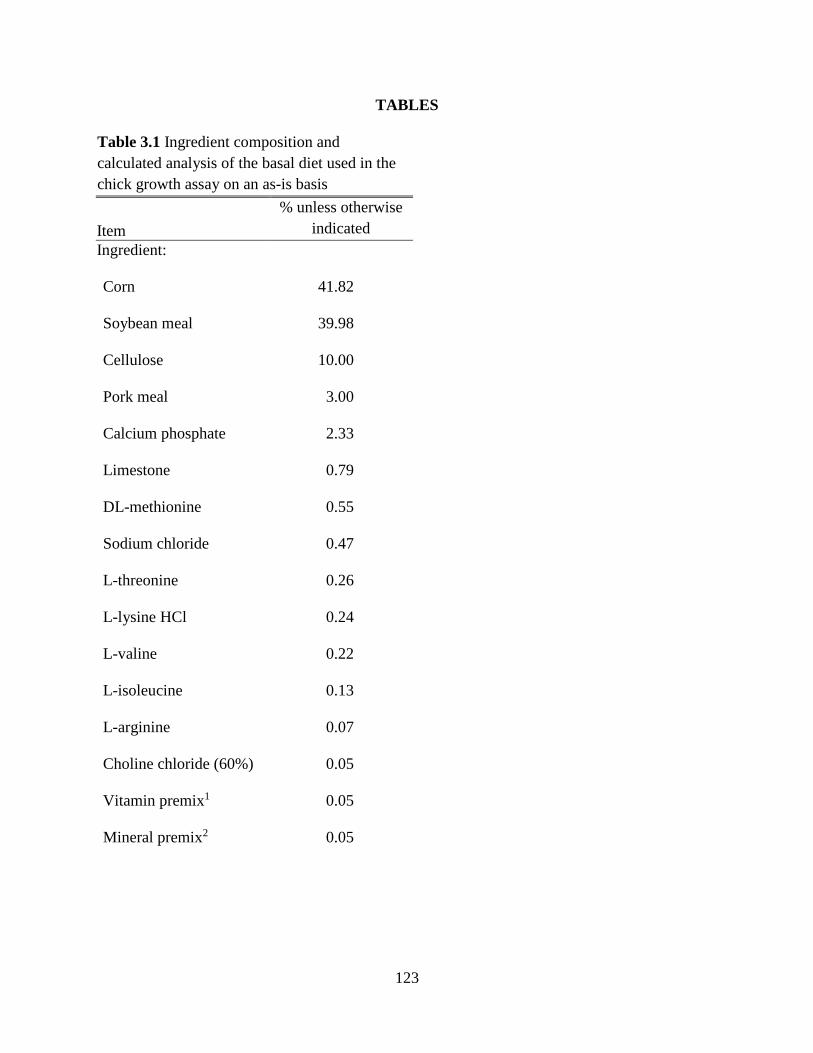
123
TABLES
Table 3.1 Ingredient composition and
calculated analysis of the basal diet used in the
chick growth assay on an as-is basis
Item
% unless otherwise
indicated
Ingredient:
Corn 41.82
Soybean meal 39.98
Cellulose 10.00
Pork meal 3.00
Calcium phosphate 2.33
Limestone 0.79
DL-methionine 0.55
Sodium chloride 0.47
L-threonine 0.26
L-lysine HCl 0.24
L-valine 0.22
L-isoleucine 0.13
L-arginine 0.07
Choline chloride (60%) 0.05
Vitamin premix1 0.05
Mineral premix2 0.05
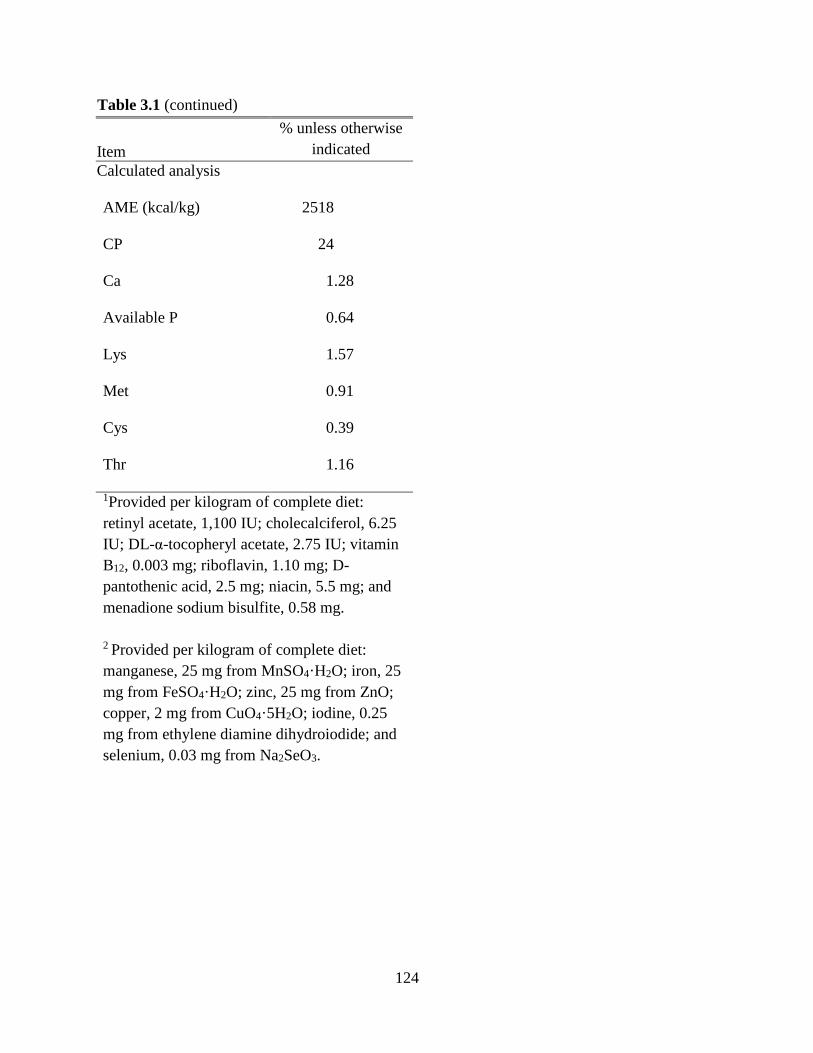
124
Table 3.1 (continued)
Item
% unless otherwise
indicated
Calculated analysis
AME (kcal/kg) 2518
CP 24
Ca 1.28
Available P 0.64
Lys 1.57
Met 0.91
Cys 0.39
Thr 1.16
1Provided per kilogram of complete diet:
retinyl acetate, 1,100 IU; cholecalciferol, 6.25
IU; DL-α-tocopheryl acetate, 2.75 IU; vitamin
B12, 0.003 mg; riboflavin, 1.10 mg; D-
pantothenic acid, 2.5 mg; niacin, 5.5 mg; and
menadione sodium bisulfite, 0.58 mg.
2 Provided per kilogram of complete diet:
manganese, 25 mg from MnSO4·H2O; iron, 25
mg from FeSO4·H2O; zinc, 25 mg from ZnO;
copper, 2 mg from CuO4·5H2O; iodine, 0.25
mg from ethylene diamine dihydroiodide; and
selenium, 0.03 mg from Na2SeO3.
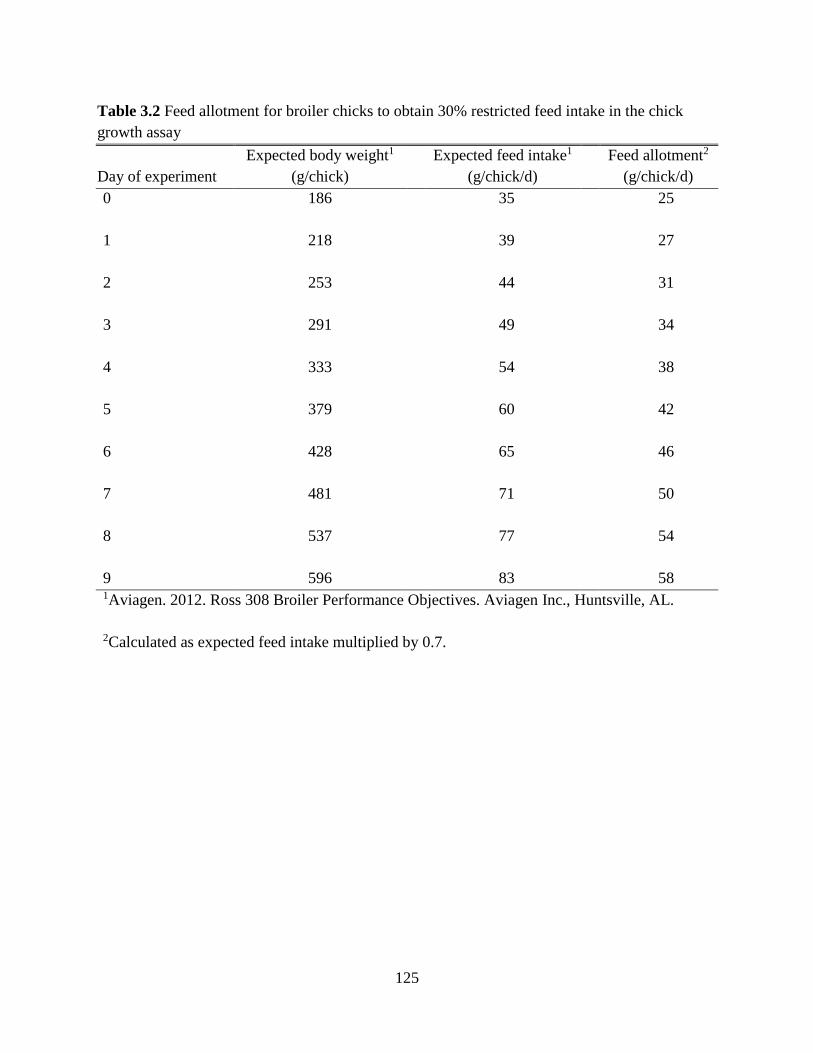
125
Table 3.2 Feed allotment for broiler chicks to obtain 30% restricted feed intake in the chick
growth assay
Day of experiment
Expected body weight1
(g/chick)
Expected feed intake1
(g/chick/d)
Feed allotment2
(g/chick/d)
0 186 35 25
1 218 39 27
2 253 44 31
3 291 49 34
4 333 54 38
5 379 60 42
6 428 65 46
7 481 71 50
8 537 77 54
9 596 83 58 1Aviagen. 2012. Ross 308 Broiler Performance Objectives. Aviagen Inc., Huntsville, AL.
2Calculated as expected feed intake multiplied by 0.7.
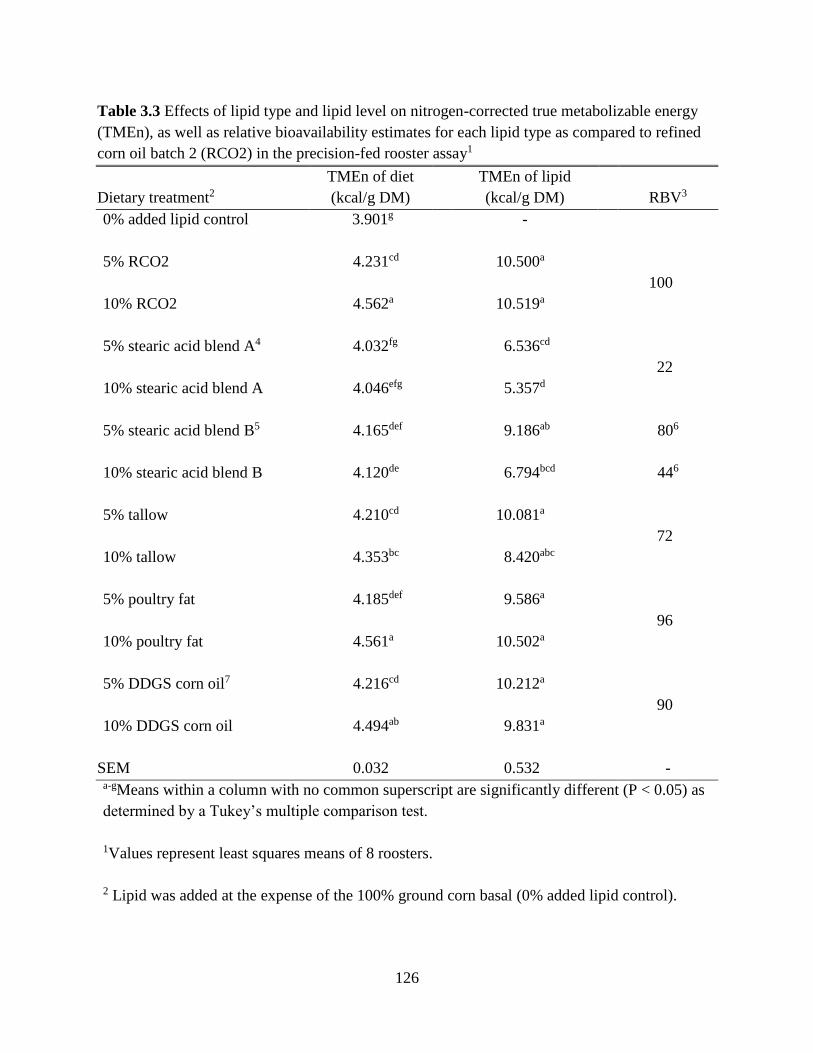
126
Table 3.3 Effects of lipid type and lipid level on nitrogen-corrected true metabolizable energy
(TMEn), as well as relative bioavailability estimates for each lipid type as compared to refined
corn oil batch 2 (RCO2) in the precision-fed rooster assay1
Dietary treatment2
TMEn of diet
(kcal/g DM)
TMEn of lipid
(kcal/g DM) RBV3
0% added lipid control 3.901g -
5% RCO2 4.231cd 10.500a
100
10% RCO2 4.562a 10.519a
5% stearic acid blend A4 4.032fg 6.536cd
22
10% stearic acid blend A 4.046efg 5.357d
5% stearic acid blend B5 4.165def 9.186ab 806
10% stearic acid blend B 4.120de 6.794bcd 446
5% tallow 4.210cd 10.081a
72
10% tallow 4.353bc 8.420abc
5% poultry fat 4.185def 9.586a
96
10% poultry fat 4.561a 10.502a
5% DDGS corn oil7 4.216cd 10.212a
90
10% DDGS corn oil 4.494ab 9.831a
SEM 0.032 0.532 - a-gMeans within a column with no common superscript are significantly different (P < 0.05) as
determined by a Tukey’s multiple comparison test.
1Values represent least squares means of 8 roosters.
2 Lipid was added at the expense of the 100% ground corn basal (0% added lipid control).
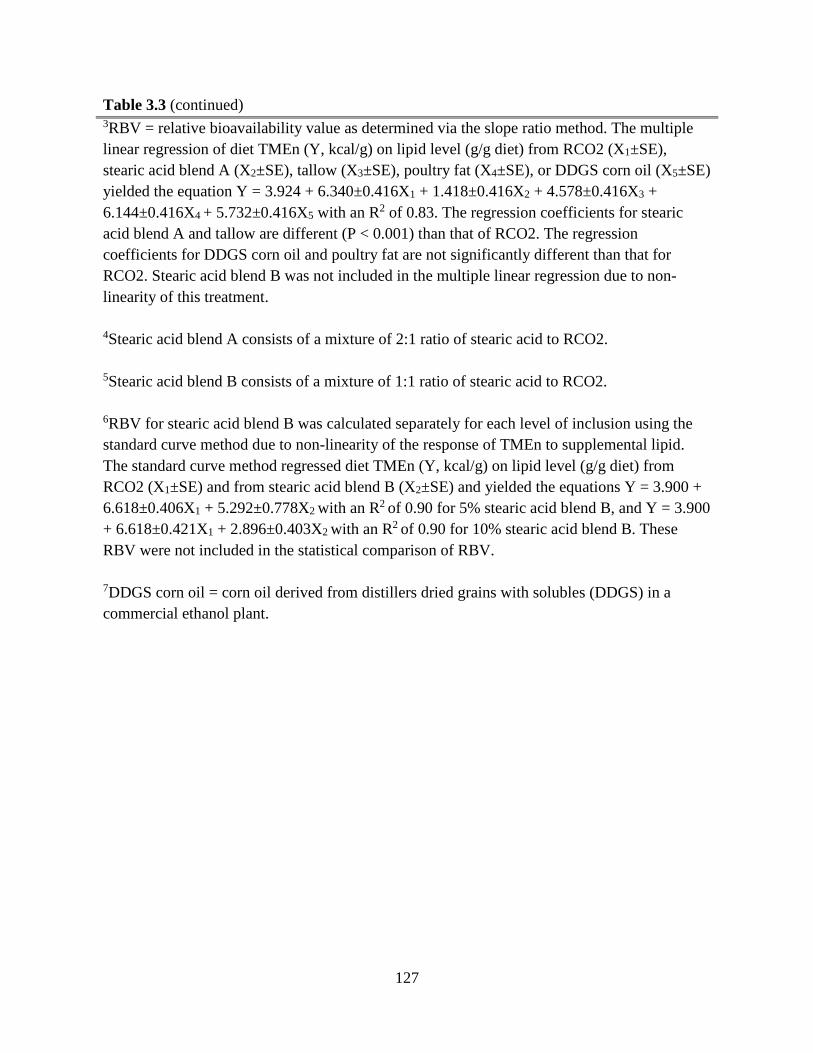
127
Table 3.3 (continued) 3RBV = relative bioavailability value as determined via the slope ratio method. The multiple
linear regression of diet TMEn (Y, kcal/g) on lipid level (g/g diet) from RCO2 (X1±SE),
stearic acid blend A (X2±SE), tallow (X3±SE), poultry fat (X4±SE), or DDGS corn oil (X5±SE)
yielded the equation Y = 3.924 + 6.340±0.416X1 + 1.418±0.416X2 + 4.578±0.416X3 +
6.144±0.416X4 + 5.732±0.416X5 with an R2 of 0.83. The regression coefficients for stearic
acid blend A and tallow are different (P < 0.001) than that of RCO2. The regression
coefficients for DDGS corn oil and poultry fat are not significantly different than that for
RCO2. Stearic acid blend B was not included in the multiple linear regression due to non-
linearity of this treatment.
4Stearic acid blend A consists of a mixture of 2:1 ratio of stearic acid to RCO2.
5Stearic acid blend B consists of a mixture of 1:1 ratio of stearic acid to RCO2.
6RBV for stearic acid blend B was calculated separately for each level of inclusion using the
standard curve method due to non-linearity of the response of TMEn to supplemental lipid.
The standard curve method regressed diet TMEn (Y, kcal/g) on lipid level (g/g diet) from
RCO2 (X1±SE) and from stearic acid blend B (X2±SE) and yielded the equations Y = 3.900 +
6.618±0.406X1 + 5.292±0.778X2 with an R2 of 0.90 for 5% stearic acid blend B, and Y = 3.900
+ 6.618±0.421X1 + 2.896±0.403X2 with an R2 of 0.90 for 10% stearic acid blend B. These
RBV were not included in the statistical comparison of RBV.
7DDGS corn oil = corn oil derived from distillers dried grains with solubles (DDGS) in a
commercial ethanol plant.
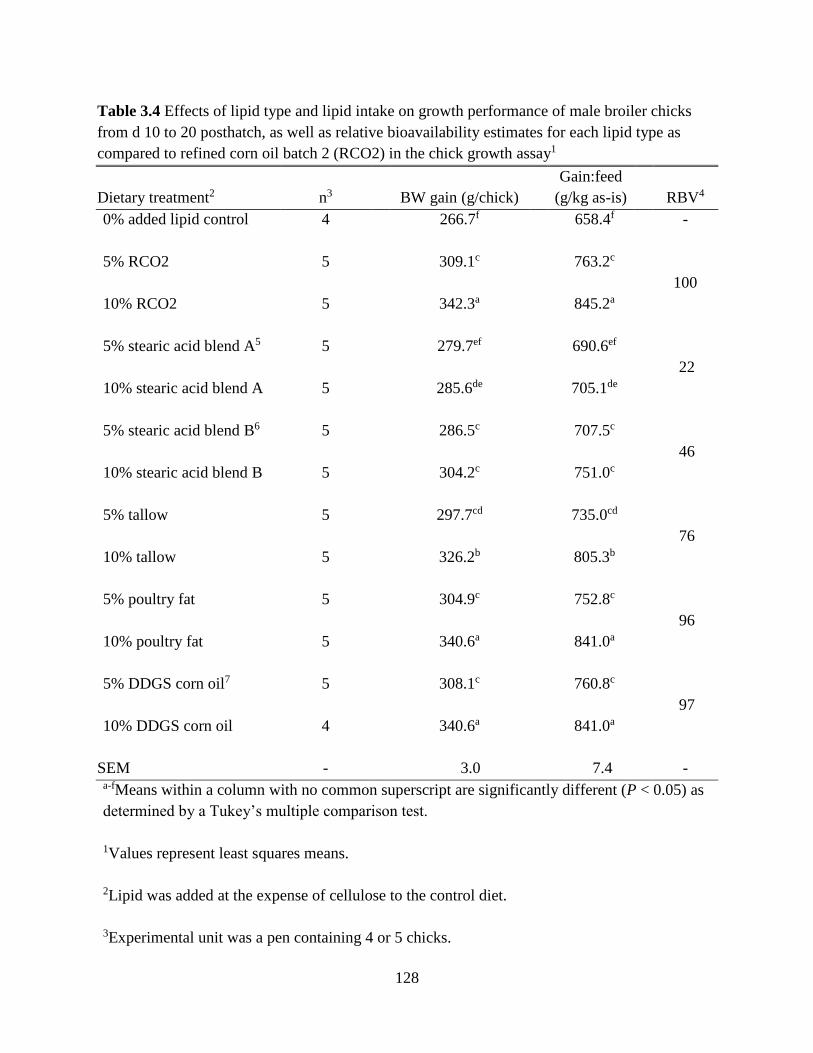
128
Table 3.4 Effects of lipid type and lipid intake on growth performance of male broiler chicks
from d 10 to 20 posthatch, as well as relative bioavailability estimates for each lipid type as
compared to refined corn oil batch 2 (RCO2) in the chick growth assay1
Dietary treatment2 n3 BW gain (g/chick)
Gain:feed
(g/kg as-is) RBV4
0% added lipid control 4 266.7f 658.4f -
5% RCO2 5 309.1c 763.2c
100
10% RCO2 5 342.3a 845.2a
5% stearic acid blend A5 5 279.7ef 690.6ef
22
10% stearic acid blend A 5 285.6de 705.1de
5% stearic acid blend B6 5 286.5c 707.5c
46
10% stearic acid blend B 5 304.2c 751.0c
5% tallow 5 297.7cd 735.0cd
76
10% tallow 5 326.2b 805.3b
5% poultry fat 5 304.9c 752.8c
96
10% poultry fat 5 340.6a 841.0a
5% DDGS corn oil7 5 308.1c 760.8c
97
10% DDGS corn oil 4 340.6a 841.0a
SEM - 3.0 7.4 - a-fMeans within a column with no common superscript are significantly different (P < 0.05) as
determined by a Tukey’s multiple comparison test.
1Values represent least squares means.
2Lipid was added at the expense of cellulose to the control diet.
3Experimental unit was a pen containing 4 or 5 chicks.
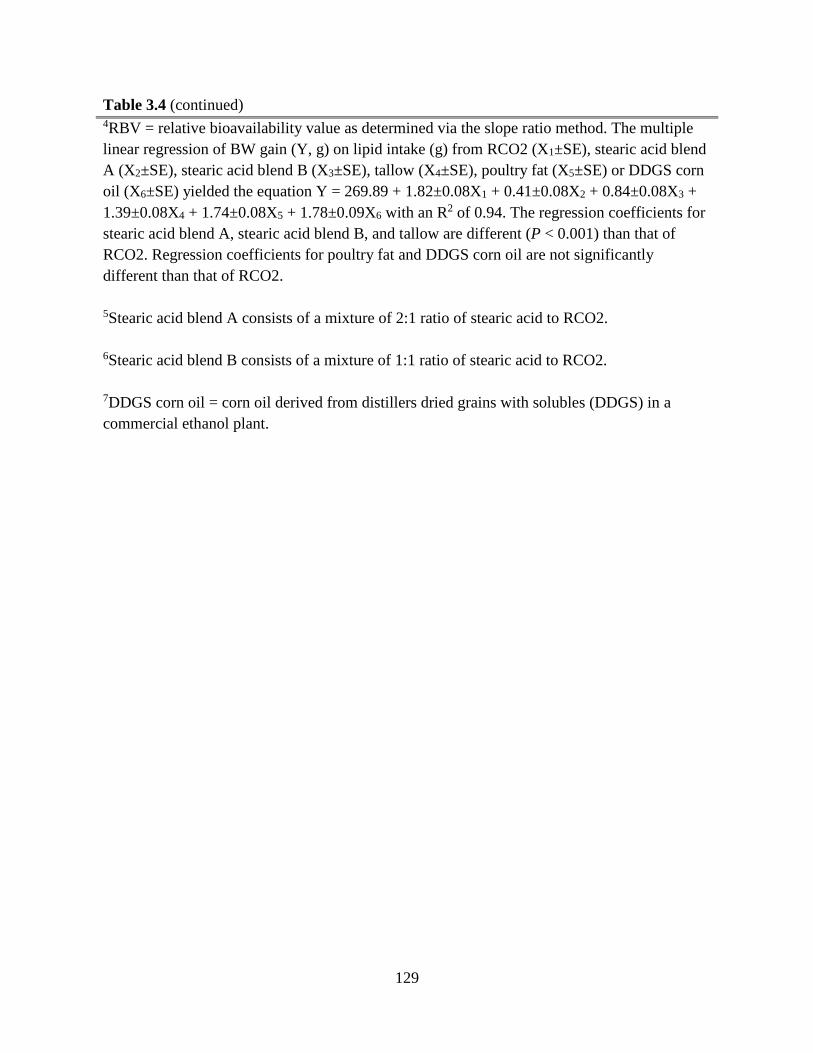
129
Table 3.4 (continued) 4RBV = relative bioavailability value as determined via the slope ratio method. The multiple
linear regression of BW gain (Y, g) on lipid intake (g) from RCO2 (X1±SE), stearic acid blend
A (X2±SE), stearic acid blend B (X3±SE), tallow (X4±SE), poultry fat (X5±SE) or DDGS corn
oil (X6±SE) yielded the equation Y = 269.89 + 1.82±0.08X1 + 0.41±0.08X2 + 0.84±0.08X3 +
1.39±0.08X4 + 1.74±0.08X5 + 1.78±0.09X6 with an R2 of 0.94. The regression coefficients for
stearic acid blend A, stearic acid blend B, and tallow are different (P < 0.001) than that of
RCO2. Regression coefficients for poultry fat and DDGS corn oil are not significantly
different than that of RCO2.
5Stearic acid blend A consists of a mixture of 2:1 ratio of stearic acid to RCO2.
6Stearic acid blend B consists of a mixture of 1:1 ratio of stearic acid to RCO2.
7DDGS corn oil = corn oil derived from distillers dried grains with solubles (DDGS) in a
commercial ethanol plant.
130
CHAPTER 4
FUTURE DIRECTIONS AND CONCLUSIONS
FUTURE DIRECTIONS
Future work should focus on slight modifications to the assay procedures to strengthen the
robustness of the slope-ratio precision-fed rooster assay. Primarily, it may be desirable to increase
the number of levels of non-zero supplemental fat or oil (lipid) inclusion to greater than two to aid
in meeting the statistical assumptions of the slope-ratio method. Due to limited numbers of roosters
available within our laboratory as well as efforts to keep costs for services low, keeping treatments
to a minimum is frequently desired and may be necessary. However, for samples that are suspected
to have characteristics such as high free fatty acid or high saturated fatty acid content that may
result in deviations from linearity, increasing the number of supplementation levels will likely aid
in obtaining more clear results.
CONCLUSIONS
The slope-ratio precision-fed rooster assay holds considerable potential as a new method
for the routine evaluation of lipids that are used in poultry diets. The assay is simple, rapid, and
yields data that are meaningful to commercial poultry nutritionists (R. Mitchell, personal
communication, 2015). In many cases, lipids that are commonly fed in the poultry industry (such
as poultry fat and DDGS corn oil) had equivalent relative bioavailability values (RBV) as refined
corn oil (RCO). This indicates that these lipid sources are excellent sources of available energy for
poultry. However, equivalent RBV of the test lipid was not seen in all cases, highlighting the need
to detect and quantify these inferior lipid sources. The slope-ratio precision-fed rooster assay was
shown to be able to do so reliably and repeatability.
131
The slope-ratio chick growth assay also was able to detect and quantify inferior lipid
sources, and may hold potential for lipid analysis for laboratories that are not equipped to perform
the slope-ratio precision-fed rooster assay. The slope-ratio chick growth assay is much more labor
intensive than the slope-ratio precision-fed rooster assay, and thus the precision-fed rooster assay
is likely to be preferred. Furthermore, the very small amount of lipid sample required for the
precision-fed rooster assay makes it highly suitable for the evaluation of novel lipids that are only
available in small quantities, as well as for lipids that must be shipped long distances to be
analyzed.
Excellent agreement was obtained for RBV between roosters (slope-ratio precision-fed
rooster assay) and chicks (slope-ratio chick growth assay). The RBV and the ranking of the lipids
were similar for both bird types. This indicates that the RBV obtained with adult roosters are
applicable for use in young broiler chicks, which is a major requirement that must be met for the
RBV to be maximally useful to the commercial poultry industry. Thus, the slope-ratio precision-
fed rooster assay is a rapid, simple, and reliable method for use in the generation of relative
available energy values for lipids for use in poultry diets.