Embed Size (px)
Citation preview
Optics and Lasers in Engineering 49 (2011) 1301–1308
Contents lists available at ScienceDirect
Optics and Lasers in Engineering
0143-81
doi:10.1
n Corr
E-m
journal homepage: www.elsevier.com/locate/optlaseng
Determination of Young’s modulus of epoxy coated polyethylenemicro-cantilever using phase-shift shadow moire method
J.H. Lim a, M.M. Ratnam a,n, I.A. Azid a, D. Mutharasu b
a School of Mechanical Engineering, Engineering Campus, University Sains Malaysia, 14300 Nibong Tebal, Penang, Malaysiab School of Physics, Universiti Sains Malaysia, 11800 Penang, Malaysia
a r t i c l e i n f o
Article history:
Received 12 November 2010
Received in revised form
19 May 2011
Accepted 1 June 2011Available online 13 July 2011
Keywords:
Polyethylene terephthalate (PET)
Phase-shift shadow moire (PSSM)
Young0s modulus
66/$ - see front matter & 2011 Elsevier Ltd. A
016/j.optlaseng.2011.06.005
esponding author. Tel.: þ604 5996325; fax:
ail address: [email protected] (M.M. Ratn
a b s t r a c t
Young0s moduli of various epoxy coated polyethylene terephthalate (PET) micro-cantilevers were
determined from the deflection results obtained using the phase-shift shadow moire (PSSM) method.
The filler materials for epoxy coatings were aluminum and graphite powders that were mixed with
epoxy at various percentages. Young0s moduli were calculated from theory based on the deflection
results. The PET micro-cantilever coated with aluminum-epoxy coating showed increasing value of
Young0s modulus when the ratios of the aluminum-epoxy were increased. The graphite-epoxy coating
on the PET micro-cantilever also showed the same trend. The experimental results also show that
Young0s modulus of the graphite-epoxy coating is higher than aluminum-epoxy coating in comparison
at the same mixing ratio.
& 2011 Elsevier Ltd. All rights reserved.
1. Introduction
Silicon-based materials have been widely used in the fabrica-tion of many mechanical structures in micro-electromechanicalsystem (MEMS) [1]. The widely accepted use of the silicon-basedmaterials in MEMS are mainly because the mechanical structurescan be readily fabricated using surface micro-machining techni-ques [2] and the silicon-based structures can be easily integratedwith electronic circuits. With the improvement of the fabricationtechnology, such as polymer-based micro-machining technique [3]of the polymeric materials, it is possible to fabricate the MEMSstructures using polymer-based materials. The significant advan-tages of polymer-based MEMS over the silicon-based MEMS arethat the polymers are ductile but have high impact resistance andflexibility. Moreover, Young0s modulus of the material can be easilyaltered using conductive fillers, reinforcement or coatings.
The amorphous type of polyethylene terephthalate (PET) hasthe advantages of high impact-resistant, lightweight and flexibility.When fabricated in the biaxial oriented thin film form, the PET filmhas high strength-to-weight ratios and flexibility. As such, the PETfilm is often used in applications such as flexible food packaging,thermal insulation and tape applications, such as carriers formagnetic tapes and backing for pressure sensitive adhesive tapes.PET has a relatively low Young0s modulus, which is 50–100 timeslower than that of silicon [4]. Thus, PET micro-cantilevers are moresensitive to deflection compared to silicon. Furthermore, PET
ll rights reserved.
þ604 5941025.
am).
micro-cantilever can be coated with various materials to alterYoung0s modulus.
The value of Young0s modulus of coated PET micro-cantilevermust be determined accurately to facilitate the design andfabrication of MEMS. However, the micro-scale of the MEMSstructures makes the conventional tensile or bending tests diffi-cult to be applied to the MEMS. The early effort to determineYoung0s modulus of micro-cantilever was carried out by Sharpeet al. [5]. In their method a two-layer polysilicon specimen ofdimensions 4 mm length, 0.6 mm wide and 3.5 mm thick wassubjected to tensile test. Optical method, namely interferometricstrain/displacement gage (ISDG), was applied to measure the in-plane displacement. The ISDG tensile test method was modifiedby Zupan et al. [6] and later was also used by Cho et al. [7] tomeasure Young0s modulus of LIGA (an acronym from the Germanwords for lithography, electroplating and molding) nickel micro-samples of dimensions 3.7 mm�1.9 mm�0.4 mm. The majordisadvantage of the ISDG tensile test and other tensile testingmethod is that the test samples are relatively large in dimensions;therefore this technique is difficult to be applied on MEMScantilever at the nominal size.
The bending test is an alternative method to determine Young0smodulus, especially for materials fabricated in thin strips. For thebending test of MEMS structures, the out-of-plane deflectionprofiles must be determined using non-contact method. This isbecause in the conventional point-wise tactile methods the probeof the measuring device will impose an additional load onto themicro-structure, thus contributing to significant measurementerrors. Wang et al. [8,9] applied optical interferometry techniqueto measure the deflection of the MEMS cantilever of dimensions
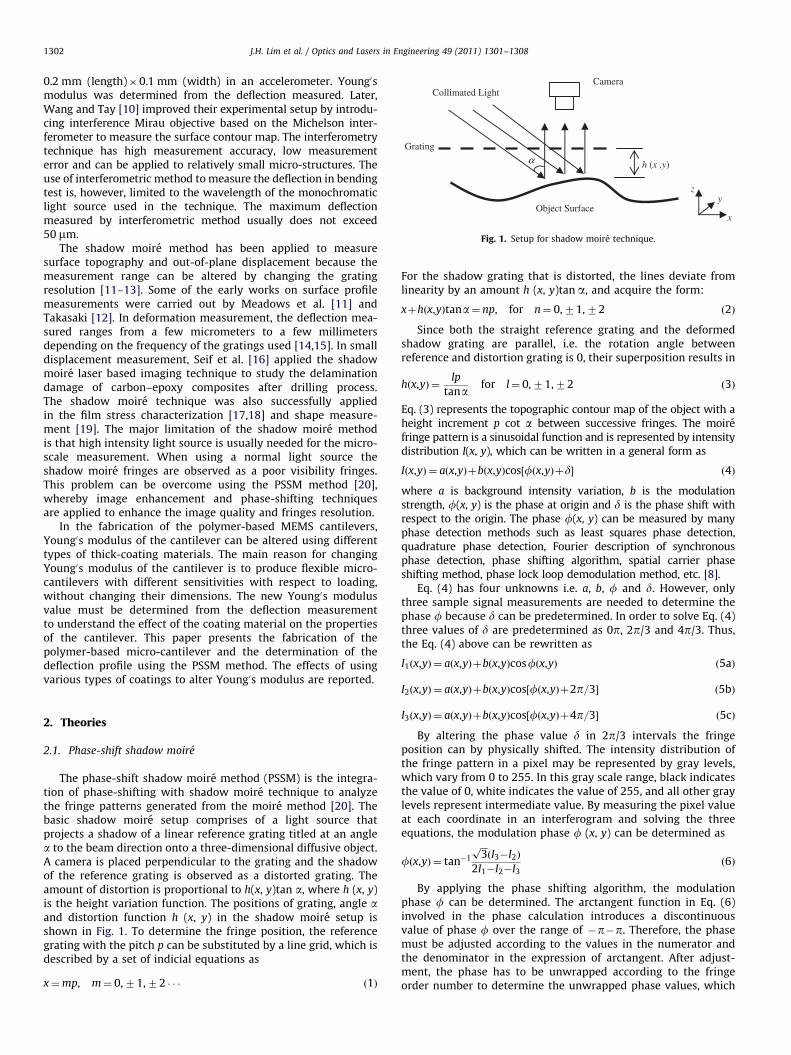
α h (x ,y)
Collimated LightCamera
Object Surface
Grating
zy
x
Fig. 1. Setup for shadow moire technique.
J.H. Lim et al. / Optics and Lasers in Engineering 49 (2011) 1301–13081302
0.2 mm (length)�0.1 mm (width) in an accelerometer. Young0smodulus was determined from the deflection measured. Later,Wang and Tay [10] improved their experimental setup by introdu-cing interference Mirau objective based on the Michelson inter-ferometer to measure the surface contour map. The interferometrytechnique has high measurement accuracy, low measurementerror and can be applied to relatively small micro-structures. Theuse of interferometric method to measure the deflection in bendingtest is, however, limited to the wavelength of the monochromaticlight source used in the technique. The maximum deflectionmeasured by interferometric method usually does not exceed50 mm.
The shadow moire method has been applied to measuresurface topography and out-of-plane displacement because themeasurement range can be altered by changing the gratingresolution [11–13]. Some of the early works on surface profilemeasurements were carried out by Meadows et al. [11] andTakasaki [12]. In deformation measurement, the deflection mea-sured ranges from a few micrometers to a few millimetersdepending on the frequency of the gratings used [14,15]. In smalldisplacement measurement, Seif et al. [16] applied the shadowmoire laser based imaging technique to study the delaminationdamage of carbon–epoxy composites after drilling process.The shadow moire technique was also successfully appliedin the film stress characterization [17,18] and shape measure-ment [19]. The major limitation of the shadow moire methodis that high intensity light source is usually needed for the micro-scale measurement. When using a normal light source theshadow moire fringes are observed as a poor visibility fringes.This problem can be overcome using the PSSM method [20],whereby image enhancement and phase-shifting techniquesare applied to enhance the image quality and fringes resolution.
In the fabrication of the polymer-based MEMS cantilevers,Young0s modulus of the cantilever can be altered using differenttypes of thick-coating materials. The main reason for changingYoung0s modulus of the cantilever is to produce flexible micro-cantilevers with different sensitivities with respect to loading,without changing their dimensions. The new Young0s modulusvalue must be determined from the deflection measurementto understand the effect of the coating material on the propertiesof the cantilever. This paper presents the fabrication of thepolymer-based micro-cantilever and the determination of thedeflection profile using the PSSM method. The effects of usingvarious types of coatings to alter Young0s modulus are reported.
2. Theories
2.1. Phase-shift shadow moire
The phase-shift shadow moire method (PSSM) is the integra-tion of phase-shifting with shadow moire technique to analyzethe fringe patterns generated from the moire method [20]. Thebasic shadow moire setup comprises of a light source thatprojects a shadow of a linear reference grating titled at an anglea to the beam direction onto a three-dimensional diffusive object.A camera is placed perpendicular to the grating and the shadowof the reference grating is observed as a distorted grating. Theamount of distortion is proportional to h(x, y)tan a, where h (x, y)is the height variation function. The positions of grating, angle aand distortion function h (x, y) in the shadow moire setup isshown in Fig. 1. To determine the fringe position, the referencegrating with the pitch p can be substituted by a line grid, which isdescribed by a set of indicial equations as
x¼mp, m¼ 0,71,72 � � � ð1Þ
For the shadow grating that is distorted, the lines deviate fromlinearity by an amount h (x, y)tan a, and acquire the form:
xþhðx,yÞtana¼ np, for n¼ 0,71,72 ð2Þ
Since both the straight reference grating and the deformedshadow grating are parallel, i.e. the rotation angle betweenreference and distortion grating is 0, their superposition results in
hðx,yÞ ¼lp
tana for l¼ 0,71,72 ð3Þ
Eq. (3) represents the topographic contour map of the object with aheight increment p cot a between successive fringes. The moirefringe pattern is a sinusoidal function and is represented by intensitydistribution I(x, y), which can be written in a general form as
Iðx,yÞ ¼ aðx,yÞþbðx,yÞcos½fðx,yÞþd� ð4Þ
where a is background intensity variation, b is the modulationstrength, f(x, y) is the phase at origin and d is the phase shift withrespect to the origin. The phase f(x, y) can be measured by manyphase detection methods such as least squares phase detection,quadrature phase detection, Fourier description of synchronousphase detection, phase shifting algorithm, spatial carrier phaseshifting method, phase lock loop demodulation method, etc. [8].
Eq. (4) has four unknowns i.e. a, b, f and d. However, onlythree sample signal measurements are needed to determine thephase f because d can be predetermined. In order to solve Eq. (4)three values of d are predetermined as 0p, 2p/3 and 4p/3. Thus,the Eq. (4) above can be rewritten as
I1ðx,yÞ ¼ aðx,yÞþbðx,yÞcosfðx,yÞ ð5aÞ
I2ðx,yÞ ¼ aðx,yÞþbðx,yÞcos½fðx,yÞþ2p=3� ð5bÞ
I3ðx,yÞ ¼ aðx,yÞþbðx,yÞcos½fðx,yÞþ4p=3� ð5cÞ
By altering the phase value d in 2p/3 intervals the fringeposition can by physically shifted. The intensity distribution ofthe fringe pattern in a pixel may be represented by gray levels,which vary from 0 to 255. In this gray scale range, black indicatesthe value of 0, white indicates the value of 255, and all other graylevels represent intermediate value. By measuring the pixel valueat each coordinate in an interferogram and solving the threeequations, the modulation phase f (x, y) can be determined as
fðx,yÞ ¼ tan�1
ffiffiffi3pðI3�I2Þ
2I1�I2�I3ð6Þ
By applying the phase shifting algorithm, the modulationphase f can be determined. The arctangent function in Eq. (6)involved in the phase calculation introduces a discontinuousvalue of phase f over the range of �p�p. Therefore, the phasemust be adjusted according to the values in the numerator andthe denominator in the expression of arctangent. After adjust-ment, the phase has to be unwrapped according to the fringeorder number to determine the unwrapped phase values, which
J.H. Lim et al. / Optics and Lasers in Engineering 49 (2011) 1301–1308 1303
represents the actual height measurement. The detailed work onphase unwrapping can be found elsewhere, e.g. Ref. [8].
2.2. Deflection equation for cantilever
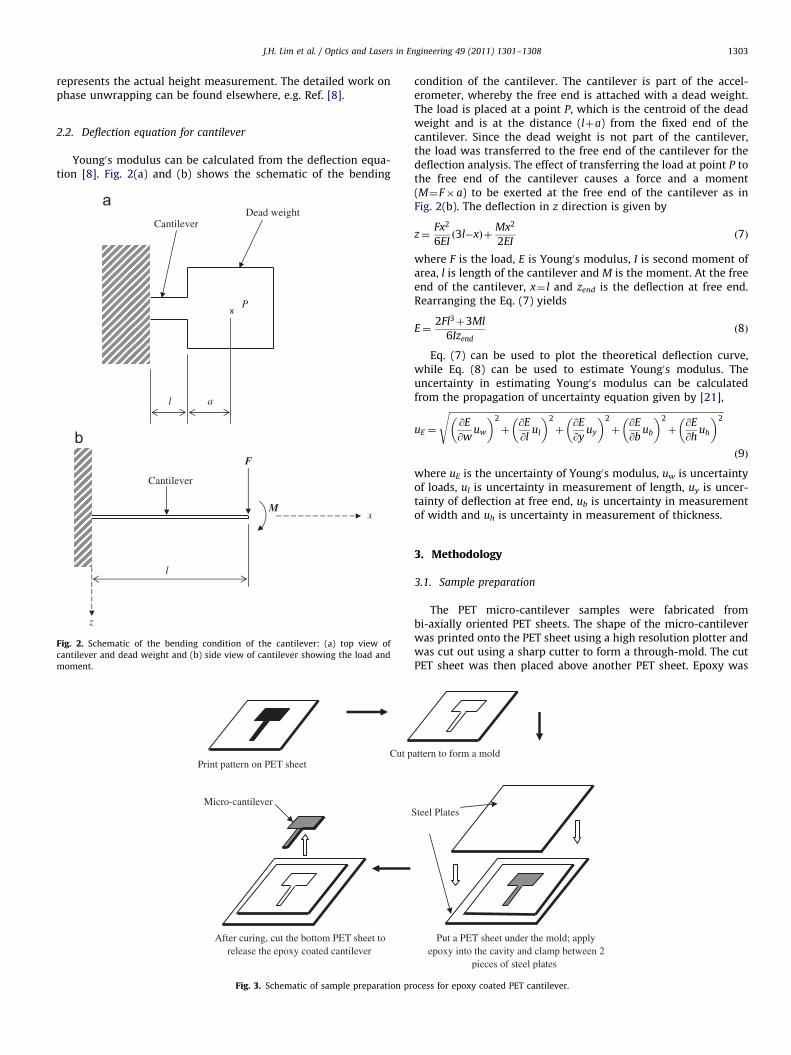
Young0s modulus can be calculated from the deflection equa-tion [8]. Fig. 2(a) and (b) shows the schematic of the bending
al
CantileverDead weight
P
z
l
M
F
x
Cantilever
Fig. 2. Schematic of the bending condition of the cantilever: (a) top view of
cantilever and dead weight and (b) side view of cantilever showing the load and
moment.
Print pattern on PET sheet Cut p
After curing, cut the bottom PET sheet to release the epoxy coated cantilever
Micro-cantilever
Fig. 3. Schematic of sample preparation pr
condition of the cantilever. The cantilever is part of the accel-erometer, whereby the free end is attached with a dead weight.The load is placed at a point P, which is the centroid of the deadweight and is at the distance (lþa) from the fixed end of thecantilever. Since the dead weight is not part of the cantilever,the load was transferred to the free end of the cantilever for thedeflection analysis. The effect of transferring the load at point P tothe free end of the cantilever causes a force and a moment(M¼F� a) to be exerted at the free end of the cantilever as inFig. 2(b). The deflection in z direction is given by
z¼Fx2
6EIð3l�xÞþ
Mx2
2EIð7Þ
where F is the load, E is Young0s modulus, I is second moment ofarea, l is length of the cantilever and M is the moment. At the freeend of the cantilever, x¼ l and zend is the deflection at free end.Rearranging the Eq. (7) yields
E¼2Fl3þ3Ml
6Izendð8Þ
Eq. (7) can be used to plot the theoretical deflection curve,while Eq. (8) can be used to estimate Young0s modulus. Theuncertainty in estimating Young0s modulus can be calculatedfrom the propagation of uncertainty equation given by [21],
uE ¼
ffiffiffiffiffiffiffiffiffiffiffiffiffiffiffiffiffiffiffiffiffiffiffiffiffiffiffiffiffiffiffiffiffiffiffiffiffiffiffiffiffiffiffiffiffiffiffiffiffiffiffiffiffiffiffiffiffiffiffiffiffiffiffiffiffiffiffiffiffiffiffiffiffiffiffiffiffiffiffiffiffiffiffiffiffiffiffiffiffiffiffiffiffiffiffiffiffiffiffiffiffiffiffiffiffiffiffiffiffiffiffiffiffiffiffiffiffiffiffiffi@E
@wuw
� �2
þ@E
@lul
� �2
þ@E
@yuy
� �2
þ@E
@bub
� �2
þ@E
@huh
� �2s
ð9Þ
where uE is the uncertainty of Young0s modulus, uw is uncertaintyof loads, ul is uncertainty in measurement of length, uy is uncer-tainty of deflection at free end, ub is uncertainty in measurementof width and uh is uncertainty in measurement of thickness.
3. Methodology
3.1. Sample preparation
The PET micro-cantilever samples were fabricated frombi-axially oriented PET sheets. The shape of the micro-cantileverwas printed onto the PET sheet using a high resolution plotter andwas cut out using a sharp cutter to form a through-mold. The cutPET sheet was then placed above another PET sheet. Epoxy was
attern to form a mold
Put a PET sheet under the mold; apply epoxy into the cavity and clamp between 2
pieces of steel plates
Steel Plates
ocess for epoxy coated PET cantilever.
J.H. Lim et al. / Optics and Lasers in Engineering 49 (2011) 1301–13081304
applied into the cavity and the assembly was sandwichedin-between two pieces of steel plates. After curing, the PET sheetthat was coated with epoxy was cut to release the cantilever.The molding technique applied in this process ensures an eventhickness of epoxy layer. Fig. 3 shows the steps for the samplepreparation. Three types of epoxy coatings were prepared,i.e. pure epoxy coating, aluminum-epoxy mixture and graphite-epoxy mixture coating. The compositions of the aluminum-to-epoxy and graphite-to-epoxy ratio in the mixtures were arbitraryset as 10% , 20% and 30% weight, respectively. Three samples wereprepared for each type of cantilever coatings and the total numberof samples prepared was 21.
3.2. Experiments
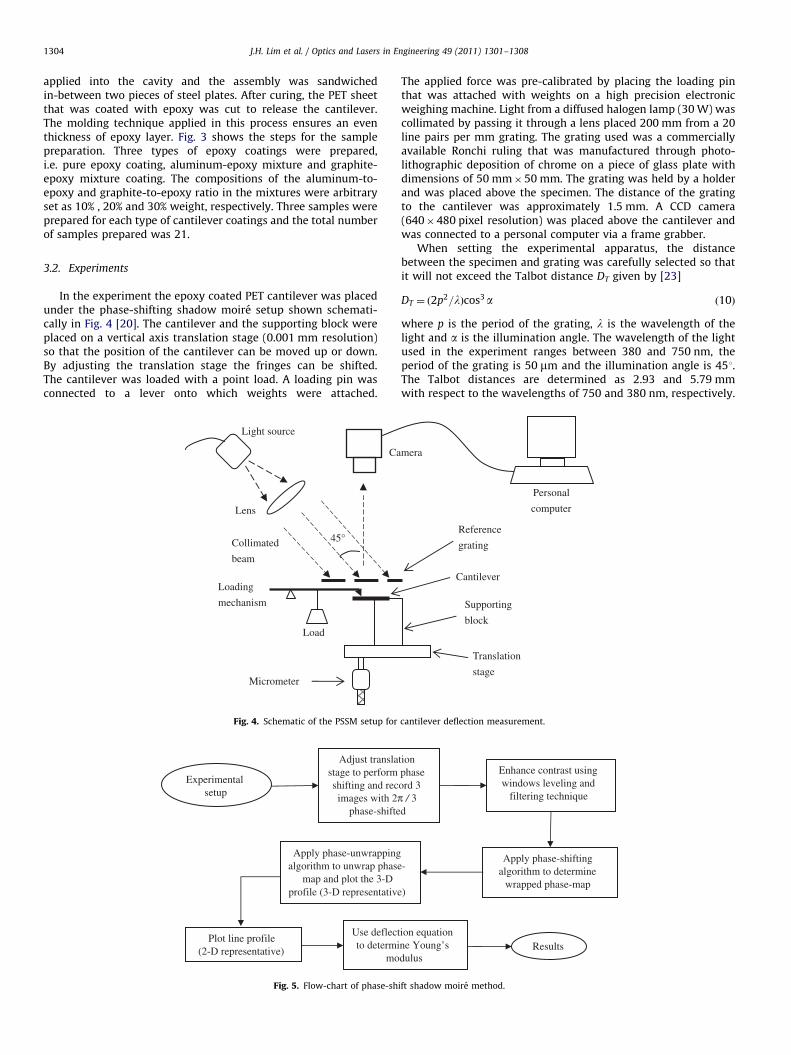
In the experiment the epoxy coated PET cantilever was placedunder the phase-shifting shadow moire setup shown schemati-cally in Fig. 4 [20]. The cantilever and the supporting block wereplaced on a vertical axis translation stage (0.001 mm resolution)so that the position of the cantilever can be moved up or down.By adjusting the translation stage the fringes can be shifted.The cantilever was loaded with a point load. A loading pin wasconnected to a lever onto which weights were attached.
45°
Ca
Light source
Collimated
beam
Loading
mechanism
Micrometer
Lens
Load
Fig. 4. Schematic of the PSSM setup for
Experimentalsetup
Adjust translastage to performshifting and recimages with 2π
phase-shifte
Apply phase-unwrappingalgorithm to unwrap phase
map and plot the 3-D profile (3-D representative
Plot line profile(2-D representative)
Use deflectto determi
mo
Fig. 5. Flow-chart of phase-sh
The applied force was pre-calibrated by placing the loading pinthat was attached with weights on a high precision electronicweighing machine. Light from a diffused halogen lamp (30 W) wascollimated by passing it through a lens placed 200 mm from a 20line pairs per mm grating. The grating used was a commerciallyavailable Ronchi ruling that was manufactured through photo-lithographic deposition of chrome on a piece of glass plate withdimensions of 50 mm�50 mm. The grating was held by a holderand was placed above the specimen. The distance of the gratingto the cantilever was approximately 1.5 mm. A CCD camera(640�480 pixel resolution) was placed above the cantilever andwas connected to a personal computer via a frame grabber.
When setting the experimental apparatus, the distancebetween the specimen and grating was carefully selected so thatit will not exceed the Talbot distance DT given by [23]
DT ¼ ð2p2=lÞcos3a ð10Þ
where p is the period of the grating, l is the wavelength of thelight and a is the illumination angle. The wavelength of the lightused in the experiment ranges between 380 and 750 nm, theperiod of the grating is 50 mm and the illumination angle is 451.The Talbot distances are determined as 2.93 and 5.79 mmwith respect to the wavelengths of 750 and 380 nm, respectively.
Personal
computer
mera
Reference
grating
Cantilever
Supporting
block
Translation
stage
cantilever deflection measurement.
tion phase ord 3 / 3d
Apply phase-shifting algorithm to determine
wrapped phase-map
-
)
Results
Enhance contrast using windows leveling and
filtering technique
ion equation ne Young’s dulus
ift shadow moire method.
J.H. Lim et al. / Optics and Lasers in Engineering 49 (2011) 1301–1308 1305
The use of the normal visible light is expected to reduce thecontrast significantly even when the specimen and grating areplaced within the Talbot distance. Han and Han [24] reported thatthe experimental error varies cyclically as the distance betweenthe reference grating and the specimen increases. However, theoptimum distance between the grating and specimen is slightlyless than 0.5DT [23]. The distance between specimen and gratingin our experimental is approximately 1.5 mm and is consideredacceptable.
Fig. 5 shows a flow-chart of the various stages of the PSSM indeflection measurement. In the experiment, the fringes wereshifted in three steps of 1/3 spacing, which is equivalent to aphase-shift angle of 2p/3. The 0, 2p/3 and 4p/3 phase-shiftedimages were captured and the contrasts of the images wereimproved using the image processing technique developed in
30% Al-EpoxyPure Epoxy 30% GP-Epoxy
0 5 10 mm
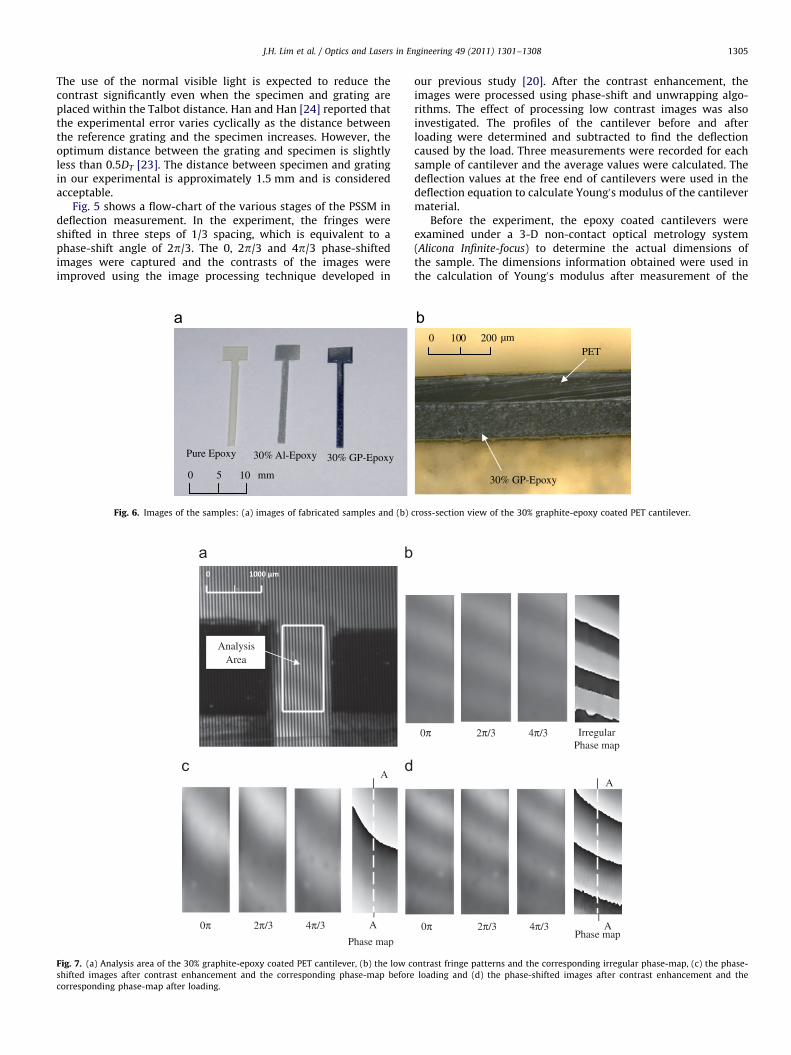
Fig. 6. Images of the samples: (a) images of fabricated samples and (b)
AnalysisArea
4π/30π
A
A2π/3
Phase map
Fig. 7. (a) Analysis area of the 30% graphite-epoxy coated PET cantilever, (b) the low c
shifted images after contrast enhancement and the corresponding phase-map before
corresponding phase-map after loading.
our previous study [20]. After the contrast enhancement, theimages were processed using phase-shift and unwrapping algo-rithms. The effect of processing low contrast images was alsoinvestigated. The profiles of the cantilever before and afterloading were determined and subtracted to find the deflectioncaused by the load. Three measurements were recorded for eachsample of cantilever and the average values were calculated. Thedeflection values at the free end of cantilevers were used in thedeflection equation to calculate Young0s modulus of the cantilevermaterial.
Before the experiment, the epoxy coated cantilevers wereexamined under a 3-D non-contact optical metrology system(Alicona Infinite-focus) to determine the actual dimensions ofthe sample. The dimensions information obtained were used inthe calculation of Young0s modulus after measurement of the
30% GP-Epoxy
PET0 100 200 µm
cross-section view of the 30% graphite-epoxy coated PET cantilever.
A0π 2π/3 4π/3Phase map
A
0π 2π/3 4π/3 IrregularPhase map
ontrast fringe patterns and the corresponding irregular phase-map, (c) the phase-
loading and (d) the phase-shifted images after contrast enhancement and the
J.H. Lim et al. / Optics and Lasers in Engineering 49 (2011) 1301–13081306
deflection. Based on the magnification used (10� ), the measure-ment tolerance of the Alicona profile projector was estimated tobe 2.0 mm. Fig. 6(a) shows the images of the samples andFig. 6(b) shows the cross-section view of the 30% graphite-epoxycoated PET cantilever.
In the deflection measurement, a 0.0515 N load was applied atthe centroid of the dead weight, which is located at a distance of4200 mm from the fixed end. The length of the cantilever portionis 1700 mm (free-end to fixed-end distance). The load applied wascarefully selected based on the fringes density. For the givencantilever dimension and grating resolution, the ideal fringesdensity is about three to four fringes over the length of2000 mm. Based on the estimation from the theory a 0.0515 Nload will produce three to four fringes on the cantilever surface.
4. Results and discussions
Fig. 7(a)–(d) shows the experimental results for 30% graphite-epoxy coated PET cantilever. Fig. 7(a) shows the analysis area ofthe cantilever. The analysis area shows the continuous fringepattern and therefore, the reflectivity at this area is consideredinsignificant. Fig. 7(b) shows the fringe patterns without contrastenhancement. The low contrast images cause serious errors andproduce irregular phase-map. After contrast enhancement, thephase-shifted images as well as the phase-map before and after
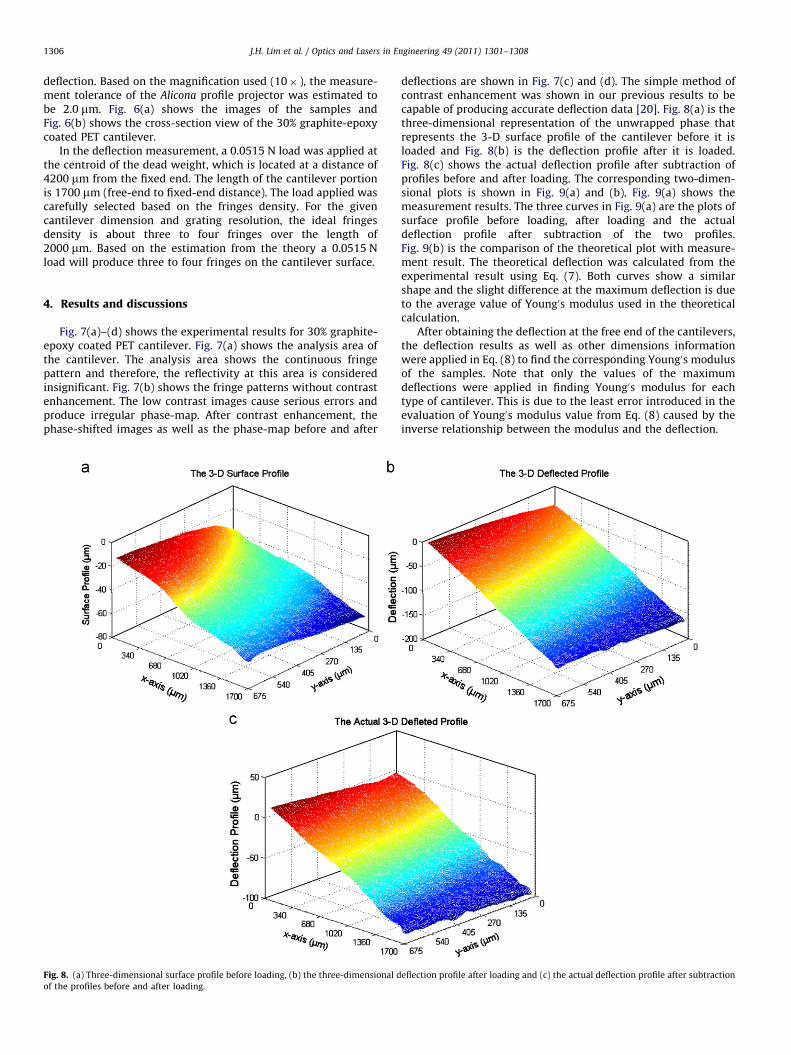
Fig. 8. (a) Three-dimensional surface profile before loading, (b) the three-dimensional d
of the profiles before and after loading.
deflections are shown in Fig. 7(c) and (d). The simple method ofcontrast enhancement was shown in our previous results to becapable of producing accurate deflection data [20]. Fig. 8(a) is thethree-dimensional representation of the unwrapped phase thatrepresents the 3-D surface profile of the cantilever before it isloaded and Fig. 8(b) is the deflection profile after it is loaded.Fig. 8(c) shows the actual deflection profile after subtraction ofprofiles before and after loading. The corresponding two-dimen-sional plots is shown in Fig. 9(a) and (b). Fig. 9(a) shows themeasurement results. The three curves in Fig. 9(a) are the plots ofsurface profile before loading, after loading and the actualdeflection profile after subtraction of the two profiles.Fig. 9(b) is the comparison of the theoretical plot with measure-ment result. The theoretical deflection was calculated from theexperimental result using Eq. (7). Both curves show a similarshape and the slight difference at the maximum deflection is dueto the average value of Young0s modulus used in the theoreticalcalculation.
After obtaining the deflection at the free end of the cantilevers,the deflection results as well as other dimensions informationwere applied in Eq. (8) to find the corresponding Young0s modulusof the samples. Note that only the values of the maximumdeflections were applied in finding Young0s modulus for eachtype of cantilever. This is due to the least error introduced in theevaluation of Young0s modulus value from Eq. (8) caused by theinverse relationship between the modulus and the deflection.
eflection profile after loading and (c) the actual deflection profile after subtraction
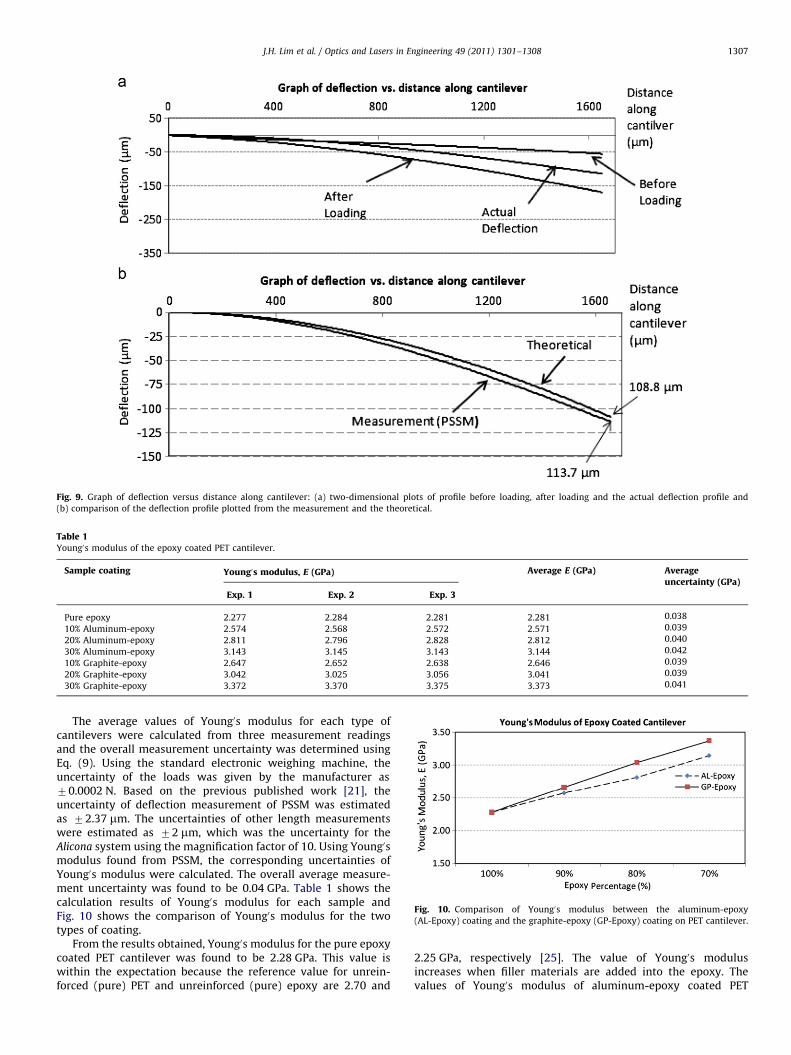
Fig. 9. Graph of deflection versus distance along cantilever: (a) two-dimensional plots of profile before loading, after loading and the actual deflection profile and
(b) comparison of the deflection profile plotted from the measurement and the theoretical.
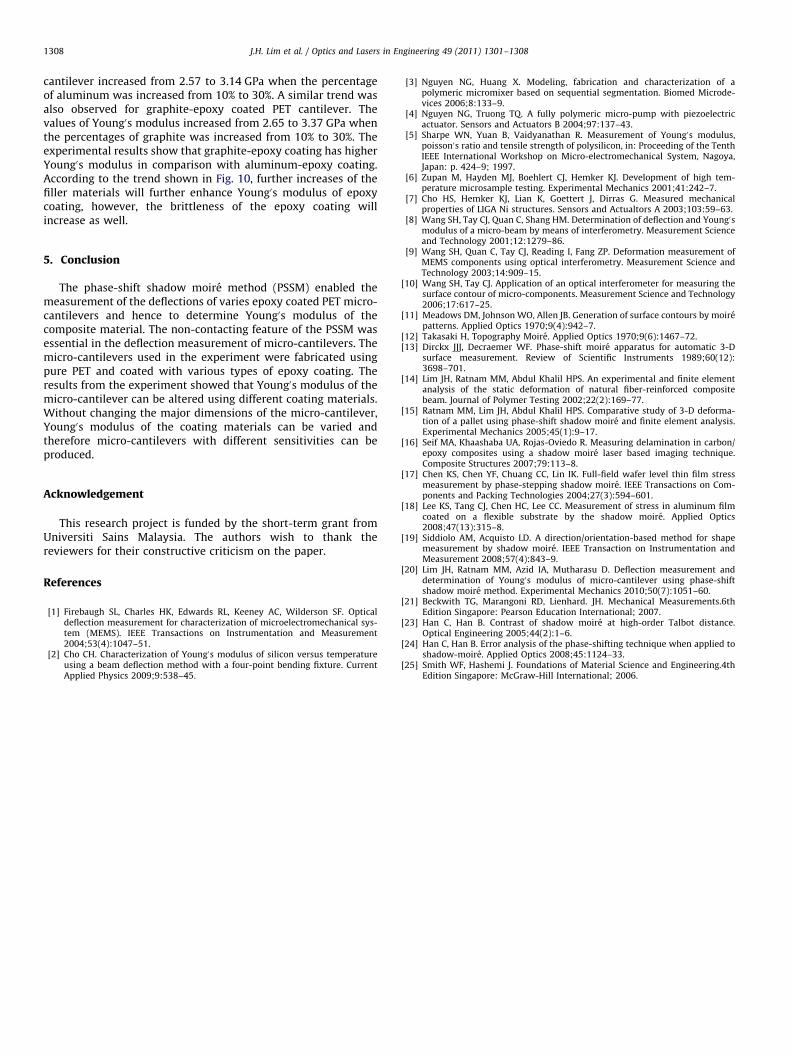
Table 1Young0s modulus of the epoxy coated PET cantilever.
Sample coating Young0s modulus, E (GPa) Average E (GPa) Averageuncertainty (GPa)
Exp. 1 Exp. 2 Exp. 3
Pure epoxy 2.277 2.284 2.281 2.281 0.038
10% Aluminum-epoxy 2.574 2.568 2.572 2.571 0.039
20% Aluminum-epoxy 2.811 2.796 2.828 2.812 0.040
30% Aluminum-epoxy 3.143 3.145 3.143 3.144 0.042
10% Graphite-epoxy 2.647 2.652 2.638 2.646 0.039
20% Graphite-epoxy 3.042 3.025 3.056 3.041 0.039
30% Graphite-epoxy 3.372 3.370 3.375 3.373 0.041
Fig. 10. Comparison of Young0s modulus between the aluminum-epoxy
(AL-Epoxy) coating and the graphite-epoxy (GP-Epoxy) coating on PET cantilever.
J.H. Lim et al. / Optics and Lasers in Engineering 49 (2011) 1301–1308 1307
The average values of Young0s modulus for each type ofcantilevers were calculated from three measurement readingsand the overall measurement uncertainty was determined usingEq. (9). Using the standard electronic weighing machine, theuncertainty of the loads was given by the manufacturer as70.0002 N. Based on the previous published work [21], theuncertainty of deflection measurement of PSSM was estimatedas 72.37 mm. The uncertainties of other length measurementswere estimated as 72 mm, which was the uncertainty for theAlicona system using the magnification factor of 10. Using Young0smodulus found from PSSM, the corresponding uncertainties ofYoung0s modulus were calculated. The overall average measure-ment uncertainty was found to be 0.04 GPa. Table 1 shows thecalculation results of Young0s modulus for each sample andFig. 10 shows the comparison of Young0s modulus for the twotypes of coating.
From the results obtained, Young0s modulus for the pure epoxycoated PET cantilever was found to be 2.28 GPa. This value iswithin the expectation because the reference value for unrein-forced (pure) PET and unreinforced (pure) epoxy are 2.70 and
2.25 GPa, respectively [25]. The value of Young0s modulusincreases when filler materials are added into the epoxy. Thevalues of Young0s modulus of aluminum-epoxy coated PET
J.H. Lim et al. / Optics and Lasers in Engineering 49 (2011) 1301–13081308
cantilever increased from 2.57 to 3.14 GPa when the percentageof aluminum was increased from 10% to 30%. A similar trend wasalso observed for graphite-epoxy coated PET cantilever. Thevalues of Young0s modulus increased from 2.65 to 3.37 GPa whenthe percentages of graphite was increased from 10% to 30%. Theexperimental results show that graphite-epoxy coating has higherYoung0s modulus in comparison with aluminum-epoxy coating.According to the trend shown in Fig. 10, further increases of thefiller materials will further enhance Young0s modulus of epoxycoating, however, the brittleness of the epoxy coating willincrease as well.
5. Conclusion
The phase-shift shadow moire method (PSSM) enabled themeasurement of the deflections of varies epoxy coated PET micro-cantilevers and hence to determine Young0s modulus of thecomposite material. The non-contacting feature of the PSSM wasessential in the deflection measurement of micro-cantilevers. Themicro-cantilevers used in the experiment were fabricated usingpure PET and coated with various types of epoxy coating. Theresults from the experiment showed that Young0s modulus of themicro-cantilever can be altered using different coating materials.Without changing the major dimensions of the micro-cantilever,Young0s modulus of the coating materials can be varied andtherefore micro-cantilevers with different sensitivities can beproduced.
Acknowledgement
This research project is funded by the short-term grant fromUniversiti Sains Malaysia. The authors wish to thank thereviewers for their constructive criticism on the paper.
References
[1] Firebaugh SL, Charles HK, Edwards RL, Keeney AC, Wilderson SF. Opticaldeflection measurement for characterization of microelectromechanical sys-tem (MEMS). IEEE Transactions on Instrumentation and Measurement2004;53(4):1047–51.
[2] Cho CH. Characterization of Young0s modulus of silicon versus temperatureusing a beam deflection method with a four-point bending fixture. CurrentApplied Physics 2009;9:538–45.
[3] Nguyen NG, Huang X. Modeling, fabrication and characterization of apolymeric micromixer based on sequential segmentation. Biomed Microde-vices 2006;8:133–9.
[4] Nguyen NG, Truong TQ. A fully polymeric micro-pump with piezoelectricactuator. Sensors and Actuators B 2004;97:137–43.
[5] Sharpe WN, Yuan B, Vaidyanathan R. Measurement of Young0s modulus,poisson0s ratio and tensile strength of polysilicon, in: Proceeding of the TenthIEEE International Workshop on Micro-electromechanical System, Nagoya,Japan: p. 424–9; 1997.
[6] Zupan M, Hayden MJ, Boehlert CJ, Hemker KJ. Development of high tem-perature microsample testing. Experimental Mechanics 2001;41:242–7.
[7] Cho HS, Hemker KJ, Lian K, Goettert J, Dirras G. Measured mechanicalproperties of LIGA Ni structures. Sensors and Actualtors A 2003;103:59–63.
[8] Wang SH, Tay CJ, Quan C, Shang HM. Determination of deflection and Young0smodulus of a micro-beam by means of interferometry. Measurement Scienceand Technology 2001;12:1279–86.
[9] Wang SH, Quan C, Tay CJ, Reading I, Fang ZP. Deformation measurement ofMEMS components using optical interferometry. Measurement Science andTechnology 2003;14:909–15.
[10] Wang SH, Tay CJ. Application of an optical interferometer for measuring thesurface contour of micro-components. Measurement Science and Technology2006;17:617–25.
[11] Meadows DM, Johnson WO, Allen JB. Generation of surface contours by moirepatterns. Applied Optics 1970;9(4):942–7.
[12] Takasaki H, Topography Moire. Applied Optics 1970;9(6):1467–72.[13] Dirckx JJJ, Decraemer WF. Phase-shift moire apparatus for automatic 3-D
surface measurement. Review of Scientific Instruments 1989;60(12):3698–701.
[14] Lim JH, Ratnam MM, Abdul Khalil HPS. An experimental and finite elementanalysis of the static deformation of natural fiber-reinforced compositebeam. Journal of Polymer Testing 2002;22(2):169–77.
[15] Ratnam MM, Lim JH, Abdul Khalil HPS. Comparative study of 3-D deforma-tion of a pallet using phase-shift shadow moire and finite element analysis.Experimental Mechanics 2005;45(1):9–17.
[16] Seif MA, Khaashaba UA, Rojas-Oviedo R. Measuring delamination in carbon/epoxy composites using a shadow moire laser based imaging technique.Composite Structures 2007;79:113–8.
[17] Chen KS, Chen YF, Chuang CC, Lin IK. Full-field wafer level thin film stressmeasurement by phase-stepping shadow moire. IEEE Transactions on Com-ponents and Packing Technologies 2004;27(3):594–601.
[18] Lee KS, Tang CJ, Chen HC, Lee CC. Measurement of stress in aluminum filmcoated on a flexible substrate by the shadow moire. Applied Optics2008;47(13):315–8.
[19] Siddiolo AM, Acquisto LD. A direction/orientation-based method for shapemeasurement by shadow moire. IEEE Transaction on Instrumentation andMeasurement 2008;57(4):843–9.
[20] Lim JH, Ratnam MM, Azid IA, Mutharasu D. Deflection measurement anddetermination of Young0s modulus of micro-cantilever using phase-shiftshadow moire method. Experimental Mechanics 2010;50(7):1051–60.
[21] Beckwith TG, Marangoni RD, Lienhard. JH. Mechanical Measurements.6thEdition Singapore: Pearson Education International; 2007.
[23] Han C, Han B. Contrast of shadow moire at high-order Talbot distance.Optical Engineering 2005;44(2):1–6.
[24] Han C, Han B. Error analysis of the phase-shifting technique when applied toshadow-moire. Applied Optics 2008;45:1124–33.
[25] Smith WF, Hashemi J. Foundations of Material Science and Engineering.4thEdition Singapore: McGraw-Hill International; 2006.