Embed Size (px)
Citation preview
DEPARTMENT OF INFORMATICS
Prof. Dr. Andreas Meier
Dr. M. A. Kaufmann
Seminar research paper
Determining boundary conditions of transformer station
clusters by Inductive Fuzzy Classification.
– Case study –
Student: Daria Kurochkina
Studies: Master in computer science
Semester: second
Student ID: 11-222-759
E-Mail: [email protected]
Fribourg, 06.12.2012

I
Abstract
The energy sector is changing from being unimaginative and lethargic to focused, exciting and
vigorously dynamic. External influences in this sector are constantly increasing: global warm-
ing, shortage of resources, demographic growth, change in society’s values, market liberalisa-
tion and etc. Changes create new rules such as competition, energy efficiency, new business
models, and energy production technologies. Regulations create new demand which raises
questions:
What can distinguish the company from others with new services or new business models?
What can help to identify the potential of cost reduction?
What is the most important information?
How can I acquire this information quick and comprehensive?
Existing processes and systems are not able to deliver the required answer in time, within
budget and with a satisfactory level of quality.
In the recent years, computational models are widely used in various fields and their use is
growing in the energy industry too. More and more companies started to apply data mining
methods for solving very wide range of tasks. For example, condition monitoring of high volt-
age electrical equipment. Other example is data clustering techniques – such as the self-organ-
izing map, that have been applied to vibration monitoring and analysis of transformer on-load
tap-changers.
Theoretical part of this paper briefly overviews new data mining methodology, inductive fuzzy
classification. Practical part represents how this methodology is used for solving the problem
of finding the boundary conditions of transformer station clusters. The purpose of the current
case study is to apply theoretical knowledge in handling the practical challenge.
Index terms
Data Mining, Inductive Fuzzy Classification, Fuzzy Data Analysis, Clusterization, Inductive
Reasoning, Energy Company, Transformer Station, Energy Grid,

II
Table of Contents
ABSTRACT .............................................................................................................................. I
INDEX TERMS ....................................................................................................................... I
TABLE OF CONTENTS ........................................................................................................ II
LIST OF FIGURES .............................................................................................................. III
LIST OF TABLES ................................................................................................................. III
LIST OF ABBREVIATIONS ............................................................................................... III
1 INTRODUCTION............................................................................................................ 1
1.1 Problem statement ................................................................................................................... 1
1.2 Objectives ................................................................................................................................. 2
2 THEORY .......................................................................................................................... 3
2.1 Neural Networks ...................................................................................................................... 3
2.2 Data mining .............................................................................................................................. 3
2.3 Classical set theory ................................................................................................................... 4
2.4 Inductive reasoning .................................................................................................................. 4
2.5 Inductive Fuzzy Classification ................................................................................................ 4
2.6 Weka and IFC_Filter ............................................................................................................... 5
3 SOLUTION ...................................................................................................................... 5
3.1 Data preparation ...................................................................................................................... 5
3.2 Attribute verification by Weka ............................................................................................... 8
3.3 Fuzzy boundary conditions ..................................................................................................... 8 3.3.1 Input .................................................................................................................................................... 8 3.3.2 Filter parameters ................................................................................................................................. 9 3.3.3 Evaluation process ............................................................................................................................... 9 3.3.4 Results ................................................................................................................................................. 9
3.4 Test the results ........................................................................................................................ 11
4 CONCLUSION .............................................................................................................. 12
5 REFERENCES ............................................................................................................... 13

III
List of Figures
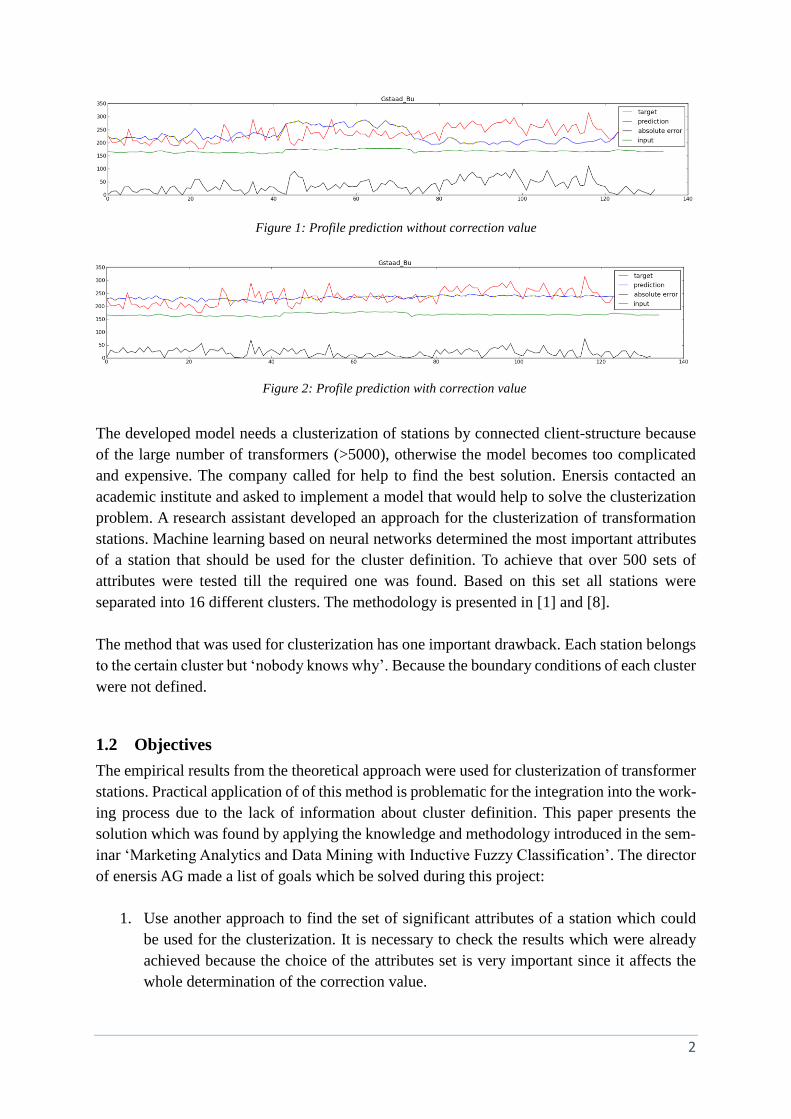
Figure 1: Profile prediction without correction value ................................................................ 2
Figure 2: Profile prediction with correction value ..................................................................... 2
Figure 3: The final table with transformer station data (the part) .............................................. 7
Figure 4: NLR, average value and inductive membership function of AO in target class ........ 9
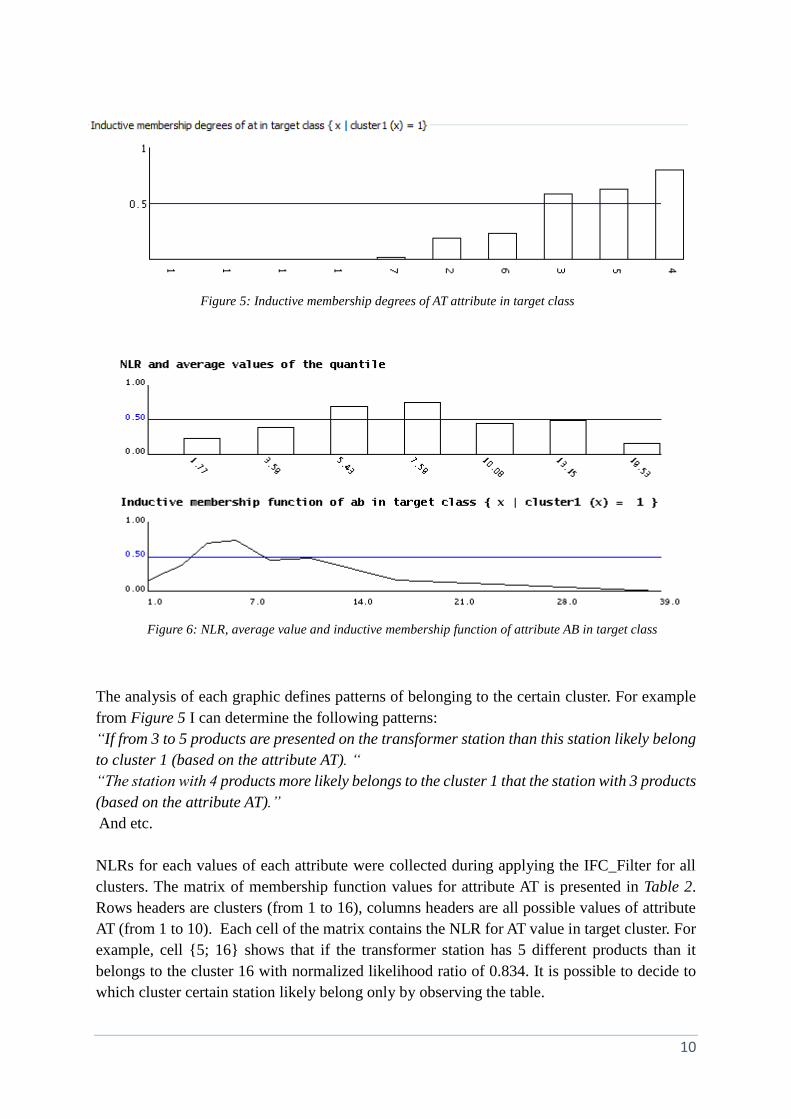
Figure 5: Inductive membership degrees of AT attribute in target class .................................. 10
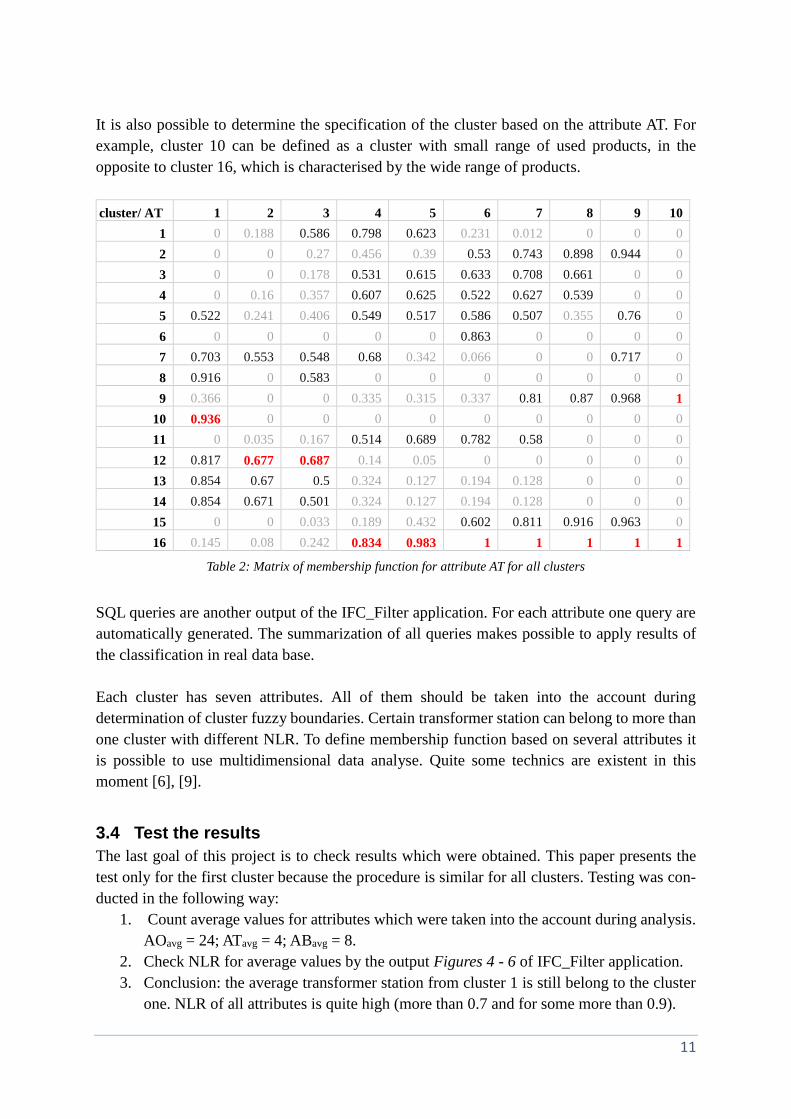
Figure 6: NLR, average value and inductive membership function of attribute AB in target
class .......................................................................................................................................... 10
List of Tables
Table 1: The set of transformer station attributes that was used for clusterization .................... 6
Table 2: Matrix of membership function for attribute AT for all clusters ................................ 11
List of Abbreviations
ARFF - Attribute-Relation File Format
CSV - Comma Separated Values
GIS – Geographical Information System
IFC – Inductive Fuzzy Classification
NLR – Normalised Likelihood Ratio
SQL – structured query language
Weka - Waikato Environment for Knowledge Analysis

1
1 Introduction
1.1 Problem statement
Three types of projects were proposed in the Seminar ‘Marketing Analytics and Data Mining
with Inductive Fuzzy Classification’: case study, software development, and theoretical survey.
This paper is going to present the case study project will be presented. This project was chosen
because in addition to the master study I also work in the company named enersis AG as a GIS
(Geographical Information System) software developer and it is next to my university study.
Case study is a good way to combine theoretical knowledge and practice.
Enersis AG is a company which provides consulting services for energy companies in Swit-
zerland and Germany. Enersis is a start-up company which launched its business with the novel
software gridsTIS. The goal of the company is to increase the productivity of workers by
integrating gridsTIS in the working process. The software analyses data from energy compa-
nies and visualizes the geographical context. It is important to visualize results in a clear and
comprehensive way, since nowadays it is not sufficient to only present empirical data. The ease
of use is important since each client has a lot of gridsTIS users from different fields and with
different experience.
The key responsibilities of an energy company are production, transportation, and delivery of
electricity. The transformer station is a central important technical object in the energy-net-
work. With the growing number of small decentralized suppliers it is important to know the
load profile of each station. The certain energy company with whom enersis works now has
thousands of stations and nearly none of them are measured. It makes the monitoring of the
whole electricity grid therefore very complicated, since that the particular hardware needs to
be established on each station for getting measurements.
Enersis AG has developed a methodology to create a load profile based on down laying client
measurements which are connected to a transformer station. With these measurements it is
possible to predict the level of consumption of the whole transformer. Initial tests were made
and the results for the certain station are shown on the Figure 1. Red line represents a real
energy consumption on the transformer station Gstaad_Bu. It is a target that should be
obtained. The green line represents the input data from the client side. The blue line stands for
a predicted level of consumption which made by applying enersis methodology. The grey line
shows the absolute error between real consumption and predicted one. It is noticeable that the
load profile generated by this approach and the real profile are not equal and that the prediction
approach need to be improved. Therefore a correction value is introduced: each station has a
correction value which should be used to obtain a reproducible profile. In the Figure 2 the
error value is much smaller and the prediction level is very close to the average of the real
consumption.
2
The developed model needs a clusterization of stations by connected client-structure because
of the large number of transformers (>5000), otherwise the model becomes too complicated
and expensive. The company called for help to find the best solution. Enersis contacted an
academic institute and asked to implement a model that would help to solve the clusterization
problem. A research assistant developed an approach for the clusterization of transformation
stations. Machine learning based on neural networks determined the most important attributes
of a station that should be used for the cluster definition. To achieve that over 500 sets of
attributes were tested till the required one was found. Based on this set all stations were
separated into 16 different clusters. The methodology is presented in [1] and [8].
The method that was used for clusterization has one important drawback. Each station belongs
to the certain cluster but ‘nobody knows why’. Because the boundary conditions of each cluster
were not defined.
1.2 Objectives
The empirical results from the theoretical approach were used for clusterization of transformer
stations. Practical application of of this method is problematic for the integration into the work-
ing process due to the lack of information about cluster definition. This paper presents the
solution which was found by applying the knowledge and methodology introduced in the sem-
inar ‘Marketing Analytics and Data Mining with Inductive Fuzzy Classification’. The director
of enersis AG made a list of goals which be solved during this project:
1. Use another approach to find the set of significant attributes of a station which could
be used for the clusterization. It is necessary to check the results which were already
achieved because the choice of the attributes set is very important since it affects the
whole determination of the correction value.
Figure 1: Profile prediction without correction value
Figure 2: Profile prediction with correction value

3
2. Solve the problem of the cluster boundary condition definition. The used approach does
not give an explanation of the result (‘black box’). It is important to know rules whether
or not a station belongs to the cluster.
3. Use real data to check the results which will be obtained. The cluster boundary condi-
tions resulting from this method can yield a different distribution of transformers over
the clusters, therefore it is necessary to determine whether each transformer will still
belong to the same cluster as before.
2 Theory
In this section the theoretical background of the current case study is presented. It contains the
overview of the neural networks, data mining, classical crisp logic, fuzzy logic, and classifica-
tion.
2.1 Neural Networks
The problem of clustering is solved by applying the neural networks approach which operates
in a myriad of models. Traditionally neural network refers to a network or circuit of biological
neurons. The term also refers to artificial neural networks, which are built from artificial neu-
rons or nodes and which try to simulate some properties of biological neural networks. Artifi-
cial neural network can be used for building mathematical models. They were successfully
used in the artificial intelligence field. For example they were applied to search recognition,
adaptive control and image recognition. Currently employed networks are based on control
theory, classification optimization and statistical estimation. It can explain why this approach
was chosen for the transformer station clusterization. The result of the application of this
method is a set of significant attributes of a station and the data table which shows the belong-
ing of each station to certain cluster.
2.2 Data mining
We are surrounded by a huge amount of different types of data from all kind of sources. When
the meaning of data is known then the information appears. The information can be used to
increase revenue, cuts costs, optimise production and etc. The data mining represents the pro-
cess of extracting information from raw data and subsequent transformation it into a compre-
hensive structure. Technically, data mining can be presented as a process of finding patterns
amongst dozens of attributes in large datasets. Generally data mining involves six classes of
tasks [2]:
- anomaly detection – identification of unusual data records or data errors.
- association rule learning – identification of relationships between variables.
- clustering – useful to discover groups by similarity in data with unknown structure.
- classification – generalization of known structure in perspective of applying to new
data.
4
- regression – determination of the best function for modelling certain data.
- summarization –compact representation of data, visualization and report generation.
The approach of data mining which is used in this project is an Indicative Fuzzy Classification.
2.3 Classical set theory
Some objects in the world around us are similar and others are very different. Objects can be
grouped by one or more characteristics that they hold and which distinguish them from others.
The set is a collection of objects (physical, mathematical and etc.) which all share the same
property. The process of grouping elements into the set is called classification [5]. If element
has a current property then it belongs to the set, otherwise it does not. The classical crisp
classification has membership function which is either 1 or 0:
ms : U →{0, 1}, where U is an element of universe of discourse, S is a set.
2.4 Inductive reasoning
The set is defined and contains several elements. By learning from existing examples of mem-
bership it is possible to define whether the new element will belong to the set or not. This
process is known as inductive reasoning or induction. Some sources also refer to it as "bottom-
up" logic [11]. The process starts from observation, which helps to define a pattern. From this
pattern the hypothesis is formulated which leads to the theory. The way is oppositional to the
deductive reasoning or “up-bottom” logic: theory – hypothesis – observation – confirmation.
Inductive reasoning was selected for this project because the set of clustered transformer sta-
tions is the input data. Observations of data can help to define patterns of the belonging to the
cluster. The hypothesis step should formulate cluster boundary conditions. The output is the
theory of transformer station clusterization: why the current set of attributes was chosen; what
is the difference between clusters and etc.
2.5 Inductive Fuzzy Classification
The term Fuzzy Set was originally proposed by Lotfi A. Zadeh [13]. The difference with the
classical Set Theory is that the membership function has value varying between absolutely true
and absolutely false [7]: µF: U → [0, 1], where F is a fuzzy set.
By analogy to the crisp classification, which were described before, “fuzzy classification is a
process of grouping elements into a fuzzy set by the truth value of a fuzzy constrain predicate”
[5]. Fuzzy set is defined as F = { e | P(e) }. P(e) is a fuzzy predicate, e is an element of U, and
R is a fuzzy restriction [14]. Element can belong to different sets with different degree of
membership µF (e) := v(P(e)), where v is the truth value of the corresponding fuzzy predicate.
The advantage of the fuzzy classification method for the current project is that cluster bound-
aries would not be sharp. It will make the system more flexible.
5
If the principle of inductive reasoning apply to the fuzzy classification then the process of
assigning element i to the inductive fuzzy set y’ would be based on the membership function
inferred by induction from data [5].
µ𝑦′(𝑖): 𝑈 → [0,1] 𝑦′ ≔ {𝑖 ∈ 𝑈 |𝑖 𝑖𝑠 𝑙𝑖𝑘𝑒𝑙𝑦 𝑎 𝑚𝑒𝑚𝑏𝑒𝑟 𝑜𝑓 𝑦}
“The likelihood ratio is the numeric degree of support for one of two opposite hypotheses”
[4]. Hypothesis 1: element i does belong to the fuzzy set y’. Hypothesis 2: i does not belong to
y’. Likelihood ratio could be normalized and be used as a membership degree if has following
properties [5], [4]:
1. The higher the likelihood of i ∈ 𝑦 in relation to 𝑖 ∉ 𝑦, the greater the degree of
membership of element i in fuzzy set y’;
2. The membership degree should be 0.5 if Hypothesis 1 is equal to Hypothesis 2.
Normalised likelihood ratio (NLR) is the central object of inductive fuzzy classification
(IFC).
2.6 Weka and IFC_Filter
Weka is a software which implements a collection of machine learning algorithms for data
mining tasks. It contains tools for data pre-processing, classification, regression, clustering,
association rules, and visualization. It is an open source software which was developed at the
University of Waikato, New Zealand and issued under the GNU General Public License [12].
In this project Weka software is used for solving settled tasks.
Weka contains supervised attribute filter IFC_Filter which was implemented by Graf (2010).
It makes possible the practical application of the IFC-NLR algorithm: transformation of nu-
meric and nominal values into normalized likelihood ratios values. The filter also visualize
association between analytic variables (station attributes) and the target variable (columns
‘clusterN’). Obtained results are presented in understandable way that make the process of
analysis very easy.
3 Solution
The enersis AG interests in modelling of transformer load profiles. Information of a single
station is based on the structure and the load of the network. From this information the com-
plete load profile can be predicted. It is especially useful when the measurements of a period
of time are missed or were not carried out.
3.1 Data preparation
All data are stored in the energy company database. It contains a list of 4,626 transformers and
in total the information about 297,364 nodes which are connected to the stations. Of the exist-
6
ing amount of transformers 2 were removed because their connected nodes have no consump-
tion. Each station is described by the aggregation of the available information with 24 attrib-
utes. Some of the attributes are measured and others are computed. Not all attributes are
significant for cluster definition. For example only 13 of the existing tariffs were used. Tariff
is a product that the energy company sells to the consumers. It is characterized by the energy
consumption during period and the type of connected object.
In the introduction to this paper it was already mentioned that the clusterization of the trans-
former stations was successfully modelled. To attain this, more than 500 sets of attributes were
analysed and amounts of possible clusters were examined by means of a Gaussian Mixture
Model. The maximum amount of clusters was 45 and minimum 16. The model was simplified
by choice of 16 clusters and the final clusterization was performed based on the set of selected
attributes.
The final set of attributes that was used for the clusterization: AO-AN-AT-AB-Tariff-V-L. ‘Tar-
iff ‘ is the amount of tariffs which are presented in the certain station. These attributes was
calculated based on data from columns which contains information about different tariffs.
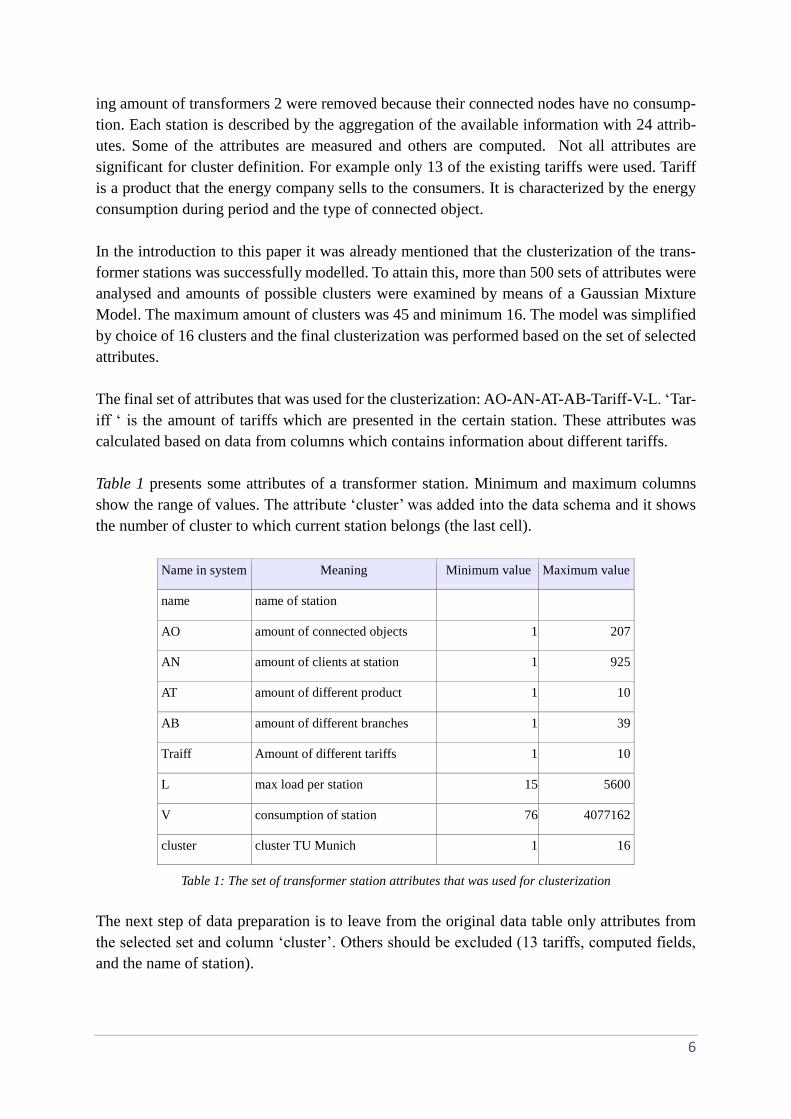
Table 1 presents some attributes of a transformer station. Minimum and maximum columns
show the range of values. The attribute ‘cluster’ was added into the data schema and it shows
the number of cluster to which current station belongs (the last cell).
Name in system Meaning Minimum value Maximum value
name name of station
AO amount of connected objects 1 207
AN amount of clients at station 1 925
AT amount of different product 1 10
AB amount of different branches 1 39
Traiff Amount of different tariffs 1 10
L max load per station 15 5600
V consumption of station 76 4077162
cluster cluster TU Munich 1 16
Table 1: The set of transformer station attributes that was used for clusterization
The next step of data preparation is to leave from the original data table only attributes from
the selected set and column ‘cluster’. Others should be excluded (13 tariffs, computed fields,
and the name of station).
7
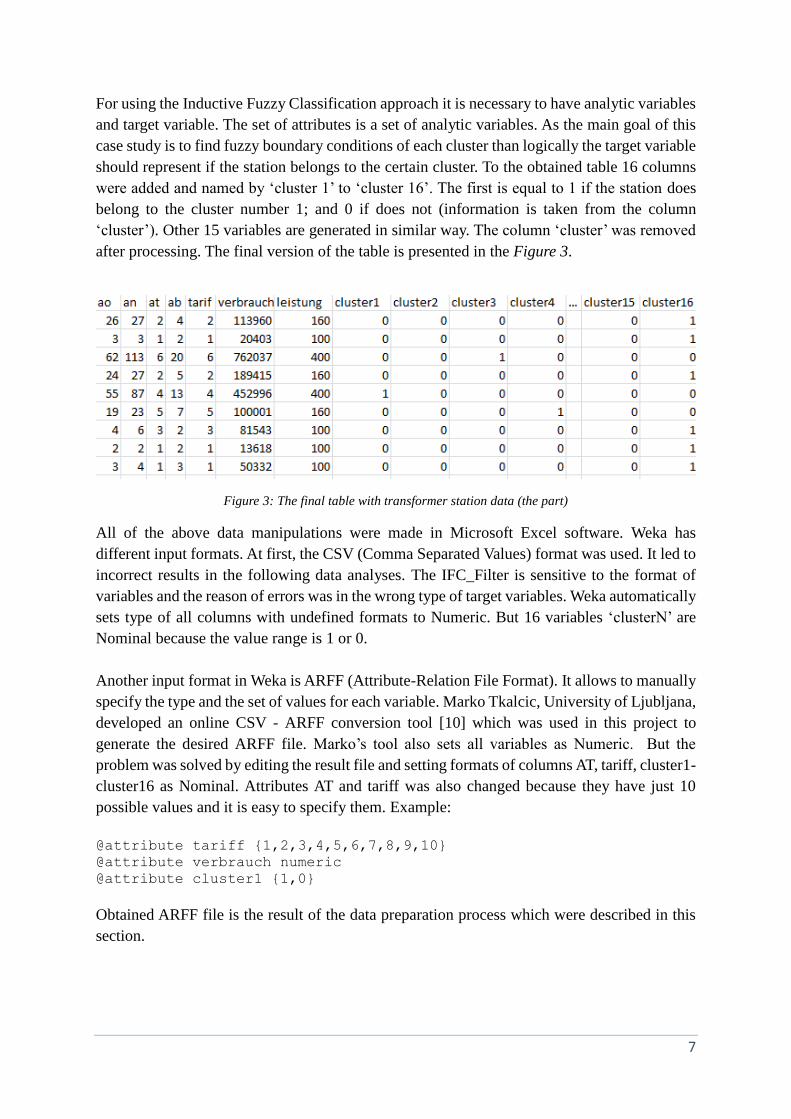
For using the Inductive Fuzzy Classification approach it is necessary to have analytic variables
and target variable. The set of attributes is a set of analytic variables. As the main goal of this
case study is to find fuzzy boundary conditions of each cluster than logically the target variable
should represent if the station belongs to the certain cluster. To the obtained table 16 columns
were added and named by ‘cluster 1’ to ‘cluster 16’. The first is equal to 1 if the station does
belong to the cluster number 1; and 0 if does not (information is taken from the column
‘cluster’). Other 15 variables are generated in similar way. The column ‘cluster’ was removed
after processing. The final version of the table is presented in the Figure 3.
All of the above data manipulations were made in Microsoft Excel software. Weka has
different input formats. At first, the CSV (Comma Separated Values) format was used. It led to
incorrect results in the following data analyses. The IFC_Filter is sensitive to the format of
variables and the reason of errors was in the wrong type of target variables. Weka automatically
sets type of all columns with undefined formats to Numeric. But 16 variables ‘clusterN’ are
Nominal because the value range is 1 or 0.
Another input format in Weka is ARFF (Attribute-Relation File Format). It allows to manually
specify the type and the set of values for each variable. Marko Tkalcic, University of Ljubljana,
developed an online CSV - ARFF conversion tool [10] which was used in this project to
generate the desired ARFF file. Marko’s tool also sets all variables as Numeric. But the
problem was solved by editing the result file and setting formats of columns AT, tariff, cluster1-
cluster16 as Nominal. Attributes AT and tariff was also changed because they have just 10
possible values and it is easy to specify them. Example:
@attribute tariff {1,2,3,4,5,6,7,8,9,10}
@attribute verbrauch numeric
@attribute cluster1 {1,0}
Obtained ARFF file is the result of the data preparation process which were described in this
section.
Figure 3: The final table with transformer station data (the part)

8
3.2 Attribute verification by Weka
The first aim of this case study is to check by another approach the set of attributes that were
used for clusterization. The set was obtained by ‘straight task’: check around 500 sets of
attributes, get clusters, check errors, and choose the best set. My goal is the ‘reverse task’:
clusters and attributes values are known, than select attributes by which this clusters were
made.
In Section 2 of this paper the software Weka was presented. One of its functions is called
‘Attributes selection’. First, it is necessary to choose ‘Attribute Evaluator’ and second –
‘Search Method’. Classifier subset evaluator was selected as an ‘Attribute Evaluator’. Its
capabilities: Class - Binary class, Nominal class, Numeric class, Missing class values, Date
class; Attributes - Empty nominal attributes, Numeric attributes, Missing values, Relational
attributes, String attributes, Binary attributes, Nominal attributes, Unary attributes, Date
attributes. Search method – BestFirst with search termination equal to 1.
First test: attribute selection was applied to the original table which was modified by adding
the column ‘cluster’ and removing column ‘name’ as not significant for the clusterization. The
target attribute is ‘cluster’. Output window presents the list of selected attributes: AO, AN, AT,
N7_BG_ET, NX_PL_01, NX_PR_01, N7_SD_LG1, N7_SD_LG, N7_SD_P1. Where
attributes N7_BG_ET and furthers are names of tariffs.
Second test: the same attribute selection was applied to the result table which were gained in
the Section 3.1. The target attribute is the same as in the first test. Results: AO, AN, AT, L.
Next step is to compare results of both tests with the set of attributes which were used for the
clusterization: AO-AN-AT-AB-Tariff-V-L.
As we can see from the results AO, AN, and AT attributes are appeared in all sets. The result
of the first test also contains different tariffs that were aggregated in the attribute ‘Tariff’ in the
result table. Output of the second test also contains attribute L. Only AB and V are not
presented in the results of Weka attribute selections. My conclusion is that selection of 5
attributes from seven is proven. But for the cluster definition by IFC all attributes from the set
should be used.
3.3 Fuzzy boundary conditions
The second goal of this case study is to define boundary conditions for each of the sixteen
clusters. In Section 2 the Inductive Fuzzy Classification approach was presented as well as the
software Weka which was already used for the attribute verification. The task will be solved
by application IFC_Filter.
3.3.1 Input
The result data table from the Section 3.2. First 7 columns from the table are transformer
station attributes that will be used as analytic variables. The IFC_filter should be applied for

9
each cluster. In each iteration the target variable is the column ‘clusterN’, where N is the
number of cluster. It represents the belonging of the certain station to the current cluster N.
3.3.2 Filter parameters
The ‘IFCWindow’ parameter is set in true to see the result graphics. The ‘classValue’ is last
because the target variable is the last column. ‘percentOfDataSet’ is equal to 0.1%. The
standard value was changed from 0.01% to decrease evaluation time because the data set
contains more than 4.5 thousands of rows and the filter should be applied 16 times. The
‘targetType’ is binary due to the value of target variable that can be 1 or 0.
3.3.3 Evaluation process
The IFC_Filter should be applied 16 times to get membership functions of all attributes for
each cluster. Each iteration will give two graphics for each analytic variable. First one shows
the likelihood ratio and average value. Second one represents inductive membership function.
Also the SQL query will be built to give possibility to use results of the classification on the
real data base.
3.3.4 Results
This paper only presents results for some attributes for the first cluster because the procedure
of the IFC_Filter application is similar for all 16 clusters. Attributes AO, AT and AB were
chosen for the illustration because they were discovered during the Attribute Selection
procedure. Figures 4 – 7 show corresponding results. Attribute AT is Nominal, AO and AB are
Numeric. Nevertheless other attributes were also analysed.
Figure 4: NLR, average value and inductive membership function of AO in target class
10
The analysis of each graphic defines patterns of belonging to the certain cluster. For example
from Figure 5 I can determine the following patterns:
“If from 3 to 5 products are presented on the transformer station than this station likely belong
to cluster 1 (based on the attribute AT). “
“The station with 4 products more likely belongs to the cluster 1 that the station with 3 products
(based on the attribute AT).”
And etc.
NLRs for each values of each attribute were collected during applying the IFC_Filter for all
clusters. The matrix of membership function values for attribute AT is presented in Table 2.
Rows headers are clusters (from 1 to 16), columns headers are all possible values of attribute
AT (from 1 to 10). Each cell of the matrix contains the NLR for AT value in target cluster. For
example, cell {5; 16} shows that if the transformer station has 5 different products than it
belongs to the cluster 16 with normalized likelihood ratio of 0.834. It is possible to decide to
which cluster certain station likely belong only by observing the table.
Figure 5: Inductive membership degrees of AT attribute in target class
Figure 6: NLR, average value and inductive membership function of attribute AB in target class
11
It is also possible to determine the specification of the cluster based on the attribute AT. For
example, cluster 10 can be defined as a cluster with small range of used products, in the
opposite to cluster 16, which is characterised by the wide range of products.
cluster/ AT 1 2 3 4 5 6 7 8 9 10
1 0 0.188 0.586 0.798 0.623 0.231 0.012 0 0 0
2 0 0 0.27 0.456 0.39 0.53 0.743 0.898 0.944 0
3 0 0 0.178 0.531 0.615 0.633 0.708 0.661 0 0
4 0 0.16 0.357 0.607 0.625 0.522 0.627 0.539 0 0
5 0.522 0.241 0.406 0.549 0.517 0.586 0.507 0.355 0.76 0
6 0 0 0 0 0 0.863 0 0 0 0
7 0.703 0.553 0.548 0.68 0.342 0.066 0 0 0.717 0
8 0.916 0 0.583 0 0 0 0 0 0 0
9 0.366 0 0 0.335 0.315 0.337 0.81 0.87 0.968 1
10 0.936 0 0 0 0 0 0 0 0 0
11 0 0.035 0.167 0.514 0.689 0.782 0.58 0 0 0
12 0.817 0.677 0.687 0.14 0.05 0 0 0 0 0
13 0.854 0.67 0.5 0.324 0.127 0.194 0.128 0 0 0
14 0.854 0.671 0.501 0.324 0.127 0.194 0.128 0 0 0
15 0 0 0.033 0.189 0.432 0.602 0.811 0.916 0.963 0
16 0.145 0.08 0.242 0.834 0.983 1 1 1 1 1
Table 2: Matrix of membership function for attribute AT for all clusters
SQL queries are another output of the IFC_Filter application. For each attribute one query are
automatically generated. The summarization of all queries makes possible to apply results of
the classification in real data base.
Each cluster has seven attributes. All of them should be taken into the account during
determination of cluster fuzzy boundaries. Certain transformer station can belong to more than
one cluster with different NLR. To define membership function based on several attributes it
is possible to use multidimensional data analyse. Quite some technics are existent in this
moment [6], [9].
3.4 Test the results
The last goal of this project is to check results which were obtained. This paper presents the
test only for the first cluster because the procedure is similar for all clusters. Testing was con-
ducted in the following way:
1. Count average values for attributes which were taken into the account during analysis.
AOavg = 24; ATavg = 4; ABavg = 8.
2. Check NLR for average values by the output Figures 4 - 6 of IFC_Filter application.
3. Conclusion: the average transformer station from cluster 1 is still belong to the cluster
one. NLR of all attributes is quite high (more than 0.7 and for some more than 0.9).

12
This test was run on all clusters and gave positive result in each iteration. Results of this work
are very optimistic. First, they prove the type of the clusterization. Second, they help to under-
stand the meaning of each cluster and explain the difference between clusters. Third, fuzzy
boundary conditions were found which would help in the future to determine the cluster of the
new station.
4 Conclusion
In the introduction section of this paper 3 goals were formulized: check attributes, find cluster
boundary conditions and test outcomes. All of them were successfully reached and very
optimistic results were gained. The set of attributes was checked by attribute selection module
in software Weka which also was presented. The application of IFC_Filter to prepared data
helped to find cluster boundary conditions. The output of this step is a matrix of membership
function values for selected seven attributes of transformer station. Also this step helped to
clarify current clusterization and difference between clusters. In the last step obtained results
were successfully tested.
From another side, this case study shows how novel theoretical methods could by applied into
practice. The clusterization was made by using an artificial neural network. Cluster boundary
conditions were found by induction of membership function from data and summarizing
results for existent attributes. This results will led to more precise definition of the correlation
value for the prediction of transformer station load profile.
In the future these results will help to reduce costs for installation and maintenance of external
hardware on transformer stations. Also the load profile prediction will be used when real
measurements are missed or measuring process is not available. The end energy company will
get better control on their electricity grid.

13
5 References
[1] Bayer, J., & Osendorfer, C. (2012). Clustering von Transformatoren basierend auf.
Munchen.
[2] Fayyad, U., Piatetsky-Shapiro, G., & Smyth, P. (1996). From Data Mining to Knowledge
Discovery in Databases.
[3] Kaufmann, M. (2012). Inductive Fuzzy Classification in Marketing Analytics. University
of Fribourg.
[4] Kaufmann, M., & Graf, S. (2012). Fuzzy Target Groups in Analytic Customer
Relationship Management. In A. Meier, & L. Donzé, Fuzzy Methods for Customer
Relationship Management and Marketing: Applications and Classifications (pp. 168-
192). IGI Global.
[5] Kaufmann, M., & Meier, A. (2099). An Inductive Fuzzy Classification Approach applied
to Individual Marketing. NAFIPS . Cincinnati.
[6] Klawonn, F., & Kruse, R. (1995). Deriviation of Fuzzy Classification Rules from
Multidimentional Data. Braunschweig.
[7] Meier, A., Schindler, G., & Werro, N. (2008). Fuzzy Classification on Relational
Databases. In G. M., Handbook of Research on Fuzzy Information Processing in
Database. Volume II (pp. 586 - 614).
[8] Osendorfer, C. (2012). Studie zur Modellierung von Trafolastprofilen mittels. Munchen.
[9] Stoffel, K., Cotofrei, P., & Han, D. (2012). Fuzzy Clustering based Methodology for
Multidimensional Data Analysis in Computational Forensic Domain. International
Journal of Computer Information Systems and Industrial Management Applications.,
400–410.
[10] Tkalcic, M. (2008). Online CSV --> ARFF conversion tool. Retrieved from Digital
signal, image and video processing laboratory: http://slavnik.fe.uni-
lj.si/markot/csv2arff/csv2arff.php
[11] Trochim, W. M. (2006). Deduction & Induction. Retrieved from Research Methods
Knowledge Base: http://www.socialresearchmethods.net/kb/dedind.php
[12] Weka 3 - Data Mining with Open Source Machine Learning Software in Java. (n.d.).
Retrieved from Machine Learning Project at the University of Waikato in New
Zealand: http://www.cs.waikato.ac.nz/ml/weka/
[13] Zadeh, L. A. (1965). Information and Control xol. 8. In Fuzzy sets (pp. 338-353).
[14] Zadeh, L. A. (1975). Calculus of fuzzy restrictions. In L. A. Zadeh, Fuzzy sets and their
applications to cognitive and decision processes. New York: Academic Press.