Embed Size (px)
Citation preview
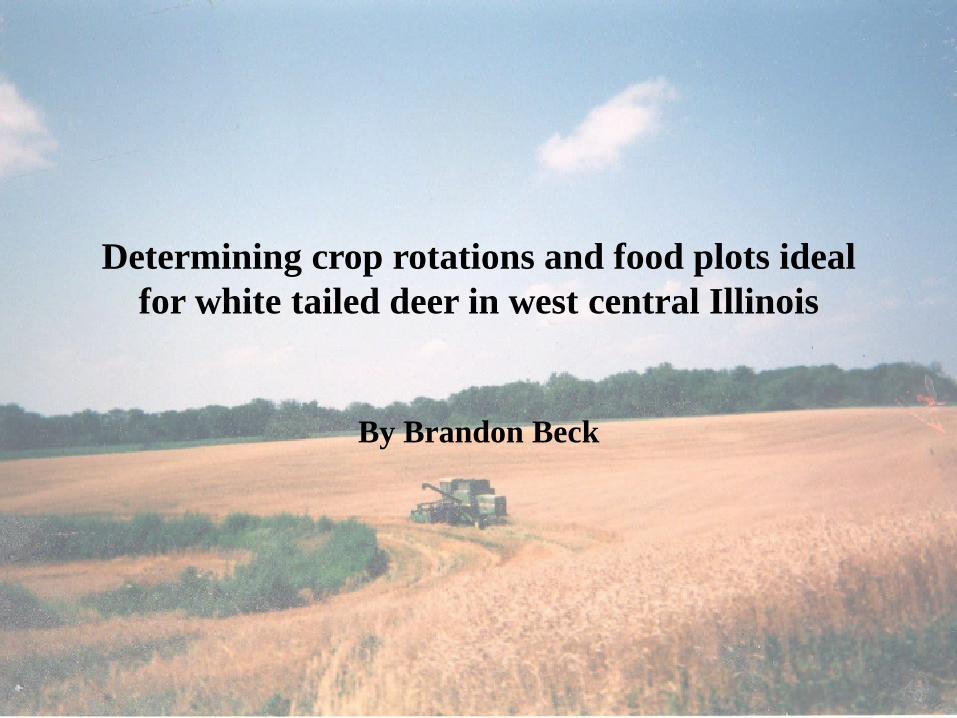
Determining crop rotations and food plots ideal for white tailed deer in west central Illinois
By Brandon Beck
Background
• Grew up on a farm in west central Illinois • Attended Eastern Illinois University for
Undergraduate (B.S. in Biology) • Worked in Monsanto Corn Breeding for last 5
years. • Starting a PhD Program at Texas A&M in plant
breeding in the fall of 2014
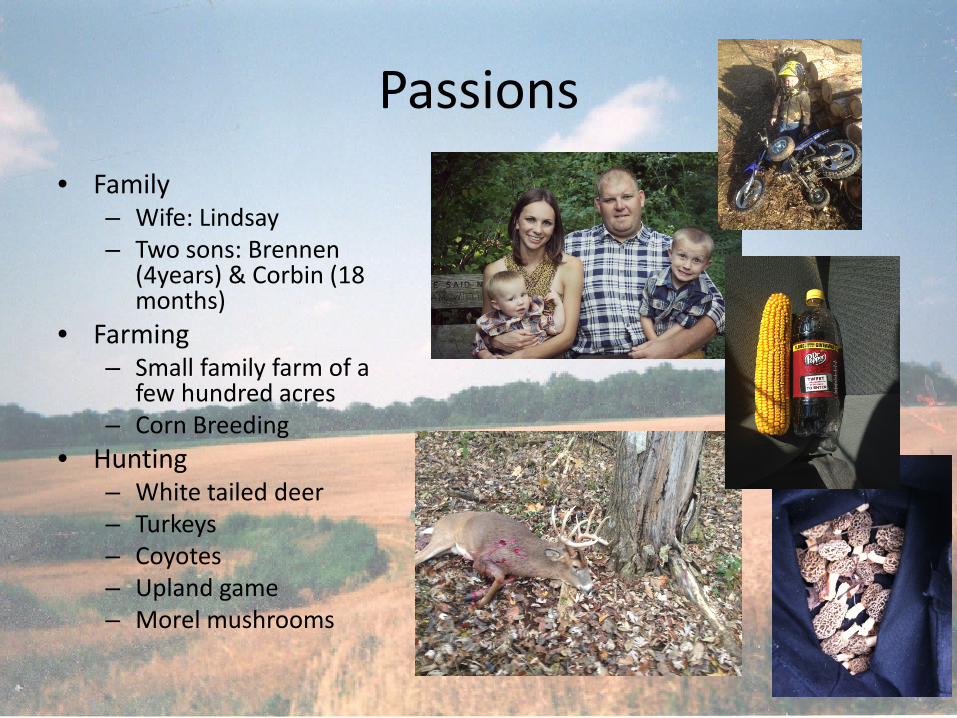
Passions • Family
– Wife: Lindsay – Two sons: Brennen
(4years) & Corbin (18 months)
• Farming – Small family farm of a
few hundred acres – Corn Breeding
• Hunting – White tailed deer – Turkeys – Coyotes – Upland game – Morel mushrooms
Overview
• Agricultural Trends • Food Plots • The Test Farm • Plot Selections • Methods and Materials • Results • Discussion
Agricultural Trends

Illinois Farm Facts
• 76,000 farms that cover 28 million acres
• Average farm is 368 acres
• Majority of farms still family owned operation
• Average farmer is over 50 years of age
• 40 % of farmers have jobs outside of the farm
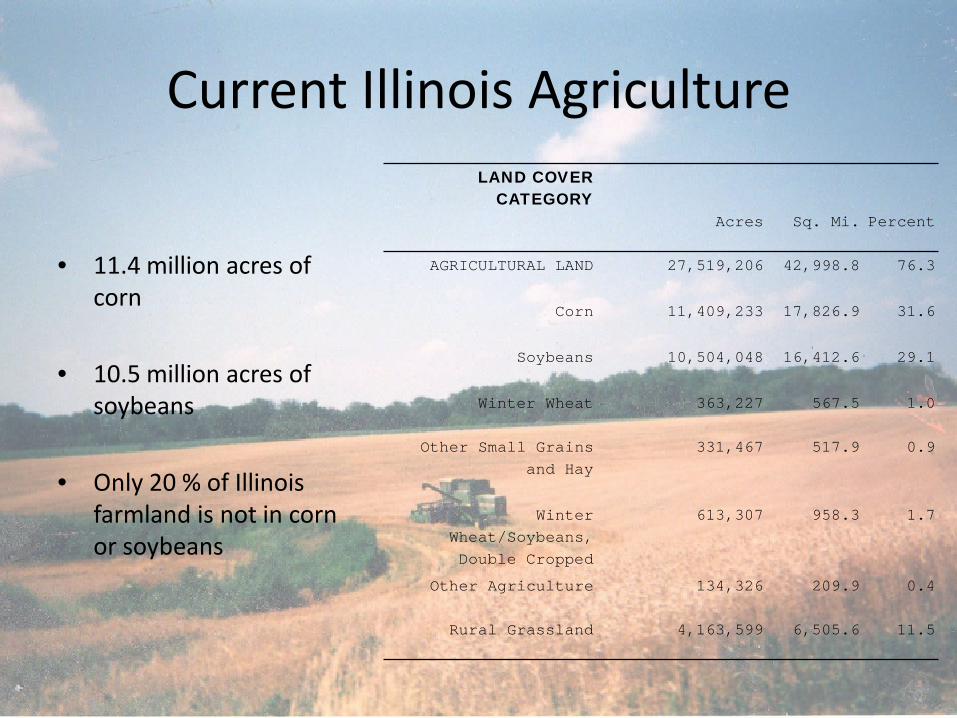
Current Illinois Agriculture • 11.4 million acres of
corn
• 10.5 million acres of soybeans
• Only 20 % of Illinois farmland is not in corn or soybeans
LAND COVER CATEGORY
Acres Sq. Mi. Percent
AGRICULTURAL LAND 27,519,206 42,998.8 76.3
Corn 11,409,233 17,826.9 31.6
Soybeans 10,504,048 16,412.6 29.1
Winter Wheat 363,227 567.5 1.0
Other Small Grains and Hay
331,467 517.9 0.9
Winter Wheat/Soybeans, Double Cropped
613,307 958.3 1.7
Other Agriculture 134,326 209.9 0.4
Rural Grassland 4,163,599 6,505.6 11.5

Historic Illinois Crop Acres
Year
Acres planted for all purposes
Acres harvested for grain
Yield per harv acre Production
Thousands Bushels Thous. Bu.
CORN
1950 8,352 8,008 51 408,408
1960 10,425 9,985 68 678,980
1970 10,310 9,940 74 735,560
1980 11,700 11,440 93 1,063,920
1990 10,600 10,400 127 1,320,800
1997 11,200 11,050 129 1,425,450
SOYBEANS
1950 NA 3,989 24.0 95,736
1960 5,013 4,973 26.0 129,298
1970 6,848 6,800 31.0 210,800
1980 9,400 9,350 33.5 313,225
1990 9,200 9,100 39.0 354,900
1997 10,000 9,950 43.0 427,850
WHEAT
1950 1,562 1,417 19.5 27,632
1960 1,617 1,577 29.0 45,733
1970 1,075 1,030 37.0 38,110
1980 1,600 1,570 49.0 76,930
1990 2,050 1,850 48.0 88,800
1997 1,200 1,150 61.0 70,150
SORGHUM, GRAIN
1950 5 0 0 0
1960 19 14 50 700
1970 30 20 56 1,120
1980 100 83 59 4,897
1990 210 195 75 14,625
1997 160 155 91 14,105
OATS
1950 3,842 3,796 41 155,636
1960 1,912 1,867 51 95,217
1970 935 612 56 34,272
1980 280 230 61 14,030
1990 600 170 68 11,560
1997 100 75 74 5,550
ALL HAY
Tons Thous. tons
1950 NA 2,840 1.64 4,648
1960 NA 2,171 2.16 4,682
1970 NA 1,230 2.69 3,303
1980 NA 1,160 3.07 3,558
1990 NA 900 3.72 3,348
1997 NA 1,020 3.29 3,354
• Corn acres have increased significantly in last 50 years
• Soybean acres have doubled in last 50 years
• Wheat and sorghum acres peaked in1990
• Oats fell from nearly 4 million acres to 100 thousand
• Hay acres have dropped from nearly 3 million acres to 1 million
Illinois Agricultural Economy
• One of the nations leaders in corn and soybean production
• Nations second largest exporter of agricultural commodities
• Nearly 9 billion dollars a year are put into Illinois economy
• Close to 4 billion comes from exportation
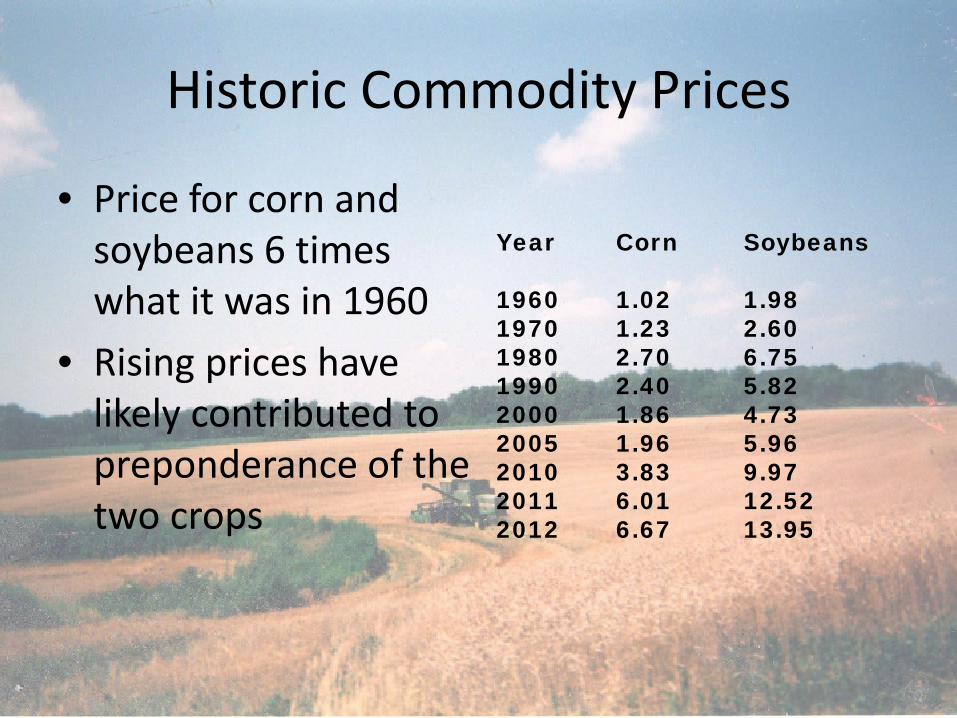
Historic Commodity Prices
• Price for corn and soybeans 6 times what it was in 1960
• Rising prices have likely contributed to preponderance of the two crops
Year Corn Soybeans 1960 1.02 1.98 1970 1.23 2.60 1980 2.70 6.75 1990 2.40 5.82 2000 1.86 4.73 2005 1.96 5.96 2010 3.83 9.97 2011 6.01 12.52 2012 6.67 13.95
Conservation Reserve Program
• Introduced in the 1985 farm bill • Encourages farmers to take marginal ground
out of commodity production • Acres peaked in 2007 at 25 million acres for
Mississippi River Basin and National at 36.8 million acres
• Increased productivity and commodity prices have given farmers incentive to convert CRP back into cropland

Converted Land • Nationally 400,000
acres were converted into cropland between 2011and 2012
• In that time only 150,000 acres were taken out of production
• In 2011 that left a net gain of 250,000 acres of cropland
State Acres Converted Illinois 12,272.80 Indiana 14,681.90 Iowa 22,301.50 Kansas 20,931.50 Michigan 8,802.90 Minnesota 12,453.10 Missouri 5,664.90 Nebraska 54,876.60 Ohio 9,642.70 South Dakota 27,128.40 Texas 26,395.20 Wisconsin 11,412.60 Combined Total 226,564.10
Agriculture Key Notes
• Agricultural trend has removed winter forages
from crop rotation
• Conversion of rough ground to cropland
• High commodity prices
• Current trend not ideal for white tailed deer
Food Plots

Food Plot Facts
• Midwest deer are not as dependent as the Southeast, but they will use plots when available
• They can be used to attract more deer to a property
• Will concentrate the herd to a smaller area • Should be part of a wildlife management plan
and not a replacement for one
Food Plot Nutrition
• Effective food plots will provide nutrition to the herd during critical times of the year
• Bucks need a large amount of protein during antler development
• Does need protein during pregnancy and lactation
• Winter forage can be very important to herd health during long harsh winters
Plot Selection Needs
• Attract the deer during hunting season (Oct 1- Jan 15)
• Enhance herd health throughout the year • The focus of the experiment was to determine
a plot or rotation that was feasible for a farmer to implement and also provide value to an outfitting operation

The Test Farm
Test Farm
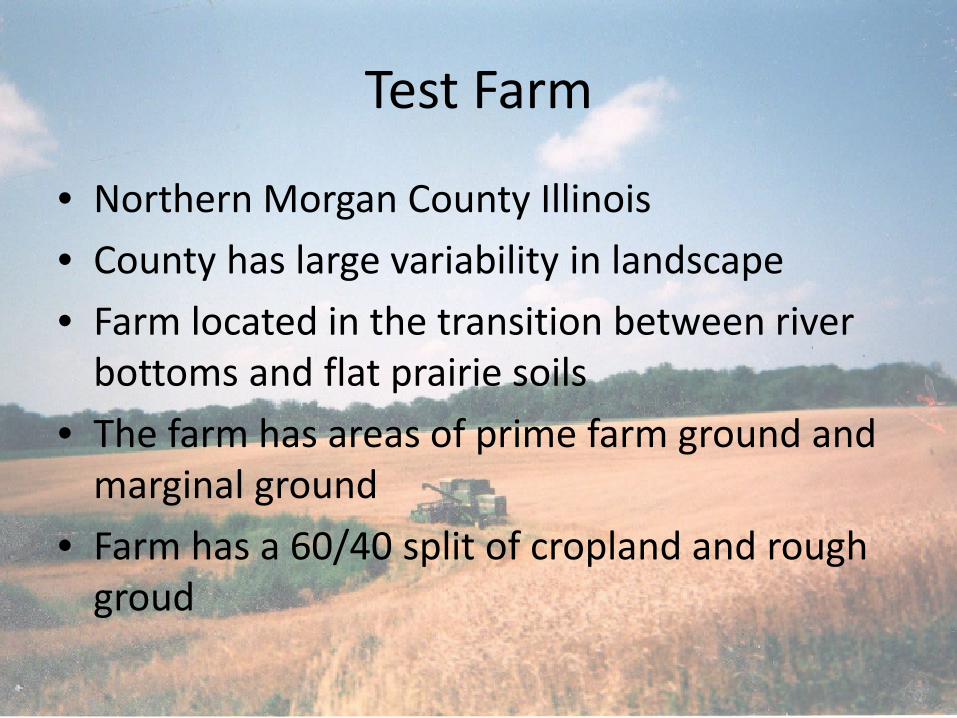
• Northern Morgan County Illinois • County has large variability in landscape • Farm located in the transition between river
bottoms and flat prairie soils • The farm has areas of prime farm ground and
marginal ground • Farm has a 60/40 split of cropland and rough
groud
Farm Productivity
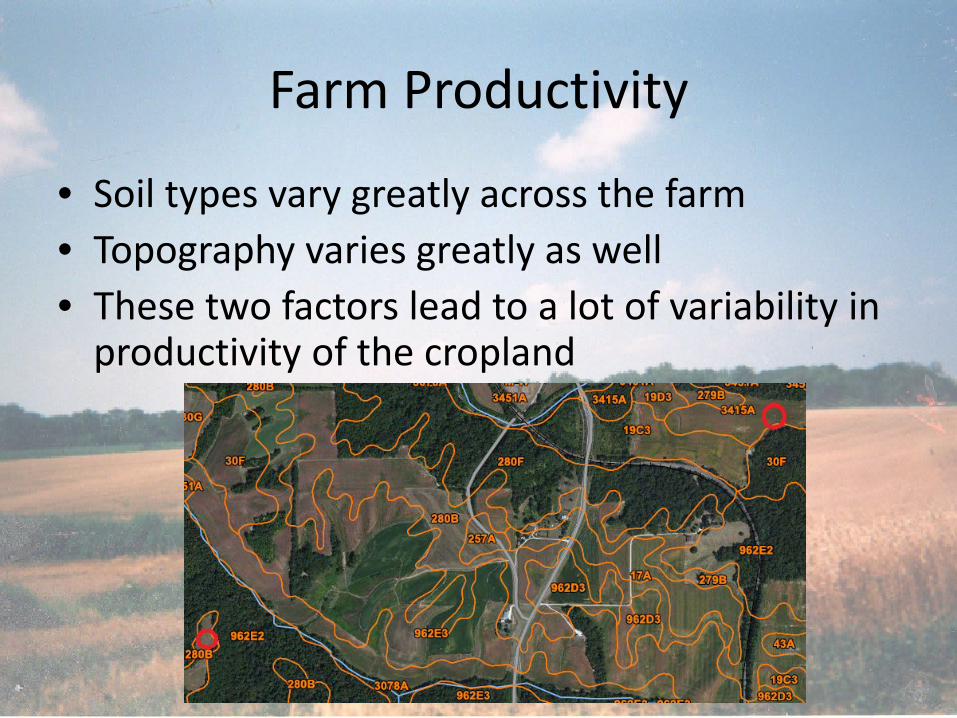
• Soil types vary greatly across the farm • Topography varies greatly as well • These two factors lead to a lot of variability in
productivity of the cropland

Soil Slope Soil Profile Productivity
Fayette silt loam 2 to 5 percent slopes 0 to 9 inches: Silt loam Prime Farmland
280B 9 to 60 inches: Silt loam
Arenzville silt loam 0 to 2 percent slopes 0 to 6 inches: Silt loam Prime Farmland if protected from flooding or not
frequently flooded during the growing season
3078A 6 to 36 inches: Silt loam
36 to 80 inches: Silt loam
0 to 5 inches: Silt loam
Sylvan-Bold complex
962 E&D
18 to 25 percent slopes 0 to 5 inches: Silt loam
5 to 60 inches: Silt loam
Not prime farmland
Clarksdale silt loam 0 to 2 percent slopes 0 to 8 inches: Silt loam Prime Farmland
257 8 to 16 inches: Silt loam
16 to 47 inches: Silt loam
47 to 67 inches: Silt loam
67 to 80 inches: Silt loam
Lawson silt loam 0 to 2 percent slopes 0 to 14 inches: Silt loam Prime Farmland if protected from flooding or not
frequently flooded during the growing season
3451A 14 to 33 inches: Silt loam
33 to 80 inches: Silt loam
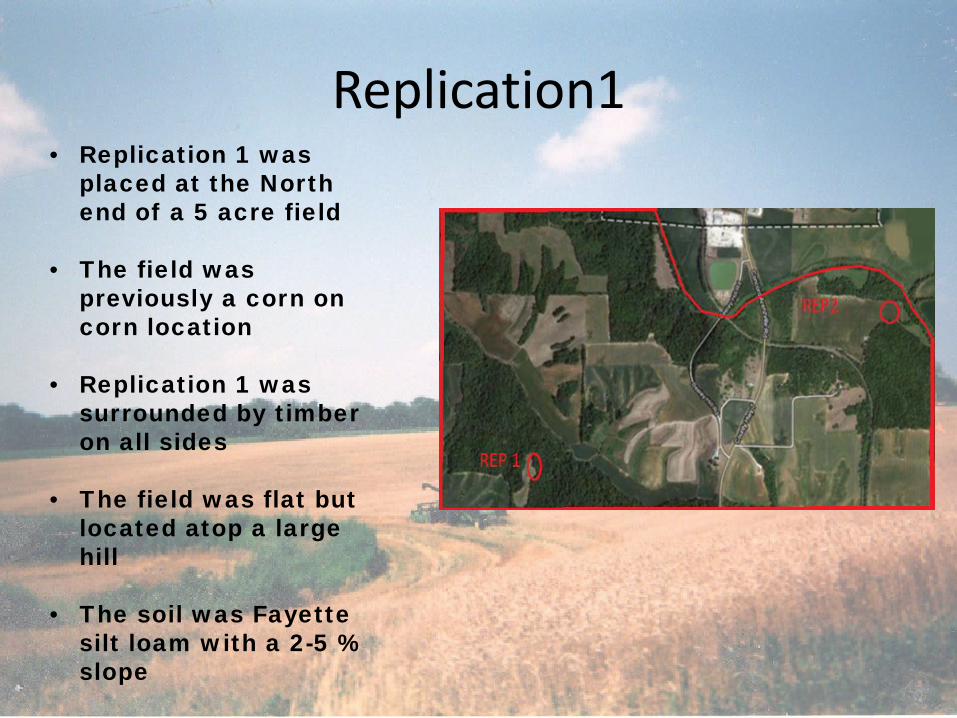
Replication1 • Replication 1 was
placed at the North end of a 5 acre field
• The field was
previously a corn on corn location
• Replication 1 was
surrounded by timber on all sides
• The field was flat but
located atop a large hill
• The soil was Fayette
silt loam with a 2-5 % slope
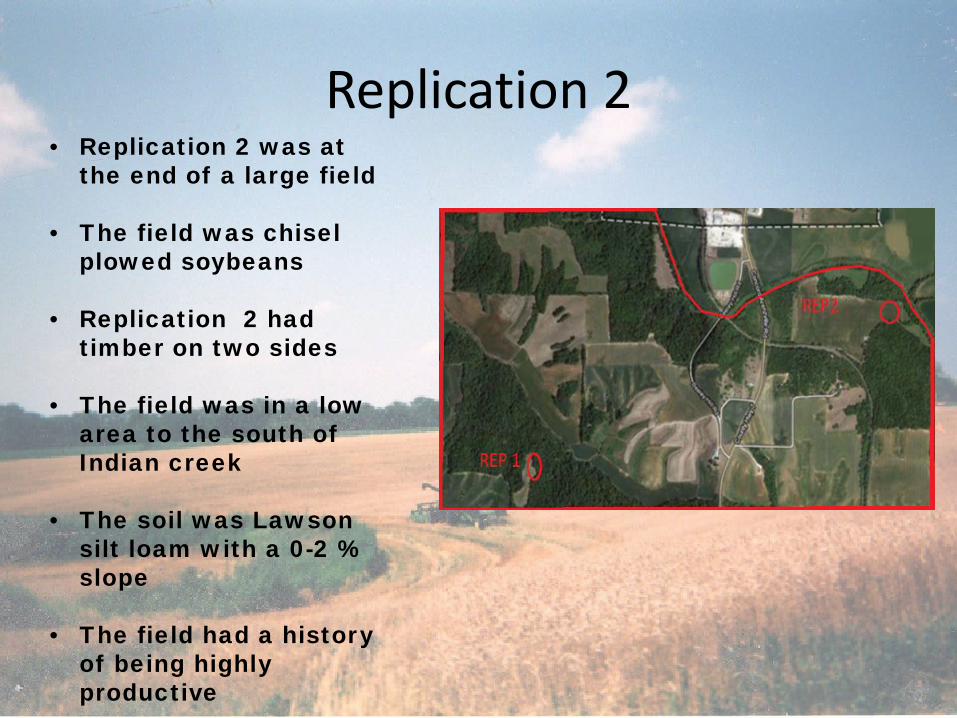
Replication 2 • Replication 2 was at
the end of a large field • The field was chisel
plowed soybeans
• Replication 2 had timber on two sides
• The field was in a low
area to the south of Indian creek
• The soil was Lawson
silt loam with a 0-2 % slope
• The field had a history
of being highly productive

Replication locations
• Using Trimble GPS farm scout I determined the replications were 2530 yards apart (1 1/2miles) in a strait line
• Following the predominant game trails the plots were about 3400 yards (2 miles) apart
Plot Selection
Plot Selection Needs
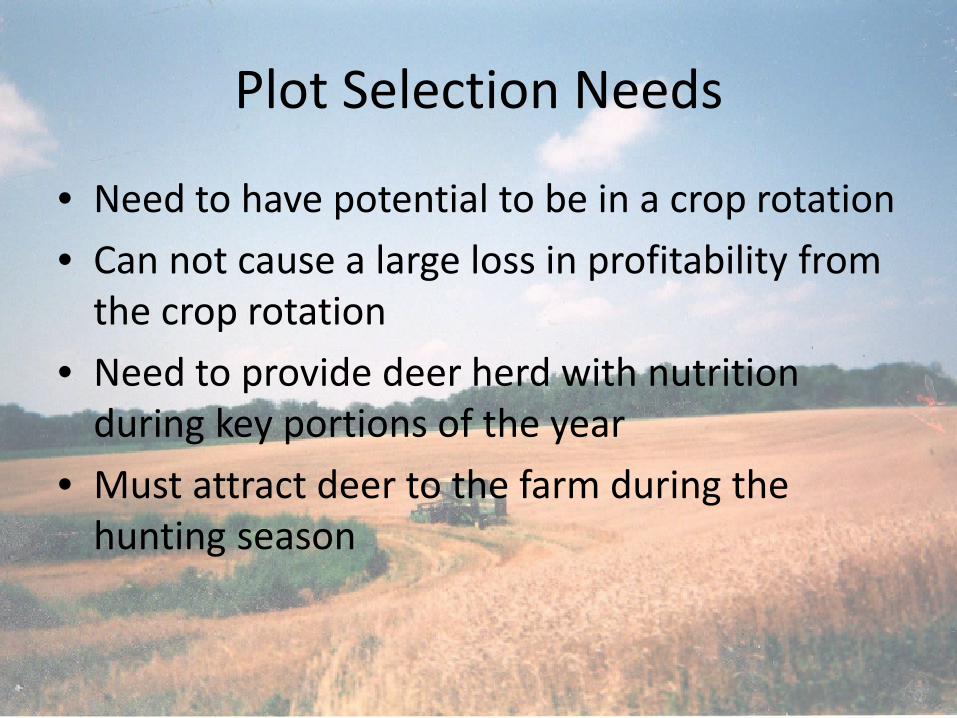
• Need to have potential to be in a crop rotation • Can not cause a large loss in profitability from
the crop rotation • Need to provide deer herd with nutrition
during key portions of the year • Must attract deer to the farm during the
hunting season

Selected Plots
Crop Protein Content
Value Added
Wheat 10-15% Winter/spring forage, Income as harvestable crop, Straw.
Oats 12-24% Winter/spring forage, Income as harvestable crop, Oatlage for
livestock. Brassicas 17-24% Summer/Fall/Early Winter Forage,
Break up compaction, Move nutrients to upper layer of soil.
Soybeans 30-40% Fall/Winter Forage, Income as harvestable crop.
Clover 16-22% Summer/Fall/Forage, Nitrogen Fixation, Cover Crop.
Fallow Control Control
• The plots that were chosen were wheat, oats, clover, brassicas, soybeans, and fallow ground
• These plots were determined to have potential benefit to a crop rotation
• They were also identified as potential attractants and nutritional aids for the deer herd

Methods and Materials

Plot Overview • The experiment was set up as a comparison of the five
crops with a control on each of three replications • Drought conditions of central Illinois during the 2012
growing season caused one replication to be lost • Each replication consisted of six plots • Each plot was approximately eighty feet wide by one
hundred and thirty feet long • Each plot approximately one quarter of an acre • The plots were set up in randomized block design • Excel was used to generate randomized numbers for
each plot

Forage Locations Crop Replication1 Replication 2
Wheat 2 4
Oats 4 1
Brassicas 5 6
Soybeans 3 5
Clover 1 3
Fallow 6 2
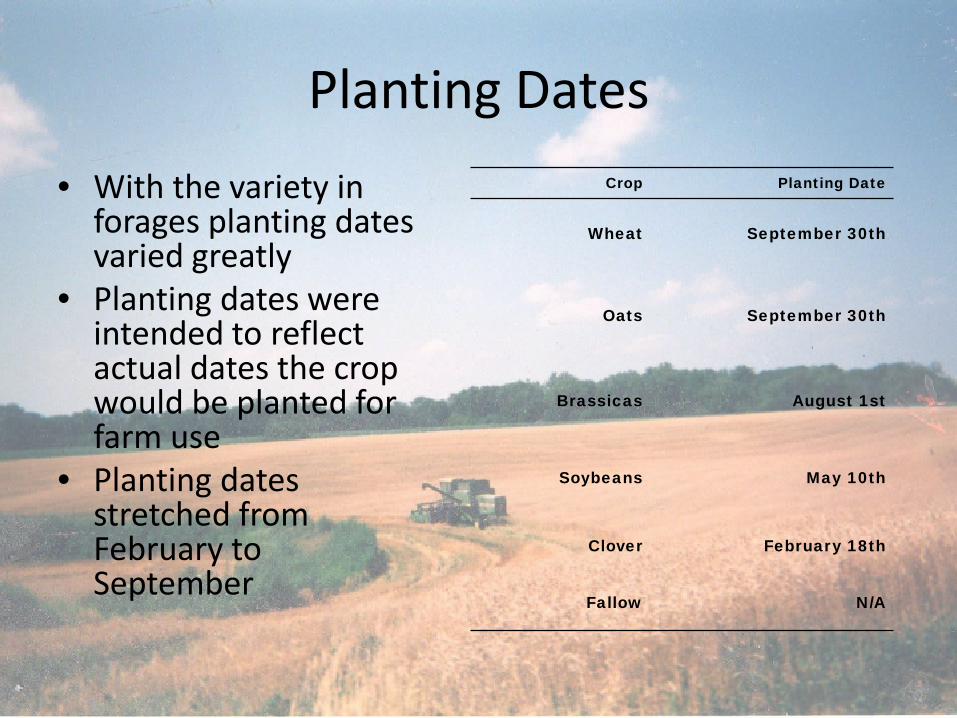
Planting Dates • With the variety in
forages planting dates varied greatly
• Planting dates were intended to reflect actual dates the crop would be planted for farm use
• Planting dates stretched from February to September
Crop Planting Date
Wheat September 30th
Oats September 30th
Brassicas August 1st
Soybeans May 10th
Clover February 18th
Fallow N/A
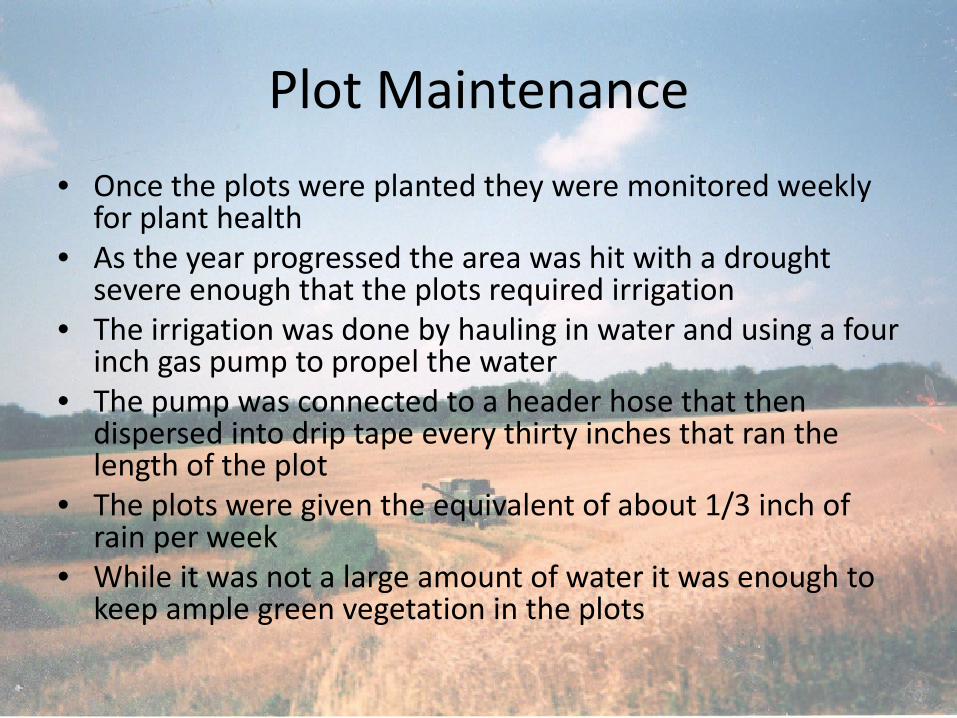
Plot Maintenance • Once the plots were planted they were monitored weekly
for plant health • As the year progressed the area was hit with a drought
severe enough that the plots required irrigation • The irrigation was done by hauling in water and using a four
inch gas pump to propel the water • The pump was connected to a header hose that then
dispersed into drip tape every thirty inches that ran the length of the plot
• The plots were given the equivalent of about 1/3 inch of rain per week
• While it was not a large amount of water it was enough to keep ample green vegetation in the plots
Plot Monitoring
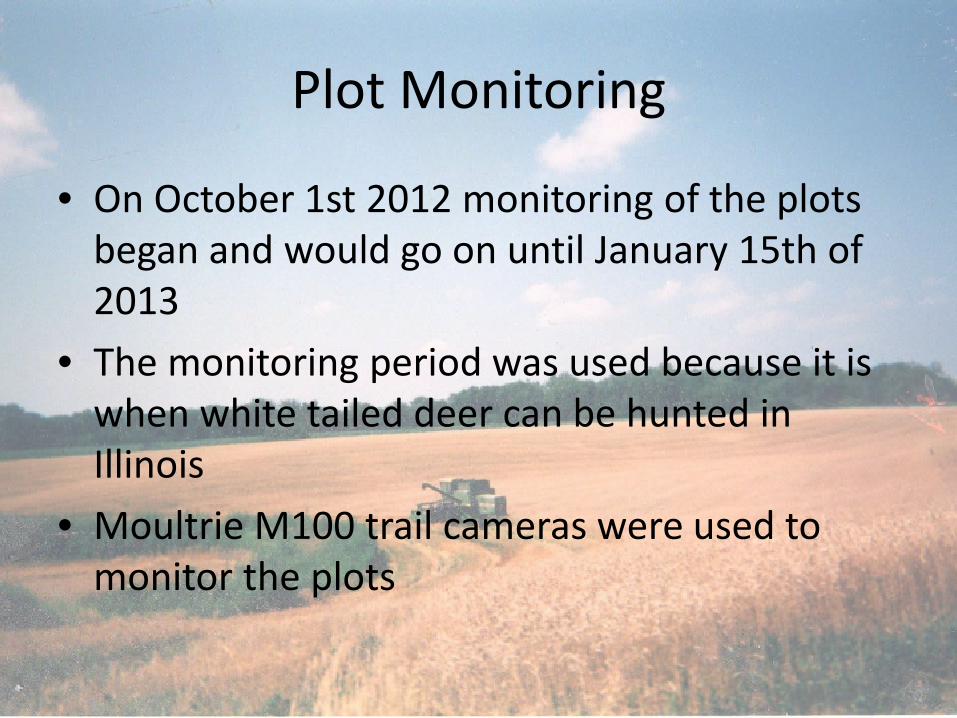
• On October 1st 2012 monitoring of the plots began and would go on until January 15th of 2013
• The monitoring period was used because it is when white tailed deer can be hunted in Illinois
• Moultrie M100 trail cameras were used to monitor the plots

M100 Cameras • The cameras monitor atmospheric
pressure, temperature, moon phase, date, and time
• The trail cameras were set to take a photo every second as long as movement existed in the plot
• The memory cards were exchanged
and batteries were checked every week to ensure no data was lost
• Every week following the data collection the film was examined and the data was entered into a spreadsheet for analysis at the end of deer season

Results
0
20
40
60
80
100
120
140
Clov
er
10/01/2012 11/01/2012 12/01/2012 01/01/2013
Date
0
20
40
60
80
100
120
140
Soyb
eans
10/01/2012 11/01/2012 12/01/2012 01/01/2013
Date
0
20
40
60
80
100
120
140
Bras
sica
10/01/2012 11/01/2012 12/01/2012 01/01/2013
Date
0
20
40
60
80
100
120
140
Oat
s
10/01/2012 11/01/2012 12/01/2012 01/01/2013
Date
0
20
40
60
80
100
120
140
Whe
at
10/01/2012 11/01/2012 12/01/2012 01/01/2013
Date
0
20
40
60
80
100
120
140
Fallo
w10/01/2012 11/01/2012 12/01/2012 01/01/2013
Date
Graphing the Plots
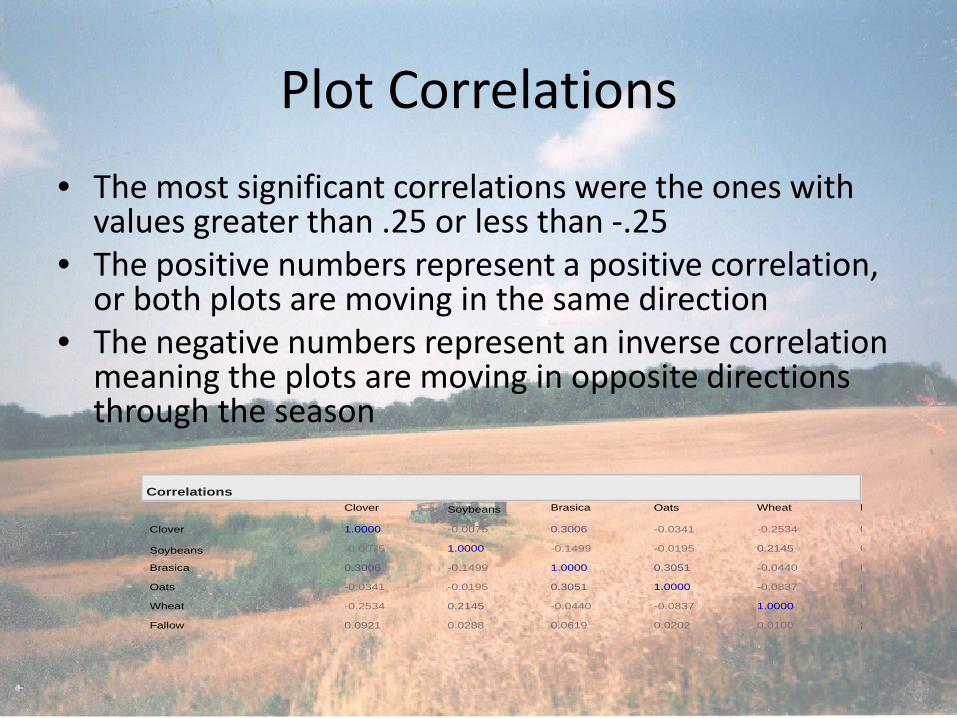
Plot Correlations • The most significant correlations were the ones with
values greater than .25 or less than -.25 • The positive numbers represent a positive correlation,
or both plots are moving in the same direction • The negative numbers represent an inverse correlation
meaning the plots are moving in opposite directions through the season
Clover
Soybeans
Brasica
Oats
Wheat
Fallow
1.0000
-0.0075
0.3006
-0.0341
-0.2534
0.0921
-0.0075
1.0000
-0.1499
-0.0195
0.2145
0.0288
0.3006
-0.1499
1.0000
0.3051
-0.0440
0.0619
-0.0341
-0.0195
0.3051
1.0000
-0.0837
0.0202
-0.2534
0.2145
-0.0440
-0.0837
1.0000
0.0100
0
0
0
0
0
1
Clover Soybeans Brasica Oats Wheat FCorrelations
Data Analysis
• Divided the data into two week intervals for each
month (1st - 15th & 16th- months end)
• January only had 1st half of month analyzed
• Used JMP to perform a one way ANOVA for each
segment of the season

October 1st-15th
• Dominated by the clover and brassica plots
• The mean deer minutes per day for these two plots were 25 minutes per day for the brassicas, and 37 minutes per day for the clover
• This was significantly higher than any other plot in the experiment for early October (P<0.001)
Oneway Analysis of Data By Label
-20
0
20
40
60
80
100
Dat
a
Brassica Clover Fallow Oats Soybeans Wheat
Label
Oneway Anova
Summary of FitRsquare
Adj Rsquare
Root Mean Square Error
Mean of Response
Observations (or Sum Wgts)
0.3
0.2
21
11
18
Analysis of Variance
Source
Label
Error
C. Total
DF
5
174
179
Sum of
Squares
38187.44
83550.47
121737.91
Mean Square
7637.49
480.18
F Ratio
15.9056
Pro
<.000*
Means for Oneway AnovaLevel
Brassica
Clover
Fallow
Oats
Soybeans
Wheat
Number
30
30
30
30
30
30
Mean
25.3333
37.6333
0.3333
0.5000
4.0000
1.6667
Std Error
4.0007
4.0007
4.0007
4.0007
4.0007
4.0007
Lower 95%
17.44
29.74
-7.56
-7.40
-3.90
-6.23
Upp
33.2
45.5
8.23
8.39
11.8
9.56
Std Error uses a pooled estimate of error variance
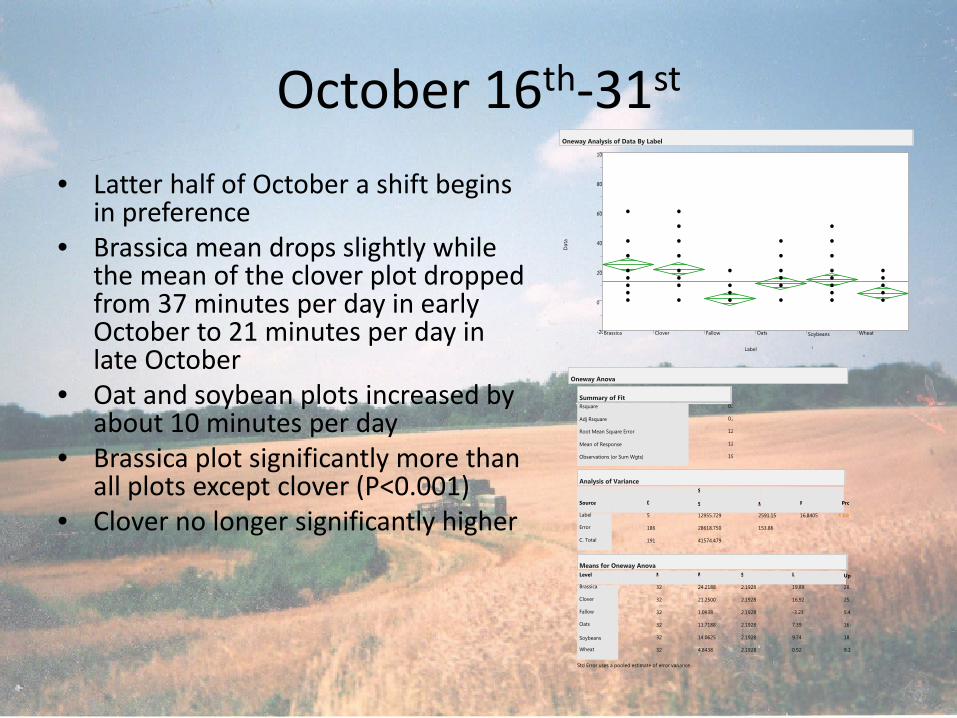
October 16th-31st • Latter half of October a shift begins
in preference • Brassica mean drops slightly while
the mean of the clover plot dropped from 37 minutes per day in early October to 21 minutes per day in late October
• Oat and soybean plots increased by about 10 minutes per day
• Brassica plot significantly more than all plots except clover (P<0.001)
• Clover no longer significantly higher
Oneway Analysis of Data By Label
-20
0
20
40
60
80
100
Dat
a
Brassica Clover Fallow Oats Soybeans Wheat
Label
Oneway Anova
Summary of FitRsquare
Adj Rsquare
Root Mean Square Error
Mean of Response
Observations (or Sum Wgts)
0.3
0.2
12
12
19
Analysis of Variance
Source
Label
Error
C. Total
DF
5
186
191
Sum of
Squares
12955.729
28618.750
41574.479
Mean Square
2591.15
153.86
F Ratio
16.8405
Pro
<.000*
Means for Oneway AnovaLevel
Brassica
Clover
Fallow
Oats
Soybeans
Wheat
Number
32
32
32
32
32
32
Mean
24.2188
21.2500
1.0938
11.7188
14.0625
4.8438
Std Error
2.1928
2.1928
2.1928
2.1928
2.1928
2.1928
Lower 95%
19.89
16.92
-3.23
7.39
9.74
0.52
Upp
28.5
25.5
5.42
16.0
18.3
9.17
Std Error uses a pooled estimate of error variance
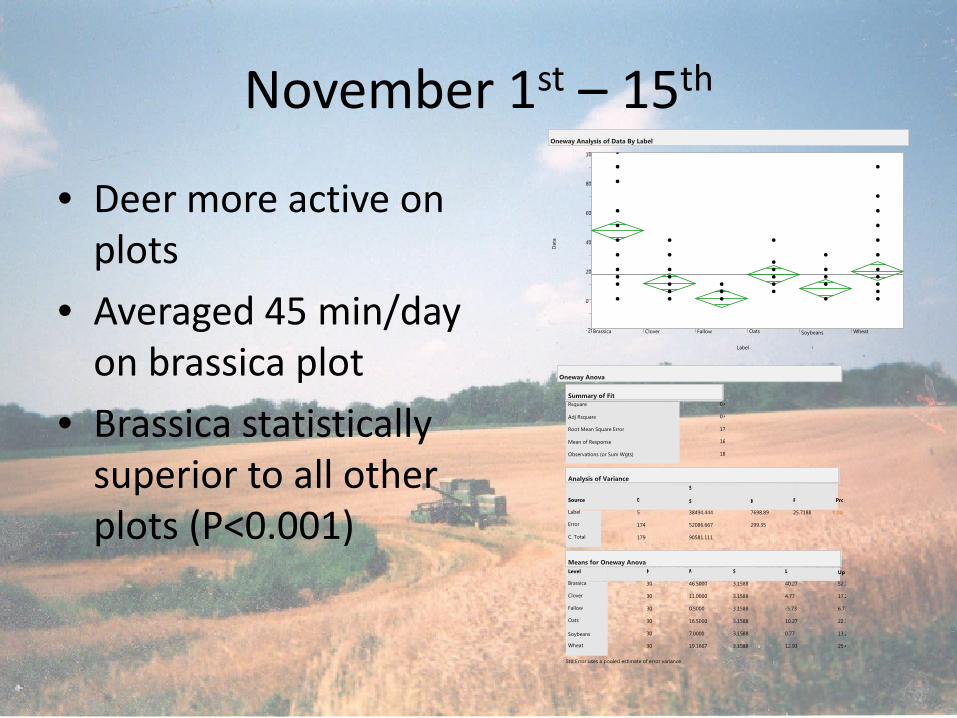
November 1st – 15th
• Deer more active on plots
• Averaged 45 min/day on brassica plot
• Brassica statistically superior to all other plots (P<0.001)
Oneway Analysis of Data By Label
-20
0
20
40
60
80
100
Dat
a
Brassica Clover Fallow Oats Soybeans Wheat
Label
Oneway Anova
Summary of FitRsquare
Adj Rsquare
Root Mean Square Error
Mean of Response
Observations (or Sum Wgts)
0.4
0.4
17
16
18
Analysis of Variance
Source
Label
Error
C. Total
DF
5
174
179
Sum of
Squares
38494.444
52086.667
90581.111
Mean Square
7698.89
299.35
F Ratio
25.7188
Pro
<.000*
Means for Oneway AnovaLevel
Brassica
Clover
Fallow
Oats
Soybeans
Wheat
Number
30
30
30
30
30
30
Mean
46.5000
11.0000
0.5000
16.5000
7.0000
19.1667
Std Error
3.1588
3.1588
3.1588
3.1588
3.1588
3.1588
Lower 95%
40.27
4.77
-5.73
10.27
0.77
12.93
Up
52.7
17.2
6.73
22.7
13.2
25.4
Std Error uses a pooled estimate of error variance
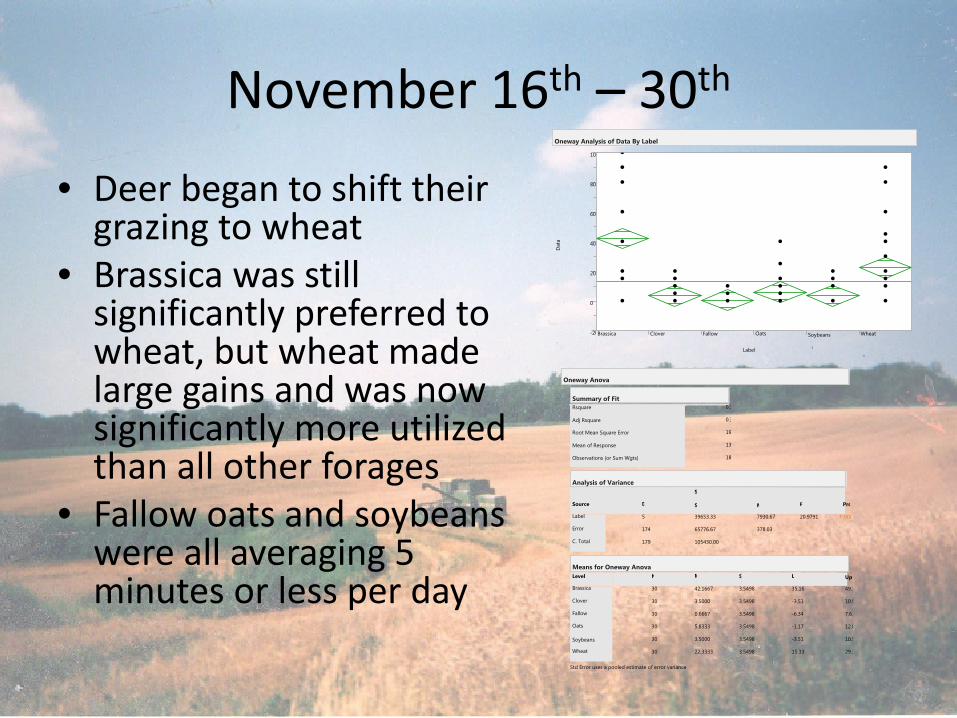
November 16th – 30th
• Deer began to shift their grazing to wheat
• Brassica was still significantly preferred to wheat, but wheat made large gains and was now significantly more utilized than all other forages
• Fallow oats and soybeans were all averaging 5 minutes or less per day
Oneway Analysis of Data By Label
-20
0
20
40
60
80
100
Dat
a
Brassica Clover Fallow Oats Soybeans Wheat
Label
Oneway Anova
Summary of FitRsquare
Adj Rsquare
Root Mean Square Error
Mean of Response
Observations (or Sum Wgts)
0.3
0.3
19
13
18
Analysis of Variance
Source
Label
Error
C. Total
DF
5
174
179
Sum of
Squares
39653.33
65776.67
105430.00
Mean Square
7930.67
378.03
F Ratio
20.9791
Pro
<.000*
Means for Oneway AnovaLevel
Brassica
Clover
Fallow
Oats
Soybeans
Wheat
Number
30
30
30
30
30
30
Mean
42.1667
3.5000
0.6667
5.8333
3.5000
22.3333
Std Error
3.5498
3.5498
3.5498
3.5498
3.5498
3.5498
Lower 95%
35.16
-3.51
-6.34
-1.17
-3.51
15.33
Upp
49.1
10.5
7.67
12.8
10.5
29.3
Std Error uses a pooled estimate of error variance
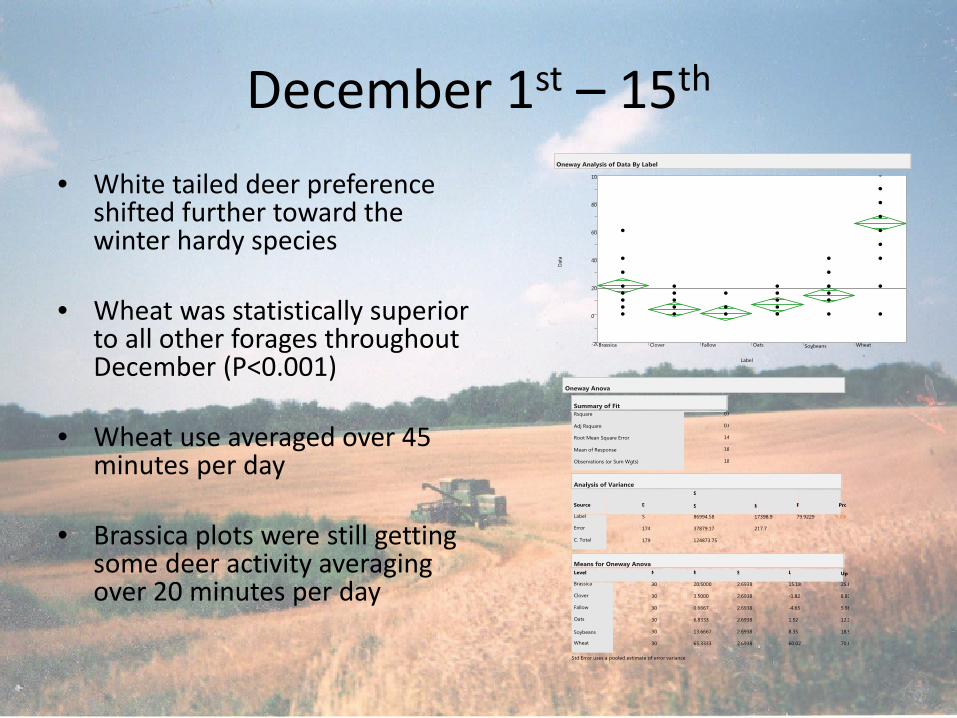
December 1st – 15th • White tailed deer preference
shifted further toward the winter hardy species
• Wheat was statistically superior
to all other forages throughout December (P<0.001)
• Wheat use averaged over 45
minutes per day • Brassica plots were still getting
some deer activity averaging over 20 minutes per day
Oneway Analysis of Data By Label
-20
0
20
40
60
80
100
Dat
a
Brassica Clover Fallow Oats Soybeans Wheat
Label
Oneway Anova
Summary of FitRsquare
Adj Rsquare
Root Mean Square Error
Mean of Response
Observations (or Sum Wgts)
0.6
0.6
14
18
18
Analysis of Variance
Source
Label
Error
C. Total
DF
5
174
179
Sum of
Squares
86994.58
37879.17
124873.75
Mean Square
17398.9
217.7
F Ratio
79.9229
Pro
<.000*
Means for Oneway AnovaLevel
Brassica
Clover
Fallow
Oats
Soybeans
Wheat
Number
30
30
30
30
30
30
Mean
20.5000
3.5000
0.6667
6.8333
13.6667
65.3333
Std Error
2.6938
2.6938
2.6938
2.6938
2.6938
2.6938
Lower 95%
15.18
-1.82
-4.65
1.52
8.35
60.02
Up
25.8
8.81
5.98
12.1
18.9
70.6
Std Error uses a pooled estimate of error variance
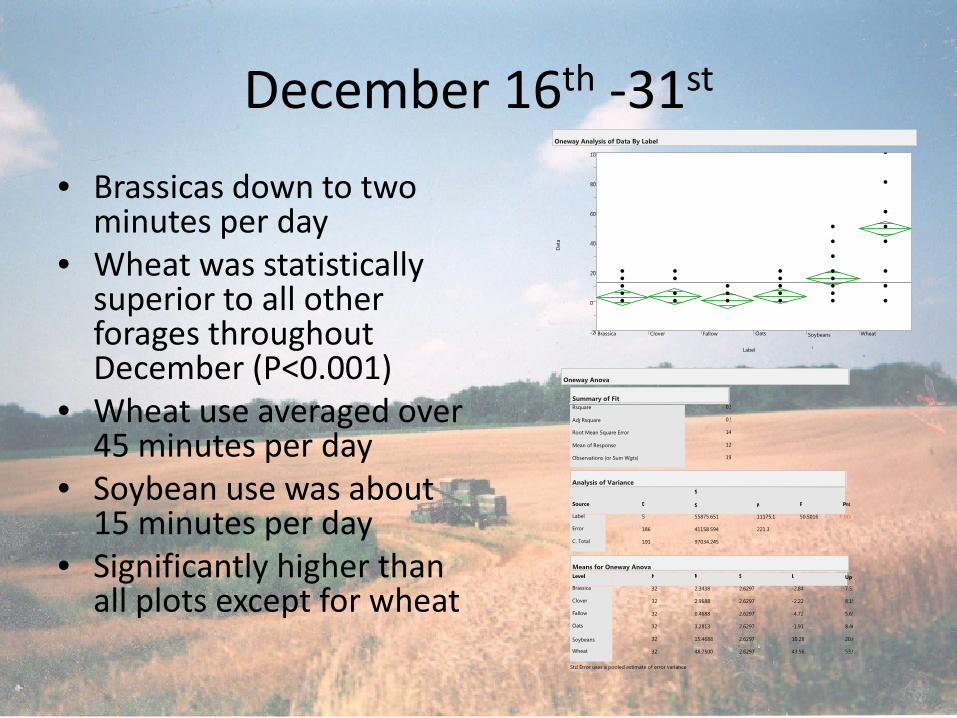
December 16th -31st • Brassicas down to two
minutes per day • Wheat was statistically
superior to all other forages throughout December (P<0.001)
• Wheat use averaged over 45 minutes per day
• Soybean use was about 15 minutes per day
• Significantly higher than all plots except for wheat
Oneway Analysis of Data By Label
-20
0
20
40
60
80
100
Dat
a
Brassica Clover Fallow Oats Soybeans Wheat
Label
Oneway Anova
Summary of FitRsquare
Adj Rsquare
Root Mean Square Error
Mean of Response
Observations (or Sum Wgts)
0.5
0.5
14
12
19
Analysis of Variance
Source
Label
Error
C. Total
DF
5
186
191
Sum of
Squares
55875.651
41158.594
97034.245
Mean Square
11175.1
221.3
F Ratio
50.5016
Pro
<.000*
Means for Oneway AnovaLevel
Brassica
Clover
Fallow
Oats
Soybeans
Wheat
Number
32
32
32
32
32
32
Mean
2.3438
2.9688
0.4688
3.2813
15.4688
48.7500
Std Error
2.6297
2.6297
2.6297
2.6297
2.6297
2.6297
Lower 95%
-2.84
-2.22
-4.72
-1.91
10.28
43.56
Upp
7.53
8.15
5.65
8.46
20.6
53.9
Std Error uses a pooled estimate of error variance
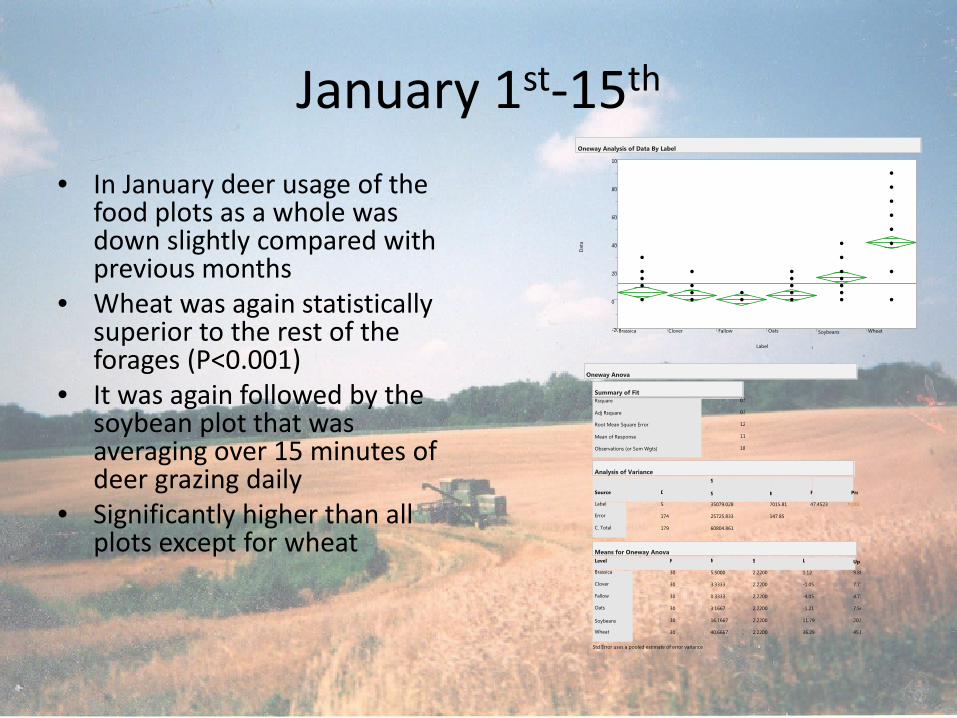
January 1st-15th • In January deer usage of the
food plots as a whole was down slightly compared with previous months
• Wheat was again statistically superior to the rest of the forages (P<0.001)
• It was again followed by the soybean plot that was averaging over 15 minutes of deer grazing daily
• Significantly higher than all plots except for wheat
Oneway Analysis of Data By Label
-20
0
20
40
60
80
100
Dat
a
Brassica Clover Fallow Oats Soybeans Wheat
Label
Oneway Anova
Summary of FitRsquare
Adj Rsquare
Root Mean Square Error
Mean of Response
Observations (or Sum Wgts)
0.5
0.5
12
11
18
Analysis of Variance
Source
Label
Error
C. Total
DF
5
174
179
Sum of
Squares
35079.028
25725.833
60804.861
Mean Square
7015.81
147.85
F Ratio
47.4523
Pro
<.000*
Means for Oneway AnovaLevel
Brassica
Clover
Fallow
Oats
Soybeans
Wheat
Number
30
30
30
30
30
30
Mean
5.5000
3.3333
0.3333
3.1667
16.1667
40.6667
Std Error
2.2200
2.2200
2.2200
2.2200
2.2200
2.2200
Lower 95%
1.12
-1.05
-4.05
-1.21
11.79
36.29
Upp
9.88
7.71
4.71
7.54
20.5
45.0
Std Error uses a pooled estimate of error variance
Discussion
• Looking for a superior plot out of the group • Data analysis revealed that there was no
single forage that was superior across the entire season
• In order to attract white tailed deer to the farm for the entire hunting season it will likely be necessary to plant multiple plots or rotations
Discussion

Possible Rotations Year Rotation 1 Rotation 2 Rotation 3 Rotation 4
1 Corn with tillage radishes applied by airplane in fall
prior to harvest
Corn with tillage radishes applied by airplane in fall
prior to harvest Corn Corn
2 Soybeans followed by
winter wheat Soybeans followed by
winter wheat Soybeans followed by
winter wheat Soybeans followed by
winter wheat
3 Winter wheat with frost
seeded clover Winter wheat with double
crop soybeans Winter wheat with double
crop soybeans Winter wheat with frost
seeded clover
Rotation 1
• Most ideal rotation • Most expensive to farmer • Other benefits besides attracting deer
– Cover crops – Compaction loss – Disease/insect cycle broken up
• Ideal for use on steeper hills
Tillage Radish
• Extra expense • Weed suppression • Stock pile nutrients • Die with a couple nights below 20 degrees
Fahrenheit • Winter cover crop • Erosion control
Red Clover
• Loss of a row crop • Winter cover crop • Weed suppression • Erosion control • Nitrogen fixation • Hay

Other options
• Eliminate Radish to save on cost • Follow winter wheat with soybeans have
extra income from an additional row crop • Leave soybeans standing rather than
incorporating winter wheat • No fall tillage • Use food plots instead of incorporating into
crop rotation
Conclusion
• Benefits to cropping system • Benefits to deer herd • Extra income from outfitting/ land lease • Coincidentally the portions of the farm where
cover crops may provide better erosion control or that where soils may be less fertile are also those areas best suited for wildlife habitat