Embed Size (px)
Citation preview
Determining Gas Hydrate Distribution at Porangahau Ridge, Southern Hikurangi
Subduction Margin Using Seismic and Controlled Source Electromagnetic Data
S. Toulmin1, I. Pecher1, K. Schwalenberg2, S. Henrys3 & G. Crutchley4
1 Heriot-Watt University & ECOSSE, Edinburgh, Scotland (UK), [email protected]
2 Federal Institute for Geosciences and Natural Resources (BGR), Hannover, Germany
3 GNS Science, Lower Hutt, New Zealand (presenting author)
4 University of Otago, Dunedin, New Zealand
ABSTRACTPorangahau Ridge is a prominent thrust ridge inferred to contain large concentrations of gas
hydrate, located within the accretionary wedge of the southern Hikurangi Subduction Margin. A
high-resolution velocity model developed using conventional and horizon based velocity analysis
has been used to derive a preliminary migrated seismic section. This preliminary section reveals
complex near-surface faulting not previously resolved, and more clearly defines a band of high-
amplitude reflections above the regional bottom simulating reflections (BSRs). Interpretation of
the depth-converted migrated seismic section provides new insight into the nature of faulting and
its relationship to fluid flow and gas hydrate formation on the margin.
Controlled source electromagnetic (CSEM) surveying is sensitive to highly-resistive gas hydrate
and free gas in water-saturated conductive sub-seafloor sediments to depths of a few hundred
metres below the seafloor. CSEM data acquired along a transect across Porangahau Ridge
(coincident with 05CM-38 seismic profile) show anomalously high apparent resistivities above
the high-amplitude reflection bands we observe, and close to a near surface, small high ampli-
tude reflection.
INTRODUCTIONA bottom-simulating reflection (BSR) with a negative impedance contrast is a useful tool for identify-
ing locations where gas hydrate is overlying free gas at the base of gas hydrate stability (BGHS).
However, seismic data provides little information about the distribution of gas hydrate within the gas
hydrate stability zone.
Controlled Source Electromagnetic Methods (CSEM) detect variations in the resistivity structure of
sediments within the top few hundred metres of seafloor sediments. Hydrocarbons are strongly
resistive in comparison with seawater, so produce a strong positive resistivity anomaly. Here we
show that joint analysis of resistivity inversions and seismic data provides constraint on the distribu-
tion of gas hydrate within the gas hydrate stability zone.
SEISMIC DATAHere we present a depth converted migrated seismic
section which has been processed using a smoothed
version of our high resolution velocity model. The
seismic section clearly resolves the BSR, a high-
DISCUSSION AND CONCLUSIONSA combination of good quality seismic data and controlled source electromagnetic data provides
constraint on the vertical distribution of gas hydrate within the Gas Hydrate Stability Zone at
Porangahau Ridge.
Our results show that a high amplitude seismic reflection close to the seafloor coincides with a
strong resisitvity anomaly, indicating the presence of hydrocarbon (likely gas hydrate) at 90 mbsf,
on the western flank of Porangahau Ridge.
A smaller resistivity anomaly is located immediately beneath the apex of the anticline and
adjacent to a fault extending towards a high amplitude reflection band. Crutchley et al (2006)
suggests that this high amplitude reflection band (and others on the margin) are connected to the
gas hydrate system. Furthermore, Crutchley et al (2006, submitted) and Pecher et al (2006)
suggest that the high amplitude reflection band is caused by the presence free gas above BGHS.
The second, smaller resisitvity anomaly is therefore intepreted to be caused by free gas, or gas
hydrate, formed by gas migrating upwards from the high amplitude reflectivity band and along the
intepreted fault. On encountering a low permeability layer the gas is forced laterally into a high
permeability bed. If the sediments become methane saturated, gas hydrate will form.
REFERENCESBarnes, P. M., and B. Mercier de Lepinay, 1997, Rates and mechanics of rapid frontal acrretion along the very obliquely converget southern Hikurangi margin, New Zealand: J. Geophys. Res., 102, 24931-24952.
Bialas, J., J. Greinert, P. Linke, and O. Pfannkuche, 2007, FS Sonne Fahrtbericht / Cruise Report SO 191 New Vents: IFM-GEOMAR.
Crutchley, G.J.,Pecher, S. Henrys and A Gorman., 2006. Gas hydrate “sweet spots” on the Hikurangi Margin, from recently acquired multi-channel seismic data, Proc. New Zealand Petrol. Conf., Auckland,7pp.
Crutchley, G. J., A. R. Gorman, I. A. Pecher, and S. Henrys, submitted, Full-waveform inversion applied to sites hosting potentially high gas hydrate accumulations; Hikurangi Margin, New Zealand: Geochem., Geophys.,
Geosys.
DeMets, C., R. G. Gordon, D. F. Argus, and S. Steins, 1990, Current plate motions: Geophys. J. Int., 101, 425-478.
Henrys, S. A., D. J. Woodward, and I. A. Pecher, submitted, Variation of bottom-simulating reflection (BSR) strength in a high-flux methane province, Hikurangi margin, New Zealand, AAPG Special Publication.
Pecher, I. A., R. Coffin, S. A. Henrys, and CHARMNZ Working Group, 2007, Cruise Report: gas hydrate exploration on the East Coast, North Island, New Zealand, GNS Science Report 2007/29.
Pecher, I. A., and S. A. Henrys, 2003, Potential gas reserves in gas hydrate sweet spots on the Hikurangi Margin, New Zealand: GNS Science Report, 2003/23.
Pecher, I. A., S. A. Henrys, N. Kukowski, G. J. Crutchley, A. R. Gorman, W. T. Wood, R. Coffin, J. Greinert, K. Faure, and CHARMNZ Working Group, submitted, Focussing of fluid expulsion on the Hikurangi margin, New
Zealand, based on evidence for free gas in the regional gas hydrate stability zone: Mar. Geol.
Schwalenberg, K., W. Wood, I. Pecher, L. Hamdam, S. Henrys, M. Jegen and R. Coffin, submitted. Preliminary Interpretation of CSEM, heatflow, seismic, and geochemical data for gas hydrate distribution across the
Porangahau Ridge, New Zealand: Mar. Geol.
Sibson, R. H., and J. V. Rowland, 2003, Stress, fluid pressure and structural permeability in seismogenic crust, North Island, New Zealand: Geophys. J. Int., 154, 584-594.
Sloan, E. D., 1998, Clathrate hydrates of natural gases: Marcel Bekker.
Townend, J., 1997b, Subducting a sponge: minimum estimates of the fluid budget of the Hikurangi Margin accretionary prism: Geol. Soc. N.Z. Newsletter, 112, 14-16.
ACKNOWLEDGMENTSWe thank captains and crews M/V Pacific Titan,
and R/V Sonne for their hard work. Funding
sources include the New Zealand Foundation of
Research, Science, and Technology (FRST,
contract C05X0302 to GNS Science), GNS and
NIWA Capability Funds, NRL Advanced
Research Initiative, the Office of Naval
Research, the Department of Energy (National
Methane Hydrate R & D), the German Federal
Ministry of Education and Research (BMBF,
grant no. 03G0191A) and ECOSSE.
Fig. 2: Depth converted migration section of 05CM-38. Red box
denotes the location of the enlargement (right), blue box shows
the location of the section in Figure 3.
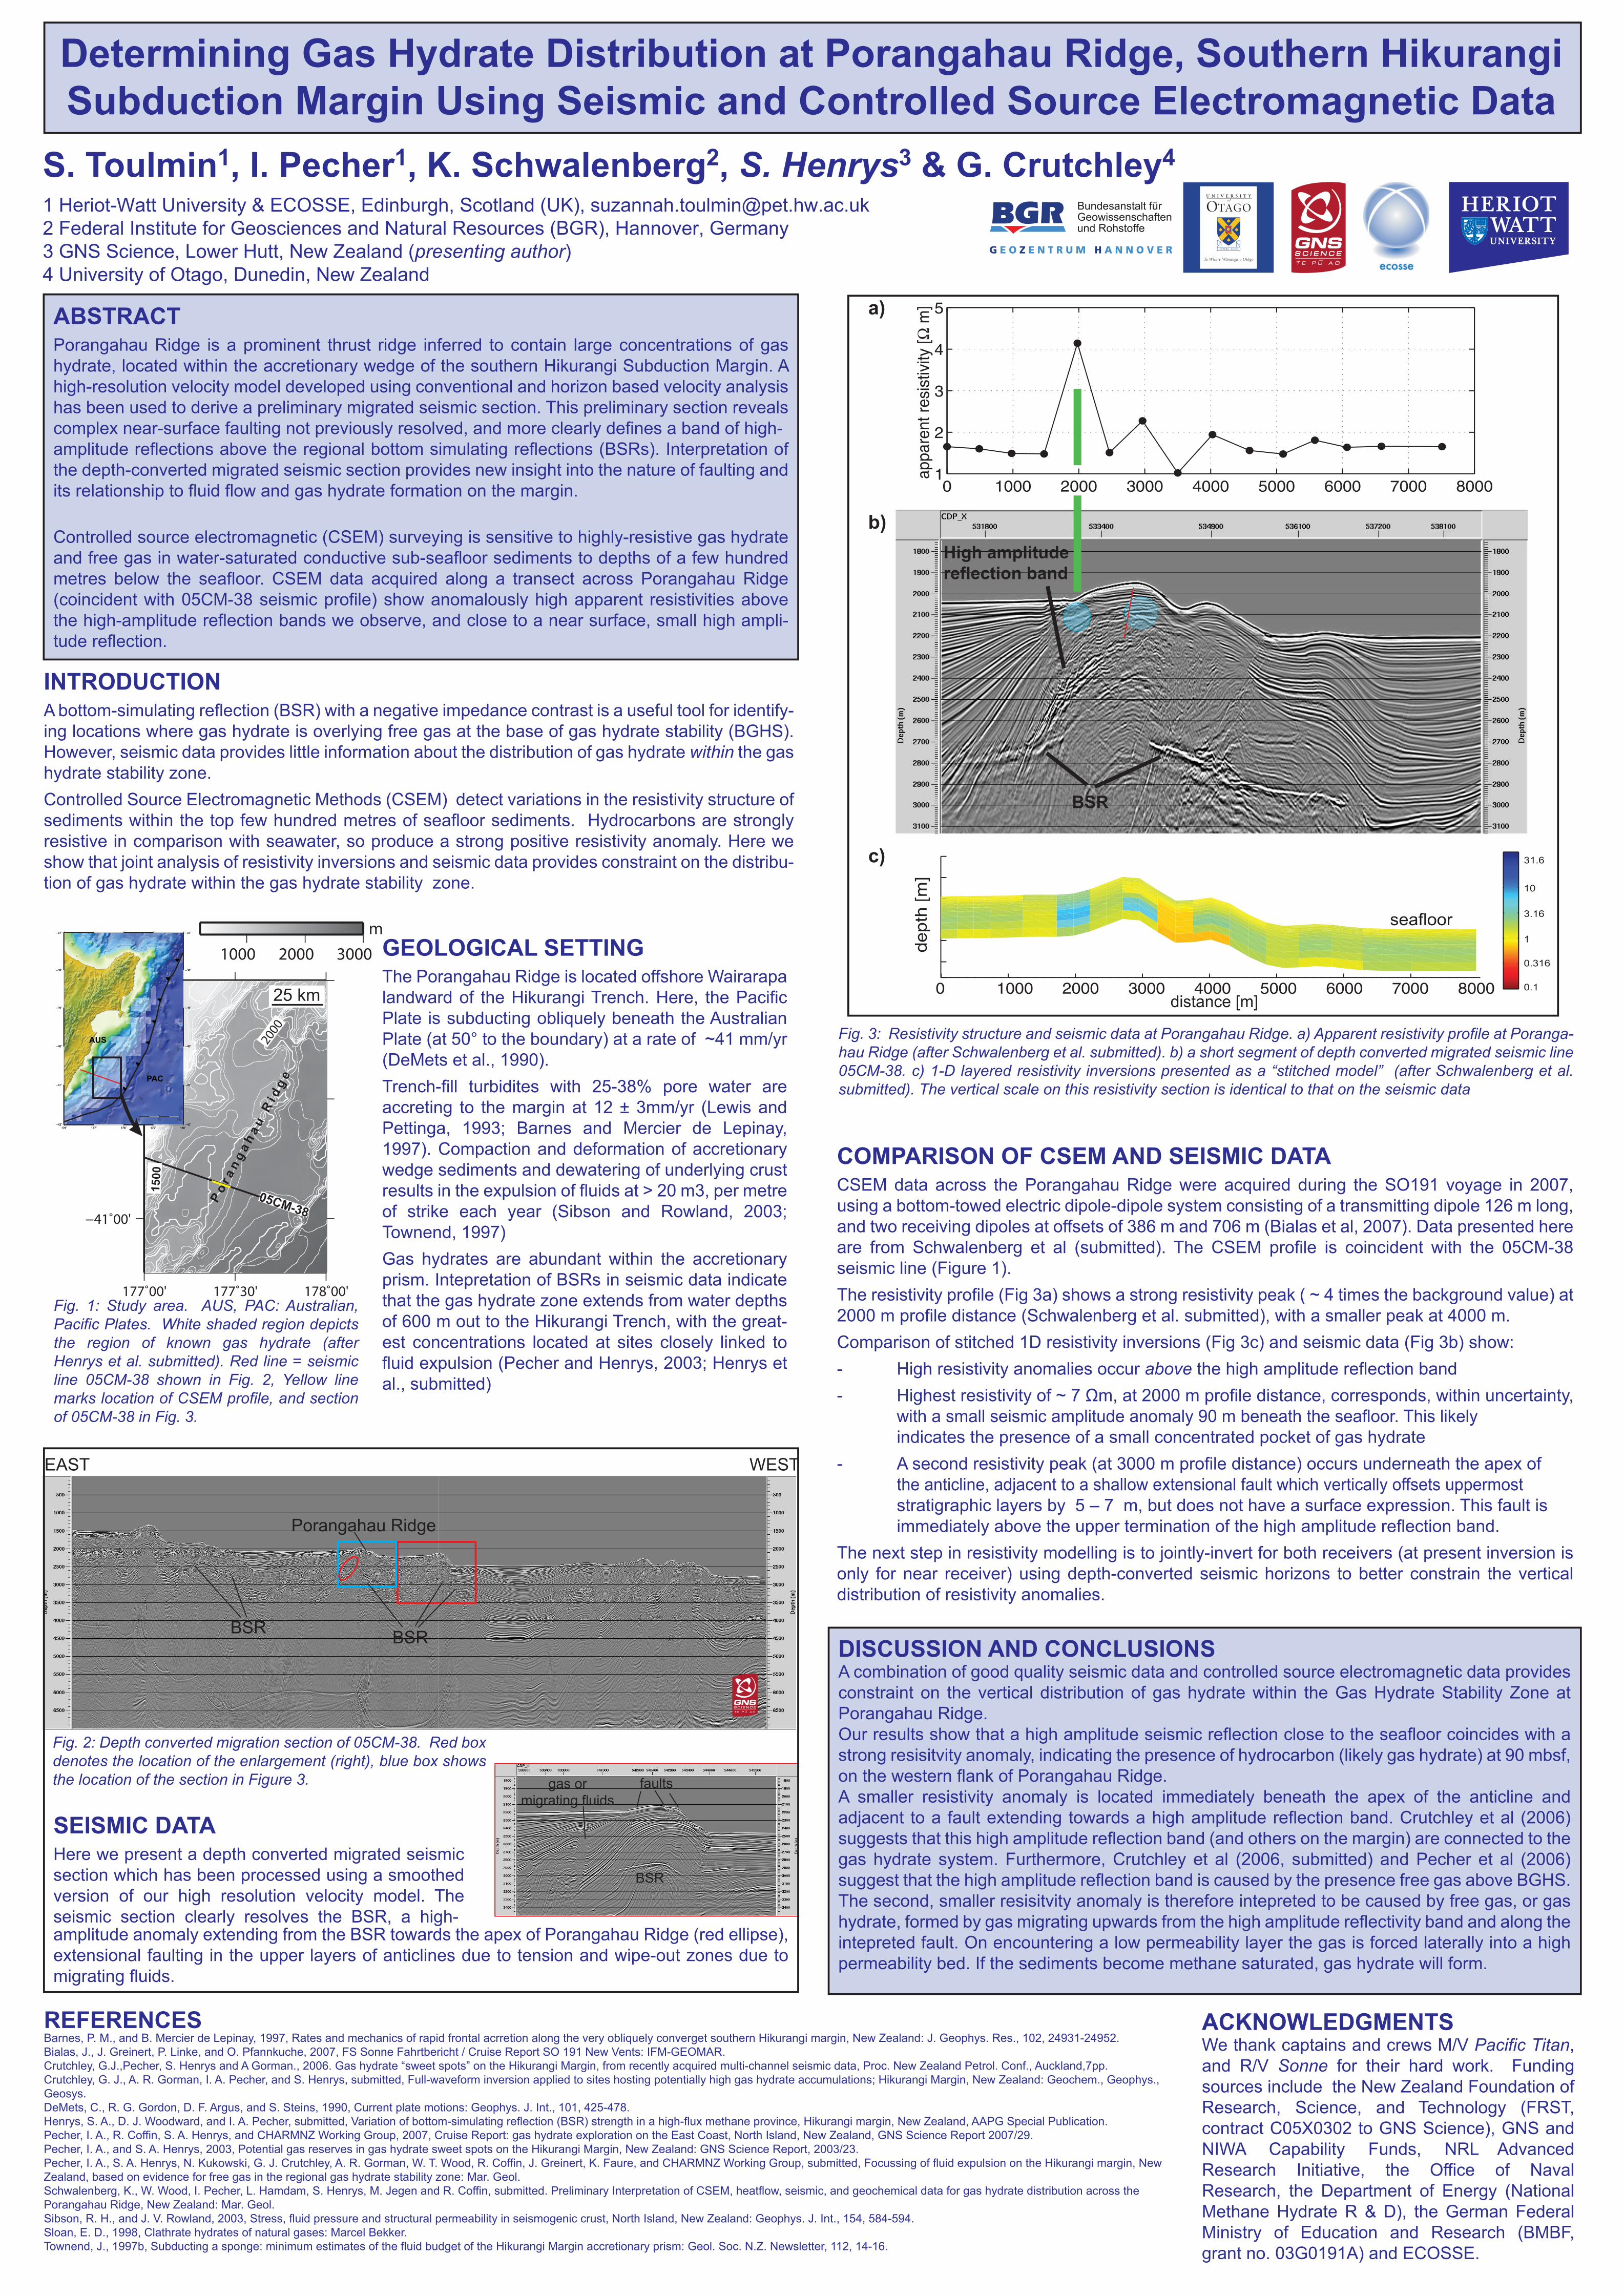
Fig. 3: Resistivity structure and seismic data at Porangahau Ridge. a) Apparent resistivity profile at Poranga-
hau Ridge (after Schwalenberg et al. submitted). b) a short segment of depth converted migrated seismic line
05CM-38. c) 1-D layered resistivity inversions presented as a “stitched model” (after Schwalenberg et al.
submitted). The vertical scale on this resistivity section is identical to that on the seismic data
COMPARISON OF CSEM AND SEISMIC DATACSEM data across the Porangahau Ridge were acquired during the SO191 voyage in 2007,
using a bottom-towed electric dipole-dipole system consisting of a transmitting dipole 126 m long,
and two receiving dipoles at offsets of 386 m and 706 m (Bialas et al, 2007). Data presented here
are from Schwalenberg et al (submitted). The CSEM profile is coincident with the 05CM-38
seismic line (Figure 1).
The resistivity profile (Fig 3a) shows a strong resistivity peak ( ~ 4 times the background value) at
2000 m profile distance (Schwalenberg et al. submitted), with a smaller peak at 4000 m.
Comparison of stitched 1D resistivity inversions (Fig 3c) and seismic data (Fig 3b) show:
- High resistivity anomalies occur above the high amplitude reflection band
- Highest resistivity of ~ 7 Ωm, at 2000 m profile distance, corresponds, within uncertainty,
with a small seismic amplitude anomaly 90 m beneath the seafloor. This likely
indicates the presence of a small concentrated pocket of gas hydrate
- A second resistivity peak (at 3000 m profile distance) occurs underneath the apex of
the anticline, adjacent to a shallow extensional fault which vertically offsets uppermost
stratigraphic layers by 5 – 7 m, but does not have a surface expression. This fault is
immediately above the upper termination of the high amplitude reflection band.
The next step in resistivity modelling is to jointly-invert for both receivers (at present inversion is
only for near receiver) using depth-converted seismic horizons to better constrain the vertical
distribution of resistivity anomalies.
GEOLOGICAL SETTINGThe Porangahau Ridge is located offshore Wairarapa
landward of the Hikurangi Trench. Here, the Pacific
Plate is subducting obliquely beneath the Australian
Plate (at 50° to the boundary) at a rate of ~41 mm/yr
(DeMets et al., 1990).
Trench-fill turbidites with 25-38% pore water are
accreting to the margin at 12 ± 3mm/yr (Lewis and
Pettinga, 1993; Barnes and Mercier de Lepinay,
1997). Compaction and deformation of accretionary
wedge sediments and dewatering of underlying crust
results in the expulsion of fluids at > 20 m3, per metre
of strike each year (Sibson and Rowland, 2003;
Townend, 1997)
Gas hydrates are abundant within the accretionary
prism. Intepretation of BSRs in seismic data indicate
that the gas hydrate zone extends from water depths
of 600 m out to the Hikurangi Trench, with the great-
est concentrations located at sites closely linked to
fluid expulsion (Pecher and Henrys, 2003; Henrys et
al., submitted)
Fig. 1: Study area. AUS, PAC: Australian,
Pacific Plates. White shaded region depicts
the region of known gas hydrate (after
Henrys et al. submitted). Red line = seismic
line 05CM-38 shown in Fig. 2, Yellow line
marks location of CSEM profile, and section
of 05CM-38 in Fig. 3.
1000 2000 3000
m
177˚30' 178˚00'177˚00'
−41˚00'
1500
2000
25 km
05CM-38
Po
ra
ng
ah
au
Ri d
ge
1500
-3000
-3000
-3000
-3000
-3000
-3000
-3000
-3000
-3000
-3000
-3000
-2000
-2000
-2000
-2000
-2000
-2000
-1000
-1000
-1000
-1000
-1000
-1000
-1000
0
0
0
0
1000
-3000
-3000
-2000
-2000
-2000
-2000
-1000
-100
-1000
-1000
-1000
176˚ 177˚ 178˚ 179˚ 180˚
−42˚ −42˚
−41˚ −41˚
−40˚ −40˚
−39˚ −39˚
−38˚ −38˚
−37˚ −37˚
176˚ 177˚ 178˚ 179˚ 180˚
−42˚ −42˚
−41˚ −41˚
−40˚ −40˚
−39˚ −39˚
−38˚ −38˚
−37˚ −37˚
0 75 150
km
PAC
AUS
BSR
High amplitude
reflection band
a)
b)
c)
amplitude anomaly extending from the BSR towards the apex of Porangahau Ridge (red ellipse),
extensional faulting in the upper layers of anticlines due to tension and wipe-out zones due to
migrating fluids.
faultsgas or
migrating fluids
BSR
BSR
Porangahau Ridge
EAST WEST
BSR