Embed Size (px)
Citation preview
Electronic copy available at: http://ssrn.com/abstract=2224447
487Am. J. Enol. Vitic. 63:4 (2012)
Understanding consumer rationale for a particular purchase decision is critical for implementing successful marketing strategies. The case is especially challenging for hedonic prod-ucts for which intrinsic properties (or product performance) and extrinsic attributes (or marketing elements) may influence, consciously or subconsciously, the purchaser. To target po-tential customers, two approaches have prevailed in the wine industry: (1) to conduct usage and attitude surveys leading to consumer segmentation and to deduce which product each segment may like based on past behavior and (2) to conduct actual taste tests, determine sensory preferences, and segment consumers based on the sensory attributes driving their prefer-ences. It is generally accepted that particular wine styles will not appeal to each individual wine consumer, considering the biological, cultural, and genetic variability among individuals (Bisson et al. 2002, Simons and Noble 2003). Researchers and
wine professionals alike are therefore highly motivated to bet-ter understand and target consumer wine sensory preferences.
Intrinsic wine quality cues equate to their sensory attri-butes and are commonly described as “taste,” which is one of the factors most often listed by consumers as a determi-nant of their choice and wine consumption (Thompson and Vourvachis 1995, Jaeger et al. 2009). Consequently, sensory attributes are frequently used by the wine industry to com-municate the type of wine quality consumers will likely ex-perience when consuming the wine. The use of past behavior to predict likelihood of future behavior is part of traditional marketing research practice. The wine marketing literature has investigated the role of individual characteristics such as gender, generation, and lifestyle on consumer purchase and consumption preferences, considering indexes such as past volume consumption of a particular wine type or stated pref-erences by consumers through interviews or questionnaires. General trends have been reported mainly by American (Bru-wer and Johnson 2010) and Australian (Bruwer et al. 2011) studies. For example, it was found that gender differences in wine consumption are likely to be associated more strongly with volume and perhaps wine style and grape variety (Bru-wer et al. 2005, Bruwer 2007). Females were found to prefer lighter wine styles (Bruwer et al. 2012) and sweeter wines (Bruwer et al. 2011, Miller and Bruwer 2006). When the mil-lennial generation entered the wine market, several studies implemented qualitative (e.g., focus groups) and quantitative research (e.g., surveys) to summarize what this generation was drinking and what they liked and disliked in order to deduce the wine sensory profile that was most appreciated (Thach and Olsen 2004, 2006). Millennials stated that they drank red wine before they tried other wine styles (Bruwer et al. 2012, Olsen
1Research Director; 2Research Associate, Consumer Insights and Product In-novation, Vineland Research Innovation Centre, 4890 Victoria North, P.O. Box 4000, Vineland Station, Ontario, Canada L0R2E0; and 3Associate Professor, School of Agriculture, Food and Wine, Wine Science and Business Group, University of Adelaide, Waite Campus, Glen Osmond, SA 5064, Australia.*Corresponding author (email: [email protected])Acknowledgments: The financial assistance of Canada-Ontario Orchard Vineyard Transition Program is acknowledged.The authors thank Erika Neudorf, Michele Moniz, and Cassandra Price for technical assistance. Sections of this study were presented at the Seventh In-ternational Symposium on Cool Climate Viticulture and Enology, June 2010, Seattle, Washington.Manuscript submitted Sept 2011, revised Jan 2012, May 2012, accepted Jun 2012Copyright © 2012 by the American Society for Enology and Viticulture. All rights reserved.doi: 10.5344/ajev.2012.11085
Determining the Impact of Consumer Characteristics to Project Sensory Preferences in Commercial White Wines
Isabelle Lesschaeve,1* Amy Bowen,2 and Johan Bruwer3
Abstract: The sensory preferences for white wines of three consumer groups selected for their differences in wine consumption habits and attitudes toward wines were investigated. A stepwise screening of the wines was used to ensure an objective selection based solely on perceived sensory characteristics while representing the commercial market. Sensory profiles of the selected wines were then determined by trained sensory descriptive panelists (n = 10). Consumers (n = 120) were recruited, assigned to one of three a priori groups, and evaluated 12 white wines. Internal preference mapping was conducted to explain consumer preference data with wine sensory descriptions and consumer characteristics. Results showed that sensory preferences were not significantly different among a priori consumer groups. Segmentation of individual liking scores revealed two distinct preference segments, with the largest one accounting for 77%. The majority of consumers preferred sweeter and fruitier wines as opposed to oaky and burning wines, independently of their a priori assigned group. Only a few demographics and attitudinal characteristics distinguished the two preference segments; however, they were not related to the initial a priori grouping. The primary dimension explaining consumer preferences for white wines confirmed previous research findings on other wine styles and obtained from various groups of consumers, suggesting that the main preference dimension common to many wine styles was driven by sweet and fruity sensory characteristics as opposed to dry, burning, and oaky attributes.
Key words: preference, sensory analysis, consumer segmentation, consumer behavior, white wine
Electronic copy available at: http://ssrn.com/abstract=2224447
488 – Lesschaeve et al.
Am. J. Enol. Vitic. 63:4 (2012)
et al. 2007) and preferred red wines in general, according to a 2007 Nielsen Company marketing report (Millennials and Beverage Alcohol Study). Another marketing tool is to study sales data over a period of time to predict the growth or decline of a particular wine category and thus determine the taste characteristics that appeal to consumers. The lack of tasting opportunities for consumers forces researchers to rely on stated, rather than behavioral, information and to de-duce the sensory attributes to be used for communications or winemaking. These attributes are often generated by market-ers or winemakers based on their own experience and have been shown to misrepresent the quality experienced by a less professional consumer (e.g., Solomon 1990). Moreover, the vocabulary used by consumers tends to be more general and could be misleading at times (Lesschaeve 2006).
Rather than relying on experts to predict consumer likes and dislikes, several studies have used sensory data and sta-tistical tools to investigate the sensory attributes that drive consumer preferences for particular wine styles (Yegge and Noble 2001, Lesschaeve et al. 2002, Francis et al. 2005, Lund et al. 2009, Lattey et al. 2010). The main outcome is a prefer-ence map, which is used to interpret preferences with sensory attributes or to predict preferences from the sensory attributes. In the first instance, the intent is to fully characterize the sensory landscape defining consumer likes and dislikes. In the second instance, the main purpose is to develop a statisti-cal tool to create new wine styles and check their likeability by submitting them only to sensory descriptive analysis and derive a position on the preference map, without the need to run a formal consumer test (MacFie 2007). These preference maps are based on blind evaluation, without any marketing information. These extrinsic cues, on the one hand, have been shown in the literature to impact overall product acceptabil-ity and wine particularly. Brand names (Lange et al. 2002), appellations of origin (Lange 2000) or regions of origin and price (e.g., D’Hauteville et al. 2007, Goldstein et al. 2008), or context of tasting (Mantonakis et al. 2009) were shown to generate cognitive dissonance between visual expectations and sensory perceptions and to alter the actual sensory expe-rience of tasting a glass of wine. Knowledge of blind sensory preferences, on the other hand, enables the assessment of the appropriateness of the wine itself with the marketing attri-butes or product concept. Tasting wine first in a blind setting and then with packaging options is recommended to ensure that wine sensory properties match the marketing concept.
Based on these two approaches to determine wine sensory preferences, this study purports to determine whether charac-terizations of consumer stated usage and attitudes align with actual sensory preferences of commercially available white wines, using a case study conducted in response to an Ontario (Canada) grape and wine industry initiative.
Materials and MethodsThe study was designed in three steps: (1) a wine screen-
ing process based on sensory characteristics, (2) descriptive analysis of the selected white wines, and (3) hedonic assess-ment by three groups of consumers a priori assigned based
on usage and attitudes. The industry participation and inputs were solicited at several occasions in the process to comply with the terms under which this project was conducted.
Tasting conditions. Wine evaluations were conducted in two different facilities where similar tasting parameters were implemented to ensure consistency and integrity of the sen-sory and hedonic data. The screening and descriptive analysis sessions were conducted in the sensory evaluation laboratory of the Vineland Research and Innovation Centre, which has 10 computerized independent booths. Descriptive panelists recorded their answers on a computer using EyeQuestion software (Logic 8, The Netherlands).The hedonic assessment were conducted in the sensory facility of a contracted service provider (ACCE International, Mississauga, Canada), which had 20 independent booths. The experimental design and questionnaires were provided to the service provider and they recruited the participants, distributed and coded the question-naires, and administered the sessions.
Wine samples (30 mL) were poured in ISO wineglasses labeled with 3-digit codes and were covered with plastic lids. Samples were presented according to either a sequential mo-nadic presentation or as a set (screening task) following a William’s Latin Square design (MacFie and Bratchell 1989). Serving temperature ranged from 14 to 16°C. Unsalted crack-ers and filtered water were provided for panelists and consum-ers to cleanse their palates between samples.
Screening and product selection. Three Vitis vinifera grape varietals (Riesling, Chardonnay, and Sauvignon blanc) were chosen after consultation with industry stakeholders as good representatives of the white wine market in Ontario. The price range selected, $US 15 to 20 per bottle, represented the premium wine price segment in which VQA (Vintners Quality Alliance) stamped wines compete. (The VQA stamp indicates primarily that the wine is made of 100% Ontario grapes grown in a particular geographical region.) The experimental design applied to select the wines and to address the research objec-tive was adapted from a procedure described previously (Less-chaeve et al. 2002). The first step was a systematic screening of candidate wines based solely on sensory characteristics and wine styles to select samples that would represent the sen-sory variability of Riesling, Chardonnay, and Sauvignon blanc wines available to Ontario consumers. After an extensive re-view, 91 wines were identified for meeting these criteria: 23 Rieslings, 34 Chardonnays, and 34 Sauvignon blancs.
Two bottles of each of the 91 wines were purchased com-mercially and screened for sensory similarities in respec-tive wine styles. Nine experienced wine professionals (three enologists, two sommeliers, two wine writers, and two edu-cators) were recruited from the local wine community and participated voluntarily in three 2-hr sessions scheduled two days apart. For each session, participants evaluated 30 to 34 wines from the same grape varietal. They were first asked to group 15 wines based on similar sensory characteristics. After a 5-min break, participants were asked to match each remaining wine to one of the groups they had created. Wine professionals were informed about the nature of the varietal wine to be evaluated within one session, the price range,
Wine Sensory Preferences – 489
Am. J. Enol. Vitic. 63:4 (2012)
and the fact that all samples were commercially available in Ontario.
Sensory descriptive analysis. The trained sensory panel was comprised of 10 employees (part-time tasters) of Vineland Research and Innovation Centre. They attended 12 2-hr ses-sions to perform a descriptive analysis of the selected wines. In the first six sessions, panelists developed a list of 29 at-tributes describing the perceptions by smell and 39 attributes describing perceptions in mouth. All these attributes were defined by either a physical reference or a verbal definition as described previously (Lesschaeve et al. 2011). The next six sessions were dedicated to the measurement of these at-tributes in the wine samples and were performed in duplicate. For evaluating each sample, panelists were instructed to (1) remove the lid from the glass, (2) swirl the glass three times in a clockwise fashion, and (3) smell or taste the sample and evaluate the intensity of all the sensory properties they per-ceived on a 15-cm linear scale, anchored by weak on the left side and strong on the right side. Intensity measurements were converted into scores from 0 to 100.
Consumer hedonic assessment. One hundred and twenty consumers were recruited from the service provider data-base (ACCE International) and qualified respondents were assigned to one of three consumer groups determined by the Ontario wine industry, corresponding to their current mar-keting targets. Group A was labeled “VQA wine drinkers” (n = 41): 35–64 years of age, 60/40 male/female split; must drink a minimum of 20% VQA Ontario wine in the past 6 months; household annual $US 75K+; 52% are wine influ-encers: they agree to the statement that they are frequently asked for opinions and recommendations on wine. Group B was labeled “imported wine drinkers” (n = 39): 35–49 years of age, 65/35 male/female split; must drink a minimum of 3% VQA Ontario wine, ≥85% must be imported wines (not from Canada); household annual income $US 50K–75K; 44% are wine influencers. Group C was labeled “millennials” (n = 40): 19–34 years of age, 50/50 male/female split.
To qualify, all respondents had to drink a minimum of one glass of dry white wine at least twice a month, had to sign an informed consent document before taking part in the project, and have a designated driver, take public transit, or take a taxi. Respondents had to declare that no allergies or medical conditions could prevent them to taste wines. Some candidates were excluded for sensitive employment. Selected participants had to show photo identification as proof of legal drinking age (19 years and older in Ontario) when registering upon arrival at the tasting facility.
Consumers tested a total of 12 wines over two 90-min ses-sions, six wines per session, and rated their overall liking on a 9-point hedonic scale. A 5-min break was imposed between each wine sample. Respondents completed two self-adminis-tered questionnaires, one at the end of each session. Addition-al characteristics were extracted from these questionnaires for subsequent analysis and interpretation of preference patterns. Wine involvement was measured using a previously deter-mined scale (Lockshin et al. 1997), and a wine involvement index was derived from consumer responses to 12 questions.
Self-declared wine knowledge was rated on a 4-point scale: (1) know a little about wine; (2) somewhat knowledgeable; (3) very knowledgeable; (4) expert or professional knowledge. Finally, purchase and consumption habits were recorded.
Data analysis. Data analysis was performed using SPSS (ver. 16.0; SPSS Inc., Chicago, IL) and XLStat 2007.1 (Addin-soft, Paris) statistical software. For sorting and matching data from the wine screening, a similarity matrix was drawn from the occurrence of two products placed in a same group by one participant. An aggregated matrix was compiled from all the individual matrices, transformed in a dissimilarity matrix, and submitted to multidimensional scaling (MDS) (Schiff-man et al. 1981). To facilitate the interpretation of the product grouping, a hierarchical cluster analysis (Pearson correlation coefficient; unweighted pair-group average) was conducted on product coordinates on the dimensions representing the best MDS solution.
For the sensory descriptive data, a two-way ANOVA mixed model (wine, panelist, wine x panelist) was performed to determine which sensory attributes wines were perceived as different (p ≤ 0.05). Panelist and panel performance were evaluated in terms of discrimination, repeatability, and agree-ment (Sulmont et al. 1999). Stepwise discriminant analysis was performed to select only discriminant and noncorrelated attributes (p ≤ 0.10) for the internal preference map interpre-tation. The resulting product representation was also used to select wines to be assessed by consumers.
For the hedonic data, a three-way ANOVA with a nested effect (wine, group, consumer (Group)) was performed to de-termine if wines were liked differently by the a priori con-sumer groups. Consumer preferences were further evaluated by performing internal preference mapping, which was pre-ferred over external methods considering the main goal was to understand consumer preferences for white wines and not to predict preferences. A principal component analysis (PCA) was therefore performed on a table comprised of products in rows and consumers in columns. Significant sensory attributes were correlated with the principal components to enable interpreta-tion of the preference dimensions. Hierarchical cluster analysis (Pearson correlation coefficient; unweighted pair-group aver-age) was conducted on the same table to determine the ex-istence of consumer segments with different liking patterns.
For the wine involvement index, a factorial analysis with oblique rotation was conducted to check the dimensionality of the involvement scale proposed by Lockshin et al. (1997). Five items correlated with wine involvement (results not shown). An index was calculated by summing up the five item scores rated on a 7-point Likert scale; the maximum attainable value was 35.
Results and DiscussionWine screening and sensory characterization. The se-
lection of wines for consumer hedonic assessment was de-signed to ensure the final wine selection included percepti-bly different wines while representing the sensory variability available to consumers on the Ontario market. The sorting/matching task first enabled the selection of different wine
490 – Lesschaeve et al.
Am. J. Enol. Vitic. 63:4 (2012)
styles. Second, the sensory descriptive data were analyzed to retain the most different wines for consumer assessment.
Data of each varietal wine collected from the sorting/matching task were analyzed with multidimensional analysis; the solutions fitted five or six dimensions, which enabled the clustering of varietal wines based on their sensory similari-ties. Wines were selected to best represent the clusters with an additional criterion that the wines were available in large quantities for sensory analysis. A selection of 18 wines was used for the sensory descriptive analysis by the trained sen-sory descriptive panel (Table 1).
Twenty aroma attributes and 27 flavor attributes were sig-nificantly different (p ≤ 0.05) among the 18 wines. Panelist performances in terms of discrimination ability, repeatabil-ity, and agreement were assessed using univariate parameters from the two-way ANOVA and were deemed satisfactory. The stepwise discriminant analysis was used to further select 12 aroma and 16 flavor attributes that differentiated the wines significantly (p ≤ 0.10) and were not correlated or weakly cor-related. Aroma attributes included petroleum, oak, canned/tin peas, caramel/butterscotch, lychee, canned green beans/cooked asparagus, grapefruit, rose, melon, butter, orange blossom, and black pepper. Flavor attributes included sweet, oak, green apple, pineapple, lychee, petroleum, smooth/vis-cous, burnt match, vanilla, canned green beans, pear, dry/astringent, apricot, butterscotch, effervescent, burning/biting, fresh green bell pepper. Working with a smaller set of attri-butes was preferred to retaining all 47 significant attributes, primarily to obtain a clearer preference map. If the goal of the preference map was to guide new wine development, then retaining all the significant attributes would have brought a richer description of consumer sensory preference to guide the desired sensory profile for the end product. However, that was not the purpose of this study.
Wine preferences. To reduce the test costs, only 12 of the 18 wines were evaluated by consumers. Selection of the 12 wines was based on the results of the ANOVA described above and of a stepwise discriminant analysis (data not shown). Con-sumers evaluated the 12 wines and rated their liking thereof on the 9-point hedonic scale. The three-way ANOVA with nested effect conducted on the individual liking scores indi-cated that wines were liked differently by consumers (F11,1439 = 22.60; p < 0.0001) and among consumer a priori groups (F 2, 1439 = 6.58; p < 0.001). Although the interaction wine x group was significant (F22,1439 = 1.72; p = 0.02), indicating that liking scores from consumer a priori groups were dependent on the wines presented, the multiple comparisons of the interaction means (Tukey HSD, p < 0.05) showed that the liking differ-ences only occurred for one wine (Riesling 5).
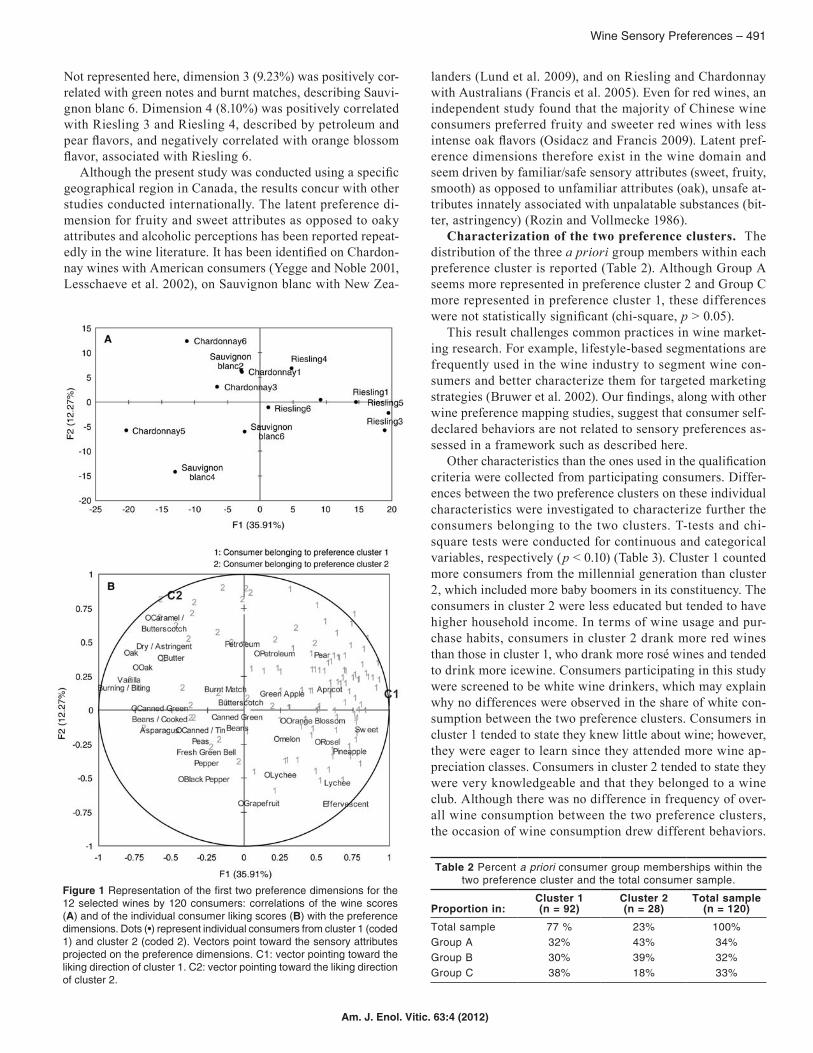
Sensory attributes driving consumer preferences. Indi-vidual liking scores were subjected to an internal preference mapping where the descriptive attributes were projected based on their correlations with the first two preference dimensions. These two dimensions represented 48% of the initial variance and show wine positioning based on consumer preferences (Figure 1A) and the circle of correlation between each indi-vidual consumer (Figure 1B) and the preference dimensions. The first preference dimension separated Riesling 1, Riesling 3, and Riesling 5 on the right and Chardonnay 5 on the left. The second dimension separated Sauvignon blanc 4 from Chardonnay 6 (Figure 1A). In the correlation circle (Figure 1B), most consumer preferences were directed on the positive side of dimension 1, thus signaling a preference for Riesling 1, Riesling 3, and Riesling 5. The same dimension correlated with the following attributes: sweetness, pineapple, apricot, and pear flavors. The negative side correlated with burning mouthfeel, vanilla, oak aroma, and oak flavor; these attributes are mainly correlated with Chardonnay 5. The cluster analysis revealed two preference clusters of unequal sizes: cluster 1 (n = 92) and cluster 2 (n = 28), representing 77% and 23% of the total consumer panel, respectively.
A three-way ANOVA with nested effect showed that the interaction wine x cluster was significant (F(11,1439) = 20.05, p < 0.0001), indicating that wine liking scores were dependent on the preference cluster. The multiple comparison of the interaction means revealed significance in the case of Ries-ling 3, Riesling 5, Chardonnay 6, and Chardonnay 5 (Tukey HSD, p ≤ 0.05). The direction of liking of these two clusters is shown (Figure 1B). The majority of consumer preference directions (cluster 1) was correlated with dimension 1, sug-gesting that 77% of consumers preferred wines with tropical fruit and tree fruit flavors and some sweetness. The second preference dimension was negatively correlated with black pepper, lychee, and grapefruit aromas describing Sauvignon blanc 4, and positively correlated to a lesser extent with cara-mel aroma and butterscotch associated with Chardonnay 6. Cluster 2 preference direction points toward the negative side of dimension 1 and positive side of dimension 2, suggest-ing that 23% of consumers did not like the sweet and fruity style wines as much, but rather liked less sweet wines, with caramel and butterscotch flavors and some petroleum notes.
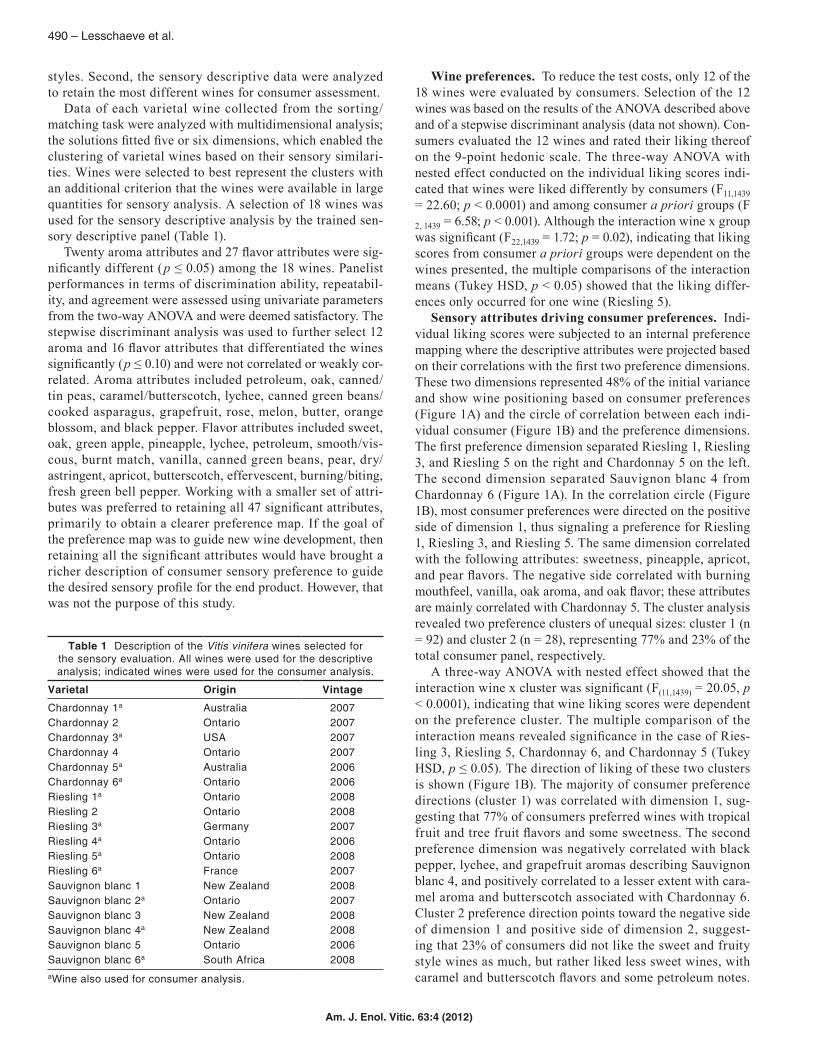
Table 1 Description of the Vitis vinifera wines selected for the sensory evaluation. All wines were used for the descriptive analysis; indicated wines were used for the consumer analysis.
Varietal Origin Vintage
Chardonnay 1a Australia 2007Chardonnay 2 Ontario 2007Chardonnay 3a USA 2007Chardonnay 4 Ontario 2007Chardonnay 5a Australia 2006Chardonnay 6a Ontario 2006Riesling 1a Ontario 2008Riesling 2 Ontario 2008Riesling 3a Germany 2007Riesling 4a Ontario 2006Riesling 5a Ontario 2008Riesling 6a France 2007Sauvignon blanc 1 New Zealand 2008Sauvignon blanc 2a Ontario 2007Sauvignon blanc 3 New Zealand 2008Sauvignon blanc 4a New Zealand 2008Sauvignon blanc 5 Ontario 2006Sauvignon blanc 6a South Africa 2008aWine also used for consumer analysis.
Wine Sensory Preferences – 491
Am. J. Enol. Vitic. 63:4 (2012)
Not represented here, dimension 3 (9.23%) was positively cor-related with green notes and burnt matches, describing Sauvi-gnon blanc 6. Dimension 4 (8.10%) was positively correlated with Riesling 3 and Riesling 4, described by petroleum and pear flavors, and negatively correlated with orange blossom flavor, associated with Riesling 6.
Although the present study was conducted using a specific geographical region in Canada, the results concur with other studies conducted internationally. The latent preference di-mension for fruity and sweet attributes as opposed to oaky attributes and alcoholic perceptions has been reported repeat-edly in the wine literature. It has been identified on Chardon-nay wines with American consumers (Yegge and Noble 2001, Lesschaeve et al. 2002), on Sauvignon blanc with New Zea-
Figure 1 Representation of the first two preference dimensions for the 12 selected wines by 120 consumers: correlations of the wine scores (A) and of the individual consumer liking scores (B) with the preference dimensions. Dots (•) represent individual consumers from cluster 1 (coded 1) and cluster 2 (coded 2). Vectors point toward the sensory attributes projected on the preference dimensions. C1: vector pointing toward the liking direction of cluster 1. C2: vector pointing toward the liking direction of cluster 2.
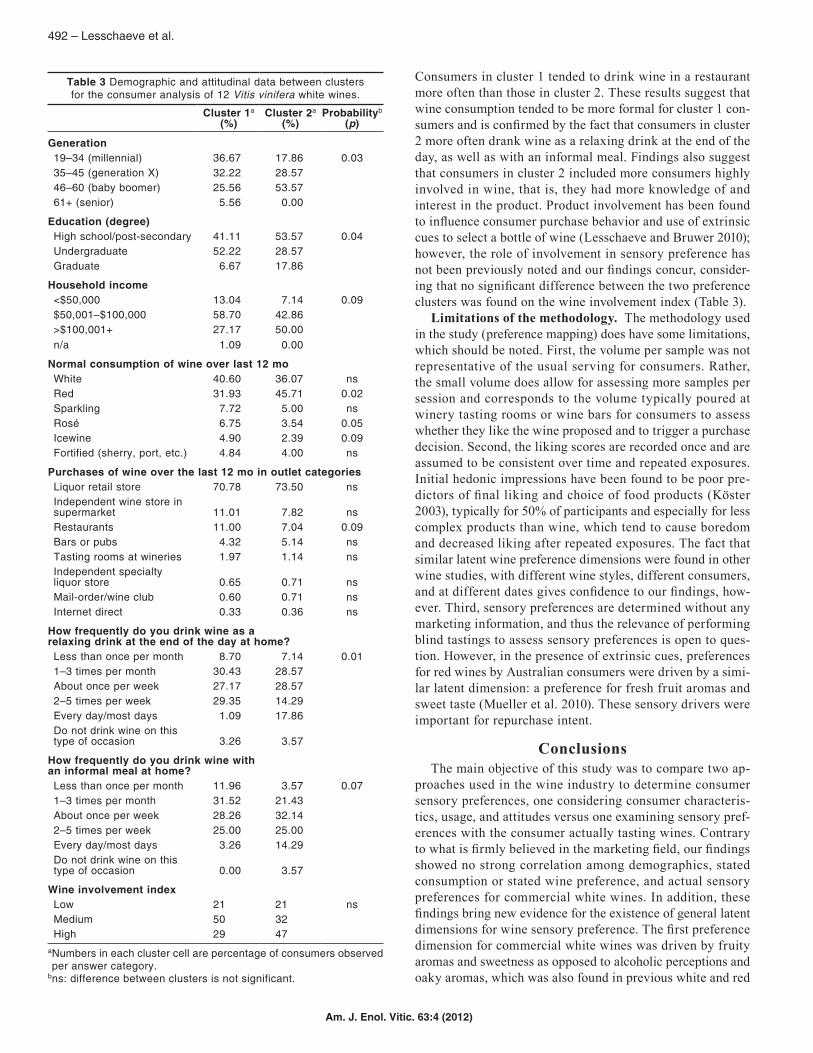
Table 2 Percent a priori consumer group memberships within the two preference cluster and the total consumer sample.
Proportion in:Cluster 1 (n = 92)
Cluster 2(n = 28)
Total sample(n = 120)
Total sample 77 % 23% 100%Group A 32% 43% 34%Group B 30% 39% 32%Group C 38% 18% 33%
landers (Lund et al. 2009), and on Riesling and Chardonnay with Australians (Francis et al. 2005). Even for red wines, an independent study found that the majority of Chinese wine consumers preferred fruity and sweeter red wines with less intense oak flavors (Osidacz and Francis 2009). Latent pref-erence dimensions therefore exist in the wine domain and seem driven by familiar/safe sensory attributes (sweet, fruity, smooth) as opposed to unfamiliar attributes (oak), unsafe at-tributes innately associated with unpalatable substances (bit-ter, astringency) (Rozin and Vollmecke 1986).
Characterization of the two preference clusters. The distribution of the three a priori group members within each preference cluster is reported (Table 2). Although Group A seems more represented in preference cluster 2 and Group C more represented in preference cluster 1, these differences were not statistically significant (chi-square, p > 0.05).
This result challenges common practices in wine market-ing research. For example, lifestyle-based segmentations are frequently used in the wine industry to segment wine con-sumers and better characterize them for targeted marketing strategies (Bruwer et al. 2002). Our findings, along with other wine preference mapping studies, suggest that consumer self-declared behaviors are not related to sensory preferences as-sessed in a framework such as described here.
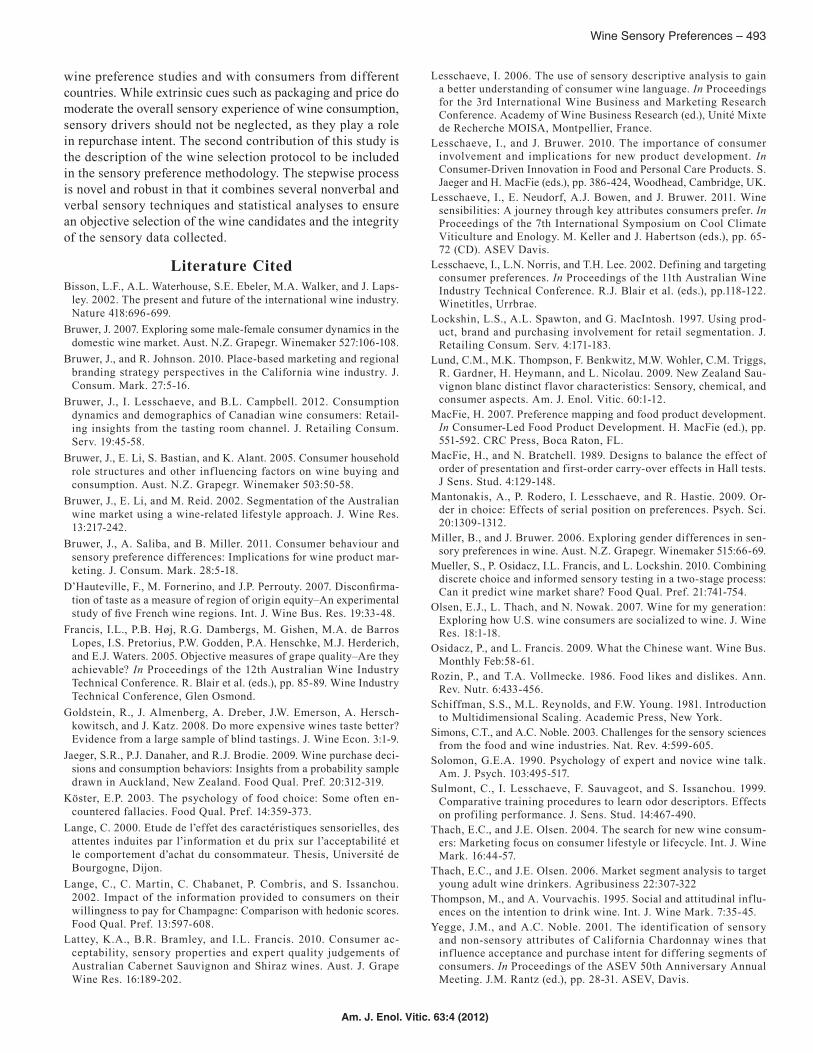
Other characteristics than the ones used in the qualification criteria were collected from participating consumers. Differ-ences between the two preference clusters on these individual characteristics were investigated to characterize further the consumers belonging to the two clusters. T-tests and chi-square tests were conducted for continuous and categorical variables, respectively (p < 0.10) (Table 3). Cluster 1 counted more consumers from the millennial generation than cluster 2, which included more baby boomers in its constituency. The consumers in cluster 2 were less educated but tended to have higher household income. In terms of wine usage and pur-chase habits, consumers in cluster 2 drank more red wines than those in cluster 1, who drank more rosé wines and tended to drink more icewine. Consumers participating in this study were screened to be white wine drinkers, which may explain why no differences were observed in the share of white con-sumption between the two preference clusters. Consumers in cluster 1 tended to state they knew little about wine; however, they were eager to learn since they attended more wine ap-preciation classes. Consumers in cluster 2 tended to state they were very knowledgeable and that they belonged to a wine club. Although there was no difference in frequency of over-all wine consumption between the two preference clusters, the occasion of wine consumption drew different behaviors.
492 – Lesschaeve et al.
Am. J. Enol. Vitic. 63:4 (2012)
Consumers in cluster 1 tended to drink wine in a restaurant more often than those in cluster 2. These results suggest that wine consumption tended to be more formal for cluster 1 con-sumers and is confirmed by the fact that consumers in cluster 2 more often drank wine as a relaxing drink at the end of the day, as well as with an informal meal. Findings also suggest that consumers in cluster 2 included more consumers highly involved in wine, that is, they had more knowledge of and interest in the product. Product involvement has been found to influence consumer purchase behavior and use of extrinsic cues to select a bottle of wine (Lesschaeve and Bruwer 2010); however, the role of involvement in sensory preference has not been previously noted and our findings concur, consider-ing that no significant difference between the two preference clusters was found on the wine involvement index (Table 3).
Limitations of the methodology. The methodology used in the study (preference mapping) does have some limitations, which should be noted. First, the volume per sample was not representative of the usual serving for consumers. Rather, the small volume does allow for assessing more samples per session and corresponds to the volume typically poured at winery tasting rooms or wine bars for consumers to assess whether they like the wine proposed and to trigger a purchase decision. Second, the liking scores are recorded once and are assumed to be consistent over time and repeated exposures. Initial hedonic impressions have been found to be poor pre-dictors of final liking and choice of food products (Köster 2003), typically for 50% of participants and especially for less complex products than wine, which tend to cause boredom and decreased liking after repeated exposures. The fact that similar latent wine preference dimensions were found in other wine studies, with different wine styles, different consumers, and at different dates gives confidence to our findings, how-ever. Third, sensory preferences are determined without any marketing information, and thus the relevance of performing blind tastings to assess sensory preferences is open to ques-tion. However, in the presence of extrinsic cues, preferences for red wines by Australian consumers were driven by a simi-lar latent dimension: a preference for fresh fruit aromas and sweet taste (Mueller et al. 2010). These sensory drivers were important for repurchase intent.
ConclusionsThe main objective of this study was to compare two ap-
proaches used in the wine industry to determine consumer sensory preferences, one considering consumer characteris-tics, usage, and attitudes versus one examining sensory pref-erences with the consumer actually tasting wines. Contrary to what is firmly believed in the marketing field, our findings showed no strong correlation among demographics, stated consumption or stated wine preference, and actual sensory preferences for commercial white wines. In addition, these findings bring new evidence for the existence of general latent dimensions for wine sensory preference. The first preference dimension for commercial white wines was driven by fruity aromas and sweetness as opposed to alcoholic perceptions and oaky aromas, which was also found in previous white and red
Table 3 Demographic and attitudinal data between clusters for the consumer analysis of 12 Vitis vinifera white wines.
Cluster 1a (%)
Cluster 2a (%)
Probabilityb (p)
Generation19–34 (millennial) 36.67 17.86 0.0335–45 (generation X) 32.22 28.5746–60 (baby boomer) 25.56 53.5761+ (senior) 5.56 0.00
Education (degree)High school/post-secondary 41.11 53.57 0.04Undergraduate 52.22 28.57Graduate 6.67 17.86
Household income<$50,000 13.04 7.14 0.09$50,001–$100,000 58.70 42.86>$100,001+ 27.17 50.00n/a 1.09 0.00
Normal consumption of wine over last 12 moWhite 40.60 36.07 nsRed 31.93 45.71 0.02Sparkling 7.72 5.00 nsRosé 6.75 3.54 0.05Icewine 4.90 2.39 0.09Fortified (sherry, port, etc.) 4.84 4.00 ns
Purchases of wine over the last 12 mo in outlet categoriesLiquor retail store 70.78 73.50 nsIndependent wine store in supermarket 11.01 7.82 nsRestaurants 11.00 7.04 0.09Bars or pubs 4.32 5.14 nsTasting rooms at wineries 1.97 1.14 nsIndependent specialty liquor store 0.65 0.71 nsMail-order/wine club 0.60 0.71 nsInternet direct 0.33 0.36 ns
How frequently do you drink wine as a relaxing drink at the end of the day at home?Less than once per month 8.70 7.14 0.011–3 times per month 30.43 28.57About once per week 27.17 28.572–5 times per week 29.35 14.29Every day/most days 1.09 17.86Do not drink wine on this type of occasion 3.26 3.57
How frequently do you drink wine with an informal meal at home?Less than once per month 11.96 3.57 0.071–3 times per month 31.52 21.43About once per week 28.26 32.142–5 times per week 25.00 25.00Every day/most days 3.26 14.29Do not drink wine on this type of occasion 0.00 3.57
Wine involvement indexLow 21 21 nsMedium 50 32High 29 47
aNumbers in each cluster cell are percentage of consumers observed per answer category.
bns: difference between clusters is not significant.
Wine Sensory Preferences – 493
Am. J. Enol. Vitic. 63:4 (2012)
wine preference studies and with consumers from different countries. While extrinsic cues such as packaging and price do moderate the overall sensory experience of wine consumption, sensory drivers should not be neglected, as they play a role in repurchase intent. The second contribution of this study is the description of the wine selection protocol to be included in the sensory preference methodology. The stepwise process is novel and robust in that it combines several nonverbal and verbal sensory techniques and statistical analyses to ensure an objective selection of the wine candidates and the integrity of the sensory data collected.
Literature CitedBisson, L.F., A.L. Waterhouse, S.E. Ebeler, M.A. Walker, and J. Laps-
ley. 2002. The present and future of the international wine industry. Nature 418:696-699.
Bruwer, J. 2007. Exploring some male-female consumer dynamics in the domestic wine market. Aust. N.Z. Grapegr. Winemaker 527:106-108.
Bruwer, J., and R. Johnson. 2010. Place-based marketing and regional branding strategy perspectives in the California wine industry. J. Consum. Mark. 27:5-16.
Bruwer, J., I. Lesschaeve, and B.L. Campbell. 2012. Consumption dynamics and demographics of Canadian wine consumers: Retail-ing insights from the tasting room channel. J. Retailing Consum. Serv. 19:45-58.
Bruwer, J., E. Li, S. Bastian, and K. Alant. 2005. Consumer household role structures and other inf luencing factors on wine buying and consumption. Aust. N.Z. Grapegr. Winemaker 503:50-58.
Bruwer, J., E. Li, and M. Reid. 2002. Segmentation of the Australian wine market using a wine-related lifestyle approach. J. Wine Res. 13:217-242.
Bruwer, J., A. Saliba, and B. Miller. 2011. Consumer behaviour and sensory preference differences: Implications for wine product mar-keting. J. Consum. Mark. 28:5-18.
D’Hauteville, F., M. Fornerino, and J.P. Perrouty. 2007. Disconfirma-tion of taste as a measure of region of origin equity–An experimental study of five French wine regions. Int. J. Wine Bus. Res. 19:33-48.
Francis, I.L., P.B. Høj, R.G. Dambergs, M. Gishen, M.A. de Barros Lopes, I.S. Pretorius, P.W. Godden, P.A. Henschke, M.J. Herderich, and E.J. Waters. 2005. Objective measures of grape quality–Are they achievable? In Proceedings of the 12th Australian Wine Industry Technical Conference. R. Blair et al. (eds.), pp. 85-89. Wine Industry Technical Conference, Glen Osmond.
Goldstein, R., J. Almenberg, A. Dreber, J.W. Emerson, A. Hersch-kowitsch, and J. Katz. 2008. Do more expensive wines taste better? Evidence from a large sample of blind tastings. J. Wine Econ. 3:1-9.
Jaeger, S.R., P.J. Danaher, and R.J. Brodie. 2009. Wine purchase deci-sions and consumption behaviors: Insights from a probability sample drawn in Auckland, New Zealand. Food Qual. Pref. 20:312-319.
Köster, E.P. 2003. The psychology of food choice: Some often en-countered fallacies. Food Qual. Pref. 14:359-373.
Lange, C. 2000. Etude de l’effet des caractéristiques sensorielles, des attentes induites par l’information et du prix sur l’acceptabilité et le comportement d’achat du consommateur. Thesis, Université de Bourgogne, Dijon.
Lange, C., C. Martin, C. Chabanet, P. Combris, and S. Issanchou. 2002. Impact of the information provided to consumers on their willingness to pay for Champagne: Comparison with hedonic scores. Food Qual. Pref. 13:597-608.
Lattey, K.A., B.R. Bramley, and I.L. Francis. 2010. Consumer ac-ceptability, sensory properties and expert quality judgements of Australian Cabernet Sauvignon and Shiraz wines. Aust. J. Grape Wine Res. 16:189-202.
Lesschaeve, I. 2006. The use of sensory descriptive analysis to gain a better understanding of consumer wine language. In Proceedings for the 3rd International Wine Business and Marketing Research Conference. Academy of Wine Business Research (ed.), Unité Mixte de Recherche MOISA, Montpellier, France.
Lesschaeve, I., and J. Bruwer. 2010. The importance of consumer involvement and implications for new product development. In Consumer-Driven Innovation in Food and Personal Care Products. S. Jaeger and H. MacFie (eds.), pp. 386-424, Woodhead, Cambridge, UK.
Lesschaeve, I., E. Neudorf, A.J. Bowen, and J. Bruwer. 2011. Wine sensibilities: A journey through key attributes consumers prefer. In Proceedings of the 7th International Symposium on Cool Climate Viticulture and Enology. M. Keller and J. Habertson (eds.), pp. 65-72 (CD). ASEV Davis.
Lesschaeve, I., L.N. Norris, and T.H. Lee. 2002. Defining and targeting consumer preferences. In Proceedings of the 11th Australian Wine Industry Technical Conference. R.J. Blair et al. (eds.), pp.118-122. Winetitles, Urrbrae.
Lockshin, L.S., A.L. Spawton, and G. MacIntosh. 1997. Using prod-uct, brand and purchasing involvement for retail segmentation. J. Retailing Consum. Serv. 4:171-183.
Lund, C.M., M.K. Thompson, F. Benkwitz, M.W. Wohler, C.M. Triggs, R. Gardner, H. Heymann, and L. Nicolau. 2009. New Zealand Sau-vignon blanc distinct f lavor characteristics: Sensory, chemical, and consumer aspects. Am. J. Enol. Vitic. 60:1-12.
MacFie, H. 2007. Preference mapping and food product development. In Consumer-Led Food Product Development. H. MacFie (ed.), pp. 551-592. CRC Press, Boca Raton, FL.
MacFie, H., and N. Bratchell. 1989. Designs to balance the effect of order of presentation and first-order carry-over effects in Hall tests. J Sens. Stud. 4:129-148.
Mantonakis, A., P. Rodero, I. Lesschaeve, and R. Hastie. 2009. Or-der in choice: Effects of serial position on preferences. Psych. Sci. 20:1309-1312.
Miller, B., and J. Bruwer. 2006. Exploring gender differences in sen-sory preferences in wine. Aust. N.Z. Grapegr. Winemaker 515:66-69.
Mueller, S., P. Osidacz, I.L. Francis, and L. Lockshin. 2010. Combining discrete choice and informed sensory testing in a two-stage process: Can it predict wine market share? Food Qual. Pref. 21:741-754.
Olsen, E.J., L. Thach, and N. Nowak. 2007. Wine for my generation: Exploring how U.S. wine consumers are socialized to wine. J. Wine Res. 18:1-18.
Osidacz, P., and L. Francis. 2009. What the Chinese want. Wine Bus. Monthly Feb:58-61.
Rozin, P., and T.A. Vollmecke. 1986. Food likes and dislikes. Ann. Rev. Nutr. 6:433-456.
Schiffman, S.S., M.L. Reynolds, and F.W. Young. 1981. Introduction to Multidimensional Scaling. Academic Press, New York.
Simons, C.T., and A.C. Noble. 2003. Challenges for the sensory sciences from the food and wine industries. Nat. Rev. 4:599-605.
Solomon, G.E.A. 1990. Psychology of expert and novice wine talk. Am. J. Psych. 103:495-517.
Sulmont, C., I. Lesschaeve, F. Sauvageot, and S. Issanchou. 1999. Comparative training procedures to learn odor descriptors. Effects on profiling performance. J. Sens. Stud. 14:467-490.
Thach, E.C., and J.E. Olsen. 2004. The search for new wine consum-ers: Marketing focus on consumer lifestyle or lifecycle. Int. J. Wine Mark. 16:44-57.
Thach, E.C., and J.E. Olsen. 2006. Market segment analysis to target young adult wine drinkers. Agribusiness 22:307-322
Thompson, M., and A. Vourvachis. 1995. Social and attitudinal influ-ences on the intention to drink wine. Int. J. Wine Mark. 7:35-45.
Yegge, J.M., and A.C. Noble. 2001. The identification of sensory and non-sensory attributes of California Chardonnay wines that inf luence acceptance and purchase intent for differing segments of consumers. In Proceedings of the ASEV 50th Anniversary Annual Meeting. J.M. Rantz (ed.), pp. 28-31. ASEV, Davis.