Embed Size (px)
Citation preview
1.
D m O N A T I O N A N D THE HYDRODYNAMICS OF. REACTIVE SHOCK WAVES
\ Roger A . S.trehlow
Department of A e r o n a u t i c a l and A s t r o n a u t i c a l E n g i n e e r i n g U n i v e r s i t y of I l l i n o i s , Urbana, I l l i n o i s
INTRODUCTION
The c o n t e n t s o f t h i s r ev iew may be c o n v e n i e n t l y s e p a r a t e d i n t o two r a t h e r d i s t i n c t p a r t s . On t h e one hand t h i s r e v i e w c o v e r s o u r c u r - r e n t u n d e r s t a n d i n g of d e t o n a t i o n a s a u n i q u e n a t u r a l phenomena, w h i l e o n t h e o t h e r hand t h e r ev iew . d i s c u s s e s t h e l i m i t a t i o n s t h a t hydrodynamics p l a c e s o n t h e u t i l i t y of t h e shock t u b e as a t o o l f o r s t u d y i n g h igh t e m p e r a t u r e r e a c t i o n k i n e t i c s . S p e c i f i c r e a c t i o n k i n e t i c s t u d i e s a r e no t c o v e r e d because t h e y a r e so e x t e n s i v e t h a t it is d i f f i - c u l t t o do them j u s t i c e i n a s h o r t r e v i e w . The r e a d e r is r e f e r r e d t o r e c e n t more e x t e n s i v e r e v i e w s f o r t h i s p ~ r p o s e l - ~ .
DETONATION
I . T h e o r i e s R e l a t i n g t o S t F u c t u r e and S t a b i l i t y
The Ze l ' dov ich6 , von Neumann7, Dor ings (ZND) model of a one -d imens iona l s t e a d y d e t o n a t i o n wave a s a shock d i s c o n t i n u i t y f o l l o w e d by a zone of homogeneous c h e m i c a l r e a c t i o n is p r o b a b l y t h e most u s e f u l concep t to e v o l v e p r i o r t o t h e mid 1 9 5 0 ' s . Even though t h i s model must now be m o d i f i e d t o accommodate non-steady and t h r e e - d i m e n s i o n a l e f f e c t s , i ts i m p l i c a t i o n t h a t a n e l emen t of t h e f l o w may tie t r e a t e d a s c o n t a i n i n g a n exo the rmic c h e m i c a l r e a c t i o n t r i g g e r e d by a s t r o n g shock , which may i n i t s e l f b e hand led a s a d i s c o n t i n u i t y i n t h e f l o w , r e p r e s e n t s a u s e f u l t o o l f o r u n d e r s t a n d i n g t h e s t r u c t u r e and non-s teady b e h a v i o r of de tona - t i o n waves.
. I
The Chapman9-JouguetlO, (CJ), c o n c e p t t h a t a minimuin s t e a d y one- d i m e n s i o n a l mass f l o w e x i s t s f o r any s p e c i f i c e x o t h e r m i c s y s t e m under - g o i n g r e a c t i v e shock t r a n s i t i o n is a t p r e s e n t u s e f u l o n l y i n s o f a r a s i t a l l o w s n r a t h e r e x a c t c a l c u l a t i o n of t h e v e l o c i t y and p r e s s u r e i n a d e t o n a t i o n wave. U n f o r t u n a t e l y , a t t h e p r e s e n t t i m e , t h i s s u c c e s s m u s t be c o n s i d e r e d t o be e i t h e r f o r t u i t o u s or a t l e a s t e m p i r i c a l because re- cent work h a s shown t h a t a one-dimensional d e t o n a t i o n t r a v e l i n g a t t h e C.J v e l o c i t y is dynamica l ly u n s t a b l e .
The f i r s t a t t e m p t t u l o o k a t t ime-dependent s t a b i l i t y i n a d e t o n a t i o n w a v e was mide by S h c h e l k i n l l i n 1958 . a s h i s model. I n t h i s model t h e c h e m i c a l r e a c t i o n is c o n c e n t r a t e d a t t h e C J p l a n e and t h i s p l a n e i s s e p a r a t e d from t h e shock wave by a n in - d u c t i o n zone . I n h i s model, he p e r t u r b e d t h e p o s i t i o n of t h e C J p l a n e w i t h t i m e and d i s c u s s e d t h e consequences o f t h i s p e r t u r b a t i o n . H e found t h a t t h e d e t o n a t i o n w i l l tie u n s t a b l e t o t h i s t y p e of p e r t u r b a t i o n i f t h e i n d u c t i o n zone i . c a c t i o n s have a s u f f i c i e n t l y l a r g e a c t i v a t i o n e n e r g y . T h i s model is u n r e a l i s t i c b e c a u s e o n e c a n n o t t r u l y c a u s e t h e C J p l a n e t o s u f f e r a p e r t u r b a t i on , s i n c e it is n s t e a d y c o n c e p t . However, S h c h e l k i n was t h e f i r s t t o d i s c u s s t h e . e f f c c t of a t ime-dependent p e r t u r b a t i o n o n s t a b i l i t y .
S i n c e 1963, t h e r e have been .a number of papers12-19 whi.ch d i s c u s s t h e s t a b i l i t y of t h e squa re ' wave d e t o n a t i o n . However r e c e n t work on d e t o - nat ion s t a b i l i t y , u s i n g models 'wh ich a l l o w f o r an' e x t e n d e d h e a t r e l e a s e
H e u s e d a s q u a r e wave d e t o n a t i o n
,. z o n e , show q u i t e d e f i n i t e l y t h a t a l l t h e i n t e r e s t i n g a m p l i f i c a t i o n mechanisms which l e a d t o i n s t a b i l i t y o c c u r i n t h e r e g i o n o f h e a t release. T h e r e f o r e , t h e s q u a r e wave model a p p e a r s t o be u n s u i t a b l e f o r d i s c u s s i n g s t a b i l i t y .
Two a p p r o a c h e s have been u s e d t o i n v e s t i g a t e t h e s t a b i l i t y o f a ZND d e t o n a t i o n wave w i t h a n e x t e n d e d r e a c t i o n zone . Erpenbeck20m21 h a s examined s t a b i l i t y by f o l l o w i n g t h e r e s p o n s e of t h e shock d i s c o n t i n u - i t y t o a p u r e l y t r a n s v e r s e harmonic p e r t u r b a t i o n i n t h e f low down- stream of t h e shock wave ( i . e . , i n t h e r e a c t i o n z o n e ) . H i s a n a l y s i s is a p p l i c a b l e t o d i s t u r b a n c e s of a r b i t r a r y wave l e n g t h b u t r e q u i r e s a model f o r t h e h e a t re lease r e a c t i o n s t h r o u g h o u t t h e e n t i r e r e a c t i o n z o n e . H e has n o t f o r m a l l y examined t h e C J d e t o n a t i o n case, b u t h a s a l w a y s worked w i t h d e t o n a t i o n s t h a t have some a r b i t r a r y o v e r d r i v e . H i s a n a l y s i s , which is pe r fo rmed i n L a p l a c e t r a n s f o r m s p a c e , i s v e r y complex and he f i n d s t h a t s t a b i l i t y i n t h e g e n e r a l case c a n be d i s - c u s s e d o n l y by r e s o r t i n g t o n u m e r i c a l t e c h n i q u e s . H i s r e s u l t s i n d i c a t e t h a t t h e o c c u r r e n c e of i n s t a b i l i t y is dependen t on t h e f r e q u e n c y of the d i s t u r b a n c e , t h e a c t i v a t i o n e n e r g y o f t h e f i r s t o r d e r h e a t release r e a c t i o n t h a t he h a s u s e d i n h i s model and t h e amount of t h e o v e r d r i v e p r e s e n t i n t h e d e t o n a t i o n . e x t e n d e d h i s a n a l y s i s t o t r a n s v e r s e waves of h i g h f r e q u e n c y . I n t h i s case, he f i n d s t h a t there are three t y p e s o f s t a b i l i t y regimes which may be p r e s e n t i n t h e r e a c t i o n zone o f t he d e t o n a t i o n . The t y p e of regime tha t is p r e s e n t is dependen t on t h e l o c a l v a l u e o f t h e q u a n t i t y d(a2-u2)/dx where x is measured from t h e shock and a and u a r e t h e sound v e l o c i t y and f l o w v e l o c i t y a t a p o i n t i n t h e s t e a d y f l o w beh ind t h e s h o c k . H e o b s e r v e d t h a t t h i s q u a n t i t y e i ther i n c r e a s e s , goes t h r o u g h a maximum, o r d e c r e a s e s , i n t h a t o r d e r , as one p a s s e s from t h e shock wave t o t h e p l a n e where h e a t a d d i t i o n is t e r m i n a t e d . I f t h e q u a n t i t y s i m p l y decreases i n t h e r e a c t i o n zone he f i n d s t h a t t h e d e t o n a t i o n w i l l be s t a b l e t o a h i g h f r e q u e n c y t r a n s v e r s e wave. I f t h i s q u a n t i t y goes t h r o u g h a maximum o r i f i t i n c r e a s e s , he f i n d s t h a t t h e d e t o n a t i o n behaves u n s t a b l y t o a h i g h f r e q u e n c y t r a n s v e r s e p e r t u r - b a t i o n . I n t h e l i m i t b e h a v i o r which he i n v e s t i g a t e d , t h e u l t i m a t e s t a b i l i t y is found t o be d e p e n d e n t on t h e a c t i v a t i o n e n e r g y of t h e f i r s t o r d e r chemica l r e a c t i o n which was assumed i n t h e a n a l y s i s . S p e c i f i c a l l y , s y s t e m s w i t h a s u f f i c i e n t l y l o w a c t i v a t i o n e n e r g y were found t o be s t a b l e .
I n a f o l l o w i n g p a p e r , Erpenbeck22 h a s
I n t h e o t h e r a p p r o a c h t o t h e s t a b i l i t y problem, S t r eh low- and F e r n a n d e ~ ~ ~ and B a r t h e l and S t r e h l ~ w ~ ~ have used a r a y t r a c i n g t e c h n i q u e t o d i s c u s s t h e b e h a v i o r o f a h i g h f r e q u e n c y c o h e r e n t t r a n s v e r s e a c o u s t i c wave i n t h e r e a c t i o n zone o f a ZND d e t o n a t i o n . They a l s o f i n d t h a t t h e q u a n t i t y d(a2-u2)/dx is i m p o r t a n t t o t h e b e h a v i o r of t h e s e c o h e r e n t t r a n s v e r s e waves. F o r a t r a n s v e r s e wave p r o p a g a t i n g i n a f l o w i n g gas , t h e d i r e c - t i o n of p r o p a g a t i o n o f t h e e n e r g y t r a p p e d i n t h e a c o u s t i c f r o n t ( i . e . , t h e r a y d i r e c t i o n ) is t h e d i r e c t i o n wh ich is o f i n t e r e s t . They f i n d t h a t , i n t h e r e g i o n where t h e q u a n t i t y d(a2-u2)/dx is d e c r e a s i n g , a n aconctic -:;zvc f r o n t of aiiy o l i e n i a t i o n ( e x c e p t f o r one v e r y s p e c i f i c o r i e n t a t i o n ) s u b s e q u e n t l y p a s s e s t h r o u g h t h e r e a c t i o n zone of t h e deto- n a t i o n a t most o n l y twice (due t o r e f l e c t i o n f rom t h e s h o c k f r o n t ) . However a wave f r o n t of t h e p r o p e r o r i e n t a t i o n was found t o a s y m p t o t i - c a l l y a p p r o a c h t h e p l a n e where d(a2-u2)/dx h a s a maximum v a l u e . t h e r m o r e , t h i s r a y was found t o s u b s e q u e n t l y p r o p a g a t e p a r a l l e l t o t h e s h o c k f r o n t f o r a n i n f i n i t e l y l o n g t i m e . Thus , i f t h e d e t o n a t i o n d i d no t have a p l a n e where d(a2-u2)/dx w a s maximum, t h e i r t h e o r y a l s o p r e d i c t e d t h a t t h e d e t o n a t i o n would be d y n a m i c a l l y s t a b l e t o a t r a n s v e r s e wave per- t u r b a t i o n . They a l s o n o t e d t h a t s i n c e t h e r a y p r o p a g a t i n g a t t h e p l a n e d(a2-u2)/dx = maximum is p r o p a g a t i n g i n a r e g i o n where a t e m p e r a t u r e and
Fur-
7 3 .
d e n s i t y s e n s i t i v e e x o t h e r m i c chemical react i o n is o c c u r r i n g , i ts r a t e o f a m p l i t u d e growth is dependent o n t h e d e t a i l s o f t h e chemica l r e a c t i o n . B r i e f l y , t h e y came t o t h e c o n c l u s i o n t h a t any exo the rmic r e a c t i o n t h a t h a s b e e n o b s e r v e d i n n a t u r e would p r o d u c e t r a n s v e r s e wave a m p l i f i c a t i o n u n d e r t h e s e c o n d i t i o n s .
I n t h e r e g i o n where t h e q u a n t i t y d(a2-u2)/dx is i n c r e a s i n g t h e y found a n o t h e r i n t e r e s t i n g b e h a v i o r . I n t h i s r e g i o n , wave f r o n t s which have a p a r t i c u l a r r a n g e of i n i t i a l o r i e n t a t i o n s c o n v o l u t e w i t h t i m e i n s u c h a manner t h a t a n e l emen t of t h e wave f r o n t p rGpaga te s some d i s t a n c e away from t h e s h o c k f r o n t , t h e n t u r n s a r o u n d and r e t u r n s t o t h e f r o n t t o r e f l e c t and r e p e a t t h e p r o c e s s . S i n c e t h i s b e h a v i o r is o c c u r r i n g i n a r e g i o n which c o n t a i n s a t e m p e r a t u r e - s e n s i t i v e e x o t h e r m i c r e a c t i o n , it is a l s o e x p e c t e d t h a t t h e a m p l i t u d e of t h i s wave f r o n t w i l l grow w i t h t i m e . I n t e r e s t i n g l y enough t h e y found t h a t t h i s wave f r o n t e v e n t u a l l y p r o d u c e s m u l t i p l e s h o c k c o n t a c t s which a s y m p t o t i c a l l y a p p r o a c h a r e g u l a r s p a c i n g and t h a t t h i s s p a c i n g is dependent o n t h e e x t e n t and t h e d e t a i l e d s t r u c t u r e o f . t h e r e a c t i o n zone of t h e d e t o n a t i o n .
R e l a t i v e t o t h e problem o f l o n g i t u d i n a l i n s t a b i l i t y i n d e t o n a t i o n waves, Erpenbeck21 h a s pe r fo rmed a n a n a l y s i s f o r t r a n s v e r s e waves w i t h a r b i t r a r i l y l o n g wave l e n g t h s (which e f f e c t i v e l y become a l o n g i t u d i n a l d i s t u r b a n c e i n t h e f l o w ) . H e o n c e a g a i n found v a l u e s of o v e r d r i v e above which i n s t a b i l i t y o c c u r s . pe r fo rmed a one -d imens iona l non-s teady method of c h a r a c t e r i s t i c a n a l y s i s o n a p r o p a g a t i n g o v e r d r i v e n d e t o n a t i o n p roduced by a p i s t o n mot ion . They c a r r i e d t h e i r a n a l y s i s o u t t o v e r y l o n g t i m e s and o b s e r v e d a c o n t i n - ued l a r g e o s c i l l a t i o n i n t h e shock v e l o c i t y f o r t h e case t h a t Ei.penbcck p r e d i c t e d would be u n s t a b l e . They a l s o o b s e r v e d no s u s t a i n e d o s c i l . l a - t i o n s f o r 2 g n e o f E rpenbeck ' s s t a b l e c a s e s . Erpenbeck h a s been a b l e t o p r e d i c t t h e magn i tude of t h e s e l a r g e s c a l e o s c i l l a t i o n s b y e x t e n d i n g h i s a n a l y s i s t o i n c l u d e n o n l i n e a r terms.
From t h e above w e see t h a t one s h o u l d e x p e c t hydrodynamic i n s t a b i l i t i e s i n many of t h e f l o w s i t u a t i o n s i n which a shock wave is c l o s e l y f o l l o w e d by exo the rmic c h e m i c a l r e a c t i o n . S p e c i f i c a l l y , t h e s e r e s u l t s show t h a t t h e C J p l a n e is no t i m p o r t a n t t o t h e o c c u r r e n c e of f l o w i n s t a b i l i t i e s and t h e r e f o r e t h a t t h e s e l f s u s t e n a n c e o f d e t o n a t i o n is n o t a r equ i r emen t f o r i n s t a b i l i t y . I n o t h e r words, t h e i n s t a b i l i t i e s o b s e r v e d o n s e l f - s u s t a i n i n g d e t o n a t i o n s a re q u i t e c e r t a i n l y a r e s t r i c t e d example o f a g c n e r a l c l a s s of hydrodynamic i n s t a b i l i t i e s which o c c u r i n f l o w s con- t a i n i n g a h e a t r e l e a s e z o n e f o l l o w i n g a s h o c k t r a n s i t i o n .
I n a r e c e n t p a p e r , F i c k e t t and Wood25 have
I n a f o l l o w i n g pape r ,
11. S t r u c t u r e
A number of i n v e s t i g a t o r s have o b s e r v e d t h a t e s s e n t i a l l y a l l d e t o n a t i o n s p r o p a g a t e w i t h a complex non-steady f r o n t a l s t r u c t u r e . E a r l y work i n t h i s a r e a was pcrforrned p r i m a r i l y by R u s s i a n i n s i ga to l ; and h a s heen summarized i n a number o f recent R u s s i a n t e x t s . 3'>'8,2g,d8 The p r imary f i n d i n g s of t h e s e and s u b s e q u e n t i n v e s t i g a t o r s is t h a t t h e main shock f r o n t c o n s i s t s o f many s e c t i o n s w h i c h . a r e l o c a l l y convex towards t h e up- s t r e a m f low and t h e i n ' t e r s e c t i o n of t h e s e s e c t i o n s a r e t r a v e l i n g a c r o s s t h e . f r o n t a s waves ( s e e f o r example t h e e a r l y p h o t o g r a p h s o b t a i n e d by Whi t e31) . Both t h e o c c u r r e n c e and s t r u c t u r e of t h e s e t r a n s v e r s e waves a re i n t i m a t e l y c o n n e c t e d t o t h e chen i i s t ry of t h e r e a c t i o n s o c c u r r i n g i n t h e d e t o n a t i o n . I n t h e f o l l o w i n g s e c t i o n s o u r c u r r e n t u n d e r s t a n d i n g of t h e n a t u r e of t h i s t r a n s v e r s . e s t r u c t u r e and i ts i n t e r a c t i o n w i t h t h e c h e m i s t r y w i l l .be, d i s c u s s e d .
4. a . The Na tu re of T r a n s v e r s e Waves
The t r a n s v e r s e waves t h a t p r o p a g a t e a c r o s s t h e f r o n t o f a d e t o n a t i o n have been found t o o c c u r a t t h e f r o n t a s Mach stems or t r i p l e shock i n t e r s e c t i o n s of f i n i t e a m p l i t ~ d e ~ ~ , 3 2 , 3 3 . The s i n g l e s p i n de tona - t i o n t h a t o c c u r s i n a round t u b e is u n i q u e because it w a s t h e f i r s t non-one-dimensional s t r u c t u r e t o be o b s e r v e d and because it is t h e o n l y example o f a t r a n s v e r s e wave s t r u c t u r e which is s t e a d y i n t h e p r o p e r c o o r d i n a t e s y s t e m . ( I n t h i s c a s e , t h e c o o r d i n a t e s y s t e m which r e n d e r s t h e wave m o t i o n s t e a d y is o n e which r o t a t e s a t t h e s p i n f r e q u e n c y w i t h its a x i s o f r o t a t i o n a l o n g t h e t u b e a x i s . ) S p i n n i n g d e t o n a t i o n c o n t a i n s a v e r y complex d o u b l e Mach s t e m p a t t e r n which h a s been d e s c r i b e d by V o i t s e k h o v s k i i , Mi t ro f anov and J g p ~ h i a n ~ ~ and v e r i f i e d by t h e c a r e f u l work o f Duff32 and S c h o t t o b s e r v e d t r a n s v e r s e s t r u c t u r e s , t h e r e a r e a lways oppos ing t r a n s v e r s e waves p r o p a g a t i n g a c r o s s t h e f r o n t s i m u l t a n e o u s l y and the s t r u c t u r e a t t h e f r o n t is n e c e s s a r i l y t w o or t h r e e - d i m e n s i o n a l non-s teady . A t t h e p r e s e n t t i m e , a l l t h e d e t a i l s of t h i s complex s t r u c t u r e a r e not u n d e r s t o o d . However, a s men t ioned above , it is known t h a t these t r a n s v e r s e waves c o n s i s t o f Mach s t e m i n t e r a c t i o n s a t the f r o n t . These have been o b s e r v e d e x p e r i m e n t a l l y , b o t h o n p r o p a g a t i n g de tona - t i 0 n s ~ ~ , 3 5 , 3 6 and a s a n a r t i f i c a l l y produced the “ l a m i n a r “ d e t o n a t i o n which White and CaryS7 f i r s t p roduced by expand ing a n o v e r d r i v e n d e t o n a t i o n t h r o u g h a c y l i n d r i c a l n o z z l e . A s p a r k i n t e r f e r o g r a m o f s u c h a n a r t i f i c a l l y produced Mach s t e m and a n a n a l y s i s of its t r i p l e p o i n t s t r u c t u r e is shown i n F i g u r e 1. T h i s s t r u c t u r e was o b s e r v e d by White and and a n a l y z e d by S t r e h l ~ w . ~ ~ S t r e h l o w found t h a t e v e n though t h e shock t r i g g e r e d a h i g h l y exo the rmic r e a c t i o n a few m i c r o s e c o n d s a f t e r it p a s s e s a n e l emen t of t h e g a s , t h e t r i p l e p o i n t s t r u c t u r e is s t i l l c o n t r o l l e d by a n u n r e a c t i v e - u n r e a c t i v e s l i p s t r e a m b a l a n c e . The o b s e r v a t i o n s on p r o p a g a t i n g d e t o n a t i o n s have no t been a n a l y z e d as e x t e n s i v e l y a t t h e p r e s e n t t i m e . The re a r e still s e r i o u s q u e s t i o n s c o n c e r n i n g t h e d i s p o s i t i o n of t h e r e f l e c t e d shock and t h e manner i n which it i n t e r a c t s w i t h t h e r e a c t i o n z o n e .
The t r i p l e p o i n t s p r o p a g a t i n g o n t h e shock f r o n t of t h e d e t o n a t i o n have been found t o have t h e p r o p e r t y t h a t t h e y w i l l “ w r i t e ” a i n e on a smoked s u r f a c e . T h i s b e h a v i o r was f i r s t o b s e r v e d by A n t o l i k J g i n 1875 and w a s u sed by E. Mach i n c o n j u n c t i o n w i t h h i s s t u d i e s of s p a r k d i s c h a r g e s and t h e i n t e r a c - t i o n o f shock waves produced by b u l l e t s f i r e d i n t h e l a b o r a t o r y . The t e c h n i q u e l a y dormant f o r o v e r 80 y e a r s u n t i l i n 1958, Denisov a n d T r o s h i n 4 0 s t a r t e d t o u s e i t t o s t u d y d e t o n a t i o n s t r u c t u r e . t h a t t h e t r i p l e p o i n t is w r i t i n g t h e p a t t e r n by d i r e c t l a s e r s c h l i e r e n pho tography l o o k i n g t h r o u g h t h e smoked f i l m .
T h i s p r o p e r t y h a s b e e n v e r y h e l p f u l i n t h e s t u d y of t r a n s v e r s e wave phenomena i n d e t o n a t i o n s . To pe r fo rm a n expe r imen t , o n e s imply smokes a s u r f a c e w i t h e i rher wood, acetyleiie, kc i les i~~e , o r zny other a p p r o p r i a t e smoke a n d e x p o s e s it t o t h e d e t o n a t i o n . After e x p o s u r e t h e f i l m is “ f i x e d t t w i t h a c l e a r l a c q u e r s p r a y . The q u a l i t y is a l m o s t a s good a s t h a t o f a p h o t o g r a p h i c n e g a t i v e . A f e w examples of smoke t r a c k r e c o r d s o b t a i n e d w i t h d e t o n a t i o n s p r o p a g a t i n g i n a r e c t a n g u l a r t u b e a r e shown i n F i g u r e 2.
I n F i g u r e 3, t h e r e s u l t s of s t u d y i n g a symmetr ic i n t e r a c t i o n u s i n g t h e smoke t r a c k t e c h n i q u e a r e summarized42. of s a n d g r a i n s were p l a c e d o n t h e smoke p l a t e b e f o r e t h e d e t o n a t i o n
. I n a l l o t h e r
e a c t i v e Mach stem o n
Oppenheim and U t r i e w 4 1 have r e c e n t l y v e r i f i e d
I n t h i s c a s e , a number
5.
p a s s e d o v e r ' t h e p l a t e and e a c h g r a i n w r o t e a wake p a t t e r n w h o s e ' a x i s 1s normal t o t h e l o c a l o r i e n t a t i o n o f t h e 1 e a d i n g . s h o c k wave of t h e d e t o n a t i o n . , .The i n t e r s e c t i o n geometry i s t h e r e f o r e c o m p l e t e l y d e t e r m i n e d , a n d one may c a l c u l a t e a l l shock and f l o w p r o p e r t i e s i n t h e ne ighborhood of t h e i n t e r s e c t i o n . ' From t h i s c a l c u l a t i o n one con- c l u d e s t h a t t h e normal shock v e l o c i t y is d i s c o n t i n u o u s l y i n c r e a s e d by abou t 30 t o 40% a t t h e c e n t e r l i n e o f t h e i n t e r s e c t i o n and t h e r e f o r e t h a t a l l p o r t i o n s o f t h e l e a d i n g shock are a t t e n u a t i n g v e r y r a p i d l y i n t h e d e t o n a t i o n . T h i s is v e r y d i s t u r b i n g , b e c a u s e ' e v e n though t h e shock is l o c a l l y p r o p a g a t i n g a t a v e l o c i t y which v a r i e s ' f r o m 10 t o 20% below C J t o 1 0 t o 20% above CJ , t h e d e t o n a t i o n a s a whole i s s t i l l o b s e r v e d t o p r o p a g a t e a t v e r y close t o t h e C J v e l o c i t y . The mechanism which makes t h i s p o s s i b l e is no t u n d e r s t o o d a t t h e p r e s e n t t i m e .
b . A c o u s t i c Coup l ing and L i m i t s
The t r a n s v e r s e waves o n t h e d e t o n a t i o n f r o n t e x h i b i t a d e g r e e of r e g u l a r i t y which is dependen t o n t h e geometry o f t h e d e t o n a t i o n t u b e and o n t h e c h e m i c a l sys t em which is s u p p o r t i n g t h e d e t o n a t i o n . The e f f e c t o f d e t o n a t i o n t u b e geometry is p r i m a r i l y c a u s e d by t h e f a c t t h a t t h e h i g h p r e s s u r e r e g i o n s p r o p a g a t i n g across t h e f r o n t (immedi- a t e l y beh ind t h e Mach stem) p roduce t r a n s v e r s e p r e s s u r e waves i n t h e g a s column f o l l o w i n g t h e f r o n t and t h a t these t r a n s v e r s e waves have a t endency t o c o u p l e w i t h r e s o n a n t t r a n s v e r s e modes of t h e g a s column downstream o f t h e f r o n t . M a n ~ o n ~ ~ and Fay44 p r e d i c t e d t h i s b e h a v i o r f o r n e a r l i m i t d e t o n a t i o n s a p p r o x i m a t e l y 1 5 t o 20 y e a r s a g o . It now a p p e a r s , however, t h a t t h i s c o u p l i n g is i n c i d e n t a l t o t h e o c c u r r e n c e o f t r a n s v e r s e waves o n t h e f r o n t . have o b s e r v e d t r a n s v e r s e s t r u c t u r e o n a' s p h e r i c a l d e t o n a t i o n . However, t h e o c c u r r e n c e of t r a n s v e r s e waves o n t h e f r o n t is n o t i n - c i d e n t a l t o t h e s e l f - s u s t e n a n c e o f t h e d e t o n a t i o n wave. I t h a s been n o t e d r e p e a t e d l y i n t h e l i t e r a t u r e t h a t a s t h e i n i t i a l p r e s s u r e is
Flowered o r a s t h e d e t o n a b l e m i x t u r e is d i l u t e d w i t h a n i n e r t g a s , t h e c h a r a c t e r i s t i c s p a c i n g of t h e s t r u c t u r e g e t s l a rge r . I t a l s o h a s been o b s e r v e d t h a t t h e l a s t t r a n s v e r s e f r o n t a l s t r u c t u r e t h a t o c c u r s i n any s p e c i f i c t u b e c o r r e s p o n d s t o t h e lowest t r a n s v e r s e a c o u s t i c mode of t h e h o t gas column f o l l o w i n g t h e f r o n t i n t h a t t u b e . I n t h e case of round t u b e s , t h i s mode is t h e s i n g l e s p i n mode. I t is a l s o now q u i t e c e r t a i n , t h a t d e t o n a t i o n s p r o p a g a t i n g j u s t i n s i d e t h e s e l i m i t s p r o p a g a t e a t a n a v e r a g e v e l o c i t y lower t h a n the C J v e l o c i t y . T h i s is e v i d e n t l y c a u s e d b e c a u s e a s i g n i f i c a n t f r a c t i o n o f t h e chemica l e n e r g y r e l e a s e d i n t h e r e a c t i o n zone res ides i n t r a n s v e r s e wave ene rgy f o r a n a p p r e c i a b l e l e n g t h of t i m e i n t h e s e l i m i t d e t o n a t i o n s .
I n c e r t a i n c h e m i c a l s y s t e m s , t h e t u b e geometry .has a v e r y marked e f f e c t o n t h e r e g u l a r i t y o f t h e w r i t i n g p a t t e r n . F i g u r e 4 i l l u s t r a t e s t h a t e x t r e m e l y r e g u l a r p a t t e r n s c a n b e o b s e r v e d i n r e c t a n g u l a r and p l a n a r ( v e r y 'narrow r e c t a n g u l a r ) g e o m e t r i e s . I n c i d e n t a l l y , t h e p l a n a r mode o c c u r s when t h e p r e f e r r e d t r a n s v e r s e s p a c i n g o f t h e d e t o n a t i o n is a t l e a s t f i v e t imes , . t h , e w i d t h o f a nar,row c h a n n e l . I t is t h e s i m p l e s t s e l f - s u s t a i n i n g d , e t o n a t i o n mode whlch may be s t u d i e d , s i n c e i t is two-dimensional non-s teady . 1.n: o t , he r c h e m i c a l ' s y s t e m s however, it h a s been o b s e r v e d t h a t t h e r e g u l a r i t y o f t h e t r a n s v e r s e s t r u c t u r e is poor i n a l l t u b e g e o m e t r i e s . T y p i c a l . s m o k e t ' r a c k r e c o r d s a r e shown i n Figure 2 and r e s u 1 , t s f o r a number of f u e l L o x i d i z e r 'mix t .ures a r e summarized i n T a b l e 1. The r e a s o n ' f o r t h i s . b e h a v i o r h a s not been d i s - c o v e r e d a t t h e p r e s e n t t i m e , . I t is, however, q u i t e o b v i o u s l y r e l a t e d t o t h e c h e m i s t r y o f t h e s y s t e m which is d e t o n a t i n g .
F o r example, Duff and F i n g e r 4 5
6 .
c . S p a c i n g of T r a n s v e r s e Waves and Chemis t ry
I n s y s t e m s which show a r e a s o n a b l y r e g u l a r w r i t i n g p a t t e r n i n rectan- g u l a r t u b e s , i t h a s been o b s e r v e d t h a t t h e c h a r a c t e r i s t i c s ize of p a t t e r n is d i c t a t e d by t h e i n i t i a l p r e s s u r e l e v e l and t h e d i l u t i o n . The t r a n s v e r s e wave s p a c i n g of r e g u l a r smoke t r a c k p a t t e r n s is u s u a l l y d e f i n e d a s t h e a v e r a g e d i s t a n c e between two s u c c e s s i v e waves p ropaga t - i n g i n t h e same d i r e c t i o n measured a l o n g a l i n e p a r a l l e l t o t h e a v e r a g e o r i e n t a t i o n o f t h e l e a d i n g shock wave, i . e . , a l o n g t h e d i a m e t e r o f t h e t u b e .
i!P
The most e x t e n s i v e d a t a o n s p a c i n g has been t a k e n i n t h e hydrogen- oxygen sys t em c o n t a i n i n g a r g o n a s a n i n e r t d i l u e n t . T h i s d a t a is summarized and compared w i t h t h e a c o u s t i c p r e d i c t i o n s f o r t h e s p a c i n g and w i t h a v e r a g e i n d u c t i o n zone and r ecombina t ion zone l e n g t h s i n F i g u r e 5. Here t h e r e c o m b i n a t i o n zone l e n g t h has been approx ima ted b y n o r m a l i z i n g t h e r e c i p r o c a l o f t h e maximum rate of r e c o m b i n a t i o n and u s i n g t h e flow v e l o c i t y a t t h e s ta r t of r e c o m b i n a t i o n . We n o t i c e f rom t h i s f i g u r e t h a t t h e s p a c i n g is a lways l a r g e r t h a n t h e sum o f t h e i n d u c t i o n p l u s r e c o m b i n a t i o n zone l e n g t h s i n t h i s s y s t e m and t h e r e f o r e t h a t e a c h e l e m e n t o f t h e d e t o n a t a b l e m i x t u r e is n e v e r t r a - v e r s e d by more t h a n o n e t r a n s v e r s e wave o f t h e same f a m i l y b e f o r e i t c o m p l e t e s i ts r e a c t i o n . W e a l s o n o t e f rom F i g u r e 5 t h a t t h e s p a c i n g p r e d i c t e d from t h e a c o u s t i c t h e o r y i s c o n s i d e r a b l y less t h a n any o f t h e r e a c t i o n l e n g t h s or t h a n t h e s p a c i n g of t h e t r a n s v e r s e wave a t t h e f r o n t of t h e d e t o n a t i o n . Thus i t a p p e a r s t h a t t h e a c o u s t i c t h e o r y c a n n o t be u s e d t o p r e d i c t t h e s p a c i n g of t h e f i n i t e a m p l i t u d e t r a n s v e r s e w a v e s t h a t are o b s e r v e d o n p r o p a g a t i n g d e t o n a t i o n s . T h i s is n o t s u r p r i s i n g , however , s i n c e t h e i n t e r a c t i o n o f oppos ing waves a p p e a r s t o be t h e r e g u l a t i n g mechanism i n a p r o p a g a t i n g d e t ~ n a t i o n ~ ~ . However, i t i s i n t e r e s t i n g t h a t t h e s p a c i n g s which a re measured and t h e s p a c i n g s which a r e c a l c u l a t e d u s i n g t h e a c o u s t i c t h e o r y are r o u g h l y p r o p o r t i o n a l t o e a c h o t h e r .
d . Spontaneous Growth o f T r a n s v e r s e Waves
The a c o u s t i c t h e o r y of S t r e h l o w and Fernandesa3 p r e d i c t s t h a t c o h e r e n t t r a n s v e r s e w a v e s s h o u l d grow i n a m p l i t u d e a s t h e y p r o p a g a t e t h r o u h t h e r e a c t i o n zone o f t h e d e t o n a t i o n and t h e B a r t h e l and S t r eh lowag t h e o r y p r e d i c t s t h a t a s i n g l e a c o u s t i c f r o n t s h o u l d c o n v o l u t e t o pro- duce a number of e v e n l y s p a c e d shock c o n t a c t s a f t e r some t i m e . T h i s c o n t e n t i o n has been v e r i f i e d e x p e r i m e n t a l l y f o r a t least one case, d u r i n g t h e homogeneous i n i t i a t i o n of d e t o n a t i o n b e h i n d a r e f l e c t e d shock wave i n a hydrogen-oxygen-argon m i x t u r e . F i g u r e 6 c o n t a i n s a n ( x , t ) i n i t i a t i o n p h o t o g r a p h a n d a smoke t r a c k r e c o r d o b t a i n e d s i m u l t a n e o u s l y on a s ide w a l l o f t h e t u b e . I t is i n t e r e s t i n g t o n o t e t h a t d u r i n g t h i s n i c e l y one -d imens iona l i n i t i a t i o n e x p e r i m e n t , v e r y weak t r a n s v e r s e waves a p p e a r on t h e f r o n t and t h e n grow i n a m p l i t u d e ( a s i n d i c a t e d b y a n i n c r e a s e i n t h e r e f r a c t i o n of o p p o s i n g waves a t t h e i r i n t e r s e c t i o n ) . I n a r e c e n t p a p e r , S t r e h l o w , Liaugminas , Watson and E ~ m a n ~ ~ have shown t h a t t h e a p p e a r a n c e l o c a t i o n o n t h e smoke t r a c k r e c o r d s may be u s e d t o p r e d i c t a r e a s o n a b l y c o n s t a n t e x p o n e n t i a l c o e f f i c i e n t f o r t h e l i n e a r t h e o r y of a c o u s t i c g rowth . From t h e s e e x p e r i m e n t a l r e s u l t s w e may deduce t h a t t h e r e is l i t t l e doub t b u t t h a t t h e a c o u s t i c t h e o r y of a m p l i t u d e growth o f f e r s a v i a b l e mechanism for t h e a p p e a r a n c e of t h e f i n i t e a m p l i t u d e t r a n s v e r s e waves t h a t o c c u r On p r o p a g a t i n g d e t o n a t i o n s .
7. 111. I n i t i a t i o n and F a i l u r e
a . Flame .to D e t o n a t i o n I n i t i a t i o n
T h i s s u b j e c t h a s been s t u d i e d e x t e n s i v e l y i n t u b e s o f v a r y i n g geometry and i n many chemica l s y s t e m s . By f a r t h e m o s t q u a n t i t a t i v e s t u d y of t h e s u b j e c t h a s been per formed b y Oppenheim, U r t i e w a n d c o - ~ o r k e r s ~ ~ - ~ ~ a t Berke ley . The phenomena is complex and t h e p r o c e s s of flame a c c e l e r a t i o n ( e v e n t u a l l y l e a d i n g t o d e t o n a t i o n ) is v e r y dependen t on t h e c o n d i t i o n o f t h e t u b e wal l s and t h e p r e s e n c e o f obs t ac l e s i n t h e f l o w .
I n g e n e r a l t h e p r o c e s s d e v e l o p s i n t h e f o l l o w i n g manner. A flame, g e n e r a t e d a t t h e c l o s e d end o f t u b e p r o d u c e s a compress ion wave i n t h e gas which s t e e p e n s i n t o a shock wave some d i s t a n c e f rom t h e end o f t h e t u b e . T h i s f l o w d e v e l o p s a boundary l a y e r which becomes t u r b u l e n t and c a u s e s t h e f l ame to accelerate. The a c c e l e r a t i o n of t h e flame t h e n s u b s e q u e n t l y r e i n f o r c e s t h e o r i g i n a l shock wave. E v e n t u a l l y , t h e shock p r e h e a t s t h e gas s u f f i c i e n t l y t o c a u s e t h e o n s e t o f d e t o n a t i o n . However, t h e a c t u a l o c c u r r e n c e o f d e t o n a t i o n is s o m e t i m e s o b s c u r e d by t h e p r o x i m i t y o f a v e r y t u r b u l e n t f l a m e i n t h e ne ighborhood o f t h e i n i t i a t i o n p o i n t and i n g e n e r a l t h e p r o c e s s is n o t one -d imens iona l . The a c c e l e r a t i o n p r o c e s s depends v e r y s t r o n g l y on t h e r a t i o of t h e b u r n i n g v e l o c i t y t o t h e sound v e l o c i t y i n t h e c o m b u s t i b l e m i x t u r e . High v a l u e s o f t h i s r a t i o c a u s e more r a p i d a c c e l e r a t i o n i n t h e s y s t e m and t h e r e f o r e c a u s e a s h o r t e r d e t o n a t i o n " i n d u c t i o n " d i s t a n c e . I f t h e t u b e h a s a f i n i t e l e n g t h and is closed a t b o t h e n d s , s h o c k r e f l e c t i o n from t h e f a r end may o c c u r b e f o r e i g n i t i o n . The r e f l e c t i o n
* p r o c e s s w i l l a lways p r e f e r e n t i a l l y t r i g g e r d e t o n a t i o n and i t has t h e added d i s a d v a n t a g e t h a t i t p r o d u c e s v e r y h i g h p r e s s u r e s b e f o r e t h e d e t o n a t i o n o c c u r s . T h i s t y p e of i n i t i a t i o n is e x t r e m e l y i m p o r t a n t t o t h e p r e d i c t i o n of p o s s i b l e haza rdous d e t o n a t i o n s i n large i n d u s t r i a l i n s t a l l a t i o n s . I t a p p e a r s , f rom t h e i n f o r m a t i o n now a v a i l a b l e t h a t one m a y make q u i t e r e a l i s t i c es t imates o f t h e p o s s i b i l i t y of de tona - t i o n f o r any s p e c i f i c a p p a r a t u s a n d c o m b u s t i b l e m i x t u r e .
b . Homogeneous I n i t i a t i o n
Homogeneous one-d imens iona l i n i t i a t i o n h a s been o b s e r v e d beh ind a r e f l e c t e d shock wave i n a c o n v e n t i o n a l shock tube54,55,56. shows a n x , t s c h l i e r e n in fe rogram o f s u c h a n i n i t i a t i o n p r o c e s s . The g a s namics o f t h i s p r o c e s s have been modeled by G i l b e r t and Strehlow" u s i n g a n ( x , t ) method o f c h a r a c t e r i s t i c s a n a l y s i s . They assumed t h a t e a c h e l e m e n t o f t h e gas reacts w i t h k i n e t i c s which are dependen t o n l y on t h e p r e v i o u s t ime- t empera tu re p r e s s u r e h i s t o r y and t h a t t h e gas dynamics m a y be modeled i n a c o n v e n t i o n a l manner . The r e s u l t s o f t h e i r a n a l y s i s a g r e e d w i t h e x p e r i m e n t a l o b s e r v a t i o n s o f h i g h t e m p e r a t u r e r e f l e c t e d i n i t i a t i o n i n e v e r y d e t a i l and showed t h a t t h i s t y p e o f i n i t i a t i o n p r o c e s s is d i r e c t l y c a u s e d by t h e i n t e r a c t i o n of r e a c t i o n k i n e t i c s and i n v i s c i d gas dynamics . I n s h o r t , t h e y found t h a t because shock h e a t i n g is a wave p r o c e s s i t g e n e r a t e s a r e a c t i o n ' w a v e which i n t e r a c t s w i t h and accelerates t h e shock wave i n a manner which is c o m p l e t e l y p r e d i c t a b l e i f t h e k i n e t i c s a re w e l l u n d e r s t o o d . Fu r the rmore t h e y found t h a t f o r t h i s p r o c e s s t h e r m a l c o n d u c t i o n and d i f f u s i o n a r e u n i m p o r t a n t t o t h e wave develop-. ment p r o c e s s .
F i g u r e 6
a. I n a f o l l o w i n g work, S t r e h l o w , Crooke r , and Cusey57 have e x p e r i m e n t a l l y and t h e o r e t i c a l l y s t u d i e d t h e p r o c e s s of d e t o n a t i o n i n i t i a t i o n when a s t e p shock wave p a s s e s i n t o a s l o w l y c o n v e r g i n g c h a n n e l . Once a g a i n t h e y obse rved t h a t t h e first p o i n t of i n i t i a t i o n , i n r e a l t i m e , i n t h e c o n v e r g i n g c h a n n e l c o u l d be p r e d i c t e d by s i m p l e a p p l i c a t i o n of non- s t e a d y g a s dynamics and t h e p r o p e r r e a c t i o n k i n e t i c s .
c . Hot Spot I n i t i a t i o n
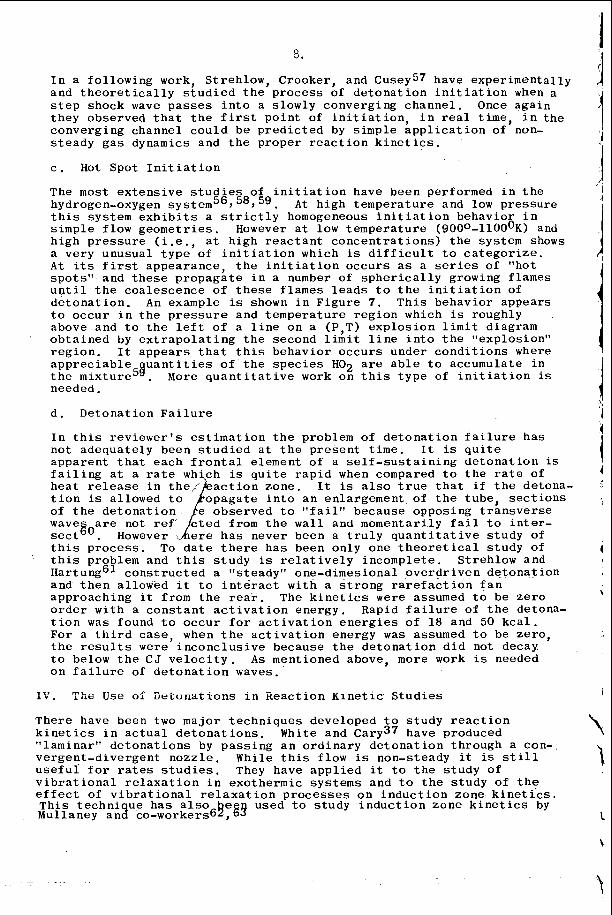
The most e x t e n s i v e s t u d i e s of i n i t i a t i o n have been per formed i n t h e hydrogen-oxygen sys tem56, 58, 59 . t h i s sys t em e x h i b i t s a s t r i c t l y homogeneous i n i t i a t i o n b e h a v i o r i n s i m p l e f low g e o m e t r i e s . h i g h p r e s s u r e ( i .e. , a t h i g h r e a c t a n t c o n c e n t r a t i o n s ) t h e sys tem shows a v e r y unusua l t y p e of i n i t i a t i o n which is d i f f i c u l t t o c a t e g o r i z e . A t i ts f irst a p p e a r a n c e , t h e i n i t i a t i o n o c c u r s a s a series o f " h o t s p o t s " and t h e s e p r o p a g a t e i n a number of s p h e r i c a l l y growing f l a m e s u n t i l t h e c o a l e s c e n c e o f t h e s e f l a m e s l e a d s t o t h e i n i t i a t i o n of d e t o n a t i o n . An example is shown i n F i g u r e 7 . T h i s b e h a v i o r a p p e a r s t o o c c u r i n t h e p r e s s u r e and t e m p e r a t u r e r e g i o n which is roughly above and t o t h e l e f t of a l i n e on a (P,T) e x p l o s i o n l i m i t d iagram o b t a i n e d by e x t r a p o l a t i n g t h e second l i m i t l i n e i n t o t h e " e x p l o s i o n " r e g i o n . I t a p p e a r s t h a t t h i s b e h a v i o r o c c u r s under c o n d i t i o n s where a p p r e c i a b l e t h e mix tu re58 . More q u a n t i t a t i v e work on t h i s t y p e of i n i t i a t i o n is needed .
A t h i g h t e m p e r a t u r e and low p r e s s u r e
However a t l o w t e m p e r a t u r e (9000-1100°K) and
u a n t i t i e s o f t h e s p e c i e s H 0 2 a r e a b l e t o accumula t e i n
d . D e t o n a t i o n F a i l u r e
I n t h i s r e v i e w e r ' s e s t i m a t i o n t h e problem o f d e t o n a t i o n f a i l u r e h a s not a d e q u a t e l y been s t u d i e d a t t h e p r e s e n t t i m e . I t is q u i t e a p p a r e n t t h a t e a c h f r o n t a l e lement of a s e l f - s u s t a i n i n g d e t o n a t i o n is
t h i s p r o c e s s . To d a t e t h e r e h a s been o n l y o n e t h e o r e t i c a l s t u d y of t h i s problem and t h i s s t u d y is r e l a t i v e l y i n c o m p l e t e . S t r e h l o w and HartungG1 c o n s t r u c t e d a " s t eady" one -d imes iona l o v e r d r i v e n d e t o n a t i o n and t h e n a l l o w e d it t o i n t e r a c t w i t h a s t r o n g r a r e f a c t i o n f a n a p p r o a c h i n g it f rom t h e r e a r . The k i n e t i c s were assumed t o be z e r o o r d e r w i t h a c o n s t a n t a c t i v a t i o n e n e r g y . Rapid f a i l u r e of t h e detona- t i o n was found t o o c c u r f o r a c t i v a t i o n e n e r g i e s o f 18 and 50 k c a l . Fo r a t h i r d c a s e , when t h e a c t i v a t i o n ene rgy was assumed t o be z e r o , t h e r e s u l t s were i n c o n c l u s i v e b e c a u s e t h e d e t o n a t i o n d i d not decay t o below t h e C J v e l o c i t y . A s men t ioned above, more work is needed o n f a i l u r e of d e t o n a t i o n waves.
T,, rnL- IT-- L U G U ~ C of D e i v n a t i o n s i n R e a c t i o n K i n e t i c S t u d i e s
T h e r e have been two ma jo r t e c h n i q u e s deve loped t o s t u d y r e a c t i o n k i n e t i c s i n a c t u a l d e t o n a t i o n s , White and have produced " l a m i n a r " d e t o n a t i o n s by p a s s i n g a n o r d i n a r y d e t o n a t i o n t h r o u g h a con- v e r g e n t - d i v e r g e n t n o z z l e . While t h i s f l ow is non-s teady it is S t i l l u s e f u l f o r r a t e s s t u d i e s . They have a p p l i e d it t o t h e s t u d y of v i b r a t i o n a l r e l a x a t i o n i n e x o t h e r m i c s y s t e m s and t o t h e s t u d y of t h e e f f e c t of v i b r a t i o n a l r e l a x a t i o n p r o c e s s e s o n i n d u c t i o n zone k i n e t i c s . T h i s t e c h n i ue h a s a l s o e used t o s t u d y i n d u c t i o n z o n e k i n e t i c s by Mul laney a n 3 co-workers69, g!?
9.
I n a n o t h e r t e c h n i q u e , a one -d imens iona l d e t o n a t i o n h a s been s t a b i l i z e d i n a wind t u n n e l and t h e r e a c t i o n p r o f i l e s t u d i e d by o b s e r v i n g t h e P r e s s u r e p r o f i l e downstream of t h e normal shockG4. T h i s t e c h n i q u e h a s i n t e r e s t i n g e n g i n e e r i n g i m p l i c a t i o n s b e c a u s e it measu res o v e r a l l r a t e s of h e a t r e l e a s e d i r e c t l y i n a n i c e l y c o n t r o l l e d one-dimensional geometry .
U n f o r t u n a t e l y , it a p p e a r s t h a t a l l a t t e m p t s t o r e s o l v e t h e r e a c t i o n zone i n o r d i n a r y s e l f - s u s t a i n i n g d e t o n a t i o n s are doomed t o f a i l u r e , because of t h e p r e s e n c e of t r a n s v e r s e waves. S o l o u k h i n i n h i s d i s c u s s i o n of what are , i n h i s t e r m i n o l o g y , "mul t i - f r o n t e d de tona t ions"60 , h a s p o i n t e d o u t t h a t e i t h e r a v e r a g i n g across t h e t r a n s v e r s e s t r u c t u r e w i t h o p t i c a l t e c h n i q u e s or u s i n g p r e s s u r e t r a n s d u c e r s a t t h e w a l l w i l l a lways y i e l d r e s u l t s which a r e i n c o r r e c t i n terms .of a one -d imens iona l t h e o r y . Thus t h e u t i l i t y of o r d i n a r y p r o p a g a t i n g d e t o n a t i o n s f o r k i n e t i c s t u d i e s is a t b e s t m a r g i n a l .
SHOCK TUBE HYDRODYNAMICS
S i n c e t h e i n c e p t i o n of i ts u s e i n t h e e a r l y 1 9 5 0 ' s t h e c h e m i c a l shock t u b e h a s g r e a t l y expanded t h e t e m p e r a t u r e r a n g e a v a i l a b l e f o r q u a n t i t a t i v e e x p e r i m e n t a l s t u d i e s of t h e phys ico -chemica l p r o p e r t i e s o f g a s e s . The s u c c e s s of i t s a p p l i c a t i o n as a r e s e a r c h too l may be gauged by t h e f a c t t h a t t h r o u g h o u t t h e wor ld t h e e x t a n t c h e m i c a l shock t u b e l i t e r a t u r e c o n s i s t s of o v e r a t h o u s a n d reference^^^, is p r e s e n t l y b e i n g i n c r e a s e d a t t h e r a t e of a p p r o x i m a t e l y 150 r e f e r e n c e s p e r y e a r .
I n t h e f i e l d of r e a c t i o n k i n e t i c s s t u d i e s t h e r e are t w o fundamen ta l r e a s o n s f o r t h i s s u c c e s s . p roduced d u r i n g t h e o p e r a t i o n o f a n i d e a l shock t u b e y i e l d s a n ~
e x t r e m e l y p r e c i s e and r e p r o d u c i b l e h e a t i n g c y c l e w i t h e x c e l l e n t i n i t i a l c o n d i t i o n s . I n t h e second p l a c e t h e shock t u b e is p a r t i c u l a r l y s u i t e d f o r s t u d i e s i n s y s t e m s t h a t a re h i g h l y d i l u t e d w i t h a n i n e r t g a s and s t u d i e s i n s u c h d i l u t e s y s t e m s have c o n s i s t e n t l y y i e l d e d t h e b e s t q u a n t i t a t i v e k i n e t i c d a t a . T h e r e f o r e , o n e might s ay t h a t g a s dynamics is t h e s e r v a n t which allows one t o make r e l a t i v e l y p r e c i s e r a t e measurements a t hLgh t e m p e r a t u r e s i n a c h e m i c a l shock t u b e . However, i t i s a l s o t h e master of t h e s i t u a t i o n i n t h a t , ( 1 ) t h e geometry of t h e c h e m i c a l shock t u b e is d i c t a t e d pr imar i1 .y by g a s dynamics con- s i d e r a t i o n s , ( 2 ) s p e c i f i c g a s dynamics n o n - i d e a l i t i e s l i m i t t h e u t i l i t y o f t h e a p p a r a t u s and ( 3 ) t h e c o u p l i n g of t h e c h e m i c a l r e a c t i o n and t h e g a s dynamics is a l w a y s i m p o r t a n t t o t h e s t u d y o f r e a c t i o n k i n e t i c s ; p a r t i c u l a r l y i n e x o t h e r m i c s y s t e m s .
A t t h e p r e s e n t time s u f f i c i e n t i n f o r m a t i o n h a s been c o m p i l e d conce rn - i n g t h e behav io r of shock t u b e s , so t h a t t h e d e s i g n o f a shock t u b e f o r p r e c i s e c h e m i c a l r a t e s t u d i e s is p o s s i b l e . T h i s p o r t i o n of t h e p a p e r w i l l p r e s e n t a c r i t i c a l d i s c u s s i o n o f t h e r e l a t i v e merite of v a r i o u s e x p e r i m e n t a l t e c h n i q u e s and i n a d d i t i o n w i l l r e v i e w r e c e n t work on non- idea l shock t u b e b e h a v i o r and r e c e n t l y a c q u i r e d knowledge c o n c e r n i n g t h e o c c u r r e n c e o f t h o s e f l o w i d e a l i t i e s c a u s e d by t h e p r e s e n c e of exo the rmic r e a c t i o n s .
I . S t u d i e s Behind "Steady" I n c i d e n t Shock Waves
The most p r e c i s e measurement of a c h e m i c a l r e a c t i o n r a t e c o n s t a n t may be o b t a i n e d by o b s e r v i n g . t h e r e a c t i o n immedia te ly b e h i n d t h e i n c i d e n t shock wave p roduced i n a c o n v e n t i o n a l shock t u b e . F o r t h e
and
I n t h e f i r s t p i a c e t h e s t e p s h o c k wave
10.
h i g h e s t p r e c i s i o n it is i m p e r a t i v e t h a t t h e s e measurements be made a t h i g h d i l u t i o n i n a monatomic g a s and t h a t b o t h t h e r a t e measurement and t h e shock v e l o c i t y measurement be e x t r a p o l a t e d t o t h e i n s t a n t t h e shock uncovered t h e o b s e r v a t i o n s t a t i o n . I n a l l o t h e r c a s e s f l o w non- i d e a l i t i e s w i l l c a u s e d i f f i c u l t i e s i n t h e i n t e r p r e t a t i o n o f t h e d a t a . T h i s t y p e o f e x t r a p o l a t i o n is p o s s i b l e i n o n l y c e r t a i n s p e c i f i c c a s e s , f o r example, i n t h e s t u d y of t h e i n i t i a l d i s s o c i a t i o n r a t e of a d i a t o m i c o r more complex molecu le . T y p i c a l examples of i n v e s t i g a t i o n s which have y i e l d e d r e s u l t s of h i g h p r e c i s i o n u s i n g t h i s t e c h n i q u e a r e t h e measurements o f t h e d i s s o c i a t i o n r a t e of t r i a t o m i c m o l e c u l e s by Olschewski , Troe and Wagnere6, 6 7 , 68, 69, t h e easurement of hydrogen d i s s o c i a t i o n by Myerson, Thompson and Josephvo and t h e measurement of oxygen atom r e c o m b i n a t i o n by K i e f e r and Lu tz71 .
I n c a s e s where t h e r e a c t i o n p r o c e s s must be f o l l o w e d f o r a l o n g t ime a f t e r shock p a s s a g e t h e measurement of a c o r r e c t r a t e is not r e a l l y v e r y s t r a i g h t f o r w a r d . The raw d a t a a f t e r b e i n g r educed w i t h t h e h e l p of i d e a l shock t u b e t h e o r y must s t i l l be c o r r e c t e d f o r t h e non- idea l f l ow b e h a v i o r i n t h e p a r t i c u l a r t u b e t h a t is be ing used i n t h e e x p e r i m e n t . S i n c e combus t ion d r i v e r s , h e a t e d g a s d r i v e r s , doub le d iaphragm t u b e s , d e t o n a t i o n d r i v e r s , e tc . , produce n o t o r i o u s l y non- i d e a l f l ow s i t u a t i o n s i n t h e test g a s , w e w i l l d i s c u s s c o r r e c t i o n pro- c e d u r e s which must be u s e d f o r o n l y t h e s i m p l e s t d r i v i n g p r o c e s s : a c o l d g a s d r i v e r o p e r a t i n g w i t h a s i m p l e p r e s s u r e b u r s t i n a c o n v e n t i o n a l c o n s t a n t a r e a shock t u b e . Even i n t h i s c a s e t h e r e a r e t h r e e o v e r l a p p i n g b u t r e l a t i v e l y i n d e p e n d e n t c o r r e c t i o n s which must c o n c e r n t h e i n v e s t i - g a t o r i f h e is t o o b t a i n r e a s o n a b l e r a t e c o n s t a n t s . The f i r s t of t h i s c o n c e r n s t h e diaphragm m a t e r i a l u s e d i n t h e s t u d y . Diaphragm opening t i m e is a f u n c t i o n of b o t h t h e i n e r t i a and t h e t e a r i n g p r o p e r t i e s of t h e diaphragm m a t e ~ - i a l ~ ~ , ~ ~ . P r o b a b l y t h e b e s t m a t e r i a l i n t h i s r e s p e c t i s c e l l u l o s e a c e t a t e b e c a u s e it d i s i n t e g r a t e s so t h o r o u g h l y on b u r s t i n g . Mylar is q u i t e s low and i r r e g u l a r and h a s been shown t o p roduce i r r e p r o d u c i b l e l a t e p r e s s u r e p u l s e s 7 4 ( p r o b a b l y due t o f l a p p i n g or l a t e t e a r i n g ) which c o u l d l e a d t o s c a t t e r i n t h e r a t e measurements . Metal d i aphragms i n g e n e r a l a p p e a r t o open r a t h e r s l o w l y b u t r e a s o n a b l y r e p r o d u c i b l e , i f s c o r e d u n i f o r m l y .
I t h a s been o b s e r v e d t h a t even when r e p r o d u c i b l e , t h e r a t e of t h e d i a - phragm open ing p r o c e s s is ex t r eme ly imp0 t a n t i n d e t e r m i n i n g t h e e a r l y b e h a v i o r of t h e s h o c k t u b e f l o w . shown t h a t f o r a s low d iaphragm open ing p r o c e s s , t h e shock v e l o c i t y i n c r e a s e s f o r a c o n s i d e r a b l e d i s t a n c e and o n l y t h e n e x h i b i t s t h e decay t h a t one would e x p e c t f r o m boundary l a y e r growth . I t h a s been shown t h e o r e t i c a l l y t h a t t h i s s low a c c e l e r a t i o n may e a s i l y y i e l d v e l o c i t i e s which a r e s l i g h t l y above t h e t h e o r e t i c a l v e l o c i t y f o r t h a t b u r s t i n g p r e s s u r e r a t i o . S i n c e t h i s is t h e f o r m a t i v e p e r i o d f o r t h e shock wave, i t is b e s t t o make k i n e t i c measurements o u t s i d e of t h i s r e g i o n . T h i s r e g i o n e x t e n d s f o r a d i s t a n c e from t h e diaphragm c lamp which is a f u n c t i o n of t h e d iaphragm m a t e r i a l , t h e b u r s t i n g p r e s s u r e r a t i o and t h e t u b e d i a m e t e r . White72 r e p n r t s an accelerat ing E ~ I O C ~ 40' f ren t h e clamp w i t h a metal d iaphragm i n a 3 1/4" s q u a r e t u b e at M = 1 5 i n argon. However a t a shock Mach number of 8 he found t h a t t h e maximum v e l o c i t y o c c u r r e d o n l y 12 f e e t f rom t h e diaphragm. I f one r e m a i n s c l e a r of t h i s a c c e l e r a t i n g r e g i o n t h e ma jo r problem which may a r i s e from t h e diaphragm b u r s t i n g p r o c e s s is t h e problem of l a t e s p u r i o u s p r e s s u r e s i g n a l s from m a t e r i a l s s u c h a s m y l a r .
White75 and Alphe r and White73 have

11.
O t h e r f low n o n - i d e a l i t i e s t h a t o c c u r i n a shock t u b e d u r i n g t h e l a t e f low a r e a l l c o n n e c t e d t o t h e deve lopment of t h e boundary l a y e r b e h i n d t h e i n c i d e n t s h o c k . These e f f e c t s have b e e n r e v i e w e d by S e n c e and Woods75 and by Holbeche and Spence76. i n a number of p a p e r s h a s d i s c u s s e d t h e s e r i o u s n e s s of t h i s problem. I f one assumes a n i d e a l d iaphragm b u r s t it has been f o u n d t h a t t h e f l o w e s s e n t i a l l y d i v i d e s i t se l f i n t o two r e g i m e s . The f i r s t of t h e s e is a p e r i o d when t h e s h o c k is d e c a y i n g due t o t h e boundary l a y e r g rowth . Dur ing t h i s p e r i o d , t h e l e n g t h of t h e h o t column o f tes t g a s is growing a t a r e a s o n a b l y c o n s t a n t r a t e t h a t is somewhat below t h e t h e o r e t i c a l r a t e p r e d i c t e d by i d e a l t h e o r y . A f t e r t h i s i n i t i a l p e r i o d t h e boundary l a y e r h a s grown t o s u c h a n e x t e n t t h a t it is a c c u m u l a t i n g t e s t g a s f rom t h e ma in sample a t t h e same r a t e a s t h e i n c i d e n t shock is a c c u m u l a t i n g new t e s t g a s . I n t h i s s i t u a t i o n , t h e ra te o f decay i n t h e i n c i d e n t shock v e l o c i t y becomes less t h a n b e f o r e and t h e l e n g t h o f t h e test g a s colug8 becomes r e l a t i v e l y c o n s t a n t . T h i s e f f e c t w a s f i r s t r e p o r t e d by Duff R e c e n t l y Fox, McLaren and HobsonS3 have shown t h a t Mirel 's t h e o r y q u i t e a d e q u a t e l y p r e d i c t s t h e o b s e r v e d b e h a v i o r .
I n a d d i t i o n , M i r e l ~ ~ ~ , ~ ~ , 79,80y 81,
.
T h e r e a r e t w o d i s t i n c t l y d i f f e r e n t t y p e s of c o r r e c t i o n s n e c e s s a r y be- c a u s e of t h e s e f l o w n o n - i d e a l i t i e s . I n t h i s p a p e r t h e e f f e c t s of non- idea l f l o w w i l l be d i s c u s s e d f o r o n l y t h e s t a t e p r o p e r t y t e m p e r a t u r e b e c a u s e r e a c t i o n r a t e s a r e p r i m a r i l y t e m p e r a t u r e s e n s i t i v e . I n t h e f i r s t p l a c e t h e s h o c k wave is c o n t i n u a l l y d e c e l e r a t i n g -- a t f i r s t r a p i d l y and l a t e r s l o w l y -- and t h i s i n t r o d u c e s a t e m p e r a t u r e g r a d i e n t i n t h e g a s sample which c a n be l a r g e . T h i s t e m p e r a t u r e g r a d i e n t may be c a l c u l a t e d i f o n e assumes t h a t t h e shock a t t e n u a t e s a t a s p e c i f i c r a t e and t h a t t h e r e a re t w o p o s s i b l e l i m i t b e h a v i o r s f o r t h e p r e s s u r e decay beh ind t h e f r o n t . These a r e : 1. Each f l u i d e l emen t r e t a i n s its shock t r a n s i t i o n p r e s s u r e . I n t h i s case t h e g a s c o n t a i n s a r e l a t i v e l y s t e p p r e s s u r e g r a d i e n t due t o a t t e n u a t i o n and 2 . Each e l emen t of gas a f t e r shock compress ion , is i s e n t r o p i c a l l y expanded t o t h e i n s t a n t a n e o u s shock t r a n s i t i o n p r e s s u r e . The r e a l b e h a v i o r b e h i n d t h e d e c a y i n g s h o c k l i e s somewhere between these two l i m i t b e h a v i o r s . T h e s e two a s s u m p t i o n s y i e l d t h e f o l l o w i n g e q u a t i o n s f o r t h e t e m p e r a t u r e g r a d i e n t i n t h e gas f o l l o w i n g t h e shock wave.
1. With a r e s i d u a l p r e s s u r e g r a d i e n t (no p r e s s u r e change a f t e r shock t r a n s i t i o n )
2 . With i s e n t r o p i c e x p a n s i o n
F i g u r e 8 is a p l o t o f T 2 / m i l l i s e c o n d i n t h e f l o w b e h i n d a shock wave i n a r g o n w i t h a n a t t e n u a t i o n r a t e of 1% p e r meter, A s t h i s f i g u r e shows, t h e g r a d i e n t s a re s i z a b l e and v e r y dependent o n t h e t e s t i n g t e m p e r a t u r e
The second c o r r e c t i o n h a s been e s t i m a t e d by Mirelsgl o n t h e b a s i s of a ' boundary l a y e r deve lopment t h e o r y . I n h i s t h e o r y f o r t h e l a t e f l o w he assumes a c o n s t a n t v e l o c i t y shock wave p r o p a g a t i n g down t h e t u b e and he c a l c u l a t e s t h e c h a n g e s i n f l o w p r o p e r t i e s a l o n g t h e t u b e a x i s due t o
T2 *
12.
the boundary layer growth. His results are plotted as a function of the dimensionless distance from the shock wave l/lm where 1, is the equilibrium length of the hot gas column. In general he finds that all state properties increase in value as one travels away from the shock. Specifically for a gamma = 5/3 gas at M = 3 he finds that the temperature rises to about 1.07 T2 at a distance 1 = 0.2 IF and then remains relatively constant for the remainder of the transit time. However he finds that an even more serious correction than this is the correction to the testing time that must be included for strong shocks Specifically, the real testing time for a strong shock increases rapidly over the ideal testing time and at a position 1 = 0.2 1, the real testing time is 3/2 of the ideal testing time. This has been verified quantitatively by Fox, McLaren and H ~ b s o n ~ ~ .
The non-ideal temperature drifts caused by the effects of shock velocity attenuation and boundary layer growth are in the same direction (each yielding a temperature increase as one travels away from the shock) and they may be added to a good first approximation. The testing time correction augments both of these temperature gradients 1 and can in itself cause large errors if ideal flow is assumed. It appears as though some of the extant reaction kinetic data obtained in shock tubes should be re-evaluated in the light of these developments. It should be pointed out that these corrections can change the apparent activation energy of the reaction as well as the absolute rate because in all cases the correction becomes more severe as the run temperature increases.
i
\
: In the previous discussion it was implied that dilution with an inert monatomic gas is desirable for accurate kinetic rate measurements. Modica and La Graff84 have recently studied the decomposition of N2F4 using both argon and nitrogen as a diluent and their comparative re- sults reinforce the contention that monatomic gas dilution is i
necessary to reduce the ambiguity of results. In another interesting experiment along these same lines Seery and B r i t t ~ n ~ ~ have shown that xenon is apparently not a completely inert diluent during the dissociation of fluroine.
11. Reflected-Shock Time-Resolved Techniques
Rate measurements made behind the reflected shock offer certain advantages over measurements made using the incident technique. In particular, sampling with a time-of-flight or quadrapole mass spectrometer is possible and laboratory time is real time because the gas is relatively quiescent in the neighborhood of the end-wall. Also, for the same initial conditions the reflected technique produces considerably high temperatures than an incident technique.
I
In this section we will discuss some difficulties exhibited by only the simplest time-resolved reflected techniques, those in which a sample is drawn from the end wall for mass spectrometer analysis or in which an emission or absorption spectroscopic technique is Used to observe a gas sample trapped near the back wall. In these cases the initial temperature behind a reflected shock may be calculated quite accurately from the incident shock velocity measured at the moment of impact, assuming that the gas is entirely inert. The shock velocity at impact must be determined by extrapolating upstream measurements and the calculation is only valid for the case where the reactant is highly diluted with a monatomic carrier gas,. As in the case of incident measurements, if it is not possible to extrapolate
13 t h e r a t e t o t h e shock , c o r r e c t i o n s f o r t h e f l o w n o n - i d e a l i t i e s must be i n c l u d e d t o a c c u r a t e l y d e t e r m i n e t h e r a t e s .
Boundary l a y e r c o r r e c t i o n s are s t i l l i m p o r t a n t i n t h i s case. I f o n e o p e r a t e s n e a r t h e back w a l l ( w i t h i n a p p r o x i m a t e l y 5mm of t h e back w a l l ) t h e t e s t i n g t i m e c o r r e c t i o n ceases t o b e i m p o r t a n t and i f o n e o p e r a t e s w i t h a monatomic c a r r i e r g a s , b i f u r c a t i o n p rob lems a r e no t s e r i o u s 8 6 . However t h e p r e s s u r e r i s e i n t h e g a s t r a v e l i n g beh ind t h e i n c i d e n t shock d o e s c a u s e a s e r i o u s p e r t u r b a t i o n t o t h e p r e s s u r e - t i m e and t empera tu re - t ime h i s t o r y of t h e g a s s a m p l e t r a p p e d n e a r t h e back w a l l . A s t h e r e f l e c t e d shock p r o p a g a t e s away f rom t h e back w a l l , it e n c o u n t e r s t h i s p r e s s u r e i n c r e a s e and t r a n s m i t s s i g n a l s t o t h e g a s a t t h e back w a l l . F o r t u n a t e l y t h e sample n e a r t h e back w a l l is compressed i s e n - t r o p i c a l l y d u r i n g t h i s p r o c e s s and f o r a monatomic g a s t h e t e m p e r a t u r e i n c r e a s e may b e e s t i m a t e d r a t h e r a c c u r a t e l y u s i n g t h e e q u a t i o n :
Thus a p r e s s u r e gauge may b e u s e d t o m o n i t o r t h e ra te o f p r e s s u r e change a t t h e back w a l l a n d t h i s r a t e o f change may b e u s e d t o e s t i m a t e t h e e q u i v a l e n t t e m p e r a t u r e d r i f t n e a r t h e back w a l l . A l t e r n a t e l y , Mi re l s ’ theo ry may be used i n c o n j u n c t i o n w i t h R u d i n g e r ’ s s i m p l i f i e d method of c h a r a c t e r i s t i c s a n a l y s i s 8 7 t o c a l c u l a t e a p r e s s u r e and t e m p e r a t u r e change a t t h e back w a l l f o r t h e p a r t i c u l a r shock t u b e and i n i t i a l c o n d i t i o n s o f t h e e x p e r i m e n t .
I n t h e c a s e of mass s p e c t r o m e t e r a n a l y s e s s a m p l i n g t e c h n i q u e s are i m p o r t a n t and t h e c o r r e c t i o n f o r h e a t t r a n s f e r t o t h e w a l l s h o u l d be c o n s i d e r e d i n any c a l c u l a t i o n 8 8 . These c o r r e c t i o n s a r e r e a s o n a b l y s t r a i g h t f o r w a r d , however, s i n c e i n t h i s t i m e sca le c o n v e c t i o n does not o c c u r . T h e r e f o r e , o n l y a c o n d u c t i o n e q u a t i o n need b e s o l v e d t o d e t e r m i n e t h e n e c e s s a r y c o r r e c t i o n . Heat t r a n s f e r can a l s o be i m p o r t a n t i n s p e c t r o s c o p i c t e c h n i q u e s b e c a u s e a b s o r p t i o n i n t h e cold boundary l a y e r g a s e s a t t h e w a l l c a n c o m p l e t e l y domina te t h e measurement i n c e r t a i n cases89. a p p a r a t u s t o c i r cumven t t h i s d i f f i c u l t y .
I n a d d i t i o n t o t h e above , r e f l e c t e d - s h o c k , t i m e - r e s o l v e d t e c h n i q u e s s u f f e r from t w o u n i q u e d i f f i c u l t i e s related t o the c h e m i s t r y . I n t h e f i r s t p l a c e , t h e o c c u r r e n c e of c h e m i c a l r e a c t i o n b e h i n d t h e i n c i d e n t shock canno t a lways D e d i s m i s s e d i n a n 2 p s i o r i manner b u t s h o u l d be examined f o r e a c h e x p e r i m e n t a l s y s t e m . T h i s problem is p a r t i c u l a r l y s e r i o u s f o r a f i r s t o r d e r r e a c t i o n w i t h a r e l a t i v e l y l o w a c t i v a t i o n ene rgy and c o u l d a l s o b e s e r i o u s f o r a second order r e a c t i o n w i t h a v e r y low a c t i v a t i o n . I n t h e s e c o n d p l a c e , t h e o c c u r r e n c e of a r e a c t i o n b e h i n d t h e r e f l e c t e d shock l e a d s t o a non-steady r e f l e c t e d shock b e h a v i o r . T h e r e a r e t w o r e a s o n s f o r t h i s ; e i t h e r t h e m o l e c u l a r we igh t o r t h e e n t h a l p y of t h e g a s may change due t o t h e o c c u r r e n c e of t h e c h e m i c a l r e a c t i o n . By f a r t h e most i m p o r t a n t of t h e s e t w o changes unde r o r d i n a r y c o n d i t i o n s is t h e e n t h a l p y change a s s o c i a t e d w i t h t h e r e a c t i o n p r o c e s s . I f a n endo the rmic r e a c t i o n o c c u r s b e h i n d t h e re- f l e c t e d shock , t h e shock wave w i l l decelerate and t h i s w i l l c a u s e a p r e s s u r e d e c r e a s e and a n a t t e n d a n t i s e n t r o p i c t e m p e r a t u r e d e c r e a s e a t t h e back w a l l . of t h i s f l o w and a d e t a i l e d method of cha rac t e r i s t i c c a l c u l a t i o n of t h e i n t e r a c t i o n f o r t h e v i b r a t i o n a l r e l a x a t i o n of oxygen h a s been r e p o r t e d by N a f ~ i n g e x - 9 ~ .
A l l e n , T e x t o r i s and Wilsongg have d e v e l o p e d a n i n g e n i o u s
Johnson and B r i t t o n g o have d i s c u s s e d t h e ma in f e a t u r e s
H e found t h a t t h e s h o c k r e l a x a t i o n p r o c e s s
14.
t o o k a p p r o x i m a t e l y 7 rv where rd is t h e c h a r a c t e r i s t i c r e l a x a t i o n t i m e b e h i n d t h e r e f l e c t e d s h o c k a t t h e back w a l l . H e a l s o obse rved t h a t t h i s non-s teady p r o c e s s l e d t o a s u b s t a n t i a l r e s i d u a l e n t r o p y g r a d i e n t a l o n g t h e t u b e a x i s i n t h e ne ighborhood of t h e back w a l l . The e f f e c t o f e x o t h e r m i c r e a c t i o n s w i l l be d i s c u s s e d i n S e c t i o n IVb.
111. S i n g l e P u l s e Techn iques
S i n g l e p u l s e t echn iquesg3 s u f f e r from a number of r e l a t i v e l y d i s t i n c t p roblems. I n t h i s r e v i e w e r ' s o p i n i o n , t h e sum t o t a l o f t h e s e d e f i - c i e n c i e s are s e r i o u s enough t o make t h e t e c h n i q u e v e r y d i f f i c u l t , f o r q u a n t i t a t i v e k i n e t i c s t u d i e s . I t is, however, s t i l l a u s e f u l t e c h n i q u e f o r q u a l i t a t i v e and c o m p a r a t i v e s t u d i e s f o r new or complex s y s t e m s .
L e t u s f i r s t c o n s i d e r t h o s e d i f f i c u l t i e s t h a t are i n h e r e n t i n a s i n g l e p u l s e expe r imen t p e r f o r m e d w i t h a n i d e a l shock t u b e . Even i n t h i s c a s e , t h e r e are f i v e ma jo r problems which l i m i t t h e t e c h n i q u e ' s u t i l i t y . These are: 1. A n a l y s e s a r e per formed a f t e r t h e expe r imen t is comple ted . Thus o n l y s t a b l e p r o d u c t s may be i d e n t i f i e d and , a t b e s t , o n l y t h e s y s t e m s o v e r a l l b e h a v i o r may be s t u d i e d . T h e r e f o r e t h e d e d u c t i o n o f r e s p o n s i b l e i n d i v i d u a l r e a c t i o n s w i t h a concordan t d e t e r m i n a t i o n o f t h e i r rates is v e r y d i f f i c u l t . 2 . The h e a t i n g c y c l e is n o t t h e same f o r t h e e n t i r e g a s sample . T h e r e f o r e , a n a v e r a g e p r o c e s s i n g t i m e must be esti- mated f o r t h e r u n . 3. C o n t a c t s u r f a c e t a i l o r i n g is n e c e s s a r y t o o b t a i n l o n g test t i m e s and t h e r e b y r e d u c e t h e errors c a u s e d by t h e a v e r a g i n g p r o c e s s ment ioned i n P a r t 2 above . However o f f - d e s i g n t a i l o r i n g w i l l c a u s e s u b s t a n t i a l t e m p e r a t u r e changes d u r i n g t h e las t (and u s u a l l y major ) p a r t o f t h e t e s t i n g t i m e and t h i s is s e r i o u s i f t h e r e a c t i o n h a s a high t e m p e r a t u r e s e n s i t i v i t y . 4. C o o l i n g must n e c e s s a r i l y be produced by a r a r e f a c t i o n f a n and t h i s i n t r o d u c e s y e t a n o t h e r u n c e r t a i n t y i n t o t h e c a l - c u l a t e d t e s t i n g t i m e . 5. I f the r e a c t i o n i s n o t t h e r m a l l y n e u t r a l , e f f e c t s of s e l f - h e a t i n g must be i n c l u d e d . These l as t t w o problems have been d i s c u s s e d b y Pa lmer , b o x and McHaleg4.
The n o n - i d e a l i t y of a real shock t u b e f low compounds t h e s e problems. By f a r t h e most s e r i o u s n o n - i d e a l i t y is t h e growth of t h e boundary l a y e r b e h i n d t h e i n c i d e n t shock . T h i s l e a d s t o t h r e e d i s t i n c t d i f f i c u l t i e s which c a u s e problems. I n t h e first p l a c e t h e t e m p e r a t u r e c a n n o t be h e l d c o n s t a n t f o r t h e d e s i r e d t e s t i n g t i m e because t h e upward d r i f t is a lways a p p r e c i a b l e on a t i m e scale of 1 t o 4 m i l l i - s e c o n d s . Second ly , t a i l o r i n g c a n n o t be e x a c t because of t h e sh i f - t - i n p r o p e r t i e s c a u s e d b y t h e boundary l a y e r growth . T h i r d l y , t h e growing boundary l a y e r c a n e n t r a i n a sizable q u a n t i t y of t h e test g a s . There- fore t h e e n t i r e r e a c t i v e sample is n o t t r e a t e d by t h e t e s t p u l s e . T h i s l as t d i f f i c u l t y is p a r t i c u l a r l y s e r i o u s i f t h e e n t i r e c o n t e n t s of t h e t u b e are b e i n g a n a l y z e d a f t e r t h e r u n and may be a l l e v i a t e d t o some e x t e n t by a n a l y z i n g o n l y t h a t p o r t i o n o f t h e test g a s t h a t was i n t h e ne ighborhood o f t h e back w a l l d u r i n g t h e p u l s e c y c l e .
The m a j o r i t y of t h e d i f f i c u l t i e s ment ioned above C ~ I I S C errors in bcrtb t h e a c t i v a t i o n e n e r g y a n d t h e a c t u a l magni tude of t h e r a t e measured w i t h a s i n g l e p u l s e t u b e . T h i s is b e c a u s e t h e s e v e r i t y of most of t h e s e c o r r e c t i o n s i n c r e a s e as t h e t e m p e r a t u r e of the test r u n i n c r e a s e s .
T h e r e have been many v a r i a t i o n u l s e t e c h n i q u e i n t r o d u c e d i n t h e p a s t few y e a r s . Tsang , 15%:$5, ~ ~ % ~ l ~ o for example , h a s a p p l i e d t h e t e c h n i q u e t o t h e s t u d y of hydrocarbon decompos i t ion and r ea r r angemen t r e a c t i o n s u s i n g a m i x t u r e t h a t c o n t a i n s a small q u a n t i t y of "p ropy l c h l o r i d e " as a trace r e a c t a n t . T h i s s p e c i e is u s e d t o i n d e p e n d e n t l y
o b t a i n i n f o r m a t i o n on t h e t empera tu re - t ime p u l s e so a s t o i n c r e a s e t h e a c c u r a c y of t h e e x p e r i m e n t a l decompos i t ion measurement . T h i s t y p e of " t r a c e r e a c t i o n " t e c h n i q u e h a s u t i l i t y o n l y i f it c a n b e proved i n a n unambiguous manner t h a t t h e t r a c e r e a c t i o n is o c c u r r i n g independen t ly o f t h e unknown r e a c t i o n . I t s h o u l d have t h e h i g h e s t a c c u r a c y when t h e a c t i v a t i o n e n e r g i e s of t h e two r e a c t i o n s a r e a p p r o x i m a t e l y e q u a l .
T S C h U C h i k 0 w - R o ~ x ~ ~ ~ ~ l 0 2 , 103 h a s p roposed a b a l l v a l v e t e c h n i q u e which may be used t o i s o l a t e a sample e i t h e r be tween t h e b a l l v a l v e and t h e end p l a t e of t h e t u b e or j u s t i n t h e b o r e of t h e b a l l v a l v e . However, h i s h e a t i n g c y c l e a n a l y s i s is based on ideal shock t u b e f l o w t h e o r y and s i n c e h e p r o p o s e s t o c a l c u l a t e h e a t i n g t i m e by s u b t r a c t i n g two l a r g e t i m e s which a r e t h e m s e l v e s c a l c u l a t e d by u s i n g i d e a l t h e o r y , t h e a c c u r a c y of h i s c a l c u l a t i o n w i l l be l o w . However, t h e r e is t h e p o s s i - b i l i t y of improving t h e a c c u r a c y by i n c l u d i n g t h e n e c e s s a r y boundary l a y e r growth c o r r e c t i o n s . ,
L i f s h i t z , Bauer and Res le r1°4 have i n t r o d u c e d and used a t u b e w i t h a s i d e dump t a n k on t h e t e s t s e c t i o n l e g . I n c o n j u n c t i o n w i t h t h i s t h e y o p e r a t e t h e t u b e w i t h o u t a t a i l o r e d i n t e r f a c e . I n s t e a d t h e y " tune" t h e l e n g t h of t h e d r i v e r s e c t i o n by i n s e r t i n g p l u g s a t t h e end w a l l SO t h a t t h e s t r o n g r a r e f a c t i o n f a n i n t h e d r i v e r gas , a f t e r r e f l e c t i n g from t h e end of t h e d r i v e r s e c t i o n , w i l l o v e r t a k e t h e c o n t a c t s u r f a c e a t t h e i n s t a n t t h a t i t is m e t by t h e r e f l e c t e d shock wave. Thus, t e s t i n g t i m e i n t h e sample t h e o r e t i c a l l y r a n g e s from z e r o t o a p p r o x i m a t e l y 2 tave. The t e c h n i q u e s u f f e r s , however, f rom t h e f a c t t h a t non- idea l boundary l a y e r growth w i l l a lways c a u s e t h e c o n t a c t s u r f a c e t o i n t e r s e c t t h e r e f l e c t e d shock e a r l i e r t h a n t h e t h e o r e t i c a l t i m e . I f t h i s e f f e c t is no t i n c l u d e d i n the " tun ing" o p e r a t i o n t h e t e s t g a s sample w i l l s u f f e r a complex t ime- t empera tu re h e a t i n g c y c l e and t h e i n t e r p r e t a t i o n of t h e d a t a w i l l be d i f f i c u l t . The p r e s e n c e of a s i d e dump t a n k m o d i f i e s t h e downstream f low i n t h e test s e c t i o n bu t a r e a s o n a b l e c o n s t a n t shock v e l o c i t y is s t i l l a t t a i n e d n e a r t h e end p l a t e . The s ide dump t a n k is used p r i m a r i l y t o p r e v e n t m u l t i p l e h i g h p r e s s u r e r e f l e c t i o n s i n t h e g a s sample . I t is p r o b a b l y a d e q u a t e f o r t h i s pu rpose .
I V . Exothermic System I n s t a b i l i t i e s
I n a d d i t i o n t o a l l t h e d i f f i c u l t i e s ment ioned above, i n exo the rmic s y s t e m s t h e a p p l i c a t i o n of t h e shock t u b e t o r e a c t i o n k i n e t i c s t u d i e s is l i m i t e d by t h e o c c u r r e n c e of non-steady f l o w p r o c e s s e s which may be t r i g g e r e d by t h e p r e s e n c e of t h e exo the rmic r e a c t i o n . S p e c i f i c a l l y , two d i s t i n c t t y p e s of f low i n s t a b i l i t i e s may o c c u r and it h a s been found t h a t two independent c r i t e r i a may be u s e d t o p r e d i c t t h e o c c u r r e n c e of t h e s e i n s t a b i l i t i e s on t h e b a s i s of known f l o w p r o p e r t i e s of t h e p a r t i c u l a r sys tem which is under i n v e s t i g a t i o n . The t w o c r i t e r i a w i l l be c a l l e d t h e Chapman-Jouguet c r i t e r i o n and t h e t u b e d i a m e t e r c r i t er i o n .
a . The Chapman-Jouguet C r i t e r i o n
C o n s i d e r a gas m i x t u r e c a p a b l e of s u s t a i n i n g a r e a c t i o n which d r i v e s t h e s y s t e m toward a s t a t e of f u l l chemica l e q u i l i b r i u m . With t h i s res t r ic t i o n w e d e f i n e t h e m i x t u r e t o be "exothermic" i f , i n t h e (P,V) p l a n e , t h e R a y l e i g h l i n e t h r o u g h t h e p o i n t (P1,V1) which j u s t t a n g e n t s t h e e q u i l i b r i u m Hugoniot r e p r e s e n t s a shock t r a n s i t i o n whose Mach number, MGJ, is g r e a t e r t h a n u n i t y . c a l l t h e v a l u e of t h i s minimum ach number f o r s t e a d y shock p ropaga t i o n t h e Chapman-Jouguet c r i t e r i o n f o r i n s t a b i l i t y . I t
We
16.
may, of c o u r s e , be c a l c u l a t e d q u i t e a c c u r a t e l y i f thermodynamic p r o p e r t i e s a r e a v a i l a b l e f o r t h e sys tem i n q u e s t i o n ,
An example o f t h e a p p l i c a t i o n of t h i s c r i t e r i o n may b e d i s c u s s e d w i t h t h e h e l p o f F i g u r e 9 . The s y s t e m c o n s i d e r e d i n t h i s f i g u r e is a s t o i c h i o m e t r i c hydrogen-oxygen m i x t u r e d i l u t e d w i t h v a r i o u s amounts of a r g o n a t t h e i n i t i a l c o n d i t i o n s T = 300°K and P = 100 torr . number M = MCJ is p l o t t e d v e r s u s t h e m i x t u r e c o m p o s i t i o n i n t h i s f i g u r e . The v e r t i k a l l i n e s approx ima te r e g i o n s i n which s t u d i e s h a v e been r e p o r t e d , a d m i t t e d l y f o r d i f f e r e n t s t o i c h i o m e t r i c s and p r e s s u r e l e v e l s ( t h e numbers o n t h e l i n e s a r e r e f e r e n c e numbers). The approximat i o n is r e a s o n a b l y good because , however, p r e s s u r e s h i f t s t h e c u r v e i n F i g u r e 9 o n l y s l i g h t l y and s t o i c h i o m e t r y changes a r e e f f e c t i v e l y d i l u t i o n changes on t h e b a s i s o f a CJ c a l c u l a t i o n . Region I, above and t o t h e l e f t of t h e s t a b i l i t y l i n e M = M ~ J , c o r r e s p o n d s t o t h e e x p e r i m e n t a l c o n d i t i o n s unde r which s t e a y i n c i - den t shock waves may be produced and s t u d i e d i n t h i s system, w h i l e r e g i o n 11, below and t o the r i g h t o f t h e s t a b i l i t y c u r v e r e p r e s e n t s i n i t i a l shock c o n d i t i o n s f o r which a s t e a d y shock wave w i t h c h e m i c a l r e a c t i o n c a n n o t e x i s t . Note t h a t B e l l e s and =erlo7 worked w i t h i n c i d e n t shocks j u s t a t t h e edge of r e g i o n I and t h a t a l l o t h e r e x t a n t i n c i d e n t shock s t u d i e s were pe r fo rmed w e l l i n s i d e r e g i o n I . I t is i n t e r e s t i n g t h a t Belles and Lauver r e p o r t i n s t a b i l i t y d i f f i c u l t i e s at low t e m p e r a t u r e s .
I n r e g i o n I1 of F i g u r e 1, k i n e t i c s t u d i e s must n e c e s s a r i l y b e p e r - formed i n c o n j u n c t i o n w i t h a f l o w which is l o n g i t u d i n a l l y non- s t e a d y . For t h i s r e a s o n w e l l c o n t r o l l e d and r e p r o d u c i b l e i n i t i a l c o n d i t i o n s a r e i m p o r t a n t t o t h e d e s i g n of these e x p e r i m e n t s . Fo r example , t h e s i m p l e f a c t t h a t t h e i n i t i a l f l o w produced by t h e d iaphragm b u r s t i n g p r o c e s s is n e i t h e r one -d imens iona l nor r e p r o d u c i b l e o b v i a t e s t h e u s e of a c o n v e n t i o n a l i n c i d e n t shock t e c h n i q u e for r e g i o n I1 s t u d i e s . The re are, however, f o u r shock t u b e t e c h n i q u e s which e i t h e r have been used or have a p o t e n t i a l u s e f o r pe r fo rming k i n e t i c s t u d i e s under r e g i o n I 1 c o n d i t i o n s . These w i l l be d i s c u s s e d i n d i v i d u a l l y .
The f i r s t of these t e c h n i q u e s u s e s t h e r e f l e c t e d shock r e g i o n . R e f l e c t e d shock s t u d i e s , when per formed i n a g a s m i x t u r e w i t h a h i g h h e a t c a p a c i t y ratio, y i e l d a r e a s o n a b l y one-d imens iona l h e a t - i n g c y c l e w i t h w e l l d e f i n e d i n i t i a l condition^^^. t h e f l o w f o l l o w i n g r e f l e c t i o n r e m a i n s non-s teady f o r a n ex tended p e r i o d of t i m e (and i n d e e d may y i e l d a d e t o n a t i o n wave p r o p a g a t i n g away from t h e end w a l l ) t h e g a s n e a r t h e end w a l l may be used f o r k i n e t i c s t u d i e s s i n c e it is q u i e s c e n t , it s u f f e r s no a d d i t i o n a l shock t r a n s i t i o n s a f t e r r e f l e c t e d shock p a s a g e and its p r e s s u r e - t i m e h i s t g s y d u r i n g t h e r e a c t i o n p r o c e s s may be p r e d i c t e d r eason- a b l y w e l l . T h i s t e c h n i u e has been used s u c c e s s f u l l y by numerous i n v e s t i g a t n r s 5 4 , ? 0 5 ; 106 i~ sit:ati=r,s where the steady i n c i d e n t t e c h n i q u e would no t be a p p l i c a b l e i n terms of t h e C J c r i t e r i o n .
The u n r e a c t i v e shock t e m p e r a t u r e $or a shock of hach
Even though
The second t e c h n i q u e c o n s i s t s of p a s s i n g a weak, b u t w e l l e s t a b l i s h e d , s t e p s h o c k - wave p roduced i n a c o n v e n t i o n a l c o n s t a n t a r e a shock t u b e i n t o and t h r o u g h a s e c t i o n of t u b i n g whose cross s e c t i o n a l a r e a is s l o w l y d e c r e a s i n g w i t h d i s t a n c e . I f t h e r a t e o f d e c r e a s e of a r e a is s u f f i c i e n t l y slow ( a maximum w a l l a n g l e t o t h e c e n t e r l i n e o f a p p r o x i m a t e l y lo f o r example ) t h e f l o w w i l l become a q u a s i one-
,,
d i m e n s i o n a l non- s t eady f l o w i n which t h e l e a d i n g shock wave 1s i
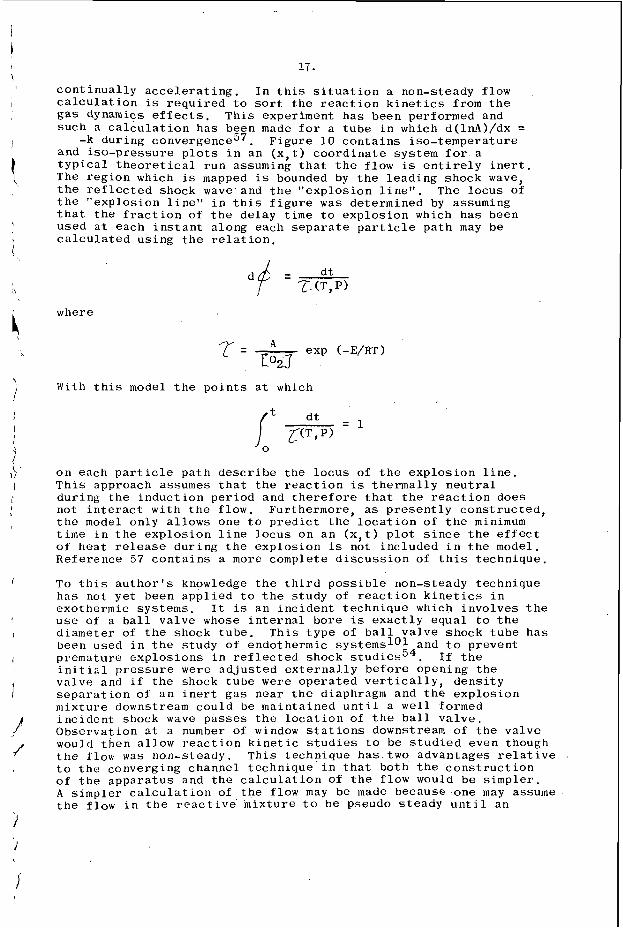
17.
C o n t i n u a l l y a c c e l e r a t i n g . I n t h i s s i t u a t i o n a non-s teady f l o w c a l c u l a t i o n is r e q u i r e d t o sort t h e r e a c t i o n k i n e t i c s from t h e g a s dynamics e f f e c t s . T h i s expe r imen t h a s b e e n pe r fo rmed and s u c h a c a l c u l a t i o n h a s been made f o r a t u b e i n which d( lnA)/dx =
and i s o - p r e s s u r e p l o t s i n a n ( x , t ) c o o r d i n a t e s y s t e m for a t y p i c a l t h e o r e t i c a l r u n assuming t h a t t h e f l o w is e n t i r e l y i n e r t . The r e g i o n which is mapped is bounded by t h e l e a d i n g s h o c k wave, t h e r e f l e c t e d shock wave and t h e " e x p l o s i o n l i n e " . The l o c u s of t h e " e x p l o s i o n l i n e " i n t h i s f i g u r e w a s d e t e r m i n e d by assuming t h a t t he f r a c t i o n of t h e d e l a y t l m e t o e x p l o s i o n which h a s been u s e d a t e a c h i n s t a n t a l o n g each s e p a r a t e p a r t i c l e p a t h may be c a l c u l a t e d u s i n g t h e r e l a t i o n .
-k d u r i n g c ~ n v e r g e n c e ~ ~ . F i g u r e 10 c o n t a i n s i s o - t e m p e r a t u r e
df = - dt L- 0, P)
where
With t h i s model t h e p o i n t s a t which
o n e a c h p a r t i c l e p a t h d e s c r i b e t h e l o c u s of t h e e x p l o s i o n l i n e . T h i s approach assumes t h a t t he r e a c t i o n is t h e r m a l l y n e u t r a l d u r i n g t h e i n d u c t i o n p e r i o d and t h e r e f o r e t h a t t h e r e a c t i o n d o e s n o t i n t e r a c t w i t h t h e f l o w . Fur the rmore , a s p r e s e n t l y c o n s t r u c t e d , t h e model o n l y a l l o w s one t o p r e d i c t t h e l o c a t i o n of t h e minimum time i n t h e e x p l o s i o n l i n e l o c u s o n a n ( x , t ) p l o t s i n c e t h e e f f e c t o f h e a t r e l e a s e d u r i n g t h e e x p l o s i o n is no t i n c l u d e d i n t h e model. R e f e r e n c e 57 c o n t a i n s a more comple t e d i s c u s s i o n of t h i s t e c h n i q u e .
To tliis a u t h o r ' s knowledge t h e t h i r d p o s s i b l e non-s teady t e c h n i q u e h a s n o t y e t been a p p l i e d t o t h e s t u d y of r e a c t i o n k i n e t i c s i n e x o t h e r m i c s y s t e m s . I t is a n i n c i d e n t t e c h n i q u e which i n v o l v e s t h e u s e of a b a l l v a l v e whose i n t e r n a l b o r e is e x a c t l y e q u a l t,o t h e d i a m e t e r of t h e shock t u b e . T h i s t y p e of b a l l v a l v e s h o c k t u b e h a s been used i n t h e s t u d y o f endo the rmic sys t ems lo l and t o p r e v e n t p r e m a t u r e e x p l o s i o n s i n r e f l e c t e d shock s t u d i e s 5 4 . i n i t i a l p r e s s u r e were a d j u s t e d e x t e r n a l l y b e f o r e o p e n i n g t h e v a l v e and i f t h e shock t u b e were o p e r a t e d v e r t i c a l l y , d e n s i t y s e p a r a t i o n of a n i n e r t g a s n e a r t h e d iaphragm and t h e e x p l o s i o n m i x t u r e downstream c o u l d be m a i n t a i n e d u n t i l a w e l l fo rmed i n c i d e n t shock wave p a s s e s t he l o c a t i o n of t h e b a l l v a l v e . O b s e r v a t i o n a t a number of window s t a t i o n s downstream of t h e v a l v e would t h e n a l low r e a c t i o n k i n e t i c s t u d i e s t o be s t u d i e d e v e n though t h e flow was non-s teady . T h i s t e c h n i q u e h a s . t w o . a d v a n t a g e s r e l a t i v e . t o t h e c o n v e r g i n g c h a n n e l t e c h n i q u e i n t h a t b o t h t he c o n s t r u c t i o n of t h e a p p a r a t u s and t h e c a l c u l a t i o n o f t h e f l o w would b e s i m p l e r . A s i m p l e r c a l c u l a t i o n of t h e f low may be made b e c a u s e . o n e may assume t h e f l o w i n t h e r e a c t i v e ' m i x t u r e t o b e pseudo s teady u n t i l a n
If t h e
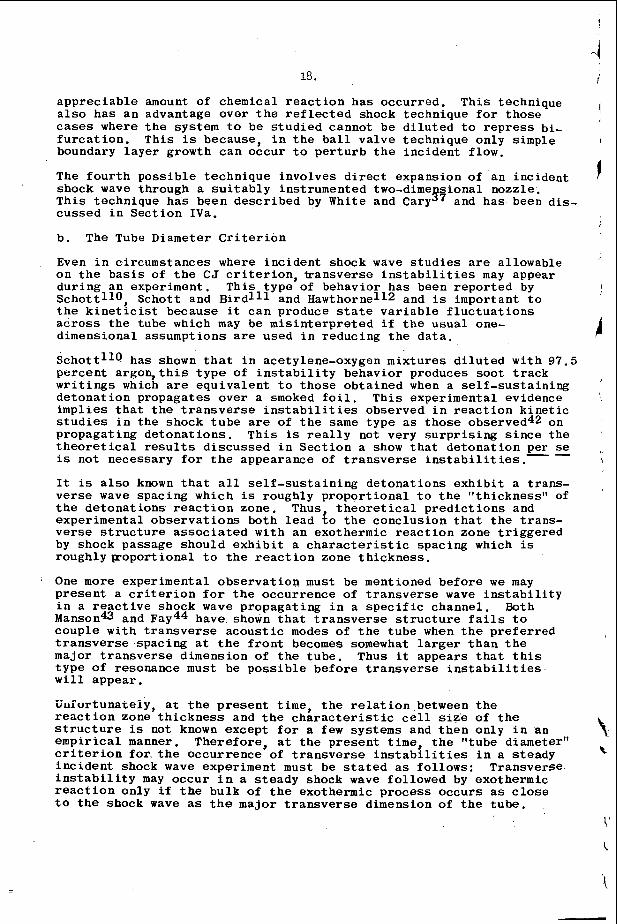
18.
a p p r e c i a b l e amount of c h e m i c a l r e a c t i o n h a s o c c u r r e d . T h i s t e c h n i q u e a l s o h a s a n advan tage o v e r t h e r e f l e c t e d shock t e c h n i q u e f o r t h o s e cases where t h e s y s t e m t o be s t u d i e d c a n n o t be d i l u t e d t o r e p r e s s b i - f u r c a t i o n . T h i s is b e c a u s e , i n t h e b a l l v a l v e t e c h n i q u e o n l y s i m p l e boundary layer g rowth c a n o c c u r t o p e r t u r b t h e i n c i d e n t f l o w .
The f o u r t h p o s s i b l e t e c h n i q u e i n v o l v e s d i r e c t e x p a n s i o n o f a n i n c i d e n t shock wave t h r o u g h a s u i t a b l y i n s t r u m e n t e d two-dime s i o n a l n o z z l e . T h i s t e c h n i q u e has b e e n d e s c r i b e d by White and Gary'? and h a s been d i s - c u s s e d i n S e c t i o n IVa.
b. The Tube Diamete r C r i t e r i o n
Even i n c i r c u m s t a n c e s where i n c i d e n t shock wave s t u d i e s are a l l o w a b l e o n t h e b a s i s of t h e C J c r i t e r i o n , t r a n s v e r s e i n s t a b i l i t i e s may appea r d u r i n g a n e x p e r i m e n t . T h i s t y p e of b e h a v i o r h a s been r e p o r t e d by S c h o t t l l o , S c h o t t and B i r d l l l and Hawthorne l l2 and is i m p o r t a n t t o t h e k i n e t i c i s t b e c a u s e it c a n produce s t a t e v a r i a b l e f l u c t u a t i o n s a c r o s s t h e t u b e which may be m i s i n t e r p r e t e d i f t h e u s u a l one- d i m e n s i o n a l a s s u m p t i o n s are u s e d i n r e d u c i n g t h e d a t a .
S c h o t t l l O has shown that i n ace ty l ene -oxygen m i x t u r e s d i l u t e d w i t h 97.5 p e r c e n t a r g o n , t h i s t y p e o f i n s t a b i l i t y b e h a v i o r p roduces s o o t t r a c k w r i t i n g s which a r e e q u i v a l e n t t o t h o s e o b t a i n e d when a s e l f - s u s t a i n i n g d e t o n a t i o n p r o p a g a t e s o v e r a smoked f o i l . T h i s e x p e r i m e n t a l ev idence i m p l i e s t h a t t h e t r a n s v e r s e i n s t a b i l i t i e s o b s e r v e d i n r e a c t i o n k i n e t i c s t u d i e s i n t h e s h o c k t u b e a r e of t h e same t y p e a s t h o s e observed42 on p r o p a g a t i n g d e t o n a t i o n s . T h i s is r e a l l y not v e r y s u r p r i s i n g s i n c e t h e t h e o r e t i c a l r e s u l t s d i s c u s s e d i n S e c t i o n a show t h a t d e t o n a t i o n p e r se is n o t n e c e s s a r y for t he a p p e a r a n c e of t r a n s v e r s e i n s t a b i l i t i e s . - - It is a l s o known t h a t a l l s e l f - s u s t a i n i n g d e t o n a t i o n s e x h i b i t a t r a n s - v e r s e wave s p a c i n g which is r o u g h l y p r o p o r t i o n a l t o t h e " t h i c k n e s s " of t h e d e t o n a t i o n s r e a c t i o n z o n e . Thus, t h e o r e t i c a l p r e d i c t i o n s and e x p e r i m e n t a l o b s e r v a t i o n s b o t h l e a d t o t h e c o n c l u s i o n t h a t t h e t r a n s - v e r s e s t r u c t u r e a s s o c i a t e d w i t h a n exo the rmic r e a c t i o n zone t r i g g e r e d by shock p a s s a g e s h o u l d e x h i b i t a c h a r a c t e r i s t i c s p a c i n g which is r o u g h l y p - o p o r t i o n a l t o t h e r e a c t i o n zone t h i c k n e s s .
One more e x p e r i m e n t a l o b s e r v a t i o n must be ment ioned b e f o r e w e may p r e s e n t a c r i t e r i o n f o r t h e o c c u r r e n c e of t r a n s v e r s e wave i n s t a b i l i t y i n a r e a c t i v e shock wave p r o p a g a t i n g i n a s p e c i f i c c h a n n e l . Both Manson43 and Fay44 have shown t h a t t r a n s v e r s e s t r u c t u r e f a i l s t o c o u p l e w i t h t r a n s v e r s e a c o u s t i c modes o f t h e t u b e when t h e p r e f e r r e d t r a n s v e r s e s p a c i n g a t t he f r o n t becomes somewhat l a r g e r t h a n t h e ma jo r t r a n s v e r s e d i m e n s i o n of t h e t u b e . Thus it a p p e a r s t h a t t h i s t y p e of re sonance must be p o s s i b l e b e f o r e t r a n s v e r s e i n s t a b i l i t i e s w i l l a p p e a r .
U n f o r t u n a t e l y , a t the p r e s e n t t i m e , t h e r e l a t i o n between t h e r e a c t i o n zone t h i c k n e s s and t h e c h a r a c t e r i s t i c c e l l s i z e o f t h e s t r u c t u r e is not known e x c e p t f o r a f e w s y s t e m s and t h e n o n l y i n a n e m p i r i c a l manner. T h e r e f o r e , a t t h e p r e s e n t t i m e , t h e " t u b e d i ame te r " c r i t e r i o n for. t h e o c c u r r e n c e o f t r a n s v e r s e i n s t a b i l i t i e s i n a s t e a d y i n c i d e n t shock wave e x p e r i m e n t must be s t a t e d a s f o l l o w s : T r a n s v e r s e i n s t a b i l i t y may o c c u r i n a s t e a d y shock wave f o l l o w e d by exo the rmic r e a c t i o n o n l y i f t h e b u l k of t h e e x o t h e r m i c p r o c e s s o c c u r s a s c l o s e t o t h e shock wave a s t h e m a j o r t r a n s v e r s e d imens ion o f t h e t u b e .
-1 i
I
I
1
i
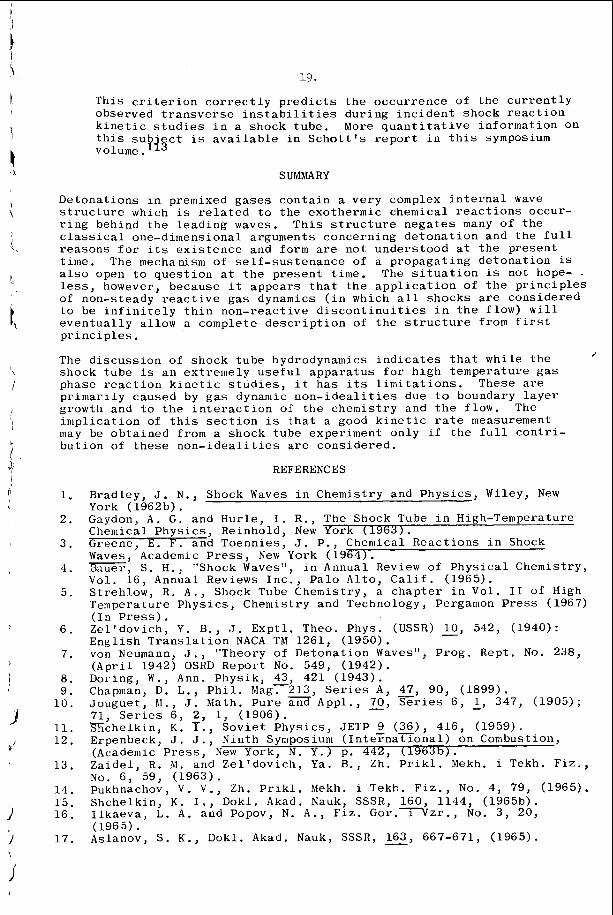
19 *
T h i s c r i t e r i o n c o r r e c t l y p r e d i c t s t h e o c c u r r e n c e of t h e c u r r e n t l y observed t r a n s v e r s e i n s t a b i l i t i e s d u r i n g i n c i d e n t shock r e a c t i o n k i n e t i c s t u d i e s i n a shock t u b e . More q u a n t i t a t i v e i n f o r m a t i o n On t h i s s u b ' c t is a v a i l a b l e i n S c h o t t ' s r e p o r t i n t h i s symposium volume. 135
S UhfMA RY
D e t o n a t i o n s i n premixed g a s e s c o n t a i n a v e r y complex i n t e r n a l wave s t r u c t u r e which is r e l a t e d t o t h e exo the rmic chemica l r e a c t i o n s occur- r i n g behind t h e l e a d i n g waves. T h i s s t r u c t u r e n e g a t e s many o f t h e c l a s s i c a l one-d imens iona l a rguments c o n c e r n i n g d e t o n a t i o n and t h e f u l l r e a s o n s f o r i t s e x i s t e n c e and form are no t u n d e r s t o o d a t t h e p r e s e n t time. The mechanism of s e l f - s u s t e n a n c e of a p r o p a g a t i n g d e t o n a t i o n i s a l s o open t o q u e s t i o n a t t h e p r e s e n t time. The s i t u a t i o n is not hope- . l e s s , however, because i t a p p e a r s t h a t t h e a p p l i c a t i o n of t h e p r i n c i p l e s of non-s teady r e a c t i v e g a s dynamics ( i n which a l l s h o c k s a r e c o n s i d e r e d t o be i n f i n i t e l y t h i n n o n - r e a c t i v e d i s c o n t i n u i t i e s i n t h e f low) w i l l e v e n t u a l l y a l low a comple t e d e s c r i p t i o n of t h e s t r u c t u r e f rom f i r s t p r i n c i p l e s .
The d i s c u s s i o n of shock t u b e hydrodynamics i n d i c a t e s t h a t w h i l e t h e shock t u b e i s a n e x t r e m e l y u s e f u l a p p a r a t u s f o r h i g h t e m p e r a t u r e g a s phase r e a c t i o n k i n e t i c s t u d i e s , i t h a s its l i m i t a t i o n s . These are p r i m a r i l y caused by g a s dynamic n o n - i d e a l i t i e s due t o boundary l a y e r growth and t o t h e i n t e r a c t i o n of t h e c h e m i s t r y and t h e f low. The i m p l i c a t i o n of t h i s s e c t i o n is t h a t a good k i n e t i c rate measurement may be o b t a i n e d from a shock t u b e expe r imen t o n l y i f t h e f u l l c o n t r i - b u t i o n of t h e s e n o n - i d e a l i t i e s a r e c o n s i d e r e d .
i
1.
2 .
3 .
4 .
5 .
6 .
7 .
8 . 9 .
1 0 .
11. 12 .
13 .
14 . 15. 1 6 .
17.
REFERENCES
Brad ley , J . N . , Shock Waves i n Chemis t ry and P h y s i c s , Wiley, N e w York (1962b) . Gaydon, A . G . and H u r l e , I . R . , The Shock Tube i n High-Temperature Chenlical P h y s i c s , Re inho ld , New York (1963) . Greene , E . F . and T o e n n i e s , J . P . , Chemical R e a c t i o n s i n Shock Waves, Academic P r e s s , N e w York (1964) . 3 a u e r , S . H . , "Shock Waves", i n Annual Review of P h y s i c a l Chemis t ry , Vol. 16 , Annual Reviews I n c . , P a l o A l t o , C a l i f . (1965) . S t r eh low, R . A . , Shock Tube Chemis t ry , a c h a p t e r i n Vol . I1 o f High Tempera ture P h y s i c s , Chemis t ry and Technology, Pergamon P r e s s (1967) ( I n P r e s s ) . Z e l ' d o v i c h , Y . B . , J . E x p t l . Theo. Phys . (USSR) - 10, 542, (1940) : E n g l i s h T r a n s l a t i o n NACA Thl 1261, (1950) . von Neumann, J . , "Theory of D e t o n a t i o n Waves", P r o g . Rep t . N o . 238, ( A p r i l 1942) OSRD Repor t No. 549, (1942) . Dor ing , W . , Ann. P h y s i k , 43, 421 (1943) . Chapman, D . L . , P h i l . MagF213, S e r i e s A , 47, 90 , (1899) . J o u g u e t , h l . , J . Math. P u r e and Appl . , 2, S e r i e s 6 , - 1, 347, 71, S e r i e s 6 , 2 , 1, (1906) . S h c h e l k i n , K . T . , ' S o v i e t P h y s i c s , JETP 9 ( 3 6 ) , 416, (1959) . Erpenbeck, J . J . , Nin th Symposium ( I n t e F n a s o n a l ) on Combust ion, (Academic P r e s s , N e w York, N . Y . ) p. 442, (196313). Z a i d e l , R . h l . and Z e l ' d o v i c h , Ya. B . , Zh. P r i k l . Mekh. i Tekh. F i z . , No. 6 , 59, (1963) . pukhnachov, V . V . , Zh. P r i k l . hlekh. i Tekh. F i z . , N o . 4 , 79, (1965) . S h c h e l k i n , K . I . , Dokl . Akad. Nauk, SSSR, 160 , 1144, (1965b) . I l k a e v a , L . A . and Popov, N . A . , F i z . G o r . i z r . , No. 3 , 2 0 , (1965) . As lanov, S. K . , Dokl . Akad. Nauk, SSSR, - 163, 667-671, (1965) .
(1905) ;
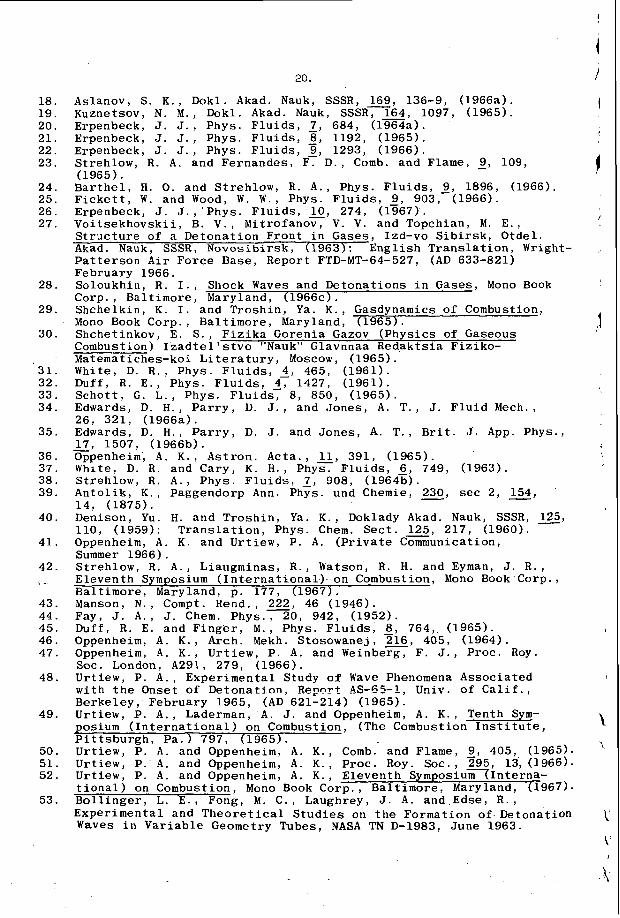
20.
Aslanov, S. K., Dokl. Akad. Nauk, SSSR, 169, 136-9, (1966a). Kuznetsov, N. M., Dokl. Akad. Nauk, SSSR, 164, 1097, (1965). Erpenbeck, J. J., Phys. Fluids, 1, 684, (1964a). Erpenbeck, J. J., Phys. Fluids, 8 , 1192, (1965). Erpenbeck, J. J., Phys. Fluids, 9, 1293, (1966). Strehlow, R. A. and Fernandes, FT D . , Comb. and Flame, 2, 109, (1965). Barthel, H. 0. and Strehlow, R. A., Phys. Fluids, 9, 1896, (1966). Fickett, W. and Wood, W. W., Phys. Fluids, 9, 903,-(1966). Erpenbeck, J. J.,'Phys. Fluids, 10, 274, (1367). Voitsekhovskii, B. V., Mitrofanov, V. V. and Topchian, M. E., Structure of a Detonation Front in Gases, Izd-vo Sibirsk, Otdel. Akad. Nauk, SSSR, Novosibirsk, (1963): English Translation, Wright- Patterson Air Force Base, Report FTD-MT-64-527, (AD 633-821) Februarv 1966.
18. 19. 20. 21. 22. 23.
24. 25. 26. 27.
28.
29.
30.
31. 32. 33. 34.
35.
36. 37. 38. 39.
40.
41.
42. ~-
43. 44. 45. 46. 47.
48.
49.
50. 51. 52.
53.
~~
Soloukhin, R. I., Shock Waves and Detonations in Gases, Mono Book Corp., Baltimore, Maryland, (1966~). Shchelkin, K . I . and Troshin, Ya. K . , Gasdynamics of Combustion, Mono Book Corp., Baltimore, Maryland, (1965). Shchetinkov, E. S., Fizika Gorenia Gaxov (Physics of Gaseous Combustion) Izadtel'stvo "Nauk" Glavnnaa Redaktsia Fiziko- Matematiches-koi Literatury, Moscow, (1965). White, D. R., Phys. Fluids, 4 , 465, (1961). Duff, R. E., Phys. Fluids, 37 1427, (1961). Schott. G. L., Phys. Fluids, 8 , 850, (1965). Edwards, D. H., Parry, D. J., and Jones, A. T., J. Fluid Mech., 26, 321, (1966a). Edwards, D. H., Parry, D. J. and Jones, A. T., Brit. J. App. Phys., - 17, 1507, (1966b). Oppenheim, A. K., Astron. Acta., 11, 391, (1965). White, D. R. and Cary, K. H., Phys. Fluids, 6, 749, (1963). Strehlow, R. A., Phys. Fluids, 1, 908, (1964%). Antolik, K., Paggendorp Ann. Phys. und Chemie, 230, sec 2, 154, 14, (1875). Denison, Yu. H . and Troshin, Ya. K., Doklady Akad. Nauk, SSSR, 125, 110, (1959): Translation, Phys. Chem. Sect. 125, 217, (1960). Oppenheim, A . K. and Urtiew, P. A. (Private Communication, Summer 1966). Strehlow, R. A., Liaugminas, R., Watson, R. H. and Eyman, J. R., Eleventh Symposium (International) on Combustion, Mono Book Corp., Baltimore, Maryland, p. 177, (1967). Manson, N., Compt. Rend., 222, 46 (1946). Fay, J. A., J. Chem. Phys., 20, 942, (1952). Duff, R. E. and Finger, M., Phys. Fluids, 2, 764, (1965). Oppenheim, A. K., Arch. hlekh. Stosowanej, 216, 405, (1964). Oppenheim, A . K., Urtiew, P. A. and Weinberg, F. J., Proc. Roy. SOC. London, A291, 279, (1966). Urtiew, P. A., Experimental Study of Wave Phenomena Associated with the Onset of Detonation, Report AS-65-1, CTciv. cf Calif., Berkeley, February 1965, (AD 621-214) (1965). Urtiew, P. A., Laderman, A. J. and Oppenheim, A. K . , Tenth Sym- posium (International) on Combustion, (The Combustion Institute, Pittsburgh, Pa. 797, (1965). Urtiew, P. A . and Oppenheim, A. K., Comb. and Flame, 9 , 405, (1965). Urtiew, P. A. and Oppenheim, A. K., Proc. Roy. SOC., 295, 13, (1966). Urtiew, P. A. and Oppenheim, A. K., Eleventh SymposiuflInterna- tional) on Combustion, Mono Book Corp., Baltimore, Maryland, (1967). Bollinger, L. E., Fong, M. C., Laughrey, J. A . and Edse, R., Experimental and Theoretical Studies on the Formation of Detonation Waves in Variable Geometry Tubes, NASA TN D-1983, June 1963.
54 . 55 . 56. 57 .
58. 59 .
60 . 61 . 6 2 .
63 .
64 .
6 5 .
6 6 .
67 .
68.
69 .
70 .
71. 72 . 73. 74. 75.
7 6 . 7 7 . 78. 79. 80 . 81. 82 . 83.
84 . 85. 8 6 . 8 7 . 88. 8 9 . 90.
91.
21.
S t r e h l o w , R . A . a n d Cohen, A . , Phys . F l u i d s , 5 , 97 , (1962) . G i l b e r t , R . B. and S t r e h l o w , R . A . , A I A A J o u r x a l , 4 , 1777, (1966) . S o l o u k h i n , R . I . , Zh. P r i k l . Mekh. i Tekh. F i z . , #q, 4 2 , (1964) . S t r e h l o w , R . A . , C r o o k e r , A . J. a n d Cusey, R . E . , Comb. and Flame, - 11, (1967) ( I n P r e s s ) . S c h o t t , G . L. and K i n s e y , J . L . , J. Chem. P h y s . , 2, 1177, (1958) . White , D. R . , "A Study of Shock Wave Induced R e a c t i o n s , " ARL Repor t 66-Dl77, Off i c e of Aerospace R e s e a r c h , USAF W r i g h t - P a t t e r s o n AFB, Ohio, (September 1966) (AD 646-559) . Soloukhin , R . I . , Comb. and Flame, 1 0 , 51, (1966a) . S t r e h l o w , R . A . and Har tung , W . , C o x . and Flame, 2 , 423, (1965) . Mul laney , G. J . and Arave, R . , " D e t e r m i n a t i o n of I n d u c t i o n Times i n One-Dimensional D e t o n a t i o n s , " Boeing S c i e n t i f i c L a b o r a t o r y Research R e p o r t , D1-82-0324, Boeing Aircraf t C o r p . , S e a t t l e , Washington, (December 1 9 6 3 ) . Mullaney, G . J . , Ku, P. S. a n d B o t c h , W. B . , A I A A J o u r n a l , 3 , 873, (1965) . Rubins , P. hl . and P a n e s c i , J . H . , "Exper imenta l S t a n d i n g Wave Shock-Induced Combust ion f o r D e t e r m i n i n g R e a c t i o n K i n e t i c H i s t o r i e s , " A I A A P a p e r 65-607, ( J u n e 1 9 6 5 ) . N e s t e r i c h i n , Y. E . and Soloukhin , R . I . , "Rapid I n s t r u m e n t a t i o n hlethods f o r Gasdynamics and Plasma P h y s i c s , " N o v o s i b i r s k Hydro- dynamic I n s t i t u t e , N o v o s i b i r s k , ( 1 9 6 5 ) ; E n g l i s h T r a n s l a t i o n : JPRS 3 9 , 6 5 7 TT 67-30306, CFSTI, Washington, D. C . , ( J a n u a r y 1 9 6 7 ) . Olschewski , H. A . , T r o e , J . and Wagner, H. Gg. , Z . P h y s i k . Chem., ( F r a n k f u r t ) 9, 383, ( 1 9 6 5 ~ ) . Olschewski , H. A . , T r o e , J. and Wagner, H. Gg. , Z . P h y s i k Chem., ( F r a n k f u r t ) 45, 329, (1965b) . Olschewski , H. A . , T r o e , J. and Wagner, H . G g . , B e r . Bunsen G e s . P h y s i k . Chem. ~ 3, 450 , (1966b) . Olschewski , H. A . , T r o e , J. and Wagner, H . Gg. , E l e v e n t h Symposium ( I n t e r n a t i o n a l ) on Combust ion, Mono Book Corp. , B a l t i m o r e , Mary- l a n d , (1967) . Alyerson, A . L . , Thompson, H. M . a n d J o s e p h , P. S . , J . Chem. P h y s . , - 42 , 3331, ( 1 9 6 5 ) . K i e f e r , J. H . , L u t z , R . W . , J . Chem. P h y s . , 42 , 1709, (1965b) . Whi te , D. R . , J . F l u i d Mech., 4, 585, (1958)- A l p h e r , R . A . and Whi te , D. R . , J . F l u i d Mech., 3, 457, (1958) . Dyner , H . B . , Phys . F l u i d s , 2 , 879, (1966) . Holbeche , T. A . and Spence , D. A . , P r o c . Roy. S o c . , E, 111, (1964) . Spence , D. A . and Woods, B . A . , J . F l u i d Mech., 2, 1 6 1 , (1964) . BI i r e l s , H . , Phys . F l u i d s , 6, 1201, (1963) . hlirels, H . and hlul len, J . F . , Phys . F l u i d s , 1, 1208, (1964) . hlirels, H . , A I A A J o u r n a l , 2 , 8 4 , (1964) . hlirels, H . , Phys. F l u i d s , 4, 1265, (1966a) . h l i re ls , H . , Phys . F l u i d s , 2, 1907, (1966b) . Duff , R . E . , Phys. F l u i d s , 2, 207, (1959) . Fox, J . N . , McLaren, T. I . and Hobson, R . h f . , Phys. F l u i d s , 9, 2345, ( 1 9 6 6 ) . hlodica, A . P . and L a G r a f f , J . E . , J . Chem. P h y s . , 45 , 4729, (1966b) . S e e r y , D . J . and B r i t t o n , D . , J . Phys . Chem., 70 , m74, (1966) . S t r e h l o w , R . A . and Cohen, A . , J . Chem. P h y s . , 3 0 , 257, (1959) . Rudinger , G . , Phys. F l u i d s , 4, 1463, (1961) . - hlodica, A . P . , J . Phys. Chem., 6 9 , 2111, ( 1 9 6 5 ) . C h a r a t i s , G . and W i l k e r s o n , T. E, Phys. F l u i d s , 2, 578, (1959) . A l l e n , R . A . , T e x t o r i s , A . and Wilson, J . , J . Q u a n t . S p e c t r . R a d i a t i v e T r a n s f e r , r, 95, (1965) . Johnson, C . D. and B r i t t o n , D . , J . Chem. Phys . , 38, 1455, (1963) .
92.
93.
94 #
95. 96. 97. 98. 99. 100. 101.
102. 103. 104.
105.
106. 107. 108. 109. 110.
111. 112.
113.
22.
Nafzinger, L. E. , "Non-Steady Relaxation Phenomena Behind a rl Reflected Shock Wave," M.S. Thesis, University of Illinois, 1
(August 1966). Glick, H. S., Squire, W. and Hertzberg, A., Fifth Symposium (International) on Combustion, Reinhold, New York, 393, (1955). Palmer, H . B., Knox, B. E. and McHale, E. T., AIAA Journal, 2, 1195, (1963). Tsang, W., J. Chem. Phys., 9, 1171, (1964a). Tsang, W., J. Chem. Phys. , 40, 1498, (1964b). Tsang, W., J. Chem. Phys., 42, 1805, (1965a). Tsang, W., J. Chem. Phys., 43, 352, (1965b). Tsang, W., J. Chem. Phys., 44, 4283, (1966). Tschuikow-Roux, E. and Marte, J. E., J. Chem. Phys., 42, 2049, (1965); Erratum: 43, 1438. Tschuikow-Roux, E. , Phys. Fluids, 5 , 821, (1965a). Tschuikow-Roux, E., J. Chem. Phys., 42, 3639, (1965b). Lifshitz, A., Bauer, S. H . and Resler, E. L., J. Chem. Phys., 38, 2056, (1963). Voevodskii, V. V. and Soloukhin, R. I., Tenth Symposium (Inter- national) on Combustion, The Combustion Institute, Pittsburgh, Pennsylvania, 279, (1965). Miyama, H. and Takeyama, T., J. Chem. Phys., 41, 2287, (1964). Belles, F. E. and Lauver, M. R., J. Chem. Phys., 40, 415, (1964). Skinner, G. B. and Ringrose, G. H., J. Chem. Phys; 42, 2190, (1965). Schott, G. L., J . Chem. Phys., 32, 710, (1960). Private communication, (1963). Schott, G. L. and Bird, P. F. , J. Chem. Phys., 5, 2869, (1964). Hawthorne, R. D. and Nixon, A. D., "Shock Tube Ignition Delay Studies of Endothermic Fuels, I t AIAA Paper, #65-594. Presented at AIAA Joint Propulsion Specialists Meeting, Colorado Springs, Colorado, (June 1965) also Hawthorne, R. D. , Shell Development Co., Emeryville, Calif. , Private communication, (1965). Schott, G. L., "Detonation Spin in Driven Shock Waves in a Dilute Exothermic Mixture," Division of Fuel Chemistry Preprints for Symposium on Detonations and Reactions in Shock Waves, ACS National Meeting, Chicago, Illinois, (September 1967).
f
Tsang, W., J. Chem. Phys., 41, 2487, (1964~). J
1
1
.]
Schott, G. L., Los Alamos Scientific Lab., Los Alamos, New Mexico, 1
f
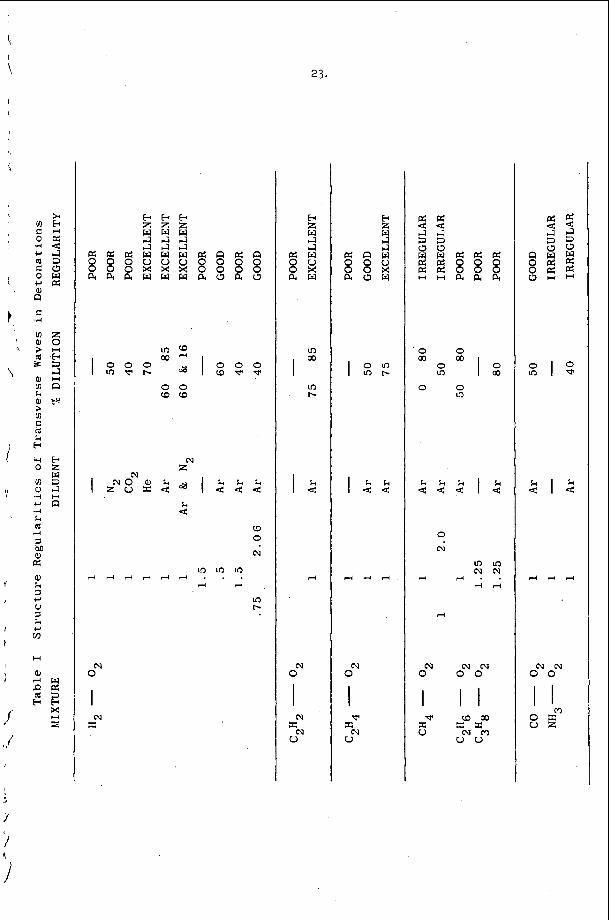
b b b 2 2 2 w w w 4 J d 4 4 ! 4
c c p : p : : w w w c c n p : n ~ O o v v v 0 0 0 o o x x x 8 o o o a a a w w w a o a o
0 0 w ( 9
k k k 4 4 4
(0
0
cv
F.1 0
N
I z
In
I " v) t-
I,.
d
hl 0
4
o m I I n b
I G G
(v 0
I
. O 0 c o w 0 m I :
0 0 m
k k k 4 4 4 l G
0
(v 0
cp
I X V
k 4 1 . 2
h l c v 0 0
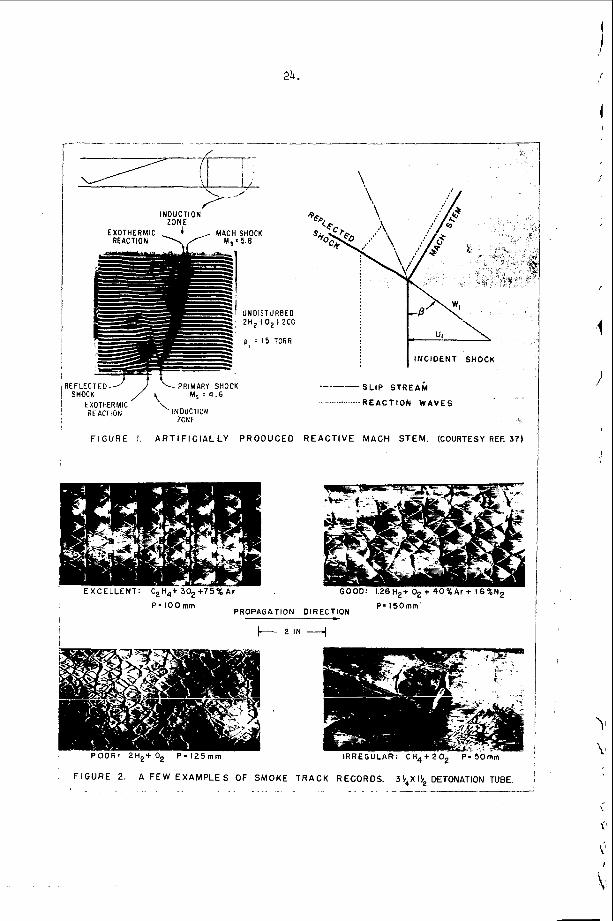
24.
I N D U C T I O N ZONE
EXOTHERMIC </ MAC;s;HiCK REACTION
REFLECTED-J ! SHOCK 1 EXOTHERMIC
I ZONE ' INDUCTION REACTION
F I G U R E I . A R T I F I C I A L L Y P R O D U C E D
P - l O O r n r n PROPAGATION
I INCIDENT SHOCK
SLIP S T R E A ~
. .. REACTIOIV WAVES
R E A C T I V E M A C H S T E M . (COURTESY REF: 37)
GOOD: 1 2 6 H 2 + 0 2 + 4 0 % A r + 16%N2
DIRECTION P m ' 5 0 m m
POOR' 2H2+ O2 P - 1 2 5 m m IRREGULAR: CH4+202 P - S O m m
I i
F I G U R E 2 A F E W E X A M P L E S O F SMOKE TRACK RECORDS. 3 ' / ,Xl t DETONATION TUBE 1
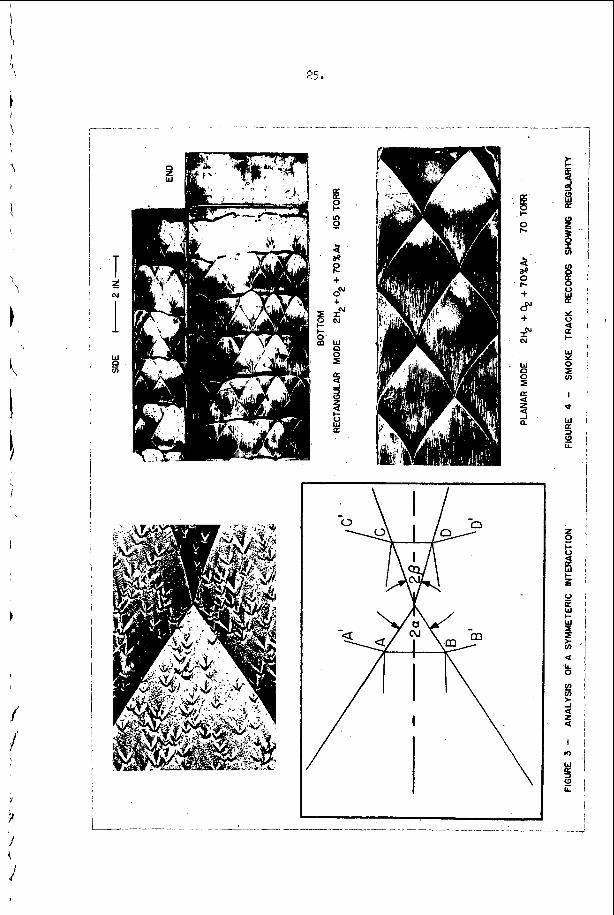
I !\
25
n 2 W
E
I- om'
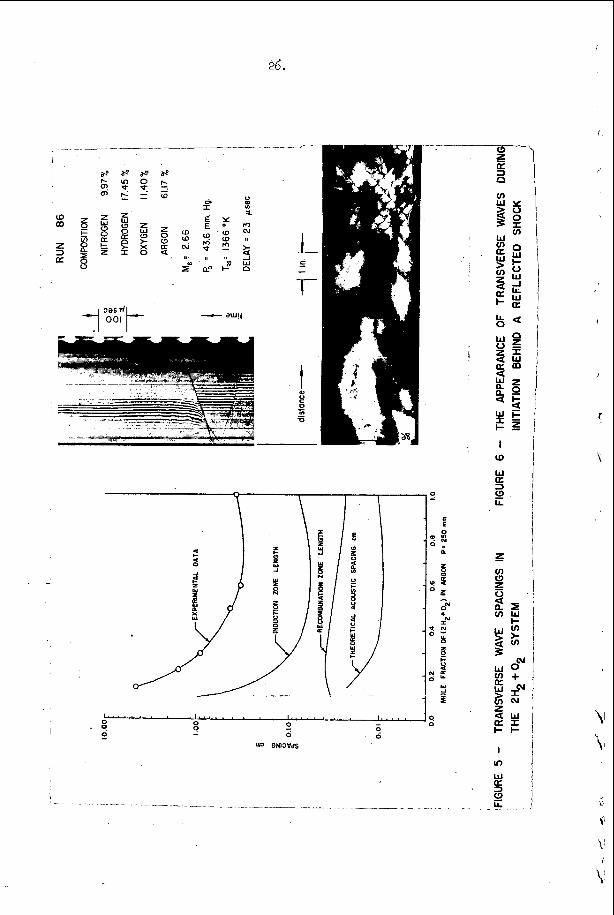
A-
I
26.
I..... . . . . 0
I . . . . . , , , 0
I . . , . , , . , I... , ,
0 I? - -
0 x w3 ON13VdS
e
E
0 'D.3 O h
9
I In
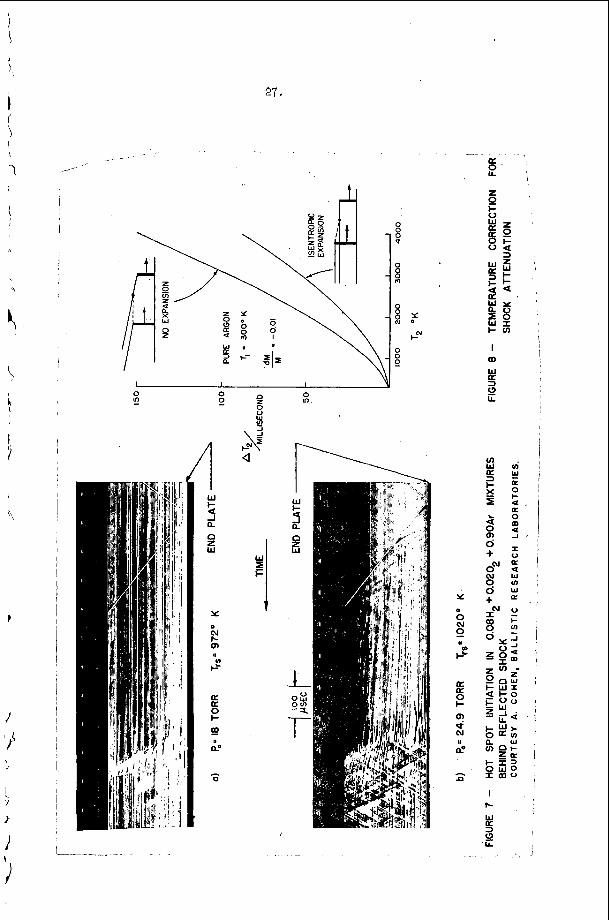
0 P
1 W
t- -1 a a n z W
Y
(u I- Q,
0
" &?
E 0 t- a0 n o
-
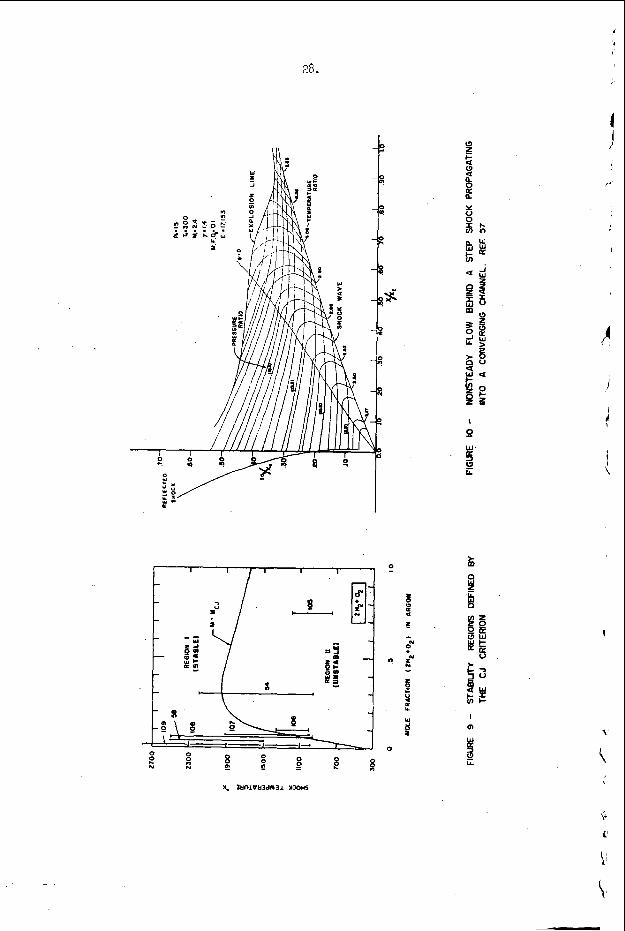
r I I 1
I
0
0 w
6
i \
29.
D e t o n a t i o n S p i n i n Driven Shock Waves i n a D i l u t e Exothermic H i x t u r e
(;amy L. S c h o t t . U n i v e r s i t y of C a l i f o r n i a , Los Alamos S c i e n t i f i c L a b o r a t o r y ,
Los Alamos, !leu P e x i c o 87544
There have been many u s e s of shock waves i n d i l u t e d m i x t u r e s of e x o t h e r m i c r e a c t a n t s f o r s t u d i e s of c h e m i c a l r e a c t i o n r a t e s . I t was once commonly thou.cht , for l a c k of e v i d e n c e t o t h e c o n t r a r y , t h a t one c o u l d o p e r a t e ' . i n a regime f r e e of c o m p l i c a t i o n s from s p o n t a n e o u s " d e t o n a t i o n " phenomena a r i s i n g from t h e d e p o s i t i o n o f t h e r e a c t i o n e n e r c y i n t h e f l o w i n g gas by E e n e r a t i n g shock waves fas ter and s t r o n e e r t h a n t h e Chapman-Jouguet wave fo r t h e d i l u t e m i x t u r e . Such shock waves are i n r e a l i t y o v e r d r i v e n d e t o n a t i o n waves, and t h e o n l y b a s i s for d i s t i n g u i s h i n g them from s t r o n g d e t o n a t i o n waves i n more c o n c e n t r a t e d m i x t u r e s i s t h e fact t h a t t h e d i l u t e m i x t u r e s , i f n o t s u p p o r t e d , may f a i l t o s u s t a i n a slower, Chapman- J o u g u e t v e l o c i t y wave. T h i s d i s t i n c t i o n is one of d e g r e e r a t h e r t h a n of k i n d , and r e c e n t e x p e r i e n c e w i t h u n s u p p o r t e d d e t o n a t i o n s and o v e r d r i v e n d e t o n a t i o n s i n d e t o - n a b l e g a s m i x t u r e s i n d i c a t e s t n a t t h r e e - d i m e n s i o n a l s t r u c t u r e which c h a r a c t e r i z e s t h e Chapman-Jouquet v e l o c i t y waves r e m a i n s p r e s e n t , on a. p r o g r e s s i v e l y f i n e r scale, i n o v e r a r i v e n waves. 1 **
waves i n d i l u t e , o n l y m i l d l y exotherm.ic m i x t u r e s h a s been less c o m p l e t e l y charac- t e r i z e d . Indeed , many s u c c e s s f u l i n v e s t i g a t i o n s of k i n e t i c s of e x o t h e r m i c r e a c - t i o n s have been c a r r i e d o u t ' i n shock waves i n d i l u t e m i x t u r e s w i t h o u t major or even n o t i c e a b l e i n t e r f e r e n c e . On t h e o t h e r hand, t h e r e have been i s o l a t e d r e p o r t s of " i n s t a b i l i t i e s " , i n t h e r e a c t i o n z o n e s i n p a r t i c u l a r , under c i r c u m s t a n c e s where t h e s y s t e m was d i l u t e d w e l l beyond t h e l i m i t of d e t o n a b i l i t y and t i i e ' s h o c k wave was c l e a r l y s t r o n p e r t h a n a Chapman-Jouguet wave. Examples of t h e s e o c c u r r e n c e s may b e found i n s t u d i e s of t h e hydro,gen - bromine r e a ~ t i o n , ~ ozone d e c o m p ~ s i t i o n , ~ and hydroKen-oxygen cornkust ion. The p r e s e n t p a p e r r e p o r t s t h e o c c u r r e n c e of such i n - s t a b i l i t i e s i n shock waves i n a m i x t u r e of 1% C2i.i2, 1 .5% 0 2 , 97.5% A r and t h e i d e n - t i f i c a t i o n of c o n d i t i o n s where t h e phenomena e x h i b i t t h e r e c o g n i z a b l e and q u a s i - r e p r o d u c i b l e form of s i n g l e - h e a d e d s p i n . 6 ,'
The o c c u r r e n c e of t r a n s v e r s e waves o r o t h e r i n s t a b i l i t i e s i n d r i v e n shock
Exper imenta l .
The e x p e r i m e n t s r e p o r t e d h e r e were c a r r i e d o u t i n t h e 1 0 cm i . d . c i r c u l a r b r a s s shock t u b e used f o r s e v e r a l p r e v i o u s l y r e p o r t e d chemical i n v e s t i p t i o n s . S e v e r a l d i f f e r e n t t e s t s e c t i o n c o n E i E u r a t i o n s were u t i l i z e d fo r t h e v a r i o u s k i n d s of d i a g n o s t i c e x p e r i m e n t s . E i t h e r b r a s s shim s t o c k or Hylar s h e e t d iaphragms were u s e c , and t h e - d r i v e r g a s was' hydrogen. The s e v e r a l d a t c n e s of 1 .0% C2H2, 1.5% 02 , 97 .5% h r tes t as m i x t u r e were p r e p a r e d inanometr ica l ly fron t a n k a r g o n a n d a s i n g l e , homogeneous s t o c k m i x t u r e of 40% C2H2, 60% 0 2 p r e p a r e d i n i t i a l l y from t a n k sup- p l i e s . T h e c o m p o s i t i o n of one b a t c h was c h e c k e l by mass s p e c t r a l a n a l y s i s , and 0.C38 :iZ was t h e o n l y d e t e c t e d d e p r t u r e from t h e i n t e n d e d c o m p o s i t i o n . ments were C a r r i e ? c u t a t i n i t i a l shock t u b e p r e s s u r e s , po , of 20.. 50, a n d 1 2 0 T o r r .
,
Exper i -
Shock wave s;;eeds were moni tored 5y raster o s c i l l o s c o 2 e r e c o r d i n g o f t h e prog- r e s s of tile shock. f r o n t p a s t f i v e p i e z o e l e c t r i c T r e s s u r e t r a n s d u c e r s spaced a t 30 c m o r lonaer i n t e r v a l s Along a 1 4 0 cm o r l o n g e r segment of t h e t u b e b e g i n n i n g 200 cm or 350 cm fro;r. t h e d i a p h r a p n .
In o t h e r e x y e r i n e n t s , where t h e d e i m r t u r e of t h e shock f r o n t from p l a n a r i t y was u n d e r e x a m i n a t i o n , four of t h e p i e z o e l e c t r i c qaug,es were arrardged a t 90° i n t e r - v a l s a round t h e t u b e 2 e r i n . e t e r . i n a p l a n e p e r p e n d i c u l a r t o t h e . a x i s , .and t h e i r re- s p o n s e s were d i s p l a y e d on four s y n c h r o n i z e d o s c i l l o s c o p e t r a c e s .
t h e e x p e r i m e n t s by o s c i l l o s c o p e r e c o r d i n g of t h e a b s o r p t i o n of a beam of u l t r a v i o l e t The p r e s e n c e of Gti r a d i c a l s i n . t t : e combustion zone was. ,monitored in .many of.
/
I
I
OH m o l e c u l a r l i n e r a d i a t i o n 9 which passed d i a m e t r i c a l l y a c r o s s t h e t u b e th rough q u a r t z windows.
Mylar f o i l s c o a t e d w i t h wood smoke soot2 were p l a c e d a g a i n s t t h e i n t e r i o r s u r - f a c e o f t h e shock t u b e end f l a n g e i n many o f t h e expe r imen t s t o r e c o r d t h e p re sence o f i r r e g u l a r i t i e s i n t h e shock f r o n t r e a c h i n g t h e t u b e end. Smoked f o i l s l i n i n g t h e s i d e walls a l o n g a 1 4 c m l e n g t h of t h e t e s t s e c t i o n were a l s o used i n sone ex- p e r i m e n t s . The l o c i a t t h e t u b e w a l l o f t h e a b r u p t i n t e r s e c t i o n s of segments of c r e a s e d shock waves a r e r e c o r d e d a s i n s c r i p t i o n s i n t h e s o o t c o a t i n g .
F i n a l l y , open s h u t t e r pho tography i n a 60 cm long q l a s s e x t e n s i o n of t h e tes t s e c t i o n was used t o r e c o r d t h e luminous t r a j e c t o r y o f t h e s p i n n i n g r e a c t i o n zone - shock f r o n t complex i n shock waves e x h i b i t i n g t h e s ing le -headed s p i n phenomenon.
R e s u l t s
1
The i n i t i a l r e s u l t s which s u g g e s t e d t h a t s p i n - l i k e i r r e g u l a r i t i e s might be p r e s e n t i n prompt ly r e a c t i v e shock waves i n t h e 97.5% A r mix tu re c o n s i s t e d of t h e oc- c u r r e n c e o f q u a s i - p e r i o d i c u n d u l a t i o n s i n s p e c t r o p h o t o n e t r i c r e c o r d s o f OH r a d i c a l
s econds a f t e r pas sage of t h e s h o c k wave. These r e c o r d s d i d n o t i d e n t i f y t h e i n - s t a b i l i t y d e f i n i t i v e l y , . n o r have t h e y proven t o b e even r e l i a b l e i n d i c a t o r s o f t h e
' p r e s e n c e o f i n s t a b i l i t y i n a l l i n s t a n c e s . Accord ingly , t h e i n v e s t i g a t i o n of t h e i n s t a b i l i t y phenomena t u r n e d t o t h e i n c l u s i o n o f o t h e r d i a g n o s t i c t e c h n i q u e s w i t h which w e have e x p e r i e n c e f rom t h e s t u d y o f gaseous d e t o n a t i o n s . 2 s 6
P o s i t i v e c o n f i r m a t i o n of t h e o c c u r r e n c e o f s i n e l e - h e a d e d s p i n was made w i t h a smoked f o i l a l o n g t h e i n s i d e w a l l o f t h e t u b e . t h e smoke l a y e r b e a r s a h e l i c a l , r i b b o n - l i k e i n s c r i p t i o n . The fo rward edge o f t h e r i b b o n i s t h e p a t h o f t h e backward p o i n t i n g crease i n t h e o t h e r w i s e convex shock f r o n t . The t r a i l i n E edge is t h e p a t h o f t h e rear t e r m i n u s of t h e t r a n s v e r s e de to - n a t i o n uave which p r o p a F a t e s i n t h e compressed , u n r e a c t e d g a s accumula ted behind t h e weaker r e g i o n of t h e p r imary shock f r o n t . T h i s prompt ly r e a c t i v e t r a n s v e r s e c o m p r e s s i o n a l wave c o u p l e s t h e r evo lv ine , crease i n t h e p r imary shock f r o n t t o t h e p redominan t ly c i r c u m f e r e n t i a l a c o u s t i c o s c i l l a t i o n o f t h e p r e s s u r e of t h e column of burned Kas f lowing beh ind t h e combust ion wave sys tem. The phase of t h e h e l i x i n the t u b e and also t h e p i t c h a n g l e , 9, whose t a n c e n t i s t h e r a t i o of t h e a x i a l t o t h e c i r c u m f e r e n t i a l v e l o c i t y component, is reco rded ' by t h e s i d e w a l l smoked f o i l . Good spec imens of t h e s e s i n g l e s p i n r e c o r d s were o b t a i n e d a t i n i t i a l p r e s s u r e s of 20 and 50 Torr. These d i f f e r from t h e r e c o r d s o f s i n e l e s p i n i n unsuppor t ed de to -
. n a t i o n s , however, i n t h a t t h e f i n e s t r u c t u r e found w i t h i n t h e t r a n s v e r s e wave band ' i n t h e l a t t e r r e c o r d s 2 y6 is a b s e n t .
d u r a b l e and are g e n e r a l l y easier t o work w i t h . These r e c o r d t h e l o c a t i o n o f r a d i - a l l y or c i r c u m f e r e n t i a l l y p r o p a g a t i n z creases i n t h e shock f r o n t anywhere i n t h e t u b e cross s e c t i o n upon a r r i v a l of t h e wave a t t h e end. S i n g l e sp inn in r : waves are , r ecogn ized by t h e p r e s e n c e of a s i n g l e , r c o r e o r less r a d i a l l y o r i e n t e d mark ex tend- i n g inward from t h e r i m . 2
Another prominent c h a r a c t e r i s t i c o f s i n g l e s p i n n i n g waves i s s e v e r e ' d e p a r t u r e of t h e shock f r o n t from p l a n a r i t y . 2 ' 6 ' 7
gauges spaced a r b i t r a r i l y a l o n g t h e tube .
r e v e a l e d t h e p r e s e n c e o f s i n g l e s p i n . That t h i s s ca t t e r is i n f a c t a t t r i b u t a b l e t o
a g e a x i a l v e l o c i t y is conf i rmed by t h e d i f f e r e n c e s i n a r r i v a l times measured by t h e f o u r p r e s s u r e gauges p l a c e d i n a r i n g a round the t u b e . These d i f f e r e n c e s were as ,
g r e a t as 11 usec, c o r r e s p o n d i n g t o a 15 mm d i f f e r e n t i a l i n a x i a l p o s i t i o n , i n shock waves 'where t h e smoked f o i l con f i rmed t h e p r e s e n c e of s ing le -headed s p i n .
F i n a l l y , t h e o c c u r r e n c e o f s ing le -headed s p i n i s demons t r a t ed v e r y g r a p h i c a l l y in t h e open s h u t t e r pho tograph r ep roduced i n Fig. 1.
A c o n c e n t r a t i o n i n t h e r e a c t i o n zone , which p e r s i s t e d f o r s e v e r a l hundred micro- I
1 !
A f t e r p a s s a g e o f a spinninp, wave,
I
F o i l s p l aced o n l y on t h e end w a l l are more
t
T h i s l e a d s t o s c a t t e r i n t h e a p p a r e n t shock .._.. ~ ..^,^^ :*.- .a^> -1 c-__ - I _ _ *:-. I-- 1 - I._& - . . - 1 - r ..L^ -L-->. w o w = r s i v c r ~ y u s u u c ~ u I L V ~ C L I ~ ~ i i i i r I I I L ~ L . V ~ I D ~ r ~ w e r i i a L ' L ' A v a L UI ~ i i e ~ I I U C ~ at
T h i s scat ter i n a p p a r e n t v e l o c i t y was o b s e r v e d t o be as g r e a t as '10% o v e r 30 cm i n t e r v a l s i n waves where t h e end f o i l s \ I
t h e r e v o l v i n g , nonp lana r shock f r o n t which moves a t .much more n e a r l y c o n s t a n t a v e r - \ ,I
f '
\
Q u a n t i t a t i v e examina t ion o f t h e c o n d i t i o n s under which s p i n and r e l a t e d in - s t a b i l i t y phenomena o c c u r is hampered by t h e u n c e r t a i n t y i n t h e measurement o f t h e a x i a l v e l o c i t y wi th t h e p r e s e n t i n t e r v a l method. N e v e r t h e l e s s , d e t e r m i n a t i o n of t h e approx ima te r a n g e s o f c o n d i t i o n s unde r which s p i n is observed h a s been pursued . The Chapman-Jouguet v e l o c i t y o f t h e 1% C 2 H 2 , 1.5% 0 2 , 97.5% A r m i x t u r e i n i t i a l l y a t room t e m p e r a t u r e and ca. 0 . 1 atm p r e s s u r e is a b o u t 0.9 km/sec, and t h e v e l o c i t i e s of t h e shock waves s t u d i e d were be tween 1 . 0 and 2.0 km/sec. A t each of t h e t h r e e i n i t i a l p r e s s u r e s s t u d i e d , t h e r e i s a r a n g e o f shock v e l o c i t i e s above 1.0 km/sec i n which n e i t h e r s ing le -headed s p i n n o r any o t h e r d i s c e r n i b l e p e r t u r b a t i o n a t t h e shock wave f r o n t was obse rved . A t po = 20 and 50 Torr, t h e o c c u r r e n c e of chemica l r e a c t i o n be- h i n d t h e shock f r o n t was i n d i c a t e d a t shock v e l o c i t i e s above ca. 1.1 km/sec by t h e growth and subsequen t l e v e l i n g off o f a b s o r p t i o n of t h e u l t r a v i o l e t l i n e r a d i a t i o n o f OH. But ev iaence o f s p i n w a s n o t p r e s e n t i n smoked f o i l o r open s h u t t e r photo- g r a p h i c r e c o r d s e x c e p t a t v e l o c i t i e s above ca. 1.2 km/sec f o r po = 50 T o r r and above ca. 1.33 k m / s e c f o r po 20 Tor r . a t v e l o c i t i e s as low as ca. 1.10 km/sec , b u t n o t a t still lower v e l o c i t i e s . A t t h e s e lower v e l o c i t i e s , where f o r normal shock waves t h e t e m p e r a t u r e b e f o r e r e a c t i o n l i e s below abou t 1300°K, OH r a d i c a l a b s o r p t i o n d i d n o t p rov ide a good means of de- t e c t i n g t h e o c c u r r e n c e of r e a c t i o n , even though o t h e r work9 has shown t h a t t h e i n - d u c t i o n zone, s c a l e d f o r d e n s i t y of r e a c t a n t s , l i e s w e l l w i t h i n t h e t i m e and s p a c e r eg imes o f t h e p r e s e n t expe r imen t s . E v i d e n t l y , l i t t l e OH i s formed u n l e s s t h e com- b u s t i o n t a k e s p l a c e a t h i g h e r t e m p e r a t u r e s t h a n t h i s .
'vlhen t h e shock v e l o c i t y was r a i s e d above t h e t h r e s h o l d r a n e e f o r s i n z l e s p i n , s p i n modes of h i g n e r m u l t i p l i c i t y were ob ta i r i ea . For example, a t po = 50 T o r r , s ine l e -headed s p i n was o b t a i n e d f a i r l y r e p r o d u c i b l y n e a r 1 . 3 k m / s e c , b u t shock f r o n t s w i t h 2, 3, o r 4 v i s i b l e creases e x t e n d i n g t o t h e p e r i m e t e r of t h e end p l a t e smoked f o i l s were common n e a r 1 . 4 km/sec. The a b i l i t y of smoked and p l a t e f o i l s t o r e c o r d t h e impinqement of h i g h l y segmented f r o n t s i n t n e i n t e r i o r of t h e shock t u b e , as has been done so s u c c e s s f u l l y i n unsuppor ted was d i sappo i r i t i nE . A t shock v e l o c i t i e s above ca. 1.5 km/sec a t po = 50 T o r r , on ly small, i s o l d t e d sec- ments of wave i n t e r s e c t i o n t r a c k s were reco rded . Thus w h i l e t h e p r e s e n c e o f p e r - s i s t e n t s p i n - l i k e p e r t u r b a t i o n s i s i n d i c a t e d , it was n o t p o s s i b l e t o o b s e r v e any o r d e r l y s t r u c t u r e o r s t u d y v a r i a t i o n o f s t r u c t u r e w i t h shock v e l o c i t y .
OH a b s o r p t i o n o s c i l l o g r a m s showed pronounced u n d u l a t i o n s n o t o n l y i n e x p e r i - ments where s i n E l e s p i n was i n d i c a t e d , b u t a l s o i n expe r imen t s w i t h c o a r s e m u l t i - headed s p i n . In s t i l l f a s t e r shock waves, tnough, t h e s t r u c t u r e was e v i a e n t l y of s u f f i c i e n t l y f i n e s c a l e a n d / o r low i n t e n s i t y t h a t p r o p e r t i e s a v e r a g e d o v e r t h e t u b e d i a m e t e r , as by a photon beam a b s o r p t i o n e x a e r i m e n t , may become u s a b l e f o r d e t e r m i n a t i o n of combustion s t o i c h i o m e t r y and t n e c o u r s e o f slow chemica l changes t h a t f o l l o w behind t h e i n d u c t i o n zme.
A t 120 Torr, s i n g l e - h e a d e d s p i n o c c u r r e d
Another reg ime of i n t e r e s t i n g phenomena was found i n r e a c t i v e shocks a t ve loc - i t i e s j u s t below t h o s e a t which s ing le -headed s p i n was obse rved . o s c i l l o ~ r a m s were n o t r e p r o d u c i b l e , sometimes i n d i c a t i n g a b r u p t f o r m a t i o n of l a r g e q u a n t i t i e s o f OH and on o t h e r o c c a s i o n s , unde r c l o s e l y s i m i l a r c o n d i t i o n s , showing s c a r c e l y d e t e c t a b l e appea rance o f OH. wave prop,ress down t h e t u b e showed scat ter which was a p p r e c i a b l e , w i t h d i f f e r e n c e s i n a p p a r e n t v e l o c i t y a s l a r g e as 3% between s u c c e s s i v e 30 cm i n t e r v a l s . Tests re- v e a l e d co r re spond inn d e p a r t u r e s of t h e shock f r o n t s from p l a n a r i t y , which were on ly abou t o n e - t h i r a as large a$ t h o s e found when s p i n was i d e n t i f i a b l e . r e c o r d s showed no c r e a s e s extendinp, t o t h e p e r i m e t e r o f t h e tube . p l a t e f o i l s showed p a t c n e s of i n d i s t i n c t d i s t u r b a n c e i n t h e i n t e r i o r of t h e tube .
On t h e b a s i s o f t h i s somewhat i ncomple t e c h a r a c t e r i z a t i o n o f t h e s e sub- s p i n n i n g i n s t a b i l i t i e s , it is nypo thes i zed t h a t t h e y r e p r e s e n t i r r e g u l a r i t i e s i n t h e r e a c t i o n zone whicn a r e n o t of s u f f i c i e n t , l o c a l i z e d e x o t h e r m i c i t y t o ex tend t h e i r i n f l u e n c e i n l a r g e a m p l i t u d e form t o t h e shock f r o n t or are n o t of p rope r wavelength t o c o u p l e t o a c o u s t i c o s c i l l a t i o n s o f t h e burned gas . A t t e n t i o n i s h e r e drawn to i n t e r f e r o g r a m s o f r e a c t i v e shock waves i n d i l u t e exo the rmic s y s t e m s ,
OH a b s o r p t i o n
Raster o s c i l l o s c o p e r e c o r d s o f t h e shock
Smoked f o i l I n s t e a d , end
32.
i n c l u d i n z a n : iH3 - O2 sys t em” and one of t h e E2 - 02 - A r m i x t u r e s 1 2 p r e v i o u s l y used fo r k i n e t i c s s t u d i e s i n o u r L a b o r a t o r y 5 i n which a t i n i t i a l p r e s s u r e s be- tween 100 and 200 Torr t h e r e had been pronounce? u n d u l a t i o n s i n OH a b s o r p t i o n ,
o s c i l l o g r a m s . These i n t e r f e r o g r a m s showed t h a t t h e shock f r o n t is q u i t e f l a t , t h o u z n s l i g h t l y t i l t e d i n t h e t u b e , b u t t h e r e a c t i o n zone is much more s i q n i f i - c a n t l y d i s t u r b e d . I t a lso seeins a p p r o p r i a t e to r e p o r t t h a t a t t e m p t s t o r e c o r d smoked f o i l i n s c r i G t i o n s i n t h e 112 - 0 2 - A r m i x t u r e under t h e s e same c o n d i t i o n s qave n e g a t i v e r e s u l t s .
t i i f same sys te r r , we n o t e t h a t most of t n e k i n e t i c s s t u d i e s , 1 3 some of which have used more c o n c e n t r a t e d m i x t u r e s t n a n t h e p r e s e n t o n e , nave been l o n e i n an i n i t i a l p r e s s u r e reg ime an o r d e r o f mayni tude lower. 111 a d d i t i o n , many of t h e s t u d i e s have been done u s i n 2 r e f l e c t e d s h o c k waves and i r , ways which are n o t so s u b j e c t t o , i n t e r - f e r e n c e by t r a n s v e r s e waves e i t i i e r a t t h e snock f r o n t or i n t h e r e a c t i o n zone.
To r e l a t e tlie p r e s e n t work i n a c e t y l e n e - oxygen m i x t u r e s t o o t h e r work i n
The o c c u r r e n c e o f s p i n i n an envi ronment d i v o r c e d from m a r g i n a l l y p r o p a g a t i n g d e t o n a t i c n would ai’pear t o o f f e r a h e r e t o f o r e u n r e a l i z e d o p p o r t u n i t y t o s t u d y t h e l i m i t i n ? c o n d i t i o n s for t h e o c c u r r e n c e of s p i n v i t n a d d i t i o n a l v a r i a b l e s a t o n e ’ s c o m a n d i n t n e ho?e o f e l u c i d a t i n i : d e t o n a t i o n l i m i t phenomena. The l a c k of s h a r p - n e s s of t i ie limits o h s e r v e d i n t h e ? r e s e n t sys tem d e t r a c t s somewhat from t h e d t -
t r a c t i v r n e s s of t:iis a ~ ~ i r o . i c i 1 , : )u t furt1ic-r a o r ~ nay De a p a r o p r i a t e .
. na . - .. ,e:, o:,si?rve:. i n t i i e s e dv.iven inosh \ j ives t o hrrowi i ; r o p e r t i e s o f t h e ci iemical n:ix- liirc. Fro: t i le c i ; ? i t t e < : l y . : i .u te value:; of t i ie tiire;ho:d v e l o c i t i e s fo r s p i n ,
a 2: i <? 1 I n r: uc t i c,n zoi; E 1 e I: 7, L i l r i::e t e n 3 e r a t u r t a [ i d d e n s i t y behind t i ie a x i a l -
A. i,riei’ a t t e r n t i s n a i e iiere t o r e l a t e some p r a m e t e r s of t h e sirir;le s p i n n i n g
> t h r e s n o l d , , it t i i t t i .F i e ? X t.-, L i n i t i a l ;iressures, tiie i n d u c t i o n t i n e s t ; anc!
i n i n ? shock f r o n t s have i~e,en e v a l u a t e d frorn T h e s e v.l.liies a r e r e c o r d e d i n T a i l c 1, where
r:c 1eri:;tiis C c r t i i esc s ? i n n i n Z i;aves a r e n o t con- r d e n s i t y , anci a r e a11 snal.ler t h a n tkic IOC ir.m
?,. ~ : i e r,ecin ; . i ~ c n r i r i q i i , 3, f r o 3 smoked s i d e f o i l s anti t h e nean a x i a l v e l o c i t y , i j , were o t ta ine : l from se?;ir<ite ex ; ie r iments , done for 90 = 20 and 50 Torr , eaci l a t c c n s t a n t t u b e loiidin:: co c i i t i o n s . ‘.?!lese d a t a x e r e conbined t o d e t e r m i n e t h e c i r - cuni!-ereiiti;il v e l o c i t y c o ponei.? of t n e s i n ~ l e s p i n untier t h e s e two c o n d i t i o n s . I ‘Ta!;le TI t n e s e a r e rrcor e d an2 c o m a r e d w i t i l t iie p e r i m e t r a l v e l o c i t y f o r p u r e
t
fur idamental i r c u a t i o j j i r i . t h e _rea_cteti gas. es-tinidted f o r a - p l a n e
t i m e s tae sound v e l o c i t j r , c ) . l 4 A.lso t a b u l a t e d a r e the Chapman-Jouguet d e t o n a t i o n v e l o c i t i e s D’CJ i c r t h e unsuFpor t ed d e t o n a t i o n o f t h e h o t , compressed, u n r e a c t e d cas Lehind t h e 2r inar-y m o c k f r o n t havinr; v e l o c i t y 9. The c i r c u m f e r e n t i a l v e l o c - i t y of t h e t r a n s v e r s e s p i n wave d t t h e tribe p e r i m e t e r is s e e n t o l i e between these two c i l a r a c t e r i s t i c v e l o c i t i e s o f tile sys tem, wnich a r e s u f f i c i e n t l y d i f f e r e n t from eact , o t h e r under t h e p r e s e n t e x p e r i m e n t a l c i r c u m s t a n c e s t h a t t h e s p i n n i n g wave cannot be i n close r e s o n a n c e w i t h b o t h , cis i t n a s been found t o be i n c e r t a i n u n - ’ su?; ,or tec sp innine , ( j e t o n a t i o n s . 1 4 ’ 1 5
I n s i p l e s t ttrrns, t h e e x p e r i m e n t s d e s c r i b e d here show t h a t t h e o c c u r r e n c e of s i n e l e - h e a d e d s p i n , whicn may be u n i v e r s a l l y a s s o c i a t e d w i t h u n s u p p o r t e d d e t o n a - t i o n s a t tiie l i n i t s of t h e i r a b i l i t y t o p r o p a g a t e , is n o t e x c l u s i v e l y a p r o p e r t y of u n s u p p o r t e d waves or of Chapman-JouEuet f low.
oxycen - a r z o n m i x t u r e was first i d e n t i f i e d were c a r r i e d o u t i n J u l y 1 9 6 3 by 1.1. P . Eastman and P. F. 8 i r d , and i n c o l l a b o r a t i o n w i t h P ro f . K. A . S t r e h l o w . J . L. Young and J . G . d i l l i a m s o n c a r r i e d o u t most of t h e s u b s e q u e n t e x p e r i m e n t a l w o r k .
stdock wave 3 c t-re w i t ; ) r e a c t i o n to c h e m i c a l e q u i l i b r i u m (1.81+
The i n i t i a l e x p e r i m e n t s i n wnich t h e o c c u r r e n c e o f s p i n i n t n i s a c e t y l e n e -
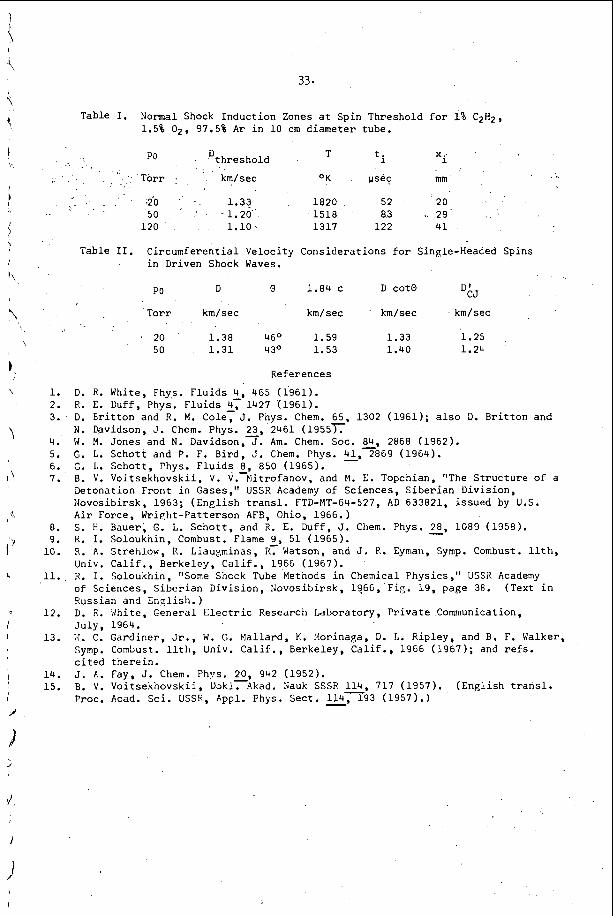
33.
Table I. Normal Shock I n d u c t i o n Zones a t Sp in Thresho ld for 1% C2H2, 1.5% 02, 97.5% A r i n 1 0 cm d i a m e t e r t ube .
X ti i
' T o r r km/sec OK p s e c mm
20 1.33 1820 52 20 50 . - 1 . 2 0 1518 8 3 29
120 1 .10 1317 122 4 1
PO D t h r e s h o l d T
Table 11. C i r c u m f e r e n t i a l V e l o c i t y C o n s i d e r a t i o n s f o r SinRle-Headed Sp ins i n Dr iven Shock Waves.
D c o t 0 %J PO D 0 1.84 c
Torr km/sec km/sec km/sec km/sec
20 1 .38 46O 1.59 1 .33 1 .25 50 1 .31 430 1 .53 1.40 1.24
1. 2. 3.
4 . 5. 6. 7.
8. 9. 10.
11.
12.
13 .
14. 15.
Re fe rences
D. R. W h i t e , Phys. F l u i d s 4 , 465 (1961) . R. E. Duff , Phys. F l u i d s 2; 1427 (1961) . D. B r i t t o n and R. M. Cole, J . Pnys. Chem. 65, 1302 (1961) ; a l so D. B r i t t o n a n d N. Davidson, J. Chem. Phys. 23, 2461 ( 1 9 5 5 r W. ?1. J o n e s and N. Davidson , J . Am. Chem. SOC. e, 2868 (1962) . G. L. S c h o t t and P. F. B i r d , J. Chem. Phys. 2, 2869 (1964) . G. L. S c h o t t , Phys. F l u i d s 8, 850 (1965) . B. V. V o i t s e k h o v s k i i , V . V. Mi t rofanov, and M. E. Topchian , "The S t r u c t u r e of a De tona t ion F r o n t i n Gases," USSR Academy o f S c i e n c e s , S i b e r i a n D i v i s i o n , Novos ib i r sk , 1963; ( E n g l i s h t r a n s l . FTD-MT-64-527, A D 633821, i s s u e d by U.S. A i r Force , Wr iEh t -Pa t t e r son AFB, Ohio, 1966. ) S. H. Bauer , G. L. S c h o t t , and R. E,. Duff , J. Chem. Phys. 2, 1089 (1958) . R. I. So loukn in , Combust. Flame 9, 5 1 ( 1 9 6 5 ) . R. A. St ren low, R. Liaup,minas, R. Watson, and J . R . Eyman, Symp. Combust. l l t h , Univ. C a l i f . , Be rke ley , C a l i f . , 19GG (1967) . R. I. So loukh in , "Some Snock Tube Metnods i n Chemical Phys ic s , " USSR Academy of S c i e n c e s , S i b e r i a n D i v i s i o n , B o v o s i b i r s k , 1966, F ig . 1 9 , page 38. (Text i n Russ ian and b n v l i s h . D. 9. d h i t e , G e n e r a l E lec t r i c Research Labora to ry , P r i v a t e Communication, J u l y , 1964. X. C. G a r d i n e r , Jr., W. G. Ma l l a rd , K. Morinaga, D. I,. R i p l e y , and B. F. Walker, Symp. Combust. l l t h , Univ. C a l i f . , Be rke ley , Cal i f . , 1966 (1967) ; and refs. c i t e d t n e r e i n . J . A . Fay, J . Chem. Phvs. 20, 942 (1952) . B. V. V o i t s e n h o v s k i i , DsklFAkad. Nauk SSSR 2, 717 (1957) . Proc. Acad. S c i . USSR, Appl. Phys. S e c t . 2, 193 (19571. )
( E n g l i s h t r a n s l .
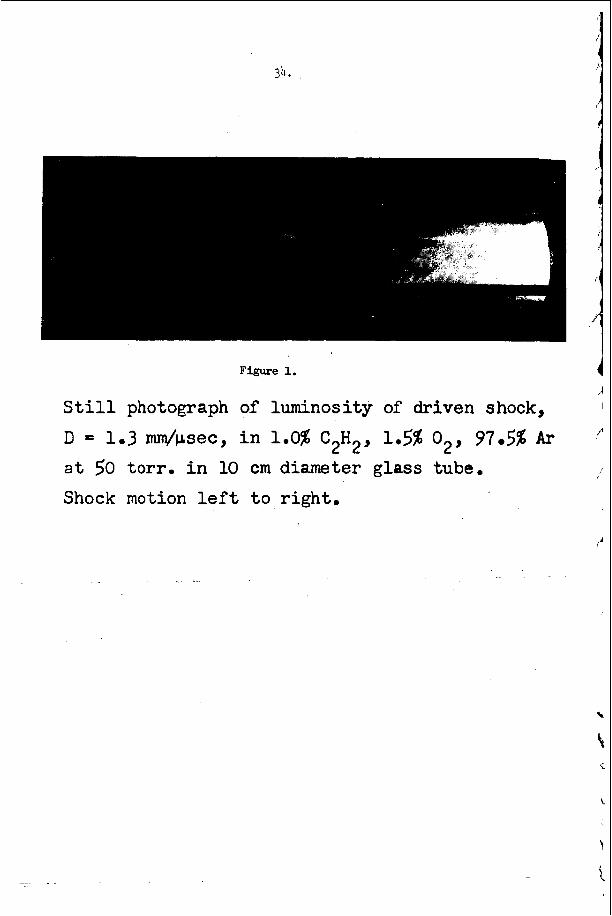
34.
Figure 1.
S t i l l photograph of luminosity of driven shock, D = 1.3 mm/psec, in 1.0% C2H2, 1.5% 02, 97.5% Ar a t 50 t o r r . i n 10 cm diameter glass tube. Shock motion l e f t t o right.
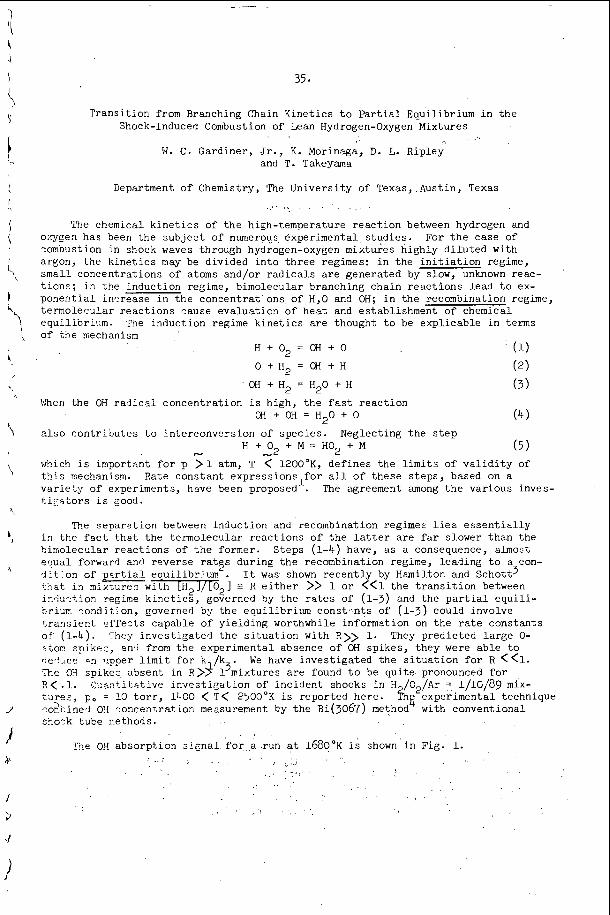
35.
Transi t ion from Branching Chain Kine t ics t o P a r t i a l Equ.ilibrium i n the Shock-Induced Combustion of Lean Hydrogen-Oxygen Mixtures
W. C. Gardiner, Jr., K. Morinaga, D. L. Ripley and T. Takeyama
Department of Chemistry, Tne Univers i ty of Texas,.Austin, Texas
. . : 1 ... . . ’ _ ,
T h e chemical k i n e t i c s of t h e high-temperature reac t ion between hydrogen and oxygen has been the subjec t of numerous, exper imenta l . s tud ies . For t h e case of -:ombzstion i n shock waves through hydrogen-oxygen mixtures h ighly d i l u t e d with argon, the k i n e t i c s may be divided i n t o t h r e e regimes: i n t h e i n i t i a t i o n regime, small concentrat ions of atoms and/or r a d i c a l s a r e generated by slow, unknown reac- t i o n s ; i n t h e induct ion regime, bimolecular branching chain r e a c t i o n s lead t o ex- ponept ia l increase i n t h e concent ra t ’ons of H,O and OH; i n t h e recombination regime, termolecular reac t ions cause evaluat ion of hea t and establ ishment of chemical equi l ibr ium. The induct ion reg-ime k i n e t i c s a r e thought t o be expl icable i n terms of t h e mechanism
H + O2 = OH + 0
0 + H 2 = OH f H
OH + H2 = H20 + H
(1)
( 2 )
( 3 ) !.,!hen t h e Of r a d i c a l concentrat ion i s high, t h e f a s t reac t ion
OH + OH = H 2 0 + 0 (4) a l s o cont r ibu tes t o interconversion of spec ies . Neglecting t h e s t e p
w!!ich i s important f o r I, >I atm, T < 1200“K, def ines t h e l i m i t s of v a l i d i t y of t h i s nechanism. Rate constant expressions f o r a l l of these s t e p s , based on a 1 v a r i e t y o f experiments, h.we been proposed . , The agreement among t h e var ious inves- t i E + t o r s i s good.
H + O2 + M = H02 + M ( 5 1 - N
The separa t ion between induct ion and recombination regimes l i e s e s s e n t i a l l y i n t h e f t ic t t h a t t h e termolecular reac t ions of t h e l a t t e r a r e f a r slower than the bimolecular reac t ions of t h e former. Steps (1-4) have, a s a consequence, almost equal forward and reverse rat s during t h e recombination regime, leading t o a con-
+;?:at i n mixture:: with 1 H2J/L0,] = R e i t h e r >> 1 or <<1 t h e t r a n s i t i o n between in~- lu~r t ion regime k i n e t i c s , governed by t h e r a t e s of (1-3) and t h e p a r t i a l e q u i l i - k . r i w . :onditl on, governed by t h e equi l ibr ium const.:nts of (1-3) could involve transient e f f e c t s capable of y ie ld ing worthwhile information on t h e rate constants of’ (1-4) . ?tor?. spike:, an,; from t h e experimental absence of OH spikes , they were a b l e t o 4 e * ! u c ~ z n >:?per l i m i t f o r k /k The 03 spike: absent i n R>3 1 3 ~ i x t u r e s a r e found t o be q u i t e pronounced fo r R < .l. C . “d;e:, p. = 10 t o r r , 1400 < T < 2500°K is reported here . :or:oined Di -oncentrat ion measurement by t h e Bi(3067) m e t k ‘ with conventional shock tube nethods.
, I : + ’ 5 - > . o n of p2r t ia . l equi l ibr ium . It was shown r e c e n t l y by H a m i l t o n and Schott3
They inves t iga ted t h e s i t u a t i o n with R)) 1. They predicted l a r g e 0-
We have inves t iga ted t h e s i t u a t i o n f o r R <<l.
Cuant i tc t ive i n v e s t i g a t i o n of inc ident shocks i n H /02 /Ar =. i/ic/89 mix- experimental technique
3-e 09 absorpt ion s i c n a l f o r a run a t 1 6 8 0 ~ ~ i s shown i n Fig. 1.
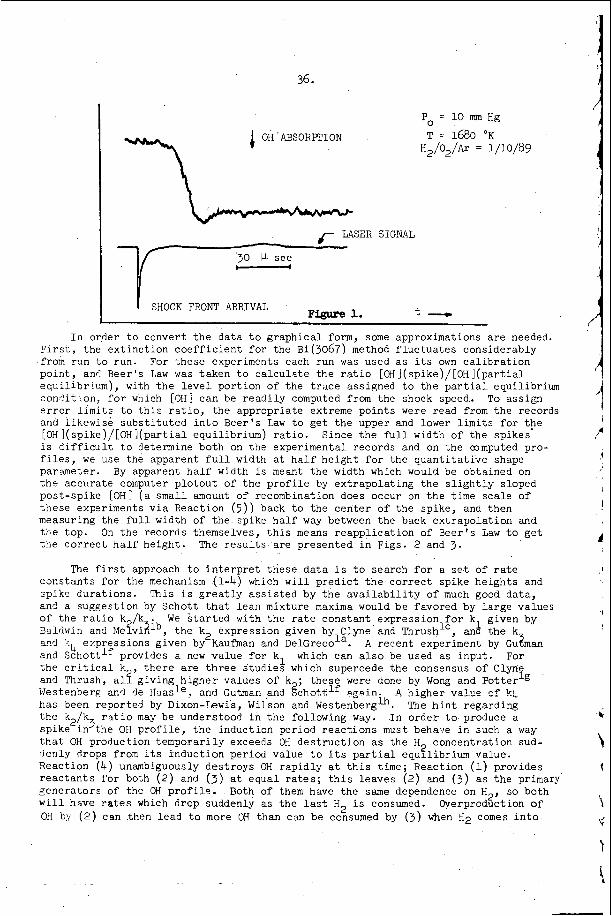
36.
4 OH .ABSORPTION
Po = 10 mm Hg
T = 1680 'K H2/02/Ar = 1/10/89
c LASER SIGNAL - SHOCK FRONT ARRIVAL Figure 1. t -
In or,der t o convert t h e da ta t o graphica l form, some approximations a r e needed. F i r s t , t h e ex t inc t ion c o e f f i c i e n t f o r t h e Bi(3067) method f l u c t u a t e s considerably
.from run t o run. po in t , a n ? Beer's Law was taken t o c a l c u l a t e t h e r a t i o [OH](spike)/[OH](partial equi l ibr lum) , with t h e l e v e l por t ion of t h e t r a c e assigned t o t h e p a r t i a l equilibrium con:!ition, f o r which [OH] can be r e a d i l y computed from t h e shock speed. To ass ign e r ro r l i m i t s t o t h i z r a t i o , t h e appropriate extreme poin ts were read from t h e records and Likewise s u b s t i t u t e d i n t o Beer ' s Law t o ge t t h e upper and lower l i m i t s f o r t h e [OH](spike)/[OH](partial equi l ibr ium) r a t i o . i s d i f f i c u l t t o determine both on the experimental records and on t h e oomputed pro- f i l e s , we use the apparent f u l l width a t h a l f h e i g h t f o r t h e q u a n t i t a t h e shape parameter. By apparent h a l f width i s meant t h e width which would be obtained on t h e accurate computer p l o t o u t of t h e p r o f i l e by ex t rapola t ing t h e s l i g h t l y sloped post-spike [OH] ( a small amount of recombination does occur on t h e time sca le of these experiments v i a Reaction ( 5 ) ) back t o the c e n t e r of t h e spike, and then measuring t h e full width of t h e spike h a l f way between t h e back ex t rapola t ion and t h e top. t h e c o r r e c t h a l f he ight . The r e s u l t s a r e presented i n Figs . 2 and 3 .
For these experiments each run was used a s i t s own c a l i b r a t i o n
Since t h e full width of the sp ikes
On t h e records themselves, t h i s means r e a p p l i c a t i o n of Beer's Law t o g e t
. .
The f i r s t approach t o i n t e r p r e t t h e s e d a t a i s t o search f o r a s e t of r a t e c o n s t a n t s f o r the mechanism (1-4) which w i l l p r e d i c t t h e - c o r r e c t spike he ights and spike dura t ions . and a suggest ion by Schot t t h a t lean mixture maxima would be favored by l a r g e values of t h e r a t i o k /k Saldwin and Me?viAib, t h e k2 expression given by Clyne and Thrushlc, an& t h e k s ~ d '?4 expressions given by Kaufman and DelGrecola. and S c h o t t l f provides a new va lue f o r kl which can a l s o be used as input . t h e c r i t i c a l 1.. and Thrush, a 1
has been reported by Dixon-Lewi's, Wilson and Westenberglh. t h e k /k spike i n the OH p r o f i l e , t h e induct ion per iod r e a c t i o n s must behave i n such a way t h a t OH production temporar i ly exceeds OH des t ruc t ion as the H concentrat ion sud- rlenly drops from i t s induct ion period value t o i t s p a r t i a l equi l ibr ium value. Reaction (4 ) unambiguously des t roys OH r a p i d l y a t t h i s time; Reaction (1) provides ,
r e a c t a n t s f o r both ( 2 ) and ( 3 ) at equal rates; t h i s leaves (2) and (3) a s t h e primary genera tors of the OH p r o f i l e . w i l l hsve rates which drop suddenly as t h e l as t H2 i s consumed. OH by (2 ) can then lead t o more OH than can be consumed by ( 3 ) when H 2 comes i n t o
This i s g r e a t l y a s s i s t e d by t h e a v a i l a b i l i t y of much good data ,
given by We s t a r t e d with t h e r a t e cons tan t ,express ion f o r k
A recent experiment by Guzman For
t h e r e a r e t h r e e s t u d i e s which supercede t h e consensus of Clyne giving h igher va lues of k . these were done by Wong and P o t t e r l g ?' . .
annin. A- higher 7cah.e ef Ir!. Westenberg and (le Hassle, and Gutman ,and 8&o+.tlf -.". -.. A . 4
The h i n t regarding I n order t o produce a r s t i o may be understood i n t h e following way.
2 3
2
Both of them have t h e same dependence on H2, so both Oyerproduction of
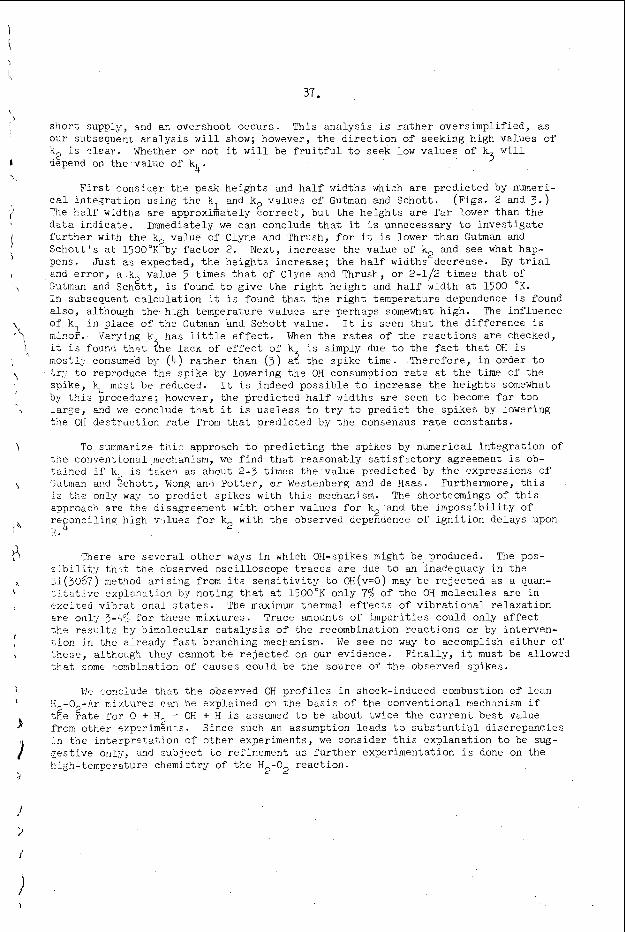
37.
shor t supply, snd an overshoot occurs . This ana lys i s is r a t h e r oversimplif ied, as our s:tbsequenr; ana lys i s w i l l show; however, t h e d i r e c t i o n of seeking high values of k, i s c lear . depend on t h e - v a l u e of k4.
c a l in tegra t ion Esing t h e k ?!?e h e l f widths a re approxiAately c o r r e c t , but t h e he ights a r e f a r lower than t h e d a t a ind ica te . Immediately we can conclude t h a t it ;s unnecessary t o i n v e s t i g a t e f u r t h e r with t h e k, value of Clyne and Thrush, f o r it i s lower than Gutman and S c h o t t ' s a t 1500"Kdby f a c t o r 2. Next, increase the value of k2 and see what hap- pens. J u s t as expected, t h e he ights increase ; t h e h a l f widths decrease. By t r i a l and e r r o r , a k2 value 5 times t h a t of Clyne and Thrush, or 2-112 t imes t h a t of nutman and Schot t , i s found t o g ive t h e r i g h t he ight and h a l f width a t 1500 OK.
I n subsequent c a l c u l a t i o n it i s found t h a t t h e r i g h t temperature dependence i s found a l s o , although the. high temoerature va lues a r e perhaps somewhat high. The inf luence of k, i n place of t h e Gutman and Schott value. minof.. Varying k has i i t t l e e f f e c t . When t h e r a t e s of the reac t ions a re checked, it i s found t h a t ?he lack of e f f e c t of k most;;- consumed by (4 ) r a t h e r than ( 3 ) a2 t h e spike time. .Therefore, i n order t o tr:j t o reproduce %he spike by lowering t h e OH consumption r a t e a t t h e time of t h e q i k e , k must be reduced. I t i s indeed poss ib le t o increase t h e he ights somewhat by t h i s procedure; however, t h e pred ic ted h a l f widths a re seen t o become f a r too la rge , 6nd we conclude t h a t it is u s e l e s s t o t r y t o p r e d i c t t h e sp ikes by lowering tile OH des t ruc t ion r a t e from t h a t predicted by t h e consensus r a t e constants .
Whether or not it w i l l be f r u i t f u l t o seek low va lues of k w i l l 3
F i r s t consider t h e peak he ights and half widths xhich a r e pred ic ted by numeri- and k2 va lues of Gutman and Schot t . (Figs . 2 and 3 , )
It i s seen t h a t t h e d i f fe rence i s
i s simply due t o t h e f a c t t h a t OH i s
4
To swrmarize thi:: approach t o pred ic t ing t h e spikes by numerical in tegra t ion of ??e conventional mechanism, we f i n d t h a t reasonably s a t i s f x t o r y agreement i s ob- te ined i f k, i s taken as about 2-3 times t h e value predic ted by t h e expressions of 0.. a d a n c
is the only way t o predict, spikes with t h i s mechanism. The shortcomings of t h i s a p p n a c ? a re the disagreement with o ther values f o r k2'and t h e imposs ib i l i ty of re onci l lnq high v i l u e s f o r k 3.
and s c h o t t , Wong and P o t t e r , or Westenberg and de Haas. Furthermore, t h i s
with t h e observed dependence of i g n i t i o n delays upon E 2
?here a re s e v e r a l o ther ways i n which OH-spikes might be produced. The pos- slbilit:! t h ? t t h e observed osc i l loscope t r a c e s a r e due t o an inadequacy i n t h e Xi(5067) method a r i s i n g from i t s s e n s i t i v i t y t o OH(v=O) may be r e j e c t e d a s a quan- t i t a t i v e explanat ion by not ing t h a t a t 1500°K only 7% of t h e OH molecules a r e i n exci ted v i b r a t - o n a l s t a t e s . The maximum thermal e f f e c t s of v i b r a t i o n a l re laxa t ion w e onl;? 3-k$ f o r these mixtures . Trace amounts of impur i t ies could only a f f e c t t he r e s - l t s by bimolecular c a t a l y s i s o f the recombination r e a c t i o n s or by interven- xion in the al ready f a s t branching mechanism. We see no way t o accomplish e i t h e r of Lzese, although they cannot be r e j e c t e d on our evidence. F ina l ly , it must be allowed t h a t some -:onbination of eamer, could be t h e source of t h e observed spikes . L 1
WE ,:onelude t h z t t h e observed OH p r o f i l e s i n shock-induced combustion of lean 3--0 -?-.r c i x t u r e s c m be explained on t h e b a s i s of the conventional mechanism i f +fie r a t e f o r 0 + 5 = OH + H i s assumed t o be about twice t h e c u r r e n t b e s t value from other ex_oerimen-.s. Since such an assumption leads t o s u b s t a n t i a l discrepancies In t h e i n t e r p r e t a t i o n of o ther experiments, we consider t h i s explanat ion t o be sug- z e s t i v e only, and sub,ject t o refinement as f u r t h e r experimentation i s done on t h e bigh-tercperature chemistry of t h e H2-02 reac t ion .
2 2
38.
Acknowledgement
We a re indebted t o B. F. Walker and C. B. Wakefield for assistance with the computational aspects of t h i s research. Our work was supported by the U. S. Army Research Office - Durham, The Robert A. Welch Foundation and The University of Texas Research Ins t i t u re .
References
1. ( a ) F. Kaufman and F. P. DelGreco, Symp. Combust. gth, Cornell University, I thaca, New York, 1962, 659 (1963); (b) R. R. B ldwin and A. Melvin, J. Chem. SOC. 1964, 1785; ( c ) M. A. A. Clyne and B. A. Thrush, Nature 189, 135, 1961; ( d ) R. W. Getzinger md G. L. Schott, J. Chem. Pnys. 43, 3 2 7 7 7 9 6 5 ) ; (e) A. A. Westenberg and N. de Haas, J. Chem. Rys . 46, 490 (19E); ( f ) D. Gutman and G. L. Schott, J. Chem. Phys., t o be published, 1967; (g) D. L. Ripleyand W. C. Gardiner, Jr., J. Chem. Phys. 44, 2285 (1966); (h ) G. Dixon-Lewis, W. E. Wilson and P. A. Westenberg, J. ChemyFhys. 44, 2877 (1966); ( i ) W. S. Watt and A.. L. Myerson, 6th InternationalShock Tube Symposium, Freiburg, 1967; ( j ) E. L. "ong and 4. E. Po t te r , J. Chem. Phys. 9, 3371 (1965).
2 .
3 . C . W. Yamilyon and G. L. Schott, Symp. Combust. l l t h , University of California,
G. L. Schott, J. Chem. Rys. 2, 710 (1960).
Berkeley, 1966.
4 . D. L. Ripley, d i s se r t a t ion , The University of Texas, January 1967.
Votp f o r Fig:. 2 and 3. metho.1; the dashed e r ro r b w s denote runs made using the water lamp method.
The s o l i d e r r o r bars denote runs made using the Bi(3067)
-
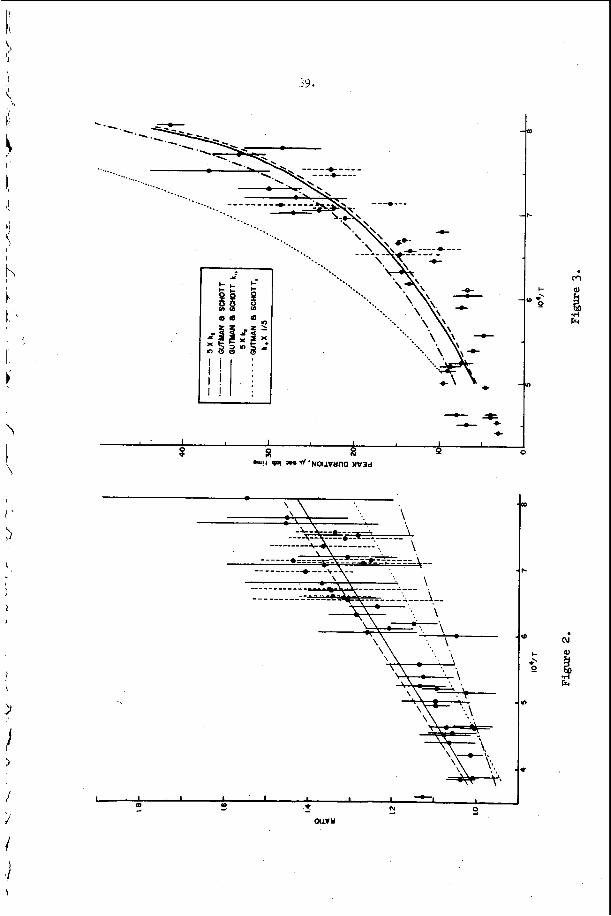
I
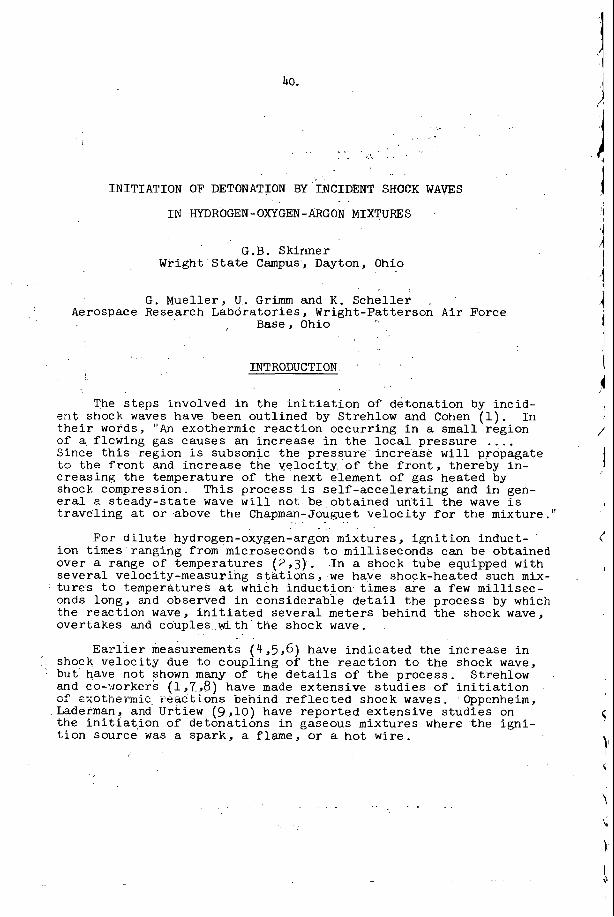
40.
.. . ".
INITIATION OF DETONATION BY "~NCIDENT SHOCK WAVES
I N HYDROGEN-OXYGEN-ARGON MIXTURJ3S
G.B. Skinner Wright S t a t e Campus, Dayton, Ohio
G . Muel ler , U . Grim and K . Sche l l e r . Aerospace Research Labora tor ies , Wright-Patterson A i r Force
, Base, Ohio
INTRODUCTION
The s t eps involved i n t h e i n i t i a t i o n of detonat ion by inc id- I n en t shock waves have been ou t l ined by Strehlow and Cohen
t h e i r words, "An exothermic r eac t ion occurr ing i n a s m a l l region o f a flcwing gas causes an increase i n the l o c a l pressure . .. . Since t h i s region i s subsonic the pressure increase w i l l propagate t o t h e f r o n t and inc rease the v e l o c i t y of t he f r o n t , thereby in - c reas ing the temperature of the next element of gas heated by shock compression. This process i s s e l f - a c c e l e r a t i n g and i n gen- e r a l e s t eady- s t a t e wave w i l l not be obtained u n t i l t he wave i s t r a v e l i n g at o r above t h e Chapman-Jouguet v e l o c i t y for t he mixture ."
For d i l u t e hydrogen-oxygen-argon mixtures , i g n i t i o n induct- ion t imes ranging from microseconds t o mi l l i seconds can be obtained over a range of temperatures ( 2 , 3 ) . I n a shock tube equipped with seve ra l velocity-measuring s t a t i o n s , we have shock-heated such mix- t u r e s t o temperatures a t which induct ion t imes are a few mi l l i s ec - onds long , and observed i n considerable d e t a i l t h e process by which t h e r eac t ion wave, i n i t i a t e d seve ra l meters behind the shock wave, overtakes and couples wi th the shock wave.
E a r l i e r measurements (4,5,6) have ind ica t ed t h e increase i n shock ve loc i ty due t o coupl ing of t h e r e a c t i o n t o the shock wave, but have not shown many of t h e d e t a i l s of t h e process . Strehlow and co-*xorkers (1,7,8) have made ex tens ive s t u d i e s of i n i t i a t i o n
C A U L I I C I I I I L L i e a c i i o n s benind r e f l e c t e d shock waves. Oppenheim, Laderman, and Urtiew ( 9 , l O ) have repor ted ex tens ive s tud ie s on t h e i n i t i a t , i o n of de tona t ions i n gaseous mixtures where the ign i - t i o n source was a spark , a flame , or a hot wi re .
(1).
,,C ^--^&I---- 1 -
. 1 . . , . . .
. .
41.
EXPERIMENTAL
A square shock tube 7.62 cm. on a s ide was used . This had a d r i v e r gas sec t ion 1.83 meters long and a sample gas sec t ion 6.10 meters long. Diaphragms were of 1 . 2 2 mm. t h i c k aluminum, s c r i b e d diagonal ly s o t h a t , when they b u r s t , four t r i a n g u l a r s ec t ions would f o l d back, one along each s ide of the tube . A i r w a s used as d r ive r gas .
a t the desired pressure (below the bu r s t ing pressure of the diaph- ragm), then the diaphragm was ruptured by a plunger . This permit t - ed c lose con t ro l (about 0.5%) over the d r i v e r gas p re s su re .
num heat t r a n s f e r gauges f o r ve loc i ty and hea t t r a n s f e r measurements, and with SLM Model 603 p iezoe lec t r i c gauges ( K i s t l e r Instrument Corporation , Clarence , New York) f o r pressure measurements. The
When a run was made, the a i r w a s added t o the d r ive r sec t ion
The sample gas s ec t ion w a s instrumented with th in - f i lm p l a t i -
pos i t i ons of these gauges w i t h r e spec t t o the diaphragm a r e l i s t e d i n Table I . .
Table I
Pos i t ions of Gauges with Respect t o Shock-Tube Diaphragm Gauge Distance Downstream from
Diaphragm, Meters
Heat t r a n s f e r No. 1 3.2004 Heat t r a n s f e r No. 2
4.6482 Heat t r a n s f e r No. Heat t r a n s f e r No. SLIM No. 1
3 : E;: 4.6991
Heat t r a n s f e r No.13 4.6991 Heat t r a n s f e r No. 5 4.8006 Heat t r a n s f e r No. 6 4 .go22
Heat t r a n s f e r No. 7 5.0038
Heat t r a n s f e r No.10 5.3086 Heat t r a n s f e r No.11 5.3594
.?
SLM No. 2 4.9530
Heat t r a n s f e r No. 8 5.1054 Heat t r a n s f e r No. 9 5.2070
Heat t r a n s f e r No.12 5.9690 Heat t r a n s f e r gauges 1, 2 , and 3, and SIN gauge 1 were mounted on the s ide of the tube; the o the r s were on the top. Heat t r a n s f e r gauge 1 3 was used to measure the r a t e of hea t t r a n s f e r from the gas t o the w a l l . The time base f o r a l l ve loc i ty measurements was a Tek- t ron ix Model 1 8 0 A time-mark genera tor . Outputs from the piezoelec- t r i c gauges were fed i n t o charge a m p l i f i e r s , then recorded using a .
42.
/ Tektronix Model 555 osc i l l o scope . The p i e z o e l e t r i c gauges were c a l i br ate d s t a t i c a1 l y aga ins t a p r e c i s i on l abor at ory p re s sure gauge.
t I n the temperature range under s tudy , the induct ion time f o r 1
RESULTS
i g n i t i o n of a hydrogen-oxygen-argon mixture v a r i e s r a p i d l y with -. temperature . Accordingly, a good many experiments were necessary t o determine the condi t ions needed t o br ing about coupling of the r eac t ion a n d shock waves i n the r i g h t p a r t of t he tube. This point i s i l l u s t r a t e d by the d a t a of Figure 1, which apply t o a gas mix- t u r e containing approximately 4% H2 and 2% 02 by volume i n argon.
With sample p re s su res above about 0.086 a t m . , the v a r i a t i o n of shock speed wi th sample pressure i s as one would expect when no chemical r eac t ion i s occurr ing . In the sample pressure range of 0.082 t o 0.086 a t m . , the shock speed reaches a high value as the r eac t ion wave ca t ches up t o t h e inc iden t wave. For lower sample p re s su res , the r e a c t i o n has coupled t o the shock wave before the wave reached the measuring s t a t i o n . The e f f e c t s of s m a l l d i f f e r - ences i n i n i t i a l p re s su re , and of o t h e r minor va r i ab le s such as the speed of diaphragm r u p t u r e , a r e shown by t h e th ree d i f f e r e n t shock speeds measured f o r presumably i d e n t i c a l runs at 0.084 a t m . Complete data f o r t hese th ree runs show t h a t i n one case t h e peak shock speed occurred before hea t t r a n s f e r gauge 8, i n one case be- tween gauges 8 a n d g , a n d i n the o t h e r case after gauge g .
I , ,
I A complete set of data f o r the run t h a t gave the h ighes t ve l -
oc i ty i n Figure 1 i s shown i n Figures 2 and 3 . The d a t a of Figure 3 have been redrawn from t h e o r i g i n a l osc i l loscope records i n order t o have the same time s c a l e for all t h e records , and t h e same pres- sure s c a l e f o r the p re s su re records .
approximately 6s Ha and 3$ 02, and 8% HB, and 4% 02. mixtures , of cour se , t h e energy r e l e a s e by chemical r eac t ion w a s g r e a t e r than f o r t he f i rs t mixture s tud ied , and the pressure and ve loc i ty e f f e c t s correspondingly more pronounced. Data f o r a run with the more concent ra ted mixture a r e shown i n Figures 4 and 5.
S imi la r sets of d a t a were obtained f o r gas mixtures containing For these
DISCUSSION - The da ta presented i n Figures 2 t o 5 can b e s t be r e l a t e d by
drawing wave diagrams f o r each experiment. S u f f i c i e n t d a t a a re ava i l ab le t o draw reasonably complete wave diagrams, which a r e given i n Figures 6 and 7. l
The procedure f o r drawing Figure 6 w a s as fo l lows: From Figures 1 and 2 it can be seen t h a t t h e f i rs t v e l o c i t y measurement of Figure c 2 corresponds t o a shock wave unaf fec ted by chemical r eac t ion .
\I
6
i 43.
Therefore, tk shock v e l o c i t y from the diaphragm t o hea t t r ans - f e r gaube 2 -;ill be constant (neg lec t ing diaphragm opening e f f e c t s and a t t e n u a t i o n ) a t a v e l o c i t y of approximately 870 meters/sec. (The shock speed t h a t i s ca l cu la t ed from t h e p re s su res of sample 2nd d r i v e r gas , by means of Markstein 's g raph ica l method (ll), i s 830 meters/sec . , i n c lose agreement . ) I f t he diaphragm opening time i s taken a s 0 , t he inc iden t shock wave w i l l reach heat t r ans - f e r gauge E i n 4.38 mil l iseconds ( p o i n t A of Figure 6 ) . From t h i s po in t on, the times t o reach var ious po in t s on the tube a re given d i r e c t l y bJ t he d a t a .
)
1
J It i s evident from the slow r i s e i n shock speed between 3.5
i Centle p re s su re wave t h a t t r a v e l s through the shock-heated gas , r i t h ve loc i ty u + a , where u i s t h e flow v e l o c i t y behind the shock
ave (551 mete r s l sec ) and a i s t h e speed of sound i n the heated _as (557 meters /sec) . 4ccordingly, a c h a r a c t e r i s t i c l i n e with u i- a , of 1108 meters /sec. can be drawn back from Point A , t o r e - p re sen t t h e pa th of t h i s f i r s t pressure wave that communicates eiierLj from the r eac t ion t o tk shock wave.
1 and 4 .9 meters (Figure 2) t h a t t h e chemical r e a c t i o n f i rs t produces
4
The o r i z i n of t h i s wave i s undoubtedly near t h e driver-sample i n t e r f a c e , a t which i s loca t ed t h e p a r t of t h e gas sample t h a t was heated f i r s t (po in t B of Figure 6 ) . It i s apparent t ha t t he ign i - t i o n induction time was about 2 mil l iseconds, o r a l i t t l e l e s s i f i t i s considered t h a t some of t he sample next t o t h e diaphragm w i l l be cooled by d r i v e r gas and not r e a c t . The c a l c u i a t e d temperature behind the inc iden t shock wave i s 880'~., and t h e p re s su re 0.68 atm.
From Point B the r eac t ion f r o n t f i r s t appears as a l i n e pa ra l - l e l t o t h e i nc iden t shock wave. That i s , once the gas has been h e i t e d f o r 2 mil l i s econds , i t s t a r t s t o r e a c t . However, as pres- su.re -;raves from the r eac t ion inc rease t h e inc iden t shock speed, they a l so increase u and a behind the shock wave. This means, f i r s t , t h a t the i z n i t i o n induc t ion . t imes of successive elements of the gas become s h o r t e r , s o t h a t the v e l o c i t y of t he r e a c t i o n wave exceeds tbac of t h e shock. wave, and second, t h a t p re s su re waves can catch up x i t h waves sen t out previously, thereby gene ra t ing a shock wave. The formation of t h i s second shock wave i s shown i n Figure 3 . It
inning t o form a s it passed S M gauge 1, and was b e t t e r rJassed SLN gavge 2 . The average v e l o c i t y i n the i n t e r -
v a l , 1z40 mecers,.,sec., i s j u s t a l i t t l e g r e a t e r than u + a , as one -:!auld expect f o r a !.reak shock wave. Once t h e two waves coa le sce , t i le tenperature behind the wave i s c lose t o ZOOO'K., a t which temp- er?.tij.:.e t h e induct ion time i s about 20 microseconds ( 2 , 3 ) . By t ; : i s t i n e , then , t h e r eac t ion wave is . c lose behind t h e shock wave, as ~i-~ot.,rn i n Fi;u.i-e ', . '
The xave dia;;rm. f o r t he more concentrated gas mixture , Fig- u re 7, i s s i m i l a r i n many ways t o Figure 6. One no tab le d i f f e rence is t h a t t h e f i r s : evidence of chemical r e a c t i o n t o reach the incid- en-; s3ock. xave :.;as a well-developed second shock wave, of v e l o c i t y
44.
2080 meters/sec . , 'which had overtaken and ass imi la ted weak pres- sure waves sen t out ear l ier when reac t ion s t a r t e d . The f a c t t h a t the shock wave had the same shape at the two pressure measuring s t a t i o n s suggests t h a t t h i s i s a detonat ion wave i n the gas which had been preheated t o 830°K., compressed t o 0.79 a t m . , and accel- e r a t ed t o 555 meters /sec. by the inc ident shock wave. A ca lcu l - a t i o n of the detonat ion p r o p e r t i e s made by s tandard methods (12) gave the following data, which a r e compared t o the experimental measurements.
Prope r t y Ob s e rve d Calculated - Detonation ve loc i ty 1,525 meters/sec . 1,465 meters/sec . r e l a t i v e t o unreact- ed gas
Detonation pressure 4 . 6 atmospheres 5.7 atmospheres
Temperature a f t e r - r e a c t ion
2 ,TOO"K
The agreement, while no t h ighly accura te , i s s u f f i c i e n t l y c lose t o confirm the i d e n t i t y of t he wave.
wave s t a r t e d , nor where i t caught up with the f i r s t pressure wave from the r eac t ion zone. Two extreme cases can be considered.
1. The detonat ion wave formed as soon as r eac t ion started, so a l i n e drawn back from the i n t e r s e c t i o n of the detonat ion wave w i t h the inc iden t shock wave (Poin t C of Figure 7) with a s lope corresponding t o 2080 meters/sec i n t e r s e c t s t he driver-sam l e i n t e r - f a c e a t the p o i n t of i n i t i a l r e a c t i o n , a t a time of E.9 mi l l i seconds .
The data f o r t h i s run do not i nd ica t e where the detonat ion
2 . - T k detonat ion wave -overtook the f i r s t p ressure wave from- the_- _ _ r eac t ion j u s t before t h e l a t t e r reached SUI gauge 1, SO t h a t a c h a r a c t e r i s t i c drawn back from t h e de tona t ion wave a t t h i s po in t , w i t h a slope corresponding t o a u + a of 1110 meters/sec. , i n t e r - s e c t s the driver-sample i n t e r f a c e a t the po in t of i n i t i a l reac- t i o n , a t a time of 3 .2 mi l l i seconds . The wave diagram has ac tu- a l l y been drawn half-way between these two extremes, on the assumption that t h e induc t ion time was 4 .0 mi l l i seconds .
The f x t that the speed of t h e inc iden t shock wave goes through a maximum value as the r e a c t i o n wave couples t o i t , than l a t e r de- c reases somewhat, i s t o be expected from t h e mechanism of the pro- c e s s . Since no r e a c t i o n occurs during the f i r s t few mi l l i seconds , the r a t e of energy r e l e a s e by chemical r eac t ion reaches a t r a n s i e n t maximum value s i g n i f i c a n t l y above the normal r a t e as t h e r eac t ion wave catches up with the shock wave.
45.
More q u a n t i t a t i v e l y , the ve loc i ty of a shock wave w i t h hea t r e l ease can be c a l c u l a t e d , and t he ca l cu la t ion g ives a value lower than the m a x i m u m ve loc i ty of Figure 2 . We have used Marks te in ' s g raphica l method (11) i n these ca l cu la t ions a l s o . With reference t o the experimental condi t ions of Figure -2, i f the induct ion time was zero an ordinary-looking shock wave would be obta ined , w i t h a ve loc i ty of 1110 meters /sec. , a pressure of 0.75 a t m . , and a temperature of 1460'K [compared t o c a l c u l a t e values of 880 meters/ s e c . , 0.71 atm and 890 K when no r eac t ion occur s ) . The shock vel-
, o c i t y of 1110 meters /sec. would be reached eventua l ly i n our exper- L~ iment with an induct ion time, i f the tube were long enough and
a t t enua t ion could be neglec ted . Once t h i s s teady s i t u a t i o n was reached the pressure would be uniform from the shock f r o n t t o the d r i v e r gas expansion reg ion .
When the same type of c a l c u l a t i o n i s made f o r t h e gas mixture conta in ing more hydrogen and oxygen, corresponding t o Figures 4 and 5 , i t i s found t h a t the a i r d r i v e r i s not capable of maintain- i n g s u f f i c i e n t flow ve loc i ty t o keep the pressure cons tan t behind the inc ident shock wave When r eac t ion occurs . The f i n a l s teady s t a t e wave would, therefore , have an appearance between a shock and an ordinary detonat ion wave, w i t h some drop i n p re s su re , tempera- t u r e and flow v e l o c i t y behind the shock f r o n t .
ACYdOW LEDGEMENT
One of the authors (G.B.S.) wishes t o acknowledge t h a t s eve ra l prel iminary experiments were c a r r i e d out at Monsanto Research Corp- o r a t i o n , Dayton, Ohio, while he w a s employed t h e r e . M r . Donald L . Zanders a s s i s t e d ma te r i a l ly i n these prel iminary experiments . He a l s o wishes t o acknowledge f i n a n c i a l a s s i s t ance from the Aerospace Research Laborator ies under Contract AF33(615)-1915 with The Ohio S t a t e Universi ty Foundation.
46.
FBFERENCES
1. R . A . Strehlow and A , Cohen Phys. F lu ids 2, 97
2 . G.L. Schott and J.’L. Kinsey. J.Chem. Phys. 3, 177 (1958).
3. G . B . Skinner and G.H. Ringrose. J.Chem. Phys. 9, 2190 (1965).
4 . J . A . Fay, Fourth Symposium ( I n t e r n a t i o n a l j on Combustion, 1952, p . 501.
5 . M. Steinberg and W.E. Kaskan. F i f t h Symposium ( I n t e r n a t i o n a l ) on Combustion, 1954, p . 664.
6 . F .E . Bel les and J . G . E h l e r s . Am. Rocket SOC. J. 32, 215 (1962) *
7. R . A . Strehlow and H.B . Dyner, A I A A Journal 1, 591 . . (1963) - a . R . B . G i lbe r t and R.A. Strehlow, AIM Journal 4, 1777
(1966) *
9 . A . J . Laderman and A . K . Oppenheim, Proc. Roy. S O C . e, 153(19@).
10. P.A. U r t i e w and A . K . Oppenheim, Proc. Roy. Soc. my 13( 1946) *
11. G . H . Markstein. Am. Rocket SOC. J . 3, 588 (1959).
12. B. Lewis and G . von Elbe. Combustion, Flames, and Explosions of Gases, Second E d i t i o n , New York, Academic Press , Inc . , 1961, p . 524.
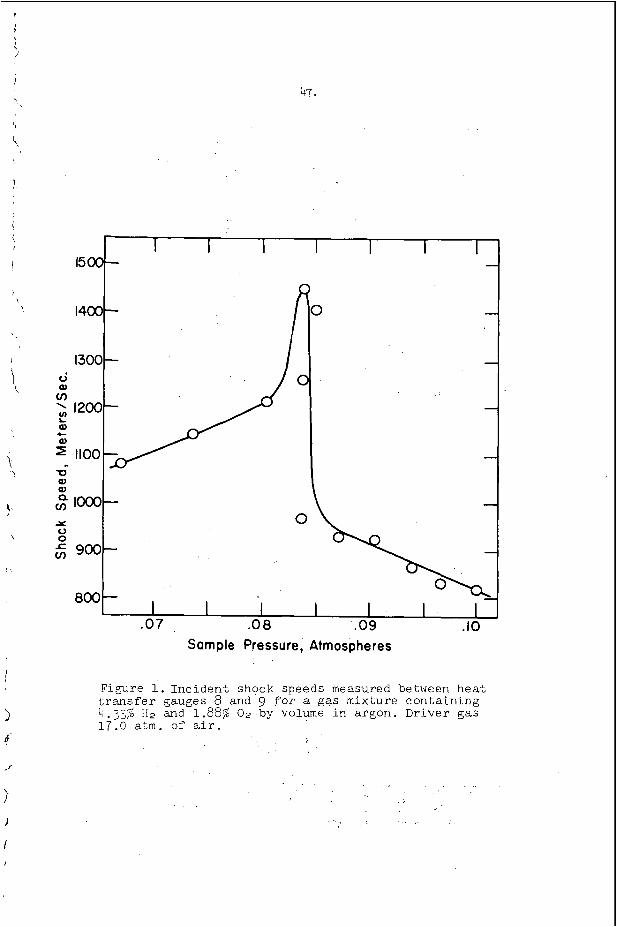
47.
in
Sam pie Pie ssu r e, Atmospheres
I
Figure 1. Inc ident shock speeds measured between hea t t r a n s f e r gauges 8 and 9 for a gas mixture conta in ing &.33$ HZ and 1.88% 02 by volume i n argon. Driver gas 17.0 atm. of a i r .
. . .
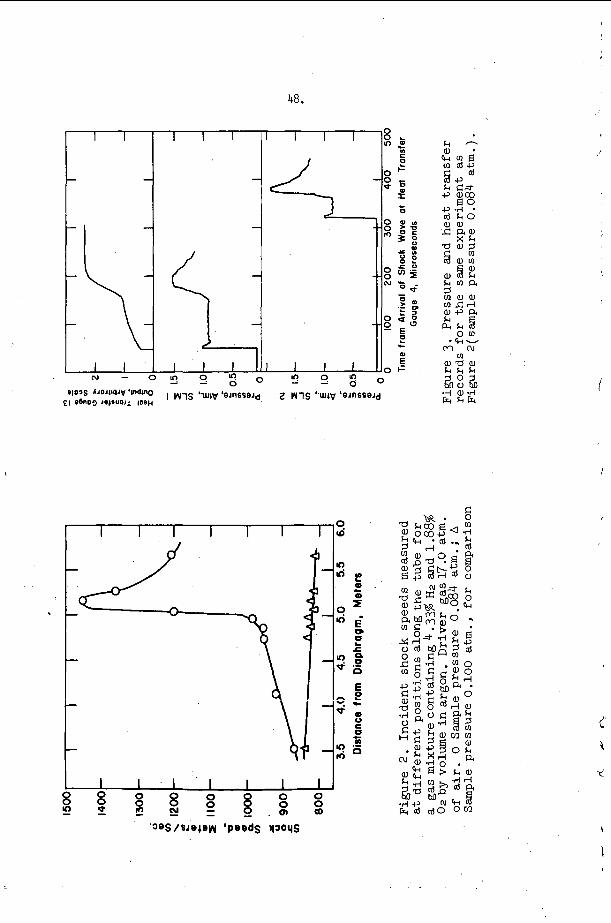
48.
I l -
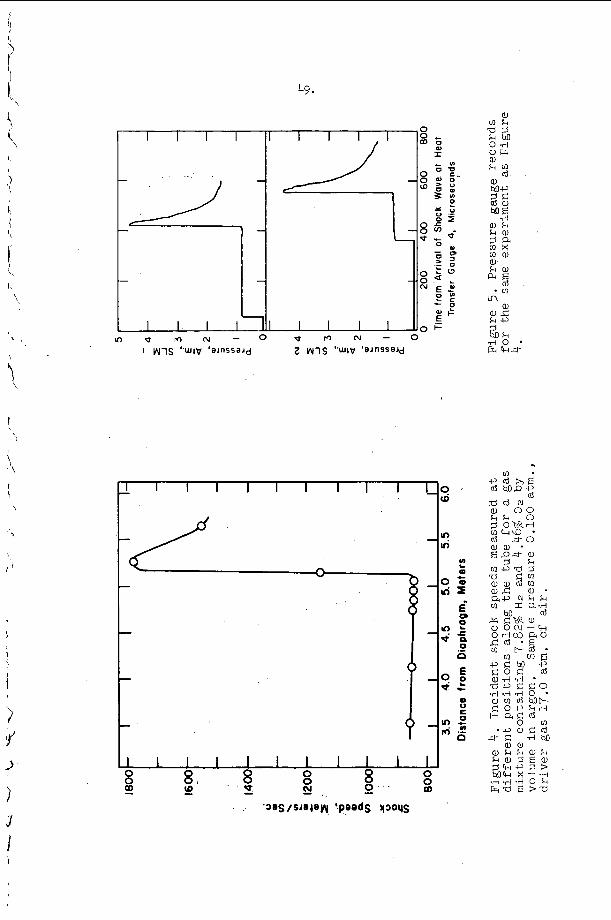
49.
I
I ' L ,
\
' \
1
I - I I I I I I I I I
I I . I I 1 I I 1 1 I 8 8 !E s - 8 0 0 ' o_
8 0
c 0 W
I
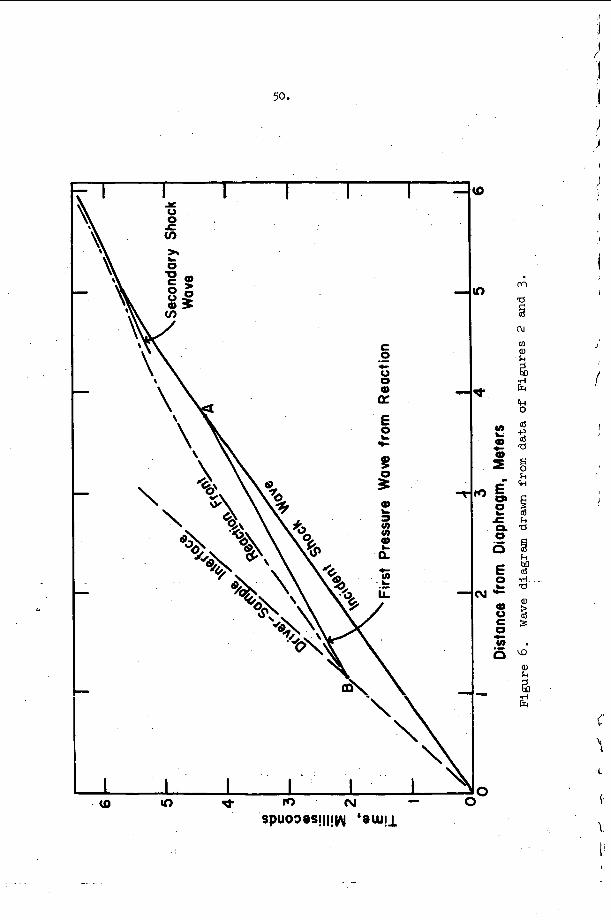
c 0 .-
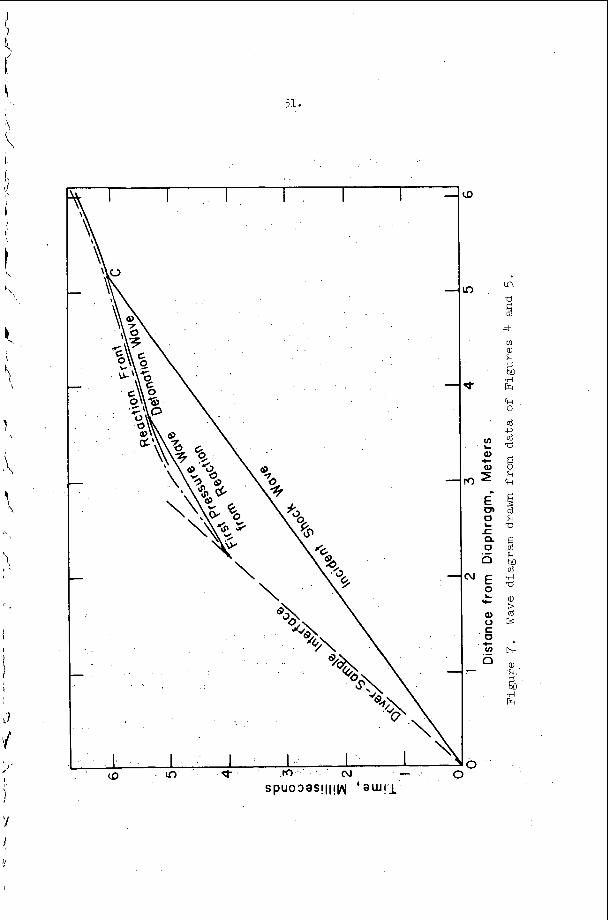
1 \
*
a
0
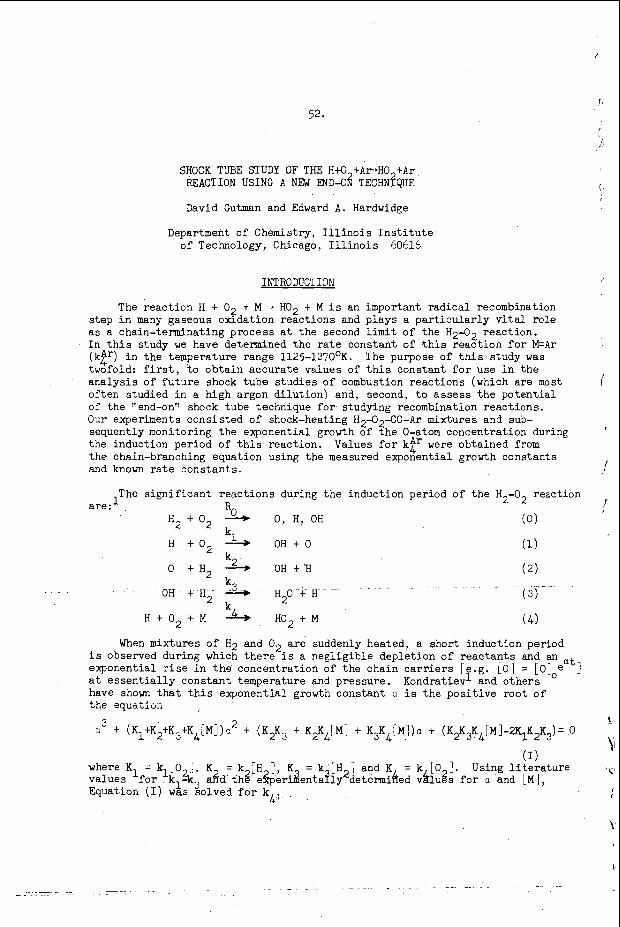
SHOCK TUBE STUDY OF THE H+O +ArHO + A r REACTION USING A NEW END-O~? TECHN?QUE
David Gutman and Edward A . Hardwidge
Departmeht o f Chemistry, I l l i n o i s I n s t i t u t e o f Technology, Chicago, I l l i n o i s 60616
INTRODUCl I O N
The r e a c t i o n H + O2 t M - KO2 + M i s an important r a d i c a l recombination s t e p i n many gaseous oxlda t ion r e a c t i o n s and p l a y s a p a r t i c u l a r l y v i t a l r o l e as a chain- terminat ing process a t t h e second l i m i t o f t h e H2-02 r e a c t i o n . I n t h i s study we have determined t h e rate cons tan t of t h i s r e a c t i o n f o r M=Ar ( k p ) i n t h e temperature range 1125-1370'K. twofold: f i r s t , t o o b t a i n a c c u r a t e va lues o f t h i s cons tan t f o r use i n the a n a l y s i s of f u t u r e shock t u b e s t u d i e s of combustion r e a c t i o n s (which are most o f t e n s tudied i n a high argon d i l u t i o n ) and, second, t o assess t h e p o t e n t i a l of t h e "end-on" shock tube technique f o r s tudying recombination reac t ions . Our experiments c o n s i s t e d o f shock-heating H2-02-CO-Ar mixtures and sub- sequent ly monitoring t h e exponent ia l growth o f t h e 0-atom concent ra t ion during t h e induct ion per iod of t h i s reac t ion . Values f o r ky were obta ined from t h e chain-branching equat ion using t h e measured exponent ia l growth cons tan ts and known rate cons tan ts .
The purpose of this s tudy w a s
The s i g n i f i c a n t r e a c t i o n s during t h e induct ion per iod o f t h e H2-02 reac t ion R
k
1 are: H2 + O2 0, 0, H , OH ( 0 )
H + 0 2 1, O H t O (1)
(2)
( 3 ) --
k2 0 + H 2 ---j O H t H k
OH + H2 3, H20 + H - -
H + 0 2 + M k4* H 0 2 + M ( 4 )
When mixtures o f H2 and O2 a r e suddenly heated, a shor t induct ion per iod i s observed during which t h e r e i s a n e g l i g i b l e d e p l e t i o n o f reactants and an exponent ia l r i s e i n t h e concent ra t ion o f t h e cha in c a r r i e r s [e.g. [ O ] = [O]oeat] a t e s s e n t i a l l y cons tan t temperature and pressure . have shown t h a t this exponent ia l growth cons tan t u i s t h e p o s i t i v e root o f
Kondrat ievl and o t h e r s
+he --..-A> _- ULLG ryuab,suri
(1) where K1 = k 0 K = k 'H ' K = k LH j and K = k [0 ]. Using l i t e r a t u r e va lues f o r 'kl&j d d th8'ef&denta?ly2determiked v h u 8 s f o r a and [MI, Equation (I) vas so lved f o r k 4: ,
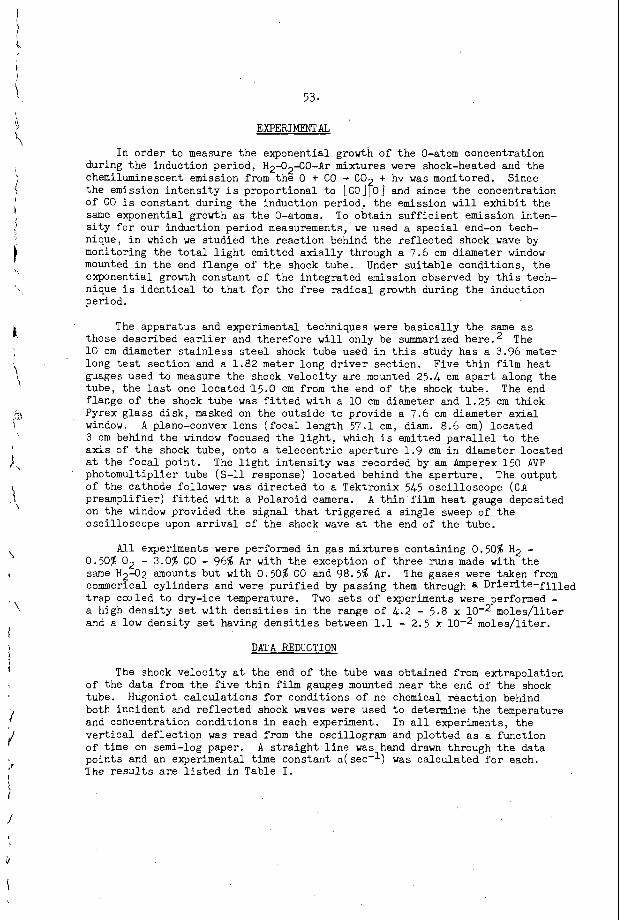
I
i 53.
,
I.
i
I
' \
I n order t o measure t h e exponent ia l growth o f t h e 0-atom concentrat ion during t h e induct ion per iod , H 2 a 2 - C O - A r mixtures were shock-heated and t h e chemiluminescent emission from t h e 0 + CO + CO + hv was monitored. Since t h e emission i n t e n s i t y i s propor t iona l t o [CO]fO] and s ince t h e concentrat ion of CO i s constant during t h e induct ion per iod, t h e emission will e x h i b i t t h e same exponent ia l growth as t h e 0-atoms. To o b t a i n s u f f i c i e n t emission inten- s i t y f o r our induct ion per iod measurements, we used a s p e c i a l end-on tech- nique, i n which w e s tud ied t h e reac t ion behind t h e r e f l e c t e d shock wave by monitoring t h e t o t a l l i g h t emit ted a x i a l l y through a 7.6 cm diameter window mounted i n t h e end f lange of t h e shock tube. Under s u i t a b l e condi t ions , t h e exponent ia l growth constant of t h e i n t e g r a t e d emission observed by t h i s tech- nique i s i d e n t i c a l t o t h a t f o r t h e free r a d i c a l growth during t h e induct ion per iod.
The apparatus and experimental techniques were b a s i c a l l y t h e same as The those descr ibed e a r l i e r and t h e r e f o r e will only be summarized here .2
10 cm diameter s t a i n l e s s s t e e l shock tube used i n this study h a s a 3.96 meter long tes t sec t ion and a 1 .82 meter long d r i v e r sec t ion . guages used t o measure t h e shock v e l o c i t y are mounted 25.4 em a p a r t along t h e tube , t h e last one l o c a t e d 15.0 cm from t h e end of t h e shock tube. The end f lange of t h e shock tube was f i t t e d wi th a 10 cm diameter and 1 .25 cm t h i c k Pyrex g l a s s d i sk , masked on t h e o u t s i d e t o provide a 7.6 c m diameter a x i a l window. A plano-convex l e n s ( f o c a l l e n g t h 57.1 cm, d i m . 8.6 cm) l o c a t e d 3 cm behind t h e window focused t h e l i g h t , which i s emit ted p a r a l l e l t o t h e axis of t h e shock tube, onto a t e l e c e n t r i c a p e r t u r e 1.9 cm i n diameter loca ted a t t h e f o c a l p o i n t . photomul t ip l ie r tube (S-11 response) loca ted behind t h e aper ture . o f t h e cathode fol lower was d i r e c t e d t o a Tektronix 545 osc i l loscope ( C A preampl i f ie r ) f i t t e d with a Polaro id camera. on t h e window provided t h e s i g n a l t h a t t r i g g e r e d a s ingle sweep of t h e osc i l loscope upon a r r i v a l of t h e shock wave a t t h e end of t h e tube.
Five t h i n film heat
The l i g h t i n t e n s i t y w a s recorded by am Amperex 150 AVP The output
A t h i n film h e a t gauge deposi ted
A l l experiments were performed i n g a s mixtures containing 0.50% H2 - 0.50% O2 - 3.0% CO - 96% A r wi th t h e exception o f t h r e e runs made with t h e same H2-02 amounts but with 0.50% CO and 98.5% A r . The gases were taken from commerical cy l inders and were p u r i f i e d by passing them through a D r i e r i t e - f i l l e d t r a p ccoled t o dry-ice temperature. Two s e t s of experiments were performed - a high d e n s i t y s e t wi th d e n s i t i e s i n t h e range of 4 .2 - 5.8 x and a low dens i ty set having d e n s i t i e s between 1.1 - 2.5 x 10⁻² moles / l i t e r .
moles / l i t e r
DATA REDUCTION
The shock v e l o c i t y a t t h e end o f t h e tube was obtained from ext rapola t ion of t h e d a t a from t h e f i v e t h i n film gauges mounted near t h e end of t h e shock tube. Hugoniot c a l c u l a t i o n s f o r condi t ions of no chemical r e a c t i o n behind both i n c i d e n t and r e f l e c t e d shock waves were used t o determine t h e temperature and concentrat ion condi t ions i n each experiment. I n a l l experiments, t h e v e r t i c a l def lec t ion was read from t h e osci l logram and p l o t t e d as a func t ion of time on semi-log paper. A s t r a i g h t l i n e was hand drawn through t h e da ta p o i n t s and an experimental time constant a (sec- l ) was c a l c u l a t e d f o r each. 'The results are l i s t e d i n Table I.
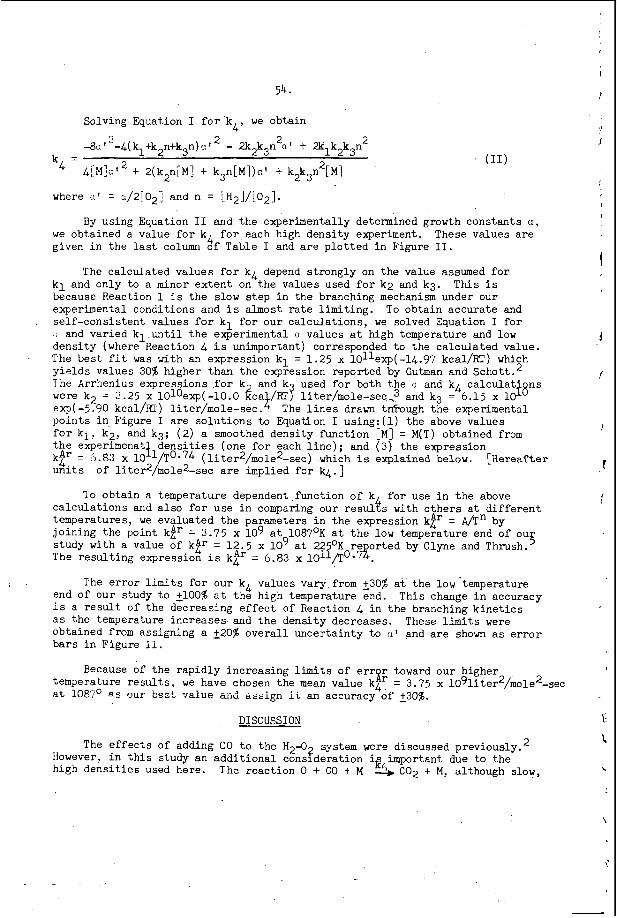
54 - Solving Equation I f o r k w e obtain 4' -8c"-4(k t k ntk3n)oT2 - 2k2k3n 2 a ' t 2k k k n 2
1 2 1 2 3 2 k =
4[M]ct2 t 2(k2n[M! + k3n[M])n' t k2k3n [ M I
where ( : I = c/2[021j and n = [H2]/[02].
By using Equation I1 and t h e experimental ly determined growth cons tan ts a , w e obtained a value f o r kL f o r each high d e n s i t y experiment. given i n t h e last column o f Table I and a r e p l o t t e d i n Figure 11.
These va lues are
The c a l c u l a t e d va lues f o r k 4 depend s t r o n g l y on t h e value assumed f o r k l and o n l y t o a minor e x t e n t on t h e va lues used f o r k2 and k3. T h i s i s because Reaction 1 i s t h e slow s t e p i n t h e branching mechanism under our experimental condi t ions and i s almost r a t e l i m i t i n g . To o b t a i n accura te and s e l f - c o n s i s t e n t va lues for icl f o r o u r c a l c u l a t i o n s , we solved Equation I f o r : and v a r i e d kl u n t i l t h e experimental c values a t high temperature and low d e n s i t y (where Reaction 4 i s unimportant) corresponded t o t h e c a l c u l a t e d value. The b e s t f i t was with an express ion k l = 1 . 2 5 x 1Ol1exp(-14.97 kcal/RT) which y i e l d s va lues 30% higher than t h e expression repor ted by Gutman and Schot t .2
were k2 = 2.25 x 101oexp(-lO.O &a /RTf l i t e r / m o l e - s e c 2 and k3 = 6.15 x 10 exp( -5.90 kcal/RT) l i ter /mole-sec. t The l i n e s drawn t f iough t h e experimental p o i n t s i n Figure I a r e s o l u t i o n s t o Equation I using: (1) t h e above va lues f o r k l , k?, and k3; (2 ) a smoothed d e n s i t y func t ion [ M I = M(T) obtained from t h e experimenat kAr - 6.83 x 1Oi1/T0 -74 ( liter2/mole2-sec) which i s explained below. [Hereafter L. - units
The Arrhenius express ions f o r k and k used f o r both t h e a and kl
d e n s i t i e s (one f o r each l i n e ) ; and (3) t h e expression
o f liter2/mole2-sec are implied f o r k4.1
'IO o b t a i n a temperature dependent func t ion o f kL f o r use i n t h e above c a l c u l a t i o n s and a l s o f o r use i n comparing our results with o t h e r s a t d i f f e r e n t temperatures , we eva lua ted t h e parameters i n t h e expression kp = A/Tn by j o i n i n g t h e poin t k t r = 3.75 x lo9 a t 1087OK a t t h e low temperature end of ou s tudy with a value of k p = 1 2 . 5 x lo9 at 22 OK re o r t e d by Clyne and Thrush. 5 The r e s u l t i n g expression i s k t r = 6.83 x lo1 3 /To . E .
The e r r o r limits f o r o u r k4 va lues vary from 230% a t t h e low temperature end o f our s tudy t o ilOO% a t t h e high temperature end. T h i s change i n accuracy i s a r e s u l t of t h e decreas ing e f f e c t o f Reaction 4 i n t h e branching k i n e t i c s a s t h e temperature i n c r e a s e s and t h e dens i ty decreases . obtained from ass igning a +20$ o v e r a l l u n c e r t a i n t y t o r:' and a r e shown as e r r o r b a r s i n F igure 11.
temperature r e s u l t s , we have chosen t h e mean va lue k$l = 3.75 x 1091iter2/mole2-sec a t 108'i0
These limits were
Because of t h e r a p i d l y i n c r e a s i n g limits of e r r r toward o u r higher
cur best value &id a s s i g n i L a n accuracy o f 230%.
DISCUSSION x t
The e f f e c t s of adding CO t o t h e H 2 - 0 2 system were discussed previously.2 However, i n t h i s s tudy an a d d i t i o n a l cons idera t ion i important due to t h e high d e n s i t i e s used here . The r e a c t i o n 0 + CO + M + $5 C02 t M, a l though slow, L
i
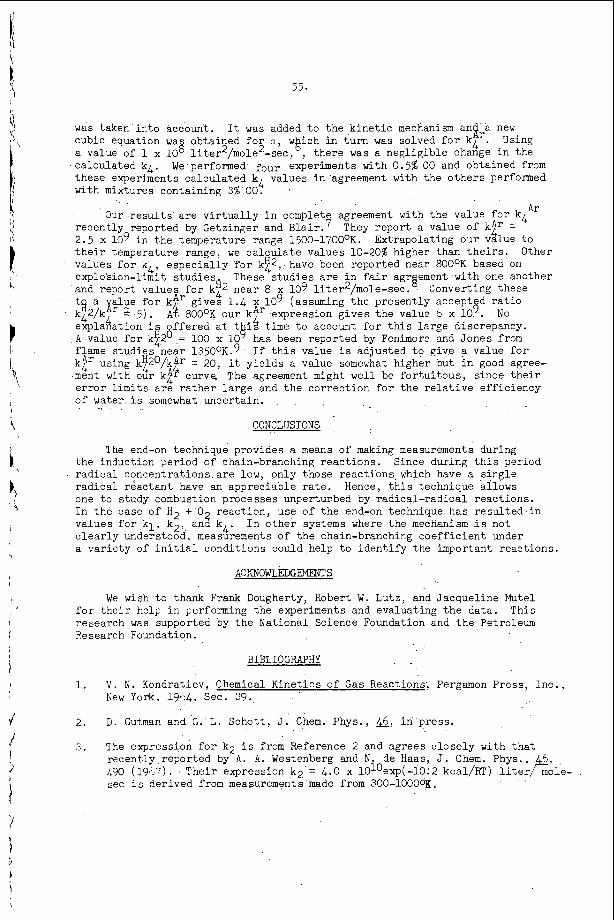
55.
t L
c
1
i
was taken i n t o account. cubic equation w a 8 obtained f o r a, w i c h i n t u r n was solved f o r k4 . Using a value of 1 x 10 liter2/mole2-sec,k, t h e r e was a n e g l i g i b l e change i n t h e ca lcu la ted k4. We performed four experiments with 0.5% CO and obtained from t h e s e experiments ca lcu la ted k4 values i n agreement with t h e o t h e r s performed with mixtures containing 3% C O .
recent ly reported by Getzinger and Blair.7 2.5 x lo9 i n t h e temperature range 1500-1700°K. t h e i r temperature range, we c a l c u l a t e va lues 10-20% higher than t h e i r s . va lues f o r k 4 , e s p e c i a l l y for k t 2 , have been repor ted near 800°K based on explosion-l imit s tud iesR and repor t va lues f o r k42 near 8 x 10⁹ liter2/mole-sec. ' Converting these t a a lue f o r khr g ives 1.4 x lo9 (assuming t h e p r e s e n t l y accept d r a t i o
e h r a h a t i o n i o f f e r e d a t t i$ t i m e t o account f o r t h i s l a r g e discrepancy.
flame s t u d i e s near 13500K.9 I f t h i s value i s ad jus ted t o give a value f o r k t r using k?Z0/k
e r r o r l i m i t s a r e r a t h e r l a r g e and t h e cor rec t ion f o r t h e r e l a t i v e e f f i c i e n c y o f water i s somewhat uncer ta in .
I t was added t o t h e k i n e t i c mechanism anfra new
A r Our r e s u l t s a r e v i r t u a l l y i n complete agreement with t h e value f o r k4 They r e p o r t a value of kAr = 4 Extrapolat ing our value i o
Other
These s t u d i e s are i n f a i r agr ement with one another
k'2 ,Iir 5 ) . A t 800°K our kAr expression g i v e s t h e value 6 x 10 8 . No
A value f o r k$2' = 100 x 10 4 has been repor ted by Fenimore and Jones f r o m
ment with our k$ $ curve The agreement might w e l l be f o r t u i t o u s , s ince t h e i r = 20, it y i e l d s a value somewhat higher but i n good agree-
CONCLUSIONS
The end-on technique provides a means of making measurements during the induct ion 9er iod of chain-branching r e a c t i o n s . Since during t h i s per iod r a d i c a l concent ra t ions a r e low, only those react ions. which have a s i n g l e r a d i c a l r e a c t a n t have an apprec iab le r a t e . Hence. t h i s technique al lows one t o study combustion processes unperturbed by r a d i c a l - r a d i c a l reac t ions . I n t h e case o f H2 t 0 va lues for k l . k2. an2 k4. I n o t h e r systems where t h e mechanism i s not c l e a r l y understood. measurements o f t h e chain-branching c o e f f i c i e n t under a v a r i e t y o f i n i t i a l condi t ions could help t o i d e n t i f y t h e important reac t ions .
reac t ion , use of t h e end-on technique has r e s u l t e d i n
AC .WOWLEI)(;ENENT S
We wish t o thank Frank Dougherty, Robert W . Lutz , and Jacquel ine Mute1 f o r t h e i r help i n performing t h e experiments and eva lua t ing t h e da ta . This research was supported by t h e Nat ional Science Foundation and t h e Petroleum Research Foundation.
BIBLIOGRAPHY
1. V . N . Kondratiev, Chemical Kine t ics o f Gas Reactions, Pergamon Press , I n c . , New York, 1964, Sec. 39.
2. D. Gutman and G . L. Schot t , J . Chem. Phys., L&, i n press .
3 . The expression f o r k2 i s from Reference 2 and agrees c l o s e l y with t h a t recent ly repor ted by A . A. Westenberg and N . de Haas, J . Chem. Phys., L90 (19',7). Thei r expression k2 = 4.0 x 10¹⁰exp(-10:2 kcal/RT) l i t e r sec i s der ived from measurements made from 300-1OOOOX.
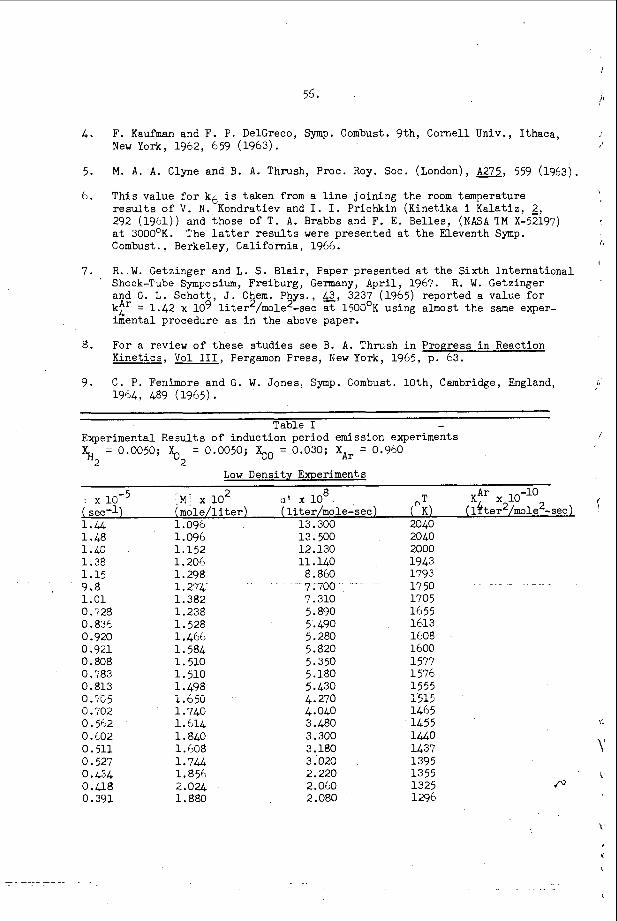
56.
4. F. Kaufman and F. P. DelGreco, Symp. Combust. 9 th , Cornel1 Univ., Ithaca, New York, 1962, 659 (1963).
M. A. A. C l y n e and B. A. Thrush, Proc. Roy. SOC. (London), m, 559 (1963).
T h i s value f o r kb i s taken from a l i n e jo in ing the room temperature r e s u l t s of V. N . Kondratiev and I. I. Prichkin (Kinetika i Kala t iz , 2, 292 (1961)) and those of T . A. Brabbs and F. E. Belles, ( N A S A TM X-52197) a t 3000'K. The la t ter r e s u l t s were presented a t t h e Eleventh Symp. Combust.. Berkeley, Cal i forn ia , 1966.
5.
6.
7 . R. W. Getzinger and L. S. Blair , Paper presented a t the Sixth In te rna t iona l ' Shock-Tube Symposium, Freiburg, Germany, April , 1967. R. W. Getzinger
and G. L . Schot t , J . Chem. Phys., .@, 3237 (1965) reported a value f o r k r = 1.42 x lo9 liter2/mole2-sec a t 1503'K using almost t he same exper- imental procedure as i n the above paper.
8. For a review of these s tud ies see B. A. Thrush i n Progress i n Reaction Kinetics, Vol 111, Pergamon Press, New York, 1965, p. 63.
9. C . P . Fenimore and G. W . Jones, Symp. Combust. l o t h , Cambridge, England, 1964, 489 (1965).
Table I - Experimental Results of induction period emission experiments %, = 0.0050; % = 0.0050; xc0 = 0.030; XAr = 0.960
2 Low Density Experiments
8 KAr x 10-l' u ' x 10 O T (l$ter2/mole2-sec) I sec-1) ( mole/l i t e r ) (liter/mole-sec) ( K )
1.U 1.096 13.300 2040 1.48 1.096 13.500 2040 1.40 1.152 12.130 2000 1.38 1.204 11.140 1943 1 . 1 5 1.298 8.860 1793 9.8 1.271, 7.700 - 1750 1.01 1.382 7.310 170 5 0.728 1.238 5.890 1655 0.836 1.528 5.490 1613 0.920 1.466 5.280 1608 0.921 1.584 5.820 1600 0.808 1.510 5.350 1577 0.783 1.510 5.180 1576 0.813 1.498 5.430 1555 0.705 i.650 4.270 151; 0. Ti02 1.740 4.040 1465 0.562 1.614 3.480 1455 0. LO2 1.840 3.300 1440 0.511 1.408 3.180 1437 0.527 1.744 3.020 1395 0 * 434 1.856 2.220 1355 0.4l8 2.024 2.060 1325 0.391 1.880 2.080 1296
:MI x lo2
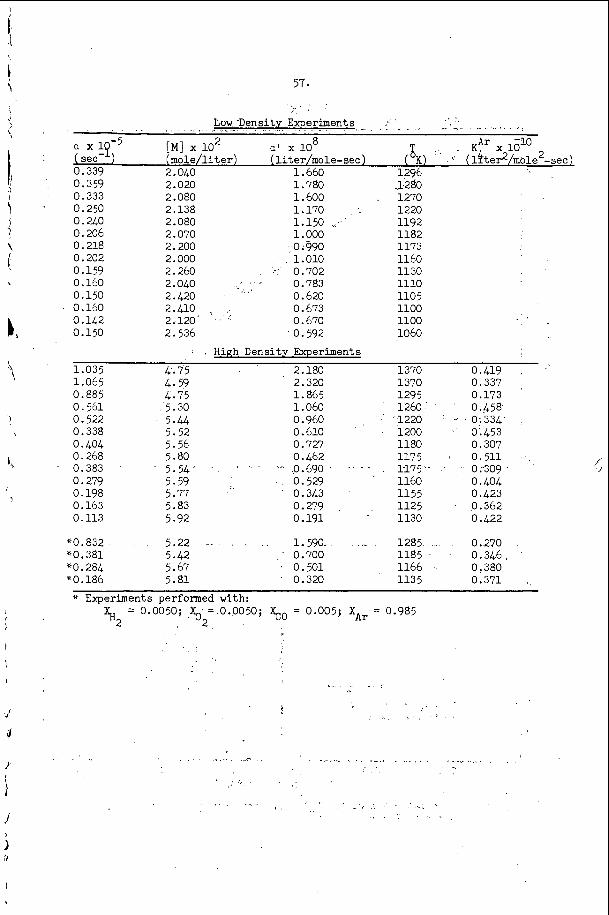
57.
Low 1. - 'Density Experiments .- " I ?
a x 1.9-5 [MI x lo2 a t x 10 T KAr x lolo
0.339 2.040 1.660 1296 0.359 2.020 1.780 ,1280 0.333 2.080 1.600 1270 0.250 2.138 1.170 1220 0.2!+0 7.080 1.150 1192 0.206 2.070 1.000 1182 0.218 2.200 0.990 1173 0.202 2.000 1.010 1160 0.159 7.260 0.702 1130 0.160 7.040 I , 0.783 1110 0.150 2.420 0.620 110 5 0.160 2 . 0 0 , 0.673 1100 0.142 2.120 0.670 1100 0.150 2.536 0.592 1060
8
sec ) (mole/liter) (liter/mole-sec) (OK) ( 14ter2/mole2-sec)
Hinh Density Experiments 1.035 4.75 2.180 1370 0.419 1.065 4.59 2.320 1370 0.337 0.885 4.75 1.865 1295 0.173 0.561 5.30 1.060 1260 0.458 0.522 5.44 0.960 1220 0.334 0.338 5.52 0.610 1700 0.453 0.404 5.56 0.727 1180 0.307 0.768 5.80 0.462 117 5 0.511 0.383 5.54 0.690 117 5 0 ;309
0.198 5.77 0.343 1 1 5 5 0.423 0.163 5.83 0.279 1175 0.362 0.113 5.92 0.191 1130 0.422
V0.832 5.22 1.590 1285 0.270 *0.381 5.42 0.700 1185 0.346 "0.284 5.67 0.501 1166 0.380 *0.186 5.81 0.320 1135 0.371
0.279 5.59 0.529 1160 0 - 404
* Experiments performed with: lk, = 0.0050; % = 0.0050; xc0 = 0.005; XAr = 0.985 2
.. . . . . . ..,. ., . . ,. . . . . .._.... . . . .- ._ . ... , I I ..- ..,, . . . . .. . .
' I ) , . . .
:.; .' . . _ . , . . . .. - . .
.. . , . t . .
. . ,
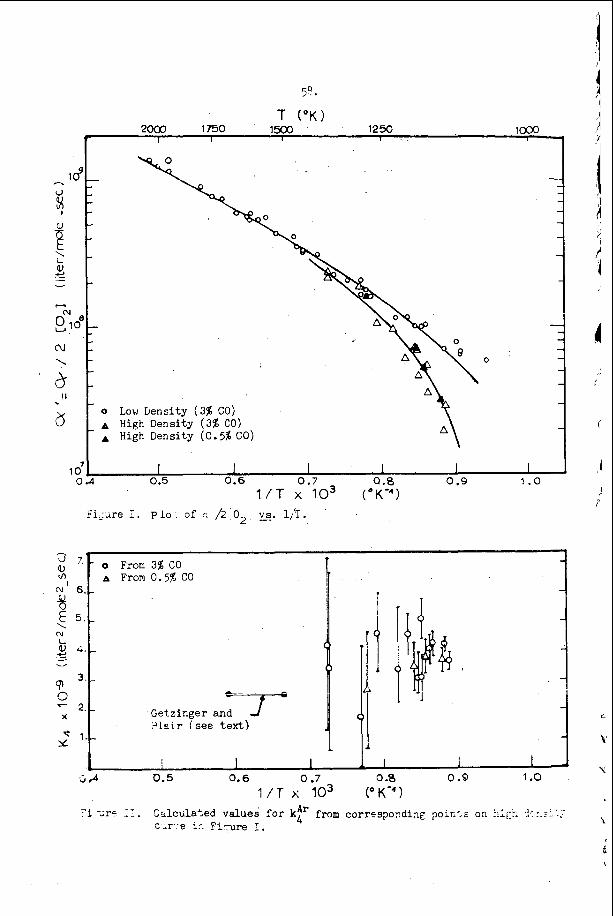
58 *
T ( O K )
2000 1750 1500 1250 loo0 I 1 I I
0
Low I jensi ty (3% C o ) High Density (3% C O ) High Density (0.5% CO)
0
1 1
I I I 1 I 1 I 0.5 0.6 0.7 a .a 0.9 1 .o
i / ~ x io3 ( " K - ~ ) FiCLire I . p l o : o f :. / = I O 2 xz. l/T.
o From 3% CO A From 0.5% CO
Getzinger and ?l%i r see t e x t )
G P 0 . 5 0.6 0.7 I / T x io3
0 -8 0 .D 1.0 .
(" K-'1
0 59.
SHOCK FRONT STRUCTURE - A CHEMICAL KINETICS VIEW
S. H. Bauer
Department of Chemistry, Cornell University, Ithaca, New York 14850
INTRODUCTION
In the analysis of shock front structures in real gases, intermolecular proc- esses which fall within the province of chemical kineticists play a dominant role. The determination of shock front profiles in density, temperature and in the con- centrations of chemical species, provide kineticists with powerful techniques f o r exploring mechanisms for reactions which cannot be studied otherwise. This has been recognized for over a decade. Advances made in the state of the art through 1963 can be measured by the content of an 850-page treatise on shock tubes by H. Oertel(l), which covers theory, practice and applications in a detailed and thorough manner. More recent assessments may be obtained from the 94 abstracts of papers which were submitted f o r presentation at the 6th International Shock Tube Symposium !2) and the 37 reports given at the AGARD Colloquium on "Recent Advances in Aerothermochemistry. " (3)
In this summary attention is called to several developments which have advanced the "state of the art" during the past year. there is continued emphasis on the improvement of experimental techniques. These center around cleanliness of operation (good vacuum technique, insistence on low leak rates, etc.), the use of polished inner walls to reduce boundary layer perturbations, improved control of species concentrations, increased precision in shock speed measurements, refinement in sensitivity and reduction of response times for diagnostic devices used in recording the profiles of shock fronts, etc. In addition there is greater sophistication in the design of experiments. The improvements may be categorized into three groups: (1) use is being made of newly available devices, such as lasers; (2 ) it is now general practice to record in many channels concurrently, such as the mass spectra of several species, the con- current recording of emission and absorption spectra at different wavelengths 6 s 3 function of time; (3) combining shock tube techniques with other techniques f o r the preparation of samples to be studied; for example, preliminary flash photolysis o r imposition of a glow discharge through the sample prior to its being exposed to the shock wave. Along with increased sophistication in the performance of experi- ments, extended computer programs are used routinely, both for equilibrium com- positions and f o r obtaining kinetic profiles; also, to facilitate data reduction.
These trends will continue because they have already proved their worth, but
A brief overall assessment shows that
they occur at the expense of increased complexity in equipment, leading inevitably to the need for collaboration among several persons in operating a facility. What remains for the lone experimenter? It appears to me that for some time to come the single-pulse shock tube technique will remain one of a few individualistic activities. The investigator will have to be ingenious in designing kinetic experiments in which knowledge of the concentrations of species after a specified reaction time permits an identification of a mechanism. Single-pulse shock tubes allow the exploration of complex systems in a qualitative manner, and provide the basis for selecting reactions which are critical steps in a complex reaction scheme for detailed study by other techniques.
60. TECHTUQUES AND DIAGNOSTIC DEVICES
A r e p r e s e n t a t i v e s e l e c t i o n of i n t e r e s t i n g developments i n technique is presented i n Table 1. The use of narrow e l e c t r o n .beams for . e x c i t i n g molecular s p e c t r a i n a flowing medium m e r i t s an a d d i t i o n a l comment. The c h a r a c t e r i s t i c s p e c t r a exc i t ed permit i d e n t i f i c a t i o n of t he s p e c i e s p r e s e n t , and an e s t ima t ion of t h e i r d e n s i t i e s ( i f p roper c a l i b r a t i o n s a r e made). V ib ra t iona l and r o t a t i o n a l temperatures can be obta ined from band contours . In t h e hands of a c a r e f u l experi- m e n t a l i s t , t h i s technique may g ive t r a n s l a t i o n a l speeds a s w e l l (Doppler widths of s p e c t r a l l i n e s ) . For example, i n a sup@yonic je t of n i t rogen expanding from room temperature i n an axi-symmetric nozz le , t he r o t a t i o n a l tempera ture was observed to fo l low t h e i s e n t r o p i c c u r v e i n i t i a l l y , but a t t h e lower temperatures t h e r o t a t i o n a l population " f roze" t o a f ixed d i s t r i b u t i o n l ead ing t o a s u b s t a n t i a l degree of non-equilibrium.
Perhaps one of t h e m o s t s e n s i t i v e dev ices f o r measuring g r a d i e n t s a t a shock
Gradien ts a s l o w a s loe5 gd l i te r mm can be de t ec t ed i n argon, and f r o n t wi th h igh r e s o l u t i o n is the l a s e r s c h l i e r i e n method descr ibed by Kie f fe r and Lutz.(") c h a r a c t e r i s t i c times ( l a b s c a l e ) a s s h o r t a s 0 . 2 ~ sec. have been measured. V ib ra t iona l r e l a x a t i o n t i m e s f o r hydrogen and deuterium have thus been q u a n t i t a t i v e l y determined for t he f i r s t t ime. Th i s technique h a s been e f f e c t i v e l y used t o scan t h e h e a t r e l e a s e p r o f i l e d u r i n g the high temperature ox ida t ion of ace ty l ene , (12)
The bes t i l l u s t r a t i o n of concurrent multichannel record ing t o provide a l a r g e amount of information f o r a s i n g l e shock, and thus t o c o r r e l a t e a v a r i e t y of parameters , is the use of a rapid-scan mass spec t rometer . A t ime-of - f l igh t spec t rometer cou l e d to a shock tube v ia a minute l eak has been descr ibed by Kistiakowsky, (13' Dove,(14) D i e s e n ( 1 5 x n d Modica. (16) of a quadruple mass f i l t e r f o r t h e a n a l y s i s of products e x t r a c t e d from a back- r e f l e c t e d shock has been r e c e n t l y repor ted by Gutman. (17) As descr ibed t h i s r e l a t i v e l y l o w c o s t ins t rument could be set to record only one mass a t a time; however, c u r r e n t developments i n Gutman's l abora to ry i n d i c a t e t h a t i t may be poss ib l e t o s e t f o u r mass f i l t e r s f o r concurren t record ing . The f i d e l i t y of sampling of back-ref lected shocked gases through 0.002 inch a p e r t u r e s remains t o be demonstrated. To avoid confus ion of t h e d e s i r e d sample wi th end-wall cooled gases and boundary l a y e r p e r t u r b a t i o n s , Marsters(") e x t r a c t s t h e sample from a r a p i d l y quenched i n c i d e n t shock and by a sequence of l a r g e a p e r t u r e nozz les con- v e r t s t h e j e t t o a molecular beam f o r a n a l y s i s by a t ime-of - f l igh t spec t rometer .
The success fu l app l i ca t ion
There is an i n t r i g u i n g p o s s i b i l i t y of us ing a small mass spec t rometer to de tec t t h e o n s e t of i o n i z a t i o n ( i n p a r t i c u l a r , t h e o n s e t of production of a p a r t i c u l a r s p e c i e s ) and c o r r e l a t i n g t h i s p r o f i l e with spec t roscop ic d a t a (chemiluminescence, or the appearance of a c h a r a c t e r i s t i c abso rp t ion ) . In this connection one should mention t h e success fu l a p p l i c a t i o n of a N i e r t y p e mass spec t rometer by Sturtevant(l ' ) who demonstrated t h a t t h e f i r s t i ons t o appear i n shock-heated argon, a t a threshold approximately four v o l t s below t h e i o n i z a t i o n p o t e n t i a l of argon, were €€+ and O+, presumably from a very l o w l e v e l wa te r impur i ty .
The technique of p repa r ing equ i l ib r ium samples a t e l eva ted temperatures ( a s w i t h ref lected s h c ~ k s ) and queiiiiiing them so r a p i a l y t h a t one may s tudy k i n e t i c processes which occur dur ing the c o o l i n g pa th h a s not a t t r a c t e d many devotees , although expansion through a smal l a p e r t u r e i n the end wa l l of a shock tube f o r sampling purposes is being used by mass s p e c t r o m e t r i s t s . To avoid boundary l a y e r problems and to achieve very r a p i d c o o l i n g , Wilson(") i n s e r t e d a p a i r of d ivergent a i r f o i l s i n a shock tube , s o a a t the i n c i d e n t shock passed through a double Prandtl-Yeyer
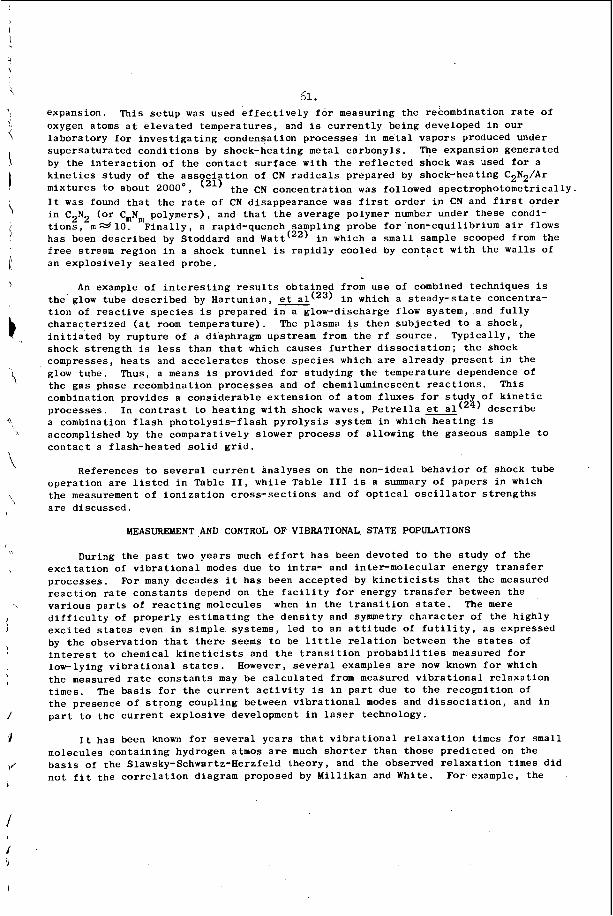
61. expansion. oxygen atoms at elevated temperatures, and is currently being'developed in our laboratory for investigating condensation processes in metal vapors produced under supersaturated conditions by shock-heating metal carbonyls. by the interaction of the contact surface with the reflected shock was used for a kinetics study of the ass ciation of CN radicals.prepared by shock-heating C2NZ/Ar mixtures to about 2 0 0 0 ° , It was found that the rate of CN disappearance was first order in CN and first order in C N tion2 ,2m 29 10. Finally, a rapid-quench sampling probe for 'non-equilibrium air flows has been described by Stoddard and Watt(22) in which a small sample scooped from the free stream region in a shock tunnel is rapidly cooled by contact with the walls of an explosively sealed probe,
This setup was used effectively for measuring the recombination rate of
%e expansion generated
the CN concentration was followed spectrophotometrically.
(or CmNm polymers), and that the average polymer number under these condi-
An example of interesting results obtained from use of combined techniques is the. glow tube described by Hartunian, et(23) in which a steady-state concentra- tion of reactive species is prepared in a glow-discharge flow system,.and fully characterized (at room temperature). The plasma is then subjected to a shock, initiated by rupture of a diaphragm upstream from the rf source. Typically, the shock strength is less than that which causes further dissociation; the shock compresses, heats and accelerates those species which are already present in the glow tube. Thus, a means is provided for studying the temperature dependence of the gas phase recombination processes and of chemiluminescent reactions. This combination provides a considerable extension of atom fluxes for study of kinetic processes. In contrast to heating with shock waves, Petrella describe a combination flash photolysis-flash pyrolysis system in which heating is accomplished by the comparatively slower process of allowing the gaseous sample to contact a flash-heated solid grid.
References to several current analyses on the non-ideal behavior of shock tube operation are listed in Table 11, while Table I11 is a summary of papers in which the measurement of ionization cross-sections and of optical oscillator strengths are discussed.
MEASURElYIENT AND CONTROL OF VIBRATIONAL STATE POPULATIONS
During the past two years much effort has been devoted to the study of the excitation of vibrational modes due to intra- and inter-molecular energy transfer processes. For many decades it has been accepted by kineticists that the measured reaction rate constants depend on the facility for energy transfer between the various parts of reacting molecules when in the transition state. The mere difficulty of properly estimating the density and symmetry character of the highly excited states even in simple systems, led to an attitude of futility, as expressed by the observation that there seems to be little relation between the states of interest to chemical kineticists and the transition probabilities measured for low-lying vibrational states. the measured rate constants may be calculated from measured vibrational relaxation times. The basis for the current activity is in part due to the recognition of the presence of strong coupling between vibrational modes and dissociation, and in part to the current explosive development in laser technology.
However, several examples are now known for which
It has been known for several years that vibrational relaxation times for small molecules containing hydrogen atmos are much shorter than those predicted on the basis of the Slawsky-Schwartz-Herzfeld theory, and the observed relaxation times did not fit the correlation diagram proposed by Millikan and White. For example, the .
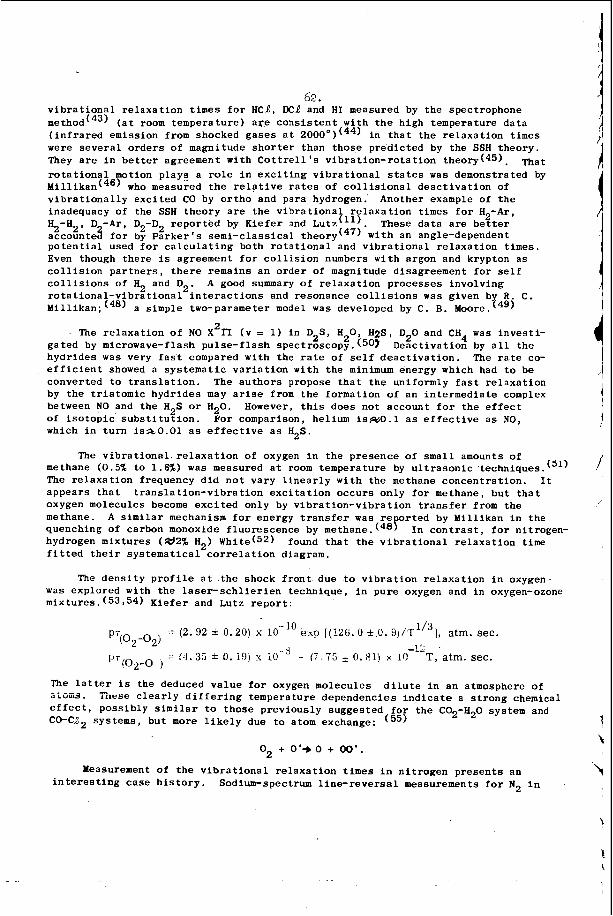
62. vibrational relaxation times for HC.f?, DCJ and HI measured by the spectrophone method(43) (at room temperature) are consistent with the high temperature data (infrared emission from shocked gases at z ! O O O " ) ( ~ ~ ) in that the relaxation times were several orders of magnitude shorter than those predicted by the SSH theory. They are in better agreement with Cottrell's vibration-rotation theor~(~5). That rotational motion plays a role in exciting vibrational states was demonstrated by Millika~~(~') who measured the relative rates of collisional deactivation of vibrationally excited CO by ortho and para hydrogen. Another example of the inadequacy of the SSH theory are the vibrational relaxation times for H2-Ar, H2-H2, D - A r , D -D These data are better accountei for by Parker's semi-classical theory(47) with an angle-dependent potential used for calculating both rotational and vibrational relaxation times. Even though there is agreement for collision numbers with argon and krypton as collision partners, there remains an order of magnitude disagreement for self collisions of H2 and D2. rotational-vibrational interactions and resonance collisions was given by R C. Millikan;(48) a simple two-parameter model was developed by C. B . Moore.(4gj
reported by Kiefer and Lutz'"). 2 2
A good summary of relaxation processes involving
2 The relaxation of NO X l7 (v = 1) in D2S, H 0, Q S , D 2 0 and CH4 was investi- gated by microwave-flash pulse-flash spectroscopy. (50? Deactivation by all the hydrides was very fast compared with the rate of self deactivation. The rate co- efficient showed a systematic variation with the minimum energy which had to be converted to translation. The authors propose that the uniformly fast relaxation by the triatomic hydrides may arise from the formation of an intermediate complex between NO and the H S or H 2 0 . However, this does not account for the effect of isotopic substitution. For comparison, helium is$+jO.l as effective as NO, which in turn is%O.Ol as effective as H2S.
The vibrational.relaxation of oxygen in the presence of small amounts of me thane (0.5% to 1.6%) was measured at room temperature by ultrasonic techniques. (51) The relaxation frequency did not vary linearly with the methane concentration. It appears that translation-vibration excitation occurs only for methane, but that oxygen molecules become excited only by vibration-vibration transfer from the methane. quenching of carbon monoxide fluorescence by methane. (48p In contrast, for nitrogen- hydrogen mixtures (&2% Ha) White(52) fitted their systematical correlation diagram.
2
2
A similar mechanism for energy transfer was re orted by Millikan in the
found that the vibrational relaxation time
The density profile at the shock front due to vibration relaxation in oxygen- was explored with the laser-schlierien technique, in pure oxygen and in oxygen-ozone mixtures. (53~54) Kiefer and Lutz report:
p.i
" T < ~ 2 - ~ j
= (2. 92 i 0.20) x
I- !-1.35 * 0. 19) x i 0 - 17 ,75 0.81) r. 10 T, atm. sec.
exp [(I%. 0 rt.0. 4,i.T1'3], atm. sec. -12 (02-@2j
.. 3
The latter is the deduced value for oxygen molecules atom. effect, possibly similar to those previously suggested for the CO2-H2O system and C0-Cl2 systems, but more likely due to atom exchange: (55)
dilute in an atmosphere of Tnase cieariy differing temperature dependencies indicate a strong chemical
o2 + O ' + O + 00'. Measurement of the vibrational relaxation times in nitrogen presents an
interesting case history. Sodium-spectrum line-reversal measurements for N2 in
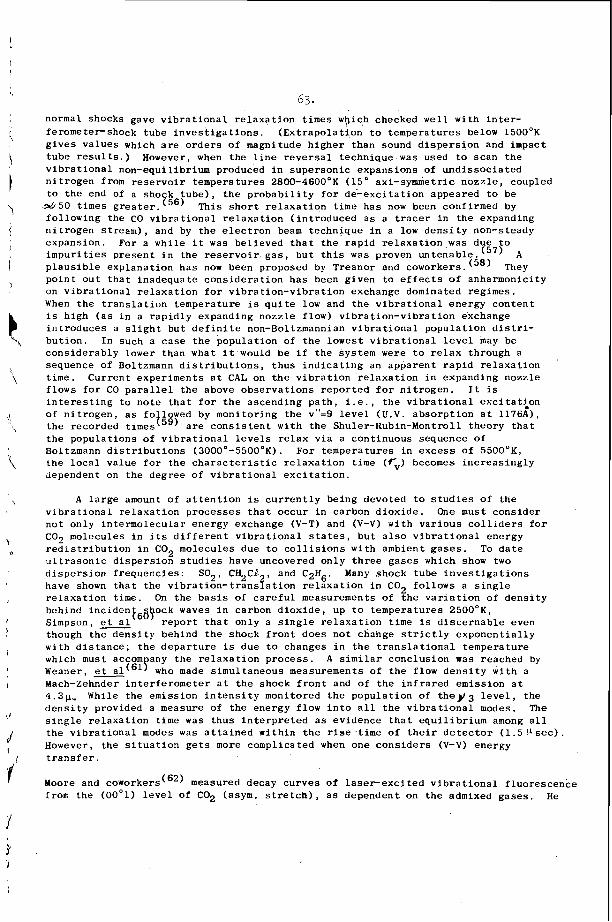
63 . normal shocks gave vibrational relaxation times which checked well with inter- ferometershock tube investigations, (Extrapolati,on to temperatures below 1500°K gives Values which are orders of magnitude higher than sound dispersion and impact tube results.) However, when the line reversal technique was used to scan the vibrational non-equilibrium produced in supersonic expansions of undissociated nitrogen from reservoir temperatures 2800-4600’K (15’ axi-symnietric nozzle, coupled to the end of a shock tube), the probability fo r de-excitation appeared to be
* 5 0 times greater.(56) This short relaxation time has now been confirmed by following the CO vibrational relaxation (introduced as a tracer in the expanding nitrogen stream), and by the electron beam techngque in a low density non-steady expansion. For a while it was believed that the rapid relaxation,was d e to impurities present in the reservoir.gas, but this was proven untenable ‘57) A plausible explanation has now been proposed by Treanor and coworkers. (”) point out that inadequate consideration has been given to effects of anharmonicity on vibrational relaxation for vibration-vibration exchange dominated regimes. When the translation temperature is quite low and the vibrational energy content is high (as in a rapidly expanding nozzle flow) vibration-vibration exchange introduces a slight but definite non-Boltzmannian vibrational population distri- bution. In such a case the population of the lowest vibrational level may be considerably lower than what it would be if the system were to relax through a sequence of Boltzmann distributions, thus indicating an apparent rapid relaxation time. Current experiments at CAL on the vibration relaxation in expanding nozzle flows for CO parallel the above observations reported f o r nitrogen. It is interesting to note that for the ascending path, i.e., the vibrational excitation of nitrogen, as fo lowed by monitoring the v”=9 level (U.V. absorption at 1176A), the recorded timest5’) are consistent with the Shuler-Rubin-Montroll theory that the populations of vibrational levels relax via a continuous sequence of Boltzmann distributions (3000°-55000K). For temperatures in excess of 5500°K, the local value for the characteristic relaxation time ($) becomes increasingly dependent on the degree of vibrational excitation.
They
A large amount of attention is currently being devoted to studies of the vibrational relaxation processes that occur in carbon dioxide. One must consider not only intermolecular energy exchange (V-T) and (V-V) with various colliders for C02 molecules in its different vibrational states, but also vibrational energy redistribution in C02 molecules due to collisions with ambient gases. To date ultrasonic dispersion studies have uncovered only three gases which show two dispersion frequencies: SOz, CI$CJ,, and CzH6. Many shock tube investigations have shown that the vibration-translation relaxation in C02 follows a single relaxation time. On the basis of careful measurements of the variation of density behind incidenF6@ock waves in carbon dioxide, up to temperatures 2500°K, Simpson, report that only a single relaxation time is discernable even though the density behind the shock front does not change strictly exponentially with distance; the departure is due to changes in the translational temperature which must accom any the relaxation process. A similar conclusion was reached by Weaner, who made simultaneous measurements of the f l o w density with a Mach-Zehnder interferometer at the shock front and of the infrared emission at 4 . 3 ~ ” While the emission intensity monitored the population of the93 level, the density provided a measure of the energy flow into all the vibrational modes. The single relaxation time was thus interpreted as evidence that equilibrium among all the vibrational modes was attained within the rise.time of their detector (1.5CIsec). However, the situation gets more complicated when one considers (V-V) energy transfer.
Moore and coworkers(62) measured decay curves of laserexcited vibrational fluorescence from the (00’1) level of C02 (asym. stretch), as dependent on the admixed gases. H e
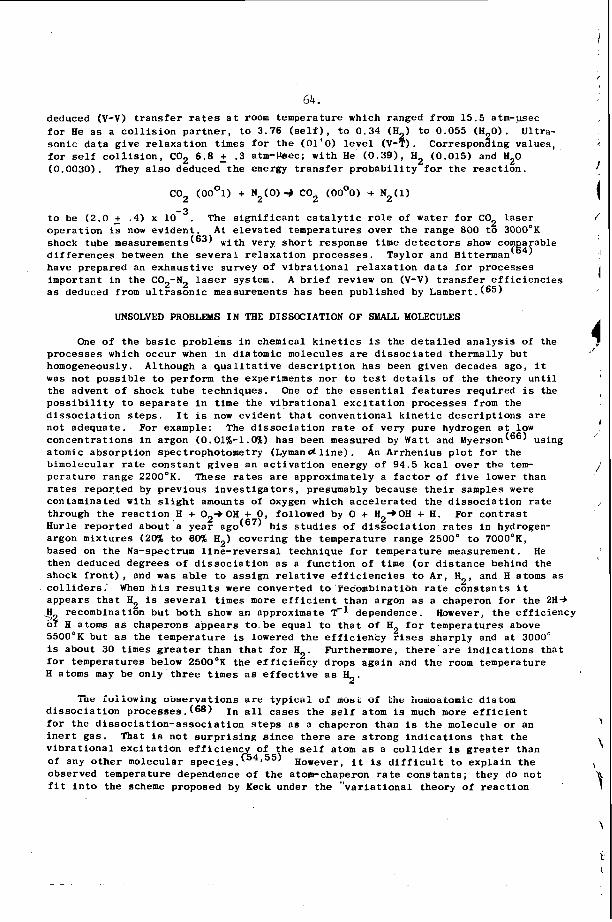
64. deduced (V-V) t r a n s f e r r a t e s a t room temperature which ranged from 15 .5 atm-psec f o r H e a s a c o l l i s i o n p a r t n e r , to 3.76 ( s e l f ) , to 0.34 (H2) t o 0.055 (H20). son ic da t a g ive r e l a x a t i o n t i m e s f o r t h e (01'0) l e v e l (V-T). f o r s e l f c o l l i s i o n , C02 6 . 8 2 .3 a tm-kec ; w i t h H e (0.39), H2 (0.015) and H20 (0.0030). They a l s o deduced t h e energy t r a n s f e r p r o b a b i l i t y f o r t he r e a c t i o n .
C02 (OOol ) + N Z ( 0 ) - + C02 (OOOO) + N2(1)
U l t r a - Corresponding va lues ,
t o be (2.0 _+ .4) x The s i g n i f i c a n t c a t a l y t i c r o l e of water f o r C02 l a s e r ope ra t ion is now ev iden t shock tube m e a ~ u r e m e n t s ( 6 ~ ) with very s h o r t response time d e t e c t o r s show corn a rab le d i f f e r e n c e s between t h e s e v e r a l r e l a x a t i o n processes . Taylor and bitter ma^^''^) have prepared an exhaus t ive survey of v i b r a t i o n a l r e l a x a t i o n da ta f o r processes important i n the C02-N2 l a s e r system. a s deduced from u l t r a s o n i c measurements has been published by Lambert. (c5)
A t e leva ted temperatures over t h e range 800 t o 3000'K
A b r i e f review on (V-V) t r a n s f e r e f f i c i e n c i e s
UNSOLVED PROBLEMS I N THE DISSOCIATION OF SMALL MOLECULES
One of the b a s i c problems i n chemical k i n e t i c s is t he d e t a i l e d a n a l y s i s of the processes which occur when i n diatomic molecules a r e d i s s o c i a t e d thermal ly but homogeneously. Although a q u a l i t a t i v e d e s c r i p t i o n has been given decades ago, i t was not poss ib l e to perform t h e experiments nor t o test d e t a i l s of t he theory u n t i l t he advent of shock tube techniques . One of t he e s s e n t i a l f e a t u r e s requi red is the p o s s i b i l i t y t o s e p a r a t e i n t i m e the v i b r a t i o n a l e x c i t a t i o n processes from the d i s s o c i a t i o n s t e p s . I t is now evident t h a t convent iona l k i n e t i c d e s c r i p t i o n s a re not adequate. For example: The d i s s o c i a t i o n r a t e of very pure hydrogen a t low concen t r a t ions i n argon (O.Ol%-l.ock) has been measured by Watt and Myerson(66) using atomic absorp t ion spectrophotometry (Lymandl ine) . An Arrhenius p l o t f o r the bimolecular r a t e cons t an t g i v e s an a c t i v a t i o n energy of 94.5 kca l over t h e t e m - pe ra tu re range 2200'K. These r a t e s a r e approximately a f a c t o r of f i v e lower than r a t e s repor ted by previous i n v e s t i g a t o r s , presumably because t h e i r samples were contaminated with s l i g h t amounts of oxygen which acce le ra t ed t h e d i s s o c i a t i o n r a t e through the r e a c t i o n . 8 + 0 2 + O H + 0, followed by 0 + H2'*OH + H. For c o n t r a s t Hurle repor ted about a year h i s s t u d i e s of d i s s o c i a t i o n r a t e s i n hydrogen- argon mixtures (20% t o 60% H ) covering t h e temperature range 2500' t o 7000°K, based on the Na-spectrum l i n e - r e v e r s a l technique f o r temperature measurement. He then deduced degrees of d i s s o c i a t i o n a s a func t ion of time (or d i s t a n c e behind the shock f r o n t ) , and was a b l e t o a s s ign r e l a t i v e e f f i c i e n c i e s t o A r , €I2, and B atoms a s c o l l i d e r s : When h i s r e s u l t s w e r e converted to recombination r a t e cons t an t s i t appears t h a t H2 is s e v e r a l t imes more e f f i c i e n t than argon a s a chaperon f o r t he 2H-b H ZdH H atoms a s chaperons appea r s t o be equal t o t h a t of li 5500'K but a s the temperature is lowered t h e e f f i c i e n c y rises sha rp ly and a t 3000" i s about 30 times g r e a t e r than t h a t f o r K 2 . f o r temperatures below 2500'K t he e f f i c i e n c y drops aga in and t h e room temperature H atoms may be only t h r e e t i m e s a s e f f e c t i v e a s
2
recombination but bo th show an approximate T-l dependence. However, t h e e f f i c i e n c y f o r tempera tures above 2
Furthermore, t h e r e a r e i n d i c a t i o n s tha t
3. .." ine io i iowing obse rva t ions are i y p i c a i vi m u s t ui the hviiiuaiumic diatoiii
d i s s o c i a t i o n processes . (W) I n a l l cases the s e l f atom is much more e f f i c i e n t f o r t he d i s s o c i a t i o n - a s s o c i a t i o n s t e p s as a chaperon than is t h e molecule or an i n e r t gas . That is no t s u r p r i s i n g s i n c e t h e r e a r e s t r o n g i n d i c a t i o n s t h a t t he v i b r a t i o n a l e x c i t a t i o n e f f i c i e n c of t h e s e l f atom a s a c o l l i d e r is g r e a t e r than of any o t h e r molecular s p e c i e s . w4155) However, i t is d i f f i c u l t t o expla in t h e observed temperature dependence of t h e atom-chaperon r a t e cons t an t s ; they do no t f i t i n t o t h e scheme propoaed by Keck under the " v a r i a t i o n a l theory of r eac t ion
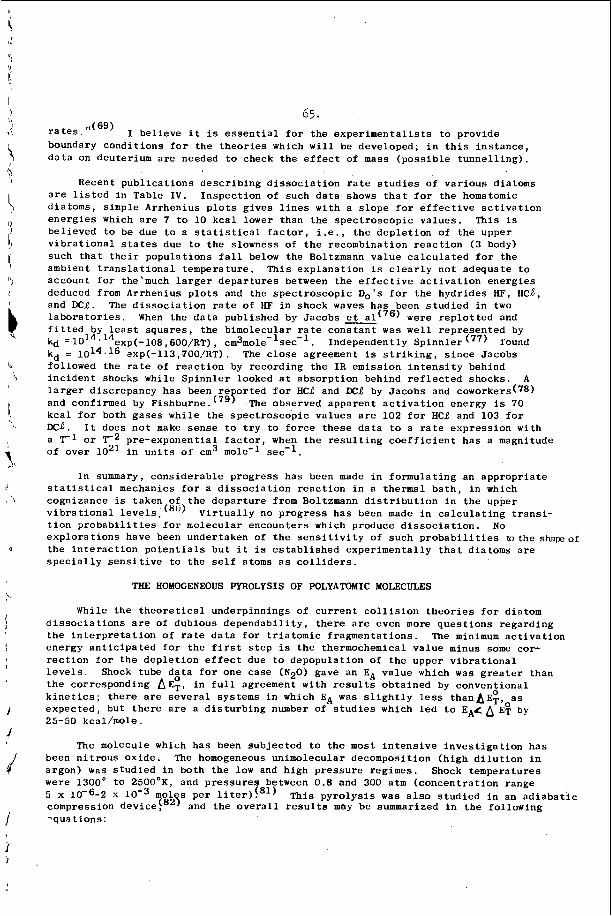
65. rates."(69) boundary conditions for the theories which will be developed; in this instance, data on deuterium are needed to check the effect of mass (possible tunnelling).
I believe it is essential for the experimentalists to provide
Recent publications describing dissociation rate studies of various diatoms are listed in Table IV. Inspection of such data shows that for the homatomic diatoms, simple Arrhenius plots gives lines with a slope for effective activation energies which are 7 to 10 kcal lower than the spectroscopic values. This is believed to be due to a statistical factor, i.e., the depletion of the upper vibrational states due to the slowness of the recombination reaction (3 body) such that their populations fall below the Boltzmann value calculated for the ambient translational temperature. This explanation is clearly not adequate to account for the'much larger departures between the effective activation energies deduced from Arrhenius plots and the spectroscopic Do's for the hydrides HF, HCB, and EL!. The dissociation rate of HF in shock waves has been studied in two laboratories. fitted by least squares, the bimolecular rate constant was well represented by kd = 1014. 14 kd = 101*.16 exp(-113,700/RT). followed the rate of reaction by recording the IR emission intensity behind incident shocks while Spinnler looked at absorption behind reflected shocks. A larger discrepancy has been re orted for HCa and LC.8 by Jacobs and coworkers(78) and confirmed by Fishb~rne.(~'~ The observed apparent activation energy is 70 kcal for both gases while the spectroscopic values are 102 for HCI and 103 for DCe. a T1 or T2 pre-exponential factor, when the resulting coefficient has a magnitude of over 1021 in units of cm3 mole-1 sec-1.
When the data published by Jacobs et(76) were replotted and
exp(-108,600/RT), cm31nole-~sec-~. Independently Spinnler (77) found The close agreement is striking, since Jacobs
It does not make sense to try to force these data to a rate expression with
In summary, considerable progress has been made in formulating an appropriate statistical mechanics for a dissociation reaction in a thermal bath, in which cognizance is taken of the departure from Boltzmann distribution in the upper vibrational levels. ( 8 ' ) tion probabilities for molecular encounters which produce dissociation. No explorations have been undertaken of the sensitivity of such probabilities @the skpeuf the interaction potentials but it is established experimentally that diatoms are specially sensitive to the self atoms as colliders.
Virtually no progress has been made in calculating transi-
THE HOMOGENEOUS PYROLYSIS OF POLYATOMIC MOLECULES
While the theoretical underpinnings of current collision theories for diatom dissociations are of dubious dependability, there are even more questions regarding the interpretation of rate data for triatomic fragmentations. The minimum activation energy anticipated for the first step is the thermochemical value minus some cor- rection for the depletion effect due to depopulation of the upper vibrational levels. the corresponding A E ~ , in full agreement with results obtained by conventional kinetics; there are several systems in which EA was slightly less thanAE;,oas expected, but there are a disturbing number of studies which led to E A e A ET by 25-50 kcal/mole.
Shock tube data for one case (N2O) gave an EA value which was greater than 0
The molecule which has been subjected to the most intensive investigation has been nitrous oxide. The homogeneous unimolecular decomposition (high dilution in argon) was studied in both the low and high pressure regimes. Shock temperatures were 1300' to 2500DK, and pressures between 0.8 and 300 atm (concentration range 5 x 10⁻⁶-2 x compression and the overall results may be summarized in the following -quations:
mol s per liter)(81) This pyrolysis was also studied in an adiabatic

66.
11.1 -1 [High pressure limit: 10 exp(-59,5OO/RT), sec J
N20 + 0 --F k2 2 NO k3/kz 3 f 1
N , O + O - - - - r N kg +'02 ( k 2 + k ! ~ ( 2 . 4 f 0 . 8 ) x 1 0 1 ~ c m 3 mole -1 sec -1
L 2 3 at 1800%.
The pyrolysis of the N 0 was also studied with a shock tube leaking into a quadruple mass filter.ql7)
At the AQARD Colloquium, Troe and Wagner(") proposed a general treatment for the dissociation of small molecules, as a semi-quantum mechanical extension Of unimolecular reaction rate theory. They considered both tri- and tetra-atomics and divided the former into two groups, those which follow spin-allowed dissocia- tions and those which require a net change in spin. The latter include N 0, CS2,
first step in the decomposition of 0.001% CS in argon was observed, completely isolated from the consecutive reaction S + Cg2+ CS + S2, using a W absorption technique. They also studied the rate of dissociation of SO2 at concentrations below 0.3% in Ar, and of very dilute mixtures of water. The spin-forbidden dissociations approach their high pressure unimolecular limits at a few hundred atmospheres, but this condition cannot be reached for melecules which dissociate to the ground state atom species, as does %O. when one observes the rate of disappearance of water, say from its emission intensity in the infrared at concentrations 0.02% to 0.2%, the rate constant is given by k&i = (Ar) 101412exp(-105000/RT), ~m~mo1e-lsec-l. Here, as in the case of SO2, over the temperature range 2700O to 4000°, the measured rate is twice the magnitude for the first step, because the initial dissociation of the water is followed by the very rapid reaction, H + H20+OH + €I2. Above 4500°K only the first step is recorded, since all the subsequent steps are very rapid and the first step essentially controls the overall OH production. However, if the course of the reaction i5 followed by recording the amount of OH produced, (OH absorption at 3063A")(85) the energy activation is about 50 kcal/mole. the Obttingen investigators. centrations the initial dissociation step is followed by a host of radical chains which involve OH; these are so rapid that they control the overall rate of its appearance.
. and C02. This analysis was amplified by Olschewski, Troe and Wagner. (841 The
It is interesting to note that
This was confirmed by Clearly, at the lower temperatures and higher con-
One of the triatomic molecules which produces a product in an electronically excited state is CO . temperature range 680O0-110OO0K (1% in Ar) . infrared emission intensity a t 2;? and 4:3.&: Hie re_sults were eese~tielly C C E ~ ~ ~ E P ~
by E. S. Fishburne and coworkers(87) (3000-5000DK; 1% to l m in Ar or N2). results are:
Davies(86)reported that his shock tube study covered the Dissociation was monitored by the .
Their
11 1 11 f kAr =7.1lxlO TLexp(-84500/RT); k = 5 . 3 3 x 1 0 Tzexp(-79000/RT), ~ r n ~ m o l e - ~ s e c ' ~
The thermochemical dissociation energy is 125.3 kcal/mole. gators. also studied C02 but at low concentrations and very high pressures in Ar.
N2
The Ggttingen investi- .
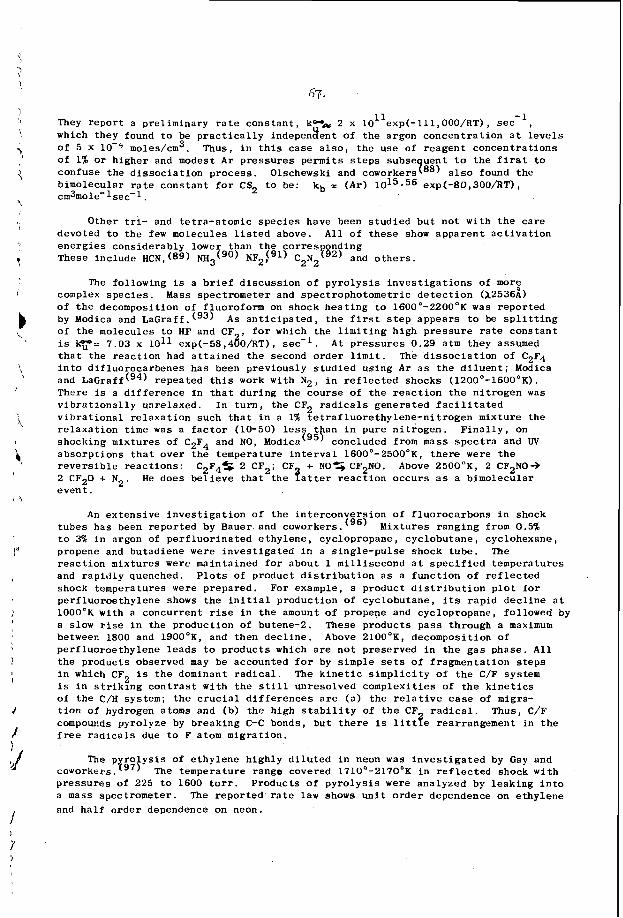
-1 They report a preliminary rate constant, kMm 2 x 101lexp(-lll,OOO/RT), sec which they found to be practically indepenxent of the argon concentration at levels of 5 X lo-'' moles/cm3. Of 1% or higher and modest Ar pressures permits steps subse uent to the first to confuse the dissociation process. bimolecular rate constant for CS2 to be: cm3mole-lsec-1.
,
Thus, in this case also, the use of reagent concentrations
Olschewski and coworkersq88) also found the kb = ( A r ) 1015.56 exp(-80,300/RT),
Other tri- and tetra-atomic species have been studied but not with the care devoted to the few molecules listed above. All of these show apparent activation energies considerably lower than the corres onding These include HCN, (89) NH3('') NF2,('l) C2N2P92) and others.
The following is a brief discussion of pyrolysis investigations of mor: complex species. Mass spectrometer and spectrophotometric detection (X2536A) of the decomposition of fluoroform on shock heating to 1600°-22000K was reported by Modica and LaGraff.(g3) As anticipated, the first step appears to be splitting of the molecules to HF and CF , for which the limiting high pressure rate constant is 7.03 x exp(-58,480/RT), sec-l. At pressures 0.29 atm they assumed that the reaction had attained the second order limit. into difluorocarbenes has been previously studied using Ar as the diluent; Modica and LaGraff(g4) repeated this work with N 2 , in reflected shocks (1200°-16000K). There is a difference in that during the course of the reaction the nitrogen was vibrationally unrelaxed. In turn, the CF2 radicals generated facilitated vibrational relaxation such that in a 1% tetrafluorethylene-nitrogen mixture the relaxation time was a factor (10-50) less t an in pure nitrogen. Finally, on shocking mixtures of C2F4 and NO, Modi~a(~'~ concluded from mass spectra and W absorptions that over the temperature interval 160O0-250OoK, there were the reversible reactions: C2F4$ 2 CF2; CF + NOSCF2N0. Above 250OoK, 2 CF2NO+ 2 CF20 + N2. event.
The dissociation of C2F4
He does believe that the fatter reaction occurs as a bimolecular
An extensive investigation of the interconversion of fluorocarbons in shock tubes has been reported by Bauer and coworkers.(96) to 3% in argon of perfluorinated ethylene, cyclopropane, cyclobutane, cyclohexane, propene and butadiene were investigated in a single-pulse shock tube. The reaction mixtures were maintained for about 1 millisecond at specified temperatures and rapidly quenched. Plots of product distribution as a function of reflected shock temperatures were prepared. For example, a product distribution plot for perfluoroethylene shows the initial production of cyclobutane, its rapid decline at 1000°K with a concurrent rise in the amount of propene and cyclopropane, followed by a slow rise in the production of butene-2. These products pass through a maximum between 1800 and 1900°K, and then decline. Above 2100°K, decomposition of perfluoroethylene leads to products which are not preserved in the gas phase. All the products observed may be accounted for by simple sets of fragmentation steps in which CF2 is the dominant radical. is in striking contrast with the still unresolved complexities of the kinetics of the C/H system; the crucial differences are (a) the relative ease of migra- tion of hydrogen atoms and (b) the high stability of the CF radical. Thus, C/F compounds pyrolyze by breaking C-C bonds, but there is littye rearrangement in the free radicals due to F atom migration.
coworkers . f 9 7 ) pressures of 225 to 1600 torr. Products of pyrolysis were analyzed by leaking into a mass spectrometer. The reported rate law shows unit order dependence on ethylene and half order dependence on neon.
Mixtures ranging from 0.5%
The kinetic simplicity of the C/F system
The p rolysis of ethylene highly diluted in neon was investigated by Gay and The temperature range covered 1710°-21700K in reflected shock with
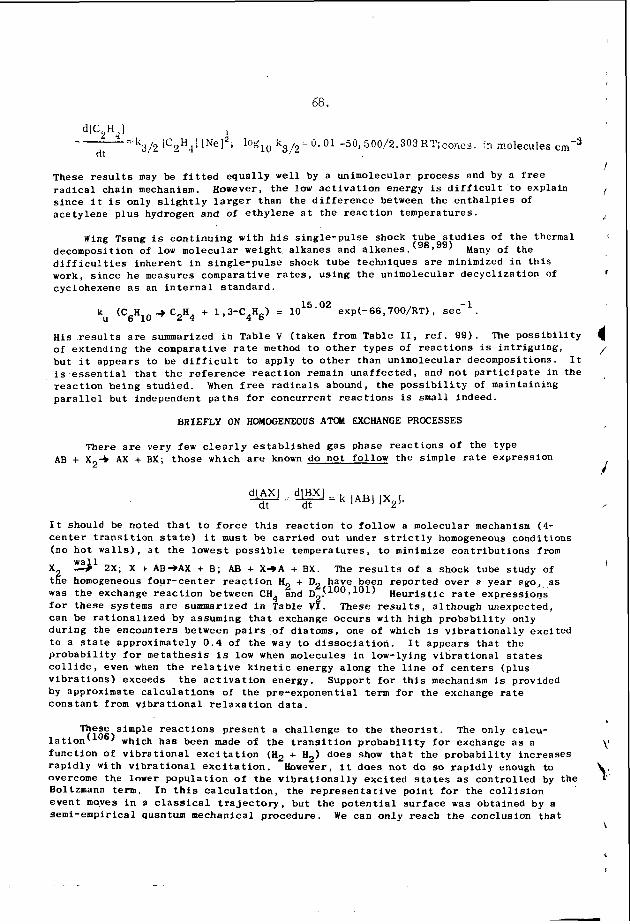
68.
These r e s u l t s may be f i t t e d e q u a l l y w e l l by a unimolecular process and by a f r e e r a d i c a l cha in mechanism. However, t h e l o w a c t i v a t i o n energy is d i f f i c u l t . t o explain s i n c e i t i s only s l i g h t l y l a r g e r than the d i f f e r e n c e - between t h e e n t h a l p i e s of ace ty lene p lus hydrogen and of e t h y l e n e a t t h e r e a c t i o n temperatures .
Wing Tsang is c o n t i n u i n g w i t h h i s s ing le-pulse shock tube s t u d i e s of the thermal decomposition of l o w molecular weight. a lkanes and a lkenes . (98*99) d i f f i c u l t i e s i n h e r e n t i n s i n g l e - p u l s e shock tube techniques a r e minimized i n t h i s work, s i n c e he measures comparat ive r a t e s , us ing the unimolecular d e c y c l i z a t i o n of cyclohexene a s an i n t e r n a l s t a n d a r d .
Many of the
k (C H -$ C2H4 + 1,3-C4H6) = 10 15*02 exp(-66,700/RT), sec-l. u 6 10
H i s r e s u l t s a r e summarized i n Table V ( taken from Table 11, r e f . 99 ) . The p o s s i b i l i t y of ex tending the comparat ive r a t e method t o o t h e r types of r e a c t i o n s is i n t r i g u i n g , bu t i t appears t o be d i f f i c u l t t o apply t o o t h e r than unimolecular decompositions. I t i s e s s e n t i a l t h a t t h e r e f e r e n c e r e a c t i o n remain unaf fec ted , and n o t p a r t i c i p a t e i n t h e r e a c t i o n be ing s t u d i e d . When f r e e r a d i c a l s abound, the p o s s i b i l i t y of maintaining p a r a l l e l but independent p a t h s f o r concurrent r e a c t i o n s is small indeed.
BRIEFLY ON HOMOGENEOUS A ' I W EXCHANGE PROCESSES
There a r e very f e w c l e a r l y e s t a b l i s h e d g a s phase r e a c t i o n s of the type AB + Xz+ AX + BX; t h o s e which a r e known do n o t fol low t h e s imple r a t e expression
I t should be noted t h a t t o force t h i s r e a c t i o n to follow a molecular mechanism (4- c e n t e r t r a n s i t i o n s t a t e ) i t must be c a r r i e d o u t under s t r i c t l y homogeneous condi t ions (no h o t w a l l s ) , a t t h e lowest p o s s i b l e temperatures , t o minimize c o n t r i b u t i o n s from
X t i e homogeneous four -center r e a c t i o n H + D have been repor ted over a year ago, a s was t h e exchange r e a c t i o n between CH4 Znd D2.(100p lol) H e u r i s t i c r a t e expressions for these systems a r e summarized i n Table Vf. can be r a t i o n a l i z e d by assuming t h a t exchange occurs w i t h h igh p r o b a b i l i t y only d u r i n g the encounters between p a i r s of diatoms, one of which is v i b r a t i o n a l l y exc i ted t o a state approximately 0 .4 of t h e way to d i s s o c i a t i o n . I t appears t h a t the p r o b a b i l i t y f o r meta thes is i s l o w when molecules i n low-lying v i b r a t i o n a l s t a t e s c o l l i d e , even when the r e l a t i v e k i n e t i c energy a long t h e l i n e of c e n t e r s (p lus v i b r a t i o n s ) exceeds t h e a c t i v a t i o n energy. Support f o r this mechanism is provided by approximate c a l c u l a t i o n s of t h e pre-exponent ia l term f o r t h e exchange r a t e c o n s t a n t from v i b r a t i o n a l r e l a x a t i o n d a t a .
wsl 2 X ; X + AB+AX + B; AB + X+A + BX. The r e s u l t s of a shock tube study of
These r e s u l t s , a l though unexpected,
These simple r e a c t i o n s p r e s e n t a cha l lenge t o t h e t h e o r i s t . The only calcu- l a t i o n ( l o 6 ) which h a s been made of t h e t r a n s i t i o n p r o b a b i l i t y f o r exchange a s a f u n c t i o n of v i b r a t i o n a l e x c i t a t i o n (H2 + H2) does show t h a t t h e p r o b a b i l i t y increases r a p i d l y with v i b r a t i o n a l e x c i t a t i o n . However, i t does n o t d o so r a p i d l y enough to overcome t h e lower popula t ion of the v i b r a t i o n a l l y e x c i t e d s t a t e s a s cont ro l led by the Boltzmann term. I n t h i s c a l c u l a t i o n , the r e p r e s e n t a t i v e p o i n t f o r t h e c o l l i s i o n e v e n t mo.ves i n a c l a s s i c a l t r a j e c t o r y , but t h e p o t e n t i a l s u r f a c e was obtained by a semi-empirlcal quantum mechanical procedure. We can o n l y reach t h e conclusion t h a t
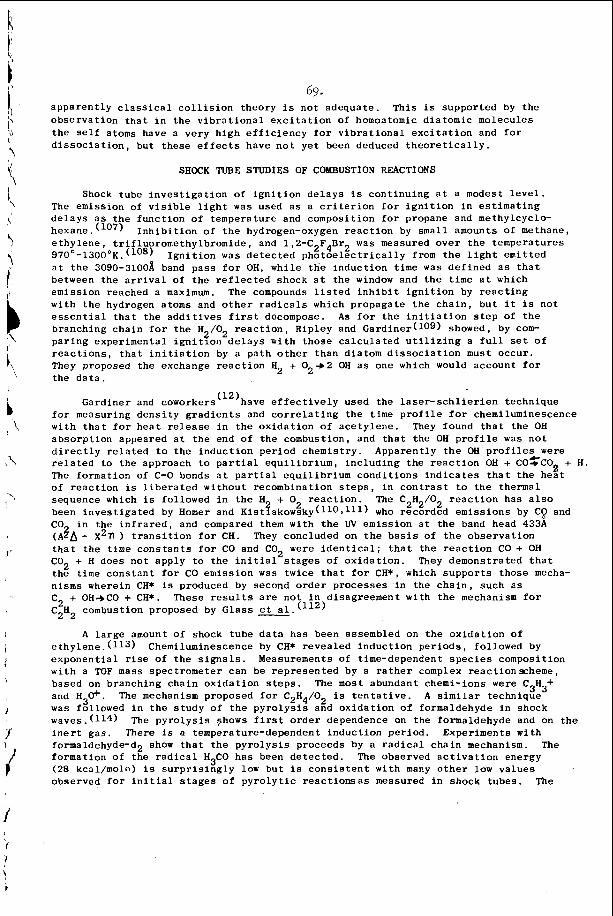
69. apparently classical collision theory is not adequate. This is supported by the observation that in the vibrational excitation of homoatomic diatomic molecules the self atoms have a very high efficiency for vibrational excitation and for dissociation, but these effects have not yet been deduced theoretically.
SHOCK TUBE STUDIES OF COMBUSTION REACTIONS
Shock tube investigation of ignition delays is continuing at a modest level. The emission of visible light was used as a criterion for ignition in estimating delays as the function of temperature and composition for propane and methylcyclo- hexane. (Io7) ethylene, trifluoromethylbromide, and 1,2-C2F4Br2 was measured over the temperatures 970°-13000K. (Io8) at the 3090-31005( band pass for OH, while the induction time was defined as that between the arrival of the reflected shock at the window and the time at which emission reached a maximum. The compounds listed inhibit ignition by reacting with the hydrogen atoms and other radicals which propagate the chain, but it is not essential that the additives first decompose. As for the initiation step of the branching chain for the H2/02 reaction, Ripley and Gardiner(lo9) showed, by com- paring experimental ignition delays with those calculated utilizing a full set of reactions, that initiation by a path other than diatom dissociation must occur. They proposed the exchange reaction H2 + 02+2 OH as one which would account for the data.
Inhibition of the hydrogen-oxygen reaction by small amounts of methane,
Ignition was detected photoelectrically from the light emitted
Gardiner and coworkers(l2’have effectively used the laser-schlierien technique for measuring density gradients and correlating the time profile for chemiluminescence with that for heat release in the oxidation of acetylene. They found that the OH absorption appeared at the end of the combustion, and that the OH profile was not directly related to the induction period chemistry. Apparently the OH profiles were related to the approach to partial equilibrium, including the reaction OH + CO%CO:, + H. The formation of C-0 bonds at partial equilibrium conditions indicates that the heat of reaction is liberated without recombination steps, in contrast to the thermal sequence which is followed in the H2 + 0 been investigated by Homer and Kistiakowsky(llOtlll) who recorded emissions by C8 and CO in the infrared, and compared them with the W emission at the band head 433A ( A E A - x271 ) transition for CH. that the time constants for CO and C02 were identical; that the reaction CO + OH CO + H does not apply to the initial stages of oxidation. They demonstrated that the time constant for CO emission was twice that for CH*, which supports those mecha- nisms wherein CH* is produced by second order processes in the chain, such as C2 + OH-bCO + CH*. C H
reaction. The C H /O reaction has also 2 2 2 2
They concluded on the basis of the observation
2
These results are not in disagreement with the mechanism for combustion proposed by Glass S . ( ’ l 2 )
A large amount of shock tube data has been assembled on the oxidation of
2 2
ethylene.(ll3) Chemiluminescence by CH* revealed induction periods, followed by exponential rise of the signals. Measurements of time-dependent species composition with a TOF mass spectrometer can be represented by a rather complex reactionscheme, based on branching chain oxidation steps. The most abundant chemi-ions were C H + 3 3 and H30+. was followed in the study of the pyrolysis and oxidation of formaldehyde in shock waves.(ll4) inert gas. There is a tempera ture-dependent induction period. Experiments wi th formaldehyde-d2 show that the pyrolysis proceeds by a radical chain mechanism. formation of the radical H3C0 has been detected. The observed activation energy ( 2 8 kcal/mole) is surprisingly low but is consistent with many other low values observed for initial stages of pyrolytic reactionsas measured in shock tubes. The
The mechanism proposed for C2H4/02 is tentative. A similar technique
The pyrolysis shows first order dependence on the formaldehyde and on the
The
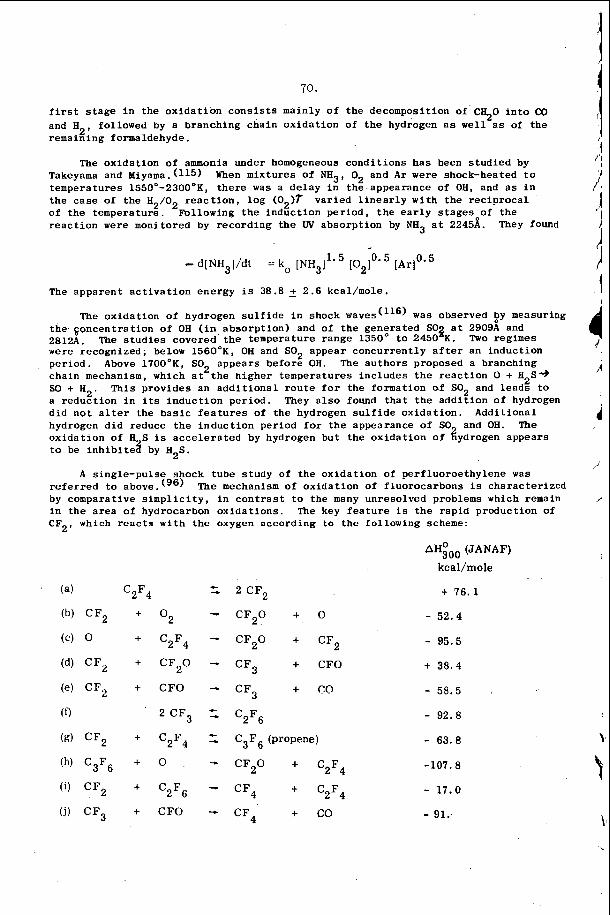
70.
first stage in the oxidation consists mainly of the decomposition of'c 0 into co and €I2, followed by a branching chain oxidation of the hydrogen as well as of the remaining formaldehyde.
3
The oxidation of ammonia under homogeneous conditions has been studied by Takeyama and Miyama.(ll5) When mixtures of NH3, O2 and Ar were shock-heated to temperatures 1550°-23000K, there was a delay in the.appearance of OH, and as in the case of the H /O of the temperaturz. 2Following the induction period, the early stages of the reaction were monitored by recording the W absorption by NH3 at 2245i.
reaction, log (0,)r varied linearly with the reciprocal
They found
- d[NH3]/dt -- ko [NH3]le5 [02]0'5
The apparent activation energy is 38.8 2 2.6 kcal/mole.
The oxidation of hydrogen sulfide in shock waves(''') was observed t/y measuring the.goncentration of OH (in absorption) and of the generated SO# at 2909A and 2812A. were recognized; below 1560°K, OH and SO2 appear concurrently after an induction period. chain mechanism, which at the higher temperatures includes the reaction 0 + H S-) SO + H 2 . This provides an additional route for the formation of SO2 and leads to a reduction in its induction period. They also found that the addition of hydrogen did not alter the basic features of the hydrogen sulfide oxidation. Additional hydrogen did reduce the induction period for the appearance of SO and OH. The oxidation of H S is accelerated by hydrogen but the oxidation of gydrogen appears to be inhibite8 by HZS.
The studies covered'the temperature range 1350O to 2450 K. Two regimes
The authors proposed a branching Above 170ODK, SO2 appears before OH. 2
A single-pulse shock tube study of the oxidation of perfluoroethylene was referred to above. (") by comparative simplicity, in contrast to the many unresolved problems which remain in the area of hydrocarbon oxidations. The key feature is the rapid production of C F 2 , which reacts with the oxygen according to the following scheme:
The mechanism of oxidation of fluorocarbons is characterized
C2F4
O2
'ZF4
CFZO
C FO
2 CF3
C2F4
0
C2F6
C FO
t 2 C F 2
- CF20 4 - 0
- CF20 + CF2
- CF3 + CFO
- CF, + co
2 C2F6
-. C3F6 (propene) - CF20 + C2F4
- CF4
3
c
+ 'ZF4 - CF4 + co
AH^^^ (JANAF)
kcal/mole
+ 7 6 . 1 ~.
- 5 2 . 4
- 95.5
-+ 3 8 . 4
- 611 c: "V. "
- 92.8 - 63.8 -107.8
- 17.0
- 91:
71.
This sequence accounts for the observed product distributions as functions of the temperature, for several compositions of ethylene and oxygen. The detailed con- firmation of the individual steps and their ,reaction rate constants will have to be obtained from mass spectrometric diagnostics.
CONCLUSION
It is amusing to attempt to pinpoint the salient features of shock tube chemi- cal kinetics. Among the many attractive ones, the most worthwhile in my opinion is the specificity in identification of transient species (and of states) on a time-resolved basis; the most troublesome is the lack of sufficiently precise tern- perature measurement; the most intriguing is the need to exploit sophisticated computer programs in order to unravel the coupling of reactions in a complex system.
ACKNOWLEDGMENT
This work was supported by the AMSR under Grant No. AF49(638 sincere thanks are due.
-1448, to whom
I
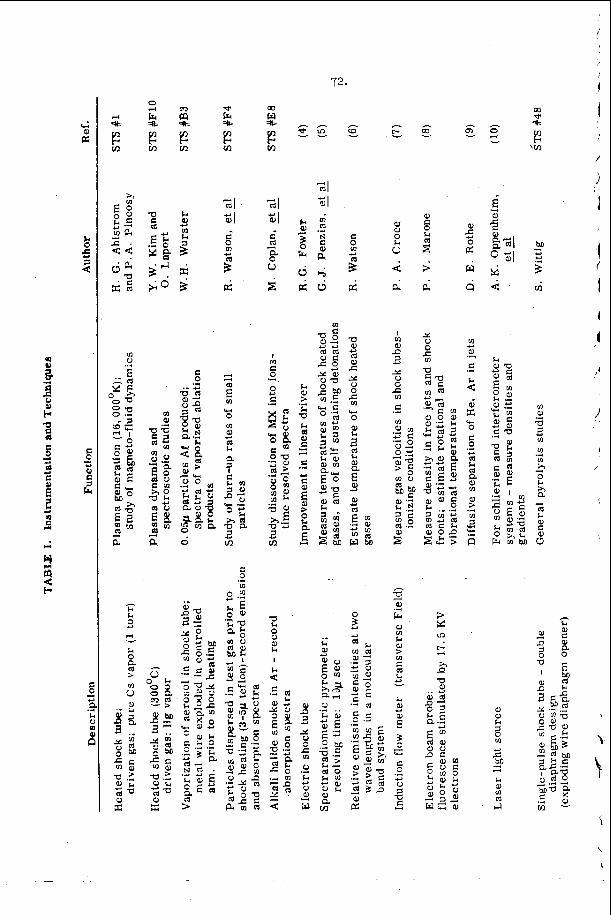
a, w ilt
rn
CGI 01
oa si
Y
C 0 - u
I
C 0
0 C
rn
e - .
c)
h z
c 0 m +I
s" p:
0 3 -0 *
h
F-,
8'
4 6
0 k u
I m 0) I)
Y V 0
2
c, C .d
r n
a,
+4= rn b
'rn
M .e Y Y s rn
lo m a 3 m m x 0
.3
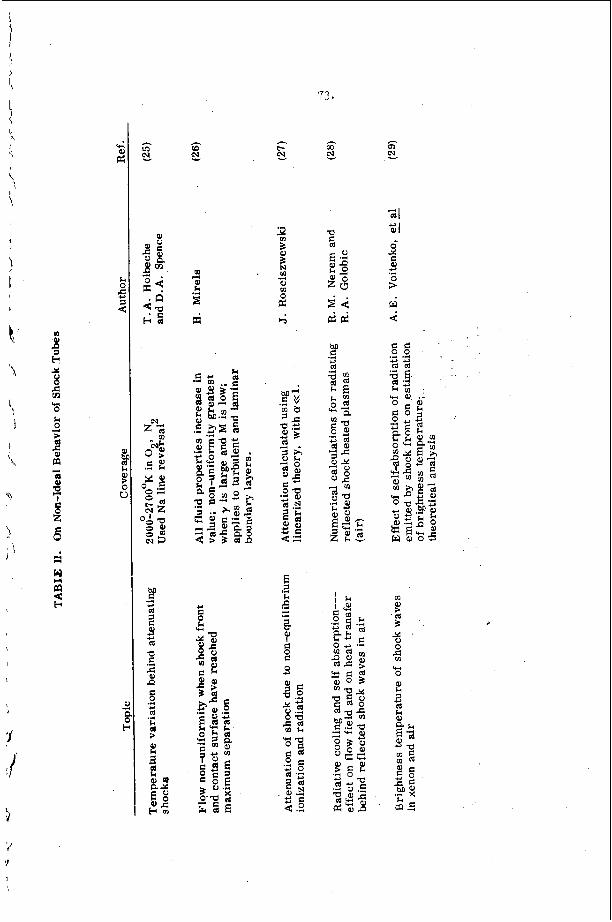
73.
G c? E? c c-
-4 I
,
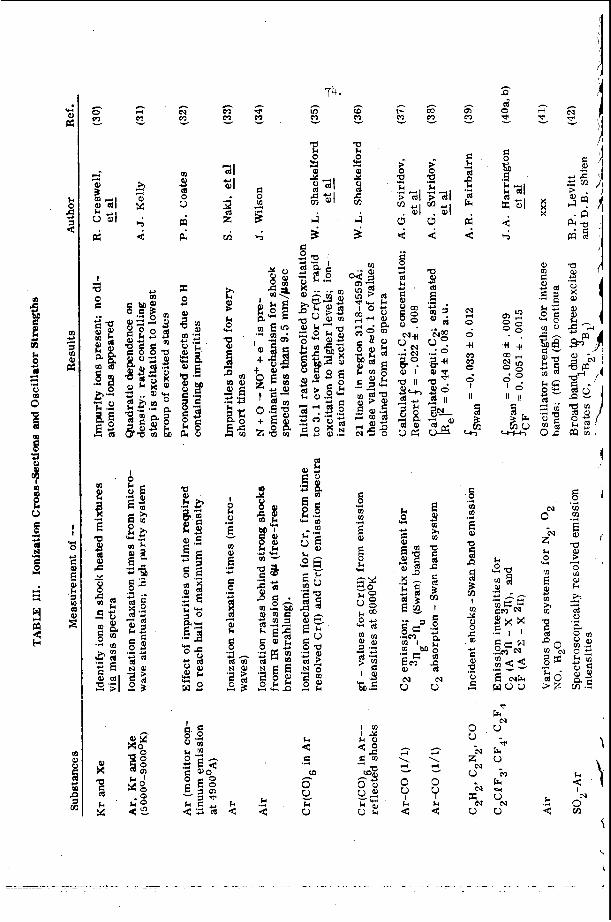
d
&, 8 0 '7
9 4
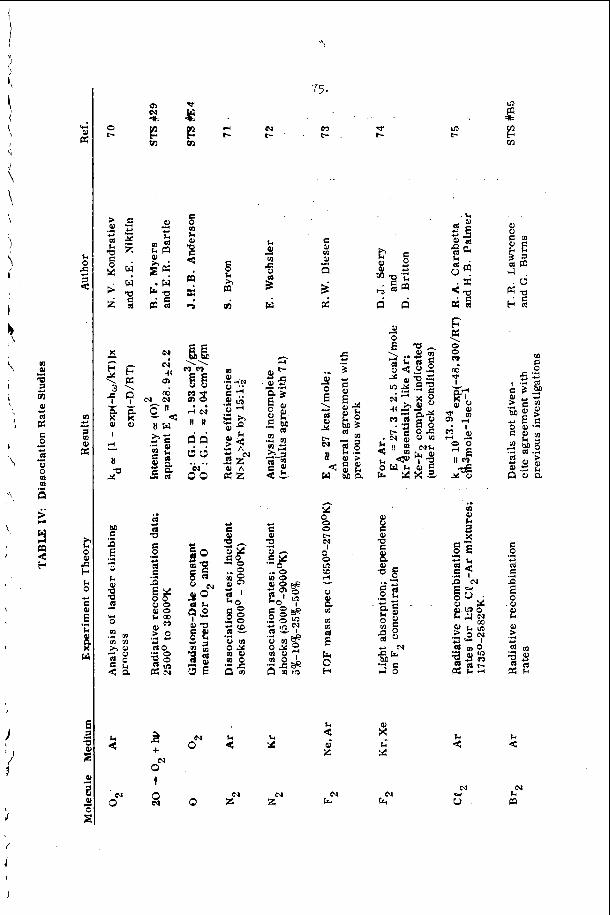
In c-
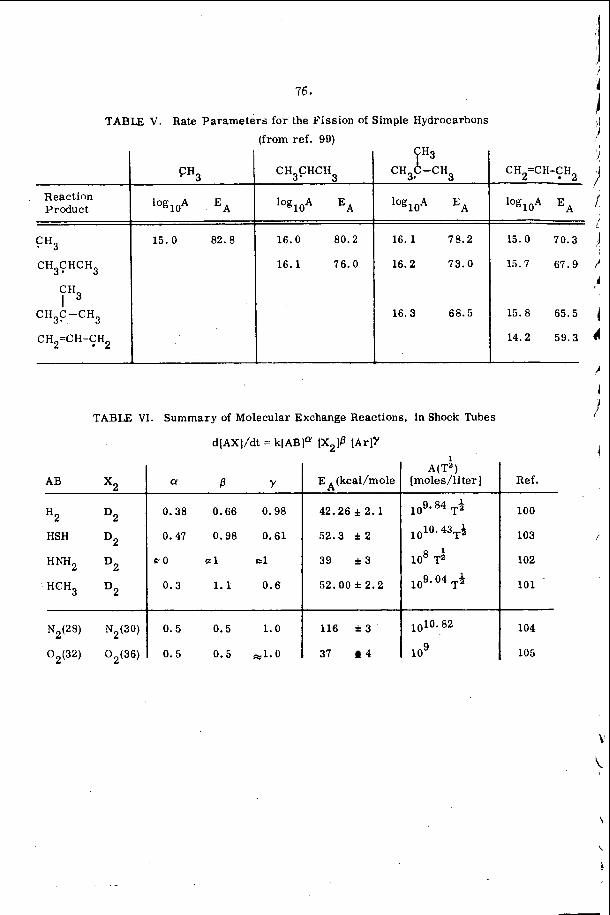
76.
TABLE V. Rate Parameters for the Fission of Simple Hydrocarbons (from ref. 99)
Reaction Product
CH3
CH3qHCH3
y 3 CH3C-CH3
C H2=C H - $H2
CH3
log1OA E A
15.0 82. 8
-.
E A( kcal/mole
42.26 f 2 . 1
52.3 f 2
39 f 3
52.00* 2.2
116 f 3
37 4
3 CH3CHCH
log1OA E A
*(Ti) [moles/liter ] Ref.
T 100
1010.43 T 4 103 /
108 T'z 102
T a 101
1010.82 104
lo9 105
16.0 80.2
16.1 76.0
16. 1 78.2
16.2 73.0
16.3 68.5
I
I
1 \ I )
9
2 ) CH2=CH-$H
log1OA E A / I
15.0 70.3 ,)
15.7 67.9 1 rl
15.8 65.5 1 14.2 59.3 d
rc 1 I ,' TABLE VI. Summary of Molecular Exchange Reactions, In Shock Tubes
i d[AX]/dt = k[ABla [X21p IArlr
a P Y
0.38 0.66 0.98
0.47 0.98 0.61
e0 C l C l
0 .3 1.1 0.6
0.5 0.5 1.0
0 .5 0.5 -1.0
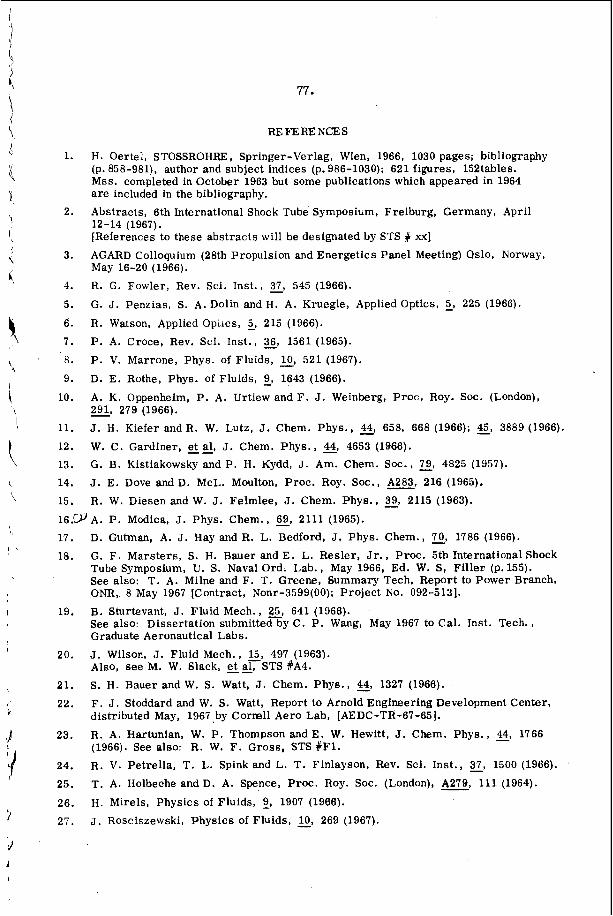
1.
2.
3.
4.
5.
6.
7 .
8.
9.
10.
11.
12.
13.
14.
15.
77.
REFERENCES
H. Oertel, STOSSROHRE , Springer-Verlag, Wien, 1966, 1030 pages; bibliography (p. 858-981), author and subject indices (p. 986-1030); 621 figures, 152tables. Mss. completed in October 1963 but some publications which appeared in 1964 are included in the bibliography.
Abstracts, 6th International Shock Tube Symposium, Freiburg, Germany, April 12-14 (1967). [References to these abstracts will be designated by STS # xx] AGARD Colloquium (28th Propulsion and Energetics Panel Meeting) Oslo, Norway, May 16-20 (1966).
R. G. Fowler, Rev. Sci. Inst . , 37, 545 (1966).
G. J. Penzias, S . A. D o h and H. A. Kruegle, Applied Optics, 5, 225 (1966).
R. Watson, Applied O ~ L I C S , 2, 215 (1966).
P. A. Croce, Rev. Sci. Inst., 3, 1561 (1965).
P. V. Marrone, Phys. of Fluids, E, 521 (1967).
D. E. Rothe, Phys. of Fluids, 2, 1643 (1966).
A. K. Oppenheim, P. A. Urtiew and F. J. Weinberg, Proc , Roy. SOC. (London), - 291, 279 (1966).
J. H. Kiefer and R. W. Lutz, J. Chem. Phys., 44, 658, 668 (1966); 45, 3889 (1966).
W. C. Gardiner, et&, J . Chem. Phys. , 44, 4653 (1966). G. B. Kistiakowsky and P. H. Kydd, J. Am. Chem. Soc., 79, 4825 (1957).
J. E . Dove andD. McL. Moulton, Proc . Roy. SOC., H, 216 (1965).
R. W. Diesen and W. J. Felmlee, J . Chem. Phys. , E, 2115 (1963).
1 6 . w A . P. Modica, J. Phys. Chem., E, 2111 (1965). 17.
18.
D. Gutman, A. J. Hay and R. L. Bedford, J. Phys. Chem., E, 1786 (1966).
G. F. Marsters , S . H. Bauer a n d E . L. Resler, J r . , Proc. 5th InternationalShock Tube Symposium, U. S. Naval Ord. Lab., May 1966, Ed. W. S, Flllel: (p. 155). See also: T. A. Milne and F. T. Greene, Summary Tech, Report to Power Branch, ONR, 8 May 1967 [Contract, Nonr-3599(00); Project No. 092-5131.
B. Sturtevant, J. Fluid Mech., 25, 641 (1966). See also: Dissertation submitted by C . P. Wang, May 1967 to Cal. Inst. Tech., Graduate Aeronautical Labs.
J. Wilson, J. Fluid Mech., 15, 497 (1963). Also, see M. W. Slack, e t & , STS #A4.
S. H. Bauer and W. S. Watt, J . Chem. Phys., 44, 1327 (1966).
F. J. Stoddard and W. S. Watt, Report to Arnold Englneering Development Center, distributed May, 1967 ,by Corm11 Aero Lab, [AEDC-TR-67-65].
R. A . Hartunian, W. P. Thompson and E. W. Hewltt, J. Chem. Phys., 4, 1766 (1966). See also: R. W. F. Gross , STS #Fl. R. V. Petrel la , T. L. Spink and L. T. Finlayson, Rev. Sci. Inst., 31, 1500 (1966).
T. A. Holbeche andD. A. Spence, Proc. Roy. SOC. (London), m, 111 (1964).
19.
20.
21.
22.
23.
24.
25.
26. H. Mirels, Physics of Fluids, 2, 1907 (1966).
27. J. Rosciszewski, Physics of Fluids, g, 269 (1967).
78.
28. R. M. Nerem and R. A. Goloblc, STS #30. 29. A. E. Voitenko, I. Sh. Model' and I. S. Samodelov, Soviet Physics (Doklady)
- 11, 596 (1967).
30. R. Creswell, M. A. Divalentin and J. E. Dove, Physics of Fluids, 9, 2285 (1966). 31a. A. J. Kelly, J . Chem. Phys. , 45, 1723 (1966). 31b. A. J. Kelly, J. Chem: Phys., 45, 1733 (1966). 32. P. B. Coates, Nature: 211, 300 (1966). 33. S. Nakai, K. Kasuya and C. Yamanaka, J. Phys. Soc. Japan, 21. 805 (1965). 34. J. Wilson, Physlcs of Fluids, 2, 1913 (1966). 35. W. L. Shackleford and S. S. Penner , J. Chem. Phys., 5 1816 (1966). 36. W. L. Shackleford, J . Quant. Spectrosc. Radlat. Transfer , 2, 303 (1965). 37. A. G. Sviridov, N. N. Sobolev and V. M. Sitovskl, J. Quant. Spectrosc. Radiat.
Transfer , 2, 525 (1965). 3'3. S. G. Sviridov, N. N. Sobolev and M. Z. Novgorodov, J. Quant. Spectrosc.
Radiat. Transfer, E, 337 (1966). 39. A. R. Fairbairn, J. Quant. Spectrosc. Radlat. Transfer , S, 325 (1966). 4Ua. J . A. Harrington, A. P. Modica and D. R. Libby , J. Chem. Phys., g, 3380
(1966).
40h. Howevere2Lbte also, T. Wentink, Jr. and L. Isaacson, J. Chem. Phys. , S, 603 (1967).
4la. D. R . Churchill and R. E. Meyerott, J. Quant. Spectrosc. Radlat. Transfer ,
42.
43.
44. P. Borrell, Chem. S O C . Spec. Publication 20, (Academic Press, 1966) p.283.
45. T. 1.. Cottrell, Int. Inst. Chem., 12th Conference, 1962 (Intersclence N. Y. 1964).
- 5, 69 (1965). [For remaining p a r t s of ref. 41, see end of l ls t . ]
B. P. Levitt and D. B. Sheen, Trans. Farad. SOC., z, 540 (1967). IvI. G. Ferguson and A. W. Read, Trans . Farad. SOC., s, 61 (1967).
46. H . C. Mlllikan, E . Switkes and L. A . Osburg, Bull, Amer. Phys, SOC., 2, 201 (1966).
47a. J. G. Parker , Phys. Fluids, 2, 449 (1959). 47b. J. G. Parker , J . Chem. Phys. , E, 3641 (1966). 48. R. C. Millikan, Molecular Relaxatlon Processes, Chemical B&lety Speclal
Publication No. 20, pp. 219-233 (Burllngton House, London, 1966). 49. C . B. Moore, J . Chem. Phys. . 43, 2979 (1965). 50. A . B. Callear and C. J . Williams, Trans . Farad. SOC., s, 2030 (1966), 51. J. G. Parker and I?. E. Swope, 2 . Chsm. Phys., 43, 4427 iiSS5j.
52. D. R . White, J . Chem. Phys . , e, 2016 (1967). 53. R. W. Lutz and J . H. Klefer, Phys. of Fluids . , 2, 1638 (1968). 54. J . H. Kiefer and R. W. Lutz, private communlcatlon.
55. S. H. Bauer and S. C. Tsang, Phys. Fluids, $, 182 (1963). 56. I. R. Hurle, A . L. Russo and.J. G. Hall, J. Chem. Phys., 40, 2076 (1964). 57. A . L. Russo, J . Chem. P h y s . , s, 1305 (1966).
-
58.
59.
60. 61. 62.
63.
64.
65.
66;
67.
68. 69. 7 0 .
7 la . I Ib.
72.
73. 74.
75. 76. 77.
78.
79.
80a. 80b.
80c.
80d.
81
82.
83.
79.
c. E. Treanor, J. W. Rich, and R. G. Rehm, report to Mechanics Division of the AFOSR under Contract No AF49(638)-1488.
J. p. Appleton, STS BB7; see also, J. P. Appleton and M. Steinberg, J. Chem. Phys. , g, 1521 (1967).
c. J. S. M. Simpson, K. B. Bridgman and T. R. D. Chandler, STS #B9. D. Weaner, J. F. Roach and W. R. Smith, Bull. Am. Phys. SOC., 12, 836 (1967). C. B. Moore, R . E . Wood, B-L. Hu, and J. T-Yardley - pre-publication manuscript . R. L. Taylor, M. Camac and R. M. Feinberg, AVCO Everet t Research report #250, May 1966; To appear: Proceedings 11th Combustion Symposium. R. L . Taylor and S. Bitterman, Pre-publication report.
J. D. Lambert, Quart. Reviews, 21, 67 (1967. J. D. Lambert, D. G. Parks-SmiSh-and J . L. Stretton, Proc. Roy. SOC., A, - 282, 380 (1964).
W. S. Watt and A. L. Myerson, STS #E3. I. R. Hurle, 11th Symposium (International) on Combustion, Berkely, California, August 1966.
S. H. Bauer, AGARD Colloquium, May 1966. J . C. Keck, Discussion Farad. SOC., 33, 173 (1962).
V. N. Kondratiev and E. E. Nikitin, J. Chem. Phys. , 45, 1078 (1966). S. Byron, J. Chem. Phys. , 44, 1378 (1966). K. L. Wray and S. Byron, Phys. Fluids, 2, 1046 (1966); and B. Cary, Phys. Fluids, 2, 1047 (1966). E. Wachsler, Dissertation, Cornel1 University, 1967.
R . W. Diesen, J. Chem. Phys. , 8, 3662 (1966). D. J. Seery and D. Britton, J. Phys. Chem. E, 4074 (1966).
R. A. Carabetta and H. B. Palmer, J. Chem. Phys. , s, 1325, 1333, 1538 (1967). T. A . Jacobs, R. R. Giedt and N. Cohen, J. Chem. Phys. , 43, 3688 (1965). J. F. Spinnler, Report No. S-127, Rohm and Haas Redstone Arsenal Research Labs., April 1967.
T . A. Jacobs, N. Cohen and R. R. Giedt, J. Chem. Phys. , E, 1958 (1967).
E . S. Fishburne, J. Chem. Phys., 2, 4053 (1966).
H. J. Kolker, J. Chem. Phys . , 44, 582 (1966). C. A. Brau, J. C. Keck and G. F. C a r r i e r , Phys. Fluids . , 2, 1885 (1966).
C. A. Brau, Avco Everet t Research Laboratory, Report 261, December 1966. N. S. Snider, J . Chem. Phys . , 45, 3299 (1966).
H . A . Olschewski, J. Troe and H. Gg. Wagner, Ber. Bunsengesellschaft. physik chem., 3, 450 (1966).
A . Martinengo, J . Troe, and H. Gg. Wagner, Zeit. Phys. Chem. 5J, 104 (1966).
J. Troe and H. Gg. Wagner, AGARD Colloquium, Oslo, May 1966.
80.
84. H. A . Olschewski, J. Troe and H. Gg. Wagner, 11th Symposium (International) on Combustion, Berkeley, August 1966.
85. S. H. Bauer, G. L . Schott, and R. E . Duff, J. Chem. P h y s . , - 28, 1089 (1958).
86.
87.
W. 0. Davies, J. Chem. Phys., 43, 2809 (1965).
E. S. Fishburne, K. R. Bilwakesh and R . Edse, J. Chem. Phys., 5, 160 (1966).
88. H. A. Olschewski, J. Troe andH. Gg., Wagner, Zeit. Physik. Chem., 45-, 329 (1965).
89. D. Marshall and S. H. Bauer, unpublished data, Cornel1 University report to NASA, January 1966.
90. H. J. Henrici, Dissertation, Gattingen, 1966.
K. W. Michel and H. Gg. Wagner, 10th Symposium (International) on Combustion, The Combustion Inst. , Pittsburgh, (1965), p. 353.
91.
92.
A. P. Modica and D. F. Hornig, J. Chem. Phys., 5, 2739 (1965).
W. Tsang, S. H. Bauer, and M. Cowperthwaite, J. Chem. Phys., E, 1768 (1962); See also: D. Schofield, W. T s m g and S. H. Bauer, J. Chem. Phys. , GI 2132 (1965).
A. P. Modica and J. E . LaGraff, J. Chem. Phys., 2, 3375 (1966).
A. P. Modica and J. E . LaGraff, J. Chem. Phys., 45, 4729 (1966).
93.
94.
95. A. P. Modica, J. Chem. Phys. 46, 3663 (1967).
96. S. H. Bauer, K. C. Hou, and E. L. Resler, Jr., STS #E7. 97.
98.
99.
I. D. Gay, R. D. Kern, G. B. Kistiakowsky, and H. Niki, J. Chem. Phys., - 45, 2371 (1966).
W. Tsang, J. Chem. Phys., 44, 4283 (1966).
W. Tsang, J. Chem. Phys., S, 2817 (1967).
100. S. Hr 'Bauer a n d E . Ossa , J. Chem. Phys. , 45, 434 (1966).
101. W. S. Watt, P. Borrel l , D. Lewis, and S. H. Bauer, J. Chem. Phys. , 5, 444 (1966).
102.
103.
104.
105.
106.
107.
108.
109.
110.
111.
112.
113.
A. Lifshitz, C. Lifshitz, and S. H. Bauer, J. Am. Chem. SOC., E, 143 (1965).
D. Lewis, et &, Prepublication report . -
A. Bar-Nun and A. Lifshitz .[Prepublication report].
H. Carrol l , and S. H. Bauer, prepublication report.
K. Morokuma, L. Pedersen and M. Karplus, In press .
R. D. Hawthorn and A. C. Nixon, AIAA Joqrnal, 4, 513 (1966).
G. B. Skinner and G. H. Ringrose, J. Chem. Phys., 4129 (1965).
E. L.
J. B. Homer and G. B. Kistiakowsky, J. Chem. Phys., 45, 1359 (1966).
J. B. Homer and G. B. Kistiakowsky, Submitted to Journal of Chemical Physics.
G. P. Glass, gal. J. Chem. Phys., 42, 608 (1965).
I. D. Gay, G. P. Glass, R. D. Kern and G. B. Kistiakowsky, Submitted to The Journal of Chemical Physics.
~ ? d W. C. ~arbi rnr , . Zi-. , j. Ciieiii. piiys., g, 2285 ji966j.
I
81. 114. I. D. Cay, C. P. Glass , G . B. Kistiakowsky and H. Niki , J. Chem. Phys. ,
115. T . Takeyama and €I. Miyama, Bull. Chem. SOC. , Japan, 3, 2352 (1966);
116. J . N. Bradley and D . C. Dobson, J. Chem. Phys . , 46, 2865, (1967); J. Chem.
- 43, 4017 (1965).
Bull. Chem. S O C . , Japan, 2, 1670 (1965).
Phys., 46, 2872 (1967).
NOTE
The complete set of r e fe rences t h a t comprise (41) a r e :
41a. D. R . Church i l l and R . E . Yeyero t t , J. Quant. Spec t rosc . Radiat . T rans fe r ,
41b. K . L . Wray and T. J . Connolly, J . Quant.Spectrosc. Radia t . T rans fe r , 2, 111
41c. R . A . A l l en , A . Tex to r i s and J . Wilson, J. Quant . Spectrosc.. Radia t . T rans fe r ,
41d. M. Jeunehomme, J. Chem. Phys., 2, 4253 (1966).
41e. R . W. Patch , J . Quant. Spec t rosc . Radia t . T rans fe r , 2, 137 (1965).
- 5 , 69 (1965).
(1965).
- 5 , 95 (1965).
A SHOCK TUBE STUDY OF-- OXIDATION
Daniel J. Seery and Craig T. Bowman
United Aircraf t Research Laboratories East Hartford, Connecticut 06108
Although the oxidat ion o f methane has been s tudied extensively there are still many Tunsolved problems r e l a t e d t o the k ine t ics and mechanism of the react ion. object ive of the present inves t iga t ion is t o provide information on the reac t ion mechanism and chemiluminescence f o r t h e high temperature oxidation of methane. t h i s end an experimental study of methane oxidation behind r e f l e c t e d shock waves has been car r ied out . OH absorption were monitored during t h e react ion. In conjunction with the exper- i n e n t a l work, an a n a l y t i c a l study of methane oxidat ion w a s car r ied out. proposed f i f teen-s tep reac t ion mechanism, temperature, pressure and concentration p r o f i l e s were calculated f o r t h e conditions of the experiment.
The
To
I n this study pressure, OH, CH, CO, C2 and H20 emission and
Using a
EXPERIMENTAL
The experimental study was car r ied out i n a s t a i n l e s s s t e e l cy l indr ica l shock t l2ke (shown i n Fig. 1) having an i n t e r n a l diameter of 3.8 cm. The dr iver gas used i n a l l experiments w a s room-temperature helium. pressures, a double diaphragm technique was employed (Ref. 1). Shock v e l o c i t i e s vere neasured using four platinum heat t r a n s f e r gauges mounted along the w a l l of tile tube. sweep osci l loscope. and consisted of four observation por t s . spectroscopic and pressure measurements. shock waves a t a loca t ion 1 cm f r o m t h e r e f l e c t i n g surface.
To assure uniform diaphragm burst ing
The si&nals from these heat t r a n s f e r gauges were displayed on a raster- The observation s t a t i o n was located 5.70 m from the diaphragm,
These por t s were used t o make various The react ion was s tudied behind re f lec ted
This 'configuration gave . . . a xaximun test time of approximately 2 msec. . -
Pressure measurements were made using a p iezoe lec t r ic pressure transducer (Kistler Model 605) with a 0.375.cm diameter pressure-sensit ive diaphragm and a r i s e time of 3 psec. Two o p t i c a l paths were ava i lab le t o monitor t h e emission and/or absorption of c h a r a c t e r i s t i c rad ia t ion during t h e reac t ion . spectroscopic instrument w a s a 0.5 m Seya-Namioka vacuum monochromator equipped with an W/US 6 2 5 5 ~ photomultiplier. t o give a bandwidth of approximately 25 A . The monochromator w a s used f o r both txission and absorption experiments. l anp (Hanovia 528B-1) was employed. t h e other op t ica l s t a t i o n using an EMI/US 9556BQ o r a P h i l i p s 5 6 m photomultiplier with various narrow-band pass interference f i l ters. Sapphire windows were used f o r a l l o p t i c a l s t a t i o n s . The output signals from the pressure transducers and photo- m l t i p l i e r s were displayed on two dual-beam osci l loscopes which were t r iggered by one of t h e hea t t r a n s f e r gauges. The rise t i m e of t h e photomultiplier/oscilloscope system was 2-3 p s e c .
The pr inc ipa l
The entrance and e x i t s l i t widths were set
For t h e absorption experiments a Hg-Xe a r c Additional emission de ta were obtained from
83.
The methane, oxygen and argon used i n t h e experiment-s were Matheson Ultrapure Grade ( > 99.9$), and t h e nitrogen w a s Linde High Pur i ty Dry (99.976).
Gas mixtures were prepared manometrically and s to red i n s t a i n l e s s s t e e l o r g l a s s vesse ls . preparing the mixture. t i o n of t he gas mixtures was confirmed using a mass spectrograph. allowed t o stand f o r at least 48 hours before use i n an experiment.
These vesse ls were evacuated t o a pressure of less than 1 Hgbefore Composi- Mixture t o t a l pressures var ied from 300-3000 m Hg.
The'mixtures were
Before a run, t h e experimental sec t ion of t h e shock tube was evacuated t o The l eak and outgassing rate was l e s s than 2 p Hg/min. l e s s than 1~ Hg.
pressures of t h e gas i n t h e experimental sec t ion var ied between 1 5 4 5 0 mm Hg. I n i t i a l
k all t h e experiments t h e temperature behind t h e r e f l ec t ed wave w a s obtained from t h e idea l shock equations and the measured inc ident shock veloci,ty at the r e f l e c t i n g surface with a su i t ab le correction f o r %on-ideal" shock r e f l ec t ion (Refs. 2 and 3 ) . In the present inves t iga t ion a temperature cor rec t ion of -35 deg K v i t h an uncertainty of 35 deg K w a s employed. r e s u l t s of a study of r e f l ec t ed shock temperature i n argon. I n this study r e f l ec t ed shock temperatures were obtained from measurements of incident and r e f l ec t ed shock v e l o c i t i e s using an approach suggested by Skinner (Ref. 3 ) . This approach could not be used with t h e fuel/oxidizer mixtures due t o gas dynamic acce lera t ion of t h e r e f l e c t e d shock wave i n t h e v i c i n i t y o f t h e r e f l e c t i n g p l a t e . mination of a temperature cor rec t ion was not poss ib le f o r t h e fuel/oxidizer mix- t u r e s .
This cor rec t ion w a s based on t h e
Hence a d i r e c t de te r -
Cue t o boundary layer e f f ec t s , the pressure behind t h e r e f l e c t e d shock wave decreased i n time. It was assumed t h a t pressure and temperature behind t h e r e f l e c t e d wave were r e l a t e d through t h e i sen t ropic equations. not s t r i c t l y cor rec t due t o heat t r a n s f e r and chemical reac t ion e f f e c t s . f e l t , however, that t h e e r r o r introduced by this assumption i s small.
This assumption i s It is
The temperature f o r a given run was assumed t o be a l i n e a r average of the temperature d i r e c t l y behind the r e f l ec t ed shock wave (cor rec ted f o r "non-ideal" r e f l e c t i o n ) and the temperature d i r e c t l y before t h e increase i n pressure accom- panying the chemical r eac t ion . pressure . were small, a l i n e a r averaging i s acceptable.
A similar averaging technique was employed fo r t h e Since va r i a t ions i n temperature and pressure behind t h e r e f l ec t ed wave
84.
EXPERIME2TTAL RESULTS
The oxidation r e a c t i o n was studied using pressure measurements and spectro- scopic observations. absorption of the OH r a d i c a l (3067 A ) and t h e emission of CH (4315 A ) , CO (2200 A), C2 (5165 A) and H20 (9300 A ) . Typical osci l loscope t r a c e s a r e shown i n Figures 2, 3 and 4. The bottom t r a c e i n Figures 2 and 3 i s the output of t h e pressure t rans- ducer. The a r r i v a l of t h e incident and r e f l e c t e d shock waves a t t h e observation s t a t i o n and the increase in pressure due t o chemical reac t ion a re indicated in the f i g u r e s . The top trace i n Fig. 2 i s the photomultiplier output showing OH emission. From t h e pressure and OH emission t r a c e s of Fig. 2 it i s seen t h a t the react ion appears t o pass through t w o phases - a f i r s t ( induct ion) phase i n which t h e pres- su 'e and OH emission increase slowly followed by a second phase i n which the pres- sure and OH emission increase rapidly. As w i l l be discussed l a t e r , these observa- t i o n s a r e consis tent with t h e r e s u l t s of the a n a l y t i c a l study. The top t r a c e in Fig. 3 is the photomultiplier output showing CH emission. From t h i s f igure it is seen t h a t exci ted CH(2A) i s probably short-l ived, undergoing a maximum i n concentra- t i o n j u s t p r i o r t o t h e onset o f f a s t react ion. In Fig. 4 t h e top t r a c e i s the photomultiplier output showing OH emission and t h e bottom t r a c e shows OH absorption. It i s apparent t h a t the onset of emission and absorption occur simultaneously, ind ica t ing t h a t t h e concentration of exc i ted s t a t e ( zZ OH increase approximately at t h e same time.
The spectroscopic measurements involved the eyiss ion and
) and ground s t a t e ( z r l )
For the purpose of comparing the experimental and ana ly t ica l results it i s con- venient t o character ize t h e oxidation of methane by an induction time. There i s no general ly accepted d e f i n i t i o n of induction t ime. In the present study the induc- t i o n t ime was defined t o be t h e time between t h e heat ing of t h e gas by the ref lected shock wave and the rap id increase i n pressure o r c h a r a c t e r i s t i c emission or absorp- t i o n . t i c a l r e s u l t s and i s not dependent on the threshold of the instrumentation.
This d e f i n i t i o n permits a simple comparison between experimental and analy-
Induction time data f o r methane oxidation a r e presented i n Figs . 5 through 8 . In these f igures the mole percent of methane, oxygen and argon o r nitrogen in the xixtiu'e is given together with the f r a c t i o n stoichiometric, @ , where
( xCH4/x02 )
(xcq/xo2) s toichiometr ic @ =
and X i s the mole f r a c t i o n . squares fit of the experimental da ta t o an equation of the form
The s o l i d l i n e s through t h e data poin ts are a l e a s t -
T = A exp (E/RT)
i
where r = induction time, T = temperature, and A and E = constants . A and E and the standard deviat ion i n E are obtained from the least-squares reduc- t i o n of t h e data, and a r e tabulated i n Table 1.
The parameters
Table 1. Least-Squares Parameters: Methane-Oxygen-Diluent
@ Diluent P( atm) A( sec ) o E - - 0.5 N2 1.7 1.6 x 44.7 3.7
0.5 Ar 1 *7 2 .3 x 10-10 44.3 1. .4
0 .5 Ar 3.7 4.5 x 10⁻¹¹ 46.6 4.3
0.5 Ar 6.0 2.1 x 10⁻¹² 53.2 6.0
1.0 Ar 2.0 5.8 x 10⁻¹¹ 49.0 2.1
2.0 Ar 1 *7 2.1 x 10⁻¹⁰ 45.4 4.8
The induction time f o r oxidizer-r ich ( @ = 0.5) methane/oxygen/argon and methane/oxygen/nitrogen mixtures for an average pressure of 1.7 2 0 . 3 a t m is pre- sented as a function of temperature i n Fig. 5. I n t h i s f igure t h e induction time i s based on the rapid increase i n pressure. It i s noted t h a t i n t h e present study there was no observed difference between induction times based on rapid increase i n pressure or those based on rapid increase i n c h a r a c t e r i s t i c emission o r absorp- t i o n . The s o l i d l i n e i s t h e least-squares f i t of the methane/oxygen/argon data . From Fig. 5 and Table 1 it i s seen t h a t within the experimental uncertainty and f o r a given temperature t h e induction time i s the same f o r the methane/oxygen/argon and t h e methane/oxygen/nitrogen mixtures. Hence f o r the conditions of t h e present invest igat ion replacing ni t rogen by argon i n t h e oxidizer does not have a s i g n i f i - cant e f f e c t on the induction t ime.
The induction time f o r a stoichiometric methane/oxygen/argon mixture a t an
From t h i s f igure it is seen t h a t t h e r e i s no s igni f icant difference average pressure of 2.0 2 0.3 atm i s presented as a function o f temperature i n Fig. 6. between induction times based on OH emission o r OH absorption.
The dependence of t h e induction time on t h e f rac t ion s toichiometr ic ( @ = 0 .5 , 1.0, 2.0) i s presented i n Fig. 7. l i n e s shown i n t h i s f igure a re within t h e experimental uncertainty presented i n Table 1. stoichiometr ic i n the range of @ = 0.5 t o 2 .0 ( f o r induction t imes between 5Opsec and 1 msec).
The difference between t h e least-squares
Therefore there i s no s igni f icant var ia t ion of t h e induction time with f rac t ion
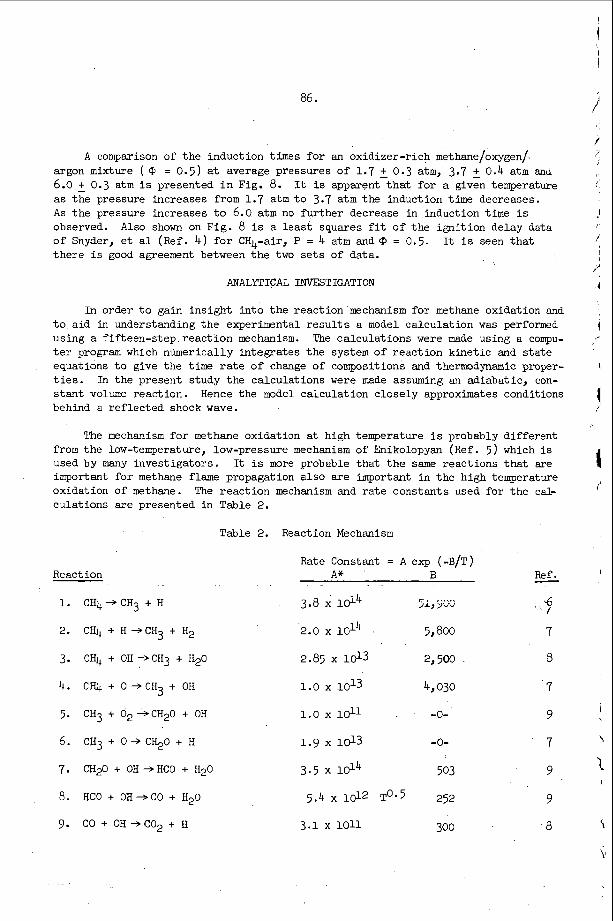
86.
A comparison of t h e induct ion times f o r an oxidizer-r ich methane/oxygen/ argon mixture ( @ = 0.5) at average pressures of 1.7 2 0.3 a t m , 3.7 2 0.4 a t m and 6.0 2 0.3 a t m is presented i n Fig. 8. It is apparent that f o r a given temperature as the pressure increases from 1.7 atrn t o 3.7 atrn the induction time decreases. A s the pressure increases t o 6.0 a t m no fur ther decrease i n induction time is observed. of Snyder, e t a1 (Ref. 4 ) f o r CHq-air, P = 4 atrn a n d @ = 0.5. t h e r e i s good agreement between t h e two s e t s of data.
A l s o shown on Fig. 8 is a l e a s t squares f i t of t h e ign i t ion delay data It i s seen t h a t
ANALYTICAL INVESTIGATION
In order t o gain ins ight i n t o t h e react ion mechanism f o r methane oxidation and t o a id i n understanding t h e experimental r e s u l t s a model ca lcu la t ion was performed using a f i f teen-s tep r e a c t i o n mechanism. The ca lcu la t ions were made using a compu- t e r Frogram which numerically in tegra tes t h e system of reac t ion k ine t ic and s t a t e equations t o give the t i m e rate of change of compositions and thermodynamic proper- t i e s . In the present study the ca lcu la t ions were made assuming an adiabat ic , con- stant volume react ion. Hence the model ca lcu la t ion c lose ly approximates conditions behind a re f lec ted shock wave.
The mechafiism f o r methane oxidation at high temperature i s probably d i f fe ren t from t h e low-temperature, low-pressure mechanism of Ehikolopyan (Ref. 5) which is used by many inves t iga tors . It is more probable t h a t the same react ions t h a t are important for methane flame propagation also are important i n t h e high temperature oxidation of methane. The reac t ion mechanism and r a t e constants used f o r t h e cal- culat ions a re presented i n Table 2.
Table 2. Reaction Mechanism
Reaction
1. CH4+ CH3 + H
2. CH4 + H + C H 3 + H2
3. CH4 + OH +CH3 + H20
4. CHl+ + O + C H 3 + OH
5. CH3 + 02 +CH20 + OH
CH3 + O+ C%O + H
CH20 + OH +HCO + H20
6 .
7.
8 . HCO + OH-CO + H20
9. CO + OH + C02 + H
Rate Constant = A exp (-B/T) A* B Ref.
_c
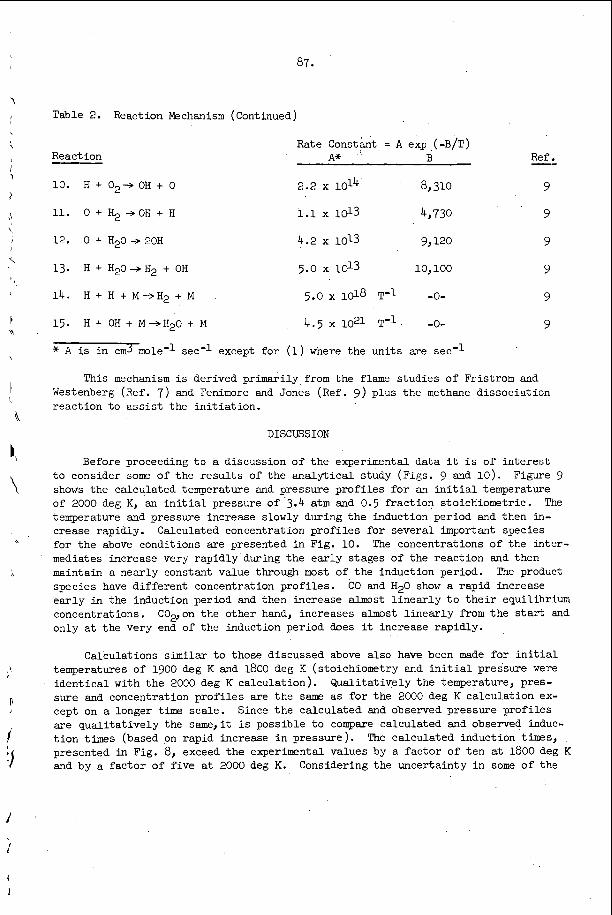
87.
Table 2. Reaction Mechanism (Continued)
Rate C o n s t F t = A exp (-B/T) React ion A* B
10. H + 02+ OH + 0 2.2 1014 8,310
11. 0 + %-+OH + H 1.1 x d 3 4,730
12. 0 + %0+20H 4.2 x 10¹³ 9,120
13. H + H20+H2 + OH 5.0 1013 10,100
14. H + H + M+H2 + M 5.0 x 10¹⁸ T'l -0-
15. H + OH + M+H20 + M 4.5 x 1 O 2 I T'l -0-
* A is i n cmj mo1e-l sec- l except for (1) where the units are sec'l
This mechanism i s derived pr imari ly from the flame s tudies of F'ristrom and Westenberg (Ref. 7 ) and Fenimore and Jones (Ref. 9) plus t h e methane dissociat ion react ion t o a s s i s t the i n i t i a t i o n .
DISCUSSION
Ref.
9
9
9
9
9
9
Before proceeding t o a discussion of t h e experimental da ta it i s o f i n t e r e s t t o consider some of the r e s u l t s of t h e a n a l y t i c a l study (Figs. 9 and 10 ) . shows the calculated temperature and pressure p r o f i l e s f o r an i n i t i a l temperature of 2000 deg K, an i n i t i a l pressure of 3.4 a t m and 0.5 f rac t ion s toichiometr ic . temperature and pressure increase slowly during the induction period and then in- crease rapidly. Calculated concentration p r o f i l e s f o r severa l important species for the above conditions are presented i n Fig. 10. The concentrations of the in te r - mediates increase very rap id ly during t h e e a r l y s tages of the reac t ion and then maintain a near ly constant value through most of t h e induction period. species have d i f f e r e n t concentration p r o f i l e s . e a r l y i n the induction period and then increase almost l i n e a r l y t o t h e i r equilibrium concentrations. C02,0n the other hand, increases almost l i n e a r l y from t h e start and only at the very end of the induction period does it increase rapidly.
Figure 9
The
The product CO and H20 show a rapid increase
Calculations similar t o those discussed above also have been made f o r i n i t i a l temperatures of 1900 deg K and 1800 deg K (stoichiometry and i n i t i a l pressure were i d e n t i c a l with t h e 2000 deg K ca lcu la t ion) . Qual i ta t ively the temperature, pres- sure and concentration p r o f i l e s are t h e same as f o r the 2000 deg K ca lcu la t ion ex- cept on a longer t i m e scale . Since t h e calculated and observed pressure p r o f i l e s are q u a l i t a t i v e l y the same,it i s possible t o compare calculated and observed induc- t i o n times (based on rapid increase i n pressure) . presented in Fig. 8, exceed t h e experimental values by a f a c t o r of t e n a t 1800 deg K and by a fac tor of f i v e a t 2000 deg K.
The calculated induction times,
Considering the uncertainty i n some o f the
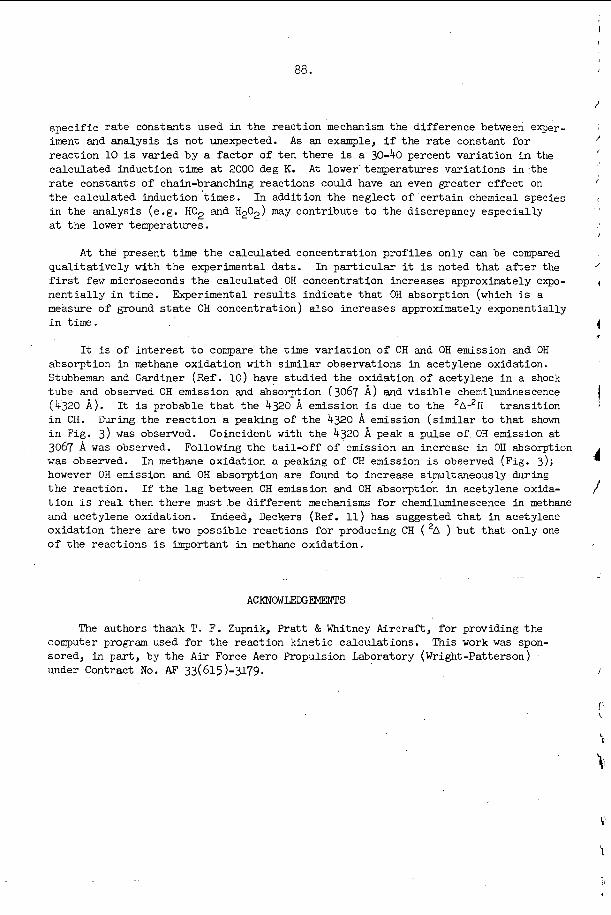
aa.
spec i f ic r a t e constants used in the react ion mechanism the difference between exper- iment and analysis i s not unexpected. A s an example, i f the r a t e constant f o r reac t ion 10 is varied by a fac tor of t e n t h e r e i s a 30-40 percent var ia t ion in the calculated induction time at 2000 deg K. A t lower temperatures var ia t ions i n the r a t e constants of chain-branching react ions could have an even greater e f fec t on t h e calculated induction 'times. i n the analysis (e.g. H02 and H202) may contr ibute t o t h e discrepancy espec ia l ly a t t h e lower temperatures.
In addi t ion t h e neglect of c e r t a i n chemical species
A t the present time t h e calculated concentration p r o f i l e s only can be compared In p a r t i c u l a r it is noted t h a t after the q u a l i t a t i v e l y with t h e experimental data.
f i r s t few microseconds t h e calculated OH concentration increases approximately expo- n e n t i a l l y i n time. measure of ground state OH concentration) a l so increases approximately exponentially i n time .
Experimental r e s u l t s ind ica te t h a t OH absorption (which is a
It i s of i n t e r e s t t o compare t h e t i m e var ia t ion of CH and OH emission and OH absorption i n ntethane oxidat ion with similar observations i n acetylene oxidation. Stubbeman and Gardiner (Ref. 10) have s tudied t h e oxidation of acetylene i n a shock tube and observed OH emission and absorption (3067 A ) and v i s i b l e chemiluminescence (4320 a). t r a n s i t i o n i n CH. During the r e a c t i o n a peaking of t h e 4320 I\ emission ( s imi la r t o t h a t shown i n Fig. 3) was observed. Coincident with the 4320 A peak a pulse of OH emission a t 3067 A was observed. Following the t a i l - o f f of emission an increase in OH absorption was observed. In methane oxidat ion a peaking of CH emission i s observed (Fig. 3); however OH emission and OH absorption are found t o increase s;multaneously during t h e react ion. I f t h e l a g between CH emission and OH absorption i n acetylene oxida- t i o n i s r e a l then t h e r e must be d i f f e r e n t mechanisms f o r chemiluminescence i n methane and acetylene oxidat ion. Indeed, Deckers (Ref. 11) has suggested t h a t i n acetylene oxidat ion there are two possible react ions f o r producing CH ('A ) but t h a t only one of the react ions is important i n methane oxidat ion.
It is probable t h a t the 4320 A emission i s due t o the 2A-2n
The authors thank T. F. Zupnik, P r a t t L?C Whitney A i r c r a f t , f o r providing t h e computer program used f o r t h e react ion k i n e t i c calculat ions. sored, i n par t , by t h e A i r Force Aero Propulsion Laboratory (Wright-Patterson) under Contract No. AF 33(615)-3179.
This work was spon-
I
1.
2.
3.
4.
5.
6.
7.
8 .
9.
10.
11.
References
Wurster, W. H., J . Chem. Phys., $, 2112 (1962).
Strehlow, R . A . and C . T . Case, J. Chem. Phys., Johnson, C . D. and D. Br i t ton , J. Chem. Phys.,
Skinner, G. B., J . Chem. Phys. , & 268 (1959).
1506 (1961) 1455 (1963).
.
Snyder, A . D., J. Robertson, D . L. Zanders and G . B . Skinner, Shock Tube Studies of Fuel-Air Igni t ion Charac te r i s t ics , Monsanto Research Corporation Report mAp~-m-65-93. August 1965.
Enikolopyan, N . S., Seventh Symposium ( In t e rna t iona l ) on Combustion, London, Butterworths (1959) , p . 157.
Palmer, H. B. and T. J. Hirt, J. Phys. Chem., a 709 (1963).
Fenimore, C . P . and G . W . Jones, J. Phys. Chem., 1532 (1961), ibid. , p. 2200.
Wilson, W. E., paper presented a t 1967 Spring Meeting, Western S ta t e s Section The Combustion I n s t i t u t e , LaJolla, C a l i f . , April 24-25, 1967.
Fristrom, R . M. and A . A . Westenberg, Flame Structure, New York, McGraw-Hill, 1965. New York, Academic Press (1963), p. 560.
Stubbeman, R. F. and W. C . Gardiner, Jr., J. Phys. Chem. & 3169 (1964).
See also Fristrom, R. M., Ninth Symposium ( In t e rna t iona l ) on Combustion,
Deckers, J. M., Energy Dis t r ibu t ion i n Flames and E lec t r i c Discharges, Final Report Grant AF-AFOSR 375-65, Lash Miller Chemical Laboratories, University of Toronto, August 1966.
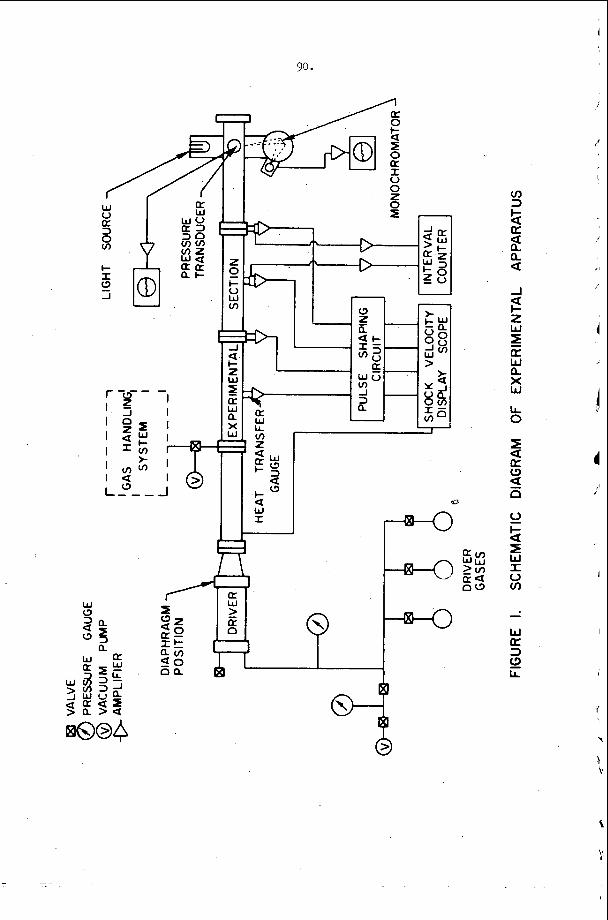
I
4 7
- I I I
J T
0 z 0
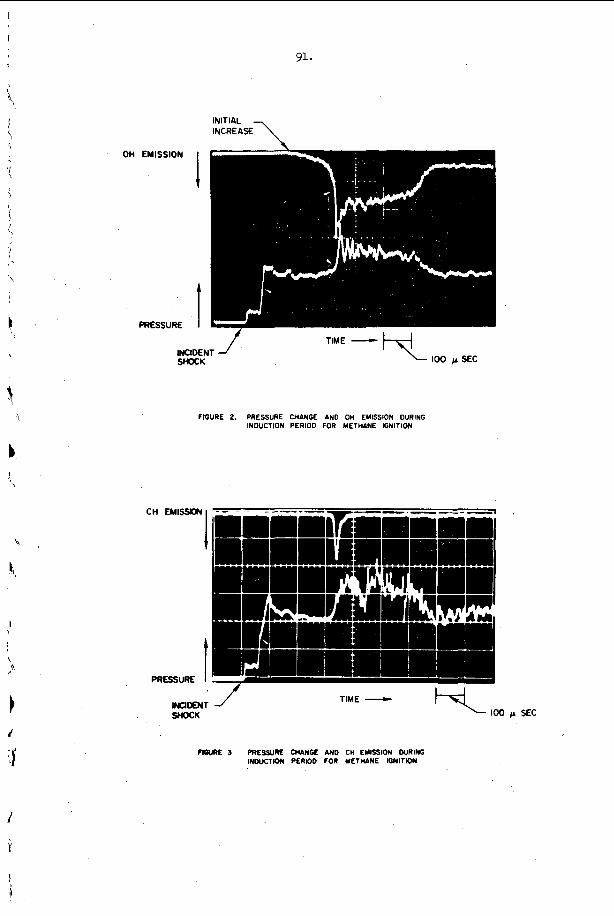
91.
INITIAL INCREASE
100 /A SEC
TIME - INCIDENT SHOCK
FIGURE 2. PRESSURE CHANGE AND OH EMISSION DURING INDUCTION PERIOD FOR METHANE IGNITION
CH EMISSION
I , ! \
f R
PRESSURE
mum 3 PRESSURE ~ ( A ) ( G E AND cn EMISSION WRING 1NWCTK)N PERIOD FOR METHANE IGNITION
Ir SEC
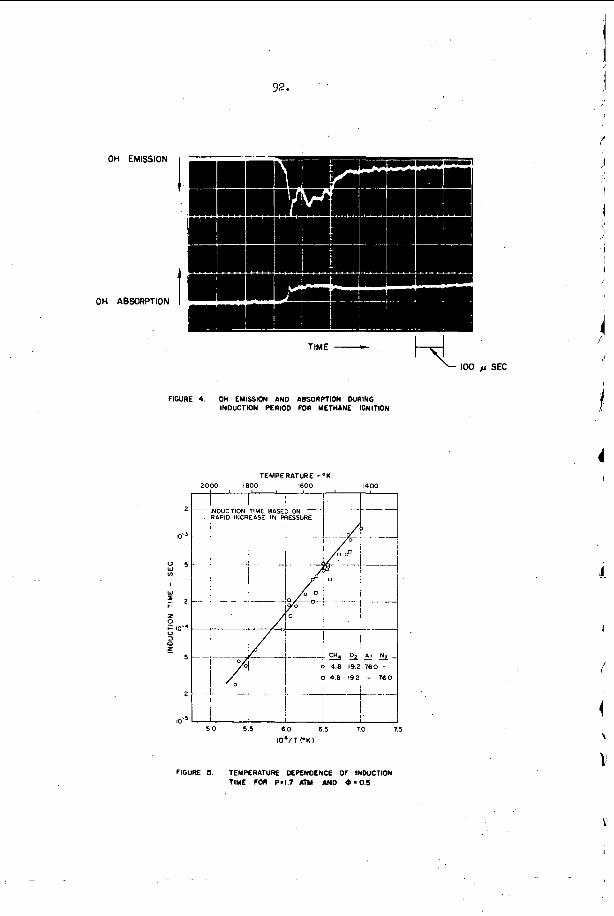
1 on EMISSION
92 * I
OH ABSORPTION I TIME -
FIGURE 4. OH EMISSION AND INDUCTION PERIOD
ABSORPTION WRING mR METHANE IGNITION
TEMPERATURE - O K
c I -4 100 p SEC
,i
IO ' IT ('Kl
FIGURE 5. TEMF'ERATURE OEPENDENCE OF INWCTION TIME FOR P.1.7 ATM AND e.0.S
1 I
4 \
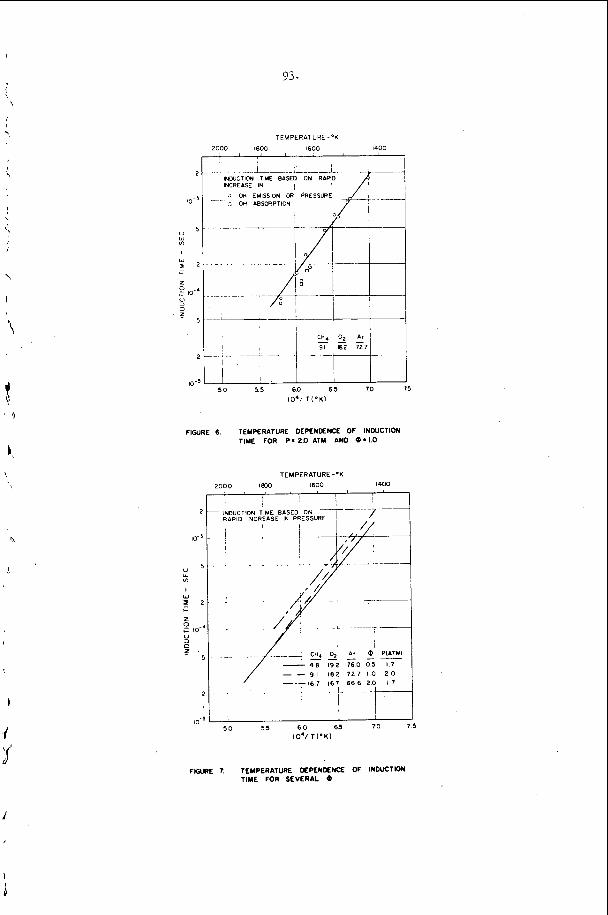
'/ y'
iEMPERATURE - O K
2000 IS00 1600 1400
-: 1 : 1.. INWCTIOU TIME BASED ON RAPID INCREASE IN I 0 OH EMISSION OR PRESSURE 7 OH ABSORPTION .- . 0 OH EMISSION OR PRESSURE 7 OH ABSORPTION .- .
__ - .-
. __
...... ...
I ..--L--- 1 T--
FIWRE 6. TEMPERATURE DEPENENCE OF INDUCTION TIME FOR P . 2.0 AIM AND 1.0
TEMPERATURE-*K 2000 1830 1600 1400
I ! I
FIGURE 1. TEMPERATURE DEPENDENCE OF INDUCTION TIME FOR SEVERAL e
I
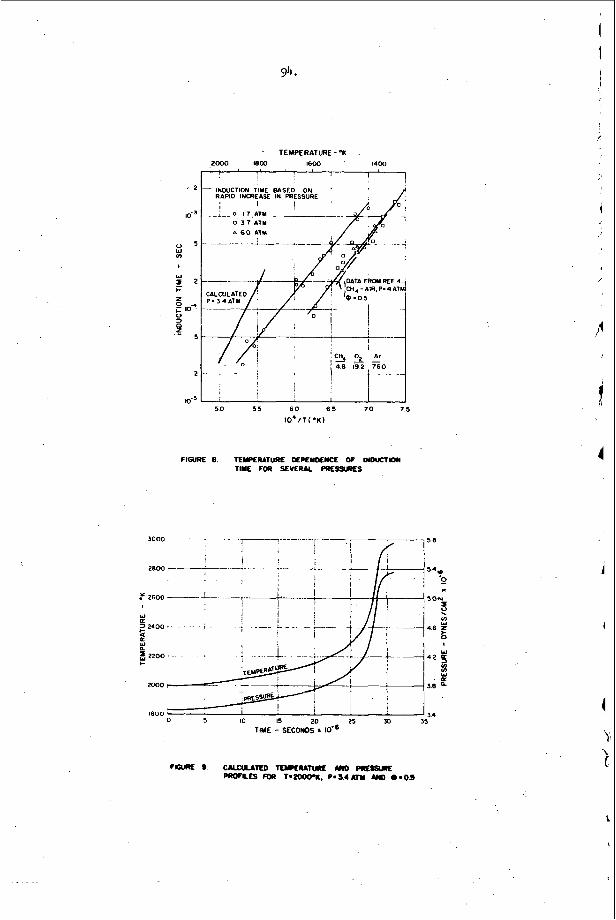
94.
. 2
IO-'
0 5 W u)
. TEMPERATURE-'I( .
2000 I800 1600 . 1400
I 1 ! !
INDUCTION TIME EASE0 ON ' RAPiO INCREASE IN PRESSURE
0 3 7 ATY 0 60 ATM
5 0 5 5 6 0 6 5 7 0 7 5
IO' / T i O K )
FIGURE e. TEWERATURE CIEPEYDCYCE OF IYWCTION TlYE FOT) SEVERAL PREstuIES
2800
5 2600
2000
1800
TIME - SECONDS I 1 6 '
1
1
I
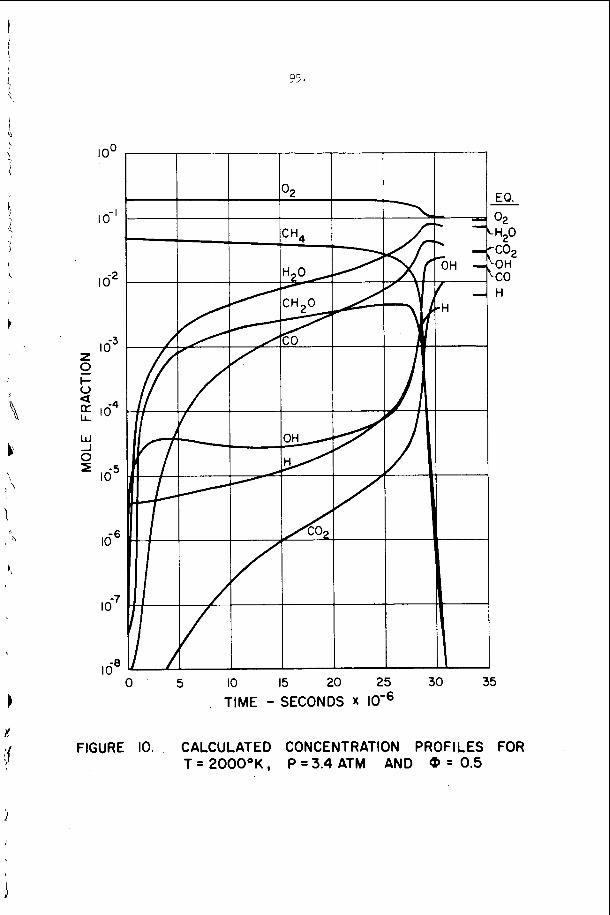
e:.
Io-'
I o2
I o3 z + 0 * s
-4 IO
W -I 0
~i~
0 5 IO 15 20 25 30 35 , TIME - SECONDS X
FIGURE IO. CALCULATED CONCENTRATION PROFILES FOR T = 2000°K, P = 3.4 ATM AND @ = 0.5
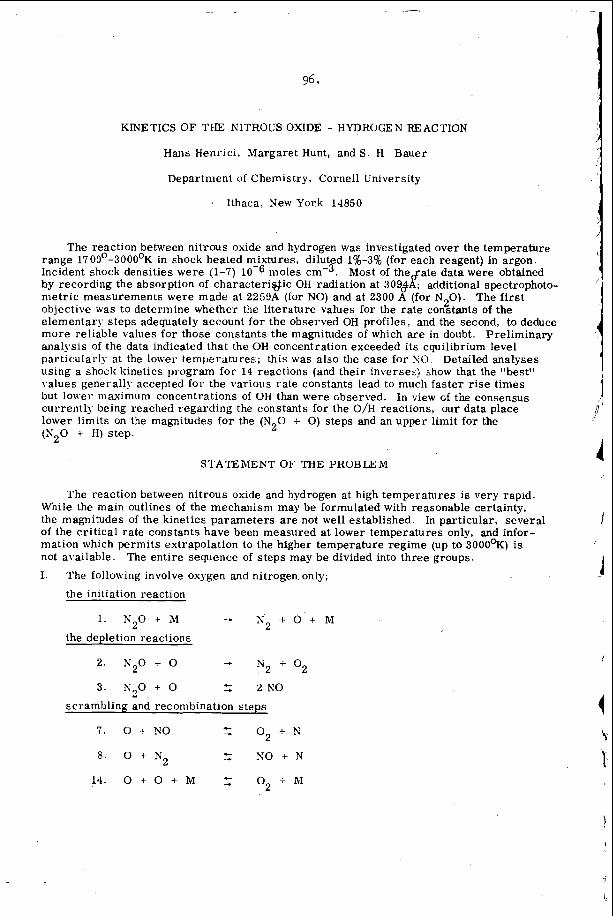
96.
KINETICS OF THE NITROUS OXIDE - HYDROGEN REACTION
Hans Henrici, Margaret Hunt, and S . H Bauer
Department o f Chemistry, Cornell University
c Ithaca, New York 14850
The reaction between nitrous oxide and hydrogen was investigated over the temperature range 1700°-3000% in shock heated mixtures, diluted lq&-3% (for each reagent) in argon. Incident shock densities were (.1-7) moles Most of the ate data were obtained by recording the absorption of charac te r ig ic OH radiation at 309$AT: additional spectrophoto- met r ic measurements were made a t 2259A (for NO) and at 2300 A (for N20) . The f i r s t objective w a s to determine whether the literature values for the r a t e constants of the elementary s teps adequately account f o r the observed OH profiles, and the second, to deduce more reliable values for those constants the magnitudes of which are in doubt. Preliminary analysis of the data indicated that the OH concentration exceeded its equilibrium level particularly at the lower temperatures; this was also the case for KO. Detailed analyses using a shock kinetics program for 14 reactions (and their inverses) show that the "best" values generally accepted for the various rate constants lead to much fas te r rise times but lower maximum concentrations of OH than were cbserved. In view Gf the consensus currentlj. being reached regarding the constants for the O/H reactions, our data place lower limits on the magnitudes for the (N 0 + 0) steps and an upper limit for the ( N 2 0 + H) s tep. 2
STATEMENT OF THE PROBLEM
The reaction between nitrous oxide and hydrogen at high temperatures i s very rapid. While the main outlines of the mechanism map be formulated with reasonable certainty, the magnitudes of the kinetics parameters are not well established. In particular, several of the cr i t ical ra te constants have been measured at lower temperatures only, and infor- mation which permits extrapolation to the higher temperature regime (up to 3000%) i s not available. The ent i re sequence of s teps may be divided into three groups. I . The following involve oxygen and nitrogen only;
the initiation reaction
1 . N 2 0 t M - N 2 + O + M the depletion reactions
2 . N 2 0 i 0 - ?i2 i o2 c 3. K9O + 0 - 2 KO
L .
scrambling and recombination s teps
c 7 . 0 i NO - 0 2 + N
8. 0 + N2 z xo -I. N
1 4 . O + O + M 0 2 c M
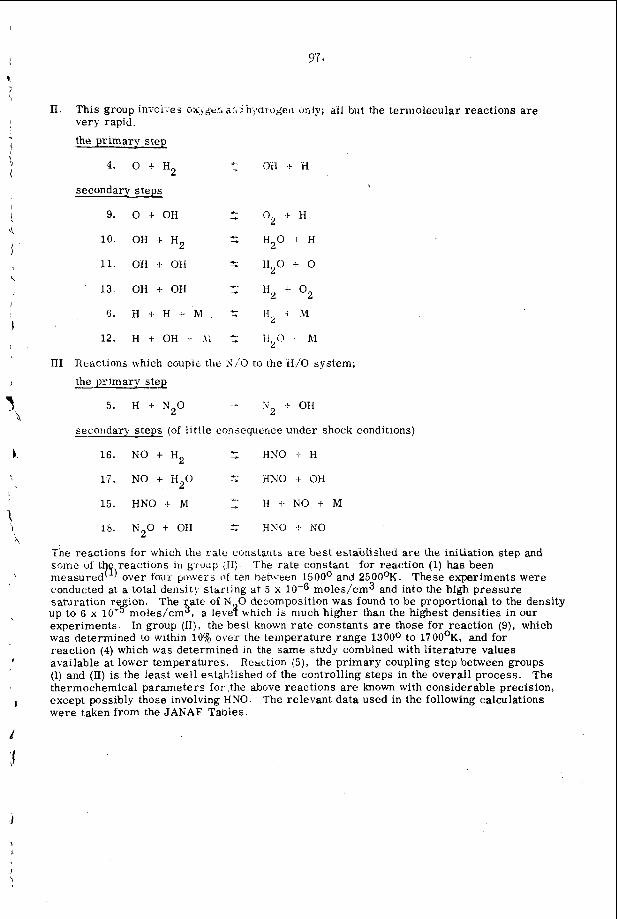
11.
III
This group ini-Ci-.cs o;(r)&~r i i r k 2 h y i i ogeli diily; all but the termoiecular reactions a r e very rapid
the primary s tep
4. 0 4 H2
secondary steps
9. 0 + OH
10. OH -t H2
11. OH -L OH
13. OH 4- OH
5. H 4. H + nr 12. H i OH -! .\L
Reactions mhich C C I U ~ I ~ the S,'O to the H i 0 system; the primary step
-.. N .$ 011 2 5. H + N 2 0
secondary step? (of little co?isequence under shock conditions)
16. NO + Ha Z BNO i- H
17. NO + H 2 0 1;: i3NO -t OH
15. HKO + M H + N O + M
r. l b . N 2 0 + OH - HNO + NO
The reactions for which the ra te cmstu i ta ore bes t est.ablished are the initiation s tep and
over foilr powers ut ten hemean 1500' and 2500OK. These experiments were reactions ill g r o u p (.[I). The ra te constant for reaction (1) has been
conducted at B total density starting ai 5 x 10-.6 moles/cm3 and into the high pressure Saturation re ion
experiments. In group (II), the best known ra te constants a r e those for reaction (9). which was determined to within 10% over the temperature range 1300° to 1700%, and for reaction (4) which was determined i n the same study combined with literature values available a t lower temperatures. (1) and (11) i s the least well established of the controlling steps in the overall process. The thermochemical parameters for ,the above reactions a r e known with considerable precision, except possibly those involving HNO. were taken from the JASAF Tables.
The ate of N 0 decomposition was found to be proportional to the density up to 6 x 10-gmoles/cm 5 , a leve? which is much higher than the highest densities in our
Reaction (5) , the pr imary coupling s tep between groups
The relevant data used in the following calculations
98
The reaction rates between nitrous oxide and hydrogen were measured in shock heated mixtures (incident regime) over the temperature range 1700°-3000%. The first objective was to determine whether the l i terature values for the rate constants of the elementary steps do adequately account for such data; the second, to deduce more reliable values for those constants the magnitudes of which a r e in doubt. The (N 0 + Hz) reaction is typicgl of complex oxidation systems and is particularly well suited for a shock tube study. Several spectroscopic probes a r e available as "handles" on the course of the reaction. Most of the data collected during this investigation were obtained by recording the absorption of character is t ic OH radiation; additional spectro-
2
photometric measurements were made in absorption 0. When both of these gases were present, the net absorption at 2259 ?or that due to NZO. Other probes which are available for following this reaction a r e the intensities of emission in the infrared due to OH, H20 and NO; these were not used in the present
a study. The mixtures of N O/H used were 1/1, 1/2, 1/3, 3/1, 3/38 in argon, with total densities f rom (1-7) I O w s koles ~ m - ~ : The levels of OH generated ranged 1 . 2 x 10⁻⁸ to 2.3 x LO-' moles cm-3.
EXPERIMENTAL PROGRAM
All our data were obtained in the incident shock r e g n i e , using a 6 " I . D . stainless s teel shock tube. It has an 8' dr iver section and a 30' tes t section. The observation windows are 26' downstream from the diaphragm. P r i o r to filling, the experimental section was pumped down to Mylar diaphragms of 0.008" thickness were cross-cut to 0.005" and pressure broken. The speed of the incident shock wave was measured with a r a s t e r system, upon which calibrated m a r k e r s were superposed at 10psec. intervals. The raster was triggered by a piezoelectric pressure t ransducer . Fur ther downstream were three platinum heat gauges with known separation. The error in the shock speed was estimated to be about 0.1%. The peizoelectric gauge also triggered the other electronic devices, including the discharge through the H20 vapor lamp. We estimated the time constant of the recording system to be about S p e c .
The N 0 used in these studies was doubly distilled in vacuum, mixed with hydrogen and argon in large glass vessels or in glass lined metal tanks and kept at least 10 hours before using, to insure complete mixing. Mass spectrometr ic checks revealed no oxygen impurity above the background level of the spectrometer.
The source of character is t ic OH radiation was described previously(15). The lamp emission was made paral le l before entering the shock tube, and the exit light was focused onto the entrance slibof a Jarrell-Ash 500 m m focal length monochromator (JACO 8200), which has a 16A/mm dispersion. In order to discriminate against the emission from the shock heated gas, the focusing lens was placed 70 cm fromfhe exit window of the shock be. For ty micron entrance and exit lits p rmitted selection of a portion ( A i = 0.64 w ) of the Q branch head (30941) of the 'Z+ - 'II. transition. The time rate of change in the conceitration of N,O and the final concentration of NO were measured neing B dcdteriitiii arc , as a source of continuum radiation.
F o r the NO absorption measurements , a wav$lengt$region around 2259A (*2.7%) was selected, this belongs to the y band (0, 0 of r+ - II ) transition. The average of 8 r u n s with 1% NO in argon, the absorption coe&&'et@ketween 1800' and 2100°K was determined to be 8 . 5 5 (* 0.3) x the NO was obtained from a commercial cylinder, and doubly distilled to remove N2
t o r r ; fne apparent leak r a t e was 2.5 x 10⁻⁶ torr /min.
2
0
cm2/mole. F o r these measurements
* h S 200 lamp, Dr. Kern, Gbttingen
99.
and the higher oxides of nitroger.. S i x e N 0 absorbs O ~ J kt shock temperatures, a reliable determination of the NO concentrafion in the reaci!ng mixture was possible only after the N 0 had deconiposed. The absorption of the generated NO remained constant for a t &ast 1 nisec, laboratory time, when the gas consisted initially of a mixture of p r e N 0 in Ar, afid also when hydrogeii was added. The ab.sor tion coefficient of N 2 0 at 23001 as ?function of temperature, has been determinad by T r ~ e ( ~ ' ) . The few preliminary measurements made in our laboratory do not disagree with that determination.
Test times ranged up to 5001 sec; however, most of the miis were taken up to 350psec only. Par t ic le times were therefore of the order of 1500psec.
TYPICAL RESULTS AhD PRE LIMW-4RY ANALYSIS
Within the limits of the time constants of these measurements the OH concentration
In some cahes there wsre c l e s indications that rises linearly with a finite slope for a period of 50 to 100psec, then slowly bends over and appears to appr0ach.a level value. this passed through a maxjmi.ini. The preliminary sssninptim t!ibl t.'ti: m&ximum level of 011 corresponded to the equilibrium concmtration proved misleadiiig. An equilibrium shock program not only gave vhlues for the final reaction temperatu?e (which ranged from 100-250' ahove shock temperatures calculated for no reaction) but also gave the equilibi.ium concentration of all the species. obyi-l:ed values, based on the approximate absorption coefficient (for OH) of 2 . 2 x 10 cin /mole is shown in Table I. temperature. The cause for the overshoot is the same as in the H/O system, in that three body processes which reduce the atom and free radical concentrations are slow ccmpared to the steps which produce OH, or bring it into local equilibrium with the other radicals. regarding the OH production [i. e. that it i s primarily controlled by reactions (l), (2), (3). and (4)l does not account for the data. Under the steady-state assumption for the oxygen atoms,
6 Comparison of the calculated with the
It is clear that the overshoot i s higher at the lower
These preliminary studies also showed that the simplifying assumption
; see Fig. 1.
A tes t oi this equatior, can be mzde by assuming literature'values for k (lA), k3(2) , and k ( 3 ) . This reduction is not acceptable in view of the fact that runs ";it% different con- centrations of N,O and H do not lie on the same line, no does the dissociation r a t e constant for N 2 d agree d t h the currently accepted valuefi). However, the various cur,-es a r e close to one another and fall below the previous data on the N 0 decomposition(lA).
Xot only does the OH concentration overshoot but the NO appears to behave likewise; this has been observed previously in studies of the N 0 decomposition(lA). The proof requires measurement of the limiting value of the N d concentration, re fer red to the initial concentration of N 0, which disappears completely by the time the test period i s over. The ratio (in the a k e n c e of H2),
4
2
where a measures the fraction of oxygen atoms used in reaction (2) , and & i s the fraction of oxygen atom which follow reaction (14), compared with reaction (3) as a reference. Table 11 is a summary of magnitudes of p for several typical runs. (a + b) = 1.1 indicates approximately comparable depletion of oxygen atoms by,reactions (2), (3) , and (4). In contrast, when hydrogen is present the observed value for i s
The sum
i
100.
considerably leas, a l so shown in Table II. The valiles id1 ;I IP. a\JSkIlCe of hydrogen check with those obtained by Gutman(lA), who reported p :: 0 . 5 6 at 2515'K, with no detectable temperature dependence. Thus, in the presence of hydiogen a corisiderable fraction of the oxygen atoms are removed by the pr imary ceaction ;+), and the secondary s tep (9). The partition oi Oxygen atoms among the various react ions, in the presence of hydrogm, canilot be directly estimated f rom the measured @, but this' does provide an additional boundary condition on the cor rec t assignment of reaction ra te constants. One may now l is t the available experimental parameters: (a) . the initial slope ,of the OH curve (absence of an inductioii period) @) the t ime required for the OH concentration to reach 63% of i t s final value (c) the magnitude of the OH at the maximum (d) the .i-alue of @ (e) the t ime required for the disappearance of N 0 to l/:! of ita irdtial value. The matching of the OH concentration-time prof i i i , and the parameters listed above were 'used to test combinations of rate constants, a3 described in the next section.
EXTENDED CALCULATIONS AND CURRENT STA'XS O F THE PROBLEM
Beauuse of the coupiing of a la rge number of reactions did their approximately compai-Ale contributions, no simplifying assumptions permit an analytic solution of the c u ~ p i e d set of differential equatioila. introduced to obtain calculated values for the concentration profiles of a l l species. The program which was obtained from Cornell Aeronauticsi Laboratory(18), permits the insertion of the enthalpy and free energy fc r each specie as a function of temperature. l'he therxuGdynamic functions are expressed as polynomials in the temperature. F o r the rate constants specific values must be inserted for the pre-exponential factor, the pre -exponential temperature dependence and the activation energy. This incident shock program computes the equilibrium constant for each reaction, obtains the rate constant f u r i ts reverse and gives the net ra te of formation (Q ) for each species (j) from every i ' reacticn (i). It also gives the concentration of each sdecies as a function of time and crJmputes the temperature profile behind the shock. The printout of the Q . . ' s as a hnct ion of time i s probably the' mos t useful par t of the outpJt. It provides'la measure of OW dependent the net concentration profile for any species is on the contribution from each reaction. It helps to gauge how effectively coupled the system is, and whether some reactions which were introduced can be discarded because of their minor contributions. F o r example, this was found to be the case for OH derived from reactions (15, 16, 17 and 18).
In the tes ts wnich will be described below no change wda made in the value for the dissociation rate constant f o r s tep (1). The study from which w e took the rate constant(l) co-iered a wide range of total p ressures and of temperatures for low concentrations of S.0 in Ar. The reported values show very little sca t te r from an Arrhenius line. In acfditi:vr the same resu l t s were obtained behind incident a rd refipcted shock waves, and tke) x ~ e r e crosschecked by experiments with an adiabatic pistl;n\l9). Nevertheless, ic our ycstem, there s t i l l may be some uncertainty docut thz rate constant for this I c ! a L A ~ ~ ~ ~ uw io iiie uiikt1oiv-n coilision efficiencies for acti7;ation by the species produced i i i tne S 0,'H r a t e constants were obtained from a survey of the l i t e ra tme a d from discussions with =.e:.i.ral w o r k e r s in the field; they are listed in Table III.
m l y thcse of the HZ/02 ,system and that of reaction (5) were varied in an attempt to obtain a fit to the experimental OH profile at 2000'K. These tes t s showed that the computed ra te of Oh-formation, which was much faster than the observed, could be,fitted only by
Therefore a general kinetics program was
_r....+.?.. A . . -
reaction. These may be much la rger thaii that for argon. The other 2 2
11) a f i r s t group of tes t s the rate constants for r e a c t i w s (2) and (3) were accepted, and
101.
reducirLg the rate constalits o i reactions (5) and (10) by a factor C J ~ 30 to 40. In order to achieve h Letter fit for experiments at different concentrations, i t was also necessary to reduce the rate constants for (9) by a factor of 10, and for (4) by 1/2. This is cleaxly an ilnacceptti;ble combination. Figure 2a shows thz contribations of the five cr i t ical reactions to the OH concentration profile (Q..) for a typica: run with 1% of :Y20 a13 l?~ H in Argon; Fig. 2b shows the net OH h o f i l e s , calculated and observed &; I as _. the2caiculated adiabatic temperature.
In -b.ie= of the consensus now being reached as to the magnitudes of the rate constants fol grGJp lI> the second exploration involved the ra te constants for the depletion reaction (2) and (3), and the pr imary coupling reaction (5). At this stage i t was demmstrated that reactions (15) to (18) have no discernable effect on the OH profile. 'Table I'il i s a summary of the various combinations tested, and 'Figures 3a and 3b she* the.Q.. and the net OH profile for one of the more successful combinations fmp.;l to da&.
A s ifi the f i rs t series of tes ts for specified k2 and k., the OH profile depends most sensitively on the ra tes of reactions (5) and (10). A difdculty in all these attempts to f:t the e-xperimental data was that the computed OX profiles yielded nlaximuin values fcr the OH coccentrations which were a t most half as large as those observed. Whether t?i;5 i s dua t-1 an uncertaiciy in the absorption coefficient ~k OH u r to an incorrect ccmbic.;tion of the ra te constants will be tested in calibration measurements designed to cietscmine the absolute OH concentrations under these conditions.
different reactions on each other and on the OH profile can be described as follows. The Text ion i s initiated by (1) which is rapidly followed by either (2) and (3) or by (G;, . If KO p h y s no further role, the only way in which reactions (2) and (3) contribute tonard the building up of OH i s through (9), the eaction of e 0 generated in
within f 10%. If the extrapolation to 2000°K i s correct, reactioa (9) makes only a inirx)r contribution to the OH generation, at least when there is no large excess of ?i20 over H
SO under conditions s imilar to those of the shock tube investigation. of h 0 is a slow process a s is also i t s rate of reaction with molecular hydrogen, rekction (16). The r a t e ofproduction of HNO would ve to be at least a 100 times
measurably. Further. the decay of pure N 0 in argon is at least 100 t imes faster than the loss of N 2 0 through(22);
The absorptinn by NO a t i t s band maximum (42002) was not detectable in the GGttingen studies on the N 0 de8omposition. 2
It iollou~s that, apar t f rom the contribution of reaction (9),oxygen atoms which reac t with N 2 0 2 reactions (2) and (3) are lost for the production of OH. The net ra te of OH production i s therefore sensitive to the ratio: k /(k2.+ k ) . The above preliminary experiments of the magnitude for p indicate thae an increase in the r a t e s of k and k3 is required to account for the observed rat io of [NOIm/[N 01'. Once the n t i 8 k /(k + k ) i s fixed, the concentration profile of OH depends str%ngly on the cxpledreac t io$s 45) and (10). At the beginning, when little water i s present, reaction (10) is faster than reaction (5), resulting in a net consumption of OH. As reaction (10) approaches local equilibrium, reaction (5) takes over until :?e N 0 is consumed. By
If the present set of rate constants i s a reasonable approximation, the effect of the
reactioii (2) with hydrogen atoms. Between l l 0 8 m d 170OOK fb k 2is by now known to
2' Apart from the current experiments there is other evidence for the stability of
The decomposition
' faster than that determined by Bulewicz and Sugden('8, in order to contribute
2
N 2 0 + .NO - NO2 + N2 (19)
3
2
2
102.
then, the buildup of OH is completed, and OH decays slowly 2 three body processes.
a lso contribute to the OH profile but by an amount which is smal le r than t h e contributions from reactions (4), (5), and (10). However, the significance of (9), (11) can be established only after the rate constants fo r (2), (3), and (5) have been measured. In order to achieve this, the experiments to determine f i as a function of the Ha concentration, and the profile for N 2 0 disappearance will be continued.
ACKNOWLEDGEMENTS
J This relatively simple picture is complicated by the fact that reactions (9) and (11)
This work is being supported by the AFOSR, Contract AF49(638)-1448. We are particularly grateful to the Aerodynamics Research Group at the Cornel1 Aeronautical Laboratory for making available to us both the equilibrium and non-equilibrium shock programs used in this investigation. We wish to thank Dr. G. L. Schott for
oq-gen reaction, and Professor J. E. Dove for sending us mass spectrometer data on the K20-H2 reaction.
informative discussions of the q%estqt values for the ra te constants for the hydrogen- 1
1
6
c
1.
1A.
2.
3. '4.
a.
6. 7.
5 .
9.
10.
11.
12.
is. 1 4 .
1.5.
I 6 *
1 'i .
18.
19.
io. 21.
22.
103.
RE FE RE NCE S
€1. A. Olschewski, J. Ti.oe, ai13 €1. Gg. Wagner, Ber . Bunsenges. physik. Chem. 70, 450 (1966). D. Gutman, R. L. Belford. A. J . Hay, a n d R . Pancirow, J. Phys.Chern., Lc, 1793 (1966).
C . p. Fenimore, and G . W. Jones, 8th (International) Symposium on Combustion, . W i h n i s and Wilkins, Baltimore 1962, p. 127. D. Gutman, and G. L. Schott, in print. C . p. Fenimore, "Chemistry in Premixed Flames' ' , International Encyclopedia oi Physical Chemistry and Chemical Physics, Topic 19, Vol. 5, MacMillan, New York, 1964.
A. L. Myerson, W. S. Watt, and P. J. Joseph, in print. K. L. Wray, and J . D. Teare, 3. Chem. P h y s . , 36: 25x2 (1962).
kf . G . Glick, J. J . Klein, and W. Squire, J. Chein. Phys., z-, 850 (1957).
0 . L. Ripleg and W. C. Gardiner, J r . , J . Chem. Phya. , +, 2285 (iY66). W. E . Kaskan and W. G. Browme, "Kinetics of the H /CO/CO, System", Ger~eral Electric Reentry Systems Dept. , Document &5D848 ($964).
H. A. Olschewski, J . Troe, and H. Cig. Wagner, 2 . physik. Chem., NF, 41, 393 (1965). 13. 2. Schott, private communication.
K. L. Wray, loth (International) Symposium on Combustion, The Combustion Institute, Pittsburgh, P a . , 1965, p, 523. E. M. Bulewicz and T. M. Sugden, Proc. Roy. Soc. (London), A277, 143 (19t;q.
K. A. Wilde, Report No. 8-121, Rohm and Haas Company, Redstone Research Laboratories, Huntsville, Alabama 35807.
S. 13. Hauer, G . I,. Schott and R. E . Duff, J . Chem. Phys . , 2, 1089 (1958).
J . Troe, Dissertation, Gottingen, 1965.
C. A. L. Equilibrium Normal Shock Program, Cornell Aeronautical Laboratory, Inc:. . Buffalo, New York 14221, September 1966. L. J . Garr , P. V. M a r r o w , W. W. Joss, and M. Williams, Inviscid Non- ecpilibrium Flow Behind Bow and Normal Shock Waves, Cornell Aeronautical Laboratory, Inc., Buffalo, New York 14221, CAL - Report No. QM - 1626 - A - 12 (I), May 1963
a i d revised
-
QM - 1626 - A - 12 (11), May 1963 QM - 1626 - A - 12 (HI), October 1966.
A Martinengo, J . Troe, and H . Gg. Wagner, Z . physik. Chem., NF, 51, 101 : 1966).
E . Freedman and J . W. Daibler, J. Chem. Phys. , 34, 1271 (1961). K. L. Wray and J. D. Teare, J . Chem. Phys. , 36, 2582 (1962).
F. Kaufman, and J . R. Kelso, J. Chem. Phys . , 23, 602 (1955).
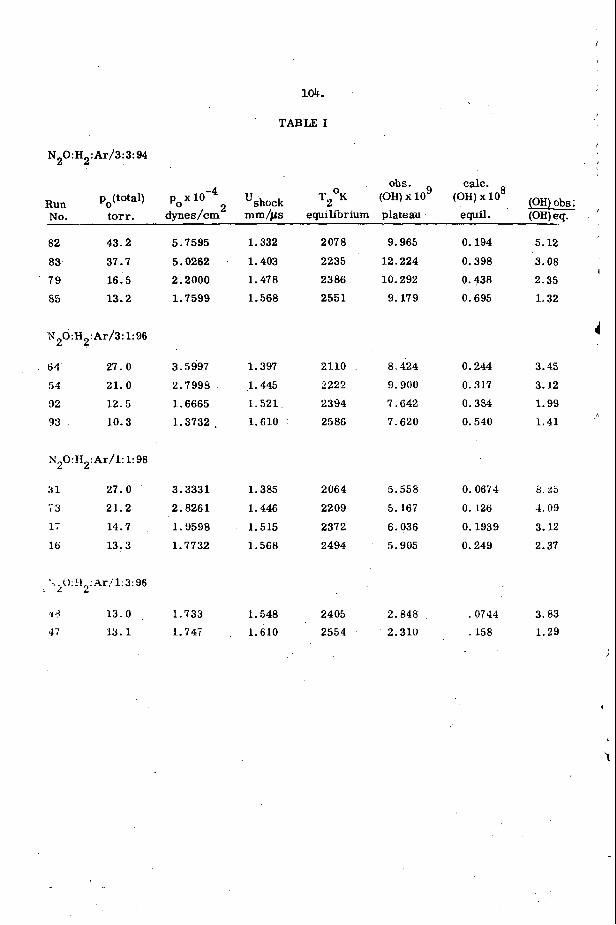
104.
TABLE I
N 2 0:H2:Ar/3:3:94
8 obs. calc. T P K (OH)x109 (OH)obs. , -4
Run po(total) pox 10 'shock No. torr. dynes/cm2 mm/ps equilibrium plateau equil. (OH) eu.
82 43.2
83. 37.1 79 16;5 85 13.2
N20:H2:Ar/3:1:96
64- 27.0
54 21.0 92 12.5 93 10.3
?; 0 . H :Ar/l:1:98
3 1 27.0
73 21.2 17 14.7
16 13.3
2 . 2
'3 d 13.0 47 13.1
5.7595
5.0262
2.2000 1.7599
3.5997
2.7998 1.6665 1.3732 ~
3.3331
2.8261
1.9598 1.7732
1.733 1.74i
1.332
1.403 1.478 1.568
1.397 1.445 1.521 1.610 .
1.385
1.446
1.515 1.568
1.548 1.610
2078
2235 2386 2551
2110 2222
2394 2586
2064 2209
2372 2494
2405 2554
9.965
12.224 10.292 9.179
8.&4
9.900
7.642 7.620
5.558 5.167
6.036 5.905
2.848 2.310
0.194
0.398 0.438 0.695
0.244 0.317
0.354 0.540
0.0675
0.126
0.1939
0.249
.0744
. 158
5.12
3.08 , 2.35 1.32
1
3.45 3.12 1.99 1.41
8.25
-1.09
3.12 2.37
3.83 1.29
1
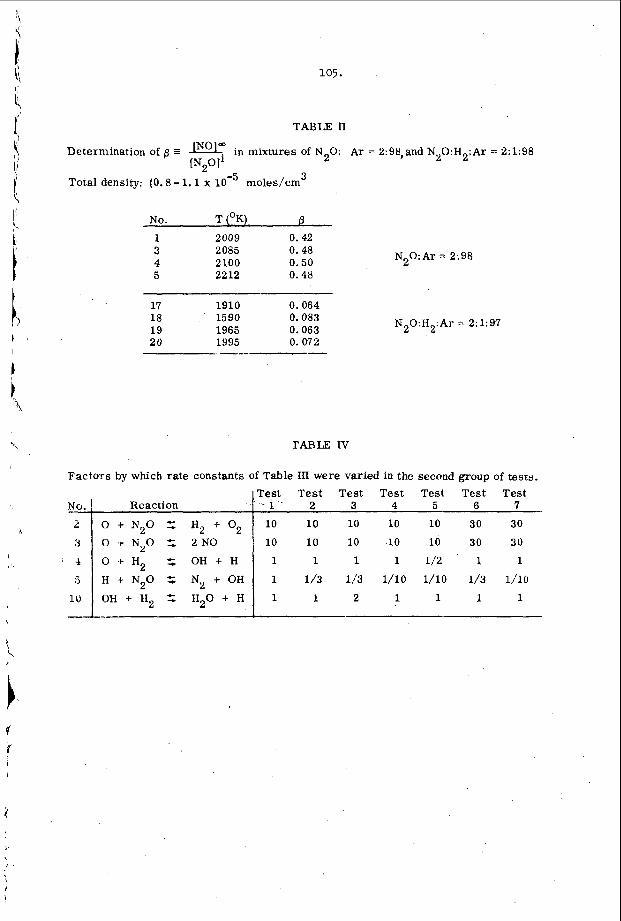
1 ' I
'V,
105.
T A B U I1
in mixtures of N 0: Ar = 2:98,and N20:H2:Ar = 2:1:98 2 Determination of p t
Total density: (0.8 - 1 . 1 x [NZO1i
3 moles/cm
No. T (OK) a 1 2009 0. 42 3 4 5 2212 0.48
2085 0.48 2100 0 .50 N 0:Ar = 2:98 2
17 1910 0 .064 18 1590 0 .083 19 1965 0.063 20 1995 0. 072
N20:H2:Ar = 2:1:97
'TABLE IV
III were varied in the second group of teste.
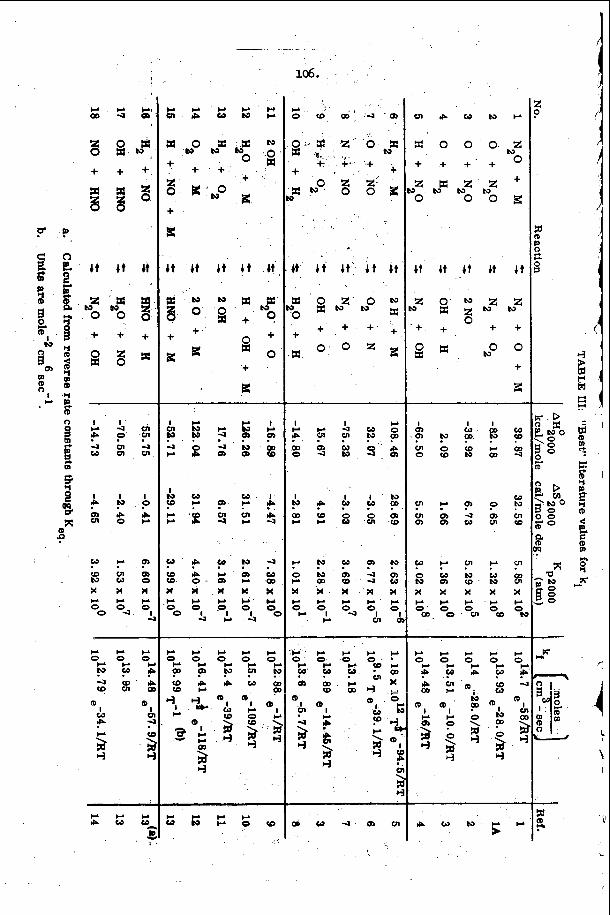
_ _ _ .
3 B tux.
+ + +.
P - 0
2 'wz a 0 0 8
tu
+ + +
8 8 x
4 u l - a w m c n
W'? w m a J l o w 0 x x x * * I - O 0 O4 OI
+ 3:
b t b t bt bt bt
'+ z
106.
* o w m - a m
. .
M bt 4t b t 8t
3: 0 Z t O PJ ' 0 x w X
z o o P E + + + ' + +
I l l t u N P W W O O * c % 8 % m w
9 c
c n r p w
m o o + + +
bt i t 4t
z 0' tu ' x z V
+ + .
0- h)z + O
P + o z hJ
bt i t
tuz hJz
+ + 0 0
tu + z
F I - P F W 0 0 0 0 0
* * * * I - P " " W P
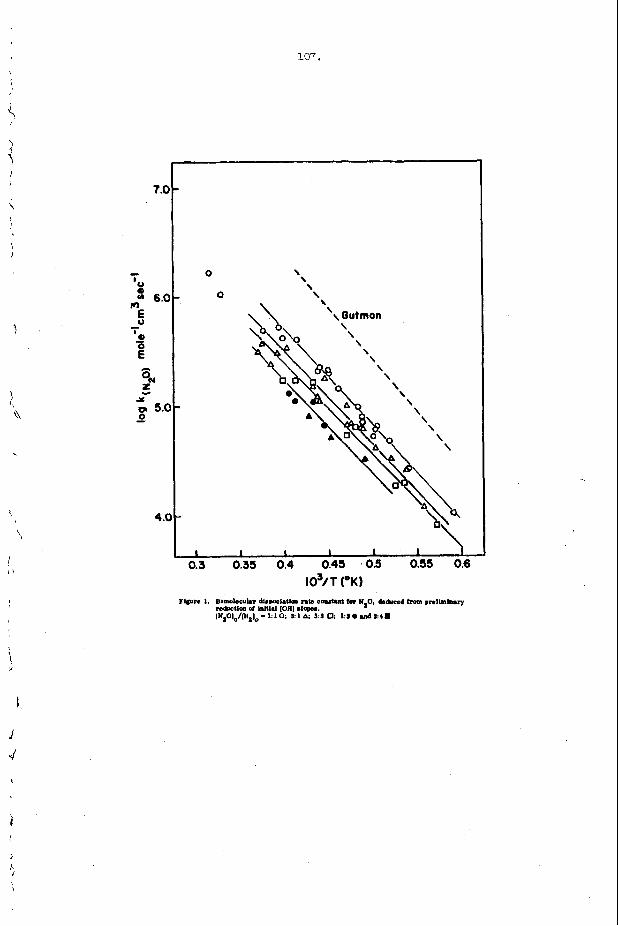
107.
/ /
1
7s
Y 9 9, 5.( 0 -
4.q
0
0
\ \ \
i
I
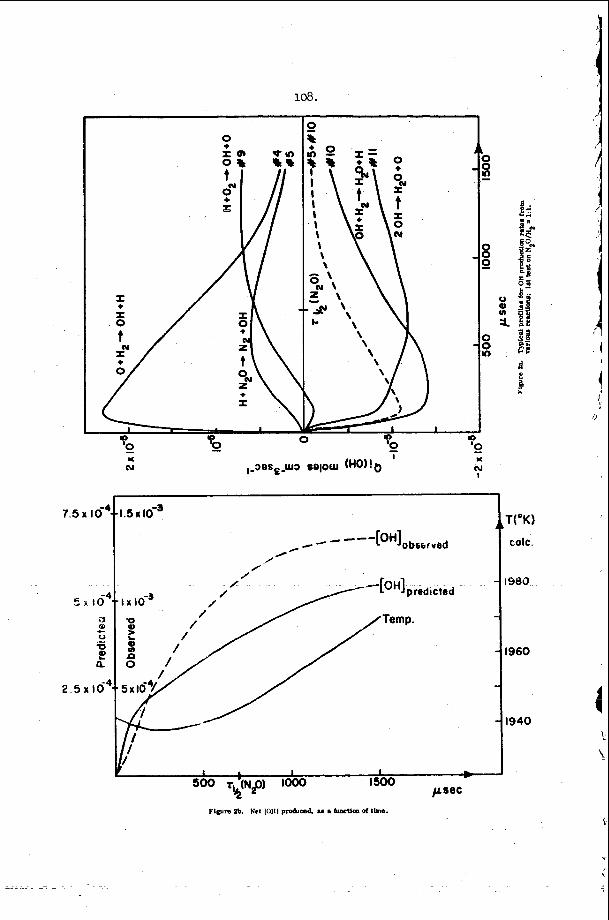
108.
7.5 16.
. .
5 x to4
2 .5 x lo4
B L
I m '2
I
U*K)
calc.
980..
960
940
1.5*10-=
observed - e ---[OH] AM-
/-
\
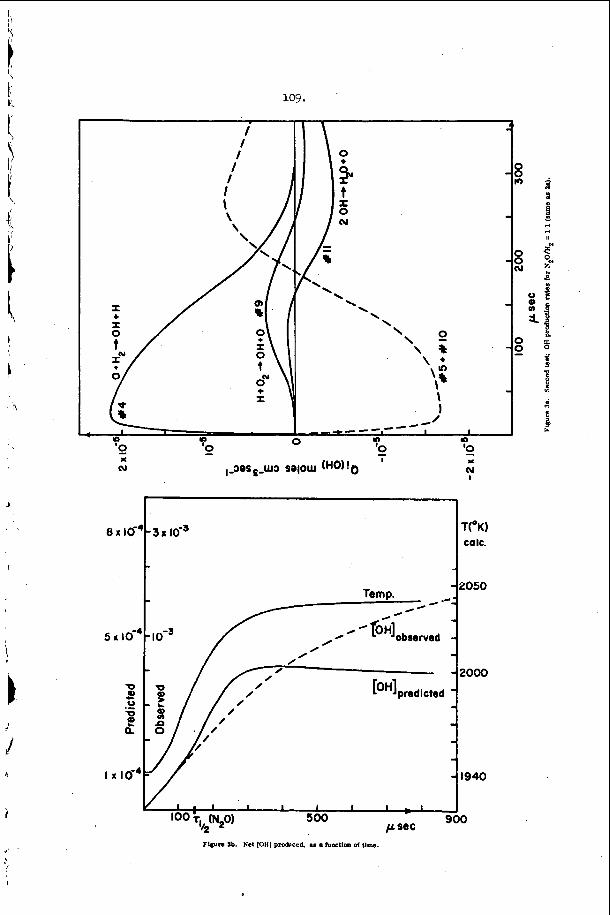
log.
I T(°K) talc.
F l l u n lb. Net lOHl pmdrced, w hm%lon ol t l w .
110.
SHOCK TUBE-MASS FILTER EXPERIKEWS ON LINUR TRIATOMIC MOLECULES
R. Llnn Belford
Department of Chemistry and Chemical Engineering Noyes Chemical Laboratory, University of I l l i n o i s , Urbana, I l l i n o i s
Introduction -- U s e of fast mass spectrometry t o follow high-temper- a tu re gas react ions i n a shock tube w a s first introduced by Bradley and KistlakowsQr(1) and Diesen and Felmlee(2) and has been exploited by several groups, a l l of whom have used a time-of-fl ight mass spec- trometer. We have developed a combination of shock tube and Paul quadrupole mass f i l t e r and are us1 it t o study react ions of l i nea r t r ia tomic molecules akin t o c o z ( 3 - 8
i a t ed w i t h them a number of common problems. These include the un- c e r t a i n t i e s I n temperature caused by our partial ignorance of flow conditions through the sampling o r i f i c e i n t o the region of the elec- t ron beam and of the r a t e of gas c o o l i q by thermal t ransport t o the end p l a t e near the sampling leak.
advantages accompanying each pa r t i cu la r mass analyzer. The time-of- f l ight device operates on a cycle i n which ion iza t ion occurs f o r only a small f r a c t i o n of t o t a l react ion time ( typ ica l ly about 1/400). T h i s fea ture limits s e n s i t i v i t y and i n t e r f e r e s w i t h noise recogni- t ion . However, one gets a f u l l mass spectrum every cycle and can e a s i l y survey the species produced in a complex reaction. While a Paul mass f i l t e r could be b u i l t t o operate e s sen t i a l ly i n the same fashion, it would o f f e r no obvious advantage. It is bes t su i ted t o the continuous ion iza t ion and study of the de ta i led time behavior of a single mass. Accordingly, mass f i l t e r detect ion is a valuable technique f o r the study of r e l a t i v e l y uncomplicated systems, i n which only a few species must be followed. It is a l s o po ten t i a l ly usefu l for inves t iga t ing the establishment of flow from the sampling arLfice and the approach t o s teady s t a t e conditions i n the ion source.
r e l a t ed pyrolyses -- NNO and OCS -- and then consider together t he ex i s t ing shock tube data on a l l molecules of the same family. Of t he severa l s t ab le linear t r ia tomic molecules having the same outer e l ec t ron s t ruc tu re as that of CO2, only four -- C02J N20, cs2J and OCS -- a r e common and have been s tudied under high-temperature shock conditions. Of these, only two -- CO2 and N20 -- have been s tudied extensively, and desp i te much progress i n the pas t 4 years, there I s sti l l disagreement about some d e t a i l s of tQjse decompositions.
Each reactant 3%:- be =epiSSSiit,eci E ( z ) , wnere C is a calcogen atom and AB is i soe lec t ronic w i t h carbon monoxide. t low pressure, high temperature, and high d i l u t i o n i n an i n e r t gas ?MI, the f i rs t k ine t i c s t ep is c o l l i s i o n a l exc i t a t ion of the in t e rna l modes of ABC followed b rap id d i s soc ia t ion of every s u f f i c i e n t l y energized reac- t a n t as fo9iows:
Under some conditions of temperature and d i l u t i o n fu r the r s teps can occur rapidly. The most important are (2) and (3):
All the mass spectrometric shock sampling techniques have assoc-
In addition, t he re a re spec ia l d i f f i c u l t i e s , but a l s o spec ia l
Here I shall ou t l ine t h e pr inc ipa l r e s u l t s of our s tud ies of two
M + A B C ( 3 -. AB(% + C(%) + M. (1 1
111.
C + A X - CA + BC, ABC + C - AB + Cz.
With the mass spec t ra l techniques it i s easy t o follow a l l of the possible species -- eg., ABC, C, M, CA, BC AB, C 2 -- and so deter- mine d i r ec t ly the ro le of s teps such as (27 and ( 3 ) .
Results -- In the ni t rous oxide study(3-5) 4s and 2$ mixtures of N 2 0 i n A r were shocked t o temperatures between 1500 and 3500'K. A l l species found were accounted f o r by Reactions (1)-(3). s igna l could be ascribed t o fragmentation. Formation of Nz, NO, and 02 accompanied destruct ion of NzO i n the proportion of about 3:2:1:h. This suggests that Reaction (1) is immediately followed by (2) o r ( 3 ) , with equal probabi l i ty . t i ons which we have looked in to do not explain the observed d i s - t r i bu t ion of species. over most of the temperature range ind ica tes that of t h e various reported ex ressions f o r k2, the most reasonable i s that of Fenimore and Jones(87 with an Arrhenius frequency f ac to r of 1014 cc/mole sec and an ac t iva t ion energy of about 28 kcal. Essent ia l ly the same expression would hold f o r k3. The general magnitude of these r a t e s has been ver i f ied i n a number of o ther shock experiments(9-11). They show an e f f i c i e n t atomic abs t rac t ion process w i t h a high ac- t i va t ion ba r r i e r which Implies s t rong repulsion between t r i p l e t - state oxygen atom and N20.
Step (1) is o f fundamental i n t e re s t . In order t o invest igate it, one must know how Reactions (2) and ( 3 ) a f fec t the r a t e . I n t h i s case t h e NzO starting concentrations were su f f i c i en t t o insure tha t the i n i t i a l r a t e of NzO destruct ion w a s 2kl(M)(NzO) a t l e a s t up t o 2500'K. A t much higher d i lu t ions , however, Steps (2) and ( 3 ) would be su f f i c i en t ly slow t o be ne l ig ib le a t small reac t ion times, and the i n i t i a l r a t e would be kl(M)?NzO). If the experimental %ti- vat ion energy f o r Step (1) remains much higher than f o r Steps (2) and ( 3 ) , a t very high temperatures the near steady s t a t e concentra- t i o n of 0 atom w i l l not e r ta in , and the r a t e w i l l drop from 2kl(M)(N20) t o kl(M)(NzO$. appl ies i n our experiments; thereforeg w e give the rate expression establ ished f o r the o i n t s below 2500 K: vrith A = 1.2~10~ c c z o l e sec JaT?, E = 60 kcal/mole, n * 5.1.
of OCS i n A r were shocked t o temperatures between 2000 and 3200'K. Typical ion current curves a r e shown i n Fig. 1, an r e s u l t s f o r
O+, SO+, SZ+ were seen. 0 is e n t i r e l y accounted f o r by fragmenta- t ion, but the others a re not, except t h a t at low temperatures CS+ comes exclusively from fragmentation of oCS. X l a t i v e concentra- t i ons of SZ and SO over a temperature ran e e s t ab l i sh t h a t the a c t i - vat ion energy f o r (2) exceeds t h a t f o r (35 by ca. 19 kcal/mole. I n the 0.5$ mixtures, the r i s e of S' s igna l indicates t h a t a steady s t a t e i n S i s not immediate and e s t ab l i shes the i n i t i a l r a t e of OCS disappearance as k l ( M ) (OCS) . From th i s , A - 1 . l ~ 1 0 ~ ~ cc/mole sec and n = 1.87, i f E i s taken as $0" = 71.5 kcal/mole. quant i ta t ive behavior of the S2 , S+, and OCS+ ion currents , we estimate k2 w 6 ~ 1 0 ' ~ $c/mole,,sec a t 2600'K. If the s t e r i c f ac to r f o r t h i s react ion is normal (0.1 or greater) , the ac t iva t ion energy i s i n the range 20-33 kcal/mole, and there is a barrier t o react ion of t r i p l e t su l fur atom w i t h OCS tha t is comparable t o the correspond- ing 0 + NzO barr ie r .
A l l 0'
The chains and o ther reac-
That Reactions (2) and (3) keep up with (1)
It i s not c e r t a i n whether t h i s s i t ua t ion
kl = fi (E/RT)nexp(-E/lIT),
I n the carbonyl su l f ide study(6,7) 4$, 2$, and 0.5% mixtures
Step (1) are p lo t ted i n Fif. 2. Here the ions OCS P , CO+, CS+, S+,
From the
l l2 .
Given the magnitude of k2 so deduced, one can ca lcu la te that a t
Although the 2$ and 4% measure-
t he higher (2s and 4%) percentages of OCS, a near steady-state con- cen t r a t ion of S atom would be establ ished almost immediately, and the measured r a t e would be 2Br(OCS)(M). ments were less reliable because of t roubles w i t h so l id sulfur , which deposited i n the sampling or i f ice , the data Indicated a r a t e about twice that yielded by the 0.5% mixtures, except a t the up e r end of the temperature range, where the values of kr from the 2$mixtures scattered about those from the 0.5$ mixtures.
-- The most i n t e r e s t i n g aspect of the high-temperature study ecomposition of t r ia tomic molecules i s the opportunity which it
ca.n af ford t o inves t iga t e some consequences of the details of col- l i s i o n a l ac t iva t ion . The s t rong-col l is ion assumption requires that in the steady state a l l bound quantum states of reac tan ts are pop- ulated i n Boltzmann fashion, and that the probabi l i ty of exc i t ing a molecule in to an unbound s t a t e i s proportional t o the Boltzmann f a c t o r f o r the f ina l s t a t e but independent of i n i t i a l (bound) s t a t e . Thus, t o ge t the r eac t ion rate a t low pressures, one need only divide a l l s t a t e s into bound and unbound, apply the Boltzmann d i s - t r i b u t i o n t o al l , find the f r a c t i o n of the Boltzmann population curve which covers unbound s ta tes , and mult iply by c o l l i s i o n rate. Thus, one has ana riorl way of pred ic t ing reac t ion r a t e as a func- t i o n of temperatuz- The rate should increase somewhat l e s s rap id ly w i t h temperature than would be predicted by an Arrhenius ex- t r apo la t ion from low temperature. It i s only at very high tempera- t u r e s that one can expect the difference between the experimental and c r i t i c a l (low-temperature ) ac t iva t ion energy t o become s igni f 1- cant. Thus, accurate data on the temperature dependence of these reac t ion rates under high-temperature shock conditions are potent ia l - l y of grea t fundamental i n t e r e s t .
If the s t rong-col l i s ion assumption I s ser ious ly at f au l t , then reac t ion may proceed l a rge ly by c o l l i s i o n a l ac t iva t ion of the high- energy bound molecules. This process, i n turn, may deplete the populations of the upper bound l eve l s and a c t t o l i m i t the react ion ra te . The e f f e c t would be expected t o increase w i t h temperature and y i e ld a negative cont r ibu t ion t o the experimental ac t iva t ion energy.
Accordingly, l e t us examine per t inent data so far col lected on high-temperature a c t i v a t i o n energies f o r rupture of molecules of the
In the case of OCS, the m i n i m u m possible c r i t i c a l ac t iva t ion CO2 family.
energy I s about 71.5 kcal/mole Our observed a c t i v a t i o n energy 64.5 kcal/mole. Since a t 2550 system of OCS is already exci ted by 15.5 kcal/mole and as the c o l l i s i o n frequency involves cc e ~ e c t i v e aeti-;ati~fi eiiei-w of (i;z jRT = 2.5 maiimole, t he min imum expected over -a l l ac t iva t ion energy would be 71.5-13 = 58.5 kcal/mole. On the basis of any s t rong-col l is ion theory, which s t a t e s that ac t ive molecules are formed in a Boltzmann d is t r ibu t ion , about 1.2RT = 6 kcal/mole i s s tored i n v ibra t ions of the average ac t ive molecule formed p u t t i the expected minimum experimental ac t iva t ion energy a t 64.5 kca3mole (48.51-6), i n agreement with that observed. Therefore, accordlng t o our current knowledge of the parameters involved in the OCS dissociat ion, the st~Ong-COlli8iOn
over -a l l d i ssoc ia t ion energy Do. the range 195O-315O0K is
theory (such as the FElRM t r ea tden t ) is not i n c o n f l i c t w i t h the experiment. However, we lack independent information about the c r i - t i c a l ac t iva t ion energy (which could be higher than the d issoc ia t ion energy, as i s ap r e n t l y the case i n NnO (5)) o r the ac t iva ted com- plex (bottleneck?configuration (which tel ls ua how to treat ro ta - t i ons i n the s t rong-col l is ion approach (7,12)). Therefore, predic- t i ons based on t h e s t rong-col l is ion theory may not be shown t o agree w i t h the fac ts . Indeed, our ca lcu la t lons based on the RRKM theory (7) show t h a t a low (-1%) c o l l i s i o n a l acOivation e f f i c i ency X required t o f i t the observed rates, and this may be considere8 rea- sonable grounds for suspecting the s t rong-col l is ion model, as cer - t a i n l y not 99 of every 100 col l is iorm are e l a s t i c . To make X lar- ger, one has t o assume a larger c r i t i c a l ac t iva t ion energy, wflich i n t u r n means that the experimental ac t iva t ion energy shows a nega- t i v e term not provided by the s t rong*col l i s ioa treatment.
be e s s e n t i a l l g the d issoc ia t ion energy, Doo = 96 kcal%ole f o r SCS('Z) - CS( C) + S ( 9 ) ; the react ion proceeds through the bent 'A2 s t a t e of CS2, which is s tab le .
modes of OCS, and cor rec t ion for the temperature dependence of col- l i s i o n frequency brings the possible minimum expected ac t iva t ion energy t o about 96. + 2.8 - 18.3 P 80.5 kcal/nole. c o l l i s i o n approximation adds about 6.5 kcal t o this, bringing the expected s t rong-col l ie ion ac t iva t ion energy t o about 87 kcal/mole. It I s possible that a r o t a t l o n a l cor rec t ion i e required (7,12), which might reduce th i s by as much as 2 kcal/mole; regardless, there i s a discrepancy indica t i rg the e f f ec t ive ac t iva t ion energy t o be a b i t too small t o be explained w i t h i n the s t rong-col l is ion framework.
a t l e a s t one employing an infrared detect ion technique(14), two in- volving u l t r av io l e t absorption measurements (11,14 ), th ree employing t ime-of-fl ight mass spectrometry, and ours using the quadrupole mass f i l t e r . The various i n v e s t i %tors report exper i ren ta l ac t iva t ion
which yielded 9 kcal /mle. There appears t o be an ac t iva t ion bar- r i e r t o recombination, giving a c r i t i c a l ac t iva t ion energy i n the v i c i n i t y of 60 kcal/mole for N20('X) -. N2('X) + O ( 9 ) . A t the mean temperature of most of the experiments (-225OoK), there i s roughly 12.5 kcal v ibra t iona l exc i ta t ion ; 60-12.92.2 - 50 kcal/mole. With ac t ive molecules being fonned with about 5 kcal average excess ener- gy, i n the s t rong-col l i s ion model we lnight expect an r c t i v a t i o n
of about 55 kcal/mole; ro t a t ion would decrerre it by 1-2 enerY kcal 7 ) . Fig. 3 shows deta from various s tud ies f i t t e d t o a least- squares Arrhenius l ine . It would be hard t o reconcile the experi- ments wi th the s t rong-col l is ion resu l t . The discrepancy i n act iva- t i o n energy is about 4RF. The apparent co l l l o iona l ac t iva t ion ef- f ic iency a l so i s very small.
Several shock s tud ie s of OCO decomposition are on record; a l l have been done by spectroscopic techniques. The experimental a c t i n - t i o n energies from severa l of the studies a m a6 follows:
is
I n - t h e case of SCS, the c r i t i c a l ac t iva t ion ener i s sure t o
The ex erimental ac t iva t ion energy has been reported 13) as 80.3 kca lAo le over the range 1800 t o 3700'K. A t 2850 '~ 1 .3 kcal/mole l a s tored i n the v ibra t iona l
The strong-
The large number of shock tube s tudies on MpO rupture include
energies rang1 from 30 t o f 9 kcal/mole, except f o r one s tudy(l1)
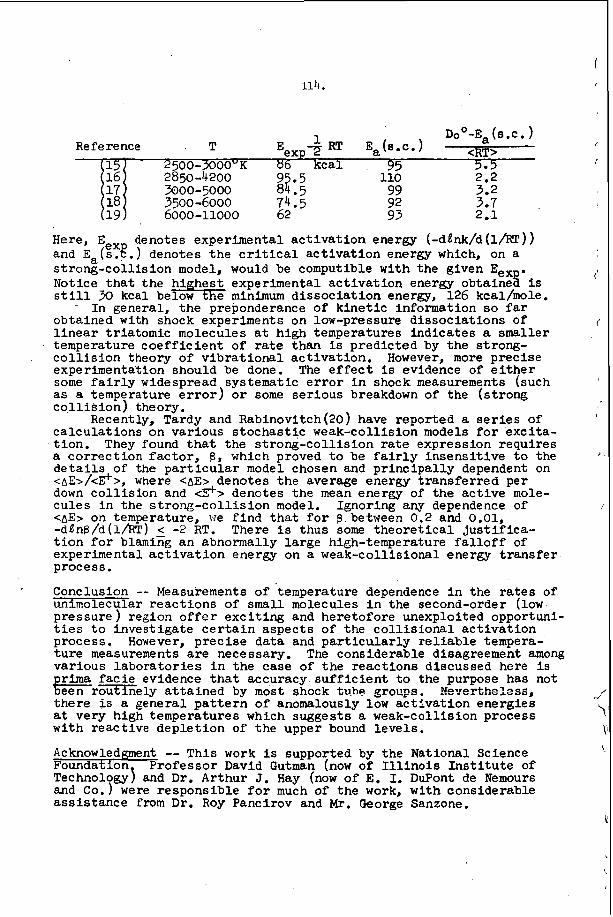
114.
1 Eexp TL I --_- Ref e rence T
15 2 5 0 0 - ~ 0 0 0 ~ ~ 6 kcal . 95 3 - 3 16 2850-4200 95.5 110 2.2
D~O-E,(S.C. 1 RT E,(s.c.) <RT>
moo-5000 84.5 1: I 3500-6000 74.5 6000-11000 62
99 92 93
3.2 3.7 2 ..l
Here, E,, and Ea(s .E . ) denotes t h e c r i t i c a l ac t iva t ion energy which, on a s t rong-col l is ion model, would be computible w i t h the given E,, . Notice t h a t the h i hes t experimental ac t iva t ion energy obta lne i i s s t i l l 30 kcal b e h minimum dissoc ia t ion energy, 126 kcal/mole.
- In general, the preponderance of k ine t i c information so f a r obtained w i t h shock experiments on low-pressure dissociat ions of l i n e a r t r ia tomic molecules a t high temperatures indicates a smaller temperature coe f f i c i en t of rate than is predicted by the strong- c o l l i s i o n theory of v ib ra t iona l ac t iva t ion . However, more precise experimentation should be done. The e f f e c t is evidence of e i t h e r some f a i r l y widespread systematic e r r o r i n shock measurements (such as a temperature e r r o r ) o r some ser ious breakdown of the (strong
denotes experimental ac t iva t ion energy (-denk/d(l/kT))
c o 11 is ion ) theory . ca lcu la t ions on var ious s tochas t ic weak-collision models f o r exc i ta -
Recently, Tardy and Rabinovitch(20) have reported a s e r i e s of
t i on . They found that the s t rong-col l i s ion rate expression requires a cor rec t ion f ac to r , 8, which proved t o be f a i r l y insens i t ive t o the d e t a i l s of the p a r t i c u l a r model chosen and pr inc ipa l ly dependent on <AE>/cE+>, where <bE> denotes the average energy t ransfer red per down c o l l i s i o n and 43% denotes the mean energy of the ac t ive mole- cu les i n the s t rong-col l i s ion model. Ignoring any dependence of <AE> on temperature, we f ind that f o r B between 0.2 and 0.01, -dl?n8/d(l/RT) < -2 RT. There i s t h u s some t heo re t i ca l j u s t i f i c a - t i o n f o r blamiiig an abnormally la rge high-temperature f a l l o f f of experimental a c t i v a t i o n energy on a weak-collisional energy t r ans fe r process .
~ Conclusion -- Measurements of temperature dependence i n the r a t e s of unimolecular reac t ions of small molecules i n the second-order (low pressure ) region o f f e r exc i t i ng and heretofore unexplolted opportuni- t i e s t o invest igate c e r t a i n aspects of the c o l l i s i o n a l ac t iva t ion process. However, p rec ise data and pa r t i cu la r ly r e l i ab le tempera- t u re measurements are necessary. The considerable disagreement among various labora tor ies i n the case of the react ions discussed here i s rima fac i e evidence that accuracy s u f f i c i e n t t o the purpose has not
f k i i - r m e l y a t t a ined by most shock tube grcrltps. xeverthe:sss, tneere is a general p a t t e r n of anomalously low ac t iva t ion energies at very high temperatures which suggests a weak-collision process w i t h react ive deple t ion of the upper bound leve ls .
Acknowledgment -- T h i s work i s supported by the National Science Foundation Professor David Gutman (now of I l l i n o i s I n s t i t u t e of Technology) and D r . Arthur J. Hay (now of E. I. DuPont de Nemours and Co.) were responsible f o r much of the work, w i t h considerable ass i s tance from D r . Roy Pancirov and Mr. George Sanzone.
115.
Re f e re nce s
J. N. Bradley and G. B. K i s t i akowsb , J. Chem. Phys. a 256 and 264 (1961). R. W. Diese? and W. J. Felmlee, J. Chem. Phys. a 2115 (1963). D. Gutman, High Temperature Gas Kinetic Study of Nitrous Oxide Decompo5ition Performed w i t h a Shock Tube and Quadrupole Mass F i l t e r , Ph.D. Dissertation, University of I l l i n o i s , Urbana, I l l i no i s , May 1965. D. Gutman, A. J. Hay, R. L. Belford, J. Phys. Chem. 70, 1786 (1966). formance t e s t s . ) D. Gutman, R. L. Belford, A. J. Hay, and R. Pancirov, J. Phys. Chem. 70, 1792 (1966). Describes an N20 study performed w i t h
A. J. Hay, High-Temperature G a s Kinetic Study of Carbonyl Sulfide Deco?position Performed w i t h a Shock Tube and Quadrupole Mass F i l t e r , Ph.D. Dissertation, University of I l l i n o i s , Urbana, I l l i n o i s , Feb. 1966. A. J. Hay and R. L. Belford, J. Chem. Pbys, ( t o appear). ( D e s - cr ibes an Improved apparatus and,, i ts use i n an OCS study). C. P. Fenimye and G. W. Jones, 8th Internat ional Sym osium on Combustion, Williams and Wilkins Co., Baltimore (19623; J. Phys. Chem. 6e, 178 (1958). E. S. Fishburne and R. Edse, J. Chem. Phys. 411, 515 (1966). J. E. Dove, Pr ivate Communication, and S. C . Barton, Ph.D. Thesis, University of Toronto, Canada, Feb. 1966. H. A. Olschewski, J. Troe, and H. G. Wagner, Ber. Buns. Ges. 70 450 (1966). e A . Marcus, J. Chem. Phys. 20, 359 (1952) and 4 3 2658 (1965). Also G. M. Wieder and R. A. Marcus, ibid. 37, 1839) (1962). H. A. Olschewski, J. Troe, and H. G. Wagner, 2. f u r phy. Chemie, Frankfurt, 5 329 11965). E. S. Fishburne and R. Edse, J. Chem. Phys. 4 1 1297 (1964). T. A. Brabbs, F. E. Belles, and S. A. Zlatargh, J. Chem. Phys. 38 1939 (1963). d W . Michel, H. A. Olschewski H. Rlchtering, and H. G. Wagner 2. f u r phy. Chem., Frankfurt, & 160 (1965). E. S. Fishburne, K. R. Bllkawesh, and R. Edse, J. Chem. Phys. 45 160 (1966).
D. C. Tardy and B. S. Rabinovdch, J. Chem. Phys. 5 3720 (1966).
(Describes the f i r s t version of the apparatus and per-
the apparat is of Ref. 4. I
Also ;39, 9 (1964).
d o . Davies, J. Chem. Phys . 4 1 W. 0. Davles, J. Chem. Phys . e 2809
1846
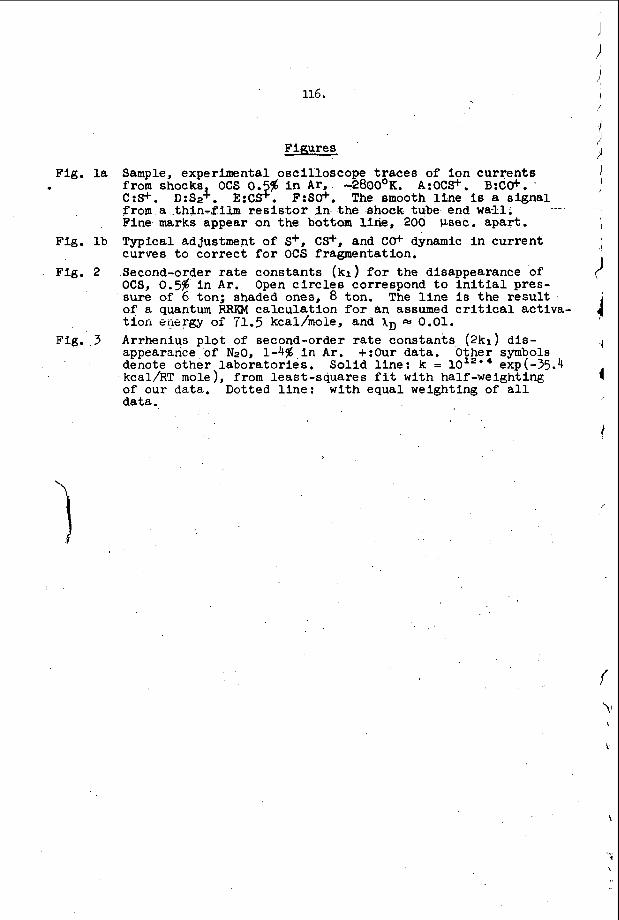
Fig. l a
Fig. l b
Fig. 2
Fig. 3
'i
116.
Figures
Sample, experimental oscil loscope traces of ion cu r ren t s from shocks OCS 0. I n A r , -2800~~. A:OCS+. B:CO+. C:S+. D:S2$. E:CS? F:SO+. The smooth l i n e is a signal from a thin-film resistor i n the shock tube end w a n . -- - Fine marks appear on the bottom l ine, 200 Psec. apar t . Typical adjustment of S+, CS+, and C@ dynamic i n current curves t o correct f o r OCS fragmentation. Second-order rate constants (kr ) f o r the disappearance of OCS, 0.5s i n A r . Open c i r c l e s correspond t o i n i t i a l pres- sure of 6 ton; shaded ones, 8 ton. The l i n e i s the r e s u l t of a quantum RRRM ca lcu la t ion f o r an assumed c r i t i c a l activa- t i o n energy of 71.5 iccai/moie, and XD - 0.01. Arrhenius p l o t of second-order r a t e constants (2k r ) d i s - appearance of N20, 1-4s i n A r . +:Our data. Other symbols denote other l abora to r i e s . S o l i d l i n e : k = lor2" exp(-35.4 kcal/RT mole), from least-squares f i t w i t h half-weighting of our data. Dotted l i n e : w i t h equal weighting of a l l data.
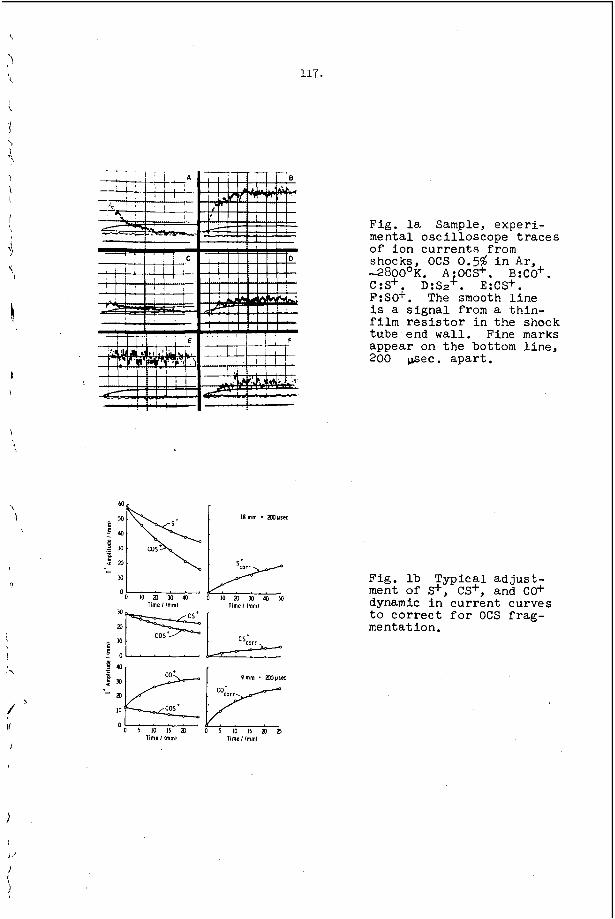
Scorr k O l O i n M ~ l O
l ime I lmml
d
Fig. l a Sample, experi- mental oscil loscope t races of ion currents from shocks, O C S 0.5s i n A r , -2800~~. AiOCS+. B:COf. C:S+. D:S2 . E:CS+. F:SO+. The smooth l i ne is a s igna l from a thin- f i lm r e s i s t o r i n the shock tube-end w a l l . Fine marks appear on the bottom l ine , 200 psec. apart .
Fig. l b Typical a d j u s t - ment of s+, CS+, and CO+ dynamic In current curves t o correct f o r OCS frag- mentation.
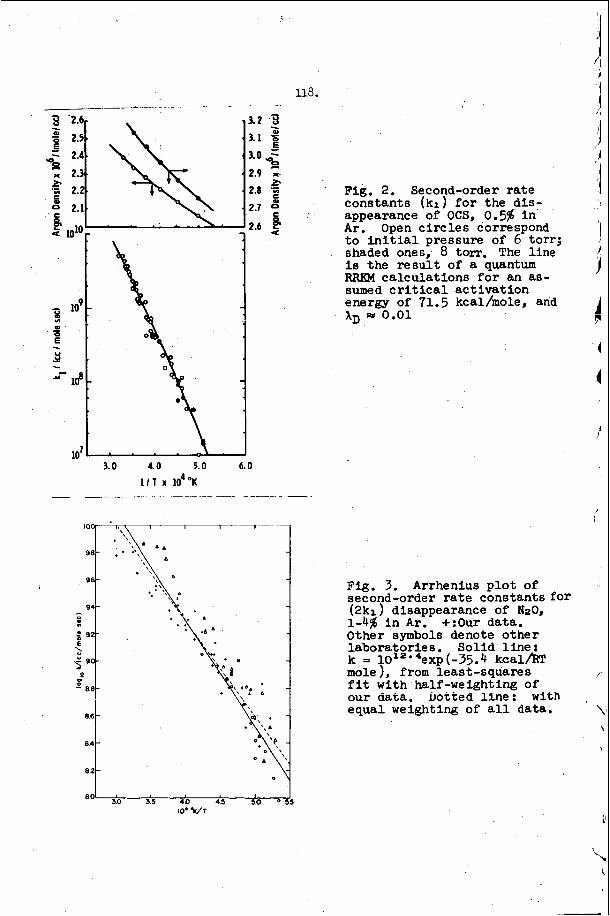
3.0 4.0 5.0 6.0
I ~ T 1 0 ~ 0 ~ - __ -
Fig. 2. Second-order r a t e constants ( k l ) f o r the d i s - appearance of OCS, 0.5s i n A r . Open c i r c l e s correspond t o i n i t i a l pressure of 6 torr; shaded ones, 8 torr. The l ine is the r e s u l t of a quantum RRKM calculat ions f o r an as- sumed c r i t i c a l ac t iva t ion energy of 71.5 kcal/mole, and XD w O,Q1
Fig. 3. Arrhenius p l o t of second-order r a t e constants for ( 2 k ~ ) disappearance of N20, 1-4% i n A r . +:Our data. Other symbols denote other labora tor ies . Sol id l i n e : k = 1012'4exp (-35.4 kcal/RT mole), from least-squares f i t w i t h half-weighting of our data. Dotted l i ne : w i t h equal weighting of a l l data.
A SHOCK TUBE STUDY OF THE RADIATIVE COMBINATION OF OXYGEN ATOMS BY INVERSE PREDISSOCIATION
B. F. Myers and E. R. Bartle
Space Science Laboratory, General Dynamic s/Convair San Diego, California, 92112
Absolute emission in tens i ty measurements of the radiative combination of oxygen atoms, 0(3P), i n the temperature range between 2500°K and 3800°K are pre- sented. in te rva ls i n the wavelength range between 2300A and 451lA. in tens i ty was found t o be proportional t o the square of the oxygen atom concen- t r a t i o n and t o be characterized by an activation energy of 2 8 . w . 2 kca l mole-l. These r e su l t s are interpretated i n terms of an inverse predissociation mechanim i n which the oxygen atoms combine along a repulsive poten t ia l energy surface with
s ta te of molecular oxygen and a subsequent radiative
The emission in tens i ty was recorded sgnultaneouFly i n six spectral The absolute emission
a t rans i t ion t o the B3 t rans i t ion t o the oxygen. The r a t e const n t f o r the overall radia ive f 2200/RT) cm3 mole-l sec-l fo r the wavelength range 2300A t o 5000A.
was found t 8 be 4 . 3 & O 8 exp(- 28900
I. INI%ODUCTION
Measurements on the radiative combination of oxygen atoms, q 3 P > , i n the temperature range between 2500°K and 380OoK are presented. This radiative process was f i r s t observed during an investigation' on the radiative combination of atomic oxygen and carbon monoxide. t o the t o t a l emission in tens i ty occurred a t wavelengths below 4500A i n the presence o f oxygen atoms only.
I n the l a t t e r case, it was found t h a t o a contribution
I n the present experiments, absolute emission in tens i ty measurements of the radiation result ing from the combination of oxygen atoms were made by shock heat- ing O3 + A r gas mixtures t o temperatures i n the range c i t ed above and t o pressures between 0.5 and 2.0 atm. six spectral in te rva ls i n the wavelength range between 2300A and 45llA. emission in tens i ty behind the shock f ront a t the time of essent ia l ly complete ozone decomposition was correlated with the oxygen atom concentrations a s determined by numerical calculations.
The emission in tens i ty w a s record@ simultqeously i n The
11. MPERIMErnAL
The experiments were conducted with the 3 inch, in te rna l diameter shock tube f a c i l i t y and the associated opt ica l system and gas handling system previously emp1oyed.l For the measurement of the emission in tens i ty of the radiative combi- nation of oxygen atoms, the six sl i ts i n the image plane of the spectrograph had the center wavelengths and bandpas+s given I n Table I. l i s t e d have an e r ro r of less t$an 3A. spec t ra l in te rva l between 2300A and 25OU, two Dumont 7664 photomultipllers with S-13 spectral responsg and fused s l l l c a VindOws were employed, and i n the spectral i n t e rva l between 3000A and 4 5 d , four RCA type P28, photomultipliers with S-5 spectral response, two of which had quartz windows, were employed. The response of the detector system was l inear ly r e b t e d t o Incident radiation' and output signal for each spectral channel was not affected by radiation t r a n m l t t e d i n the other channels.' of a calibrated tungsten ribbon filament lamp) The en t i re op t ica l system was
The wavelength values Fgr detection of incident radiation i n the
The output signals were c a l l rated i n terms of the steradiamy
m. anclosed in a light tight box which could be flushed with PS t o avoid absorption of the &tted r sd ia t lon by air.
!The gas mirtures of 4 and Ar were prepared from Matheson Co. supplies of Ar (ultra Mgh puri ty m) containing less than E ppm of contaminants and from LiqW Uarbo~Ic O2 (e lec t ro ly t ic laboratory grade) containing l e s s than 10 p m of contanbmts. The ozone was synthesized from the oxygen in a s t a t i c ozone gener- ator.2 The gas mix tures .prepand contained from 1s t o 18% of 03. analyeis of the ozone in t he prepared gas mlrtures w a s made by a standard ti; t r a t i o n procedure.3 For each experiment the t e s t gas mixture was shock heated wiWn three minutes follarlng addition t o the shock tube, and a semple of the mixture w a s withdrawn from the shock tube for ozone analysis one minute before shock b a t i n g the mixture.
900% a t l e a & the Incident shock w-me to fom atomic and molecular oxygen. The concentrations of corygen atoms and molecules were determined f o r each experiment by a numerical calculat ion based on an assumed decomposition mechanism and corresponding element- ary reaction ra te constants a s discussed below. The numerical calculations were made using the Cornell Aeronautical Laboratory normal shock wave computer progrern The calculations were performed on an IBM 7090-70!34 computer.
The qu&itative
The O3 t Ar mlxtures were shock heated t o temperatures between 25OOoK and pressures between 0.5 anti 2.0 atm. kt these temperatures ami pressures, of t he ozone had decomposed within 0.1 psec (par t ic le t i m e ) behind
4,5
m. Rg6uLTs
An oscillogram of the recorded emission in t ens i t i e s i s shown i n Figure 1. For this experiment, a mixture of 6% + 94% Ar was shock heated t o an i n i t i a l temperature of 3048OK and a pressure o 7 1.41 atm; this temperature snd prearmre correspond t o t ranslat ional , ro ta t iona l and vibrat ional equiUbrium of the mixture with frozen chemical reactions. Figure 1, the center wavelength and spectral i n t e rva l are given i n Angstrom units. The shock f ront a r r i v a l 1s indicated by the sudden rise Is t he upper t race of Figure Ib which shows the response of a heat r e s i s to r gauge mounted i n the shock tube wall at the cross section of the radiat ion measurement. the detector system i s channel with a center wavelength of 3002A for which the response time i s 20 psec (laboratory time). To obtain the emission in tens i ty inrmediately a f t e r essent ia l ly complete ozone decomposition which occurs within 0.1 psec (par t ic le time) of shock front a r r i v a l a t the obsemation station, the emission-time p ro f i l e s are extrapo- la ted pract ical ly t o zero time. l&merical calculat ions demonstrate that a f t e r the ozone decomposes, the concentrations of atomic and molecular oxygen and the temper- ature change slowly under the present experimental conditions toward an equi l lbr im state . initial rise in signal, the signal was e i the r constant or Unearly increasing or decreasing slowly for 50 t o 150 psec (laboratory time), el lov ing for the noise in the si@; the extrapolation was based on t h i s port ion of the trace.
Opposite the beginning of each channel t race i n
The response time of 15 psec (laboratory time) for a l l channels except that
For that portion of the emission intensity-time prof i le following the
Tbe extrapolated values of the signals near zero time were coxrverted t o in - t ens i ty values for each spec t ra l channel (I) by us- the f o l l o m relation:
w h e r e S i s the extrapolated oscillogram signal in vol t s , CiJ the ca l lbra t ion fac tor b .watts str-1 1-1 cm-2 V-1, determined from the measured o s c i ~ s c o p e signal comesponding t o the known steradiancy of the standardized, tungaten ribbon filament lamp in each wevelength internel of the spec t ra l channels, d(= 7.70 cm)
I
I
I
\'
121.
the diameter of the shock tube and Ri, the r e f l ec t iv i ty a t the center wavelength Of
Chamel i of the shock tube wall opposite the observation s ta t ion window which serves a s a bounding plane t o the op t i ca l f i e ld . t i v i t y on the wavelength which was determined i n two independent experiments6 and the normalization of the in tens i ty with respect t o the diameter of the shock tube, d, have been discussed prev1ously.l
The de2endence of the reflec-
The values of I computed a s described above, are shown i n Table 11; also given are the initid conditions, the shock velocity and the ca l ibra t ion fac tors f o r each spectral channel.
Contributions t o the observed emission in tens i ty from molecular oxygen, argon o r impurities i n the t e s t gases were examined by shock heating argon and oxygen- argon mixtures t o temperatures up t o 3 6 0 0 ~ ~ No signal was observed with shock- heated oxygen-argon mixtures u n t i l significant decomposition of the molecular oxygen t o form oxygen atoms occurred; with shock-heated argon, aos igna l was observ- ed only i n the spectral channel with a center wavelength of 451lA. This signal was a transient lasting about 50 psec (laboratory t h e ) and was apparently caused by an impurity i n the argon o r by residual gases i n the shock tube. the extrapolation procedure t o the data fo r t h i s channel, the oscillogram trace fo r t(1aboratory time) < 50 psec was disregarded. However, when the extrapolation was made using tha t portion of the trace for which t(1aboratory time) 21501.~sec, a lower, but not significantly different value of the signal w a s obtained. The in t ens i t i e s corresponding t o the l a t t e r signal values are only considered below i n connection with Figure 7. t race by the transient signal fo r t(1aboratory time), 50 psec, although t h i s i s d i f f i cu l t t o establish because of the signal noise.
I n applying
This difference could indicate a contribution t o the oscillogram
For each experiment, the oxygen atom concentration Imedia te ly behind the shock front was determined by a numerical calculation based on the following react ion mechanism:
M = 02, 0 Ar (m) 3' o3 + M z= o2 + 0 + M o + o c o 2 + 0 2 3 O 2 + M = 2 0 + M M = A r (R3)
The forward r a t e constants f o r these reactions were pa r t of the input data f o r the computer program4 while the reverse reaction r a t e constants were calculated from thermodynamic data and the forward reaction r a t e constants as pa r t of the computer program. The ra te constants for reactions R1 and R2 have been deduced from experi- ments on the thermal decomposition of ozone a t temperatures between 3 4 3 O K and 383OK i n s t a t i c e x p e r i m e n t s 7 ~ ~ and a t temperatures between 689OK and glO°K i n shock tube experinrents.9 determined i n the low temperature expe r imen t s .7~~ a t tem eratures above 2500°K involves a large extrapolation and recent experi- mentslf; indicate t h a t the r a t i o kl/k2 i s a s much a s f ive times smaller than the extrapolated value i n the approximate range of temperatures between 1500°K and 2800'K. Arrhenius f o n n . 7 3 ~ 9 It w i l l be shown below, however, t ha t this discrepancy i s prac t ica l ly resolved fo r the present experiments by using the r a t e constant fo r reaction Rl i n the form corresponding t o the ~nshelwood-Rice-Ramsperger-Kassel theory of uni-molecular reactions a s given by Jones and Davidsong an the r a t e constant for reaction R2 i n the co l l i s ion t eory form, i.e., k = A ! d 2 e-E/m, based on the data of Benson and Axw0rthy.7,~ The values of the parameters i n these r a t e constant expressions f o r reactions Rl and R2 are given i n Table I11 i n the group labelled se t 11; i n the group labelled set I, the values of tk parameters f o r the ra te constants expressed i n the Arrhenius form are given f o r reactions R1
The re la t ive e f f ic ienc ies of Ar, 02 and 03 i n reaction R1 were The use of these r a t e constants
This co lusion i s based on r a t e constant expressions given i n the
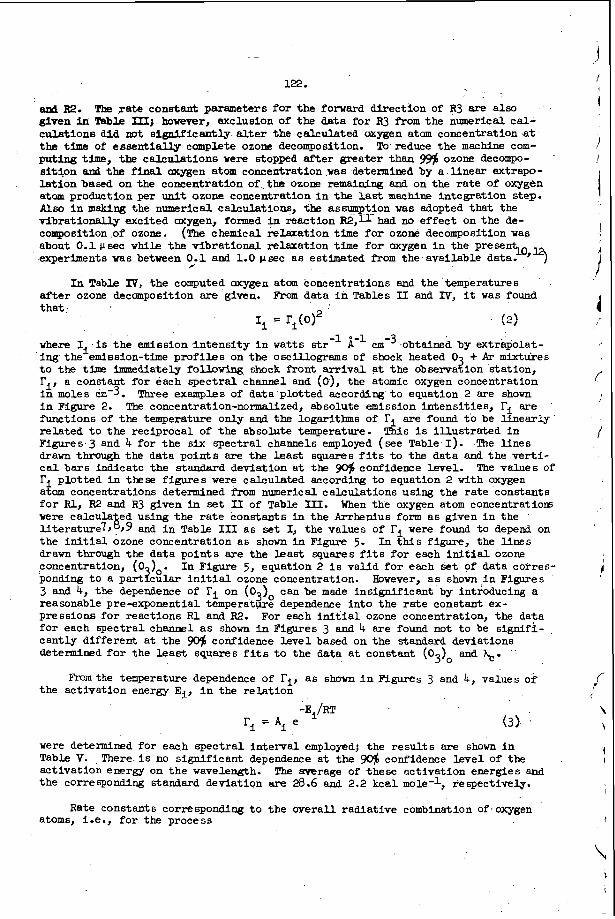
122.
& R2. glven i n Table mj however, exclusion of the data f o r from the numerical cal- culat ions did not slepllficantly a l t e r the calculated oxygen atom concentration a t the time of essent ia l ly complete ozone decomposition. To. reduce the machine com- puting time, the calculat ions were stopped a f t e r greater than 994s ozone decompo- s i t i o n and the f ina l oxygen atom concentration w a s determined by a l inear extrapo- l a t i o n based on the concentration of- the ozone remining and on the r a t e of oxygen atom production per unit ozone concentration in t h e last machine integration step. Also in making the numerical calculations, the assumption was adopted that the vibrat ional ly excited oxygen, formed in reaction R2,u had no ef fec t on the de- camposition of ozone. about 0.1psec w h i l e the vibrat ional relaxation time for oxygen in the prese50,32 experiments was between 0,.1 and 1.0 psec as estimated from the available data. )
I n Table IV, the computed oxygen atom concentrations and the temperatures a f t e r ozone decmposition are given. FNlm data in Tables II and IV, it was found
The r a t e constant paremeters f o r the forward dFrection of R3 are also
c he chemical relaxation time f o r ozone decomposition was
tha t . ( 2 )
where Ii i s the emission in tens i ty i n w a t t s str-l L-l cm-3 obtained by extrapolat- ing the emission-time p r o f i l e s on the osciLlograms of shock heated 0 t o the time immediately f o l l o w i n g shock front a r r i v a l a t the observaGion station, Ti, a constant for each spec t ra l channel and (0), the atomic oxygen concentration i n moles cm-3. i n Figure 2. The concentration-normalized, absolute emission intensi t ies , ri axe functions of the temperature only and the logarithms of ri are found t o be l inear ly re lated t o the reciprocal of the absolute temperature. This i s i l l u s t r a t e d i n Figures 3 and 4 for the six spectral chanuels employed (see Table I). drawn through the data points are the least squares f i t s t o the data and the v e r t i - c a l bars Indicate the standard deviation a t the 90% confidence level. r, plot ted in these f igures were calculated according t o equation 2 w i t h oxygen atom concentrations determined from numerical calculations using the r a t e constants f o r Rl, R2 and R3 given in set II of Table III. When the oxygen atom concentratios were calcula ed using the r a t e constants in the Arrhenius form as given i n the
the i n i t i a l ozone concentration a s shown i n Figure 5. In this figure, the Unes drawn through the data points are the least squares f i t s f o r each i n i t i a l OZOM concentration, (0 )o. ponding t o a partqcular i n i t i a l ozone concentration. 3 and 4, the dependence of Ti on (03)o can be made insignificant by Introducing a reasonable pre-exponential temperature dependence in to the r a t e constant ex- pressions for reactions R1 and R2. For each i n i t i a l ozone concentration, the data for each spectral channel a s shown in Figures 3 and 4 are found not t o be signifi- cantly different a t the gO$ confidence l e v e l based on the standard deviations determined f o r the l e a s t squares f i ts t o the data at constant (03)o and $.
the act ivat ion energy E$, i n the re la t ion
+ Ar mixtures
Three examples of data plotted according t o equation 2 are shown
The lines
The values of
l i t e r a t u r e 7 ~ 8 39 and in Table I11 as set I, the values of Ti were found to depend on
In Figure 5 , equation 2 i s vaUd f o r each set of data corres- However, a s shown I n Figures
Fm;n the temperature dependence of Ti, as shown in Figures 3 and 4, values of
-Ei/RT Ti = Ai e (3)
were determined for each spec t ra l in te rva l employedj the r e s u l t s a r e shown in Table V. .There i s no s ignif icant dependence a t the act ivat ion energy on the wavelength. the corresponding standard deviation are 28.6 and 2.2 kcel mole-l, respectively.
confidence leve l of the The average of these act ivat ion energies and
Rate constants corresponding t o the overal l radiat ive combination of. oxygen atoms, i.e., f o r the process
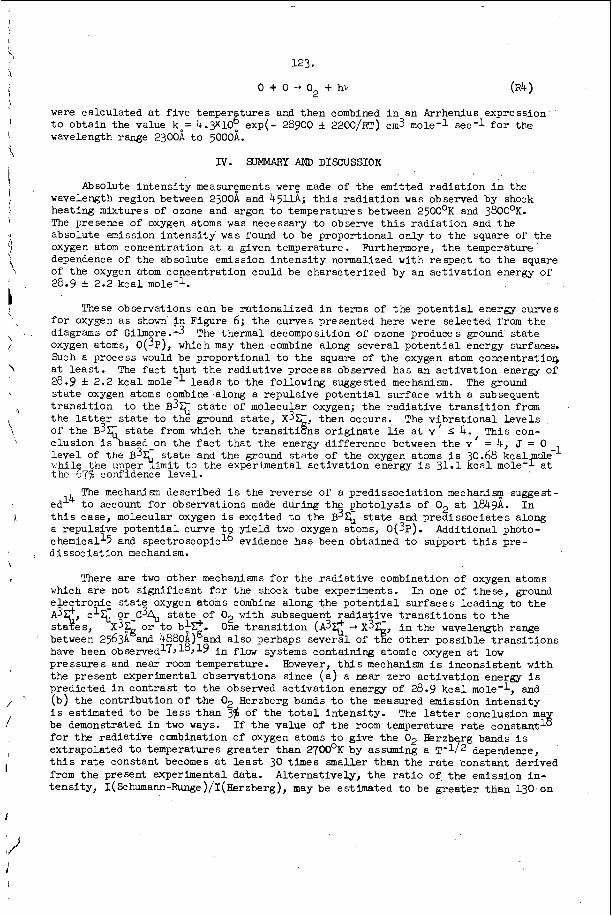
123.
0 + 0 - O2 + hv (R4 1 were calculated a t f ive temper tures and then combined i n an Arrhenius expression t o obtain the value ko= 4.31OS exp(- 28900 f 2200/RT) cm3 mole-1 sec-l f o r the wavelength range 23OOA t o 5OOOA.
IV. SUMMARY AND DISCUSSION
Absolute in tens i ty measurgments werz made of the emitted radiation i n the wavelength region between 2300A and 451I.A; t h i s radiation was observed by shock heating mixtures of ozone and argon t o temperatures between 2500°K and 3800'K. The presence of oxygen atoms was necessary t o observe t h i s rad ia t ion and the absolute emission in tens i ty was found t o be proportional o n l y t o the square of the oxygen atom concentration a t a given temperature. Furthermore, t he temperature dependence of the absolute emission in tens i ty normalized with respect t o the square of the oxygen atom concentration could be characterized by an activation energy of 28.9 & 2.2 kca l mole-l.
These observations can be rationalized i n terms of the poten t ia l e n e r a curves for oxygen a s shown i n Figure 6; the curves presented here were selected from the diagrams of Cilmore.l3 oxygen atoms, O(3P), which may then combine along several po ten t ia l energy surfaces. Such a process would be proportional t o the square of the oxygen atom concentratioq a t l ea s t . The fact tha t the radiative process observed has an activation energy of 28.9 f 2.2 kca l mole-' leads t o the following suggested mechanism. s ta te oxygen atoms combine along a repulsive poten t ia l surface with a subsequent t r ans i t i on t o the B 3 q s t a t e of molecular oxygen; the radiative t rans i t ion from the l a t t e r s t a t e t o the ground s ta te , X 3 c , then occurs. The vibrational leve ls of the B3G s ta te from which the transiti&x originate l i e a t v S 4., This con- elusion i s based on the f a c t t ha t the energy difference between the v
The thermal decomposition of ozone produce s ground s ta te
The ground
1 = 4, J = 0 s ta te and the ground s ta te of the oxygen atoms i s 30.68 kcalmde-
i m i t t o the experimental activation energy i s 31.1 kcal mole-1 a t
The mechanism described i s the reverse of a predissociation mechaniq suggest- ed14 t o account fo r observations made during the photolysis of O2 a t 1&9A. I n t h i s case, molecular oxygen i s excited t o the B 3 q s ta te and predissociates along a repulsive potential curve t o yield two oxygen atoms, O(3P). chemicall5 and spectroscopic16 evidence has been obtained t o support t h i s pre-
Additional photo-
, dissociation mechanism.
There are two other mechanisms f o r the radiative combination of oxygen atoms which are not significant for the shock tube experiments. I n one of these, ground electronic s ta te oxygen atoms combine along the poten t ia l surfaces leading t o the A3e, c lG or-C3% s ta te of O2 with subsequent radiative t rans i t ions t o the staves, between 25638 and 4880A)gand also perhaps several of t e other possible t rans i t ions have been 0 b s e r v e d l 7 J ~ ~ J ~ g i n flow systems containing atomic oxygen a t low pressures and near room temperature. However, t h i s mechanism i s inconsistent with the present experimental observations since ( a ) a near zero activation energy i s predicted i n contrast t o the observed activation energy of 28.9 kca l mole-1, and (b) the contribution of the 02 Herzberg bands t o the measured emission in tens i ty i s estimated t o be l e s s than 3$ of the t o t a l Intensity.
f o r the radiative combination of oxygen atoms t o give the O2 Herzb rg bands i s extrapolated t o temperatures greater than 2 7 0 ° K by assuming a T-172 dependence, this r a t e constant becomes a t l ea s t 30 times smaller than the rate constant derived from the present experimental data. tensity, I(Schumann-Runge)/I(Herzberg), may be estimated t o be greater than 130 on
X3Fg o r t o b!I?. One t r ans i t i on ( A 3 q - X 3 g i n the wavelength range
The l a t t e r conclusion ma be demonstrated i n two ways. I f the value of the room temperature r a t e constant lir
Alternatively, the r a t i o of the emission in-
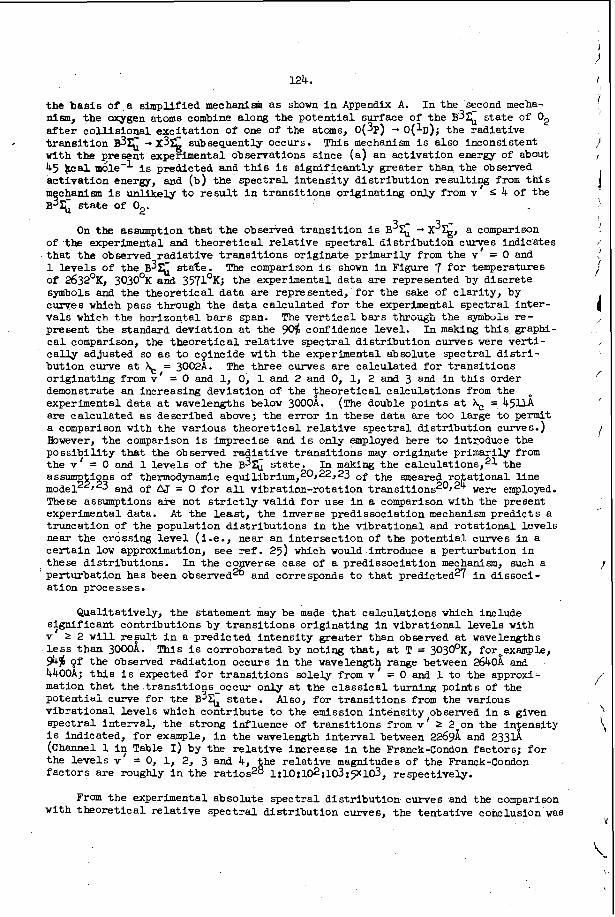
124.
the b a s i s of a simpufied mechanism a s shown i n Appendix A. nlan, the oxygen atoms combine along the poten t ia l surface of the B 3 q state of o2 a f t e r collisional excztation of one of the atoms, O(3P) -. O(lD); the radiative Oransition 3% -. X3% subsequently occurs. with the present experimental observations since (a ) an act ivat ion energy of about 45 &al mole-' 1s predicted and t h i s i s s ignif icant ly greater than the observed act ivat ion energy, and (b) the spec t ra l in tens i ty d is t r ibu t ion r e s u l t i y from t h i s m chanian i s unlikely t o result i n t rans i t ions originating only from v i 4 of the
I n the szcond mecha-
. This mechanisn i s also inconsistent
B 3 s t a t e of 02.
3 On the assumption t h a t t he observed t r ans i t i on i s B of the experimental and theore t ica l r e l a t ive spectral d i s t r ibu t ion c u q e s indicates tha t the observed rad ia t ive t r ans i t i ons originate primarily from the v = 0 and 1 levels of the B 3 q sta%e. of 2632OK, 3030°K and 3571OK; the experimental data are represented by discrete symbols and the theore t ica l data are represented, fo r the sake of c lar i ty , by curves which pass through the data calculated fo r the experimental spectral in te r - va ls which the hnrizn&l_tql bms wen. The v e r t i c a l bars tkiro-igh tine symbvis re- present the standard deviat ion a t the 9 6 confidence level . c a l comparison, the theore t ica l r e l a t ive spectral d i s t r ibu t ion curves were ve r t i - ca l ly adjusted so as t o cpincide with the experimental absolute spectral distri- bution curve a t A, = 3OO2A. The three curves a re calculated fo r t rans i t ions or iginat ing from v ' = o and 1, 0, 1 and 2 and 0, 1, 2 and 3 and i n t h i s order demonstrate an increasing deviat ion of the p e o r e t i c a l calculations from the experimental data a t wavelengths below 3000A. are calculated as described above; the error i n these data are too large t o permit a comparison with the various theore t ica l r e l a t ive spectral d i s t r ibu t ion curves.) However, the comparison i s imprecise and is only employed here t o introduce the po s s i ? i l l t y that the ob served radiat ive t rans i t ions may or iginate primarily from the Y a s y & i o n s of thermodynamic e q ~ i l i b r i u m , ~ ~ ~ * ~ ~ ~ 3 of the smeared ro ta t iona l kine model J 2 3 and of L?J These assumptions are not s t r i c t l y va l id f o r use i n a comparison with the present experimental data. truncation of the population d is t r ibu t ions i n the vibrat ional and ro ta t iona l levels near the crossing l eve l (i-e., near an intersect ion of the poten t ia l curyes i n a cer ta in low approximation, see ref. 25) which would introduce a perturbation i n these dis t r ibut ions. In the co erse case of a predissociation mechanism, such a perturbation has been observed29vand corresponds t o tha t predicted27 i n dissoci- a t ion processes.
-X3$, a comparison
"he comparison i s shown in Figure 7 f o r temperatures
In making t h i s graphi-
(The double points a t Ac = 45111
= 0 and 1 levels of the B 3 g s ta te . In making the calculations,21 the
0 f o r a l l vibration-rotation t r a n S i t i 0 1 1 S ~ ~ J ~ ~ were employed.
A t the l ea s t , the inverse predissociation mechanism predicts a
Qualitatively, the statement may be made tha t calculat ions which include
2 2 w i l l replt i n a predicted in tens i ty greater than observed a t wavelengths sfgnificant contributions by t r ans i t i ons or iginat ing i n vibrat ional leve ls with v l e s s than 3000A. 942 pf the observed radiat ion occurs i n the wavelengt9 range between 2640A and 4400A; this i s expected fo r t r ans i t i ons solely from v mation tha t the t rans i t ions occur only a t the c l a s s i ca l turning points of the poten t ia l curve lo r the B 3 q s t a t e . v ibra t iona l levels which contr ibute t o the emission in tens i ty ,observed i n a given spectral interval , the strong influence of t r ans i t i ons from v 2 2 on the in3ensity i s indicated, fo r example, i n the wavelength in t e rva l between 22691 and 233U (Channel 119 Table I) by the r e l a t ive increase in the Franck-Condon factors; f o r the l eve l s v fac tors a re roughly i n the r a t i o d lt10:1@:103r~103, respectively.
!Chis i s corroborated by noting that, at T = 3O3O0K, foroexample,
= 0 and 1 t o the approxi-
Also, for t r ans i t i ons from the various
= 0, 1, 2, 3 and 4, he re la t ive magnitudes of the Franck-Condon
From the experimental absolute spec t ra l d i s t r ibu t ion curves and the comparison with theore t ica l re la t ive spec t ra l d i s t r ibu t ion curves, the ten ta t ive conclusion was
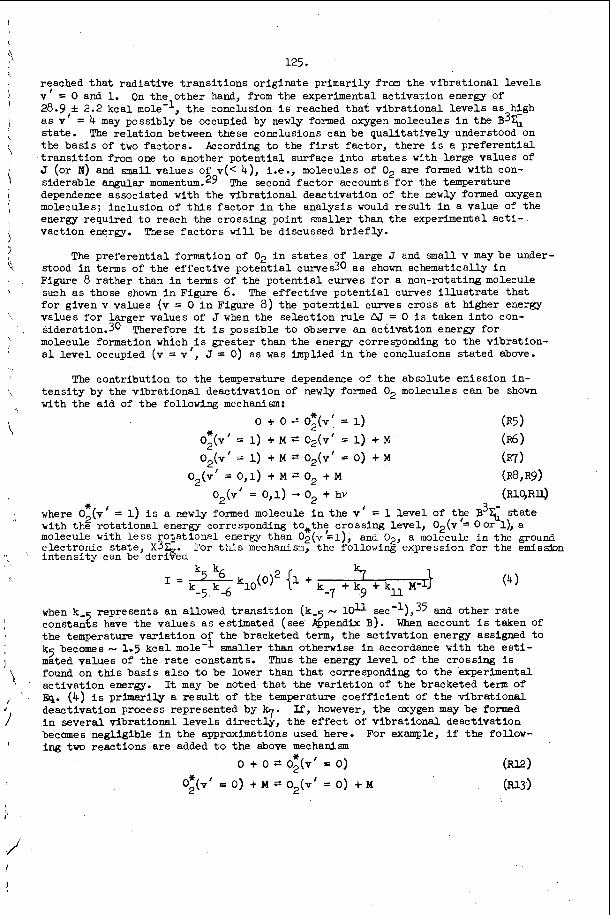
125.
reached tha t radiative t rans i t ions Originate primarily f rom the v ibra t iona l leve ls v i = 0 and 1. 28.gii 2.2 kcal mole-', the conclusion i s reached t h a t vibrational leve ls a s high as v = 4 may possibly be occupied by newly formed oxygen molecules i n the B 3 Q state. The re la t ion between these conclusions can be quali tatively understood on the bas i s of two factors. According t o the f i r s t factor, there i s a preferen t ia l t r ans i t i on from one t o another po ten t ia l surface in to s t a t e s with large values of J (or IT) and small values of v(< 4), i.e., molecules of O2 are formed with con- siderable angular m~rnentum.~g dependence associated with the vibrational deactivation of the newly formed oxygen molecules; inclusion of this fac tor i n the analysis would resu l t i n a value of the energy required t o reach the crossing point smaller than the experimental ac t i - vaction energy.
On the other hand, from the experimental activation energy of
The second fac tor accounts for the temperature
These fac tors w i l l be discussed br ie f ly .
The preferen t ia l formation of 02 i n s t a t e s of large J and m a l l v may be under- stood i n terms of the effective poten t ia l curves30 a s shown schematically i n Figure 8 rather than i n terms of the poten t ia l curves f o r a non-rotating molecule such a s those shown i n Figure 6. f o r given v values (v = 0 i n Figure 8) the poten t ia l curves cross a t higher energy values f o r larger values of J when the selection ru le &T = 0 i s taken in to con- ~ i d e r a t i o n . 3 ~ Therefore it i s possible t o observe an activation energy fo r molecule formation which a l l eve l occupied (v = Y , J = 0) as w a s implied i n the conclusions stated above.
The effective poten t ia l curves i l l u s t r a t e tha t
greater than the energy corresponding t o the vibration-
The contribution t o the temperature dependence of the absolute emission in- t ens i ty by the vibrational deactivation of newly formed O2 molecules can be shown with the a id of the following mechanism!
(R5) (R6 1 037) (R8,R9) (UO,RU
* 0 + 0 z! 02(v/ = 1) *
02(vJ = 1) + M Z= 02(v1 = 1) + M 02(vJ = 1) + M z! 02(vi = 0) + M
02(v' = 0,l) + M t O2 + M 02(vd = 0,l) -. O2 + hv
* / where 02(v = 1) i s a n e w l y formed molecule i n the v' = 1 level of the B 3 q s ta te with the ro ta t iona l energy corresponding to,the crossing level, 02(vd= 0 or l), a molecule with l e s s rotational energy than 0 ~ ( ~ & 1 ) , and 02, a molecule i n the ground electronic s ta te , X 3 in tens i ty can be der%ed
. For this mechanism, the following expression f o r the emissjon
-5. -6 -7 .9 when k- represents an allowed t r ans i t i on ("-5 - ld-1 ~ e c - l ) , ~ 5 and other r a t e constanzs have the values a s estimated (see Appendix B). When account i s teken of the temperature var ia t ion of the bracketed term, the activation energy assigned t o k5 becomes - 1.5 kca l mole-1 smaller than otherwise i n accordance with the esti- mated values of the r a t e constants. found on this bas is a l so t o be lower than t h a t corresponding t o the experimental activation energy. It may be noted tha t the var ia t ion of the bracketed term of E q . (4) is primarily a r e su l t of the temperature coefficient of the vibrational. deactivation process represented by 9. If, however, the oxygen may be formed i n several vibrational l eve l s directly, the e f f ec t of vibrational deactivation becomes negligible i n the approximations used here. ing two reactions are added t o the above mechanism
Thus the energy l eve l of the crossing i s
For example, i f the follow-
t 0 + 0 02(vd = 0)
oE(v' = 0) + M =Z 02(vJ = 0) + M (m3 1
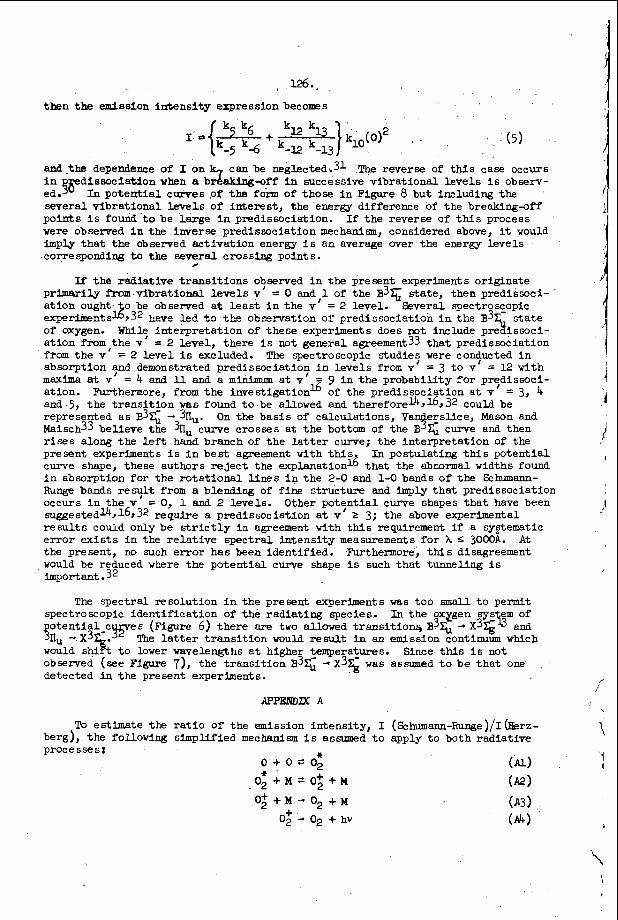
, 126.,
then the emission in tens i ty expression becomes
' ( 5 )
& t h e dependence of I on 'fa can be n e g l e ~ t e d . 3 ~ The reverse of this case occurs i n &$edissociation when a b --off i n successive vibrat ional levels is observ- ed. several vibrat ional levels of interest , the energy difference of the breahing-off points i s found to be large in predissociation. If the reverse of this process were obsemed i n the inverse predissociation mechanism, considered above, it would imply t h a t the observed act ivat ion energy is an average over the energy levels corresponding t o the several crosslng points.
If the radiat ive t rans i t ions observed i n the present experiments originate primarily from vibrat ional l e v e l s v' = 0 and,1 of the B 3 q state, then predissoci- a t ion ought o be obsemed a t l e a s t in the v = 2 level. Several spectroscopic
of oxygen. Whi? interpretat ion of these experiments does not include p r a i s s o c i - a t ion from,the v = 2 level, there i s not general agreement33 t h a t predissociation from the v = 2 l eve l is excluded. absorption y d demonstrated predissociatlon i n leve ls from v maxima at v = 4 and 11 and a minimum a t v' = 9 In the probabili ty f o r pryl issoci- ation. Furthermore, from t h e investigation* of the predissociation a t v and 5, the t rans i t ion was found t o be allowed and t h e r e f ' 0 r e l ~ j ~ r 3 ~ could be represented a s B 3 q - 3nu. On the basis of calculations, Van$e+ice, Mason and Misch33 believe the 3nU curve crosses a t the bottom of the B & curve and then rises along the l e f t hand branch of the l a t t e r curve; the interpretat ion of the present experiments is in bes t agreement with t h i s . In postulating t h i s potent ia l curve shape, these authors r e j e c t the explanationG t h a t the abnormal widths found i n absorption f o r the ro ta t iona l llnes in the 2-0 and 1-0 bands of the Schumann- Runge bands r e y l t from a b l e d n g of fine structure and imply tha t predissociation occurs i n the v = 0, 1 and 2 levels. s u g g e ~ t e d l ~ , 1 ~ , 3 ~ require a predlssociation a t v 5 3; the above experimental r e s u l t s could only be s t r i c t l y i n agreement with this requirement if a sy2ternatic e r ror e x i s t s i n the r e l a t i v e spectral intensi ty measurements for A S 3000A. A t the present, no such er ror has been ident i f ied. Furthermore, this disagreement would be reduced where the potent ia l curve shape is such tha t tunneling i s
In potent ia l curves of the form of those i n Figure 8 but including the
#
p=elrbe~%s 2 j32 h m e kc? t o t h e obsem=ttion o r predisscciat ian in the B3r- s ta te
The spectroscopic studie? were conpcted in = 3 t o v = I 2 with
= 3, 4
Other p o t y t i a l curve shapes t h a t have been
important. 32
The spectral resolution in the present experiments was too mall t o permit In the oxxgen system of
o t e n t i $ l - c y s (Figure 6) there are two allowed t rans i t ion5 B3& - X3Gu and spectroscopic ident i f ica t ion of the radiat ing species.
3nU - X 4. would shl t t o lower wavelengths a t higher t_emperat_ures. observed (see Figure 7), the t rans i t ion B3G -. X 3 s w a s asslrmed t o be t h a t one detected i n the present experiments.
The l a t t e r t rans i t ion would r e s u l t i n an emission continuum which Since this is not
APPEND= A
To estimate the r a t i o of the emission intensi ty , I (Schumann-Runge)/Ibrz- berg), the following sfmpllfied rnechanlm is assumed t o apply t o both radiat ive proce sse s I *
o + o = o & I (JQ o2 + M = 0': + M * 0; + M - o2 + M
0; - 02 + hv
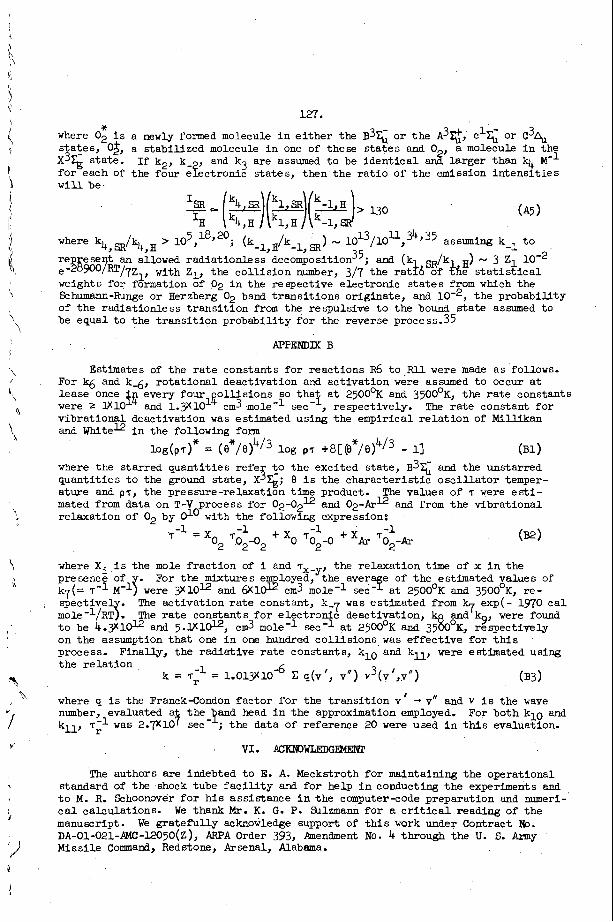
127.
where 02 i s a newly formed molecule i n e i t h e r the B3G or the A3$, c1G or C341 s ta tes , 03, a s tabi l ized molecule i n one of these states and 0 , a molecule i n t h e X 3 5 state . If k2, k-2, and k3 are assumed t o be ident ica l a d larger than k4 M'l for each of the four electronic s ta tes , then the r a t i o of the emission in tens i t ies w i l l be.
'SR '4,SR '1,SR -l,H , 130 %I ( kh,H)(kl,H)('-l,SR)
*
(A51
where k4
re ese e - 3 8 ~ o ~ R T / ~ Z l , with Z1, the co l l i s ion number, 3/7 the r a d 6 of $i$ s t a t i s t i c a l weights for formation of 02 i n the respective electronic s t a t e s from which the Schumann-Fhnge or Herzberg 02 band t rans i t ions originate, and the probabili ty of the radiationless t rans i t ion from the respulsive t o the bound s ta te assumed t o be equal t o the t rans i t ion probabili ty f o r the reverse process.35
18J20; (k-l,H/k-l,SR) - 1 0 ~ ~ / 1 0 ~ , ~ ~ , ~ ~ assuming k-: t o m/k4 > 10 , an ahowed radiat ionless d e c o m p ~ s i t i o n ~ ~ ; and (k =/k ) - 3 Z 1
APPENDIX B
Estimates of the ra te constants for reactions R6 t o Rll were made as follows. For k6 and k-6, rotat ional deactivation and act ivat ion were assumed t o occur a t
vibrat ional deactivation was estimated using the empirical re la t ion of Millikan and Whiteu i n the following form
(B1) where the starred quant i t ies re fer t,o the excited s ta te , B3G and the unstarred quant i t ies t o the ground s ta te , X3%; 8 i s the character is t ic o s c i l l a t o r temper- a ture and pr , the pressure-relaxation time product. The values of r were e s t i - mated from data on T-V process for 02-O2= and O2-ArU and from the vibrat ional relaxation of 0, by d-o w i t h the following expressions
iog(pT)* = (e*/e14/3 log p 7 +s~(e* /e)~/3 - 11
- 7-1 - -1 -1 -1 - xo2 702-02 + xo ro2-o + XAr 7O2-Ar
where Xi i s the mole f rac t ion of i and rx-y, the relaxation time of x i n the presence of . For the mixtures em loyed, the aver e o f t h e estimated values of k7(= 7 - l M-'? were Y1Ou and 6Xld cm3 mole-' sec' a t 25OO0K and 35OO0K, re- spect ivel . The act ivat ion rate constant, k-7 was estimated from mole-l/R!C$. The r a t e constants f o r e lectronic deactivation, k an3%, were found t o be 4.y1@ and 5.l81@, cm3 molem1 sec-l at 25OO0K and 358OoK, respectively on the assumption tha t one i n one hundred collisions was e f fec t ive for t h i s process, Finally, the radiat ive r a t e constants, klo and kU, were estimated using the re la t ion
exp(- 1970 c a l
k = ~1.l = l oO13X10d c q(v', v") v3(v',vN) (B3)
where q i s the Franck-Condon factor for the t rans i t ion v' -. v" and V i s the wave number, evaluated head in the approximation employed. For both klo and
V I . AcmwLEDGm
kU, 7 - l was data of reference 20 were used i n this evaluation. r
The authors are indebted t o E. A. Meckstroth f o r maintaining the operational standard of the shock tube f a c i l l t y and f o r help i n conducting t h e experiments and t o M. R. Schoonover for h i s assistance i n the computer-code preparation and numeri- c a l calculations. We thank Mr. K. G. P. Ehlzmanu f o r a c r i t i c a l reading of the manuscript. We grateful ly acknowledge support of t h i s work under Contract No. DA-Ol-O21-AMC-I205O(Z), ARPA Order 393, Amendment No. 4 through the U. S. Amy Missile command, Redstone, Arsenal, Alabama.
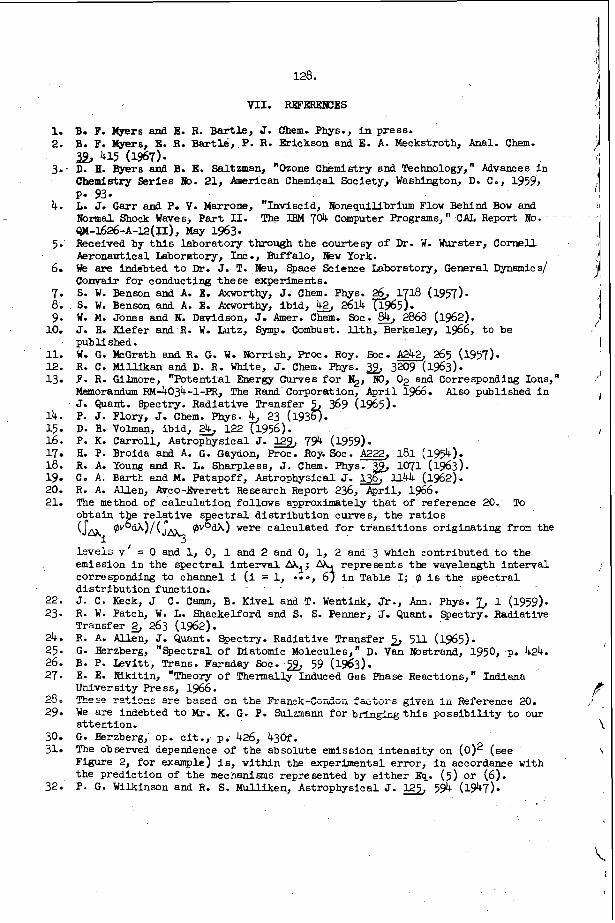
1. 2.
3..
4. -
5-
6.
7. 8. 9.
10.
11. 12. 13
14. 15 16. 17 18. 19 20. 21.
22. 23.
24 25. 26. 27.
_ _ 2R - - 29
30 31
32
128.
VII. FlEFBREICES
B. F. Myers and E. R. B a r t l e , J. Chem. Phys., i n press. B. F. m r s . E. R. Bartle, P. R. Erickson and E. A. Meckstroth, Anal. Chem.
415-(167)* D. H. Byers and B. E. Saltman, "Ozone C h e m i s t r y and Technology," Advances i n Chemist& Series ~. 21, American Chemical Society, Washington, D. C o , 1959,
L. J. G a r r and P. V. Marrone, "Inviscid, knequilibrium Flow Behind BOW and Normal Shock Waves , Par t II. The IBM 704 Computer Programs, " CAL Report No. - -
Received by this laboratory through the courtesy of Dr. W. h s t e r , Cornell Aeronautical Laboratory, h., Buffalo, New York. We are indebted t o Dr. J. T. Neu, Space Science Laboratory, General Dynamics/ Convair for conducting these experiments. S. W. Benson and A. E. Pxworthy, J. Chem. Phys. 26 So W. Benson and A. E. Axworthy, ibid, 5 2614 7$$651. W. M. Jones and N. Davidson, J. h e r . Chem. Soc. $ 2868 (1962). J. H. Kiefer and R. W. Lutz, Symp. Combust. U th , Berkeley, 1966, t o be publl shed. W. G. McGrath and R, G. W. Norrish, Proc. Roy. Soc. R. C. Miulkan and D. R. White, J. Chem. Phys. F. R. Gilmore, "Potential Energy Curves f o r N2, NO, 02 and Corresponding Ions," Memorandum RM-4O34-1-PRJ The Rand Corporation, April 1966, J. Want. Spectry. Radiative Transfer P. J. Flory, J. Chem. phys. 4 23 (1938. D. H. Volman, ibid, & 122 &6). P. K. C a r r o l l , Astrophysical J. a 794 (1959).
P. 93.
~~-1626-~-1.2(11), m y 1963.
1 18 (1957).
265 (1957). 3209 (1963).
Also published i n 369 (1965).
E. P. Broida and A. G. Gaydon, Proc. Roy. Soc.
The method of calculat ion f O l l O W 5 approximately tha t of reference 20. obtain t e re la t ive e c t r a l d i s t r ibu t ion curves, the r a t io s
leve ls vl = 0 and 1, 0, 1 and 2 and 0, 1, 2 and 3 which contributed t o the
- o o J
To
@v 2 dA)/(J- @v 2 dh) were calculated f o r t rans i t ions or iginat ing from the
emission i n the spec t ra l i n t e rva l Mi; corresponding t o channel i (i = 1,
represents the wavelength interval I n Table I; @ i s the spectral
d i s t r ibu t ion function. J. C. Keck, J C. Canm, B. Kivel and T. Wentink, Jr., Ann. Phys. Z, 1 (1959). R. W. Patch, W. L. Shackelford and S. So Penner, J. Quant. Spectry. Radiative Transfer 3 263 (1962). R. A. Allen, J. Quant. Spectry. Radiative Transfer 2 511 (1965). G o Herzberg, "Spectral of Matomic Molecules," D. Van Nostrand, 1950, pe 424. B. P. kv i t t , Trans. Faraday Soc. a 59 (1953). E- E. Nikitin, "Theory of Thermally Induced Gas Phase Reactions," Indiana University h e ss, 1966. ' P h p q p r!a+.(nnc -..a kOISl ,.- &La m _^__ ,--"..->..- _--I---- ->--. ----- -- "..."_" U L "-".-.A "Y "11s E L c & . U L P lrUlLYUU L U f b U L D & l V C L l iu Eefe rece 20. We are indebted t o Mr. K. 0. P. Sulzmann fo r bringing t h i s poss ib i l i t y t o o u r attention. G- Herzberg, op. c i t . , p. 426, 43Of. The observed dependence of the absolute emission in tens i ty on (0)2 (see Figure 2, for example) is, within the experimental error, i n accordance with the prediction o f the mechanisms represented by e i ther Eq. (5) or (6). P. G o Wilkinson and R. S. Mulllken, Astrophysical J. 594 (1947).
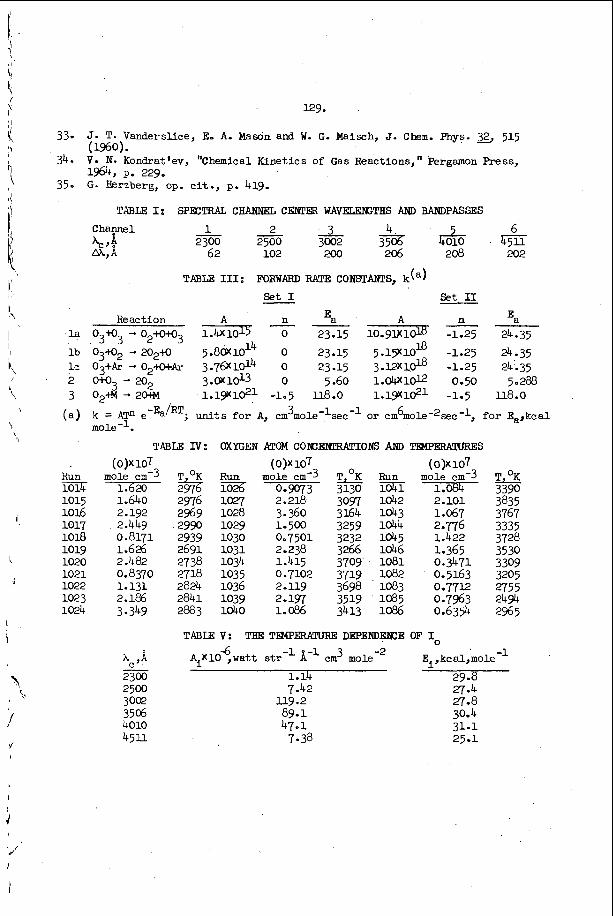
129.
33-
34-
350
J- T. Vanderslice, E. A. Mason and W. G. Maisch, J. Chem. Phys. & 515
V- N- Kondrat'ev, "Chemical Kinetics of Gas Reactions," Pergamon Press, 1964, p. 229. G- &=berg, op. cit., p. 419.
(1960).
T&BLF: I: SPECTRAL ClIANXEL CFXlW WAVEUXTHS AND BANDPASSES Channel
4 A 62 102 200 206 208 202
TABLE 111: FORWARD RATE CONSTANPS, k(a) Set I Set I1 -
Reaction A n Ea A n 'a -- l a 03W3 - 02+oto3 7 23.15 10.guCl&d -1.25 24.35 l b 03+02 - 202+0 5 . 8 W d 4 0 23.15 5.15X1Ol8 -1.25 24.35 IC 03iAr - 02+O+Ar 3.76Xd4 0 23.15 3.12Xd8 -1.25 24-35
3 O2tM-2c+M 1.1gX1s1 -1.5 118.0 l.lgXlgl -1.5 118.0 2 o+03 - 202 3.Wld-3 0 5.60 1.04x1& 0.50 5.288
(a ) k = ATn mole-1.
units for A, ~ r n ~ r n o l e - ~ s e c - ~ or crn6rnole-2sec-1, for Ea,kcal
TABLE IV: OXYGEN ATOM CONXNCRATIONS AM, TEMPERAWRES
(0)x 107 Run mole cm-3
1.620 1015 1.640 1016 2.192
101.8 0.8171 1019 1.626 1020 2.482 1021 0.8370 1022 1.131 1023 2.186 1024 3.349
1017 . 2.449
A ,w 2300 2500 3002 3506 4010 4533
-
2976 2969 2990 2939
2738
2824 2841 2883
2691
2718
Run 1026 1027 1028 1029 1030 1031 1034 103 5 1036 1039 1040
(0)x 107 m o l e cm-3
0.973 2.218 3 360 1.500 0,7501 2.238 1.415
2.ll9 0.7102
2 . q 1,086
(0)x 107 mole cm-3 1.084 2.101 1.067 2.776 1.422 1 - 3 6 0.3471 0.5163 0,7712 0.7963 0*635'+
T,oK 3390 3835 3767 3335 3728 3530 3309 3205 2755 2494 2965
TABLE V: -6
THE TWERATURB DEPENDElCE OF Io
E ,kcal,iole-l -1 8-1 3 -2 i cm mole AiXLO , w a t t str
1.14 29-8 7.42 27.4
89.1 30.4 119.2 27e8
47.1 31.1 7-38 25.1
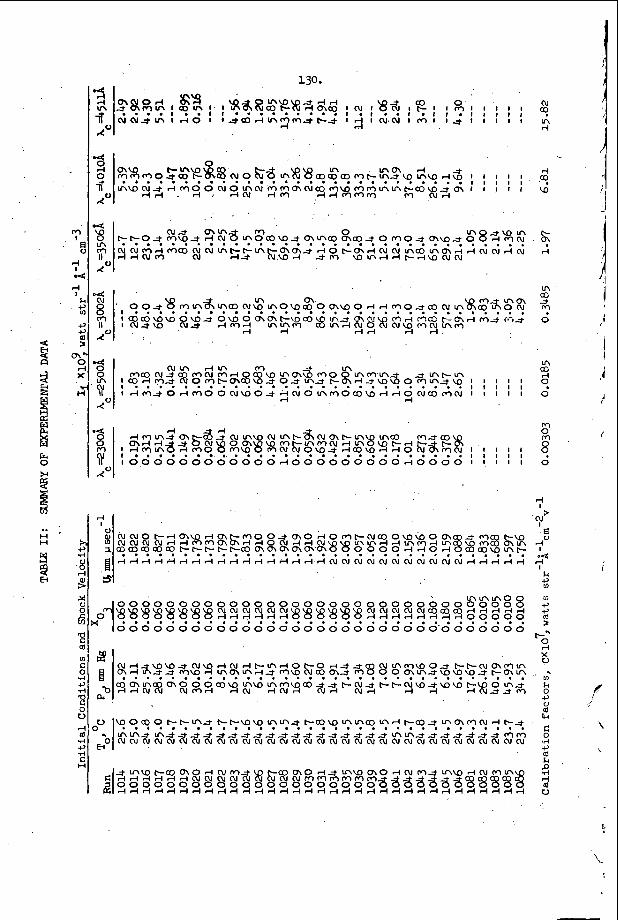
110.
r t l a
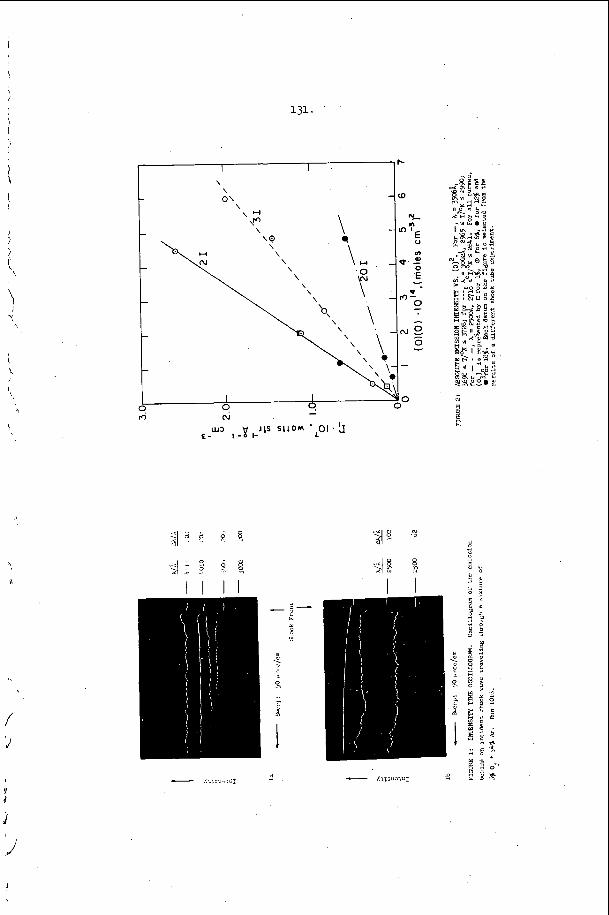
I
\ i
i A
I '\ \
\
i! ll
I I \ 1 \
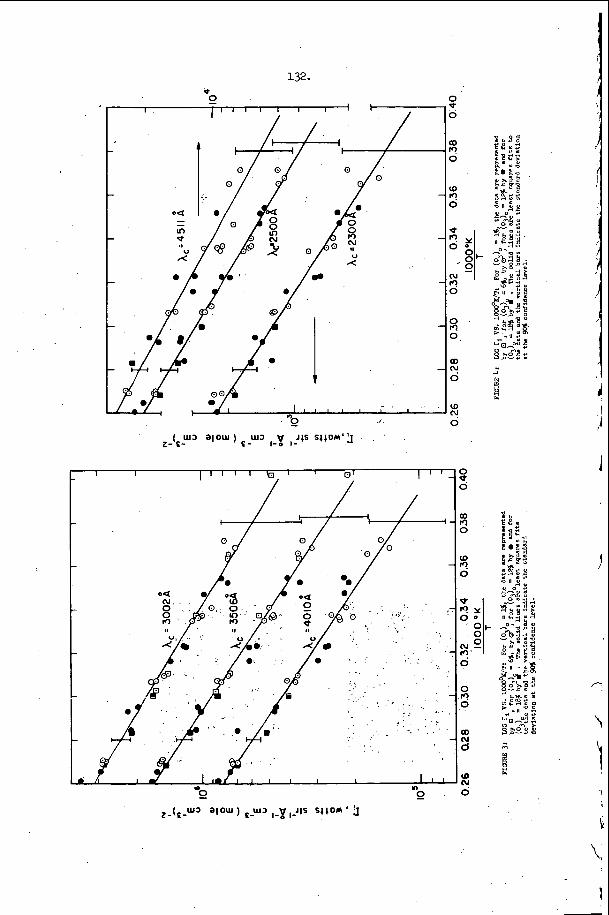
( U 3 a l O U ) IUJ v J(S S((0M’h . 2- E- E- 1-0 l -
” m
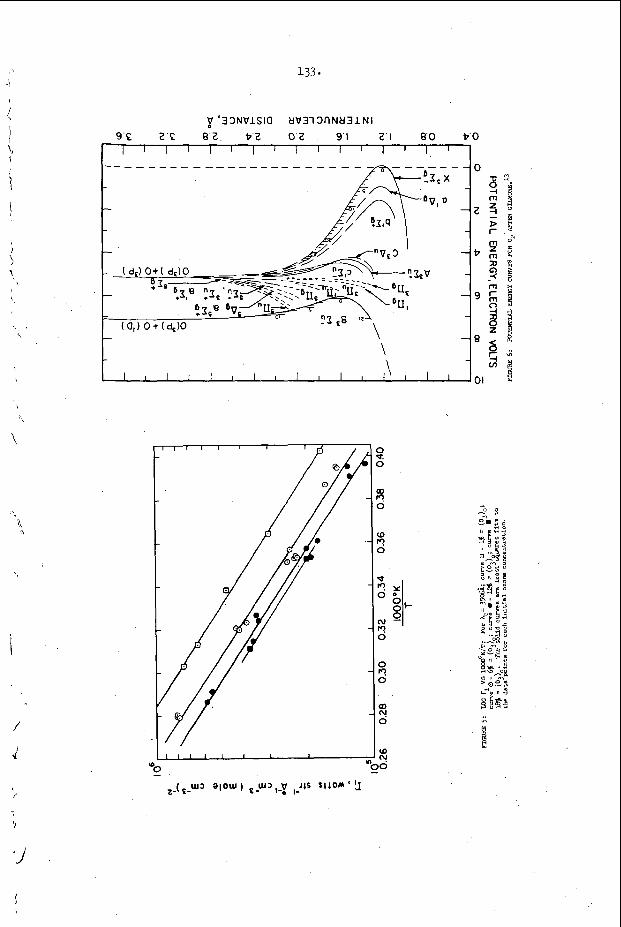
-\
\
\
m r w 8 b. b.
-3
I
,
135. POTENTIAL DESTRUCTIVENESS OF GAS DETONATIONS
J. N. Murphy, N. E. IIanna, D. S. Burgess, and R. W. Van Dolah
Explosives Research Center Bureau of Uines
U. S. Department of the Interior Pittsburgh, Pennsylvania 15213
Background
The potential destructiveness of gas detonations was evaluated in terms of the depth Of earth that could be heaved when various gas mixtures were detonated in long underground excavations. A number of years ago, a spectacular destruction of 26.8 miles of underground pipeline in Texas was ascribed to the occurrence of a detonation. The pipeline had carried crude oil and was being cleaned by forcing a scraper plug along its length with compressed air. It is not known whether the event was a gas detonation or a heterogeneous detonation of a film on the wall.i/ The intermittent cratering that occurred seemed curious but now may be explained in terms of the impulse needed to heave the earth cover. No explanation can be offered for the apparent low velocity of propagation indicated by the total elapsed time. An average velocity of only 296 feet per second was reported.
This investigation primarily covered propane-air, acetylene-air and tdAPg-/air mixtures. In some cases a partial pressure of oxygen greater than In air was employed. Limits of detonability were obtained from plots of propagation velocity versus fuel concentration in a 7-inch diameter by 12-foot long pipe which was closed at both ends. Impulse, which determines the momentum that can be imparted to a load, was measured from pressure versus time transients in a 24-inch diameter by 163-foot long steel pipe that could be closed at one end. The soil mechanical problems related to earth movement were studied in hand-dug tunnels of 3 foot x 5 foot cross-section and 150 feet length incorporating right angle turns and side entries.
Detonation Velocities and Limits of Detonabillty
Fuel/air mixtures were admitted to the 7-inch apparatus of figure 1 by the partial pressure method, recirculated via the sideline for 10 minutes, and sampled for gas chromatographic analysis. A solid explosive initiator ranging from 1.1 grams PETN to 100 grams tetryl was detonated and the velocity of the resulting ionization wave was measured between velocity stations with electronic time-interval meters.
A plot of this wave velocity versus fuel concentration is given in figure 2 for MAPP/air mixtures. Velocities in excess of 1400 meters/sec indicate detonation while velocities of about 1000 meters/sec or less are obtalned from shocks accompanying deflagration. The difference is clearly shown by the pressure traces of figure 3, wherein trace A indicates deflagration with pressure rising over a period of about 25 milliseconds while in trace B the first pressure pulse is the strongest.
Limits of detonabi1it.y as defined by this method are somewhat sensitive to the strength of the initiator. Thus, the detonable range for MAPP/air widens appreciably as the initiator is increased from 1 to 10 grams PETN (table 1). Both propane/air and acetylene/air detonate over the full reported range of flammability when initi- ated with 10 grams PETN.
136. pressuretire Transients and Impulses '
m e major part of the experimental program was carried out using the 24-inch steel tube ehom in figure 4. into the 260 cfm output stream of a gasoline-powered blower, which stream was passed throud~ the tube to give three changes of atmosphere. preaarue measurements were accomplished at five stations spaced evenly along the length of the pipe. at the upstream end of the pipe near the end closure.
Fuel was retered through calibrated spray nozzles
Gas sampling and detonation
Initiation was typically effected with 100 grams tetryl, usually
Pressure transients at the f ve stations were compared with predictions de- dealing with one-dimensional gas detonations. 3 4$ rived from standard reference-
Figure 5 shows the predicted transient for stoichiometric acetylene/air at a point 60 feet from an initiation source at the closed end of a 150-foot long pipe. The peak (C-J) pressure was assumed to be twice the constant volume explosion pressure and this proved to be a fairly accurate assumption for measurements within 2 stations (53 feet) of the initiation. For example, with 7.2 percent MAPP in air, the pre- dicted peak was 281 psig while nine measurements averaged 278 +6 psig. distance from the initiator, peak pressures became progressively m x e erratic as t t m p the detonation were departing from its one-dimensional character.
At greater
The gas expansion behind the C J plane was calculated by Taylor's equations using an equilibrium g a m a which was typically about 1.17. This gave excellent agreement with experimental pressures in the static gas zone, however, the duration of the gas expansion (from D to E in figure 5) was typically underestimated by about 20 percent. Neither this deviation from prediction nor the erratic peak pressures were of any practical consequence to the impulse of the explosion.
The duration of the pressure plateau, Eli in figure 5, was about 20 percent overestimated because no account had been taken of the three-dimensional expansion Of the wave as it emerged from the open end of the pipe; that is, the interval FG in the figure should actually be shorter than indicated and the rarefaction starts back through the pipe at an earlier time than G. Since the dominant factor in the tine interval EH is the velocity of sound in the burned gases, off-stoichiometric mixtures with lower burned gas temperatures had relatively long pressure histories and high impulses. This trend is shown in table 2; note that 4.9 percent W P in air is close to stoichiometric while 3.4 percent W P is the reported lean limit of flammability.
I
Par the same reason, propane/air and gasoline/air mixtures had impulses com- parable to.those of acetylene/air and HAPP/air even though their pressure peaks were lower. Thus, the average of impulses at the 5 pressure stations in 6 MAPP/air detonations was 7.7 psi sec, in'6 propane/air detonations 7.4 psi sec and in 3 gasoline/air detonations 7.5 psi sec.
When both ends of the pipe were open, the pressure plateau was nearly eliminated.
In 7 MAPP/air detonations the average impulse vas only 3.2 psi sec and in 5 This is shown by the transients of figure 6 (compare curves C and D with curves A and B). acetylene/air detonations 3.1 psi sec. Even a partial temporary closure, as exempli- fied by loose-fitting sandhngs in the ends Ur' i i ie pipe, brought the average impulse (for 7.2 percent YAPP/air) back to about 6.3 psi sec.
No particular difference in average impulse could be detected as a result of initiating the detonation at the longitudinal midpoint of the tube or simultaneously at the two ends.
I
1 137 *
I was deposited on the walls) could participate in the post-detonative reactions to
, apparent part in the explosion.
1 In the dry-walled steel tube, suspended aluminum powder (even though much of it
give about 50 percent greater impulse. But in dirt tunnels, the powder was collected on the damp walls and played no
Comparative values are given in table 3. i I
, Destructiveness of Gas Detonations to Earthen Structures
In field tests, a surprising fraction, usually 50-100 percent, of the impulse of the explosion was converted into motnentum of the overburden. This means that soil mechanical factors such as plasticity and shear strength were unimportant so that the overburden was behaving essentially as a frictionless piston. When the earth velocity was made to exceed 20 ft/sec, as measured at ground level by Fastax photography, the tunnel usually failed. Because of the weakness of end closures, as compared with an end plate on a steel pipe, the largest impulse attained in the field was about 6 psi sec and the greatest depth of burden defeated by a single gas detona- tion was 8 feet.
REFERENCES
1/ Armistead, George, Jr. - - 2/ MAPP is a commercial mixture of methylacetylene, propadiene and propylene. - 3/ Zeldovich, Ya. B., and A. 5 . Kompaneets, "Theory of Detonation," Academic Press,
- 4/ Taylor, G. I., "The Dynamics of the Combustion Products behind Plane and Spherical
Safety in Petroleum Refining and Related Industries, 1 ) 2nd Edition, Simmonds, N. Y., 1959, p. 43.
1 New York, N. Y., 1960. 1
Detonation Fronts in Explosives," Proc. Roy. Soc., v. 200, 1950, p. 285.
I
\
\ '\
138.
TABLE 1. - Limits of Flammability and of Detonabilitp
Mixture Initiator Flammable Range Detonable Range
-- Propane/air Spark 2.1 - 9.5% lo g PETN
10 g PETN -- 2.0 - lorn
lo g PETN
2.2 - 9.2% -- -- Ace tylene/air Spark 2.5 - 100%
W P / a i r Spark 3.4 - l 0 . W -- 1 g PETN -- 4.1 - 7.6%
2.4 - 13.7% -- *Hembree,,J. O., et al, Welding Journal, May 1963.
TABLE 2. - Plateau Durations, Plateau Pressures, and Impulses of MAPP/Air Detonations in 24" Diameter by 163' Long Steel Tube with Initiation End Closed
YAPP Plateau Duration (milliseconds) Averaged
(%) #1 #2 #3 #4 #5 Pressure (psig) (psi sec)
3.4 71 54 35 12 2 85 6.8 4.9 58 46 32 15 -- 103 8.9 6.1 64 49 35 14 -- 98 8.3 8.7 64 52 33 14 -- 99 7.8
Concentration at Instrument Stations Plateau Impulse
TABLE 3. - Impulses Obtained in Detonations in the Steel Tunnel with and without Added Aluminum Powder
Gaseous Closure of Aluminum Impulse Fuel Initiation End (#422) (psi sec)*
Acetylene Acetylene Acetylene Acetylene
Open
Closed Closed
open None 3.0, 3.9 2 lbs on floor 4.5 None - 3.9 2 lbs on floor 6.5
MAPP Open None 3.4 YAPP Open 2 lbs suspended 5.6 MAPP Closed None 4.3 W P Closed . 2 lbs on Zloor 6.6
*As measured at a station close to the open downstream end of the tunnel.
a
2 1800.
1600. 8 a,
L
aJ 0. 2 1400. aJ 4-
2 1200’
C 1000’ s - >
I-
I;‘ 8 0 0 .
139.
Velocity stations
W > 600- U ’ 400
Clrculating
G a s inlet
Vacuum pump
Primer- 10 grams P E T N -
I 1 I I I I I I
FIGURE 1 . - LABORATORY DETONATION TUBE.
2000 1 I 1 I I I I I I I
- 0 0
FIGURE 2 . - DETONABLE LIMITS OF MAPP/AIR
140.
K a 100-
FIGURE 3 . - PRESSURE TRANSIENTS I N CLDSED CHAMBER A . Deflagration B . Detonation
p- 163 feet
!
- DETAIL A
FIGURE 4 . - LARGE DETONATION TUBE (2 x 163 F E E T ) .
4.
io
who '3YnSS3Yd
J
4 I
;I
142. INITIATION OF CONDENSH) EXPLOSIVES BY GAS DETONATION'
Y. L. Weiss, T. J. Schellinger, and E. L. Litchfield
Explosives Research Center Bureau of Mines
U. S. Department of the Interior Pittsburgh, Pennsylvania 15213
Introduction
There are two ways in which stimuli may induce detonation in secondary explo- sives. A strong shock may cause detonation with an induction time of a few micro- seconds, i.e., time intervals of a few microseconds between application of the stimulus and the appearance of detonation. ulus may initiate reactions that begin as a deflagration and accelerate to detonation. The acceleration of the reaction occurs as a consequence of increasing pressure, or self-pressurization, produced by the hot, gaseous decomposition products. Mainte- nance of pressure for periods of 10's to 100's of microseconds, as may be required to obtain detonation from weak initiation stimuli, is achieved by confinement of the explosive sample.
A weaker shock or a purely thermal stim-
Although such confinement is usually provided by high-strength metallic con- tainers, for short periods of time it can also be a consequence of inertial effects. If low-strength confinement surrounds the explosive sample the acceleration of the confinement material is directly proportional to the pressure seen by the explosive sample and inversely proportional to the confinement mass per unit area of explo- sive sample. At early times, the expansion and escape of product gases are limited by the low velocity of expansion of the container and self-pressurization of an explosive sample may be maintained for considerable periods. Inertial confinement, or self-confinement might be provided by a large pile of explosive to a reaction initiated within the interior of the pile.
Examples of the first type of stimulus are initiation by other condensed phase explosives and by projectile impact. Initiation of detonation in condensed explo- sives has been studied using strong shocks across air gaps1 or through inert barriers2 l3 and by determining projectile impact initiation parameter^.^^^ r6 Threshold initiation shock pressures for condensed explosives range from 1 to 100 kbar. An example of the second type of stimulus is that of thermal ignition transforming to detonation in the conf ined explosive. 9 8
This paper describes results obtained with an initiation source producing a stimulus that is continuously variable from less than that required to ignite explo- sive flours to more than that required to detonate pressed pellets. The initiation source is the detonation wave produced in gaseous mixtures of stoichiometric ethylene- oxygen (C2E4 + 3 02).
Until recently, gas detonation waves free from incandescent solid debris had tn tw nhteinet! by ri~y-:; i~ 2 dets-atizr :,5e.9.1ns11,12 unattractive, inconvenient in use, or restricted in use by the run-up characteristics of the gaseous mixture. In Bureau of Mines' studies, gas detonations have been obtained without run-up in a detonation tube and without explosive det0nat0rs.l~
such tubes were economicaiiy
One possible difference between the shock from a projectile and the gas detonation shock is the difference between a "cold" and a "hot" shock. In the first case, tem- perature increase in the condensed explosive sample is entirely a consequence of mechanical interactions and conversion of translational energy Into heat. second case, there is additional thermal energy in the hot ethylene-oxygen combustion
In the
143. products. Phenomenological analysis and experimental results indicate that the transport from the hot gases is negligible when the explosive is initiated within 1 p sec.
Experimental Procedures
The test container was a 17.8 cm length of 1-inch schedule 80 pipe, reamed to an inside diameter of 2.54 cm. Explosive samples were positioned at one end of the tube and the wires to initiate the gas detonation were positioned near the other end.
The detonable gas mixture was 25 percent ethylene and 75 percent oxygen as determined by partial pressures. Gases were injected into the evacuated chamber through 1/16-inch orifice fittings for mechanical mixing and 20 minutes was allowed for additional diffusional mixing. Gases were from commercial cylinders and were used without further treatment. Initial pressures of the prepared gas mixture were from 3 to 85 atm gage. Initial pressures less than 3 atm were obtained by reducing a 3-atm mixture to the desired pressure.
To initiate the gas, a 0.15 mm (No. 35 B&S) copper wire, 2 cm long, was exploded with the discharge from a 1.5 pf condenser charged to 5.5 kv or more (25 joules energy, or more) using a hydrogen thyratron switch. Control trials in which the wire was exploded with inert gas plus condensed explosive gave no evidence of debris impingement or reaction of the explosive.
Representative particle size analyses of the floured or granulated materials are given in table 1. Particle sizes and distributions under the test conditions may have been slightly different. Gas was injected through orifices to produce turbulent, circulatory gas mixing. This injection must have disturbed the surfaces of the unpressed samples with some increase of "fines" occurring at the top of the sample.
The unpressed flour or granulated samples were prepared by pouring a standard weight of material into the test vessel and tapping lightly to level the sample surface. Standard weights were: 10 gm PETN,* 10 gm RDX,** 13.2 gm tetryl,*** or 14 gm Composition A5.**** Direct determinations of possible densities in the tested charges of floured or granulated explosive have given: for PETN - 0.40 to 0.69 gm/cc; for neat RDX - 0.67 to 0.91 gm/cc; for Composition A5 - 0.93 to 1.02 gm/cc; and for tetryl - 0.93 to 1.14 gm/cc. As initially prepared in the test vessel, densities were near the larger figure in all cases and these are the numbers quoted in the tables. The particle size distributions of table 1 imply adequate porosity to permit pressure equilibration within the floured or granulated sample by gas flow during loading of the detonable gas mixture. Thus, the gas charging pressure would not affect, per se, the density of the charges. As was the case with particle size data, the effect of the gas jet mixing action upon the charge density is not known.
Pellets of Composition A5 and of tetryl were prepar=d and tested at pellet densities of 1.6 gm/cc and 1.4 gm/cc. Pellets of PETN + 1 percent graphite were tested at densities of 1.6 gm/cc. All pellets were 1 inch long. Comparative tests of P E m and PETN + 1 percent graphite, both in flour form, did not reveal any noticeable difference in sensitivity resulting from the graphite addition.
* Pentaerythritol tetranitrate. ** Cyciotrlmrthylenetrlnltramlne (hexahydro-1,3,5 trinitro-s-trlazlne). *** 2,4,6-trinitrophenylmethylnitramine. **** RDX + 1% stearic acid coating material.
144. Yeasurenents were made-of the pressure-time history at the initial explosive
surface until detonation, location of first appearance of significant reaction, and the propagation velocity on the axis. pressure transducers14 and continuous wire probes. l5
, The resistive transducer was a composition resistor of 0.1 watt rating. The variation of resistance w i t h loading pressure has been established in Bureau of Mines investigations .I4 The approximate constancy of the calibration over periods of about 100 psec after applicatiaq of the gas detonation shock stimulus has been established in one inatance by direct comparison with strain gage measurements. This result provides justification for reading a "pressure at detonation" at the time that
These data were obtained from resistive
I
detonation is shown by the velocity probe. /
The wire probe consisted of a fine, nichrome axial wire helically wound with a nylon filament for insulation from the surrounding, collapsible alminum tube.
cation of the physical location of the shorting pofnt. Rates of change of the probe resistance were proportional to the velocities of the pressure front. For trials at charging pressures greater than 14 atm gage, the probe record displayed the tine- position loci in both the gaseous and the solid phases. I
Collapse of the aluminum tube altered the probe resistance and gave a direct indi- /
Results
The explosive flours or granules were observed to react in three different ways depending upon the explosive and the gas charging pressure. At higher gas charging pressures, supersonic reaction was induced with a time delay 5 1 microsecond. At lower pressures, significant chemical reaction was evident only after a delay of several microseconds and detonation commenced at some distance below the original surface of the explosive sample. At still lower pressures, granular tetryl or Composition A5 was not initiated to self-sustaining chemical reactions even though a portion of the sample might have been consumed in the test.
Test results are summarized in table 2 where charging pressures are given for the reaction modes of the several samples. PETN flour samples at a density of 0.7 g d c c required.detonable gas mixture charging pressures of 20 atm, gage, to initiate detonation with induction times 5 1 psec. At charging pressures of 0 atm gage the flour was initiated to lower order reaction and transited to detonation after con- siderable delay (_>200 psec). charging pressures of 85 atm gage to produce detonation within 1 psec of the impact
gm/cc PETN pellet was not initiated to self-sustaining reaction,
When pressed to a density of 1.6 gm/cc, PETN required
' of the detonation wave. At charging pressures less than about 9 atm gage, the 1.6
The initiation sensitivity for RDX and tetryl rrlso reduced with increasing density as would be expected. In the unpressed, flour or granule form the ordering of the sensitivities, S, is
spEm [p= 0 . 7 gm/cc] >sm [p= 0.9 gm/cc] "t e t ry 1 [p' 1.0 p/cc] ;
this ordering appears applicable to both the production of detonation with 5 1 Psec deiay ana to the feii i i ie to prcxh~e P self-sustained reaction. sensitivities appears to apply when pressed pellets of nearly equal density are compared; and is the same ordering as found by drop-weight impact16 and by projectile impact .6
The same ordering of
The detonation velocities observed in the present tests were similar to those reported b Yitche1l.lil With a gas charging pressure of 2 atn gage, PETN flour was initiated to a velocity of 3.5 mm/ psec after a delay of 4 vsec; 8 psec later this velocity accelerated to the stable value, 4.8 ma/psec. When RDX flour was initiated to
Hampdon and Stresaul' with the qualifications noted by Jones and
\
I'
145. detonation with 12 atm gage gas charging pressure, the initial velocity was about 2.6 mm/psec; after 4psec, acceleration to the stable velocity, 5.4 mm/psec, occurred. With 2 atm gage charging pressure, a subsonic reaction rate of 0.3 mm/psec in the RDX accelerated to the stable value, 5.4 mm/Psec, after 30Psec. With 16 atm gage, tetryl flour was initiated at a velocity of 2.8 arm/psec, and with 6 atm gage, 1.55 rmn/psec was observed. Acceleration to the stable, high rate of 5.3 mm/psec did not occur. This result is presumed to be a consequence of the dimensions of the explosive sample.18
When detonation occurs after induction times of several microseconds, it is to be expected that details of the hot gas-solid explosive-confinement interactions are important in determination of the course of the reaction. It was observed that after the initial pressure pulse impingement, the pressure remained nearly constant for several microseconds and then increased at a high rate. The high rate of pressure increase is seen first as a series of spikes probably due to individual pressure wave interactions followed by an approximately exponential rise to quite high values of pressure. The high values of pressure in the container following the exponential rise are of the same order as detonation wave pressures to be expected in the condensed sample.
Associated with incidence of the approximately exponential rate of increase in pressure, was an increased rate of propagation as shown by the velocity-probe. Comparison of records obtained with various initial gas charging pressures showed that the pressure at appearance of the high rate could be correlated with the explo- sive density and with the explosive type. As an example, with PETN flour and a charging pressure of 0.7 atm gage, the induction time was 24 psec and the vessel pressure at appearance of detonation was about 2 kbar. With the same type of explo- sive sample but a charging pressure of 20 atm gage, the induction time was about 1 p sec and the pressure in the vessel at appearance of detonation was again about 2 kbar. This type of observation of a critical pressure for the occurrence of detonation is supported by the results of Price, Wehner, and Roberson.'l
Table 3 compares pressures for the appearance of detonation as determined in this study, to the shock pressure required to initiate unconfined charges as given by, or derived from, the results of o t h e r C ' i n v e s t i g a t i ~ n s . ~ ' ~ * ~ * ~ ~ ~ ~ conformity of measured values from such diverse techniques strongly suggests that the tabulated pressures are indeed critical pressures for the occurrence of deto- nation. The individual values of table 3 and of table 4 are offered as represent- ative data. Additional experience with the sensors and additional experimental data are required before the results are considered to be more than semiquantita- tive.
The reasonable
Application of Results to a Large-Pile of Explosives Under Conflagration Conditions
A. Assumed Stimulus is a Gas Detonation External to the Pile
The stoichiometric mixture of ethylene and oxygen must be charged to pressures of 20, 26, or 26 atmospheres respectively in order that the gas detonation be able to induce detonation in PETN, RDX, or tetryl flours with delay times of about 1
Buildings, bins, or containers capable of withstanding more than 275 pslg are economically and architecturally incompatible with the storage of tons of explosives.
psec.
Concern, then, is entirely with pressures of approximately zero psig for such a detonable gas mixture. Table 4 summarizes induction times as functions of detonable mixture charging pressure for F'ETN and RDX. was not initiated to detonation at charging pressures below 3 atm gage.) Induction times of PETN and RDX, at 1 atm charging pressure, are 2200 and 250 W e c respec- tively.
(According to table 1, tetryl
Detonations produced in sufficiently large external volumes of gas could
146. m i n t a i n the gas stimulus a t t h e explosive sur face f o r these, o r longer,. periods of tireao but such "gas detonation confinement" would not support the r e l a t ive ly slow buildup of pressure to values i n excess of the c r i t i c a l pressure f o r appearance of detonatian (more than 28,000 psi). One test with 1.1 g d c c , Composition A5 explo- s i v e showed t r a n s i t i o n d i r e c t l y from a leve l of about 2000 ps ig i n the container without observable pressure nm-up i n the gas phase c lose to the explosive surface. Hmever, 2000 psig is beyond t h e range of sustained pressures ava i lab le from an unconfined gas detonation. ir
It is thue improbable that an ex terna l , unconfined, gas detonation would cause \ d i r e c t i n i t i a t i o n of a l a rge p i l e of f l o u r explosives of the types tes ted . gas detonation were to produce fragments having ve loc i t i e s of 300 m/sec or more6 such fragments m i g h t produce detonation i n the l a rge p i l e . p r o j e c t i l e i n i t i a t i o n a r e not s u f f i c i e n t l y complete to permit numerical prediction
I f the , - I
Existing data on
of gas volume versus p r o j e c t i l e s i z e and ve loc i ty re la t ionships . ;\
B. Assumed Stimulus is In t e rna l t o the Large P i l e of Explosives
Peak pressure i n the r e f l ec t ed gas detonation wave, of these s tud ie s , a t 0 psig is believed t o be less than 0.2 kbar; the Chapmen-Jouguet pressure is even lower, of course. In v i e r of the appreciable d i f fe rence between these pressures and the c r i t i c a l pressure required f o r appearance of detonation i n the condensed phase, i t is probable that the i n i t i a t i o n sequence is t h a t of ign i t ion of the explosive p a r t i c l e s and then se l f -pressur iza t ion of the test vessel by the decomposition pro- ducts. The exact mechanism by which deflagration of the explosive pa r t i c l e s i s i n i t i a t e d , whether by an enthalpy wave, by an in t e rna l autoignition of "cook off" gases, or by an ex terna l flame, is not of pa r t i cu la r importance. The important question is whether or not adequate confinement i s provided t o permit the pres- su r i za t ion t o occur. Two circumstances can be postulated t o provide the necessary confinement by an explosive pile--collapse of a cavity formed by erosion, or enfoldntent of burning p a r t i c l e s by a s l id ing p i l e . Because of lack of knowledge about u l lage space--induction t i m e re la t ionships and because of the complicated dynamics of the mechanical co l lapse or enfoldment, i t is not presently possible to d iscuss these circumstances i n d e t a i l . I t may be of academic i n t e r e s t to note I
t h a t r i g i d collapse of a 5-meterhigh p i l e of material having a sonic velocity of 2000 m/sec would provide nea r ly r i g i d confinement f o r a time of 200 Psec .
Summary and Conclusions
Gas detonations generated i n stoichiometric ethylene-oxygen mixtures have been used to produce detonations in PETN, RDX, and t e t r y l explosive. The explosive has been tes ted both a s a f l o u r and a s pressed p e l l e t s . The experimental r e su l t s suggest the existence of a c r i t i c a l pressure f o r t he appearance of detonation i n the condensed explosive. Induction time does not have a s t rong e f f e c t upon the induction pressure-the pressure t o which the explosive is subject a t the time of appearance of detonation. These induction pressures were sens i t i ve t o explosive type, dens i ty , and p a r t i c l e size. From these r e s u l t s , i t has been deduced tha t a gas detonation cannot produce detonation of a la rge p i l e of these materials without
gra ins .
Induction pressures f o r the tea ted f lou r s or granules of PETN, RDX, and t e t r y l were 2 , 3, and 3 kbar respectively. In pressed pellets, pressures for appearance of detonation were: 13 kbar f o r 1 .6 gm/cc PETN; 12 kbar for 1.4 g d c c Composition A 5 ; 16 kbar f o r 1.6 gm/cc Composition A5; 16 kbar for 1.4 gm/cc t e t r y l ; and 20 kbar f o r 1 .6 gm/cc t e t r y l .
t he in t e rpos i t i on of some ac t ion producing confinement of the ignited explosive .' The reqnisite cs=fise=eii: ciiiiiiot bo provided by an unconfined gas detonation.
\
I
i
1.
2.
3.
4.
5.
6.
7 .
8.
9.
10.
11.
12.
13.
14.
15.
147. References
Sultanoff, M., V. Y. Boyle, and J. Paszek. Shock Induced Sympathetic Detonation In Solid Explosive Charges. Third Symposium on Detonation, September 1960, Princeton, New Jersey, Office of Naval Research Symposium Report ACR-52, v. 2, pp. 520-533.
Seay, G. E., and L. B. Seely, Jr. Initiation of a Low-Density PETN Pressing by a Plane Shock Wave. J. Appl. Phys., v. 32, 1961, pp. 1092-1097.
Campbell, A. W., W. C. Davis, J. B. Ramsey, and J. R. Travis. Shock Initia- tion of Solid Explosives. Phys. of Fluids, No. 4, 1961, pp. 511-521.
LeRoux, A. Detonation of Explosives Through the Shock of a Solid Body Launched at High Velocity. Mem. Poudres, v. 33, 1951, pp. 283-321.
Eldh, D., P. A. Persson, B. Ohlin, C. H . Johansson, S. Ljungberg, and T. Sjolin. Shooting Test with Plane Impact Surface for Determining the Sensitivity of Explosives. Explosivstoffe, v. 5, May 1963, pp. 97-103.
Weiss, M. L., and E. L. Litchfield. Projectile Impact Initiation of Con- densed Explosives. Bur. Mines Rept. Investigations 6986, 1967, 17 pp.
Price, Donna, J. F. Wehner, and G. E. Roberson. Transition from Slow Burning to Detonation. Further Studies of the Free Volume and the Low Velocity Regime in Cast Pentolite. Naval Ordnance Laboratory Tech. Rept. 63-18, February 1963, 33 PP.
Price, Donna, and F. J. Petrone. Detonation Initiated by High Pressure Gas Loading of a Solid Explosive. Naval Ordnance Laboratory Tech. Rept. 63-103, April 1963, 18 pp.
Andreev, K. K., and V. P. Maslov. Action of Gas Explosion on Solid Explosives. Comptes Rendus (Doklady) de 1'Acad. Sci. (URSS), X X V , v. 195, 1939, pp. 195- 197.
Gordeev, V. E., A. I. Serbinov, Ya. K. Troshin, G. I. Filatov. Initiation of the Explosive Conversion of Condensed Explosives by Gaseous Detonation. Com- bustion, Explosion, and Shock Waves, v. 1, No. 2, 1965, pp. 7-13.
Makomaski, A. H. Preliminary One-Dimensional Investigation of the Initiation of Low-Density PETN by Hydrogen-Oxygen Detonation Waves. Univ. of Toronto Inst. of Aerospace Studies Tech. Note 83, February 1965, 24 pp.
Cook, M. A., and F. A. Oleon. Chemical Reactions in Propellant Ignition. AIChE Jour., v. 1, 1955, pp. 391-400.
Litchfield, E. L., Y. H. Hay, and D. R. Forshey. Direct Electrical Initiation of Freely Expanding Gaseous Detonation Waves. Ninth Symposium (International) on Combustion. Academic Press, Inc.,'New York, N. Y., 1963, pp. 282-286.
Watson, R. Gage for Measuring Shock Pressure. Rev. Sci. Instruments, in press.
Gibson, F. C., Y. L. Boawer, and C. M. Mason. Method for the Study of Deflagration to Detonation. Rev. Sci. Instruments, v. 30, 1959, pp. 916-919.
16.
17.
18.
19.
20.
148. Copp, J. L. , 8 . P. Napier, T. Nash, W.- J. Powell, 8 . Shelby, A. R. Ubbelohde, and P. Woodhead. The Sensitiveness of Explosives. Phil. Trans. Roy. SOC., P. A-241, 1949, pp. 197-298.
Hampdon, L. E., and R. E. Stresau. Small Scale Technique for Measurement of Detonation Velocities. NAVORD Report 2282, December 27, 1951.
Jones, E., and D. Mitchell. Spread of Detonation in High Explosives. Nature, v. 161, 1948, pp. 98-99.
Coleburn, N. L., and T. P. Liddiard, Jr. Hugoniot Equations of State of Several Unreacted Explosives. Jour. of Chem. Phys., v. 44, March 1966, pp. 1929-1936.
Kufer, John E. Air Blast Predictions for Operation Distant Plain. Ballistics Research Laboratory Tech. Note 1612, Aberdeen Proving Ground, Maryland, June 1966.
,
1 \
I
TABLE 1. - Particle size distributions of explosive flours or granules
Particle size range R, microns PETN RD& RDX- 2/ Tetryl
Percent of sample in range
710<R 350 < R < 710 105 <R < 350 74<R<105 R <74
7 2 1 14 81 20 85 79 7 63 13 6 0 2 1 0 0 15 0 2
Aheat RDX. z/RDX + 1% stearic acid (Compositlon A5).
TABLE 2. - Threshold charging pressures of stoichiometric ethylene-oxygen mixtures to produce gas detona- tion initiation of detonation in PETN, RDX, and tetryl
I Detonation with Density, - < 1 P sec delay, No detonation
Explosive gldcc atm gage atm gage
'\
\
PETN PEd' RDX R D x q R D g / RDXA/ Tetryl Tetryl Tetryl
0.7 1.60
.9 1.1 1.40 1.64 1.0 1.39 1.57
20 85 26 80 04
> 84 26
> 85 > 85
< O - 3/ 9
< O 8
- 3/ 15 - 3/ 39 - 3/ 3 - 3/ 39 - 3/ 67
I
- 1/ 1% graphite added. 2/ 1% stearic acid added. 3/ Average from lowest value for detonation and highest value for no - -
detonation.
I
TABLE 3. -
150.
Comparison of minimum shock pressures for initiation of explosive cmpounds by gas detonation or for initiation
with the indicated stimulus
' Density, Shock Pressure, Source l d c c Type of Stimulus kbar . - 1
PETN - This work 0.7 Gas detonation - 1/ 2.1 f: 0.3 LeRoux 8eay and Seely Weiss and Litchfield Eldh and coworkers This work
Weiss and Litchfield This work LeRoux This work This work This work Weiss and Li tchf ield Eldh and coworkers
0.7 1 .o 1.48 1.53 1.60
0.8 .9
1.0 1 ..1 1.40 1.64 1.62 1.65
Projectile impact Plane shock wave Projectile Impact Projectile impact Gas detonation
mx - Projectile impact Gas detonation Projectile impact Gas detonation Gas detonation Gas detonation Projectile impact Projectile impact
- 2/ 2.0
- 2/11.0
2.5 '
1 11.0
,r / i
- 1L13.3 -+ 0.5
3.0
2/ 3.0
12.
21 .o
- 1/ 3.1 2 0.4
3.4 2 0.5 -
1/16. 2 1 - I
- 2/22 .o Tetryl
This work 1.0 Gas detonation - 3/ 3. Weiss and Litchi ield 1.00 Projectile impact 3.5 LeRoux 1.00 Projectile impact - 2/ 3.5 Weiss and Litchfield 1.57 Projectile impact 19.0
Eldh and coworkers 1.65 Projectile impact - 2/22 .o
This work 1.39 Gas detonation - 3/11.
This work 1.57 Gas detonatim 13.
- 1/ Mean and estimated standard deviation per observation. - 2/ These values calculated by the authors from projectile velocity
data of other investigators. - 3/ For low-velocity detonation.
/-
151.
TABLE 4. - Summary of parameters for initiation of flour and pelletized explosive compounds by gas detonation
Container Charging pressure Induction
Density pressure, at detonation, time, Explosive gm/cc atm gage kbar p sec
PETN PETN PETN PETN PETN PETN PETN PETN PETN
RDX RDX RDX RDX RDX RDX RDX RDX RDXY RDXJ/ RDXJ/ RDXA/ RDXJ/ RDXJ/ RDXJ/ RDXJ/ RDXJ/ RDXi/
0.7 .7 .7 .7 .7 .7 .7
1.60 1.60
0.9 .9 .9 .9 .9 . 9 .9 .9
1.1 1.1 1.1 1.1 1.1 1.1 1.40 1.40 1.64 1.64
0.0 0.7 1.0 1.7 2.1 3.1 20.0 54.0 85.0
0.0 1.0 1.4 1.7 3.1 5.9 20.0 26.0 11.2 11.2 27.2 40.4 58.0 80.0 50.0 84.0 57.0 82.0
-- 2.2
-- 3.3 2.9 6.0 4.0 3.1 3.0 3.4 -- -- 12.5 17.0 15.0
>200 28 8 5 4 6 1 4 1
>270 50 56 28 12 5.7 4 1 70 72 36 16 7 1 7 1 14 4
-
-
- 1/ Rm[ + 1% stearic acid (Composition A5).
152.
EXPLOSIVE BEHAVIOR OF AMMONIUM PERCHLORATE
Donna Price, A. R. Clairmont, Jr., and I. Jaffe
0. S. NAVAL ORDNANCE LABOFtATOKY ’ White Oak, Si lve r Spring, Maryland
The inorganic oxld%zer, ammonium perchlorate ( A P ) , i s widely used as a major propellant ingredient. It is, i n addition, a very in t e re s t - ing hlgh explosive because i t s behavior differs markedly from that of conventional explosives such as TNT. explosives q c h exhlbit more ideal detonation behavior a t hlgh than at low porosity. No member of this group has been studied very systemati- cally; only a careful invest lgat ion of t yp ica l members w i l l enable u s t o understand these mater la ls at l e a s t as well as w e understand more con- ventional explosives. Because AP seems a representative group member, bemuse it l e -treque?l+,ly w e d as a propellant empaneat, an& because it has been extensively s tudied I n the related f i e l d s of thermal decomposi- t i o n and combustion, we have started a systematic study of i t s explosive behavior. f r o m our recent work.
AP i s a member of a group of
The purpose of this paper i s t o report the r e s u l t s obtained
The detgnation of AP has been studied before, chief ly by Andersen But t h e i r data had too much sca t te r , and d id not extend and Pesante.
s u f f i c i e n t l y far i n t o the hlgh charge density region t o demonstrate the d i s t i n c t i v e explosive behavior defined by the present r e su l t s . That behavior i s typified by a detonabi l i ty l imit curve along which c r i t i c a l density increases with c r i t i c a l diameter, and a f i n i t e diameter detona- t i o n veloci ty which Is not uniquely defined by loading density, i.e., which exhibits a non-linear curve w i t h a maximum i n the detonation velocity.
EXPERIMENTAL
- A l l ammonium perchlorate used was propellant grade; it contained 0.2 t o 1$ tr icalcium phosphate. weight-median p a r t i c l e s i z e s of 10, 25, and 200 p, respectively. For charge preparation, the material was dried a t 50°C f o r four hours o r longer and packed i n ce l lu lose ace t a t e envelopes t o form 20.32 cm-long cylinders of 1.90 t o 7.62 cm diameter. Compacting was by hand, by hy- drau l i c press, or by i s o s t a t i c press (followed by machining t o s ize) , according t o the charge densi ty desired and the g r a i n s i z e of the per- chlorate. A l l low densi ty charges were f i r e d almost immediately a f t e r preparation t o avoid the formation of small cracks and column separation, phenomena whlch occur w i t h aging.
The best q u a l i t y charges were, of course, those prepared i n the i s o s t a t i c press from the 10 material. chlorate Increased or as the charge density ( p o ) decreased, charge qua l i t y became poorer. A t po 1 g/cc, the charges were of such poor qual i ty that only a few small diameter charges prepared from the 10 I.L material w e r e accepted f o r firing.
The charges were f i r e d i n the experimental setup of Fig. 1 w i t h either t e t r y l or pen to l i t e boosters. A 70 mm smear camera was used t o record the flasher enhanced luminosity of t h e react ion front . The cam- era was used at a wri t ing speed of between 1 and 3 mm/psec t o obtain a
The th ree l o t s of perchlorate had
As the g ra in s i z e of the per-
153 smear t race of the disturbance a t 45" t o the base of the f i l m .
The smear camera photographs were of excellent quality, and deto- nation velocity was determined from the slope of the trace, i.e., by a l e a s t square fit of the l i n e a r distance - t i m e data. For the lowest resolution, the maximum e r r o r estimated f rom e r r o r in reading these records i s 1.5s. In over a dozen repl icat ions the maximum deviation was also 1.5%; the mean precision was 0.7s.
RESULTS AND DISCUSSION
Failiw Reactions
The first in t e re s t ing r e s u l t of t h i s work I s that charges of ammo- nium perchlorate (of any g ra in s i z e ) when subc r i t i ca l a r e nevertheless capable of showing fading but vigorous reaction. 10 p. and 25 p. materials, under shock from the booster, produced curved luminous t r aces persisting t o distances as large as 8 - 9 diameters down the charge. As the charge diameter was increased toward its c r i t - i c a l value, the curvature of the t r ace decreased. It was, therefore, almost impossible t o determine the exact c r i t i c a l l i m i t s f o r the per- chlorate; instead, they were bracketted by two dens i t i e s a t which f a i l u r e and detonation occurred a t a given diameter.
s i t y of 1.29 g/cc in a 7.62 cm diameter charge. be used I n the available firing f a c i l i t i e s . ) vigorous reaction pe r s i s t i ng f o r two diameters down the charge.
Such charges of the
The coarsest material (200 p) failed t o detonate a t i t s pour-den- (Larger charges cannot
However, it too showed
Detonability L i m i t s
The l i m i t or f a i l u r e curve f o r the 10 p perchlorate i n the charge diameter (d) v s po plane i s approximated I n Fig. 2. are de, the diameter a t and above which detonation propagates, and p a , the density above which detonation cannot occur. i ng c r i t i c a l density with increasing c r i t i c a l diameter and the conse- quent de f in t t i on of pc are both opposite t o those f o r TNT-like explosives. investigators on f i n e AP's. The agreement is v e r y good i n view of approximating the p a r t i c l e s i z e d i s t r ibu t ion by the median s i z e and of the d i f f i c u l t y of determining that median.
the f i n e r material. The relevant data are:
The c r i t i c a l values
The trend of increas-
Figure 2 also shows measurements made by two other
The l imi t curve f o r the 25 p AP was not as well defined as that f o r
d(cm) Deton. Failure
3.81 1.02 1.11 5.08 1.26 1.41 7.62 - 1. 7 1.56
-
This l imi t curve w i l l therefore l i e above and t o the l e f t of that f o r the f ine r perchlorate. the experimental range of the present work. effect I s the expected one f o r a l l exploeive8,that of increasing d,
The limit curve f o r the 200 p material i s beyond The trend of p a r t i c l e s i z e
with increasing p a r t i c l e size. The shift i n pa is, however, toward lower values for ammonium perchlorate, toward higher for TNT-like explo- sives.
Detonation Behavior Pa t te rn
The detonation veloci ty (D) vs po curves a t various diameters of the finest Perchlorate are shown In Pig. 3. Typically the D vs po curve a t fixed d shows detonation velocity Increasing w i t h increasing density t o a maximum value. Beyond this maxlmuxn, D decreases as po Increases unti l It reaches Its c r l t i c a l value a t the failure limit.
The curve for each diameter has been terminated a t the c r i t i c a l densi ty given by the smoothed curve of Fig. 2. The l imit l i n e of Fig. 3, which divides the detonation from the failure area, i s shown as the dashed l ine through these terminal points. The curve seems s l i g h t l y concave u,msd ERC~ gives the c r i t i c z l tietorretior. ve1ocit.y (D,) m a Punctlon of po at d i f f e ren t diameters, but a t fixed pa r t i c l e size.
Pig. 4 shows the analogous pattern, analogously derived, for the 25 p material. This pattern i s very like that of Fig. 3; it is, how- ever, compressed i n t o the smaller diameter range which r e s u l t s from the p a r t i c l e size s h i f t of the limit curve, d v s po . A t any given values of d and p,,, the,detonation veloci ty of the finer perchlorate is greater than that of t h e coarser. This point i s further i l l u s t r a t e d i n P i g . 5 where the pa r t i c l e s i ze e f f e c t on the D vs pa curves a t d = 5.08 cm is shown. The terminal points o f the two curves are on a limit curve (indicated by the dashed l i n e ) whlch gives Dc vs po at constant diameter but a t d i f fe ren t p a r t i c l e s izes .
Infinite Diameter Values
Since most of our D vs po curves are non-linear, our experimental range i s one I n which diameter e f f ec t on D is large. A t po = 1.0 g/cc a l l data are on the low densi ty side of the maximum D or, in-pne case, a t the maxirmrm. Under these circumstances, the usual D vs d curve is linear (Fig. 6) and gives the Ideal value D, of 3.78 d p s e c a t po = 1.01 g/cc i n good agreement with the comparable value of 3.75 determined by Evans e t a1.6
For an analogous se l ec t ion of data at po = 1.26 g/cc the solid symbols of Pig. 6 are from the high density side of the maximum D and must be neglected; they would lead t o values of D, which a r e too high.
are extrapolated as i n the present work, the analogous D, I s 4.85 instead of the reported 4.37 d w s e c .
manner at the higher densi ty (where detonation behavior is less idea l ) is too high. Measurements at l a rge r diameters are necessary t o decide this. Meanwhile the present values have been used i n P i g s . 3 and 4 t o indicate a portion of the D, vs po curve. The data f o r the 25 IL material a l s o extrapolate t o the saxne curve.
The remaining data give D, = 4. 9 mm/Crsec a t po = 1.25 g/cc i n very poor agreement w i t h the R e f . value. However, i f the Ref. (2) data
Even so, it is qui te l i k e l y that the D value obtained in t h i s
Reaction Zone Lengths, Reaction Times
Of the avai lable diameter e f f ec t theories, the curved front theory*
155
seems t o f i t our data best. zone length by
Ref. (7) gives the detonation reaction
a = d (1 - D/D,) (1)
z =: ( ~ / 3 . 5 ) (1 - D/Di) (2)
The modified theorye gives a zone length
where s i s the radius of curvature o f the reaction front . For the reasonable assumption that s I s d i r e c t l y proportional t o d, Eqs. (1) and (2 ) a re ident ical except f o r a constant f ac to r and w i l l lead t o the same r e l a t i v e r eac t ion zone lengths.
length by The reaction t i m e ( 7 ) is defined and related t o the react ion zone
(3) -
a = ( D - u ) T
where E i s the average p a r t i c l e veloci ty between the leading von Neumann shock and the C-J plane of the detonation front . Moreover, according t o the g ra in burning theory7,
T = R/kk (4)
where R i s the average p a r t i c l e radius, X the molecular diameter, and k the spec i f i c reaction rate of a single molecule.
temperature T,(po). Moreover, these I n f i n i t e diameter values a r e lnde- pendent of the g ra in s ize . t o obtain the r a t i o of the react ion times of the 10 I.L and 25 CL perchlo- rate a t T,. If i n addi t ion we assume that t h i s material detonates by a g ra in burning mechanism, w e can incorporate Eq. (4) i n t o the r e l a t ions t o obtain
For each Ideal value Di ( po ), there i s a corresponding detonation
Hence Eqs. (1) or (2 ) and (3) can be used
(al/aa) = (z l /za) = ( T 1 , / 7 2 , ) = ( R l / R 2 ) ( 5 )
where the subscripts 1 and 2 denote 10 and 25 p ammonium perchlorate, respectively. (5) gives (Tl,/Tal) = 0.40 0.04 over the range of 0. 0 g/cc. This is i n good agreement with the r a t i o (R,/S?q =: 10/25 = 0.40, a r e s u l t consistent w i t h the g r a i n burning mechanism f o r the detonation of t h i s material; such a mechanism i s a l s o consistent w i t h i t s more ideal behavior a t g r e a t e r porosi t ies .
Calculation of the r a t i o of the react ion times by Eq. po S 1.20
156.
REFERENCES
(1) D.'Price, "Contrasting Pat terns I n the Behavior of High Explosives, 'I Eleventh Symposium ( In te rna t iona l ) on Combustion (1967) pp 19-28, i n press.
(2) W. H. Andersen and R. E. Pesante, " R e a p o n Rate and Characterist ics of Ammonium Perchlorate i n Detonation, t i o n a l ) on Combustion, W i l l i a m s and Wilklns Co., Baltimore (1962)
Eighth Symposium (Interna-
PP 705-10.
(3) R. L. Jameson, S. J. Lukaslk, and B. J. Pernick, J. Appl. Physics z, 714-720 (1964).
(4) M. W. Evans, C. M. Ablow, B. 0. Reese, and A. B6 Amster, "Shock Sens i t i v i ty of Low Density Granular Explosives, Ifiternatieml Conferefice on Sens i t iv i ty and Hazards of Explosives, Ministry of Aviation, U. K. (1963).
I n i t i a t i o n of Low-Density Pressings of Ammonium Perchlorate, Pro- ceedings of the Fourth Sympoeium on Detonation, October 1965, i n press.
Diameter-Dependence of Detonation Velocity I n Sol id Composite Pro- pe l l an t s I, Proc. of the 4 th Symposium on Detonation, October 1965, i n press.
Proceedings of the
(5) M. W. Evans, B. 0. Reese, L. B. Seely, and E. L. Lee, "ShockI,
(6) M. L. Pandow, K. F. Ockert, and H. M. Shuey, "Studies of t h e
(7 ) H. Eyring, R. E. Powell, G. €I. Duffy, and R. B. Parlln, Chem. Revs. s, 69 (1949). (8 ) W. W. Wood and-J.. G.-Kirkwood,- J.- Chem. Phys. 22, 1920 (1954);
F16.3 OETDWITION BEHAVIOR OF AP llOpl
5or
FIG. 5 EFFECT OF PARTICLE SIZE ON OETWUTION VELOCITY OF AP ld.5.08 cmJ
DETONATION
FAILURE
Fa. 8 UTRIpaUTloll TO INFlIlIIE DlANETER VALUES
S O
f
E
a 4 0
e 5
2 0 0 1 0 2 0 10
mmoul ouna. 101 'la 'I
158. ACcELERlcFING DETClNA!KONS I N CWOSITICN B-3 FXF'LC6IyE
Robert Sewell, Lawrence Cosner, James Sinclair
U. S. Naval Ordnance Test S ta t im, China Lake, California 93555
The problem of predicting what will happen when a fragment or project i le strikes cased high explosive munitions i s complicated not only by the complexity of the projectile-munition geometry but also by the number of different reactions which can and do occur.
Recourse t o the l i t e r a tu re on t h e subject exposes one t o such terms as no re- action, burning, deflagration, low order, mild low order, large 1m order, detoaation, high order and deflagration to detonation transition.
pa-tid.
Examining the l i t e r a tu re on explosive sens i t iv i ty is about as helpful and intro- duces a series of t e s t s which regularly produce conhsed rank- of the "sensitivity" of high explosive systems. deal of help ei ther . )
(The theory or theories of detonation are not a great
The major problem is actual ly one of continual attempts t o l ink all the various modes of chemical reaction and a l l the means of physical excitation into one simple model which would be useful i n explosive applications. i n such a venture is s m a l l a t best, but an attempt must be made since studies a m going t o be msde wi th or without adequate models.
The probability of success
I n any attempt t o tackle t h i s problem the explosive system should f i r s t be exam- ined from a chemical as well as a physical dewpoint, the adiabatic auto ignition temperature and its connotations, the shock s e n s i t i s t y spectqm, experimental
-resul-ts,-eCfects-of-geometryy an-d -a i - a t t e~ t t o create a limited analytic model.
GENERAL cQ?IMENTs
THE EXPLOSIVE
Explosives i n general use vary Over a wide range of chemical cciupositions, but do have several similar character is t ics .
They consist of chemical compositions which c a n t a h both the fue l and the oxi- dizer in an "unstable" m l e c u h r c ~ f i g u r a t l o n whlch when broken allows the various atoms to combine in to such products as H20, CO, Cq, N2, etc., with a rapid net production of energy.
The s t ab i l i t y of the explosive molecule should and apparently does play an Important par t i n the sens i t iv i ty of the explosive.
Analysis of the s t a t i s t i c a l nature of chemical kinetics shows t h a t some of the molecules are decomposing at any temperature above absolute zero but that the number of molecules deccmposing o r reacting per second remains "lnsignlficant" up t o sane c r i t i c a l temperature dependent an the ab i l i t y of the exploeive t o dissipate the energy generated by the reacting molecules. molecules involved increases exponentially leading t o significant evolution of energy. t h e geometry of the explosive, the nature of the coPflnIng media, and the temrperature of the environmmt.
Above t h i s temperature the number of
The dissipative factors involve the heat capacity, the thermal conductivity,
2 I I . 159-
(Ti i ‘the presence o f ‘ai? , fans inVo1iring:the oxygen in the alr are, 1
* * ‘ - - of course, possible;), f
I n an investigation of the problem of explosive storage and handling, Longwell (ref. 1) measured the adiabatic auto-ignition temperatures of Var iOUs explosives and developed relations for safe storage times and temperature for various charge geometries.
SHOCK MC&ECULAR EFFECTS
When a shock wave strikes a molecule, the molecule absorbs energy and if the energy i s high enough, bond rupture occurs. the molecule with no effect from other molecules or their decomposition fragments, the weakest part of the molecule w i l l undergo rupture first. This will be regard- less of other factors and certainly i s the first effect of the shock nave.
As long as the energy is absorbed into
Harever,oncethe molecule i s disrupted, reactive frag~nents such as ions and free radicals can collide with the unreacted molecule t o cause further bond rupture. Since t h i s l a t t e r effect will depend on t he spat ia l features of the molecule, s t e r i c factors are important and the bonds disrupted may not necessarily be the weakest in the molecule. In f ac t they may w e l l be the strongest if the atoms involved are easier t o reach by being on the outside of the molecule.
This being the case it is easy t o select the bonds that are broken first, i.e., the N-NO;! and the C-NO;! (Table I). However, after the i n i t i a l phase it i s probable that the C-H bonds are next ruptured since they occur in both molecules and t h e hydrogen atoms are on the outside of the molecule.
SHOCK SENSITIVITY SPECTRUM
Energy levels calculated as associated w i t h shock wves in explosives show that for shocks of the order of a f e w kilobars some chemical reaction i s quite probable, but t h e extent and rate of propagation of the reaction would be strongly dependent on the duration of the pressure pulse 88 w e l l as i ts amplitude and thus strongly dependent on the nature of the confinement. Studies by Liddlerd e t al, (ref. 2) have shown t h a t with proper confinement sustained chemical reaction can be produced i n Comp B a t pressure amplitudes of the order of 5 t o 7 kbars.
This sustained chemical reaction i s not t o be conPused with detonation, which is a chemic- supported shock wave, but it can produce burning or deflagration which has often, improperly, been called low order detonation.
Low order detonation--a nonideal detonation-is generally unstable ( I t is ei ther accelerating or decaying) and I s produced when a shock wave with intensity abwe a given level (dependent on the curvature of the shock front) enters the explosive and either accelerates t o full high order detonation or decays t o no reaction. curvature of the wave front during acceleration I s strongly dependent on the con- finement, the s i z e and shape of the shock producing system, and the physical properties of the explosive.
The
It has been shown (ref. 3) that for pressures greater than 21 kbars the gronth t o detonation is-dependent upon peak pressure and is relatively independent of impulse. It is interesting to note that the factor of 3 between the values of c r i t i c a l pressures obtained by Liddiard e t al. (ref. 4) and Comer and Burford (ref. 4) correspond t o the factor of 3 between the average bond strengths of the N-No2 and the C-H b a d e .
160. The ini t ia t ion of explosive by shock impact is characterized by several zones or
thresholds. the shock level is increased surface reactions VU be triggered, and as the shock level i s increased s t i l l further other effects wi l l begin t o predominate.
A t very low shock levels no significant chemical reaction occurs, as
If the input shock level is above 202 kbars (ref. 3) , an almost instantaneous jump t o stable detonation i s observed w i t h a CJ pressure of 272 kbars. shown tha t in the region from 21 t o 202 kbars the growth of pressure with distance can be represented by
Studies have
dP - = k(P - Pc) dx ( ref . 3)
where P, = 21 kbars and k = 0.132 mm-l with P i n kilobars and x i n millimeters.
Using an assumption based on Adans' (ref. 5 ) investigation of nonideal detona- tion, the pressure is directly propertiorid t o the sq-iwue of t i e propagation velocity
P = yt? (ref. 5)
"he constant y i n t h i s expression i s found t o be 3.38 with P in kilobars and U in millimeters/microseconds .
Integration of eq. (1) yields solutions for pressure as a function of distance and these combined w i t h eq. (2) yield shock velocity as a function of distance and input pressure. A table of parameters of interest associated with these solutions is shown i n Table 11.
Wedge experiments of the type performed by Boyle, Jameson, and Allison (ref. 6 ) Their determination measure direct ly the shock velocity as a function of distance.
of the pressure i s dependent on t h e assumption that the explosive will retun-t-o i t s
just i f ied i n view of the accelerating reaction which is observed. position data are free of these assumptions and could be used for direct comparison. Unfortunately, "for ease of plott ing," Bayle, Jameson, and Allison divided their actual distance by the i n i t i a t ion distance t o "normalize" the measurements and fai led t o publish the actual. distances. Working from what they have published, the in i t i a t ion distance is found t o be 15 mm with a variation of about 1 mm. A plot of t h e i r data compared t o our calculated values is shown i n Fig. 1.
-init id-dens i-ty-upon-release-of -the-preFCsiiFe .--TKis as <et-ion-<eems highly un- Their velocity-
If a spherically divergent system i s presumed, eq. (1) is modified by substitut- ing r for x and introducing a spherical loss term
dP P - = k(P - Pc) - - d r r
or
(3) 1 P(k - F) - kP C
dP dr - =
If eq. (3b) is correct and if the constant k I s correct a minimrrm radius 'of curvature for any stable detonation becomes
1 k
I=-
1 0.133
For Comp B-3 t h i s would be r = - = 7.52 ma.
161. !Chis value is not the limiting radius of a cylinder which would propagate deto-
Actually since the pressure would not be much above nation but would be the radius of curvature of the central portion of the detonation wave in the limiting cylinder. 202 kbar a t the l i m i t situation the limiting radius of curvature would be about 8.4 mm. detonation velocity would be 16.8 mu which is equivalent t o the
If a hemispherical front is postulated the limiting diameter for flrll of ref . 7.
A graph of the pressure required t o produce an accelerating detonation as a Punction of the radius of curvature of the front is shown in Fig. 2. wave fronts (negative radius of cunrsture) require less pressure than the c r i t i c a l pressure t o produce an accelerating front which tends t o invert rapidly t o a diver- gent wave front. If during the period of convergence the pressure increases enough over a large enough zone, continued acceleration should occur.
converging
Below and t o the l e f t of the positive radius of curvature curve the reaction produced is a decaying detonation. N e a r the curve, a s l igh t change i n radius Of curvature through a density change or a void In the explosive could have a large effect on the occurrence of growth t o detonation.
REFERENCES
P. A. Longwell, NAVWEPS Report 7646, NOTS TP 2663, China Lake, Calif., Mar 1%.
T. P. Liddiard, Jr. and S. J. Jacobs, NOLTR 64-53, White Qnk, Md., 1965.
L. N. Cosner, R. G. S. Sewell, and J. E. S incb i r , NUTS TP 3984, China Lake, Calif., June 1966, pp. 150-64.
M. K. Burford and L. N. Cosner, NOTj TP 3301, China Lake, C a l i f . , Aug 1963, pp. 251-68.
G. K. Adams, "Theory of In i t ia t ion t o Detonation I n Solid and Liquid Eqlo- sives," Ninth Symposium (International) on Combustion, Academic Press, New York, N. Y., 1963, pp. 545-53.
V. M. Boyle, R. L. Jameson, and F. E. Allison, BF& Report No. 1250, Aberdeen Proving Grounds, Md., 1964.
M. A. Cook, "The Science of H i g h Ekplosives," Reinhold Publishing Company, New York, N. Y . , 1958.
L. Pauling, "The Nature of the Chemical. Bond," 3rd ed . , Cornell University Press, Ithaca, N. Y. , 1960.
A . D. L i t t l e Compw, Navy Contract No. W-l9-OeO-ORD 6433, Canbridge, Mass., 1946.
c=c C-H C-C C-N C-N% N-Ncr,
162. lPable I
Average Bond Dissociation Energies
146 kcal/mdle ref. 8) . 98.7 kcal/mle
86.6 kcal/mole 72.8 kcal/mole ref. 8) 48 kcal/mole (calcd. fman ref. 9 32 kcal/mole (calcd. from ref. 9
B \
\
163. Table I1
pressure Mstribution and Propagating Velocity for Accelerating Shock
m X
70 65 60 55 50 45 40 35
' 30 25 20 15 10
5 0
Distance t o go t o detonation,
kbars kbsrs mm/wec mm @ = (p0 - pc)e kx P = A P + P u = q 70 - x
C
181 93.5 48.3 25.0 12 -9 6.68 3.45 1.78 0.W 0.48 0.25 0.13 0.07 0.03 0.02
k = 0.132 Y = 3.34
202 114 69.3 46.0 33 -9 27.7 24.5 22.8 21.9 21.5 21.3 21.1 21.1 21 .o 21.0
7.78 5 .a6 4.56 3.n 3-19 2.88 2.71 2.61 2.56 2.54 2.52 2.52 2.51 2.51 2.51
0 5
10 1 5 20 25 30 35 40 45 50 55 60 65 70
164. SHOCK VELOCITY. U.CM/SEC x io5
PRESSURE * P KILOBARS -
c u)
0
165 . The Heat and Products of Detonation of Cyclotetramethylene tetranitramine (HMX), 2 ,4 , 6-trinitrotoluene (TNT). Nitromethane (NM),
and Bis [2, 2-dinitro-2-fluoro-ethyll -formal (FEFO)*
Donald L. Ornellas
Lawrence Radiation Laboratory, University of California Livermore, California
1. INTRODUCTION
Calorimetric measurements combined with product analysis offer a precise method fo r obtaining fundamental information about the detonation process. This information can then be used to provide normalization and boundary conditions fo r thermodynamic - hydr odynamic codes that predict explosive performance.
Three pure CHNO explosives and one fluorine containing explosive were investigated. This work is an extension of the work reported for PETN. Jointly, these studies span the range of oxygen balance in explosives that is of greatest inter est.
Previous detonation calor imetr ic work with TNT2-5 and HMX' is not amendable to theoretical interpretation because of the geometries used or the lack of reliable product information. determination of the heat and products of detonation of NM and FEFO has been found in the l i terature .
No information concerning the experimental
2. EXPERIMENTAL
2.1 Apparatus and Operation
The apparatus and i ts operation have been described; however, some changes have been made.
The thermometric system is a quartz thermometer which has a sensitivity of 1 X 10⁻⁴ O C for differential measurements, is easily calibrated, and has direct digital readout.
The heat equivalent of the standard instrument, taken as the average of s ix caiibration runs, was 15, 193 f 2 cal/"C. mean.
The e r r o r is the standard deviation of the
Charges a r e now completely confined by a 1.27-cm thickness of gold. Formerly the ends of the confining cylinder were left open. Since the bottom of the interior of the bomb was most damaged by flying fragments, it w a s protected by a 0.64-cm- thick, 6.4-cm-diameter
1.27 cm from each end with a translucent film which is a laminate of 0.025.-mm polyethylene and 0.013-mm Mylar. the film between appropriately machined gold surfaces. 0.017 g per experiment.
1.71 g /cc . required for the TNT .experiments since initiation w a s effected by means of the detonator alone.
2 .2 Explosive Materials
st,ainless steel disc which we replaced af ter each experiment. .. In order t o contain NM under vacuum conditions, we sealed the gold cylinder
A vacuum-tight seal .was obtained by compressing The weight of film averaged
NM was initiated through this film with a 0.75-g PETN booster at a density of HMX and FEFO were initiated with a 0.3-g booster. No booster was
Military specification, grade I1 HMX was used. Analyses by thin layer
"Work performed under the auspices of the U. S. Atomic Energy Commission.
166. chromatography showed about 0.570 cyclotrimethylene-trinitramine (RDX) and less than 1% each of an incompletely characterized l inear nitramine (compound C) and 1(N) acetal - 3, 5, 7 trinitrocyclotetranitramine (SEX). The melting point was 278-282°C. Charges were machined from billets which had been prepared with a special solvent -pressing technique.
Granular TNT, mili tary specification, grade I11 w a s used. Analysis by thin-layer chromatography showed l e s s than 2% impurit ies. These were identified a s 2, -4, 5 TNT, 2 , 4 dinitrotoluene and trinitrobenzoic acid. Elemental analyses for carbon, hydrogen, and nitrogen were in agreement with theory for pure TNT within the l imits of the analyses. in increments t o a density at which TNT detonates reliably in small diameters,
The melting point w a s 82.0”C. Charges were pressed
Commercial grade NM was used. Chromatographic analysis showed a purity 01 96. 7%. Impurities w e r e nitroethane 0.94%, 2-nitropropane 2.570, 1 -nitropropane 0.0370, and water 0.170 maximum. based was calculated from the above analyses and adjusted to carbon equals 1.00.
The empirical formula on which resul ts a r e
W e de-aerated NM t o avoid the formation of an a i r bubble between the booster and liquid when the bomb was evacuated. frozen NM to vacuum, sealing the container, and then thawing the NM. This procedure w a s repeated severa l t imes.
This was accomplished by subjecting
FEFO, bis[2, 2-dinitro-2-fluoro-ethyl] -formal w a s available only in research quantities. was determined to be 94.470 pure by chromatographic analyses. impurity is bis[ 2, 2-dinitro-2-fluoro-ethyl] -diformal and i t contains 0.1% water as received.
It is a liquid with a vapor pressure of about 40 p at 90°C. The sample The principle
Water was removed by vacuum distillation in order t o avoid lo s s of FEFO from the confining cylinder when the calorimeter w a s evacuated. The expirical formula on which resu l t s a r e based was calculated from elemental analyses and adjusted to carbon equals 5.00.
3. RESULTS and DISCUSSION . - - - - . - . . - __ -~ -
3.1 Products from Heavily Confined Charges
S t ~ d i e s ” ~ ’ ~ indicate ’ that t h e products f rom heavily confined charges represent those found on the Chapman-Jouguet (C-J) isentrope at temperatures in the range of 1500 t o 1800°K. TNT, NM and FEFO.
Table 1 l i s t s these products and the heats of detonation for HMX,
-4s one proceeds down the scale of oxygen balance - FEFO, HMX, TNT - t h e proportion of carbon which appears a s solid carbon increases , and which appears as carbon dioxide decreases . Also, the proportion of hydrogen appearing a s hydrogen gas increases , and which appears a s water decreases. NM, a low-density explosive with a high hydrogen-tcrcarbon ratio, is the exception to these trends. It has the same oxy- gen balance a s TNT, yet proportionally more carbon appears as carbon monoxide and
amounts of methane a r e present in the NM products than for any of the other explosives. ! C S S as s ~ ! i d carboi; than one might expect fi.oiii iiie TNT i;esiiiis. ili addiiiori, greater
It is noteworthy that all of the fluorine in FEFO appears a s hydrofluoric acid. Carbon tetrafluoride or other compounds containg the C - F s t ructure were not ob served.
The products f rom heavily confined charges attain equibirium under non-ideal
In order t o calculate the product composition along the C-J isentrope,. one gas conditions since the p re s su re at 1500 to 1800°K i s of the order of 5,000 t o 50,000 atm. must therefore use complex thermodynamic-hydrodynamic calculations. Calculations

167. were y a d e by using the two best equations of state availa e, the Becker-Kistiakowsky- Wilson (BKW) equation in the RUBYg code, and the LJDpA equation. The comparisons of observed products with calculated products f o r the four explosives studied (Tables 2, 3,4, and 5) a r e fair. for detonation products.
infinitely long, heavily confined, open-ended charge. effects would be negligible. dimensions, and end effects a r e such that some of the detonation products a r e sufficiently shock heated on colliding with the calor imeter w a l l t o cause re-equilibration. Because of this the ends of the charges w e r e also confined in gold. deficient explosives such a s TNT, doing this increases the observed heat of detonation by almost 6%.
3.2 Products f rom Unconfined Charges
Data of this type will be used t o improve equations of s ta te
The ideal experiment t o allow isentropic expansion of detonation products is an F o r such a configuration end
However, charge length is limited by the calor imeter
F o r oxygen-
The change is less for higher oxygen-balanced explosives.
1 It has been shown that the temperature a t which equilibrium becomes frozen can b e found by comparing observed detonation products f rom unconfined charges with products calculated with ideal gas laws. of Jones and Miller7 indicated a freeze-out temperature of 1500 to 1800°C. charges of HMX and TNT were fired and products were compared (Tables 6 and 7) to those calculated.
Work with PETNl and the calculations Unconfined
The agreement is good, confirming the ear l ie r work.
The TNT data indicate that solid carbon equilibrates rapidly during the reshocking of products that occurs with unconfined charges. The value for solid carbon, f rozen out in the initial isentropic expansion, is 3.65 moles/mole.TNT (from Table 1) . If it were not equilibrating, the amount found in the products f rom unconfined charges ' (1.01 moles/ mole TNT, Table 8) should be at least a s l a rge as that found in the I
products f rom heavily confined charges.
ACKNOWLEDGEMENTS
The author wishes to thank Dr. John W. Kury for his ass is tance and guidance i n the interpretation of results; Dr. Edward L. Lee and Mr. Milton Finger for providing calculations using the BKW equation of stat e, and Dr. Wildon Fickett
'
(Los Alamos Scientific Laboratory) for providing calculations using the LJD equation of state.
REFERENCES
1. D. L. Ornellas, J. H. Carpenter & S . R . Gum, Rev. Sci. Instr . 37. 907 (1966). 2 . A . Y . Apin, N. F. Velina & Y . A . Lebedev, 2 L.' P r i k . Mekhan. i. Tkhn. Fiz.
3 . Ministry of Supply, ARE Memo No. 1/51, April 1951. 4 . R . Robertson & W . E. Garner, Proc . Roy. SOC. (London)103A, 539 (1923).
5. ARDE Report (S) 4/56 a s quoted by D. Price, Chem. Rev. 59, 801 (1959). 6 . H. W . Sexton, ARDE, private communication.
7 . H. Jones & A . R. M i l l e r , Proc . Roy. SOC. (London) u, 480 (1948). 8. C . L. Mader, Los Alamos Scientific Laboratory, Report LA-2900 (1963). 9. H . B. Levine & R. E . Sharples, Lawrence Radiation Laboratory (Livermore) 1
- 5, 96 (1962). . ,
Report UCRL-6815 (1962). 10. W. Fickett, Los Alamos Scientific Laboratory, Report LA-2712 (1962).
, .
168.
Table 1 a,h The Heat and Products of Detonation of Heavily Confined Charges of Explosives
Explosive HMX TNT NMC F E F O ~ Density (g/ cc) 1.89 1.53 1.13 1.60
' Charge weight (g) 25 22 1 5 25
A H detonation, 298"I<, H20(a) , (ca l /g) 1479 f 5 1093 f 5 1227 * 5 1227 f 5
Products (moles/mole explosive) 1.. 92 1.25 0.261 3.16 1.06 1.98 0.550 1.88 0.97 3.65 0.095 not detect,ed 3.68 1.32 0.394 1.99 3.18 1.60 0.882 2.14 0.30 0 .46 0.294 0.046
0 0 0 1 .87 f 0.40 0.16 0.118 0.023 0.039 0.099 0.083 0.009 0.0081 0.020 0.0081 not detected 0.001 0.004 0,001 not detected
3 C(sJe N2 H2° H2
HCib
H F
E3
C2H6 a
"Corrected for PETN in the initiation system.
'SM = c1 .00 H2 ,96 Xo,96 01.92 by analysis and adjusted to C = 1.00. T race amounts
dFEFo = '5.00 5. (-1 4.09 O10.06
Cylindrical charges, 1.27 cm diameter, confined in 1 . 2 7 c m gold.
of acetylene were observed.
Results a r e corrected for reaction of H F with stainless steel. on the ends.
H _ , W F1.87 by analysis and adjusted to C = 5.00 . Charge not confined
eDe~e.~~.i.ned-by-di-f-f-ererlce:-- -- - - ~ ~ ~ - ~ - - - ~- -- - ~. -~ ~
f F r o m total fluorine contained in FEFO.
Table 2
Comparison of Calculated- C-J Isentrope Products with Observed Products f rom Heavily Confined Charges of HMX
Moles/ mole HMX Calculated
Oh ser ved, BKW LJD Heavily C-J Isentrope C -J Isentrope
Products Confined 1520°K 1800°K 1490°K 1760°K
N 3.68 3.97 3.97 3.98 3.97 H;O 3.18 3.11 3.67 2.90 3.06
1.92 2.39 2.13 2.16 2.01 1.06 0.10 0.071 0.77 0.93 co
C ( s ) 0.97 1.13 1.68 0.73 0.81 0 . 4 0 0.076 0.073 0.047 0.063 0.30 0.005 0.001 0.36 0.34 0.039 0.38 0.11 0.34 0.26
co2
NH3 H2 CH HCk 0.0081 0 0 not allowed
i
169. Table 3
Comparison of Calculated C-J Isentrope Products with Observed Products f rom Heavily Confined Charges of T N T
Moles/ mole TNT Calculated
Observed, BKW LJD Heavily C-J Isentrope C-J Isentrope
Products Confined 1505°K 1835°K 1500°K 1870°K
C(S) 3.65 co 1.98 H 2 0 1.60
1.32 1.25 0.46 0.16 0.099
N 2 c*2 H2
HCN 0.020 'ZH6 0.004
3.57 4.50 0.56 0.32 1.06 1.87 1.49 1.48 2.19 1.91 0.043 0.017 0.026 0.047 0.68 0.27
3.6X10⁻⁶ 1 . 3 x 1 0 - ~ not allowed
3.52 3. 80 1.60 1.58 1.33 1.64 1.50 1.50 1.53 1.39 0.48 0.40 not all owed
0.34 0.23 not allowed :
- not allowed
Table 4
Comparison of Calculated C-J Isentrope Products with Observed Products from Heavily Confined Charges of NM
Moles/ mole NM Calculated
Observed, BKW L J D Heavily C - J Isentrope C-J Isentrope
Products Confined 1520°K 1835°K 1500°K 1800°K ~ ~~
H 2 0 0.88 0.75 0.77 0.81 0.85 co 0.55 0.18 0.21 0.43 0.48
0.39 0.47 0.47 0.5 0.5 0.29 0.049 0.027 0.32 0.29 0.26 0.49 0.47 0.38 0.33 0.12 0.017 0.027 not included
0.083 0.33 0.32 0.19 0.18 0.0081 0 0 not included
N2 H 2 co2 NH3 a s ) 0.095 0 0 0 0 CH4 HCN
Table 5
Comparison of Calculated C-J Isentrope Products with Observed Products from Heavily Confined Charges of 14’EFO
170.
Table 6
Comparison of Calculated Equilibrium Products at Constant Volume with Observed Products from Unconfined Charges of HMXa
Moles/mole FEFO Observed. Calculated BKW
Moles/ mole HMX, Calculated for
Heavily c -J Isentrope Products Confined 1 5 2 0 0 ~ 18200K
3.16 3.02 2. i4 1.38 1.99 2. 04 1.88 0.83 1.87 1.87 0.046 0.045
0.023 0.018 0.0009 0.24 0 0
0 0
3.82
1.57 2.03 0.85 1.85 0.025 0.026 0.16 0.005
0.17
_.
Observed Ideal Gas Products Unconfined 1500°K 1800%
N2 4.01 4.00 4.00 co 2.65 2.36 2.52 H 2 0 2.50 2.36 2.52 H2 1.53 1.64 1.48
1.45 1.65 1.49 0.0006 0.00002 0.00002 tIC N
NIT3 not detected 0.0006 0.0002 ~ 1 1 ~ not detected 0.0004 0
25-g charges at density 1.89 g / c c and 2.54 cm diameter .
CO2
a
Table 7 -
----- ~ --Compari-s on-of-Cal EulZtd Equilibrium Products at Constant Volume with Observed Products from Unconfined Charges of TNTa
Moles/ mole T N T Calculated for
Observed Ideal Gas Products Unconfineda 1500°K 1800’K
~ ~~
co 5.89 2.31 1.36
H2 N 2 C(S) 1.01 H20 0. I ?
0.063 0.024 0.022
::2N NiI3 C1I4 0.0092
-~ ~~
5.97 6.00 2.10 2.36 1.49 1.47 0.81 0.90 O.OO? 0.003 0.009 0.003 0.018 0.056 0.0005 0.0003 0.192. 0.053
a 25-g charges a t density 1.53 g /cc and 1.27 and 2.54 crn diameter .
I
'i
1
h
171.
QUANTITATIVE INFRARED MULTICOMPONENT ANALYSIS O F MINERALS OCCURRING IN COAL
Patricia A. Estep, John J. Kovach, and Clarence Karr , Jr.
U. S. Department of the Interior, Bureau of Mines, Morgantown Coal Research Center, Morgantown, West Virginia
INTRODUCTION
The recent development of a new low-temperature ashing technique (2) for obtaining unaltered mineral mat ter from coal, combined with the extension of the mid-infrared region to 200 c m - l , has shown clearly that infrared spectroscopy i s a valuable tool for use in coal mineralogical studies (2). analysis of minerals in coal has been hindered previously by the broad background absorption of the coal itself (11) a s shown in Figure 1, curve (b), coupled with the paucity and often nonspecificity of mineral absorption bands in the rock-salt region of 5000 to 650 c m - l . However, when the coal substance, approximately 90% of the sample, is removed a t low temperatures in a n oxygen plasma (s), there remains unaltered mineral mat ter with an infrared spectrum exhibiting many diagnostic and analytically useful absorption bands a s shown in Figure 1, curve (c ) . The disap- pearance of organic absorption bands indicates complete removal of the coal sub- stance. The improved quality of the spectrum obtained on this enriched mineral mat te r has increased the possibilities for quantitative analysis. In this paper we describe the development of an infrared solid state quantitative analysis for five commonly occurring coal minerals--quartz , calcite, gypsum, pyrite, and kao- linite. The presence of many other minerals in coal in a wide range of concentra- tions has been shown (5, 9, 16, 2). were selected on the basis of their frequency of occurrence and relative abundance in the coal samples examined in this laboratory. tinuing broad program using infrared spectroscopy for coal mineralogical studies, qualitative and quantitative analysis can be developed for other minerals .
The direct infrared
However, those included in this analysis
We anticipate that in this con-
A large part of the published infrared data for minerals (1, 14, 30) and inorganic compounds (2) i s limited to the rock-sal t region of 5000 to 650 cm'l. Recently, spectral data in the extended region of 650 to 400 cm-l has been pre- sented for some minerals (2, 37) and down to 240 cm- l for some inorganic com- pounds (24, 25, 32, 38). spectra for naturally occurring minerals to 200 cm-l . quantitative infrared analysis of minerals have dealt with a single mineral or the detailed studies of sampling parameters , while very little has appeared on multi- component mixtures (2, 23).
\
However, these collections offer very few high-resolution \t The published papers on \
EXPERIMENTAL 1 ) ' Y
Several specimens of each of the five minerals were obtained from dif- ferent localities and their infrared spectra checked qualitatively for associated
the spectra for samples f r o m several sources , l i t e ra ture infrared data, and X-ray powder data.
, mineral contamination and phase purity by three means: common agreement of
On the basis of this qualitative screening, two sources were
J
172.
selected for detailed grinding studies in order to establish the infrared absorp- tivity calibration data. The minera l was placed with an agate ball into an agate vial, approximately one-third full, and ground mechanically in a Spex Mixer Mill. A sample was removed from the vial for infrared analysis a t five-minute inter- vals with a five-minute cooling period. band absorptivities became constant, a t which point a particle size determination was made using a Coulter Counter, Model A (Coulter Electronics). infrared analysis were prepared by weighing one mil l igram of the pregound mineral and 500 mill igrams of cesium iodide powder (Harshaw, 100 to 325 mesh, median particle size 6 2 p) on a microbalance and blending by hand for five minutes in a mullite mor ta r . into a pellet according to a triple p re s s method (E). placed under vacuum, pressed for five minutes a t a p res su re of 23,000 pounds total load, the pressure relaxed for five minutes, and the procedure repeated twice. The additional pressing s teps presumably relieve the s t ra in introduced by the o r i - ginal pressing. on a Perkin-Elmer 621 infrared grating spectrophotometer purged with dry a i r .
The grinding was continued until measured
Pel le ts for the
This mixture was t ransferred quantitatively to a die and pressed F o r this the pellet was
The resulting pellet of 0.80 by 13 m m was then scanned immediately
Enriched mineral samples from coal were prepared by low-temperature oxidation at 145" C in an oxygen plasma using Tracer lab ' s Model LTA-600. Each of the five minerals was exposed to the same ashing conditions a s the coal samples. There were no sample al terat ions, except for the par t ia l dehydration of gypsum to the hemihydrate.
RESULTS AND DISCUSSION
Sampling Pa rame te r s
Tuddenham (2) has shown the application of the potassium bromide pellet method to mineral analysis and demonstrated its quantitative potentialities. Most i n f r a redzec t roscop i s t s conclude that i t i s possible to achieve acceptable solid state analysis only with rigorously standardized conditions of sample preparation. The many difficulties encountered in quantitative solid phase spectroscopy have been reviewed by Duyckaerts (10). - Kirkland (E), and Baker (5).
- _ - -
Part ic le Size. Probably the most important single physical factor to be considered in quantitative solid s ta te spectroscopy is that of particle size. This problem has been investigated both theoretically and experimentally by several workers (E, 2, 34, E). loss by reflection and scattering and the intensity of an absorption band increases f rom an apparent absorptivity to its t rue absorptivity value. Descriptions of this relationship between par t ic le s i ze and absorptivity for the mineral calcite has been given bj Lejeiine (19) and u?iyckz.ei-is ( i o ; and for quartz by Tucicienham izj. Giher workers have usedthe m o r e empir icalypproach of relating infrared absorptivities to sample grinding t ime, which is proportional to particle size. used sedimentation technique for obtaining the required particle s ize of the sample, while applicable to single component samples , cannot be employed with multicom- ponent samples (14, 35) since this procedure leads to a differential separation of the individual components.
different minerals and can va ry for absorption bands of different intensities. land (17) has pointed out that the absorptivit ies of bands associated with crystallinity
A s part ic le s ize is reduced there i s a reduction of light
The commonly
The effects of par t ic le s ize reduction can vary with Kirk-
can be more susceptible to particle size variations than those originating f rom functional group vibrations. the effects of particle size on absorptivity for each band being considered for quan- titative analysis. For this work the expedient method of studying absorptivity as a function of grinding time was chosen. particle size need only be determined on those samples ground for lengths of time necessary to produce constant absorptivity values. size requirements for constant absorptivities i s available with a minimum of effort. A typical example of such a grind study is shown in Figure 2 fo r the mineral pyrite. after a minimum grinding t ime and remains constant even with extended grinding and further particle size reduction. The minimum grinding time for a particular mineral can vary with the type of vial used and the amount of sample loaded into the vial. the mean particle size of the sample falls in the range of 4 to 13 microns. This fulfills the theoretical requirement for solid phase spectroscopy, that i s , sample particle s ize should be l e s s than the wavelength of the incident radiation, in order to minimize scattering, reflection, and the Christiansen effect.
These considerations necessitate a careful study of
If a s t r ic t grinding schedule i s followed,
Thus, knowledge of particle
The data show that the apparent absorptivity becomes constant
Grind studies on all five minerals reveal that at the minimum grind t ime,
While the absorptivities a s determined for use in this analysis a r e constant,
This effect was they a r e not necessarily maximum values. iodide matr ix can cause band absorptivit ies to increase markedly. shown in a grind study in which preground kaolinite was added to samples of cesium iodide, also preground, but for different lengths of time. hand blended to prepare a pellet according to the chosen procedure. Absorptivities fo r several kaolinite bands were seen to increase 30 to 50% when prepared with cesium iodide that had been ground for 20 minutes. be determined because, a t a very fine particle s ize , cesium iodide pellets crumble. While not recommended for quantitative work, grinding samples for five minutes in a ball mil l with cesium iodide i s a good technique for improving the qualitative appearance of the spectrum; band resolution improves and background i s con- siderably reduced. The relatively gentle grinding that the cesium iodide receives during the blending stage of pellet preparation reduces i t s particle size very little a s shown by particle size determinations. function of reproducibility ra ther than absolute measurement, the relatively simple and highly reproducible method of hand blending was chosen. An additional reason for selecting this method over the technique of mechanical blending in a ball mi l l i s that the cesium iodide mixture packs in the vial and i s not quantitatively recover- able.
Par t ic le s ize reduction of the cesium
Each mixture was then
True absorptivit ies could not
Since quantitative accuracy i s more a
Sample Alteration. Extensive grinding can cause polymorphic transforma- tions o r alteration of mineral composition. that a few minutes grinding in a Wig-L-Bug with a metal vial and ball can trans- form calcite to the high-pressure phase of aragonite. tion to a pressure component in the mechanical action of the vibrator. Burns (1) also studied this calcite-aragonite transformation and found that it can occur by grinding at room temperature . minute in a stainless-steel Wig-L-Bug will cause dehydration of gypsum. Liber t i (20) has reperted destruction of the crystall ine s t ructure of quartz under cer ta in grinding conditions. W e have noted changes in the spectrum of kaolinite a f te r it was subjected to severe grinding conditions.
Fo r example, Dachille (8) has shown
He assigns this transforma-
Morr i s (27) found that vibrating for more than one
However, none of these
174. alterations were observed by using the chosen procedure, presumably due to the periodic cooling periods during grinding and to the use of an agate grinding ball mill. Since the density of agate is about one-third the density of stainless steel , there is less mechanical s t r e s s exerted on the sample in this vial. The absorp- tivity values of some absorption bands began to decrease with prolonged grinding, although no qualitative spectral changes occurred. alteration occurred, these bands were not selected for use in the quantitative analysis.
Since some form of sample
Part ic le Distribution. Lf Beer ' s law is to be followed, all absorbances must show a linear dependence on effective concentration. s idered effective because the infrared beam does not completely cover the entire pellet in the instrument. requires a high degree of uniform dispersion, o r a homogeneous mixture of sample and matr ix . thorough. In the instrument used, the i d r a r e d b e z m csvers about 50% 01 the peliet a r e a . technique, pellets of each of the five minerals were rotated systematically through 360" with scans taken at severa l settings. were identical, indicating that dispersion is adequate, and also that there a r e no polarization o r orientation effects.
The concentration i s con-
The use of sample weight as a concentration factor thus
This can be achieved i f particle s ize is small and if blending is
As a test of the dispers ion achieved with the chosen sample preparation
F o r all positions, the band intensities
Choice of Matrix. Several salts were tested for use as a matrix.
The low background a t shorter wavelengths due to scattering
Cesium iodide appeared to be the bes t choice on the basis of its superior transparency at long wavelengths. was not objectionable since most of the useful absorption bands for minera ls a r e found a t longer wavelengths. The triple p re s s method reduced scattering at short wavelengths, often a s much a s 40% over single pressing. The over-all t ransmis- sion of a blank cesium iodide pellet was acceptable, as shown in Figure 1, curve (a) , and therefore no pellet was used _ _ in the-.re_fer.ernce_beam. Although cesium- ~
i o d ~ i ~ ~ i ~ l ~ i ~ ~ l y - h ~ r ~ s c ~ p i c ~ ~ there was less difficulty f rom water adsorption than i s generally experienced using the more common potassium bromide matr ix . While mechanical grinding of cesium iodide intensified the water absorption bands, hand blending produced no m o r e than 0 . 0 2 absorbance units a t the 3 4 3 0 cm-l OH stretching frequency. since coal minerals often have useful OH absorption bands.
This behavior of cesium iodide has a decided advantage
The pellet thickness must be controlled i n order to prevent interference o r fringe patterns. paral le l pellet surfaces are relaxed, these fringe pat terns can become quite pro- nounced on thin pellets. In o rde r to eliminate this as a potential source of quan- titative e r r o r , pellets at l e a s t 0. 80 m m thick were used.
In the longer wavelength region where the requirements for
Other Parameters . There a r e other sampling problems sometimes encoun- te red in solid state analysis. Among these i s interaction of the sample with the mat r ix , believed to be negligible for the minera ls analyzed here . tive index difference between the sample and the dispersion medium can cause a pronounced Christiansen effect, characterized by the asymmetr ical shape of a n absorption band, and result ing in high light scattering which can introduce e r r o r s into quantitative measurements . However, the small particle size used should minimize any e r r o r ar is ing f rom this effect. Departure f rom Beer ' s law i s pos- .-Me, but with the base line technique for absorbance measurements and with
A large refrac-
,
,
/
i
I
I ' \
\ \
\
\ \
controlled particle s ize , Beer ' s law was obeyed for concentration ranges of 0.02 to 0. 2 wt-pct. One of the limitations in the quantitative analysis of minerals and inor- ganics i s due to their inherently high band absorptivit ies. With intense absorption, only a very small amount of sample can be included in the pellet, W i l l s t i l l be measurable, thus increasing weighing e r ro r s . However, reproducible resul ts could be obtained with a microbalance and a large a rea of beam coverage of the pellet.
SO that the band
Qual ita t ive Analy s is
Since natural mineral specimens, which were used a s standards in this analysis, often occur in polymorphic aggregations, it was necessary to determine the qualitative infrared spectral differences for polymorphs of each mineral . the coal samples thus fa r investigated no polymorphic mixtures were encountered, although they can be expected. for each of the five minerals and some polymorphic forms.
In
Table 1 l i s t s the spectral data f rom this laboratory
Quartz. The two quartz samples used a s standards, for which bands a r e presented in Table 1 and absorptivity data in Table 2, a r e both low-temperature a -quar tz . samples of polymorphs of crystall ine silica in this laboratory, f rom l i terature data (21, z, z), and from X-ray powder data. The a-quartz form can be dis- tinguished in the 650 to 200 cm-' region from the polymorphic forms of a-tridymite and CY- and p-cristobali te. from p -quartz and @ -tridymite. polymorphs and other modifications of silica can be made by the highly unique bands at 256, 363, 388, and 688 cm-'.
This was established from differences shown in the infrared spectra of
Work remains to confirm the distinction of a-quartz The distinction of a -quar tz f rom i t s crystall ine
Calcite. The natural aggregation of calcite and its dimorph aragonite is common (2). Infrared l i terature data (2, 2) in the rock-salt region show that hexagonal calcite can be distinguished from orthorhombic aragonite. The data from our laboratory in Table 1 show the marked difference in their spectra and l is t the additional bands obtained for the region 650 to 200 cm-I. Petrographic dis- tinction between these two polymorphs i s often inadequate a s shown by the fact that three of our samples labeled aragonite were shown by infrared to be calcite. Adler (2) found that several specimens of aragonite and calcite differed from their museum labels.
Gypsum. For gypsum (monoclinic), i t was necessary to show that the crystallographically different anhydrite (orthorhombic), often found in coal, and he hemihydrate (hexagonal, CaS04' 1/2H,O), can be differentiated in the infrared for the preliminary qualitative analysis of the sample. Data f rom Morr i s (E) and from our laborqtory, in Table 1 show that the hemihydrate has unique bands and can be differentiated from gypsum. These spectral differences were used to show that the low-temperature oxidation technique produced a conversion of gypsum to the hemihydrate. Gypsum was selected for testing in synthetic mixtures since it has been identified and analyzed in coal product samples not subjected to low- temperature ashing. Anhydrite is also readily distinguishable f rom gypsum. The pr imary difference i s a splitting of the l a rge , broad band of gypsum a t 594 cm-' into two sharp bands at 587 and 607 cm-' for anhydrite. The 660 cm-' band of
' \
' 1 'f
? i
!
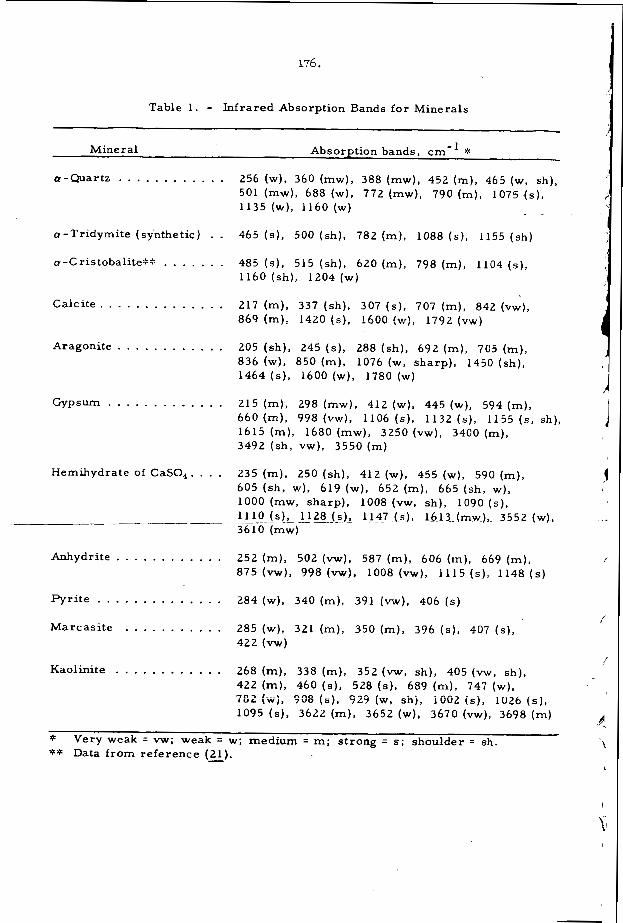
176.
Table 1. - Infrared Absorption Bands for Minerals
1 Mineral Absorption bands, cm- * a-Quartz . . . . . . . . . . . . 256 (w) , 360 (mw), 388 (mw), 452 (m) , 465 (w, sh),
501 (mw), 688 (w), 772 (mw), 790 (m) , 1075 ( s ) ,
1135 (w), 1160 ( w ) . .
a-Tridymite (synthetic) . . 465 ( s ) , 500 (sh), 782 (m) , 1088 ( s ) , 1155 ( sh )
a-cristobalite:::: . . . . . . . 485 ( s ) , 515 (sh) , 620 (m) , 798 (m), 1104 ( s ) , 1160 (sh) , 1204 (w)
Calci te . . . . . . . . . . . . . . 217 (m), 337 (sh), 307 ( s ) , 707 (m), 842 (-), 869 (m): 1420 ( s ) , 1600 (w), 1792 {w.,-)
Aragonite . . . . . . . . . . . . 205 (sh), 245 (s) , 288 (sh), 692 (m) , 705 (m), 836 (w), 850 (m), 1076 (w, sharp) , 1450 (sh), 1464 (s), 1600 (w), 1780 (w)
Gypsum . . . . . . . . . . . . . 215 (m), 298 (mw), 412 (w), 445 (w), 594 (m) , 660 (m), 998 (vw), 1106 ( s ) , 1132 ( s ) , 1155 (s, sh), 1615 (m), 1680 (mw), 3250 (vw). 3400 ( m ) , 3492 (sh, vw), 3550 (m)
Hemihydrate of CaS04. . . . 235 (m) , 250 (sh), 412 (w), 455 (w) , 590 (m), 605 (sh, w), 619 (w), 652 (m), 665 (sh, w), 1000 (mw, sharp) , 1008 (vw, sh), 1090 ( s ) , 1110 ( s ) , 1128 1147 ( s ) , 1613.(mw.),.-3552 (w), 3610 (mw)
Anhydrite . . . . . . . . . . . . 252 (m) , 502 (vw). 587 (m), 606 (m), 669 (m). 875 (-1, 998 (w). 1008 (vw), 1115 ( s ) , 1148 ( s )
Pyri te . . . . . . . . . . . . . . 284 (w), 340 (m), 391 (vw), 406 ( s )
Marcasite . . . . . . . . . . . 285 (w), 321 (m), 350 ( m ) , 396 ( s ) , 407 (s) , 422 (vw)
Kaolinite . . . . . . . . . . . . 268 (m), 338 (m), 352 (vw, sh), 405 (VW. sh), 422 (m), 460 ( s ) , 528 ( s ) . 689 (m) , 747 (w).
1095 ( s ) , 3622 (m) , 3652 (w) , 3670 (vw), 3698 (m)
7 0 7 I..., Ann . [ w ) , T W O \s), 929 iw, snj, i0Oi ( s i , iU26 ( s ) ,
* ** Data from reference (21).
Very weak = vw; weak = w; medium = m ; strong = s; shoulder = sh .
/
f
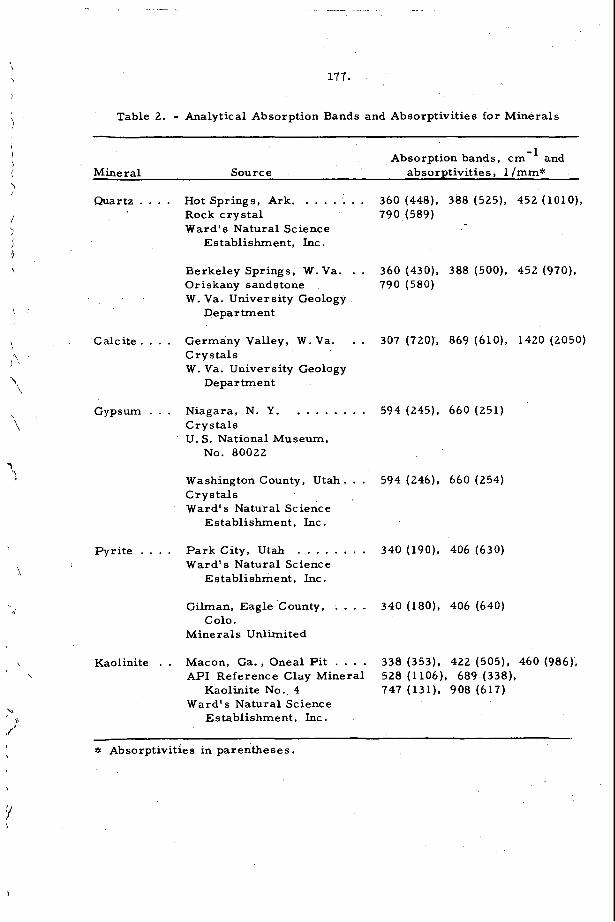
Table 2. - Analytical Absorption Bands and Absorptivities for Minerals
-1 Absorption bands, cm and Mineral Source absorptivities, 1 /mm*
Quar t z . . . .
'Calcite. . . .
Gypsum . . ,
Pyrite . . . .
Kaolinite . .
Hot Springs, Ark. . . . . . . . Rock crystal Ward's Natural Science
Establishment, Inc.
Berkeley Springs, W.Va. . . O r i skany sands tone W. Va. University Geology
Department
Germany Valley, W. Va. . . Crystals W. Va. University Geology
Department
Niagara, N. Y. . . . . . . . . Crystals U. S. National Museum,
No. 80022
Washington County, Utah. . . Crystals Ward's Natural Science
Establishment, Inc.
Pa rk City, Utah Ward's Natural Science
. . . . . . . . Establishment, Inc.
Gilman, Eagle County,
Minerals Unlimited
. . I Colo.
Macon, Ga., Oneal Pi t . . . . API Reference Clay Mineral
Ward's Natural Science Kaolinite No. 4
Establishment, Inc.
360 (448), 388 (525), 452 ( l o l o ) , 790 (589)
360 (430), 388 (500), 452 (970), 790 (580)
307 (720), 869 (610), 1420 (2050)
594 (245), 660 (251)
594 (246), 660 (254)
340 (190). 406 (630)
340 .(180), 406 (640)
338 (353), 422 (505), 460 (986), 528 (1106), 689 (338), 747 (131), 908 (617)
- ~~
* Absorptivities in parentheses.
178.
gypsum shifts to 669 cm-’ in anhydrite, and the water vibrations appearing a t 1615, 1680, 3400, and 3555 cm-’ a r e unique f o r gypsum. differences between the hemihydrate and anhydrite.
Data in Table 1 also show the
Pyri te . Both polymorphs of FeS,, pyrite and marcasi te , have been identi- fied in coal (5, 2, 36). White (37) has presented infrared data to 400 c m - l which is insufficient for differentiation between these two polymorphs. However, the infra- red spectra to 200 cm” obtained on samples in this laboratory show that these two polymorphs a r e distinguishable in this region. site exhibits two bands common to pyrite, there a r e four distinctly different bands which uniquely characterize this polymorph. Fur ther , the band a t 340 c m - l , which is unique for pyrite, allows detection of pyri te in marcasi te samples. These infra- red differences, along with X-ray confirmation, established the phase purity of the pyrite standards selected for calibration and thus a l so the qualitative identification of pyrite a s the observed f o r m occurring in the coal samples studied. It was par- ticularly important to establish by X-ray that no pyrrhotite (FeS) was present in the standard samples since this minera l h a s no absorption in the entire 5000 to 200 cm’* region. Optical examination is a lso often unreliable for this mineral c lass since out of 1 5 different mineral specimens labeled marcasi te , two were pyrrhotite, six were pyrite, and only seven were actually marcasi te a s shown by infrared analysis.
Table 1 shows that, although marca-
Kaolinite. Clays other than kaolinite a r e found in coal. Kaolinite can be identified by infrared in mixtures of clay minerals and even in mixed-layer c l a y minerals (2). Montmorillonite, illite, and kaolinite predominate in many coals and An in0 (4) has discussed the infrared spectral differences among these out to 90 cm- . The OH region is especially useful in the qualitative identification of kaolinite. Kodama (18) s ta tes that the absorption band at 3698 c m - l can distinguish kaolinite f rom other clay minera ls down t o a few weight-percent of kaolinite in total amounts of clay minerals . appearing in the OH region, along with other spectral differences, enables a unique distinction to be made among the kaolin group minerals of kaolinite, dickite, and halloysite. This l i terature data, and data obtained in our laboratory f r o m a num- ber of API reference clay minerals , were used to substantiate the identification of kaolinite in the coal low-temperature ash samples and a s a guide in the selection of bands for quantitativ.e analysis.
9 -
Lyon (22) has shown that the use of ra t ios for bands
Quantitative Analysis
The apparent absorptivity of a band was calculated f rom the relationship:
where a = absorptivity in units of l f m m ; A = absorbance of the band (baseline technique); b = pellet thickness, rrun; c = concentration, weight-percent.
The value of absorptivity is specific for a 13 m m diameter pellet.
I’ \
179.
After completion of grind studies for each mineral , bands were selected for quantitative analysis. These selections were based on both their specificity and the constancy of their absorptivities with prolonged grinding. bands selected for analysis. When it is necessary, for the sake of specificity, to use a band which does not remain constant with particle s ize reduction beyond the minimum grind time, the e r r o r introduced must be considered.
Table 2 l i s t s the
Only one source for kaolinite was used for the calibration data because there is extensive mineralogical data for i t in the l i terature. a r e the results of duplicate grind studies that were quite reproducible. source of calcite was used because of the wide variation of absorptivity values f rom different sources , even though their spectra were qualitatively identical and their particle s izes were the same. used for synthetic mixtures and for calibration data in order to obtain agreement. Additional work is required to resolve this limitation by examination of these samples by other analytical techniques in order to determine the cause for such a variation.
The data. in Table 2 Only one
Therefore, calcite f rom the same source was
Several synthetic mixtures, listed in Table 3 , were prepared to tes t the accuracy of the multicomponent analysis. Preground standard mineral samples of the required particle size were used and the same technique for pellet preparation used a s described for the mineral standards. The concentration ranges of the pure minerals were selected to represent the concentration ranges commonly encoun- tered in the coal samples examined. of detectability for each mineral since this was different for different sample com- positions. approximated the composition of a typical coal low-temperature ash a s shown in Figure 1, curve (c) . except for the gypsum-hemihydrate conversion. When band overlapping occurred, the required absorbance correction was obtained from the standard spectra of the interfering mineral , using the standard procedures for quantitative analysis. An expedient technique of char t overlay to obtain background and band overlapping corrections was a s accurate as the more t ime consuming pro- cedure of matr ix solution. The agreement shown in Table 3 , within an average e r r o r of 6. 270 for all minerals , demonstrates the method to be satisfactory for the multicomponent mixtures investigated. It is difficult, without an independent reliable method of analysis, to determine the accuracy l imits of the infrared method when applied to coal ash samples. Greater accuracy is expected with the synthetic mixtures since they were prepared under controlled conditions of par- ticle size and contained no unknown interferences. In our work it was necessary to pregrind coal samples to speed oxidation in the low-temperature asher . This pregrinding was sufficient to achieve the required particle size reduction for an accurate quantitative analysis, a s ascertained by particle size measurements on the ash. Optimum particle s ize was also indicated for a t least the minera l kao- linite from a grind study using its bands that appear fairly well resolved in the spectrum of the total coal sample ( see Fig. 1). Figure 2 were obtained with a relatively small increase in absorptivity before becoming constant. ture pr ior to analysis in order to establish when the required particle s ize reduc- tion for each component in the mixture has been achieved. should be made only after absorptivity values have become constant and particle size has been checked.
No attempt was made to determine the limit
Figure 3 shows the infrared spectrum of synthetic mixture No. 7, which
Grind curves similar to those in
It is essential to conduct a grind study on any mineral mix-
The infrared analysis
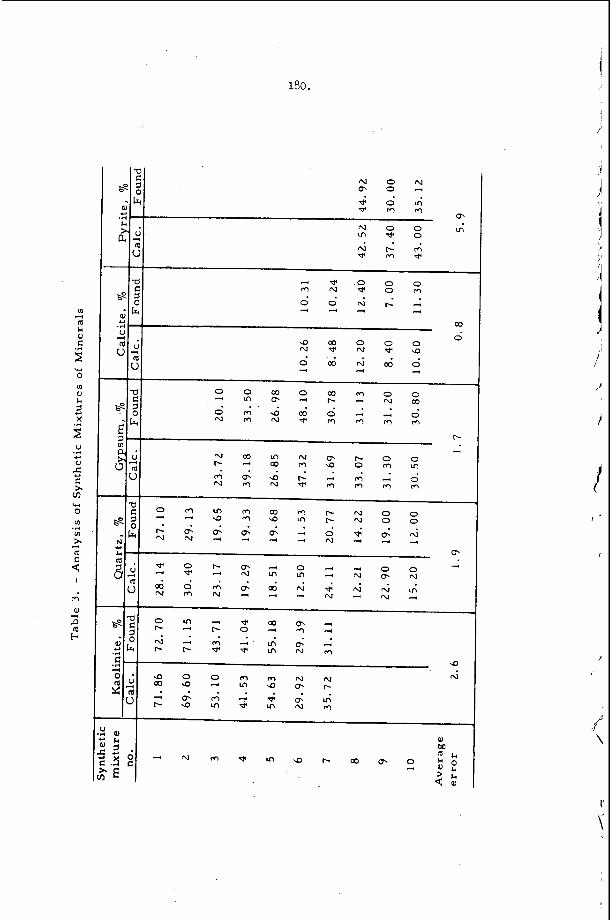
180.
m m
I I I
CO U I .A
. . . . . .
r-
u l lie I I 3
9
ru
181.
A limitation of the application of infrared spectroscopy to mineral mixtures in coal i s in the analysis of pyrite in the presence of high amounts of kaolinite (2). Both of the analytical bands of pyrite a r e overlapped considerably by kaolinite bands and amounts of pyrite as high as 2070 might be undetected when kaolinite i s present to the extent of 30% or greater . F o r this reason, no attempt was made to analyze synthetic mixtures containing both. analysis for kaolinite-pyrite mixtures when kaolinite content is high.
Work is continuing to develop a satisfactory
CONCLUSIONS
This paper descr ibes the development of a quantitative infrared multicom- ponent analysis for five minerals commonly occurring in coal. successful analysis for quartz, calcite, gypsum, pyrite, and kaolinite is possible if sampling conditions a r e controlled. The infrared region of 650 to 200 c m - l i s seen to contain data that contribute to both the preliminary qualitative and the quan- titative analysis of these mixtures. The accuracy of the method was evaluated with tes t s on synthetic mixtures. Average e r r o r s were within 6. 2% fo r all five com- ponent minerals. unaltered mineral mat ter obtained from coal by use of the new technique of low- temperature ashing in a n oxygen plasma, the calibration data obtained can be used in the analysis of other mater ia ls connected with the mining and utilization of coal. F o r example, we have determined these minerals directly in coal mine refuse samples, which often have low organic mat ter content. analysis revealed that infrared spectroscopy i s a valuable tool for differentiating among various polymorphic mineral forms and provides a collection of high r e so - lution standard reference spectra for naturally occurring minerals and their poly- morphs to 200 c m - l .
It shows that a
Although the method was pr imari ly applied t o the analysis of
The development of the
ACKNOWLEDGMENT
Special thanks a r e due to Edward E. Childers for assistance in obtaining infrared spectra, and to Dr. John J . Renton, Geology Department, West Virginia University, for providing X-ray data on the mineral samples.
REFERENCES
1 . Adler, H. H . , E. E. Bray, N. P. Stevens, J. M. Hunt, W. D. Keller, E. E. Pickett, and P. F. K e r r , Am. Pet ro l . Inst . , Project 49, Prel iminary Rept. No. 8, July 1950, 146 pp.
2. Adler, H. H. , and P. F. K e r r , Am. Mineralogist 48, Nos. 1-2, 124 (1963).
. Am’. Mineralogist 41, Nos. 5-6, 700 (1962). 3 . - 4. Angino, E. E . , Nature - 204, No. 4958, 569 (1964).
5. Baker, A. W . , J. Phys. Chem 61. No. 4, 450 (1957).
6.
7. Burns, J. H . , a n d M . A. Bredig, J. Chem. Phys. 2, NO. 6 , 1281 (1956).
- Brown, H. R., and D. J. Swaine, J. Inst. Fue l 37, No. 285, 422 (1964).
182.
8. Dachille, F . , and R. Roy, Nature - 186, No. 4718, 70 (1960).
9. Durie, R. A . , Fue l - 40, No. 5, 407 (1961).
10. Duyckaerts, G. , Analyst - 84, 201 (1959).
11. F r i ede l , R. A . , and J. A. Queiser, Anal. Chem. 28, No. 1 , 22 (1956).
12.
13. Harshaw Chemical C o . , P r e s s e d Pellet Techniques, Data Sheet 023.
14. Hunt, J. M . , and D. S. Turner , Anal. Chem. 25, No. 8, 1169 (1953).
15. K a r r , C . , J r . , P. A. Estep, and J. J. Kovach, Chem. Ind. (London) 9 , 356
Gluskoter, H. J., Fue l - 44, No. 4, 285 (1965).
- -
(1967).
16. Kemezys, M . , and G. H. Taylor, J. Inst. Fuel - 37, No. 285, 389 (1964).
17. Kirkland, J. J., Anal. Chem. 27, No. 10, 1537 (1955). - 18. Kodama, H . , and K. Oinuma, Proc. Nat. Conf. on Clays and Clay Minerals, - 1 l th , Canada, 236 (1962).
19. Lejeune, R., and G. Duyckaerts, Spectrochim. Acta - 6, 194 (1954).
20.
21. Lippincott, E. R., A. VanValkenburg, C. E. Weir, and E. N. Bunting. J.
Liberti , A. , and G . Devitofrancesco, Staub. 25, No. 4, 28 (1965).
Res. Natl. Bur. Std. - 61, No. 1 , 61 (1958).
22. Lyon, R . J. P . , and W. M. Tuddenham, Nature 185, No. 4716, 835 (1960).
23. Lyon, R. J. P . , W . M. Tuddenham, and C. S. Thompson, Econ. Geol. 54, 1047 (1959).
24. McDevitt, N. T., and W. L. Baun, Tech. Doc. Rept. No. RTD-TDR-63-4172, AF Materials Lab . , Wright-Patterson Air F o r c e Base, Ohio, Jan. 1964, 77 PP.
25. Mil ler , F. A . , C. L. Carlson, F. F. Bentley, and W . H. Jones, Spectrochim. A c t a s , Nos. 1-2, 135 (1960).
26. Miller, F. A . , and C. H. W i l k i n s , Anal. Chem. 2, No. 8, 1253 (1952).
27. M o r r i s , R . J . , J r . ,
/ 1
Anal. Chem. - 35, No. 10, 1489 (1963). \
28. Nelson, J. B . , Brit. Coal U t i l . Res.. Assoc., Monthly Bull. 17, No. 2, 41 (1953).
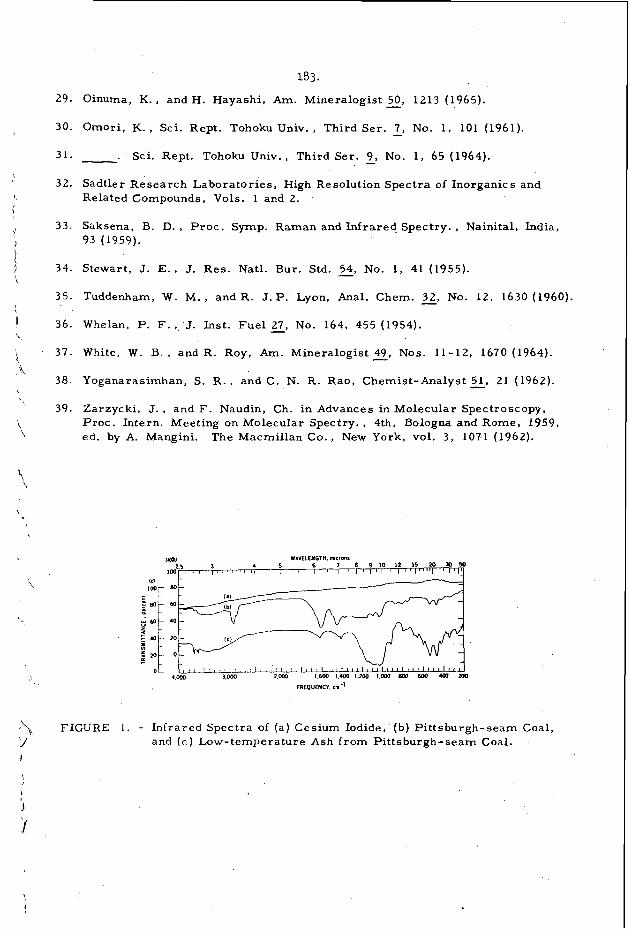
29.
30.
31.
32.
33.
34.
35.
36.
37.
38.
39.
183.
Oinuma, K . , and H. Hayashi, Am. Mineralogist 50, 1213 (1965).
Omori, K . , Sci. Rept. Tohoku Univ., Third Ser. 1, No. 1. 101 (1961).
. Sci. Rept. Tohoku Univ., Third Ser. 9 , No. 1 , 65 (1964).
-
- - Sadtler Research Laboratories, High Resolution Spectra of Inorganics and Related Compounds, Vols. 1 and 2.
Saksena, B. D. , Proc. Symp. Raman and Infrared Spectry. , Nainital, India, 93 (1959).
Stewart, J. E. , J. Res. Natl. Bur. Std. 2, No. 1, 41 (1955).
Tuddenham, W. M., and R. J. P. Lyon, Anal. Chem. 32, NO. 12, 1630 (1960).
Whelan, P. F. , J. Inst. Fue l 27, No. 164, 455 (1954).
White, W . B . , and R. Roy, Am. Mineralogist?, Nos. 11-12, 1670 (1964).
Yoganarasimhan, S . R., and C. N. R. Rao, Chemist-Analyst%, 21 (1962).
Zarzycki, J . , and F. Naudin, Ch. i n Advances in Molecular Spectroscopy, Proc. Intern. Meeting on Molecular Spectry. , 4th, Bologna and Rome, 1959, ed. by A. Mangini. The Macmillan Co. , New York, vol. 3 , 1071 (1962).
-
FIGURE 1 . - Infrared Spectra of (a) Cesium Iodide, (b) Pit tsburgh-seam Coal, and ( c ) Low-temperature Ash from Pittsburgh-seam Coal.
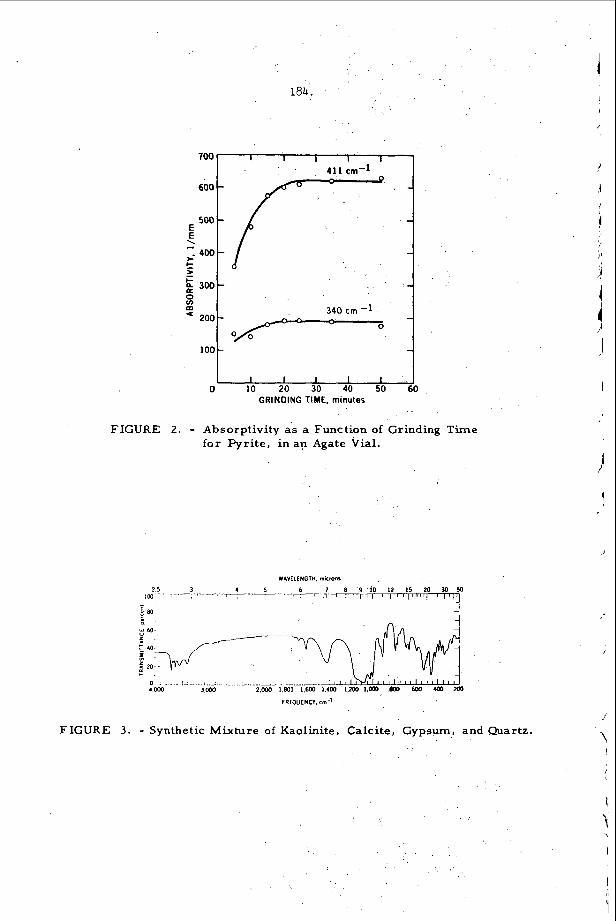
184.
700
E E
.+ 400 *- k 2
\
c 300
s: m
200-
100
0
I I I I 1
411 cm-l
I - -
- d
340 cm -1 r - -
0
- -
I I I 1 I 10 20 30 40 50 60
FIGURE 2. - Absorptivity as a Function of Grinding Time for Pyrite , in an Agate Vial.
WAVELENGTH. microns
3 6 I 8 ' 9 1 0 12 I5 M 3 0 5 0 , ' 5,- , . , , , , , r ' , , , , ' , ' " ? , , (
2 5 l ~ . - . ~ __ R 80.
FIGURE 3 . - Synthetic Mixture of Kaolinite, Calcite, Gypsum, and Quartz.
1
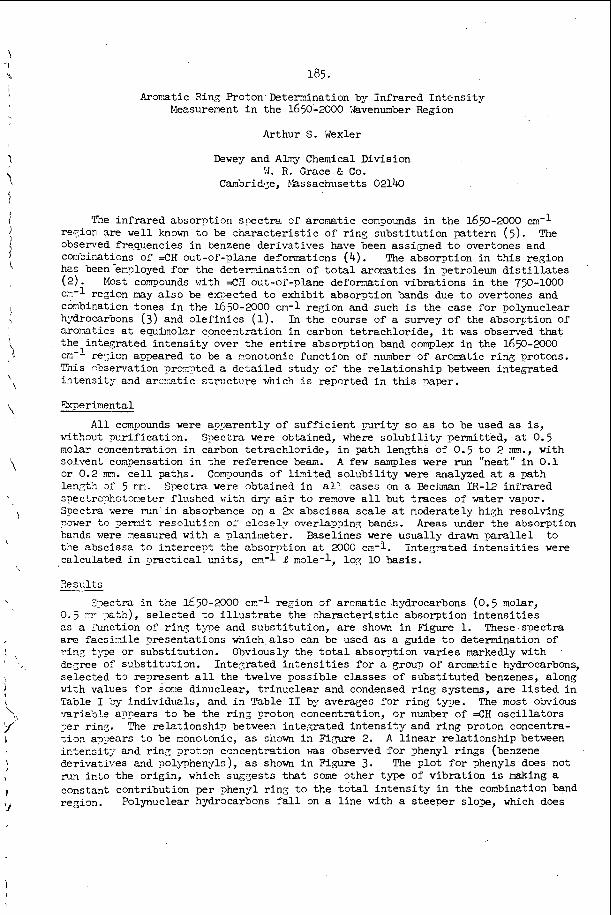
185.
Aromatic Ring Proton Determination by Inf ra red In t ens i ty Keasurenent i n the 1650-2000 Yavenumber Region
Arthur S. Wexler
Dewey and ALny Chemical Division ! I . R. Grace Ec Co.
Canbri&;e, bkissachusetts 02140
The inf ra red absorgtion snec t ra of aromatic con?ounds i n the 1650-2000 cm-l reyian are w e l l known t o be cha rac t e r i s t i c of r ing subs t i tu t ion pattern (5) . observed frequencies i n benzene derivatives have been assi,gned t o overtones and com';.inations of =CH out-of-plane defonraticns (4). h a been e?.?loyed fo r the d e t e n i n a t i o n of t o t a l a r o m t i c s i n petroleum d i s t i l l a t e s (2) .
co3bination tones i n the 1650-2000 c m - 1 region and such is the case for polynuclear h:drocarbons (3) and o l e f in i c s (1). In the course of a survey of the absorption of a rora t ics at equimolar concentration in carbon tetrachloride, it was observed that the in tecra ted in t ens i ty over the e n t i r e absorption band complex i n the 1650-2000 cm-' re:;ion a p x a r e d t o be a nonotonic function of number of aromatic r ing protons. Tiis -he rva t ion prox?ted a de ta i l ed study of the re la t ionship between integrated intensit:: and arcxz t ic s t r x t a - e vnich is repcrted i n t h i s 9aper.
The
The absorption i n t h i s region
Most comDounds v i t h =CH ou.t-of-plane d e f o m t i o n v ibra t ions i n the 750-1000 reZion may a l s o be e-ected t o exhibit absorption bands due t o overtones and
Zxxperimental
A l l compounds were aF.mrently of su f f i c i en t pu r i ty s o as t o be used as is, ~ t t h o u t p x i f i c a t i z n . Snectra were obtained, where s o l u b i l i t y permitted, a t 0.5 molar concentration i n carbon tetrachloride, i n path len*hs of 0.5 t o 2 mm., with solvent coxpensation i n the reference beam. o r 0.2 m. c e l l paths. ComFounds of l i n i t e d so lub i l i t y were analyzed a t a path l e q t h sf 5 mi. Spectra were obtained i n a].?. cases on a Becimn IR-12 inf ra red opectrc;photor!eter i h s h e d with dry air t o rerxove a l l but t races of water vapor. Spectra were m ' i n absorbance on a 2x absc issa sca le a t noderately high resolving ?over t o 3ermit resolution of c lose ly overlapping bands. Areas under the absorption bands were rneasured with a planirneter. the abscissa t o in te rcegt the abso-tion a t 2000 m-1. calculated i n F rac t i ca l un i t s , cn-1 1 mole-1, 10.3 10 basis.
A few samples were run "neat" i n 0.1
Baselines were usually drawn p a r a l l e l t o Integrated in t ens i t i e s were
33ectra in the l 6 5 O - N O c2-l region of a rcna t ic hydrocarbons (0.5 molar, 0.7 xr. :%tin), selected t o i l l u s t r a t e the charac te r i s t ic absorption in t ens i t i e s 2 s a :?unction of r i m y t-fle and subs t i tu t ion , a r e shown i n Figure 1. These.spectra are f acs i ? i l e presentations which a l s o can be used as a guide t o deternination of rir?; t ; ~ o r subs t i tu t ion . dezree of sv .5s t i tu t im. In tezra ted i n t e n s i t i e s for a of aromitic hydrocarbons, selected t 2 repr$sent a l l the twelve possible c lasses of subs t i tu ted benzenes, along with values f o r sorie binuclear, t r i ncc l ea r and condensed r ing systems, are l i s t e d i n
The most obvious - a r i e b l e apnears t o be the r i n z proton ccncentration, or number of =CH osc i l l a to r s Ter ring. :im aF3ears t o be monotonic, as siiown i n F i ? g r e 2. A l i nea r re la t ionship between inter.sit:: and r i n z ?raton ccncentration was observed fo r phenyl rings (benzene derivatiyies and nolJThenyls), as shown i n Figure 3. run i n to the origin, which susgests that some other type of vibra t ion i s making a constant contribution per phenyl r ing t o the t o t a l i n t ens i ty i n the combination band rezian.
Obviously the t o t a l a b s o p t i o n varies narkedly with
m - i ao le I by individuals, and i n Table I1 by avera-zes f o r r ing ty-pe.
The re la t ionship between inteqrated in t ens i ty and r ing proton concentra-
The p lo t f o r phenyls does not
Polynuclear hydracarbons f a l l on a l i n e with a s teeper slope, which does
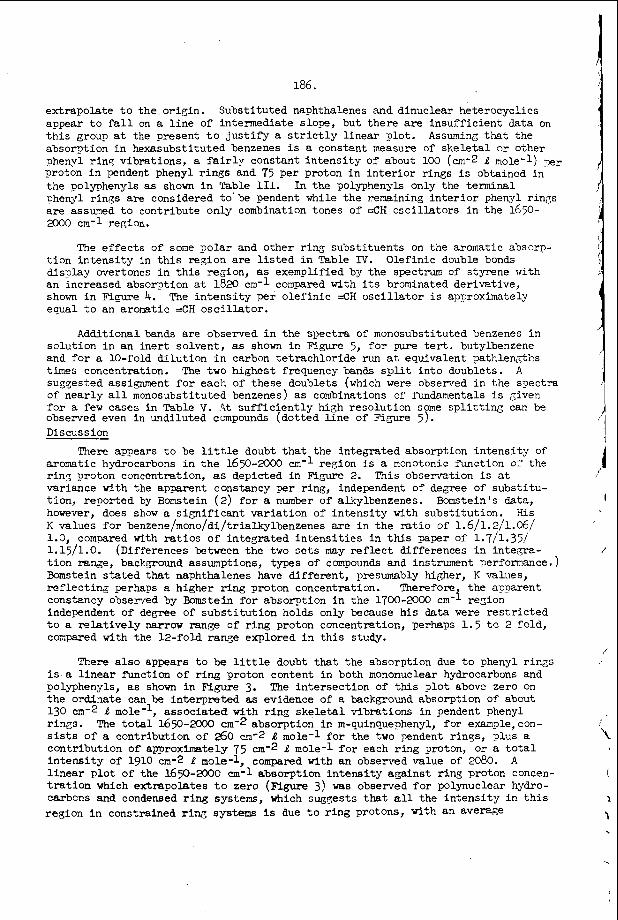
186.
extrapolate t o the or ig in . appear t o f a l l on a l i n e of intermediate slope, but t he re are insuf f ic ien t data on t h i s group a t the present t o j u s t i f y a s t r i c t l y l i nea r p lo t . abso-tion i n hexasubstituted benzenes i s a constant measure of ske le t a l o r other nhenvl rinq vibrations, a f a i r l y constant i n t e n s i t y of about 100 (cm-2 e mole-1) Ter proton i n pendent phenyl rings and 75 Per proton i n i n t e r i o r rings is obtained in the polyphenyls as shown i n lkb le 111. phenyl rings a re considered t o be pendent while the remaining i n t e r i o r phenyl rings a re assumed t o contribute only combination tones of =CH osc i l l a to r s i n the 1650- m o cm-1 region.
Substi tuted naphthalenes and dinuclear heterocyclics
Assumins that the
In the polyphenyls only the terminal
The e f f ec t s of sone po la r and other r ing subs t i tuents on the aromatic absorp- t i o n in t ens i ty in this reZion are l isted i n Table N. display wertones i n t h i s region, as exemplified by the spectrum o f styrene with an increased absorption a t 1820 cm-I compared with i ts brominated derivative, shown i n Mgwe 4. e q m l to an aronat ic =CH o s c i l l a t o r .
Olefinic double bonds
The i n t e n s i t y per o l e f in i c =CH o s c i l l a t o r is approximately
Additional bands are observed i n the spec t ra of monosubstituted benzenes i n so lu t ion i n an ine r t solvent, as shown i n Figure 5, f o r pure tert . butylbenzene and f o r a 10-fold d i lu t ion i n carbon te t rachlor ide run at equivalent pathlengths times concentration. The two highest frequency bands spli t i n t o doublets. A sugzested assignment f o r each of these doublets (which were observed i n the spectra of near ly a l l monosubstituted benzenes) as combinations of fundamentals i s Given f o r a f e w cases i n Table V. p i t s u f f i c i e n t l y high reso lu t ion some s p l i t t i n g can be observed even in undiluted compounds (dotted l i n e of Figure 5). Discussion
There appears t o be l i t t l e doubt t h a t the in tegra ted absorption in t ens i ty of a rona t ic hydrocarbons i n t h e 1650-xxx, cn-l region i s a monotonic f'unction oi the rini: proton concentration, as depicted i n Fi,o;ure 2. This observation i s a t variance with the apparent constancy per ring, independent of degree of subs t i tu - t ion , r e p o ~ e d by Bornstein (2) f o r a number of alkylbenzenes. Bomstein's data, however, does show a s i p i f i c a n t va r i a t ion of i n t ens i ty with subs t i tu t ion . His K values f o r benzene/mono/di/trialkylbenzenes a r e i n the r a t i o of 1.6/1.2/1.06/ 1.0, compared with r a t i o s of inte-gated i n t e n s i t i e s i n this paper of 1.7/1.35/ 1.1511.0. t i o n range, backp-ound assumptions, types of compounds and instrument performance.) Bornstein stated that naphthalenes have d i f fe ren t , presumably higher, K values, r e f l ec t ing perhaps a higher r ing proton concentration. Therefore the apparent constancy observed by Bomstein f o r absorption i n the 1700-2000 independent of degree of subs t i t u t ion holds only because h i s data were r e s t r i c t e d t o a r e l a t i v e l y narrow range o f ring proton Concentration, perhaps 1.5 t o 2 fold, cozpared with the 12-fold range explored i n t h i s study.
(Differences between the two s e t s m y r e f l e c t differences i n in t e ,qa -
region
There a l s o appears t o be l i t t l e doubt that the absorption due t o phenyl r i q s is a l i n e a r h n c t i o n of ring proton content in both mononuclear hydrocarbons and polyphenyls, as shown i n Figure 3. The in te rsec t ion of this p l o t above zero on the ordinate can be in t e rp re t ed as evidence of a background absorption of about 130 cn-2 1 mole-l, assoc ia ted with r i n z s k e l e t a l vibrations i n pendent Dhenyl rings. sists of a contribution of 260 cn-2 contribution of approximately 75 cm-2 .e mole-1 f o r each r ing proton, o r a t o t a l i n t e n s i t y of l 9 l O cm-2 4 mole-1, compared with an observed value of 2080. l i n e a r ? l o t of the l65O-2OOO cm-1 absorption in t ens i ty aga ins t r i ng proton concen- t r a t i o n which extrapolates t o zero (Figure 3) was observed f o r polynuclear hydro- carbcns and condensed r i n g system, which sugcests that all the in t ens i ty i n t h i s region i n constrained riw systems is due t o r i n g protons, with an average
The t o t a l 169-2000 c m - 2 absorption i n m-quinquephenyl, fo r exauple, c m - mole-1 f o r t he two pendent rinqs, plus a
A
187.
i n t ens i ty per proton of about 130 cm-2 l mole-I. For example the integrated absorp- t i o n in t ens i ty of 20-methylcholanthrene i n the 1650-zwo cm-l region was found t o be 1168 l mole-1 (Table I ) , equivalent t o a value of 8.9 arcrmatic protons per molecule, comgared with a formula value of 9.
Rubrene would present a complex case, since it contains 4 phenyl r ings attached t o a naphthacene skeleton. Conpound (not yet measured) the lover and upper limits of numbers of aromatic protons Per molecule would be estimated by in f r a red t o be 24 t o 30, compared with a formula value of 28. (Provided the molecular weight is known) t o within f. lo$ of the formula value of the infrared technique of this paper.
If the i n t e n s i t y r e h t i o n s in Table I1 apply t o t h i s
A reasonable expectation i s the determination of aromatic protons
On the basis of in tegra ted i n t e n s i t y measurements, it appears reasonable t o include a band near 1620-1640 i n para alkylbenzenes with the combination tones. Its inclusion on a frequency basis has already been j u s t i f i e d by lWhiffen(4).
Sha-ening o f peaks and s p l i t t i n g of bands w e r e observed f o r monoalkylbenzenes and other aromatics, as depicted i n Mgures 1 and 5. i n t ens i ty was found t o be e s s e n t i a l l y constant i n the range 0.5 molar t o 6 molar (approximately 10 times diluted, and undiluted). the two hiShest frequency bands of t h e 1650-2000 cm-I set, near 1860 and 1945 cm-l , have been d e s i e a t e d as i+h and h+j, summation tones by "Jhiffen (4) . su f f i c i en t ly high r e s s lu t ion partial s 2 l i t t i n g of one or both of these bands can be observed. More complete s p l i t t i n g was observed i n non-interacting solvents such as hexane, carbon te t rachlor ide and carbon d i su l f ide and the peaks were found t o be narrower. sunmation band but t he three remaining peaks a t 1880, 1938 and 1955 cm-I appear t o be, respectively, i+j, 2h and 23 bands. L i t t l e or no s p l i t t i n g was observed i n solutions i n chloroform and methylene chloride. these solvents (and t h e r ing proton of undiluted aromatics) i s ab le t o complex with the rl electron o r b i t a l s of the nonosubstituted benzene ring i n such a way as t o cause the s p l i t bands t o overlap and merge i n t o broader bands.
The t o t a l 1650-2000 cm-l
I n t he monosubstituted benzenes
Under
The 1865 cm-1 peak of monoalkylbenzenes apparently i s an i+h
Presumably the ac id i c hydrogen i n
It i s gossible t o estimate t h e a r o m t i c proton content of compounds (benzenoid and heterocyclics) fron the inf ra red absorption i n t e n s i t y i n the 1650-NO cm-I reZion usin!: averaxe i n t e n s i t i e s (cn-2 E mole-1) f o r each ring proton of 100 f o r mononuclear, 120 for dinuclear, and 130 f o r polynuclear hydrocarbons. The number 3f r ing protons i s then the t o t a l 1650-2000 cm-1 i n t e n s i t y divided by the appro- p r i a t e un i t value. As i n any spectroscopic measurement, t he molecular weight nust be known t o car ry out t h e ana lys i s . Interference by o le f ins can be handled 5g se lec t ive broinination o r hydrogenation. The in t ens i ty of styrene (which con- t a ins a conjugated double bond) i n this region was found t o be equivalent t o 7 protons. equivalent t o 5 protons, demonstrating se l ec t ive disappearance of an i n t e r f e r ing croup without disturbing t h e r i n s proton contribution.
After bromination (cf. Figure 4) t he i n t e n s i t y was observed t o be
Literature Cited
(1) Eel lamy, L. J., "The Inf ra red Spectra of Complex Molecules," Niley, New York,
I 3) W o n , I!. and Josien, M. LYJ. Am.Chem. SOC. 78 3049 (1946). (4) '&iffen, D. E., Spectrochim. A c t a 7 253 (1955r ( 5 ) Yaun,?, C. :.J. , DuVall, R. E., Wright, N., Anal. Chem. 23 709 (1951).
1958. 2) Bomstein, J., ha l . Chem. 25 1770 (1953).
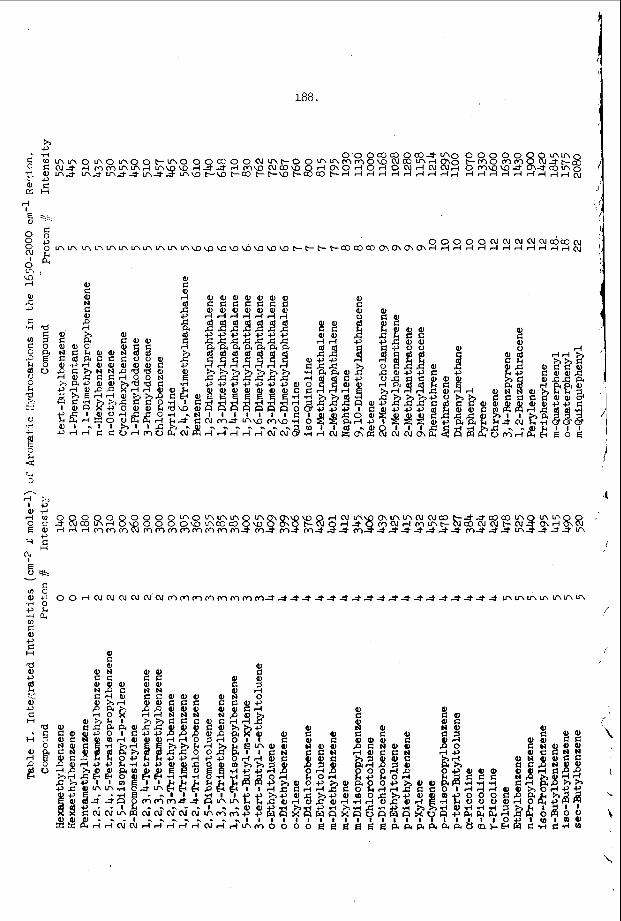
P) s
188.
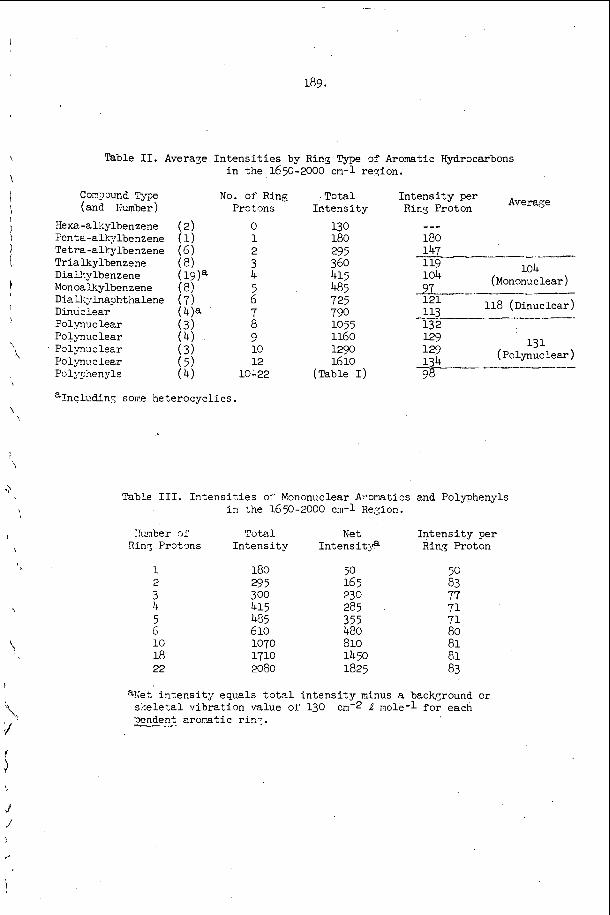
189.
Table 11. Averaze I n t e n s i t i e s by Rin3 Type of Aromatic Hydrocarbons i n the l65O-2000 cn-1 reZion.
Coqound Type (and IIumber)
Xexa -alkylbenzene Penta-alkylbenzene Tetra -aU.ylbenzene Trialkylbenzene Dialkylbenzene Monoalkylbenzene D i a UglnaFhthalene Dinuclear Polynuclear Polynuclear Polynuclear Polynuclear Pol jT:?enyls
No. oi Ring Protons
0 1 2 3 4 5 6 7 8 3 10 12
10-22
Total In tens i ty
130 180 29 5 360 415 485 725 790 1055 1160 1290 16 10
(Table I )
In tens i ty per Ring Proton Average
--- 180 147 - 119 104 104 (Mononuclear)
aIncludiny soFe heterocyclics.
Table 111. I n t e n s i t i e s or Mononuclear &omt ic s and Polfihenyls i n the 1650-2000 cm-1 ReZion.
I!urnber of Rin? Protons
1 2 3 4 5 6 10 18 22
Total In tens i ty
180 29 5 300 415 495 6 10 1070 1710 2080
N e t Intensit)+
50 16 5 230 28 5 355 480 810 1450 1825
I n t e n s i t y per R i x Proton
50 83 77 71 7 1 80 81 81 83
W e t i n t e n s i t y equals tq ta l i n t e n s i t y minus a background o r s k e l e t a l v ibra t i sn value of 130 Dendent a r o r a t i c rin-;.
cn-2 1 mole-1 f o r each
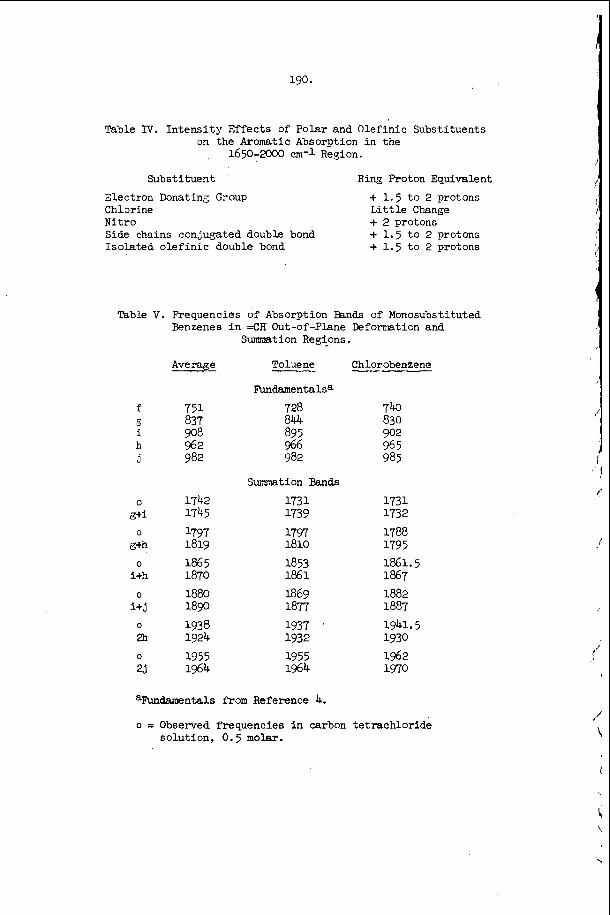
190.
Table IV. In t ens i ty Effec ts of Polar and Olefinic Substituents on the Aromatic Absorption i n the
. 1650-EQOO cm-1 Region.
Substi tuent Ring Proton Equivalent
Electron Donatins Group Chlorine L i t t l e Change Nitro + 2 protons Side chains conjugated double bond + 1.5 t o 2 protons Isolated o l e f in i c double bond + 1 .5 t o 2 protons
+ 1.5 t o 2 protons
Table V. Frequencies of Absorption mnds of Monosubstituted €?enzenes i n =CH Out-of-Plane Deformation and
f -3 i h j
0
t3+i
E+h
i+h
i + J
2h
23
0
0
0
0
0
Average
751 837 908 962 982
1742 1745 1797 1819
1865 1870 1880 1890
1938 1924
1955 1964
Sumnation Regipns . Toluene C h l o r o b e n z
Fundamentalsa
728 740 844 830 895 902 966 96 5 982 985
Summation Bands
1731 1731 1739 1732 1797 1788 1810 179 5 1853 1861.5 1861 1867 1869 1882 1877 1887 1937 . 1941.5 1932 1930 1955 1962 1964 1970
aFundamentals from Reference 4.
o = Observed frequencies i n carbon te t rachlor ide solution, 0.5 molar.
I'
1
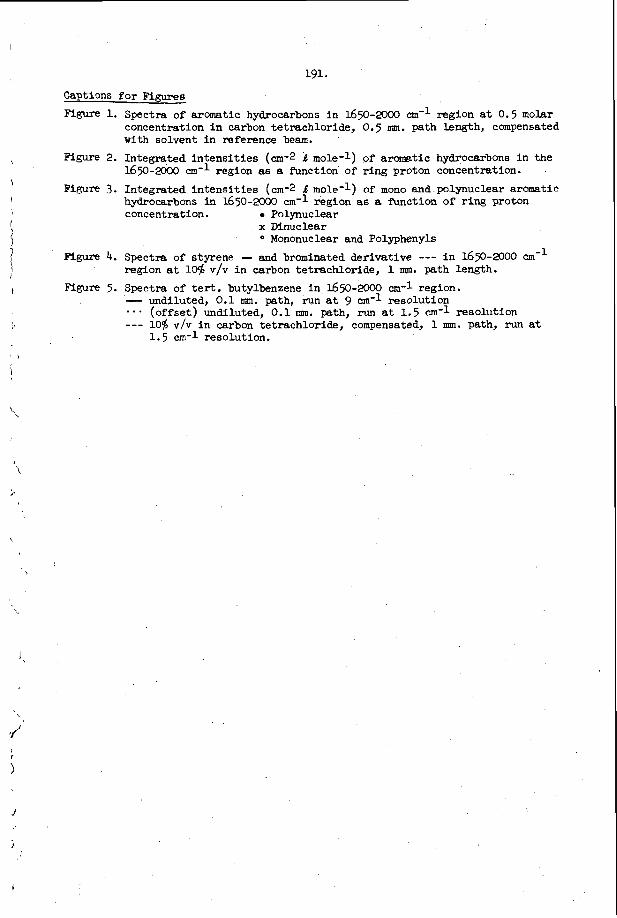
1
Captions for Fi-6
Mgure 1. Spectra of aromatic hydrocarbons i n 1650-XXx, cm-l region a t 0.5 molar concentration i n carbon te t rachlor ide, 0.5 nun. path length, compensated with solvent i n reference beam.
1650-ZQOO cm- l region a6 a f'unction of ring proton concentration.
hydrocarbons in 16.650-mOO c m - l region a6 a function of ring proton concentration. Polynuclear
=,We 2. Integrated i n t e n s i t i e s ( a - 2 8 mole-1) of aromatic hydrocarbons i n the
Me;uR 3. Integrated i n t e n s i t i e s (cm-2 8 mole-1) of mono and polynuclear aromatic
x Dinuclear Mononuclear and Polyphenyls
figure 4. Spectra of styrene - and brominated der ivat ive --- i n 1650-2000 cm-'
MguR 5. Spectra of t e r t . butylbenzene i n 1650-2000 an-1 region.
region at 109 v/v i n carbon te t rachlor ide, 1 m. path length.
- undiluted, 0.1 m. path, run a t 9 cm-l resolut ion . - * (of fse t ) undiluted, 0.1 m. path, run at 1,5 cm- l resolution --- 10% v/v i n carbon te t rachlor ide, compensated, 1 nun. path, run a t
1 .5 cm-1 resolution.
\
I
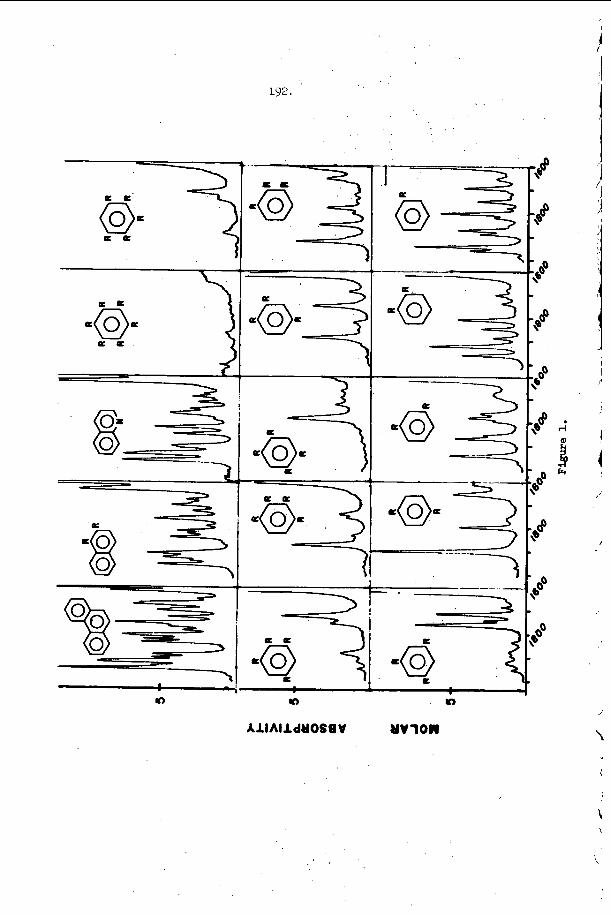
1y2. . .
. , .
a a
. - n
Al IAl ld11068V Y V l O N
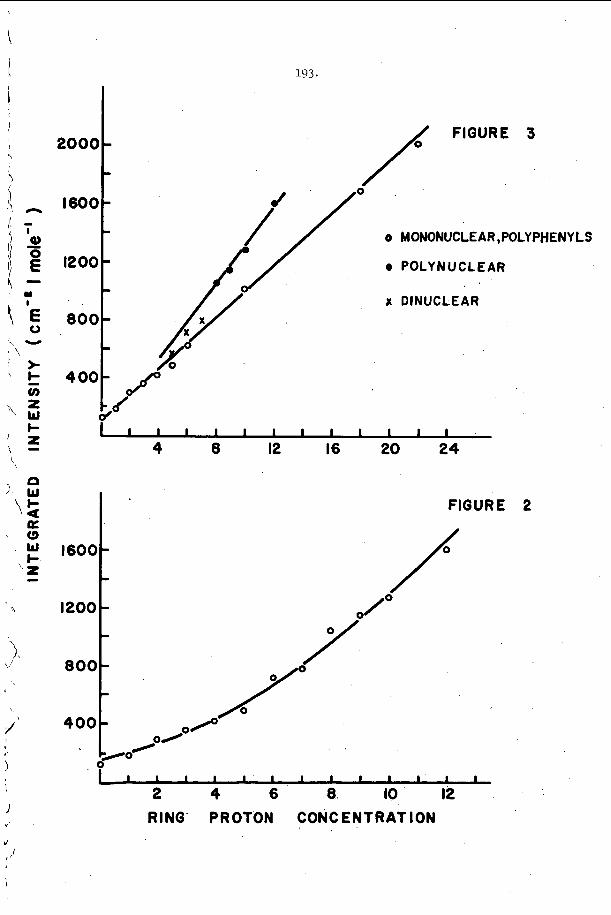
i
c ‘ 2 \ -
\
I
\
/
,,’ .
1 I I I I I I I I I I I I
4 0 12 16 20 24
F I G U R E 2 I * F I G U R E 2
/ 1200 - 4.”’ 1600 -
D
D / O
800 -
400 - O H O / / p/o
0 1 1 I I I I I I I I I I I
2 4 6 8 IO 12 RING PROTON CONCENTRATION
I 1 1 I I I I I I I I I I I
2 4 6 8 IO 12 RING PROTON CONCENTRATION
i
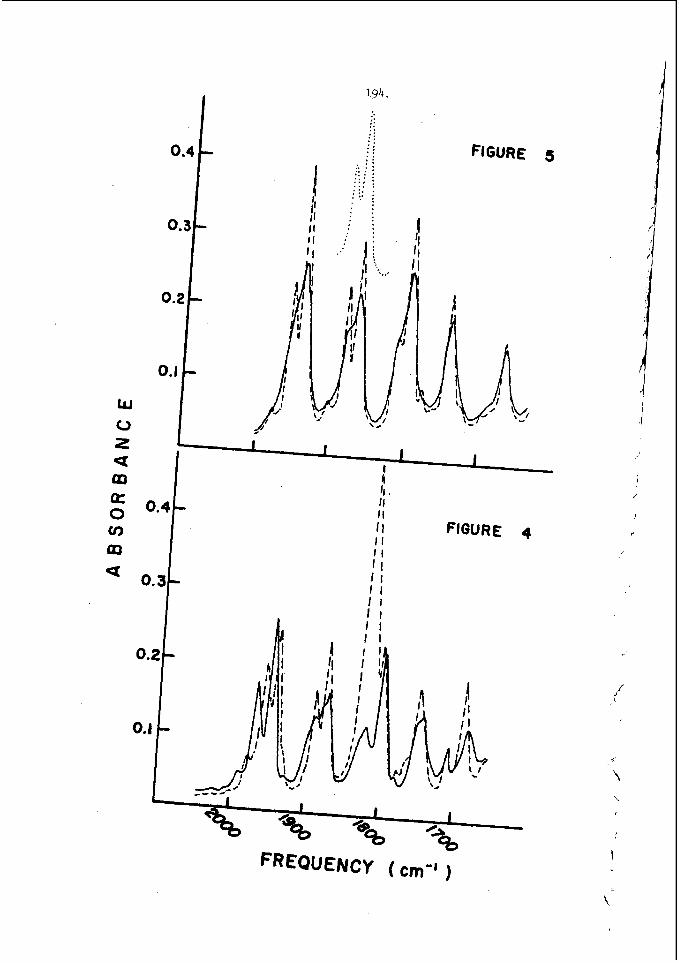
194.
:: ::
:: .: e . . . FIGURE 5
FIGURE 4
SPECTROSCOPIC STUDIES OF PHYSICO-CHEMICAL EFFECTS OF ULTRA-HIGH PRESSURES
J. W. BRASCH, R. J. JAKOBSEN, and E. JACK KAHLER
BATTELLE MEMORIAL INSTITUTE Columbus Laboratories
505 King Avenue Columbus, Ohio 43201
During r ecen t years-, a considerable volume of l i t e r a t u r e has appeared dea l - ing with pressure s tud ies . of the chemical e f f e c t s , on a molecular l eve l , produced by high pressure. o f knowledge stems from the previous necess i ty o f determining changes almst exclusively by postmortem examination of t h e pressurized material . phase change o r r eac t ion occurred, no pressure e f f e c t could be determined.
I n s p i t e of a l l t h i s work, very l i t t l e i s a c t u a l l y known This lack
Obviously, i f no permanent
Ba t t e l l e has pioneered in the u t i l i z a t i o n of commercially ava i l ab le equip- ment for inf ra red spec t roscopic i n s i t u monitoring of changes i n l i q u i d s under u l t r a - high pressures. sample, and po ten t i a l app l i ca t ions have been shown to bridge v i r t u a l l y every a rea of physical-chemical endeavor.
These techniques are now appl icable t o a l m s t any l i qu id o r so l id
It is e a s i l y demonstrated, by changes in the in f r a red spectrum as a sample is pressurized, t h a t moderate pressures of 20 t o 50 k i loba r s can produce s ign i f i can t , bu t completely r eve r s ib l e , e f f e c t s on molecular s t ruc tu re . Def in i t i ve in t e rp re t a t ion o f these changes have exc i t i ng ramif ica t ions i n every aspec t of chemical howledge. However, the broad spectrum of pressure s tud ie s can be grouped inso three phenom- enologica l a reas :
1. Phase Behavior. Most l i qu id s o l i d i f y under pressure , with poly- morphism the r u l e r a the r than the exception (even the simple benzene molecule has a t l e a s t two s o l i d phases and we obtained a "p la s t i c c rys t a l " form of benzene unde r pressure. temperature polymrphic t r a n s i t i o n s are hown f o r many, i f no t most, so l id s , a s the e i g h t forms of ice , f i v e forms of amonium n i t r a t e , o r seven forms of t r i pa lmi t in . new phases undetectable by conventional postmortem examinations of quenched samples.
Inf ra red spectroscopy has played an important r o l e i n so l id - s t a t e s tud ies . While the inf ra red spectrum is usua l ly c h a r a c t e r i s t i c of a p a r t i c u l a r polymorphic form, it is p a r t i c u l a r l y s e n s i t i v e t o any modification of molecular shape such as r o t a t i o n a l isomerism, tautomerism, o r conformational d i f f e rences which may be encountered i n high-pressure phases.
High-pressure, high-
In s i t u measurements w i l l r evea l
2. Intermolecular Forces. Fascinating p o s s i b i l i t i e s f o r e luc ida t ing intermolecular i n t e rac t ions in condensed phases a r e of fe red by cont ro l led v a r i a t i o n of pressure from ambient t o 100 k i lobars , and of temperature from ambient t o 400 C, on a sample o f determinable volume. Questions of p a r t i c u l a r chemical importance which can now be approached experimentally are:
(a) apprec iab le influence on intramolecular forces?
A t what po in t do repuls ive in te rmolecular fo rces exert an For example,
196.
m s t intramolecular v ib ra t ions i n condensed phases s h i f t t o higher frequencies with increas ing pressur,e. Is t h i s s h i f t simply a d i e l e c t r i c e f f e c t r e l a t e d t o increas ing dens i ty with compression, o r does i t a c t u a l l y represent a decrease i n bond length of t he p a r t i c u l a r v ib ra t ing e n t i t y ? a d i e l e c t r i c e f f e c t with compression, evidence from s tud ie s of hydrogen-bonded compounds ind ica tes t h a t bond lengths a r e def - k i i t e l y a f f ec t ed .
(b) When compressions a r e s u f f i c i e n t t o r e s u l t i n decreased intramolecular bond lengths, i s the shortened bond more, o r l e s s , chemically a c t i v e ? Do polar bonds behave the same a s l e s s polar bonds under s imi l a r conditions?
While there w i l l be
(c) Does order o r o r i en ta t ion i n the l i qu id approach the order i n a corresponding s o l i d a s the dens i ty of the pressurized l i qu id approaches the dens i ty of t h a t s o l i d ? Techniques developed fo r measuring compress ib i l i t i e s with photomicrographic and in f r a red spectroscopic da t a were used to show t h a t some l i qu id halogenated ethanes compress t o the dens i ty of the s o l i d before s o l i d i f i c a - t ion occurs. Also, the pressure behavior of s t rongly hydrogen bonded l iqu ids ind ica t e s a higher degree of o rde r than was pre- viously suspected.
3. Synthesis. Novel syntheses a r e poss ib le in pressurized systems. For example, w e have successfu l ly polymerized a conjugated aromatic s u b s t i t u t e d ace ty len ic compound by W i r r a d i a t i o n of a high-pressure s o l i d phase. Reaction was n o t induced i n e i t h e r the ambient o r pressur ized l i qu id phases, nor in a low-temperature so l id phase of the material.
These techniques a r e described and the value of i n s i t u c a p a b i l i t i e s is demonstrated by completely r e v i s i b l e pressure e f f e c t s which cannot be detected by pos t m o r t e m examination. These techniques involve using a d i amnd anv i l high- pressure c e l l f i t t e d w i t h a meta l gaske t to contain the l iqu id . ape r tu re of t h e diamond c e l l g r e a t l y limits the energy ava i l ab le t o the spectrometer and requi res unusual ins t rumenta l condi t ions t o achieve r e l i a b l e r e su l t s . The deter- mination of these opera t ing condi t ions and t h e i r e f f e c t on s p e c t r a l r e s u l t s is d i s - cussed. These s p e c t r a l r e s u l t s c l e a r l y show t h a t much more than simple close-packing of moleclues is involved a t pressures of 10-100 kilobars. It is a g rea t a i d in pres- sure s t u d i e s to be ab le to observe by normal o p t i c a l microscopy any corresponding changes in the physical s t a t e of t he sample. This is p a r t i c u l a r l y t r u e f o r the study of organic l i qu ids , m n y of which s o l i d i f y a t r e l a t i v e l y low pressures. This phenom- enon has been used i n the e a s i l y manipulated diamond c e l l to grow s ing le c rys t a l s , qu ick ly and eas i ly , of many organic compounds. spectroscopic and o p t i c a l microscopic monitoring allows some very i n t e r e s t i n g com- par i sons of these high-pressure s i n g l e c r y s t a l s with normal c r y s t a l s produced by f reez ing .
The very small
The powerful combination of infrared
Spectra w i l l be shown of various ranks of coa l obtained by high-pressure techniques. These spec t r a w i l l be discussed both in t e r n of a rou t ine sampling method f o r q u a l i t a t i v e i d e n t i f i c a t i o n and i n terms of new knowledge t o be gained concern-hg the s t r u c t u r e of coa ls .
ATR-PYROLYSIS SPECTRA OF COAL
Stanley E. Polchlopek W i l l i a m J. Menosky
Louis G. D a l l i
Barnes Engineering Company Instrument Division 30 Commerce Road
Stamford, Connecticut 06902
Infrared spectra of coa l have been prepared, h i s t o r i c a l l y , as might be expected, by the usua l techniques. Each of these has something t o recommend it and each has some disadvantage. exhibi ted excessive s c a t t e r i n g and have provided good spec t ra only a f t e r long per iods of grinding, of ten under selected solvents .
Both mulls and a l k a l i ha l ide d i s c s have
But even a f t e r a sample was prepared and i t s spectrum recorded, t h e i n t e r p r e t a t i o n was complicated by t h e presence of a l a r g e amount of carbon xhich contr ibutes nothing. I n f a c t , the presence of a la rge amount of highly absorbing carbon d e t r a c t s from t h e spectrum by imposing at tenuat ion requirenents on the reference beam. I n addition, t h e organic components have reacted with a l k a l i ha l ide d i s c s and i n some cases spurious water bands have been reported.
The conbination of ATR and pyro lys i s o f f e r s a new approach t o the s z u d rf coal samples by inf ra red spectrophotometry. In t h i s study a Barnes PY-2 Pyrzlyzer and a Barnes ATR-4 u n i t were used i n conjunction with a Perkin-Elmer 257 Spectrophotometer. s i i p l i f i e s sample preparat ion but imposes c e r t a i n precautions which must be observed i n in te rpre ta t ion .
The use of t h i s combination of techniques
Experimental
Two charges of 25Omg each were used t o prepare each spectrum. One ckarge v:es deposited on each s i d e of an ATR-4 KRS-5 ( tha l lous bromide-iodide cr , -s ta l ) . After appropriate experimentation, a time of 90 seconds and 900°C was used f.or each charge. 0.lm c r l e s s . P j ro lys i s i n a vacuum i s necessary i n . o r d e r t o e l iminate open i'lane cmbust ion and t 3 minimize possible end group react ions.
All of the samples were pyrolyzed i n a vacuum of
Resul ts
Six coa ls of varying rank were s tudied. These were obtained from Dr. R . A. Fr iedel , t h e symposium chairman. They a r e described i n Table I.
198. . . TABLE I
COAL SOURCE ARE3 PERCENTAGE C
Anthracite Reading, Pennsylvania 92.5%
Low v o l a t i l e
Medium v o l a t i l e
High v o l a t i l e B
High v o l a t i l e A
B i twninous Pocahontas, West Virginia 9 1 . 9
Bituminous Wyoming County, West Virginia 9 9 . 9
Bituminous Waltonville, I l l i n o i s 7 9 . 8
Bituminous Bruceton, Pennsylvania 83.1%
Sub -b i tuminous Sweetwater County, Wyoming 73.72
One of the r e s u l t s of t h i s study which was somewhat surpr i s ing i s t h a t the same time-temperature conditions could be applied t o produce spectra of apprDximately equivalent appearance f o r a l l s i x of the samples studied.
Fig. 1 shows t h e ATR spectrum of the pyrolyzate of sub-bituminous coal. The spectrum shows the presence of phenols i n l a rge amounts. The -OH band centered a t about 3225 cm-1. There a re shoulders on both s ides of the absorption peak ind ica t ing the presence of o ther species of -OH o r perhaps -NH.
In Fig 2, which i s the pyrolyzate of high v o l a t i l e A bituminous, shows c l e a r e r separation of bands i n the -OH s t r e t c h region. The carbonyl region i s subs t an t i a l ly unchanged and the phenyl frequencies i n the 650 t o 850 cm-I region have become more complex. of phenols.
The spectrum continues t o show t h e presence
The pyrolyzate of high v o l a t i l e B bituminous shown i n Fig. 3 shows t h a t the amount of v o l a t i l e -OH has ,decreased i n quant i ty and i n complexity. The phenyl frequency region from 650 t o 850 em-’ has become somewhat l e s s complicated. The carbonyl region i s a l s o changed and shows fewer bands. This ind ica tes t h a t the very v o l a t i l e components found i n very low rank coals a r e present i n decreased amounts.
The spectrum of medium v o l a t i l e bituminous shown i n Fig. 4 shows a The -OH p a t t e r n i n the carbonyl region and i n the 1400 t o 1500 cm-’ region.
s t r e t c h region remains about t he same. The phenyl frequencies from 650 t o 850 cm-’ have again become more complex. a t 1420 em-’ may be taken t o mean t h a t there has been an increase i n the a l i p h a t i c subs t i t u t ion of the phenyl systems.
The appearance of the band
Low v o l a t i l e bituminous which has almost t he same carbon content a s the pyrolyzate shown i n Fig. 5. The spectrum is no t a s in tense probably because the re a re not as many v o l a t i l e s present. has almost disappeared.
The band a t 1X)O t o 1300 cm-l The 650 t o 850 cm-I region has become qu i t e complex.
The spectrum of the pyrolyzate of an th rac i t e is shown i n Fig. 6 . This spectrum is not r e l a t ed t o the others. It is, i n f ac t , simply a spectrum of t a r . roads and driveways. The only d i f fe rence i s i n t h e s i z e of t h e charge used t o produce the spectrum. of about the same i n t e n s i t y a s a 25Omg charge of an th rac i t e .
The same spectrum has been observed from asphal t s used t o black top
A charge of about 25mg of asphal t w i l l produce the spectrum

’\
I The spectra i n t h i s study show t h a t a combination of ATR and pyrolysis
of fe r a new approach t 3 the study of coal spectra . technique l i e s i n t h e f a c t t h a t it speeds up sample preparation.
The major b e n e f i t of the
> 9
i \
\ , \
\ , f c
1
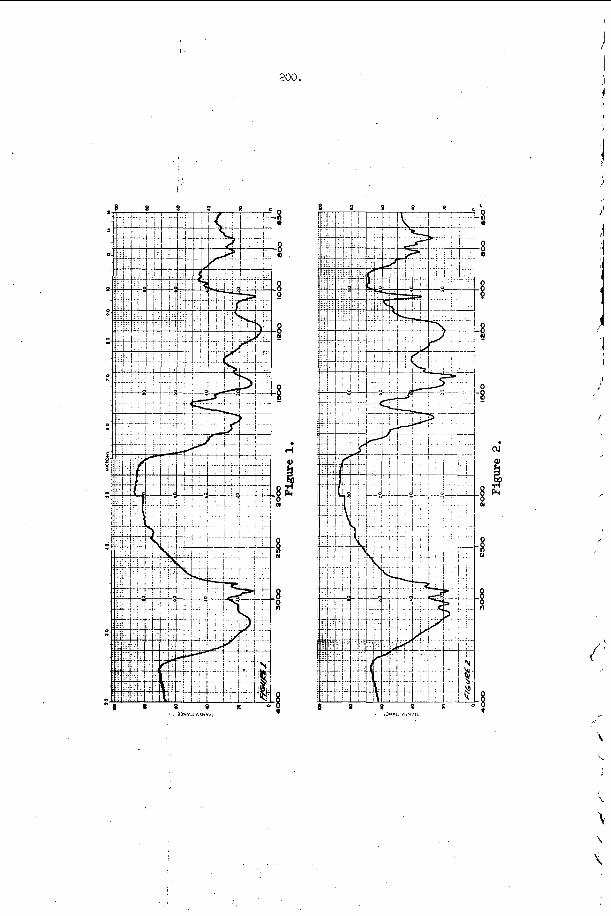
I '
(v
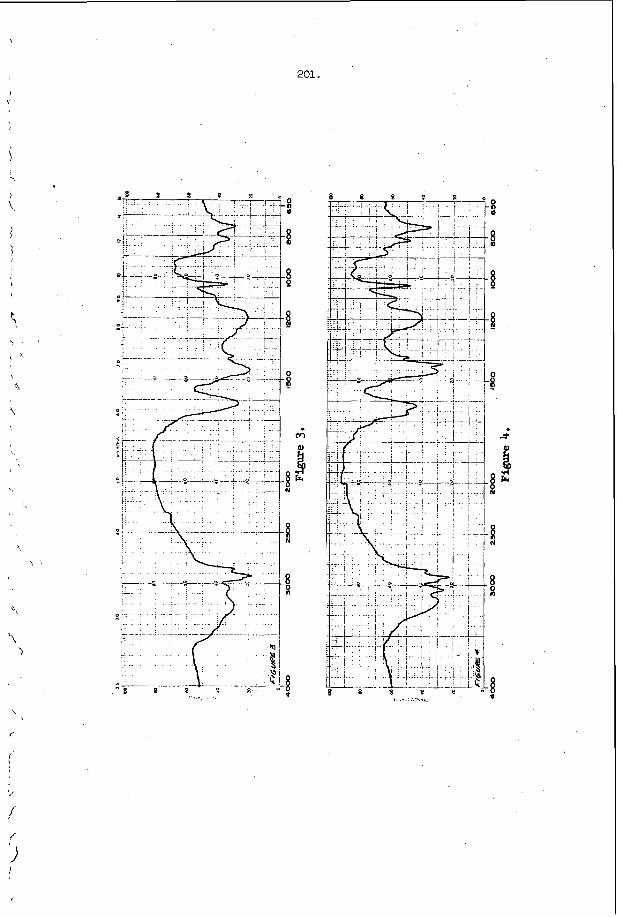
201,
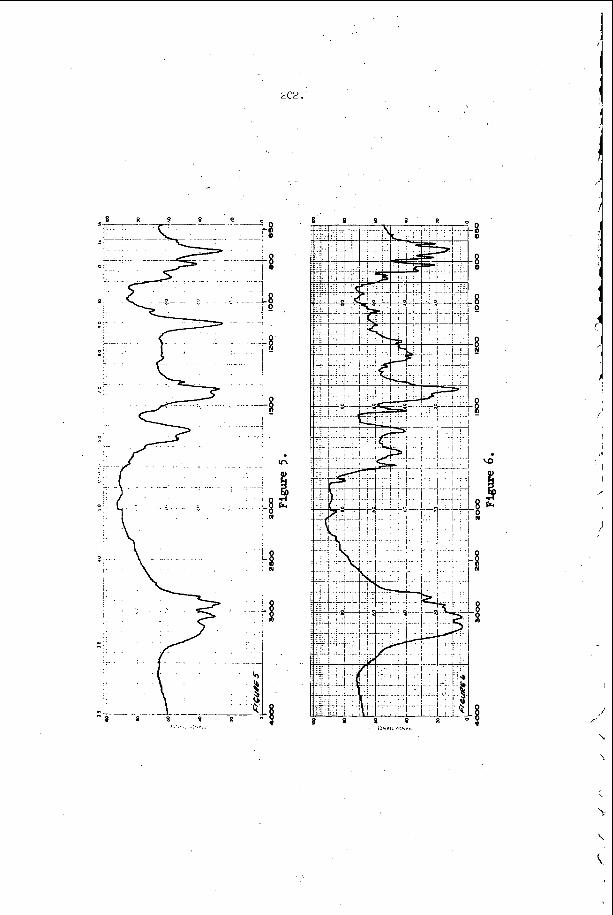
32.
. ..
. . . . . . . . .. .. . . . .. . . . . .
0 .. - ,
203. . THE USE OF INFRARED SPECTROSCOPY TO STUDY
SURFACE GROUPS AND ADSORBED SPECIES ON CATALYSTS
By Michael R. Bas i l a
Gulf Research h Development Company P i t t s b u r g h , Pennsylvania 15230
INTRODUCTION i n s u r f a c e chemistry and c a t a l y s i s has been growing a t an eve r - inc reas ing r a t e . mOSt popular technique has been i n f r a r e d fol lowed by n u c l e a r magnetic resonance and e l e c t r o n sp in resonance.
I n r e c e n t y e a r s t h e a p p l i c a t i o n of spec t roscop ic t echn iques t o problems The
I n f r a r e d techniques a r e most u s e f u l i n s u r f a c e f u n c t i o n a l group i d e n t i f i c a - t i o n and (through the u s e of adsorbed molecules a s probes) i n s tudy ing t h e n a t u r e of t h e active si tes f o r a d s o r p t i o n and r e a c t i o n . In some c a s e s i t has been p o s s i b l e to o b t a i n mechanis t ic information concerning the n a t u r e of i n t e rmed ia t e s i n s imple r e a c t i o n s such a s t h e decomposition of formic a c i d over supported and unsupported metal c a t a l y s t s (1).
As an i l l u s t r a t i v e example of t h e u s e of i n f r a r e d techniques i n s tudying t h e behavior of s u r f a c e f u n c t i o n a l groups and t h e u t i l i z a t i o n of molecular probes t o c h a r a c t e r i z e a c t i v e s u r f a c e sites, a review of our s t u d i e s of t h e s u r f a c e of s i l i c a - alumina w i l l be given. and ammonia -- a s probes t o c h a r a c t e r i z e t h e s u r f a c e a c i d sites.
SURFACE GROUPS ON SILICA-ALUMINA I n Fig. 1 t h e spectrum of a h igh ly dehydrated s i l i c a - alumina (25 wt.% A120 ) is given. v i b r a t i o n i n s u r f a c e tyd roxy l groups. The bands a t 1975, 1866 and 1633 cm-' a r e over- t one and combination l a t t i c e v i b r a t i o n s (2). which is due t o an u n i d e n t i f i e d s u r f a c e group, p o s s i b l y a s u r f a c e impuri ty . The 3745 c m - l band has been a s s igned t o t h e OH s t r e t c h i n g v i b r a t i o n i n hydroxyl groups a t t a c h e d t o s u r f a c e s i l i c o n atoms ( 2 ) . This assignment w a s made on t h e b a s i s of s i m i - l a r i t i e s i n the frequency, band shape and o t h e r p r o p e r t i e s w i t h t h e s u r f a c e hydroxyls on s i l i ca . I t has been confirmed by n u c l e a r magnetic resonance measurements (3). The p resence of a s i n g l e s u r f a c e hydroxyl group type is r a t h e r s u r p r i s i n g . workers (4) have observed t h r e e t o f i v e OH s t r e t c h i n g bands due t o i s o l a t e d (non- hydrogen bonded) s u r f a c e hydroxyl groups on alumina, wh i l e on ly one band a t 3750 cm-l is observed on s i l i ca (5). The r e s u l t s f o r s i l i ca -a lumina sugges t t h a t t h e r e a r e no a lumina - l ike a r e a s on t h e s u r f a c e o r conve r se ly , that t h e aluminum ions are d i s t r i b u t e d evenly throughout t h e l a t t i c e . We have looked a t o t h e r commercial s i l i ca -a luminas (A1 O3 ,< 25 wt.%) and a l l have on ly a s i n g l e s u r f a c e hydroxyl t ype ( a t t ached t o su rgace s i l i c o n atoms) e Other workers have made s i m i l a r obse rva t ions (6a) however t h e r e have been s e v e r a l cases where t h e p re sence of a lumina-l ike s u r f a c e hydroxyl groups have been r epor t ed i n a d d i t i o n t o t h e s i l i c a - l i k e groups (6b).
SURFACE A C I D SITES Use has been made of ammonia a s a molecular probe t o s tudy s u r f a c e a c i d i t y on alumina and s i l i ca -a lumina c a t a l y s t s by a number o f workers (7). on the o t h e r hand has on ly been used i n a few s t u d i e s (8). Pyr id ine o f f e r s t he advan- t age t h a t one can d i s t i n g u i s h unequivocably between c o o r d i n a t e l y bonded (LPY), pro- t ona ted (BPY), and hydrogen bonded (HPY) adsorbed s p e c i e s ( 8 ) . The bands t h a t a r e used i n making t h e s e d i s t i n c t i o n s a r e shown i n Table I (6b).
tiere, use was made of n i t r o g e n c o n t a i n i n g molecules -- pyr id ine
The band a t 3745 cm" is due t o t h e OH s r e t c h i n g
There is a l s o a weak band a t 1394 cm-'
A number of
Pyridine
204. TABLE I
BAND POSITIONS FOR COORDINKCELY BONDED, PROTONATED AND HYDROGEN-BONDED PYRIDINE ADSORBED ON SILICA-ALUMINA*
LPY HP Species Type (cm-1)
8a ' vCC (N) 1620 1638 1614 8b V C C (N) 1577 1620 1593 19a PCC(N) 1490 1490 1490 19b V C C (N) 1450 1545 1438
*LPY = coordinately bonded pyridine (chemisorbed) BPY = protonated pyridine (chemisorbed) HPY = hydrogen bonded pyridine (physically adsorbed)
Chemisorbed NH3 exhibits two bands that can be used to distinguish between the coor- dinately bonded and protpated species. (LNH3) and 1432 cm-' respectively (7, 9). However, the (physically adsorbed)
some uncertainty in the estimation of Lewis/Bronsted acid site ratios (9).
The position of these bands are at 1620
hydrogen-bonded cannot be distinguished from LNH3 which introduces
Figs. 2 and 3 are spectra of pyridine and ammonia adsorbed on silica-alumina. An expression for calculating the ratio of Lewis to Bronsted acid sites on the surface of silica-alumina using the 1490 and 1450 cm'l bands of LPY and BPY has been developed (10).
w= A1450 ; A = peak absorbance P q A1490-0-25 A1450
The band at 1545 CUI'' cannot be used directly in conjunction with the 1450 cm-l band because it has a much smaller absorption coefficient and the ratios are usually con- siderably greater than 1. LPY and BPY it has different absorption coefficients with '&Y/ELPY = 6 (10).
The use of the 1490 cm'l band is convenient because for
The bands at 1620 and 1432 cm'l of chemisorbed ammonia can be used directly to estimate the Lewis/Bronsted acid site ratio. are: = 7 (9). By these two methods it has been determined that one out of ev:g3$ive tNH3, (9)) to 7 (PY, (10)) molecules that are chemisorbed are adsorbed as the protonated species for the silica-alumina which was studied comparatively. Other silica-aluminas have different Lewis/Bronsted acid site ratios (10) which is to be expected since the relative amounts of alunina and methods of preparation vary over considerable ranges.
EFFECT OF WATER ON SURFACE ACIDITY More detailed studies of the adsorption of pyridine and ammonia on silica-alumina have exposed some rather interesting behavior. When H 0 is adsorbed on chemisorbed pyridine (8) or ammonia (10) containing samples most 08 the LPY (LNH However, this reaction is reversibfc and the spectrum returns to the original upon evacuation (Fig. 2d). is removed and no band due to HPY is observed. H 0 , the same spectrum results but the water is removed by subsequent evacuation (ab). Hence, it appears that the H20 molecules interact with the chemisorbed LPY and a proton transfer occurs without displacement of LPY.
The relative absorption coefficients / 5 6
is converted to BPY (mi) (Figs. 2b, c).
During this experiment H20 does not displace pyridine since no pyridine If pyridine is added to chemisorbed
.
205. It is d i f f i c u l t t o r a t i o n a l i z e the n a t u r e of t h i s i n t e r a c t i o n between water
and chemisorbed pyr id ine o r ammonia. It is important t o n o t e t h a t p y r i d i n e and water In s o l u t i o n do not i n t e r a c t t o form pyridinium ion but merely engage i n hydrogen bonding i n t e r a c t i o n s (11) . t i o n of one o r bo th of t h e components by t h e s u r f a c e . n i t rogen conta in ing base s t a y s on the primary a c i d s i t e and t h e w a t e r p a r t i c i p a t e s i n a secondary i n t e r a c t i o n . an e l e c t r o n t r a n s f e r i n t e r a c t i o n from the lone e l e c t r o n p a i r on the-N atom t o a t r i g o n a l s u r f a c e aluminum atom leading to a s u r f a c e complex of tRe type ( I ) .
The formation of BPY t h e r e f o r e must r e s u l t from a c t i v a - The r e s u l t s sugges t t h a t the
Presumably a d s o r p t i o n o f p y r i d i n e t o form occurs by
$’ 5- +H20 @ fA
-H20 H’
~
>N+AL;. ,N--
(1) (11)
I n t h e presence of water , the e l e c t r o n t r a n s f e r from N t o s u r f a c e A1 may be e s s e n t i a l l y complete i f a hydrogen atom from the water is t r a n s f e r r e d t o t h e LPY and the OH r a d i - c a l migra tes t o t h e aluminum atom t o g i v e a complex of t y p e (11). would occur i f a proton was t r a n s f e r r e d t o t h e p y r i d i n e and t h e hydroxyl ion t o t h e t r i g o n a l aluminum atom. s u r f a c e i n an ion p a i r w i t h ( SAlOH)’. The only d i f f i c u l t y w i t h t h i s model is t h a t t h e n i t r o g e n base i s a p p a r e n t l y s t r o n g l y he ld dur ing t h i s i n t e r a c t i o n (8b) s i n c e i t does not desorb upon evacuat ion whereas t h e pyridinium i o n should have some s u r f a c e mobi l i ty . however, t h e d a t a sugges t t h a t it is s t r o n g l y d isp laced to the r i g h t s i n c e most of the LPY can be converted t o BPY. It should be noted t h a t t h e r e are no d a t a a v a i l a b l e t o i n d i c a t e whether the added H20 molecules a r e i n a 1:l r a t i o w i t h t h e number of LPY molecules. r i g h t .
SURFACE ACIDITY MODEL These r e s u l t s have led us t o p o s t u l a t e (8b) t h a t a l l of t h e a c i d i c si tes on s i l ica-a lumina a r e of t h e L e w i s o r e l e c t r o n acceptor type and t h a t Bronsted type a c i d i t y results from a secondary i n t e r a c t i o n between t h e molecule chemisorbed on the primary L e w i s type s i te and a n a d j a c e n t S i O H group. a c t i o n i s p i c t u r e d a s s i m i l a r t o t h a t between water and chemisorbed LPY.
The same r e s u l t
I n e i t h e r c a s e t h e pyridinium i o n would then b e held on t h e
The real s i t u a t i o n most l i k e l y involves an e q u i l i b r i u m between (I) and (111,
I f t h e r a t i o were h igher , t h e e q u i l i b r i u m would be pushed toward t h e
This i n t e r -
\ I /
0 s i 1 ‘\ I
\ r >,A- 0
*N’’+Alg f I N ? 5 A l f ’ 5+ (IV)
H
This model’s c h i e f advantage is t h a t it a l lows t h e r a t i o n a l i z a t i o n o f e x t e n s i v e da ta i n t h e l i t e r a t u r e v h i c h h e r e t o f o r e h a s been taken as evidence that s i l i c a - a l u m i n a has predominantly Lewis type s i t e s o r converse ly p r e d o m i n a n t l y a r o n s t e d s i t e s . sugges ts that a proton is a v a i l a b l e i f needed m e c h a n i s t i c a l l y such as t o form a classical carbonium ion from an o l e f i n , but is not n e c e s s a r i l y involved i n a l l acid- c a t a l y z e d r e a c t i o n s t h a t proceed over s i l i ca-a lumina (9) .
Spectroscopic evidence suppor t ing t h i s model w i l l now be considered. Fig. 4 a p l o t of t h e c o n c e n t r a t i o n of chemisorbed NH; v e r s u s t o t a l ammonia adsorbed is g iven . A s would be expected the s l o p e d e c r e a s e s a s the t o t a l m o u n t of ammonia adsorbed increases . The i n i t i a l s lope is 0.25 which i n d i c a t e s t h a t i n i t i a l l y one .
(111)
It
I n
206.
o u t of every f i v e ammonia molecules is chemisorbed as NH+. c o n c e n t r a t i o n of i s o l a t e d (non-hydrogen bonded) s u r f a c e hydroxyls ve r sus t h e t o t a l amount of ammonia adsorbed. For a n a l y s i s t h e smooth cu rve is broken i n t o two l i n e a r segments. Note t h a t t h e i n t e r s e c t i o n p o i n t co inc ides w i t h t h e po in t (Fig. 4 ) where the i n c r e a s e i n (NH+) as t o t a l ammonia adsorbed i n c r e a s e s begins t o f l t t e n ou t . The i n v e r s e s l o p e 04 the low coverage l i n e a r se e n t i n Fig. 5 is 5.5 0.5 and t h a t of t h e high cove rage l i n e a r segment i s 0.98 FO.09. Hence, a t low coverage one ou t of every f ive o r six chemisorbed ammonia molecules is hydrogen bonded t o a s u r f a c e hydroxyl group. A t h i g h coverage every adsorbed ammonia is hydrogen bonded t o a s u r f a c e hydroxyl group, which is t y p i c a l o f t he phys ica l adso rp t ion of ammonia on s i l i c a gel (no a c i d i c sites). coverage segment corresponds t o phys i ca l a d s o r p t i o n and t h e low coverage segment t o chemisorpt ion. The c u r v a t u r e nea r t h e t r a n s i t i o n po in t is a r e s u l t of both processes occur r ing s imultaneously.
F ig . 5 is a p l o t of the
It is ev iden t from t h e s e r e s u l t s t h a t t he high
According t o the p r e d i c t i o n s of the model [N$]<bH]bonded9 t h a t i s t h e number o f chemisorbed a m o n i a molecules which a r e involved in "hydrogen-bonding" i n t e r a c t i o n s w i t h s u r f a c e hydroxyl groups should be g r e a t e r than o r equal t o t h e concen t r a t ion of chemisorbed N H i . coverage) a r e t h a t one i n f i v e ammonia molecules is chemisorbed as NH; and one i n f i v e o r s i x is hydrogen bonded t o a s u r f a c e hydroxyl group, i n good agreement wi th t h e p r e d i c t i o n . Furthermore, it is pred ic t ed t h a t hydroxyl groups involved i n proton t r a n s f e r i n t e r a c t i o n s w i t h chemisorbed ammonia molecules should no t e x h i b i t an OH s t r e t c h i n g band, hence a t low s u r f a c e coverage where chemisorpt ion predominates the i n t e n s i t y o f t h e 3050 cm-' band (due t o t h e hydrogen-bonded OH s t r e t c h i n g ) should i n c r e a s e a t a very much lower ra te than a t high coverage where phys ica l adso rp t ion predominates . Th i s behavior i s ev iden t i n Fig. 6 whe e the peak absorbance o f t h e 3745 c m - l band is p l o t t e d versus t h a t of t h e 3050 cm-' band. Th i s evidence is not conc lus ive however because t h e OH groups i n a non-proton t r a n s f e r i n t e r a c t i o n w i t h chemisorbed molecules may have a d i f f e r e n t peak frequency and abso rp t ion c o e f f i c i e n t t h a n those involved i n a normal hydrogen-bonding i n t e r a c t i o n (9).
The r e s u l t s i n Figs . 4 and 5 ( a t low su r face
Addit ional suppor t ing evidence f o r t h e proposed model i s shown i n Fig. 7. I n t h i s experiment the s i l i ca -a lumina w a s poisoned by impregnation w i t h potassium acetate followed by c a l c i n a t i o n . The presence of a l k a l i metals i n a c i d i c c a t a l y s t s is known t o p o i on carbonium i o n r e a c t i o n s (13). Fig. 7a shows t h a t t h e band due to BPY a t 1545 cm-' is a b s e n t , hence poisoning w i t h potassium ions e l i m i n a t e s Bronsted type a c i d i t y . markedly decreased when s i l i ca -a lumina i s poisoned by the a d d i t i o n of potassium. The hydroxyl groups a r e l i t t l e e f f e c t e d . When water is adsorbed on the py r id ine c o n t a i n i n g s u r f a c e the LPY s p e c i e s are converted t o BPY (Fig . 7b). Hence the added potassium ions do no t p reven t t h e conve r s ion of LPY t o BPY by adsorbed wa te r . This r e s u l t is q u i t e s u r p r i s i n g . It e l i m i n a t e s t h e s u r f a c e s p e c i e s (?AlOH)-H+ a s t h e sou rce of i nhe ren t Bronsted a c i d i t y on a f r e s h s i l i ca -a lumina s u r f a c e , I f t h i s s p e c i e s were p resen t t h e K+ i o n s would exchange w i t h t h e H+ ions and r ende r the s i t e s completely i n a c t i v e . The f a c t t h a t w a t e r can s t i l l conve r t LPY t o BPY sugges t s t h a t even though t h e degree o f a c t i v a t i o n of py r id ine by t h e a c i d i c s i t e i s decreased (8b) t h e p ro tona t ion r e a c t i o n can s t i l l proceed i f t he proton donor can g e t c l o s e enough.
I t has been shown (8b) that t h e s t r e n g t h of t h e a c i d i c s i tes is
This behavior c a n be r a t i o n a l i z e d i n terms of our model as fo l lows and hence is taken as i n d i r e c t suppor t ing evidence. S ince the r e a c t i o n s of t h e LPY-acid s i t e complex and t h e a d j a c e n t OH are geomet r i ca l ly f ixed a dec rease i n t h e deg ree of act ivat ion of LPY can p reven t t h e t r a n s f e r of a proton. However, wa te r molecules a re mobile and can cane in very close proximity t o t h e complex t o e f f e c t proton t r a n s f e r .
. . . . . . . ... -. . .- . . -. .. . .- - _ _
\ .
207. SUMMARY The r e s u l t s d i scussed above demonstrate t h a t i n f r a r e d spec t roscop ic t ech - niques can provide d e t a i l s of s u r f a c e chemistry and t h e n a t u r e of s u r f a c e f u n c t i o n a l groups. Spectroscopic techniques do n o t p rov ide t h e panacea f o r a l l c a t a l y t i c prob- lembs, however. concluded t h a t they w i l l (and do ) c o n s t i t u t e an important t o o l f o r t h e c a t a l y t i c chemist . a s g rav ime t r i c adso rp t ion measurements (used f o r example t o o b t a i n s u r f a c e concen- t r a t i o n s i n Figs . 4 and 5 ) and i s o t o p e exchange techniques.
They sometimes r a i s e more q u e s t i o n s t h a n they answer. It can be
They a r e most e f f e c t i v e when used i n con junc t ion w i t h o t h e r techniques such
REFERENCES
1. See review by L. H. L i t t l e , “ In f ra red Spec t r a o f Adsorbed Spec ie s , ” Academic Press , New York, N. Y., 1966, Chapter 5.
2. M. R. B a s i l a , J. Phys. Chem., 66, 2223 (1962).
3 . U. K. Hal l , H . P. L e f t i n , F. J. Cheselske, and D. E. OtRe i l ly , J. C a t a l y s i s , 2, 506 (1963).
( a ) J. P. P e r i and R. B. Hannan, J. Phys. Chem., 64, 1526 (1960); (b) J. P. P e r i , I b i d , 69, 211 (1965); (c) D. J. C. Yates and P. J. Lucchesi, J. Chem. Phys., 2, 243 (1961); (d) R. H. Lindquis t and D. G. Rea, p re sen ted a t 136th Na t iona l Meeting, American Chemical Soc ie ty , Sept . , 1959.
R. S. McDonald, ( a ) J. Am. Chem. SOC., 79 850 (1959); (b ) J. Phys. Chem., 62, 1168 (1958).
( a ) J. B. P e r i , J. Phys. Chem., 70, 3168 (1966); (b ) See r e f e r e n c e 1, Chapter 10.
4.
5 .
6.
7. See r e fe rence 1, Chapter 7.
8. ( a ) E. P. Pa r ry , J. C a t a l y s i s , 2, 371 (1963); (b) M. R. B a s i l a , T. B. Kantner and K. H. Rhee, J. Phys. Chem., 68, 3197 (1964).
9; M. R. Bas i l a and T. R. Kantner, J. Phys. Chem., 2, 467 (1967).
10. M. R. B a s i l a and T. R. Kantner, I b i d , 70, 1681 (1966).
11. A. N . Sidorv, Opt. i Spektroskopiya 8, 51 (1960).
12.
13.
A. V. Kiselev, V. I. Lygin and T. I. T i tova , Zh. Fiz . Khim., 38, 2730 (1964).
( a ) D. S t r i g h t and J. D. Danforth, J. Phys. Chem., 57, 448 (1953); (b) G. A. M i l l s , E . R. Boedeker, and A. G. Oblad, J. h. Chem. Soc., 12, 1554 (1950).
i’ ‘i
I
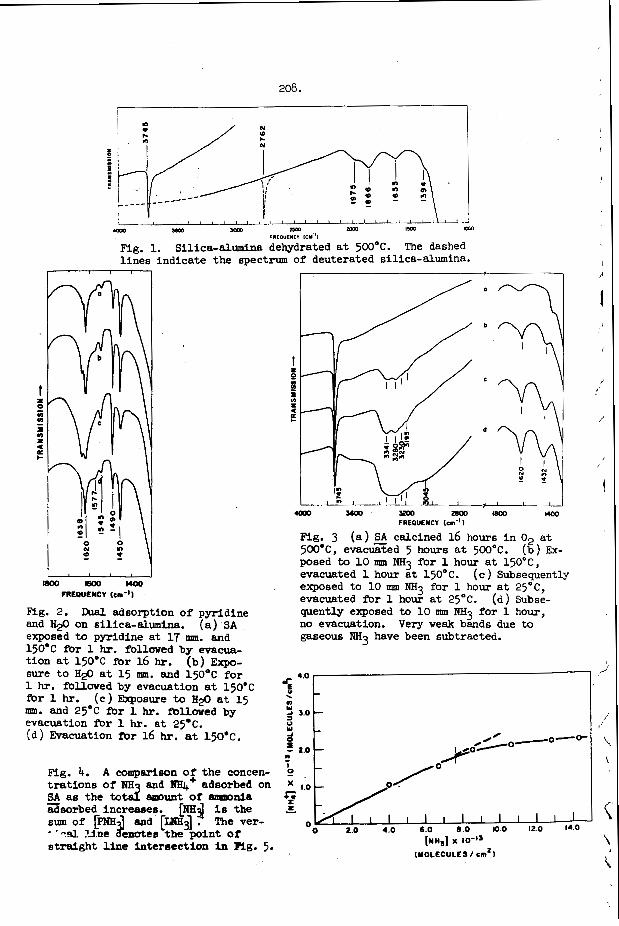
208.
5 '.O . - m W 2 3.0 - u W - -I
I I
/
l e
I V V E __--- ____---- I m ??
I , I I I I I , , , , ,
.ooo w ym 1yD gm I= ma rl)iOULYCr ICY"1
Mg. 1. Silica-alrrmina dehydrated at 500°C. The dashed lines indicate the spectlvm of deuterated silica-alumina.
t x 0
m
s Q)
2 4 a I-
01
Fig. 2. and €L$ on silica-alumina. (a) SA exposed to pyridine at 17 mm. and l5O.C for 1 hr. followed by evacua- tion at 1 5 0 ° C for 16 hr. (b) Expo- s u e to H$ at 15 mm. and 1 5 0 ° C for 1 hr. followed by evacuation at l5O.C for 1 hr. mm. and 2 5 ° C for 1 hr. followed by evacuation for 1 hr. at 25.c. (d) Evacuation for 16 hr. at l5O.C.
Duaz adsorption of pJnldine
(c) Exposure to E$ at 1 5
Fig. 4. A comparison of the concen- trations of FlII and NHI++ adsorbed on - SA as the to& a m m t of a~rm~nia adsorbed increases. [Aaa le the sum of [hi$ and [und. The ver- A '-al. Line enotei the point of straight line intersection Fn ng. 5.
Mg. 3 500'C, e v a c a e d 5 hours at 500°C. posed to 10 nun NH3 for 1 hour at l 5 O o C , evacuated 1 hour at 1 5 0 ° C . exposed to 10 mm NH3 fo r 1 hour at 25OC, evacuated for 1 hour at 25°C. quently exposed to 10 unn NH3 for 1 hour, no evacuation. gaseous 'JH3 have been subtracted.
(a) SA calcined 16 hours in O2 at (b) Ex-
(c) Subsequently
(a) Subse-
Very weak bands due to
[Ntl,] X
(MOLECULES/ cm21
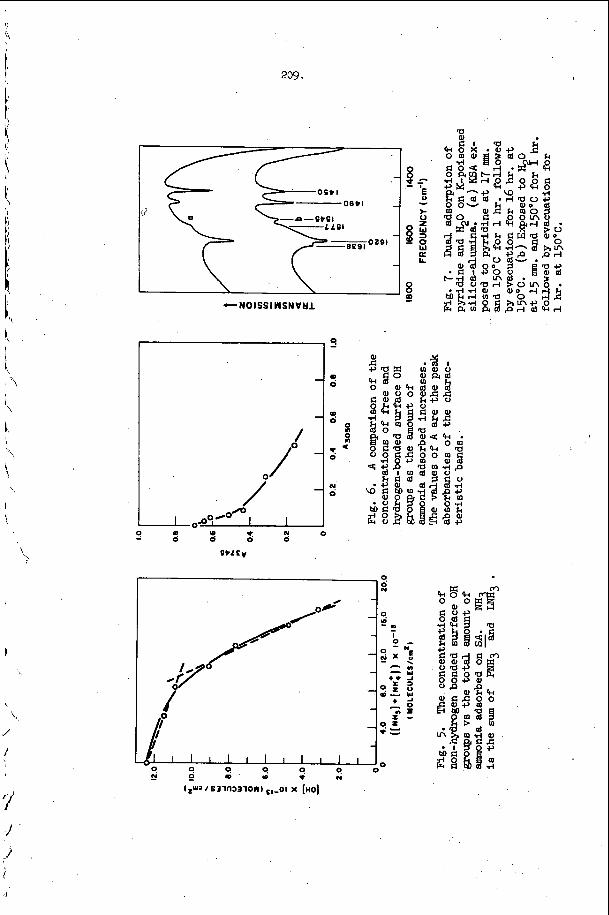
\ 1.
11
p 4 '
i
209.
m
-NO I SSI YYSN V U
J
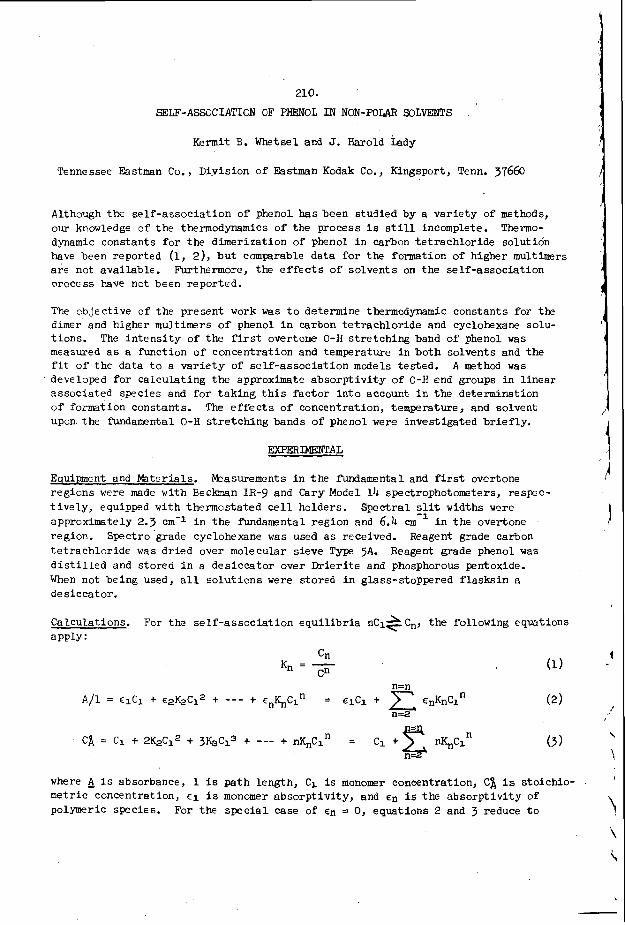
210.
SELF-ASSOCIATION OF PHENOL I N NON-POLAR SOLVENTS
Kermit B. Whetsel and J. Harold L d y
Tennessee Eastman Co. , Dipis ion of Eastman Kodak Co. , Kingsport, Tenn. 37660
Although the se l f - a s soc ia t ion of phenol has been studied b y a v a r i e t y of methods, our knowledge o f t h e thermodynamics of t h e process i s still incomplete. Thermo- dynamic constants f o r t h e d imer iza t ion of phenol i n carbon t e t r a c h l o r i d e solution have been reported (1, 2), b u t comparable da t a for the formation of higher m u l t h r s a r e not ava i lab le . Furthermore, t he e f f e c t s of so lven t s on t h e se l f - a s soc ia t ion vrocess have not been repor ted .
The sb jec t ive o f t h e present work was t o determine thermodynamic cons tan ts f o r the dimer and higher multimers of phenol i n carbon t e t r a c h l o r i d e and cyclohexane solu- t i ons . The i n t e n s i t y o f t h e first overtone 0-H s t r e t c h i n g band o f phenol was measured a s a func t ion of concent ra t ion and temperature i n b o t h so lvents and the f i t of t h e da ta t o a v a r i e t y of se l f - a s soc ia t ion models tes ted . A method was developfd f o r ca l cu la t ing t h e approximate a b s o r p t i v i t y of 0-H end groups i n l i n e a r assoc ia ted species and f o r t a k i n g t h i s f a c t o r i n t o account i n t h e determination uf formation constants. The e f f e c t s o f concentration, temperature, and solvent upon t h e fundamental 0-H s t r e t c h i n g bands of phenol were inves t iga ted b r i e f l y .
EXPERIMENTAL
Equipment and Ha te r i a l s . Measurements i n t h e fundamental and first overtone r eg ions were made w i t h Beclanan IR-9 and Cary Model 14 spectrophotometers, respec- t i v e l y , equipped with thennos ta ted ce l l holders. Spectral slit widths were approximately 2.3 cm-l i n t h e fundamental reg ion and 6.4 cm-’ i n t h e overtone region. Spectro grade cyclohexane was used a s received. Reagent grade carbon t e t r a c h l o r i d e was d r i ed over molecular s i eve Type 5A. d i s t i l l e d and s tored i n a des i cca to r over Drierite and phosphorous pentoxide. When not be ing used, a l l s o l u t i o n s were s tored i n glass-stoppered f l a s k s i n a d e s i c cat or.
Reagent grade phenol was
Calculations. For t h e s e l f - a s s o c i a t i o n e q u i l i b r i a nCl* Cn, t h e following equations a PPlY :
(1 1 Cn
C” Kn = -
where A i s absorbance, 1 i s p a t h length , CL is monomer concentration, Cl i s s to ich io- metric concentration, €1 i s monomer abso rp t iv i ty , and En i s t h e a b s o r p t i v i t y of polymeric species. For the s p f c i a l case of En = 0, equat ions 2 and 3 reduce t o
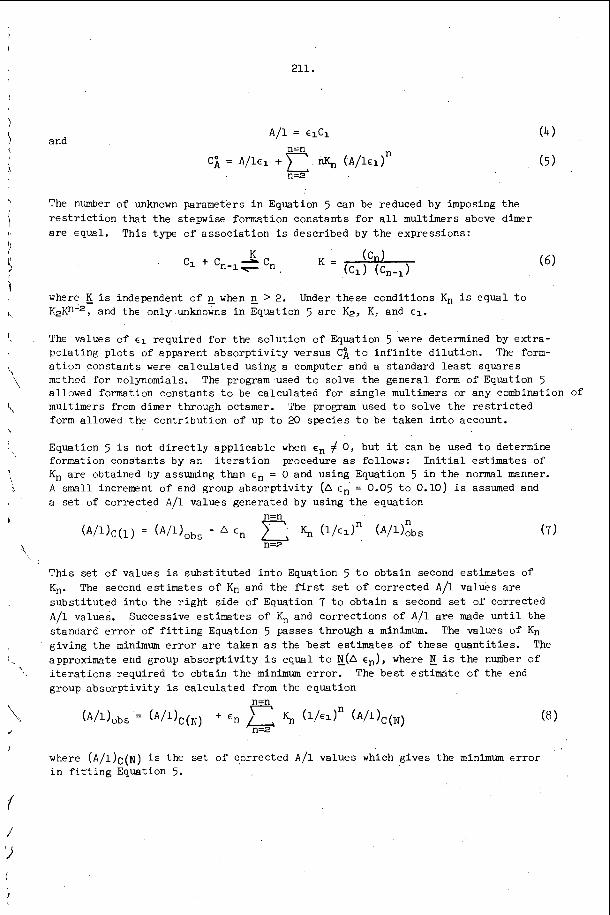
and
211.
The number of unknown parameters i n Equation 5 can be reduced by imposing t h e r e s t r i c t i o n that t h e stepwise formation cons tan ts f o r a l l multimers above dimer a r e equal. This typf o f a s soc ia t ion i s described by the expressions:
where K2Kn-', and the only unknowns i n Equation 5 a r e K2, K, and €1.
The values of €1 required f o r t he so lu t ion of Equation 5 were determined by ex t r a - po la t ing p l o t s of apparent a b s o r p t i v i t y versus C z t o i n f i n i t e d i lu t ion . The form- a t i o n constants were ca lcu la ted using a computer and a standard l e a s t squares methcd f o r nolynomials. The program used t o solve the genera l form of Equation 5 allowed formation cons tan ts t o be ca lcu la ted f o r s ing le multimers or any combination Of
multimers from dimer through octamer. The program used t o solve the r e s t r i c t e d form allowed the cont r ibu t ion of up t o 20 spec ies t o be taken i n t o account.
i s independent of p when E > 2. Under these condi t ions Kn i s equal t o
Equation 5 i s not d i r e c t l y appl icable when en # 0, but it can be used t o determine formation constants by an i t e r a t i o n procedure as follows: I n i t i a l es t imates of Kn a r e obtained by assuming than en = 0 and using Equation 5 i n t h e normal manner. A small i n c r e m n t of end group abso rp t iv i ty (A cn = 0.05 t o 0.10) i s assumed and a set of corrected A / 1 values generated by using t h e equation
Th i s s e t of va lues i s subs t i t u t ed i n t o Equation 5 t o obta in second es t imates of Kn. The second estimates of Kn and t h e f irst set o f corrected A / 1 va lues a r e subs t i t u t ed i n t o t h e r i g h t s ide of Equation 7 t o obta in a second s e t of corrected A / 1 values. Successive es t imates of K, and co r rec t ions of A / 1 are made u n t i l t h e standard e r r o r of f i t t i n g Equation 5 passes through a minimum. The values of Kn g iv ing the minimum e r r o r are taken as the b e s t e s t ima tes of t hese quan t i t i e s . approximate end group a b s o r p t i v i t y i s equal t o E(A en), where E i s t h e number of i t e r a t i o n s required t o obtain t h e minimum e r ro r . The b e s t es t imate of t he end group abso rp t iv i ty i s ca lcu la ted from the equation
The
where ( A / I ) ~ ( N ) i s the s e t of c,orrected A / 1 va lues which g ives t h e minimum error i n f i t t i n g Equation 5.
212.
The i t e r a t i o n procedure w a s used only stepwise assoc ia t ion constants , where
with t h e model involving dimerizat ion and Kn = GIP-2. The r e s u l t s obtained when
t h e method was t e s t e d wi th’synthe t ic data a r e shown i n Table I. While the method does not converge t o t h e t h e o r e t i c a l values, it y i e l d s values f o r t h e f o m t i o n constants and en that a r e within 5 and a$, respect ively, of the t r u e values.
S p e c t r a l h t a . Solut ions of phenol above a few hundredths molar show t h r e e 0-H bands i n t h e f’undamental region. bonded 0-H bands a r e near 3500 and 3350 cm-l. The band near 3500 cm-1 i s normally assigned t o a c y c l i c dimer s p c i e s and the one near 3350 an-l t o l i n e a r associated species . c reas ing concentration and decreasing temperature.
The f ree 0-H band i s near 3612 an-’ and t h e two
The r e l a t i v e i n t e n s i t y of t h e band near 3350 cm-l Increases with in-
The pr inc ipa l fea ture of t h e first overtone spectrum i s a f r e e 0-H band near 7050 cm-l whose apparent a b s o r p t i v i t y decreases as se l f -assoc ia t ion occurs. 0-H groups a r e evidenced only b y a broad, weak band extending from about 7050 t o 6000 cm-l. hexane than i n carbon t e t r a c h l o r i d e . hydrocarbon solvent, however, and a t concentrat ions above 0.1 o r 0 . 3 t h e order of apparent a b s o r p t i v i t i e s i s reversed.
Bonded
The a b s o r p t i v i t y of t h e monomer i s approximately SO$ g r e a t e r i n cyclo- Self-associat ion occurs more r e a d i l y i n t h e
Model F i t t i n g . Dhenol concentrat ions l e s s t h a n 0.1g were used. Several d i f f e r e n t models gave s a t i s f a c t o r y f i t s over t h i s l imi ted concentrat ion range. cons tan ts derived from these t e s t s were appl ied t o data f o r higher phenol con- cent ra t ions , the agreement between ca lcu la ted and observed absorbances de te r iora ted rap id ly .
In t h e i n i t i a l a t tempts t o f ind t h e b e s t model, only t h e da ta f o r
But when the fornat ion
A v a r i e t y of models were t e s t e d using data f o r phenol concentrat ions up t o 0.655 i n cyclohexane and 1.Og i n carbon t e t r a c h l o r i d e . d i f f e r e n t models a r e shown i n Table 11. f i t s over a l imited range of concentrat ion gave negative values f o r one o r more cons tan ts when t e s t e d over the more extended range. dimerizat ion constant and equal stepwise a s s o c i a t i o n cons tan ts f o r higher m u l t i m e r s gave t h e b e s t f i t i n both solvents .
The standard e r r o r s f o r t h e Several of t h e models which gave good
The model involving a
I n Figure 1 t h e f i t s of s e v e r a l d i f f e r e n t models a r e shown graphical ly . f i t of the dimer-stepwise model and t h e poor f i t of most of t h e other models a r e evident . give good f i ts , and subsequent ca lcu la t ions showed that a t r h r - h e x a m e r model did, indeed, provide a good f i t . c a l l y e s t h e dimer-stepwlse model, and It was not s tudied further.
The good
These curves ind ica ted t h a t c e r t a i n combinations of simpler models might
!his model does not appear t o be a s plausible physi-
i
1
\
\
I
B
' \
I 1 \
\
4 1
Application of t he end group cor rec t ion t o the da t a f o r t he carbon t e t r ach lo r ide system i s i l l u s t r a t e d by t h e curves i n Figure 2. t he minima i n the standard e r r o r curves correspond t o an end group abso rp t iv i ty of approximately 0.3 l./mole-an. between 2.5 and 46" was 0.4 l./mole-cm., which i s equivalent t o 0.11~1.
When the end group cor rec t ion was applied t o t h e da ta for t h e cyclohexane system, t h e standard e r r o r of f i t decreased a t f o u r temperatures but d i d not a t t h r e e others. The maximum value f o r en was 0.08~1 and the average was only 0.0361. In view of these r e s u l t s , we do not f e e l t h a t appl ica t ion of t he cor rec t ion t o the da ta f o r t h e cyclohexane system i s va l id .
Thermodynamic Results. stepwise assoc ia t ion a r e shown i n Figure 3 . from t he p l o t s a r e summarized i n Table 111. The l i n e s i n Figure 3 f o r t h e carbon t e t r a c h l o r i d e system represent da ta t o which t h e end group co r rec t ion was applied. I n Table I11 t h e thermodynamic constants ca lcu la ted f o r both t h e o r i g i n a l and t h e corrected da ta a r e stown f o r comparison.
With t h e da t a taken a t 2.5",
The average value o f E,, determined a t temperatures
P l o t s of formation cons tan ts E 1/T f o r dimerization and The thermodynamic cons tan ts derived
DISCUSSION
Coggeshall and Sa ier ( 3 ) found that a dimerization-stepwise a s soc ia t ion model adequately descr ibes the e f f e c t s of se l f -assoc ia t ion on t h e fundamental 0-H band 3f phenol i n carbon t e t r a c h l o r i d e solution. O u r r e s u l t s obtained i n t h e f i r s t overtone region confirm t h e v a l i d i t y of t h e model and show, i n addi t ion , that it i s appl icable t o se l f - a s soc ia t ion i n cyclohexane so lu t ion .
Cur values can be campared with values of 1.39 and 2.94 l./mole found b y Coggeshall and Sa ier a t ambient instrument tempfratwe and wi th values of 0.70 and 0.83 l./mole reported by West and coworkers (1, 2 ) for K 2 a t 25". kcal. /mole i s i n exce l l en t agreement wi th t h e value o f -5.1 kcal./mole reported by Maguire and West (1). A more recent value of -3.6 reported b y Powell and West (2) scems abnormally low. fcrmation of higher multimers, but our value of -4.32 kcal./mole agrees we l l wi th an Dverall heat sf a s soc ia t ion of -4.35 kcal./mole reported by Mecke (4). wcrked with r e l a t i v e l y high concentrations of phenol, and h i s value i s heavi ly weighted tcward t h e stepwise heat of formation.
sf 0.94 and 3.25 l./mole f o r K2 and K i n carbon t e t r a c h l o r i d e a t 25"
O u r heat of dimerization of -5.05
No d i r e c t comparison can be made f o r t h e heat of
Mecke
Eoth t h e dimerization cons tan ts and t h e stepwise formation cons tan ts a r e approximately twice 3 s l a rge i n cyclohexane so lu t ion a s i n carbon t e t r a c h l o r i d e so lu t ion . The hea ts cf fcrmation i n t h e hydrocarbm solvent, however, a r e only 10 t o 20$ higher than those i n the chlorinated solvent. Similar r e s u l t s have been obtained r ecen t ly f o r a v a r i e t y of hydrogen bonded complexes of phenol i n these two so lven t s (5).
\
214.
The average value o f 0.4 l./mole-cm. found f o r t h e end group a b s o r p t i v i t y i n carbon t e t r a c h l o r i d e solut-ion i s approximately 0.1 a s l a rge as t h e abso rp t iv i ty of t h e f r e e 0-H group'. This r e s u l t i nd ica t e s ei ther that t h e 0-H end groups i n t e r f e r e only s l i g h t l y a t the frequency where t h e monomer band occurs o r that t h e concentration of end groups is much lower than one would expect on t h e b a s i s of a l i n e a r a s s o c i a t i o n model. A low concentration of end groups could r e s u l t f m m t h e formation o f c y c l i c multimers or three dimensional aggregates. Most workers i n t h i s f i e l d have assumed that end group absorption i s negl ig ib le but have recognized t h a t the assumption might introduce major errors i n t h e ca lcu la ted formation cons tan ts . The present r e s u l t s show that t h e assumption i s reasonably va l id , a t l e a s t i n t h e f irst overtone region. b t a r ecen t ly presented b y Bellamy and Pace (6) ind ica t e that t h e end group abso rp t iv i ty may be a s l a rge as 0.3~1 i n t h e fundamental region.
The ques t ion of whether a l c o h o l s and phenols form l i n e a r or cyc l i c dimers, or both, has been discussed widely. Considerable evidence favoring t h e predominance of c y c l i c dimers has been presented, b u t r ecen t work by Bellamy and Pace (6), Ibb i t son and Moore ( 7 ) , and Malecki (8) emphasizes t h e importance o f l i n e a r dimers. Our thermodynamic r e s u l t s i nd ica t e t h a t a s i g n i f i c a n t f r a c t i o n of t h e phenol dimer i s i n t h e l i n e a r form.
The apparent dimerization cons tan t and heat of formation of t h e dimer a r e r e l a t e d ' t o the indiv idua l va lues f o r the l i n e a r and c y c l i c forms as follows ( 9 ) :
where t h e subsc r ip t s A, L, and C represent apparent, l i n e a r , and cyc l ic . If we assume that the heat o f formation o f the l i n e a r dimer i s equal t o t h e stepwise hea t of formation of h igher multimers, we can ca l cu la t e va lues of AI+, &c, and A'~L for various assumed r a t i o s o f KL and KC (Table IV). Making t h e reasonable assumption that LSc i s l a r g e r t han &L but somewhat less than twice a s la rge , w e conclude that t h e ratio of KL t o Kc i s a t l e a s t 0.5 and poss ib ly g rea t e r than unity.
LITERATURE CITED
1. 2. 3. N. D. Coggeshall and E.L. Saier, J. &I& &.,_P, 5414 (1951). 4. R. Mecke, Mscussions Faradax k., e 161 (1950). P
5. J. H. I ady and K. B. Whetsel, Unpublished results. 6. 7. D. A. Ibbl t son and L. F. Moore, J. %. e. 8. J. h lecki , w. m., & 1351 (1965). 9.
M. M. h g u i r e and R. West, Spectrochim. Acta, I& 369 (1961). D. L. Powell and R. West, Swctrochim. Acta, 3 983 (1964).
L. J. Bel- and R. J. Pace, Spectrochim. Acta, 525 (1966). _1967, 76.
L. E. Orgel and R. S. Mulliken, J. &. m. e., 4839 (1957).
'n K2 K Standard Error
215.
TABLE I
TEST OF METHOD FOR END GROUP CORRECTION (SYNTHETIC DATA)
Calculated Theore t ica l Uncorrected Corrected
D i m e r Trimer Tetramer Pentamer He xame r Dimer-Trimer D i m e r -Tetramer Dimer + Tetramer Dimer + Pentamer Dimer + Octamer Dimer - St epw i se
0 1.22 (0.24~1) 3-17 2.92 7.05 9.45 0.0069 0.0001
TABU I1
TEST OF MODELS FOR SELF-ASSOCIATION OF PHENOL
Standard Error Cyc lohe =nea ccl,b
a Phenol concentrations up t o 0.65g a t 22.2O.
Phencl concentrations up t o 1.0g a t 20.7".
Negative values fo r one or more constants.
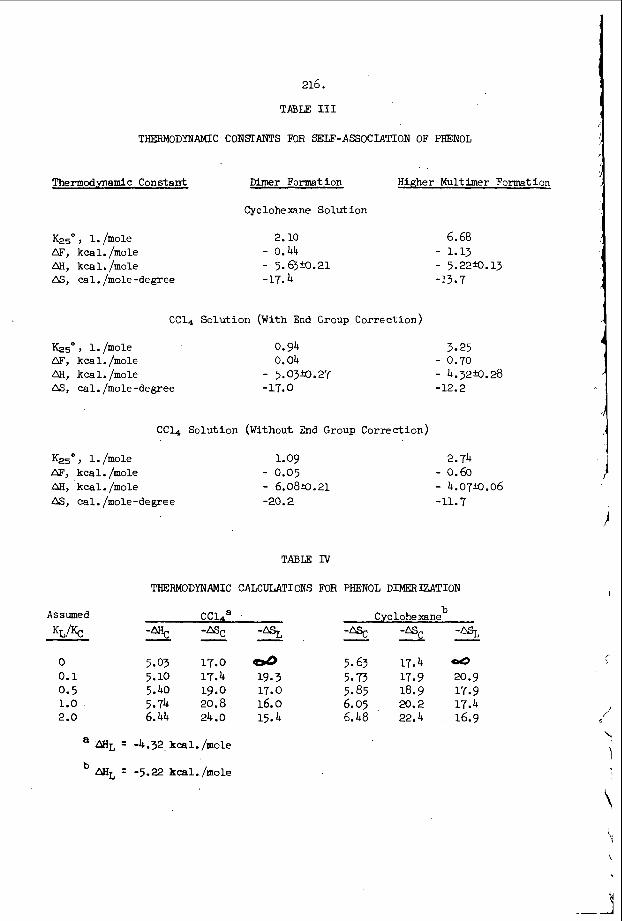
216.
TABLE 111
THERMODYNAMIC CONSI!ANTS FOR SELF-ASSOCIATION OF PHENOL
Thermodynamic Constant Dimer Formation H1a;her Multlmer Format i o n
Cyclohexane Solu t ion
KzS0, 1. /mole AF', kcal . /mole AH, kcal . /mole AS, ca l . /mole-degree
2.10 - 0.44 - 5.63m.21 -17.4
CC14 Solu t ion (With End Group Correct ion)
, 1. /mole aF, kcal . /mole AH, kcal./mole AS, cal./mole-degree
0.94 0.04
- 5.03Xl.27 -17.0
C C 4 Solu t ion (Without End Group Correct ion)
KzS0, 1. /mole AF', kca l . /mole AH, kcal . /mole AS, cal. /mole-degree
1.09 - 0.05 - 6.08m.21 -20.2
TABLE IV
6.68 - 1.15 - 5 . 2 2 ~ ~ 1 3 -13.7
3-25 - 0.70 - 4.32S.28 -12.2
2.74 - 0.60 - 4.07+0.06 -11.7
THERMODYNAMIC CALCULATIONS FOR PHENOL DIMEBIZATION
b Assumed C C l a a Cyclohexane
K L I k - -% - -Bc - -A% - -4 3 - -as, 0 5.03 17.0 4 5.63 17.4 00
0.5 5.40 19.0 17.0 5.85 18.9 17.9 0.1 5.10 17.4 19.3 5.73 17-9 20.9
1.0 5.74 20.8 16.0 6.05 20.2 17.4 2.0 6.44 24.0 15.4 6.48 22.4 16.9
a ML = -4.32 kcal./mole
ABL -5.22 kcal./mole
k \
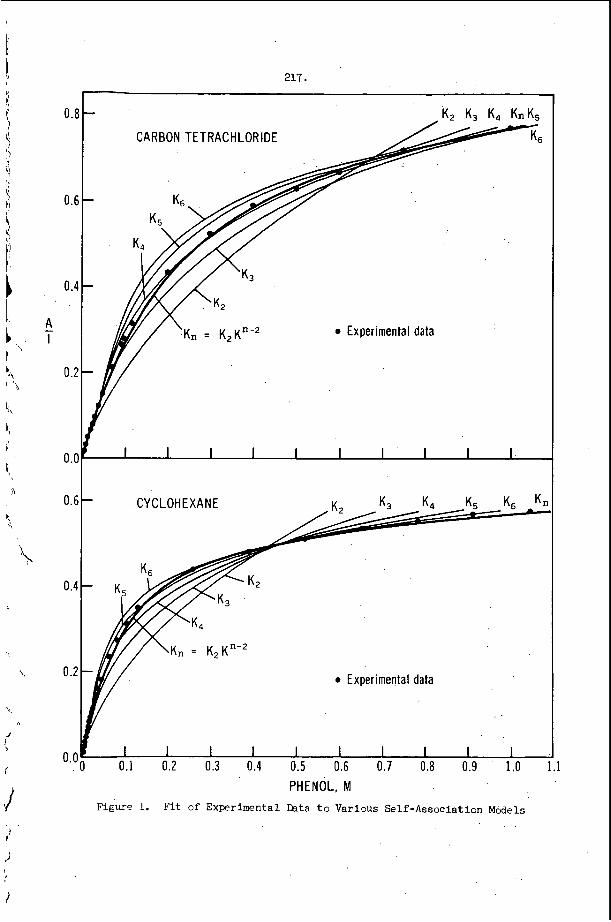
h ,
i I
0.E
0.6
0.4
A 1 -
0.2
0.0
0.6
0.4
0.2
217.
0 Experimental data
/ . 0 Experimental data
~
0.1 0.2 0.3 0.4 0.5 0.6 0.7 0.8 0.9 1.0 1.1 o.oo PHENOL, M
Figure 1. F i t of Experimental h t a t o Various Self-Association Models
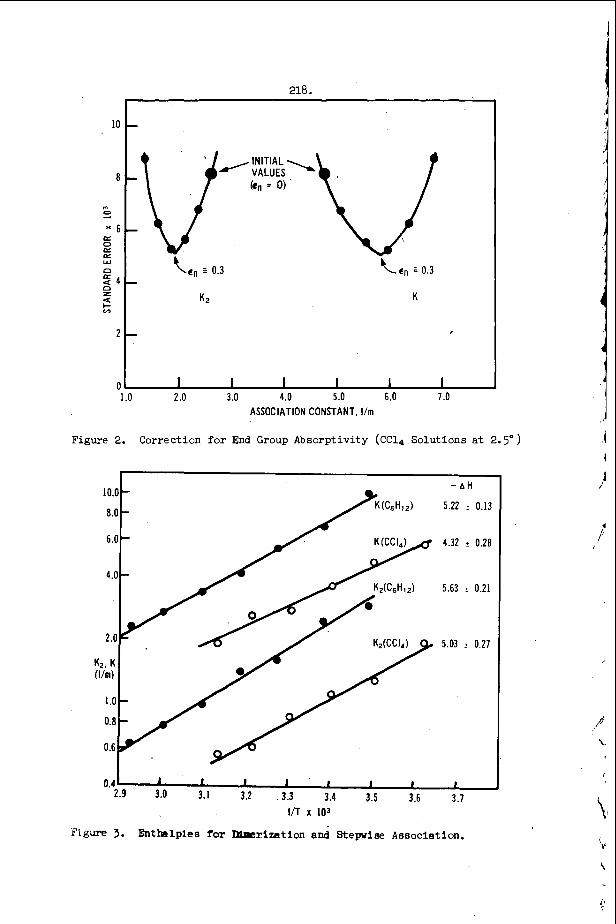
218.
i 0.3
,
1.0 2 .o 3.0 4.0 5.0 6.0 7 .O ASSOCIATION CONSTANT. I/m
Figure 2. Correction f o r End Group Absorpt ivi ty (CC14 Solu t ions a t 2.5")
0.4 I I I I 1 ' 1 I I I 2.9 3.0 3.1 3.2 3.3 3.4 3.5 3.6 3.7
Bnthslples for Dim?rizatlon and Stepwise Association.
I/T x 103
Figure 3.
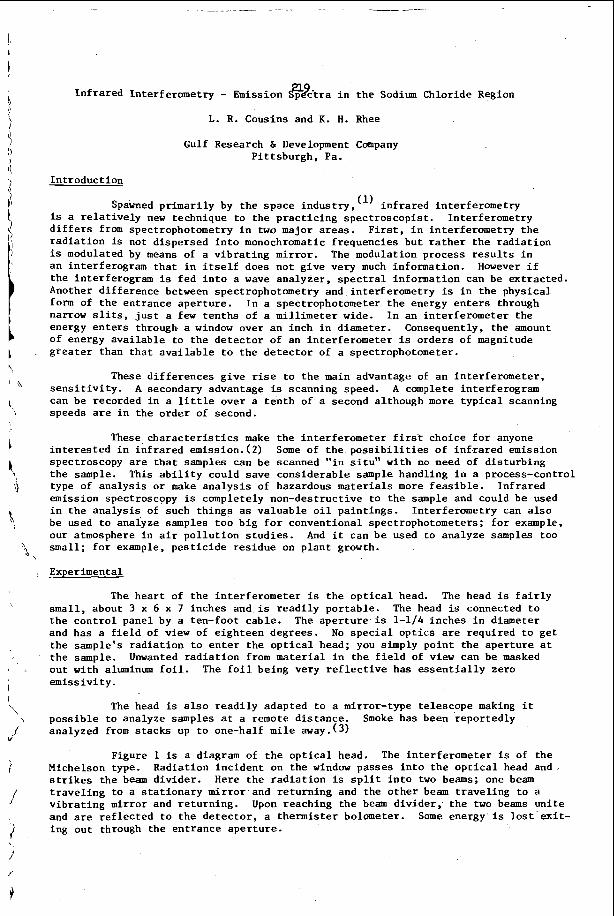
I n f r a r e d In te r fe rometry - Emission @&ra i n t h e Sodium Chloride Region
L. R. Cousins and K. H. Rhee
Gulf Research 6 Development Company P i t t sbu rgh , Pa.
In t roduc t ion
Spawned p r imar i ly by t h e space indus t ry , is a r e l a t i v e l y new technique t o the p r a c t i c i n g spec t roscop i s t . d i f f e r s from spectrophotometry i n t w o major areas. r a d i a t i o n is not d i spersed i n t o monochromatic f requencies bu t r a t h e r t h e r a d i a t i o n is modulated by means of a v i b r a t i n g mir ror . a n in te r fe rogram t h a t i n i t s e l f does not g ive very much information. However i f the in te r fe rogram is f e d i n t o a wave ana lyzer , s p e c t r a l information can b e ex t rac ted . Another d i f f e rence between spectrophotometry and in te r fe rometry is i n t h e phys ica l form of t h e en t rance ape r tu re . narrow slits, j u s t a few t en ths of a m i l l i m e t e r wide. I n an i n t e r f e romete r t he energy e n t e r s through a window over a n inch i n diameter. Consequently, t he amount of energy ava i l ab le t o t h e d e t e c t o r of an in t e r f e romete r i s o rde r s of magnitude g r e a t e r than t h a t a v a i l a b l e t o t h e d e t e c t o r of a spectrophotometer.
i n f r a r e d in te r fe rometry
F i r s t , i n in te r fe rometry t h e In te r fe rometry
The modulation process r e s u l t s i n
I n a spectrophotometer t h e energy e n t e r s through
These d i f f e r e n c e s g ive rise t o t h e main advantage of an in t e r f e romete r , s e n s i t i v i t y . A secondary advantage is scanning speed. A comple te in te r fe rogram can be recorded i n a l i t t l e over a t e n t h of a second although more t y p i c a l scanning speeds are i n the o rde r of second.
These c h a r a c t e r i s t i c s make the in t e r f e romete r f i r s t choice f o r anyone i n t e r e s t e d i n i n f r a r e d emission.(2) spectroscopy are t h a t samples can be scanned " in s i t u " wi th no need of d i s tu rb ing t h e sample. This a b i l i t y could save cons iderable sample handling i n a process-control type of ana lys i s o r make a n a l y s i s of hazardous materials more f e a s i b l e . In f r a red emission spectroscopy is completely non-destructive t o the sample and could be used i n t h e ana lys i s of such th ings as va luab le o i l pa in t ings . In te r fe rometry can a l s o be used t o analyze samples too b i g f o r convent iona l spectrophotometers; f o r example, our atmosphere i n a i r p o l l u t i o n s t u d i e s . And i t can be used t o ana lyze samples too smal l ; f o r example, p e s t i c i d e r e s idue on p l a n t growth.
Some of t h e p o s s i b i l i t i e s of i n f r a r e d emission
Experiment a1
The h e a r t of t h e in t e r f e romete r is t h e o p t i c a l head. The head is f a i r l y sma l l , about 3 x 6 x 7 inches and is r e a d i l y po r t ab le . The head is connected t o the c o n t r o l panel by a ten-foot cable . The a p e r t u r e is 1-1/4 inches i n diameter and has a f i e l d of v i e w of e igh teen degrees . No s p e c i a l o p t i c s are requi red t o ge t t he sample's r a d i a t i o n t o e n t e r t h e o p t i c a l head; you simply po in t t h e a p e r t u r e a t t h e sample. Unwanted r a d i a t i o n from material i n t h e f i e l d of view can be masked ou t wi th aluminum f o i l . The f o i l be ing very r e f l e c t i v e has e s s e n t i a l l y zero emis s iv i ty .
The head is a l s o r e a d i l y adapted t o a mirror-type te lescope making it p o s s i b l e t o analyze samples a t a remote d i s t ance . analyzed from stacks up t o one-half m i l e away.(3)
Smoke has been r epor t ed ly
Figure 1 i s a diagram of t h e o p t i c a l head. The in t e r f e romete r is of t he Radia t ion i n c i d e n t on t h e window passes i n t o t h e o p t i c a l head and Michelson type.
s t r i k e s the beam d iv ide r . Here t h e r a d i a t i o n is s p l i t i n t o two beams; one beam t r a v e l i n g t o a s t a t i o n a r y mi r ro r and r e tu rn ing and the o t h e r beam t r a v e l i n g t o a v i b r a t i n g mirror and r e tu rn ing . and are r e f l e c t e d t o t h e d e t e c t o r , a t h e m i s t e r bolometer. Some energy i s l o s t exit- ing out through the en t r ance ape r tu re .
Upon reaching the beam d iv ide r , t h e two beams u n i t e
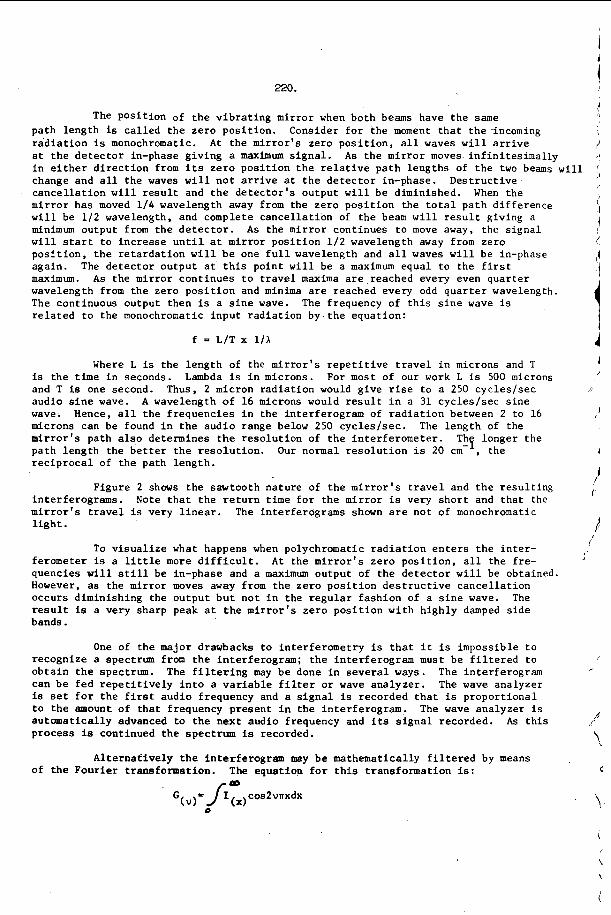
I
j no. 1
The Pos i t i on of t h e v i b r a t i n g mir ror when both beams have t h e same path length is c a l l e d t h e ze ro pos i t i on .
a t t h e d e t e c t o r in-phase g iv ing a maximum s i g n a l . i n e i t h e r d i r e c t i o n from i t s ze ro p o s i t i o n t h e r e l a t i v e p a t h lengths of t h e two beams w i l l
Consider f o r the moment t h a t t h e incoming r a d i a t i o n is monochromatic. A t t h e mi r ro r ' s zero p o s i t i o n , a l l waves w i l l a r r i v e i
A s t h e mi r ro r moves i n f i n i t e s i m a l l y
change and a l l the waves w i l l n o t a r r i v e a t t h e d e t e c t o r in-phase. Des t ruc t ive c a n c e l l a t i o n w i l l r e s u l t and t h e d e t e c t o r ' s ou tput w i l l be diminished. mi r ro r has moved 1 / 4 wavelength away from the zero p o s i t i o n the t o t a l pa th d i f f e rence w i l l be 112 wavelength, and complete cance l l a t ion of t he beam w i l l r e s u l t giving a minimum output from t h e d e t e c t o r . A s t h e mir ror cont inues t o move away, the s i g n a l w i l l start t o inc rease u n t i l a t mir ror p o s i t i o n 1 / 2 wavelength away from zero p o s i t i o n , t h e r e t a r d a t i o n w i l l b e one f u l l wavelength and a l l waves w i l l be in-phase aga in . The de tec to r ou tput a t t h i s po in t w i l l be a maximum equal t o the f i r s t maximum. A s t h e mir ror cont inues t o travel maxima a r e reached every even qua r t e r wavelength from t h e zero p o s i t i o n and minima a r e reached every odd q u a r t e r wavelength. The continuous output then i s a s i n e wave. The frequency of t h i s s i n e wave is r e l a t e d t o the monochromatic i npu t r a d i a t i o n by t h e equat ion:
When the
f = L/T x 1 / A
Where L is the l eng th of the mi r ro r ' s r e p e t i t i v e t r a v e l i n microns and T is t h e time i n seconds. Lambda is i n microns. For most of our work L is 500 microns and T is one second. Thus, 2 micron r a d i a t i o n would g ive r i s e t o a 250 cyc le s / sec audio s i n e wave. wave. Hence, a l l t he f r equenc ie s i n the in te r fe rogram of r a d i a t i o n between 2 t o 16 microns can be found i n t h e audio range below 250 cyc le s / sec . The length of the m i r r o r ' s pa th a l s o determines the re so lu t ion of t h e in t e r f e romete r . Th longer the pa th length the b e t t e r t h e r e s o l u t i o n . r e c i p r o c a l of t h e pa th l eng th .
A wavelength o f 16 microns would r e s u l t i n a 31 cyc le s / sec s i n e
Our normal r e s o l u t i o n i s 20 cm-', the
Figure 2 shows t h e sawtooth na tu re of t h e m i r r o r ' s t r a v e l and t h e r e su l t i ng in te r fe rograms. Note t h a t t h e r e t u r n t i m e f o r t h e mir ror i s very s h o r t and t h a t the mi r ro r ' s t r a v e l is very l i n e a r . l i g h t .
The in te r fe rograms shown are not of monochromatic
To v i s u a l i z e what happens when polychromatic r a d i a t i o n e n t e r s t h e i n t e r - fe rometer is a l i t t l e more d i f f i c u l t . A t t he m i r r o r ' s ze ro p o s i t i o n , a l l t he f r e - quencies w i l l still be in-phase and a maximum output of t h e d e t e c t o r w i l l be obtained. However, as the mir ror moves away from t h e ze ro p o s i t i o n d e s t r u c t i v e c a n c e l l a t i o n occurs diminishing the output b u t no t i n the r e g u l a r f a sh ion of a s i n e wave. The r e s u l t is a very sharp peak a t t h e m i r r o r ' s ze ro p o s i t i o n wi th h igh ly damped s i d e bands.
One of t he major drawbacks t o in t e r f e romet ry i s t h a t i t i s impossible t o recognize a spectrwn from t h e in te r fe rogram; t h e in te r fe rogram must be f i l t e r e d t o o b t a i n t h e spectrum. The f i l t e r i n g may be done i n several w a y s . The in te r fe rogram can be f e d r e p e t i t i v e l y i n t o a v a r i a b l e f i l t e r o r wave ana lyze r . The wave ana lyzer is set f o r t h e f i r s t audio frequency and a s i g n a l is recorded t h a t is p ropor t iona l t o t h e amount of t h a t frequency p resen t i n the in te r fe rogram. The wave ana lyzer is au tomat i ca l ly advanced t o t h e nex t audio frequency and its s i g n a l recorded. A s t h i s process is continued t h e spectrum is recorded.
A l t e rna t ive ly t h e in te r fe rogram may be mathematically f i l t e r e d by means of t h e Four i e r t ransformat ion . The equation f o r t h i s t ransformat ion is:
' G(")= /I:, cos2vnxdx 0
, r
c
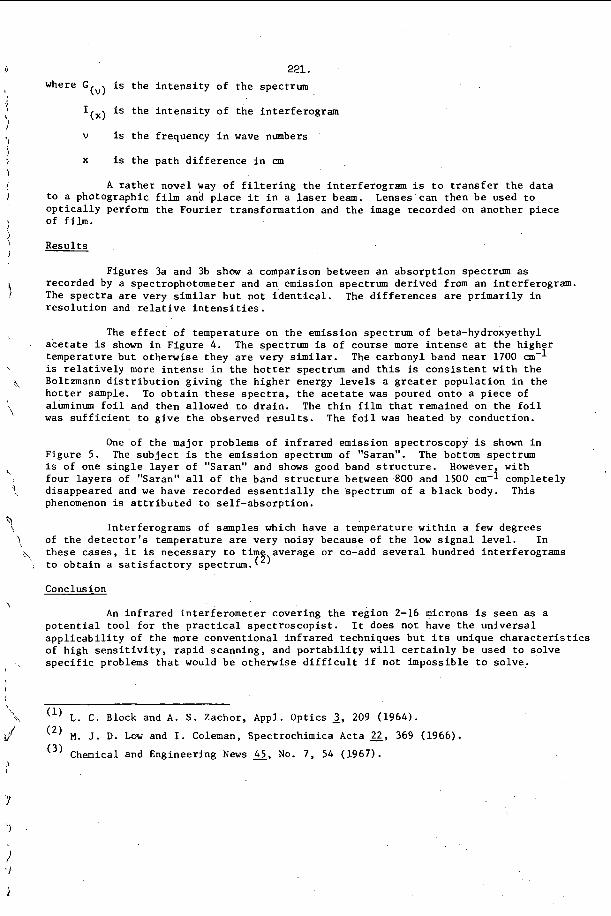
221 I
where G(") is t h e i n t e n s i t y of t h e spectrum
I ( x ) is t h e i n t e n s i t y of t h e in te r fe rogram
v i s t h e frequency i n wave numbers
x is t h e pa th d i f f e r e n c e i n an
A r a t h e r novel way of f i l t e r i n g the in te r fe rogram is t o t r a n s f e r the d a t a t o a photographic f i l m and p l a c e i t i n a laser beam. o p t i c a l l y perform t h e Four ie r t ransformat ion and t h e image recorded on another p iece of f i lm.
Resul t s
Lenses can then b e used t o
Figures 3a and 3b show a comparison between an absorp t ion spectrum as recorded by a spectrophotometer and an emission spectrum der ived from an interferogram. The s p e c t r a are very s i m i l a r b u t no t i d e n t i c a l . r e s o l u t i o n and relative i n t e n s i t i e s .
The d i f f e r e n c e s are pr imar i ly i n
The e f f e c t of temperature on t h e emission spectrum of beta-hydroxyethyl a c e t a t e is shown i n Figure 4. The spectrum is of course more i n t e n s e a t t h e higher temperature b u t o therwise they are very s imi la r . The carbonyl band near 1700 an-' is r e l a t i v e l y more i n t e n s e i n t h e h o t t e r spectrum and th i s is c o n s i s t e n t w i t h t h e Boltzmann d i s t r i b u t i o n g iv ing t h e h igher energy levels a g r e a t e r populat ion i n the h o t t e r sample. aluminum f o i l and then allowed t o d r a i n . The t h i n f i l m t h a t remained on t h e f o i l w a s s u f f i c i e n t t o g i v e t h e observed r e s u l t s . The f o i l was hea ted by conduction.
To o b t a i n t h e s e s p e c t r a , t h e acetate w a s poured onto a p i e c e of
One of t h e major problems of i n f r a r e d emission spectroscopy is shown i n Figure 5. The s u b j e c t is t h e emission spectrum of "Saran". The bottom spectrum is of one s i n g l e l a y e r of "Saran" and shows good band s t r u c t u r e . four l a y e r s of "Saran" a l l of t h e band s t r u c t u r e between 800 and 1500 cm-I completely disappeared and w e have recorded e s s e n t i a l l y t h e spectrum of a b l a c k body. phenomenon is a t t r i b u t e d t o se l f -absorp t ion .
However, w i t h
This
Interferograms of samples which have a temperature w i t h i n a few degrees
, t o o b t a i n a s a t i s f a c t o r y spectrum.(')
of the d e t e c t o r ' s temperature are very noisy because of t h e l o w s i g n a l l e v e l . I n \ these cases, it is necessary t o t i m average o r co-add several hundred in te r fe rograms
Conclusion
An i n f r a r e d i n t e r f e r o m e t e r covering t h e reg ion 2-16 microns i s seen as a p o t e n t i a l t o o l f o r t h e p r a c t i c a l s p e c t r o s c o p i s t . a p p l i c a b i l i t y of t h e more convent iona l i n f r a r e d techniques b u t i t s unique c h a r a c t e r i s t i c s of high s e n s i t i v i t y , r a p i d scanning, and p o r t a b i l i t y w i l l c e r t a i n l y b e used t o so lve s p e c i f i c problems t h a t would b e otherwise d i f f i c u l t i f n o t impossible t o solve.
It does not have t h e u n i v e r s a l
L. C. Block and A. S. Zachor, Appl. Optics 2, 209 (1964).
M. J . D. Low and I. Coleman, Spectrochimica Acta 22, 369 (1966).
( 3 ) Chemical and Engineering N e w s 45, No. 7, 54 (1967).
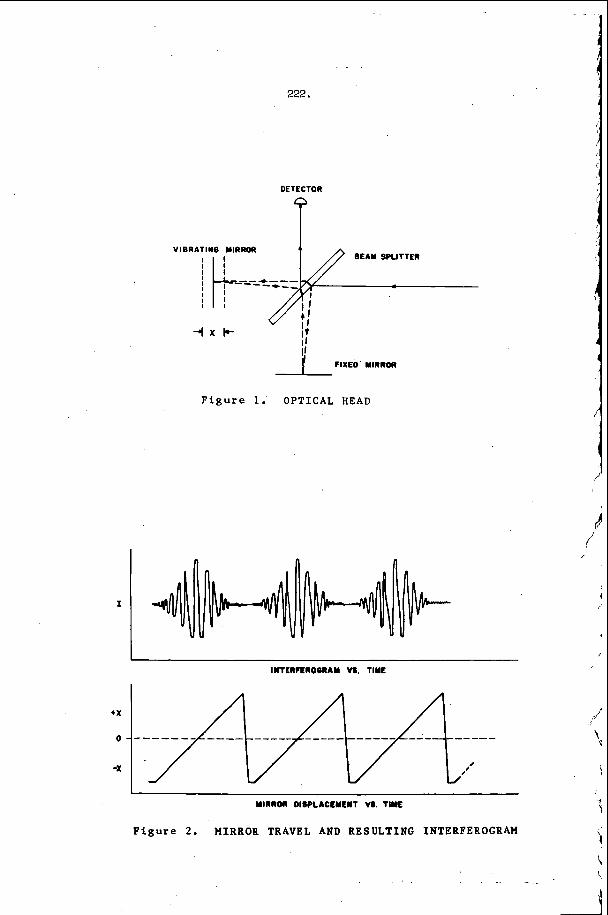
222.
DETECTOR
P
f FIXE0 MIRROR
Figure 1 . O P T I C A L HEAD
d i
I MIRROR OIIPLACLYLWT VI . TIYE
I Figure 2 . MIRROR TRAVEL AND R E S U L T I N G INTERFEROGRAM
- _
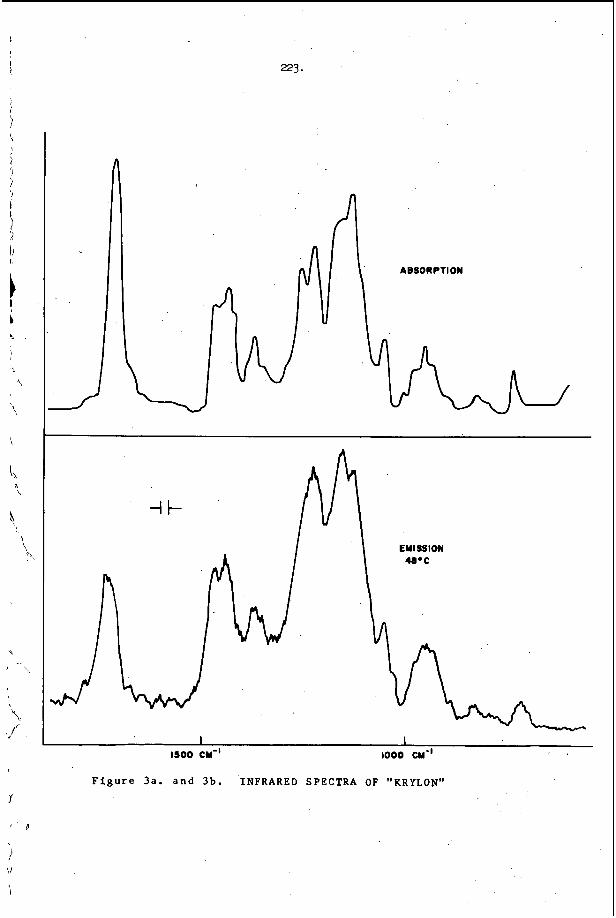
I 1 I S 0 0 CY-' 1000 CY-'
F i g u r e 3a . and 3 b . INFRARED SPECTRA OF "KRYLON"
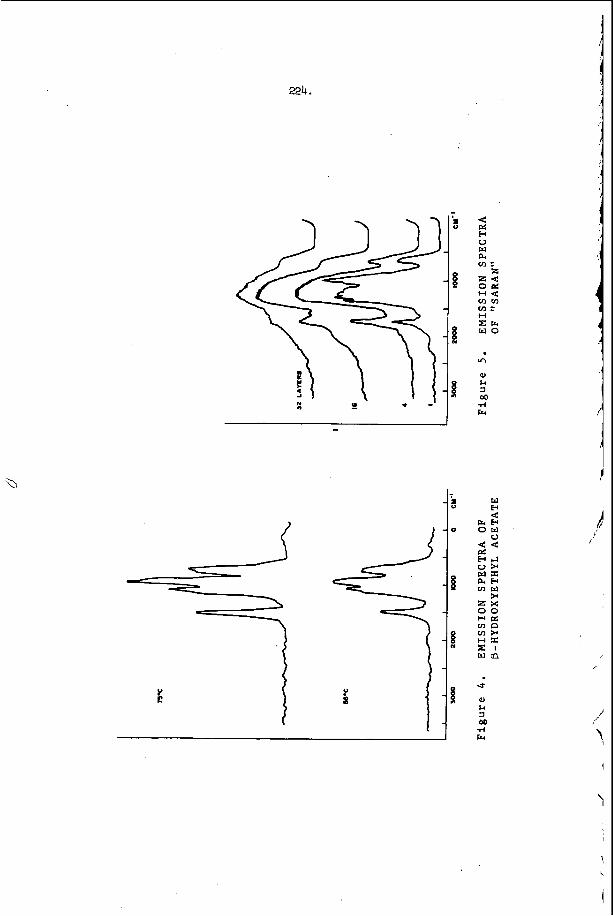
224.
E
I
I i
\ I
i
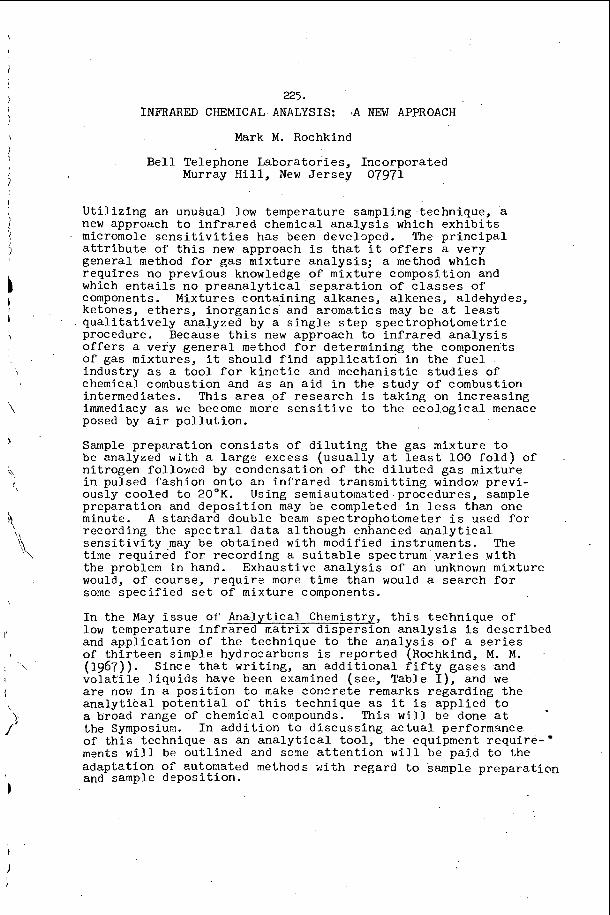
225.
INFRARED CHEMICAL ANALYSIS: ,A NEW APPROACH
Mark M. Rochkind
B e l l Telephone Lsborator ies , Incorporated Murray H i l i , New J e r s e y 07971
Ut i l i z ing an unusual low temperature sampling technique, a new approach t o i n f r a r e d chemical a n a l y s i s which e x h i b i t s micromole s e n s i t i v i t i e s has been devel3ped. The p r i n c i p a l a t t r i b u t e of t h i s new approach i s t h a t it o f f e r s a very general method f o r gas mixture ana lys i s ; a method which r equ i r e s no previous knowledge of mixture composition and which e n t a i l s no p r e a n a l y t i c a l s epa ra t ion of c l a s s e s of components. Mixtures con ta in ing alkanes, a lkenes, aldehydes, ketones, e the r s , i no rgan ic s and aromatics may be a t l e a s t q u a l i t a t i v e l y analyzed by a s i n g l e s t e p spectrophotometric procedure. Because t h i s new approach t o i n f r a r e d a n a l y s i s o f f e r s a very g e n e r a l method f o r determining the components of gas mixtures, it should f i n d a p p l i c a t i o n i n the f u e l industry as a t o o l f o r k i n e t i c and mechanistic s t u d i e s of chemical combustion and as an a i d i n the s tudy of combustion intermediates . This a r e a of r e sea rch i s t ak ing on inc reas ing immediacy a s we become more s e n s i t i v e t o t h e eco log ica l menace posed by air p o l l u t i o n .
Sample p repa ra t ion c o n s i s t s of d i l u t i n g t h e gas a i x t u r e t o be analyzed with a l a r g e excess (usua l ly a t l e a s t 100 f o l d ) of ni t rogen followed by condensation of the d i l u t e d gas mixture i n pulsed fashion onto an i n f r a r e d t r a n s m i t t i n g windod previ- ously cooled t o 20°K. Using semiautomsted procedures, sample preparat ion and depos i t i on may be completed i n less than one minute. A standard double beam spectrophotometer i s used f o r recording the s p e c t r a l d a t a although enhanced a n a l y t i c a l s e n s i t i v i t y .may be obtained with modified instruments . The time required f o r record ing a s u i t a b l e spectrum v a r i e s wi th the problem i n hand. Exhaustive a n a l y s i s of an unknown mixture would, of course, r e q u i r ? more time than would a search f o r some spec i f i ed s e t o f mixture components.
I n the May i s sue of Analytical Chemistrx, t h i s technique of low temperature i n f r a r e d matrix d i s p e r s i o n a n a l y s i s i s described and a p p l i c a t i o n of t h e technique t o the a n a l y s i s of a s e r i e s of t h i r t e e n simple hydrocarbons i s reported (Rochkind, M. M. (1967)). Since t h a t wr i t i ng , an a d d i t i o n a l f i f t y gases and v o l a t i l e l i q u i d s have been examined (see, Table I ) , and we a r e now i n a p o s i t i o n t o make conc re t e remarks regard ing t h e a n a l y t i c a l p o t e n t i a l of t h i s technique as it i s appl ied t o , a broad range of chemical compounds. This w i l l be done a t the Symposium. I n a d d i t i o n t o d i scuss ing a c t u a l performance of t h i s technique as an a n a l y t i c a l t oo l , t h e equipment r equ i r e - merits w i l l be ou t l ined end sone a t t e n t i o n w i l l be paid t o the adapts t ion of z u t o m t e d methods wi th regard t o sample p repa ra t ion and sample deposi t ion.
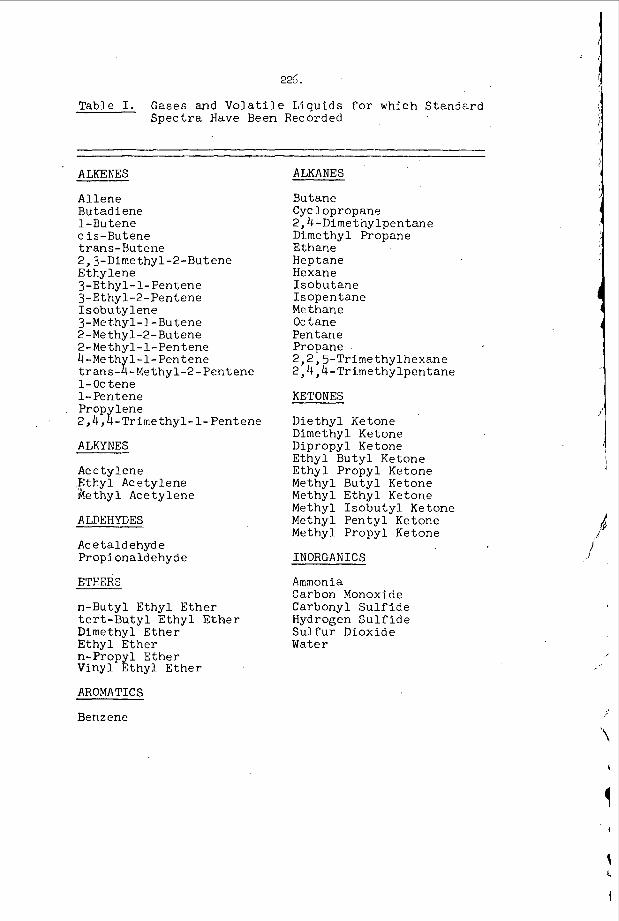
225.
1 ' i
i
Table I. Gases and V o l a t i l e Liquids f o r which Standard Spec t r a Have Been Recorded i
I
ALKENES I
Allene Butadiene 1-Butene c is-Butene t r a n s - Butene 2,3-Dimethyl-2-Butene Ethylene 3-Ethyl-1-Pentene 3-Ethyl-2-Pentene Isobutylene 3-Methyl-1-Butene 2-Me thyl-2-But ene 2 -Methyl- 1.- Pent ene 4-Meth 1 1-Ptntene t r a n s -8- Me thy l-2 - Pent ene 1-Oc tene 1- Pentene Prop lene 2,4, $ -Trimethyl-1-Pentene
ALKYNES
Acetylene .Ethyl Acetylene he thy1 Acetylene
ALDEHYDES
Ac e t a l d ehyd e . Prop i ona I d e hy d e
ETHERS
n-Butyl Ethyl Ether t e r t -Bu ty l E thy l E the r Dimethyl Ether Ethyl Ether n-Propyl Ether Vinyl Ethyl Ether
AROMATICS
Benzene
1 ALKANES
Butane Cyclopropane 2,4 - Dime t ny 1 pent an e Dimethyl Propane Ethane Heptane Hexane Isobutane I s open t a ne Methane Octane Pentane Propane 2,2,5-Trimethylhexane 2,4,4-Trimethylpentane
KETONES
Die thyl Ketone Dimethyl Ketone Dipropyl Ketone Ethyl Butyl Ketone Ethyl Propyl Ketone Methyl Butyl Ketone Methyl E thy l Ketone Methyl I sobu ty l Ketone Methyl Penty l Ketone Methyl Propyl Ketone
INORGANICS
Amnonia Carbon Monoxide Carbonyl S u l f i d e Hydrogen S u l f i d e Su l fu r Dioxide Water
1 d
//
/
1
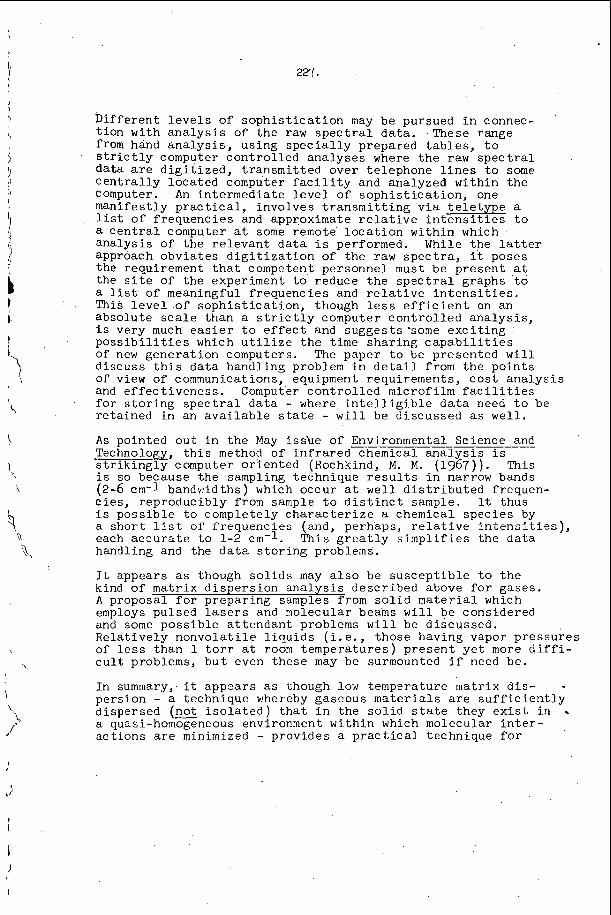
227.
I
i
''I i \
, '4
Differen t l e v e l s of s o p h i s t i c a t i o n may be pursued i n connec- '
t i o n wi th a n a l y s i s of t h e raw s p e c t r a l d a t a . from hand ana lys i s , using s p e c i a l l y prepared t a b l e s , t o s t r i c t l y computer con t ro l l ed ana lyses where t h e raw s p e c t r a l d a t a a r e d i g i t i z e d , t ransmi t ted over te lephone l i n e s t o some c e n t r a l l y loca ted computer f a c i l i t y and analyzed wi th in t h e Computer. An in te rmedia te l e v e l of s o p h i s t i c a t i o n , one manifest ly p r a c t i c a l , involves t r a n s m i t t i n g v i a t e l e t y p e a l i s t o f f requencies and approximate r e l a t i v e i n t e n s i t i e s t o a c e n t r a l computer a t sone remote l o c a t i o n wi th in which ana lys i s of t he r e l e v a n t d a t a i s performed. While t h e l a t t e r approach obvia tes d i g i t i z a t i o n of t he r a w spec t r a , i t poses the requirement t h a t competent personnel must be p re sen t a t the s i t e of t he experiment to reduce t h e s p e c t r a l graphs t o a l i s t of meaningful f requencies and r e l a t i v e i n t e n s i t i e s . This l e v e l of soph i s t i ca t ion , though l e s s e f f i c i e n t on an absolute s c a l e than a s t r i c t l y conputer con t ro l l ed ana lys i s , i s very much e a s i e r t o e f f e c t and sugges ts 'some e x c i t i n g p o s s i b i l i t i e s which u t i l i z e t h e time shar ing c a p a b i l i t i e s of new genera t ion computers. The paper t o be presented w i l l d i scuss t h i s d a t a handl ing problem i n d e t a i l from the po in t s of view of communications, equipment requirements , c o s t ana lys i s and ef fec t iveness . Computer con t ro l l ed microf i lm f a c i l i t i e s f o r s t o r i n g s p e c t r a l d a t a - where i n t e l l i g i b l e d a t a need t o be retained i n an a v a i l a b l e s t a t e - w i l l be discussed a s wel l .
These range
A s pointed o u t i n t he May iss'ue of Environmental Science and -- Technologx, t h i s method of i n f r a r e d chemical a n a l y s i s i s
1 s t r i k i n g l y computer or ien ted (Rochkind, M. M. (1967)). This '\ i s so because t h e sampling technique r e s u l t s i n narrow bands \ (2-6 c m - 1 bandwidths) which occur a t we l l d i s t r i b u t e d frequen-
c i e s , reproducibly from sample t o d i s t i n c t sample. It thus i s poss ib l e t o completely c h a r a c t e r i z e a chemical spec ies by a sho r t l i s t of f requencies (and, perhaps, r e l a t i v e i n t e n s i t i e s ) , each accu ra t e t o 1-2 cm-l. This g r e a t l y s i m p l i f i e s t he data \\
9 handling and the data s t o r i n g problems.
\ ! I
It appears as though s o l i d s may a l s o be suscep t ib l e t o t h e kind of mat r ix d i spe r s ion a n a l y s i s descr ibed above f o r gases . A proposal f o r prepar ing samples from s o l i d m a t e r i a l which employs pulsed l a s e r s and molecular beams w i l l be considered and some poss ib l e a t t endan t problems w i l l be d iscussed . Rela t ive ly nonvo la t i l e l i q u i d s ( i . e . , those having vapor p re s su res of l e s s than 1 t o r r a t room tempera tures) p re sen t y e t more d i f f i - c u l t problems, b u t even these may be surmounted i f need be.
In summary, it a p p i a r s as though lo-t~ temperature matr ix d i s - pers ion - a technique whereby gaseous m a t e r i a l s a r e s u f f i c i e n t l y dispersed (not i s o l a t e d ) t h a t i n the s o l i d s ta te they e x i s t i n . a quesi-homogeneous environment wi th in which molecular i n t e r - ac t ions are minimized - provides a p r a c t i c a l technique f o r
I
I
228.
sample p reps ra t ion . and permi ts a new approach t o i n f r a r e d chemical a n a l y s i s . p r e c i s e l y t h e q u a n t i t a t i v e c a p a b i l i t i e s of t he method. Progress i n t h i s area w i l l be b r i e f l y reported.
Work I s c u r r e n t l y underway t o de f ine
References C i t e d
1. Rochkind, M. M., Anal. Chem. 3, 567 (1967).
2. Rochkind, M. M., Environ. Sci . Technol. 1, 434 (1967).
Acknowledgement
The author i s indebted t o Robert V. Albarino who prepared gas mixtures f o r a n a l y s i s and who recorded many of t h e s p e c t r a l measurements.
I !
i
/ r
k
THE ANALYSIS OF COAL WITH THE LASER-MASS SPECIXOEETER
F. J. Vastola , A. J. Pirone , P. H.,Given, and R. R. Dutcher College of E a r t h and Mineral Sc iences
Pennsylvania S t a t e Univers i ty , Univers i ty Park, Pa:
INTRODUCTION
The laser-mass spectrometer h a s been used t o pyro lyse pe t rographic c o n s t i t u e n t s of coa l and record the mass spectrum o f t h e p y r o l y s i s products thus produced. The laser-mass spectrometer has been descr ibed i n d e t a i l elsewhere ( 1 , 2 ) . E s s e n t i a l l y it c o n s i s t s o f a small pulsed ruby l a s e r (max. ou tput energy 0.1 j o u l e ) whose output can be focused on the sur face of a coa l t a r g e t loca ted i n t h e i o n i z a t i o n chamber of a t i m e - o f - f l i g h t mass s p e c t r o - meter . A modified microscope o p t i c a l system is used t o focus the l a s e r ; i r r a d i a t e d t a r g e t s can be a s small a s 10 microns i n d iameter . Since t h e t a r g e t t o be i r r a d i a t e d can be viewed through the same microscope system, s e l e c t e d a r e a s of t h e c o a l sample can be pyrolysed. With the 10 micron diameter l i m i t of t h e i r r a d i a t i o n zone d i f f e r e n t p e t r o - graphic c o n s t i t u e n t s of a c o a l sample can be pyrolysed i n - s i t u and t h e i r mass s p e c t r a recorded. These s p e c t r a can be used t o s tudy t h e chemical composition and s t r u c t u r e of coa l o r even more simply can be used a s " f i n g e r p r i n t s " to d i f f e r e n t i a t e between the var ious heterogeneous c o n s t i t u e n t s o f c o a l .
LASER HEATING 1)
3 The energy from the l a s e r t h a t i r r a d i a t e s t h e c o a l sample i s n o t g r e a t ( 4 . 0 1 c a l . ) . However, s ince the energy i s d e l i v e r e d i n a s h o r t p u l s e and t h e h igh coherency of t h e l a s e r l i g h t enables it t o be focused on a sma l l a r e a , f l u x d e n s i t i e s of lo6 cal . /sec. /cm.2 can be e s t a b l i s h e d a t the coa l s u r f a c e . These h igh f l u x d e n s i t i e s r e s u l t i n extremely
'\ \
{ rap id h e a t i n g r a t e s . \\
It i s d i f f i c u l t t o a s s i g n a temperature t o a l a s e r p y r o l y s i s . I f one assumes t h a t / only t h e m a t e r i a l vaporized was heated es t imated temperatures would be about 50,OOO"C.
This va lue would be decreased cons iderably i f the h e a t o f decomposition of t h e coa l was taken i n t o account. Another f a c t o r even more d i f f i c u l t t o eva lua te is t h e s h i e l d i n g of the coa l sur face from t h e l a s e r r a d i a t i o n by t h e plume of decomposition products . The presence o f high molecular weight products i n t h e mass spectrum would s e e m t o i n d i c a t e t h a t the b u l k of the pyrolysed c o a l d id not reach temperature much above 1000°C. high f l u x output of t h e l a s e r e s t a b l i s h e s l a r g e temperature g r a d i e n t s i n the heated s o l i d but the s h o r t pulse length r e s t r i c t s p y r o l y s i s t o t h a t m a t e r i a l i n t h e immediate v i c i n i t y of the i r r a d i a t e d zone. This i s demonstrated by t h e f a c t t h a t a second l a s e r h e a t i n g o f a t a r g e t produces a mass spectrum c h a r a c t e r i s t i c of a c h a r r a t h e r than t h e o r i g i n a l m a t e r i a l , however i f the l a s e r i s f i r e d a t an a r e a 100 microns removed from a pyrolysed c r a t e r t h e r e s u l t i n g spectrum i s t h e same as an unheated c o a l .
The
I
,
OBTAINING THE SPECTRA
The pulse length of t h e l a s e r depends upon t h e pumping energy, under t h e condi t ions , used i n t h i s i n v e s t i g a t i o n a t y p i c a l p u l s e length would be about 300 microseconds. Most
How- of the p y r o l y s i s of t h e c o a l sample w i l l t a k e p lace d u r i n g t h e a c t u a l l a s e r b u r s t . e v e r , p y r o l y s i s products a r e s t i l l being evolved s e v e r a l mi l l i seconds a f t e r t h e l a s e r b u r s t due t o the f i n i t e cool ing time of t h e c o a l . i' The TOF mass spectrometer i s capable
I
230.
of making mass a n a l y s i s o f t h e s p e c i e s i n the i o n i z a t i o n chamber a t 50 to 100 microsecond i n t e r v a l s enab l ing s e v e r a l s p e c t r a t o be recorded du r ing t h e p y r o l y s i s .
The i n t e n s i t y o f t he masses recorded dec reases exponen t i a l ly with time. The r a t e of decay i s no t t he same f o r a l l masses. I n gene ra l t h e h ighe r masses have t h e longer time c o n s t a n t . The d i s t r i b u t i o n o f decay r a t e s cannot be accounted f o r by t h e e f f e c t o f mass on pumping speed of t h e mass spectrometer vacuum system. A more l i k e l y exp lana t ion of t he v a r i a t i o n i n decay r a t e s o f t h e d i f f e r e n t s p e c i e s i s t h a t the p y r o l y s i s product d i s t r i - bu t ion changes a s the temperature of the coa l dec reases . For t h i s i n v e s t i g a t i o n a s ing le spectrum was recorded r e p r e s e n t i n g t h e composition one mi l l i s econd a f t e r t h e s t a r t of the l a s e r b u r s t .
THE SPECTRA
Figure 1 shows s p e c t r a ob ta ined under s i m i l a r cond i t ions o f t h e v i t r a i n component o f c o a l s of s eve ra l ranks. The i o n i z a t i o n p o t e n t i a l f o r a l l t h e spec t r a was 25 v o l t s . The spectrum above mass 100 i s magnified f o r e a s e o f p r e s e n t a t i o n f o r both t h e semi- a n t h r a c i t e and the sub-bituminous c o a l s . With j u s t a cu r so ry glance one can see how e a s i l y v i t r i n i t e s can be s e p a r a t e d by t h e " f i n g e r p r i n t " technique. of t he mass spec t r a g ive some i n d i c a t i o n o f t he s t r u c t u r e o f t h e m a t e r i a l . I n t he high mass r eg ion of t h e sub-bituminous v i t r i n i t e spectrum t h e r e a r e many mass peaks of about equal i n t e n s i t y . This tends to i n d i c a t e a complex mixture of hydroaromatics and a l k y l s u b s t i t u t e d aromatics . The HVA bituminous v i t r i n i t e has a much more d i f f e r e n t i a t e d spectrum i n t h i s region i n d i c a t i n g more o r g a n i z a t i o n o f s t r u c t u r e . The semi-anthraci te has a ve ry s imple mass spectrum a s would be expected f o r a low hydrogen c o n t e n t , highly condensed r i n g system.
The gene ra l appearance
Figure 2 shows some comparison s p e c t r a . The high degree o f s i m i l a r i t y i s seen between two HVA bituminous v i t r i n i t e s f r o m d i f f e r e n t sou rces . This can be con t r a s t ed t o t h e d i s s i m i l a r i t y between t h e spectrum of v i t r a i n i n sample number 1 and t h a t of t he non- v i t r i n i t i c m a t e r i a l w i t h i n 100 microns of t h e v i t r a i n band edge. Although t h e l a t t e r two s p e c t r a have many of t h e same masses, d i f f e r e n t i a t i o n can be e a s i l y accomplished by com- pa r ing s e l e c t e d peak r a t i o s .
Major mass peaks can be found i n the HVA s p e c t r a f o r t he a l k y l s u b s t i t u t e d benzenes and naphthalenes but t h e mass d i s t r i b u t i o n s o f t h e s p e c t r a can not be accounted f o r by a mixture o f s t a b l e molecules. The s p e c t r a i n d i c a t e the presence of thermally produced f r e e r a d i c a l s i n the p y r o l y s i s p roduc t s .
The laser-mass spectrometer i s capable o f d i f f e r e n t i a t i n g between microscopic hetero- g e n e i t i e s i n c o a l . I n o r d e r to understand t h e s t r u c t u r a l b a s i s of t h i s d i f f e r e n t i a t i o n t h e behaviour of known m a t e r i a l s under t h e s e p y r o l y s i s c o n d i t i o n s w i l l have t o be s tudied.
ACKNOWLEDGEMENT
This work was supported by a g r a n t from t h e Na t iona l Science Foundation.
LITERATURE CITED
1. Vas to la , F. J . , ' P i r o n e , A . J . , Div. o f Fuel Chern. p r e p r i n t 151st Nat ional Meeting ACS, p. C-53, 1966.
2 . VaStola, F. J . , P i rone , A . J . , Knox, B. E . , Proceedings o f t he Fourteenth Annual Conference' on Mass Spectrometry and A l l i e d Topics , ASTM Committee E-14, p . 78, 1966.
\ '
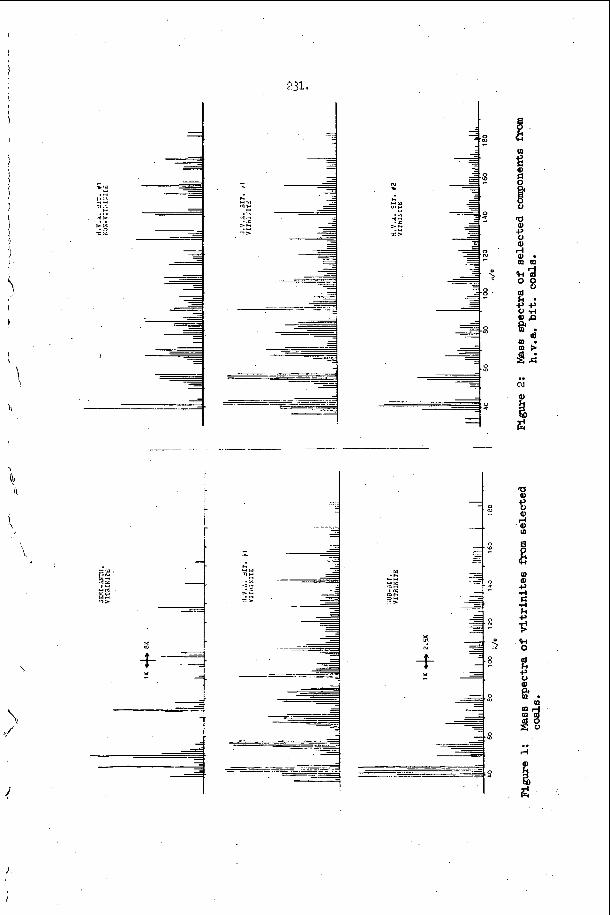
231.
-4 -3 N
F. - w m- - .:: *" ..L >" ... I>
1
\\ \\
t 4
4-
.. rl
232.
APPLICATIONS OF HIGH RESOLUTION MASS SPECTR~ETRY IN COAL RESEARCH
A. G. Sharkey, Jr., J. L. Shu l t z , T. Kess l e r , and R. A . F r i e d e l
U.S. Department o f t h e I n t e r i o r , , Bureau of Mines P i t t sbu rgh Coal Research Center , P i t t sbu rgh , Pa.
INTRODUCTION
The P i t t sbu rgh Coal Research Center of t he Federa l Bureau of Mines is attempt- ing t o determine which s p e c i f i c organic s t r u c t u r e s a r e most i n f l u e n t i a l i n enhanc- ing d e s i r a b l e p rope r t i e s i n commercially important f r a c t i o n s of coa l t a r s such as road ta r and e l ec t rode b inde r p i t c h . types of hydrocarbon s t r u c t u r e s i n c o a l - t a r p i t c h d e t e c t a b l e by h igh - re so lu t ion mass spectrometry. of weathered road ta r and o t h e r a l t e r e d f r a c t i o n s o f coa l t a r .
The c u r r e n t emphasis i s on a survey of t h e
This in format ion w i l l p rovide the b a s i s f o r an i n v e s t i g a t i o n
E . J. Greenhow and G. Sugowdz summarized t h e l i t e r a t u r e on p i t c h chemistry t o 1961 by s t a t i n f t h a t less than 100 organic compounds i n p i t c h have been i s o l a t e d and i d e n t i f i e d . I n these i n v e s t i g a t i o n s q u a n t i t a t i v e d a t a were obtained f o r only a few of the s t r u c t u r e s i d e n t i f i e d .
I n a previous i n v e s t i g a t i o n a t our l abora to ry , mass spec t romet r ic analyses were obta ined fo r t h r e e f r a c t i o n s of p i t c h from the high-temperature carboniza- t i o n o f coal'. w e l l a s carbon number d i s t r i b u t i o n d a t a f o r a l k y l d e r i v a t i v e s . Approximately 70 percent of the 80" t o 85" C so f t en ing poin t p i t c h w a s i nves t iga t ed . An aver- age molecular weight of approximately 250 and a value of 4 . 5 f o r t h e mean s t r u c - t u r a l u n i t (number of a romat ic r i n g s per c l u s t e r ) were der ived from the mass spec- t rome t r i c d a t a . cu l a t ed from these d a t a is i n e x c e l l e n t agreement wi th measurements by nuc lear magnetic resonance.
Semiquant i ta t ive d a t a were r epor t ed f o r 34 s t r u c t u r a l types as
An a r o m a t i c i t y va lue of 0 .94 (aromatic c a r b o d t o t a l carbon) c a l -
Changes i n the c h a r a c t e r i s t i c s of road t a r dur ing weathering and i n t h e ca r - bon iza t ion p rope r t i e s of va r ious c o a l s fo l lowing s to rage poss ib ly involve a l t e r a - t i o n of c e r t a i n organic c o n s t i t u e n t s by r e a c t i o n s wi th oxygen, n i t rogen , and s u l f u r . In our prev ious i n v e s t i g a t i o n s of p i t c h by mass spectrometry only t h e hydrocarbon p o r t i o n could be s tud ied i n d e t a i l a s s t r u c t u r e s con ta in ing t h e heteroatoms n i t r o - gen, oxygen, and s u l f u r have, i n many i n s t a n c e s , t h e same nominal molecular weights a s hydrocarbons. c o a l - t a r p i t c h e s , such as s o l v e n t f r a c t i o n a t i o n , r e s u l t i n a sepa ra t ion according t o molecular s i z e but not chemical type as i s r equ i r ed t o d e t e c t changes i n he tero- atom concent ra t ions .
Procedures commonly used t o s tudy the chemical c o n s t i t u t i o n of
High-reso lu t ion mass spec t romet ry o f f e r s a new approach t o s t u d i e s of spec ies con ta in ing heteroatoms. Sepa ra t ion of t h e components i s not necessary i f t h e ins t rument has s u f f i c i e n t r e s o l u t i o n and s e n s i t i v i t y . atom r e s u l t s i n a s l i g h t change i n the p r e c i s e molecular weight o f t h e spec ie s producing d i s t i n c t i v e peaks f o r t h e va r ious combinations of atoms.
The add i t ion o f a he te ro-
I n t h i s pre l iminary s tudy of t h e h igh - re so lu t ion mass spectrum of c o a l - t a r p i t ch , t h e i n v e s t i g a t i o n cons i s t ed of :
233 *
(1) t rometer ion source t o e f f e c t i v e l y concent ra te spec ies i n p a r t i c u l a r molecular weight ranges.
Obtaining spec t ra by f r a c t i o n a t i n g the p i t c h d i r e c t l y i n t h e mass spec-
(2) Making p r e c i s e mass de te rmina t ions and d e r i v i n g empir ica l formulas f o r components i n the 150 t o 320 mass range. This mass range inc ludes components comprising approximately 70 percent by weight of t h e p i t c h .
(3) Showing t h a t many of t h e high molecular weight s p e c i e s de tec ted f o r t h e f i r s t t i m e could a r i s e from t h e condensat ion of r a d i c a l s .
EXPERDENTAL PROCEDURE
A Consolidated Electrodynamics Corp. Model 2 1 - l l O B double focusing mass spec- trometer was used f o r t h i s s tudy of a Koppers 80" t o 85" C s o f t e n i n g p o i n t p i t c h . A d i r e c t i n s e r t i o n probe w a s used t o introduce t h e p i t c h i n t o the region of i o n i - z a t i o n f o r the f r a c t i o n a t i o n experiment. The mass spectrum and t h e weight of t h e sample vaporized were determined a t t h e fol lowing probe temperatures: l o o o , 175O, 250", 290", and 325O C .
A convent ional umbrella-type g l a s s i n t r o d u c t i o n system was used f o r the pre- c i s e mass study.3
Mass measurements on s tandards were accura te t o 5 .OG3 amu. The peak match- ing technique with perf luorokerosene as a s tandard w a s usea f o r a l l mass ass ign- ments. For most of the h igh- reso lu t ion de te rmina t ions , the instrument w a s oper- a t e d wi th a reso lv ing power of approximately 1 p a r t i n 8 t o 10 thousand and wi th an i n l e t and source temperature o f 300" C. The r e s o l u t i o n was high enough t o per- m i t accura te mass assignments t o approximately mass 300 and represented a com- promise between s e n s i t i v i t y and d e s i r e d reso lv ing power. The r e s o l v i n g power requi red a t mass 300 f o r c o m p l e t e s e p a r a t i o n of severa l o f t h e m a s s doublers of i n t e r e s t i s shown i n t a b l e 1; however, complete s e p a r a t i o n i s n o t genera l ly re- quired f o r prec ise mass assignments. I n many ins tances 5 0 percent of t h e t h e o r e t - i c a l reso lv ing power i s adequate.
RESULTS AND DISCUSSION OF RESULTS
A . Mass Spectra of P i t c h Frac t iona ted i n Mass Spectrometer.
Data obtained f o r the f r a c t i o n a l d i s t i l l a t i o n of t h e 80"-85" C sof ten ing poin t p i t c h i n the mass spectrometer ion source a r e shown i n t a b l e 2 . Frac t ion- a t i o n O E the sample by increas ing the temperature of t h e d i r e c t i n t r o d u c t i o n probe was e f f e c t i v e in concent ra t ing species in a l imi ted molecular weight range. P r e c i s e mass de te rmina t ions , made a s a second p a r t o f t h i s i n v e s t i g a t i o n , sub- s t a n t i a t e d s t r u c t u r a l assignments t o about molecular weight 350.
A t a probe temperature of 100°C 25.5 percent of t h e p i t c h sample was vaporized. Masses 178 and 202 a r e t h e most i n t e n s e peaks i n t h i s spectrum, i n d i c a t i n g anthracene and/or phenanthrene and 4- r ing peri-condensed s t r u c t u r e s such a s pyrene d i s t i l l p r e f e r e n t i a l l y a t these temperature-pressure condi t ions . Spec ies with molecular weights as h igh as 420 were de tec ted . temperature was increased t o 175O C a n a d d i t i o n a l 22-4 percent of t h e p i t c h vapor- ized . The molecular weight of t h e spec ies showing maximum i n t e n s i t y increased t o 252, corresponding t o a 5 - r i n g , peri-condensed aromatic s t r u c t u r e ( s ) ; the molecular weight range of t h e spectrum increased t o mass 526. A t 250" C an addi- t i o n a l 20.1 percent of the p i t c h d i s t i l l e d . The mass w i t h maximum i n t e n s i t y was
When t h e probe

234.
Table 1.- Major mass doub le t s in mass spectrum of c o a l - t a r p i t c h
Resolu t ion required t o separa te Doublet #4 ( a m ) double t a t mass 300
C2H8-S .0906 3,300
CH4-0 .0364 8,200
.0126
.0045
24,000
67,000
Table 2 . - F r a c t i o n a l d i s t i l l a t i o n of Koppers 80"-85" C so f t en ing p o i n t p i t c h i n mass spec t rometer i o n source
Mass spectrum Probe temper- D i s t i l l a t e , weight percent Mass wi th Max hum
a t u r e , O C Cumu 1 a t i v e F rac t iona l Max. i n t e n s i t y mol. w t .
L O O 175 250 2 90 325
25.5 25.5 47.9 22.4 68.0 2 0 . 1 68. Ob 68.0
178-202 420 252 526+a 228 550i-a 326 62Wa 326 5 70i-a
a . Accurate mass numbers could not be assigned t o t r a c e peaks appearing a t
b . No change i n weight of res idue de tec t ab le a t probe temperatures > 250' C. h igher molecular weights .
Table 3 .- Mass assignments f o r s eve ra l perfluorokerosene (PFK) and polynuclear hydrocarbon peaks
Experimental Calculated AM ( m u ) P.P.M.
204.9888 2 18.9856 23 0.9856 242.9856 254.9856 268.9824 280.9824
202-0 776
228.093 7
204 -9896 .0008 4 218.9852 .0004 2 230.9847 .0009 4 242.9855 .OOOl 0.4 254.9854 .0002 0.8 268.9810 .0014 5 280.9811 .0013 5
202.0783 .0007 4 . - - - - - - - - _ - _ - - _ _ - - _ _ - - - - - - - - - - - - - - - - - - - -
(P .F.K. ) do do do do do do
. - - - - - - - - - 4- r ing , per i -
condensed
228.0939 . .0002 1 4- r ing , ca ta - condensed
- I I'
i /
i
I
\ f I
228, corresponding t o a 4 - r ing , cata-condensed aromatic hydrocarbon, and t h e molecular weight range of t he spectrum i n c r e a s e d - t o mass 550. temperatures, 290" and 325" C , t h e s p e c t r a ind ica ted t h a t t he average molecular weight and r i n g s ize of t h e components continued t o inc rease . maximum i n t e n s i t y occurred a t 326 a t temperatures of 290' and 325" C. ind ica ted components w i th molecular weights h igher than 620. change de tec t ab le a t probe temperatures g r e a t e r than 250' C. Thus, t h e spec t r a obtained a t 290' and 325" C r ep resen t only a very s m a l l p o r t i o n of t h e p i t c h . t o t a l amount of p i t c h vaporized was 68 weight percent of t h e charge. This value agrees wel l with the 70 percent vapor iza t ion obtained i n our prev ious s t u d i e s of the same p i t ch .2 100' C contained t r a c e peaks whose masses could not be ass igned; t hese ions ind ica ted molecular weights up t o about 800.
A t h ighe r probe
The mass with The spec t r a
There was no weight
The
The mass spec t r a obta ined a t probe temperatures g r e a t e r than
The increased molecular weight range of t h e m a t e r i a l vaporized a t h igher probe temperatures is i l l u s t r a t e d i n f igu res 1 and 2 . These f i g u r e s , based on low-ionizing vol tage mass s p e c t r a , were p l o t t e d a t t h e Un ive r s i ty of P i t t sbu rgh Computer Center us ing a program obta ined through t h e cour tesy of t h e Graduate School of Publ ic Health a t t he Univers i ty . The t r a c e ions up t o approximately mass 800, which could not be e f f e c t i v e l y reproduced i n these f i g u r e s , correspond i n molecular weight t o s t r u c t u r e s conta in ing a t l e a s t 1 2 aromatic r ings .
B. Prec ise Mass Assignments. '
Table 3 l i s t s p rec i se mass va lues obta ined by t h e peak matching technique f o r s eve ra l peaks i n the perfluorokerosene marker spectrum and f o r t he molecular ions of 4- r ing p e r i - and cata-condensed aromatic hydrocarbons. These d a t a show t h a t mass assignments can be made t o wi th in a few par t s p e r m i l l i o n by t h i s technique.
Empirical formulas were der ived from t h e measured masses i n t h e 150 t o 319 range of t h e 80"-85" C c o a l - t a r p i t c h . Species having from 1 2 t o 2 8 carbon atoms were observed. A t o t a l of 273 peaks were ind ica t ed , many r e s u l t i n g from double ts and t r i p l e t s a t nominal masses. I n a d d i t i o n t o t h e hydrocarbon spec ie s , t h e pre- c i s e masses ind ica ted the presence of a t l e a s t 10 s t r u c t u r a l types conta in ing oxygen, 9 conta in ing s u l f u r , and 10 conta in ing n i t rogen . Measured and ca l cu la t ed masses showed agreement i n genera l from a few t en ths t o 3 m i l l i m a s s u n i t s . Nine- teen of these masses represent s t r u c t u r a l types not prev ious ly r epor t ed f o r coa l t a r - 4
The nominal molecular weight and atomic spec ie s f o r each of t h e components de tec ted is shown i n f igu res 3 and 4. The a b i l i t y of t he instrument t o r e so lve complex mixtures i s i l l u s t r a t e d a t mass 2 1 2 where empir ica l formulas were obtained f o r s t r u c t u r e s conta in ing carbon-hydrogen, carbon-hydrogen-oxygen, and carbon- hydrogen-sulfur, a l l having the same nominal molecular weight.
Table 4 g ives t h e formulas f o r 13 new high molecular weight spec ie s de t ec t ed i n t h e h igh - re so lu t ion mass spectrum of p i t c h . The formulas were der ived from the observed p rec i se masses. The p a r t i c u l a r s t r u c t u r a l t ype ( s ) cannot be i d e n t i - f i ed a s many isomeric v a r i a n t s a r e poss ib l e f o r each formula. Also shown a r e formulas and s t r u c t u r e s of s eve ra l compounds conta in ing (C,H), (C,H,O), (C,H,N), and (C,H,S) prev ious ly i d e n t i f i e d i n coa l t a r . 4 The l a s t two columns of t a b l e 4 i l l u s t r a t e how the h igh molecular weight spec ie s , wi th molecular formulas d e t e r - mined i n t h i s i n v e s t i g a t i o n , can a r i s e from condensation r e a c t i ~ n s . ~ t i o n of C4H4 o r C6H w i l l produce the mo?ecular formulas shown.
The addi- r a d i c a l s t o r a d i c a l s from previous ly i d e n t i f i e d s t r u c t u r e s
h
2 * - s X V e- V N
0, OW
% % 4 4 v u
W r - 0 0 0 0 0 0 . .
: 3 m o O d
c o c o W d N m
. .
- s N m I n m o o r ( moo W d N m
. .
0,s $< N N v u
N m P-
co d N
9
al e
5 C 6 X n. d
s U
0
al 2 m
-s x-s 0
Om % rl V
a3 0 0 9
m m W
N
N
9 m
0 03 m 9 N m N
0 N rl
xN N V
hl
2 9 2 N
I b -at
d C -4J N C - 6 o x
" - &
27 $2 z
* xd V
N rl
x-s N 0
d m 0 9
N In N d
N In m
rl W 4 rl
N In m
W r(
xm N
V
In Q\ 0 d
N 0 m
I l-7 W Q)
a, n a
2: $ 5
u c o w
@ & I
n
236.
n
d - s - s x v - s - V N
2 2- W W d r l u v
r l W
0 0 m - s
9 9
m e e o O N r l r l
P - P - W r l N m
. .
m o - I n O N
P - P - W r l N m
4 . 4 . .
z z m m xd 2" :2 v u
d m m 9 P- rl N
I n np4 Ud 0 0
E 1 9 : w a
x u In
h
-s s V N v
z, 3 0
m N 0 9
m -s 0 rl
rl m N
P- P- 0 d
d
N m
z m rl
a, N 0
In m P-
9 4
d m
I n W w
Q Q J U d
0 0 N N 5; I 6 x u
U
n 4 2* V v N
z 4 rl
V
m m 0 9
co * 0 rl
m P- cv
\D m 0 d
m PI N
z m d
2, N
V
In R 9 o\ b rl
2 z: 4
4
&I
V x:
m
5 V
m 8 9
in m 0 rl
4 VI N
W In 0 rl
-s In N
2 xO N 0
m m PI
9 4 rl
2 9
$ 6
&I
C
2: V
d rl
50 rl V
P-
0 d
N In N 4
d m
In 0 N rl
2i m
W rl
x2 V
m m m
m N N
9
PI
5
6 h
e 5 V
0 d
xN N
V
rl N 0 9
In m 0 rl
W N m
W d rl rl
W N m
5 xW N V
m m m 9 x N
al e rl h
al a n d
6 2 U 0
m
d -s 0
0
-s N V
2"
P- N 0 0
In
0 rl
0 In m
m
N N rl rl
0 In m
2 % N 0
m m m 9 0 0 m
E C Id
0
2 37
CONCLUSIONS
Approximately t h r e e times t h e number of components repor ted i n previous inves t iga t ions of c o a l - t a r p i t c h by o t h e r techniques were de t ec t ed i n t h i s study. While the i d e n t i f i c a t i o n of p a r t i c u l a r s t r u c t u r a l types i s not p o s s i b l e , t he pre- cise masses i n d i c a t e the atomic spec ie s p re sen t . This s tudy shows t h a t high- r e s o h t i o n mass spectrometry provides a means of d e t e c t i n g changes i n e i t h e r t he concen t r a t ion o r composition of organic compounds i n f r a c t i o n s o f coa l tar f o l - lowing exposure t o var ious atmospheres. Such information should lead t o a b e t t e r understanding of the p r o p e r t i e s of road tars and o t h e r commercially important f r a c t i o n s of coa l t a r .
References
1. Greenhow, E. J., and Sugowdz, G. Coal Research i n C.S.I.R.O., A u s t r a l i a , NO. 15, NOV. 1961, pp. 10-19.
2. Shu l t z , J. L., F r i e d e l , R. A . , and Sharkey, A. G. Jr. Fuel, 44, No. 1, Jan. 1965, 'pp. 55-61.
3. Lumpkin, H. E . , and Taylor , G. R. A S o l i d s I n l e t System f o r a Mass Spec- trometer. Anal. Chem., 2, 1961, pp. 476-477.
4. Anderson, H. C. , and Wu, W. R. K. Bureau of Mines Bu l l . No. 606, 1963, 834 pp.
5. Sharkey, A. G. , Jr., Shu l t z , J. L., and F r i e d e l , R. A. Carbon, 4 , 1966, pp. 365-374.
,
i
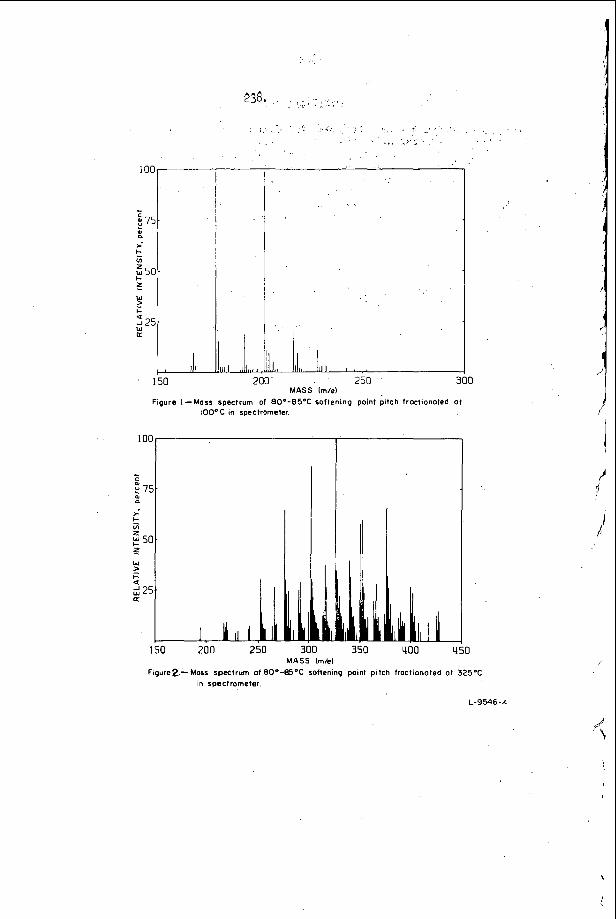
. . . . .
' O O r - I
' 150 2( L 250
MASS h / e ) Figure I --Mass spectrum of 80°-850C softening point pitch fractionoted a1
100°C in spectrometer
lO0l------
I
150 200 250 300 350 400 tl M A S S h / e l
Figure2-Mass spectrum of 8O0-85'C softening point pitch fractionoted 01 325°C in spectrometer
L-9546-4
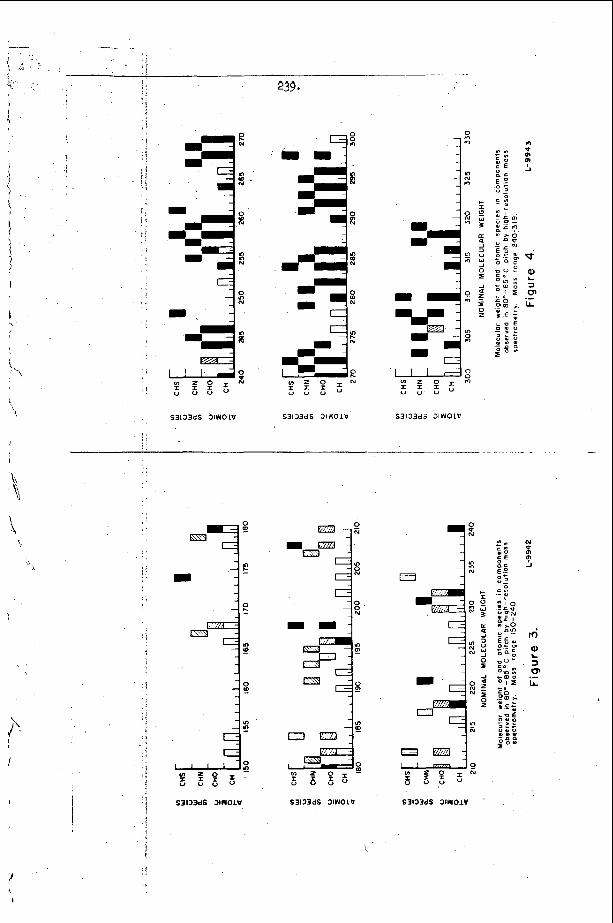
I '
. .
1
-' ,
239.
4
S3133dS 31WOlW S3133dS SIR011 S3133dS bIWOIW
S3133dS 3lWOlV
\
S3133dS 31WOlV '
240.
FIELD IONIZATION MASS SPECmOMETRY - STRUCTUKE CORRFLATIONS FOR HYDROCARBONS
Graham G. Wanless
Esso Research and Engineering Co. Analytical Research Division P. 0. Box 121 Linden, New Jersey
ABSTRACT
Field ion iza t ion is a preferred way of looking a t molecules and mixtures thereof. Ionization is accomplished by e lec t ron abstraction i n n e l e c t r o s t a t i c f i e l d of very s t eep gradient, of
impact, these spec t ra possess much grea te r parent ion abunaances and r e l a t ive ly fewer fragment ions. This r e s u l t f a c i l i t a t e s analysis of unknown mixtures grea t ly .
Because the spec t ra are simpler, greater use can be made of the metastable ions f o r s t r u c t u r a l in te rpre ta t ion . An unexpected r e - sult i s the f a c t t h a t there i s a c lose cor re la t ion between kind and abundance of f i e l d ion iza t ion primary metastable ions and compound s t ruc ture . A more complete study of branched hydrocarbons (showing these s t ruc ture cor re la t ions) w i l l be presented than t h a t published recently (Anal. Chem. 3, No. 1, 2-13, Jan. 1967).
problems are (a) to increase s igna l strength, (b) to develop im- proved f i e l d ion anode devices, and (c) t o improve repea tab i l i ty of successive spectra. How the s igna l averaging computer can convert the present-quali ty spectra to precision f ie ld- ion mass spectra w i l l be demonstrated w i t h examples.
the order of 10 8 volts/cm. I n cont ras t t o spectra from electron
The present s t a t e of development will be described. Pr inc ipa l
I Norman c. Li
DuqueSne WVersity, Pittsburgh, Pennsylvania
Hydzbqen bondinq is a ve ry s l q n i f i c a n t type of I /
I n t e r a c t i o n , qnd Is of widespread occurrence. Pimentel and McCleklanl, a hydrogen bond e x i s t s between a f u n c t i o n a l group A-H and an atom or a qroup of atoms D i n t h e same o r a d i f f e r e n t molecule when the re is evidence of bond formRtion, and when the bond l i n k i n g A-H and D involves t h e hydroqen atom a l r eady bonded t o A . In f r a red method, based mainly on i n t e n s i t y measurements of t he band ass igned t o t h e monomeric s p e c i e s , has been used ex tens ive ly I n t h e de te rmina t ion 'of equ l l ib r ium cons tan t s of hydrogen-bonded 8yEtemS. It o f f e r s the advantzqes t h a t d i f f e r e n t hydrogen- bonded complexes can be d i s t i n g u i s h e d , and t h a t r e l a t i v e l y low concen t r a t ions can be useci. For very weak coaplexes however, t he I n f r a r e d method has no t proved t o be a s u f f i c i e n t l y s e n s i t i v e probe of the q u a n t i t a t i v e a spec t s of hydrogen bondinq. High r e s o l u t i o n n u c l e a r magnetic resonance (nmr) s c o r e s e a s i l y i n providing a s e n s i t i v e measure of i n t e r a c t i o n , because i t permits t h e measurements of f r equenc ie s which can be done very a c c u r a t e l y , r a t h e r t'nan i n t e n s i t i e s which a r e more s u b j e c t t o unce r t a in ty . This paper d e s c r i b e s s e v e r a l ways i n which nmr is used t o o b t a i n e q u i l i b r l u n constcints and thermodppsrnic func t ions of v a r i o u s hydrogen-bonded systems. I n a d d i t i o n , an a p p l i c a t i o n of hydrogen-bonding d a t a t o t h e d e t e r n i n a t i o n of the p re fe r r ed form of a beta-diketone is given.
I t I s well known t h a t t h e formation of hydro%en bonds usua l ly s h i f t s t he nmr s i g n a l s t o lorser f i e l d , except In c e r t a i n c a s e s involv inq arornstic .nolecules o r e l e c t r o n donors i n which unusual magnetic a n i s o t r o p i c e f f e c t s a r e p re sen t 2,3, V l r t u a l l y a l l hydroqen bonds a r e broken and re-formed a t a s u f f i c i e n t l y fas t r a t e , s o t h a t s e p a r a t e resonances f o r bo th hydroqen-bonded and nonhydrogen-bonded s t a t e s i n the same mediua a r e not observed. Consequently, the observed frequency v w i l l correspond t o t he qvPrap;e of the c h a r a c t e r i s t i c f r equenc ie s of t he cornplexed and uncomplexed protons (v , v f ) , weiyhted according t o the equ i l ib r ium f r a c t i o n 18 each form ( X c , Xf):
For an equ l l ib r ium between a monomeric hygroeen donor, A-8, and an e lec t ron-donor , D, t o form a 1:l complex C , the following equa t ion may be der ived4 when the concen t r a t ion of t he electron-donor is much g r e a t e r than t h a t of C:
According t o
v = XfVf + xcvc (1 1
1
1 = 1 1 + 1 Y - Vf a VC'Vf
I n eq. 2, v Is t h e measured nmr frequency of t he hydroqen- bonaing proton a t a concen t r a t ion 2 of D, v of monomaric A-H proton s i q n a l a t 9 = 0 , an8 K is the a s s o c i a t l on cons t a n t
is t he frequency
( 3 ) " = &
242.
It is i n t e r e s t l n q t o n o t e t h a t , t h i s equat ion i s of t h e ssm form as one used f o r t r e a t x n t of u l t r a v i o l e t s p e c t r a l d a t a on 1:l comolexes.
1 - = 1 & + 1 E- Ef $(E,-Zf) d Ec-Ef
where t h e E ' s ere molar e x t l n c t l o n c o e f f i c i e n t s 5 . For t h e t r e a h e n t of i n f r a r e d s p e c t r a l d a t a f o r 1 :1 complexes, the fol lowinq equat lon can be der ived
1 = 1 1 + & Ef -E K Ef 3 Ef
i f I n t e n s i t y measurements ere m d e on t h e b m d ass iqned t o t h e monomeric and uncomplexe3 speClt?S and i f complexed spec les do n o t absorb radi2. t ion a t t h e saxe frequency, s o t h a t ZC = 0.
Benzenethiol comolexes. Xathur ,e t al.4, r e p o r t n x r s t u d i e s of hydrosen bondin< of benzenet%iol with N , ~ ~ l l m e ~ ~ J j f o r n t . ! ~ i d e (DiiF) , t r l b u t y l phosphate (TPP) , pyr id ine , N-Iethylpyrazole, and benzene t o serve 8 s models of bon5iny of -S!I t o t h e carbonyl oxygen, phosphoryl oxy.l;en, or?anlc n i t ro7en bases , and an Rroinatic e l e c t r o n s y s t e n , r e s p s c t i v e l y . Table I l i s t s t h e resu l t s obtained.
Table I Thernodynamlc d a t a f o r benzenethiol bonding t o e lectron-donors
- A H !?$:ole k c a l ./mol.e
Glectron donor Vc-vf (PPm)
P y r i d i n e 1 .2 &me thy1 pyrazole 1.5 TBP 1.8 DXF 2.2 Benzene -2.5
0.22 -14 -43 .24 -039
2.4 2.1 2.0 1.8 0 . 5
The e x t e n t of hydroZen-bondinq i n these systems, as measured by t h e e q u l l i b r l u ~ cons tan ts and enth9lpy changes, I s much s m l l e r t h m t h a t f o r t h e saxe e l e c t r o n donors i n t e r a c t i n g u i t h phenol. For exanple , t h e va lues o f K f o r uheno y r i d i n e and phenol-3iP a r e 77 and 64 l./mole, r e s p e c t i v e l y &if. These s u f f i c e t o show t h e weakness of -SH hydrogen bonding r e l a t i v e t o -OH. It is o n l y because of t h e f a i r l y l a r g e a s s o c i a t i o n s h i f t , , vc-v , and t h e p r e c i s i o n of n n r frequency measurements, t h a t t n e t d r m o d y n m i c f u n c t i o n s of -SH bonding systems can be obtained. I n benzene t h e r i n q c u r r e n t e f f e c t dominates t h e s i g n and mamltude of (vc-vf). As sho:in in FRble I , benzene behaves RS T-electro+onor and hence capsble of forming weak hydrogen bond w i t h benzeneth io l .
2-ProDan01 comolexes. '&en 2-propmol is used A S t h e hydroyen donor, eq. 2 has t o be modified s i n c e s e l f - a s s o c i a t i o n of t h e a l c o h o l occurs , and t h i s may a f f e c t t h e e q u l l i r ium involvlnr;
t h e fo l lowin? n o d l f l e d equat ion i t s complex formation w i t h D. Tak>has:?i and Li ll have der ived
v-v'- . m d x vc-v' 1 = 1 1 + - 1
243.
36 21: 111
0
l!. 0 29 2 1
3.61 5.02
8.94 6.01
5.00 5.17 5.23 5.35
2.23 2.56 2.88
b.20 4.30 4 . 3 3
~ - ; u ~ . ~ . c ? r ar?d .-lei t a r 9 s u . ; y ? s t t k a t t he n a r frequency of the cozi!D.e;:.~:! s p e c i e s C I A O S T I ~ S q u i t e st-onr;ly on t h e deqrec? of ex i i t n t i o t i o f t ':I e 1: y I ro ye 11 -b onrl. - s t; r e t ch i n :< v i br a t 1 o ni 1 mo 2. e . They > - ? A s < 3 i i t h s t because t h i s J. s an u:1usw?ll.y lox-frequency n o t i o n , seve ra l exc i t ed s t R t c s a r e s i ~ ; n l f I c n n t l . v populated even e t te,iiperat;u~:s F(S lor.: 2 s ZOO%, and t h e i r c ~ l c u l . ~ t i o n s s):o:.! R te?.pernturs deg:?ii?once of vo. The d a t a of T n b l e 11 on the values o f v a t d i f f e r e n t t e n p e r a t u r z s d.o inAlc?.te that vc incr;.,-.sos di5:1t1.!.7 with dec rease i n tenpernture . TA s is not
t h z t t h e hy.Iro?en bond. 2:hlr'ts do n o t irary wl th t enpe rn tu re . i n ~ ~ r " c r . : e n t x i t h t h 2 assunpt io i? o f sever21 a u t h o r s t 310-12
Amine co:iin!.e:rss. , Takahashi and L i I 3 r e ? o r t iinr s t u d i e s ' o f hy3roKer-i b s n i i n 7 bet i leen tho sn ino p r o t o n s of t-butyla!nln" 2nd m l l , l r i ~ , an9 sevzra.3. e l e c t r o n donors, c h l o r o f o r a med.lun.
becsuse of i t s r c a c t i c n ?lit:? m i n e . Jhen
equat ion i s
as the s o l v e n t , eq. 2 ~ R S t o be modifled sinc!: t h e a c t s as a hydroZen donor t o t h e e l e c t r o n
1 . l+KC(S) + 1 ( 7 1 - 1 - v-Vf x ( v , - V f r d VC'Vf
where K and Ks are e q u l l l b r l u z c o n s t n n t s o f t h e r e z c t l o n s
Amine + 3 = nslne.. .D K C13C.Y + D = C13CS ... D Ks
end ( S ) , 2 nra t h e t o t a l concen t rg t lons of CHC13 and D , r e spec t lvc ly . The ex?.::-rlr:isnts vter.5 c s r r l e d o u t 30 t h s t ( S ) is iS:JCh g reRte r than and m c h q r e a t e r t h s n t k c tot.91 concen t rn t lon o f t he niolne. P r o a eq. 7, R Plo t of l/(v-vf) vs. (l+K,(S))/d t h e r e f o r 2 should yield. EL s t r z l z h t l i n e , from which 2: c8n be de tern inef i . The ve lue of Ks i s deternlned In separate e x p e r l z e n t s b y mensurlng

244.
t h e iimr frequency o f t h e chloroform proton simal i n CCl4 s o l u t i o n s contalnine; O.O5W cIICl3 arkl v a r l o u s amounts of t he e l e c t r o n donor.
t h e arrilfies may be r ep resen ted b y t h e equat ion The hydrogen-bonding of N-methylacetmide ( N U ) t o
The v a l u e s of yc-vf f o r N#A bondinq t o t h e amines a r e lndependent of temperature between -19 an8 3 6 O . This aeans t h a t i n t h i s system,the hydrogen-bond s h i f t Is temperature independent and t 'nat t h e s e l f - a s s o c l a t l o n of NI4A does n o t i n t e r f e r e wi th i t s bondinq. w i t h t he amines. The r e l a t i v e hydrogen-donor s t r e n g t h of -NH2, -OH, and -SH may be obta lned by not ing t h a t the a s s o c i a t i o n cons tan t f o r a n i l i n e bonding t o NIL3 ( K = 58 a t 2 6 O ) 1s sma l l e r t han f o r phenol bonding t o Xi4A ( K = 105 a t 30 ) and l a r g e r than f o r benzeneth lo l bondin5 t o NKA (K = 0.13 a t 37').
Water complexes. Takahashi and L1l4 and Tlng ,e t a l . 15 , r e p o r t nnr s tud ies of water as hydrogen donor t o t e t r ahydro fu ran , a c e tone, N ,N-dime thy lace tamide , N,N-dimethylformmide and dimethyl su l foxide . I n t he i r experiments w a t e r is t h e hydrogen donor a t low concen t r a t ions (ho le f r a c t i o n i n t h e range of 0.003 t o 0.02), i n t h e presence of an e l e o t r o n donor (mole f r a c t i o n i n t h e r anae X = 0.5 t o 0.99), and cyclohexane as an I n e r t so lvent . S ince w e e r i s no t so lub le i n t h e i n e r t s o l v e n t , t h e presence of a n apprec i ab le excess concen t r a t ion of D is necessary. I n tine reg ion of low water conten t , lLnear p l o t s of t h e nmr frequency of the water protons vs. t h e mole f r a c t i o n
of t h e water proton frequency 3, o z e r o water concen t r a t lon i s of water,at a q iven va lue of
e a s i l y made, and i n t h e l i m i t of X , = 0,only two s p e c i e s a r e cocs idered: t he 1:l complex, OB2...D, and t h e 1:2 complex,
E%%nq t o the re l .a t lon
a r e obtained. The e x t r a p o l a t i o n
The two s p e c i e s a r e considered t o be i n equ i l ib r ium
i.D
OD + D = < ( 9 )
The o h a r a c t e r l s t t c nx r f r equenc le s of t h e 1 x 1 and Lr2 complexes are des igna ted v11 and v12, r e spec t ive ly , and t h e fo l lowlng equa t ion is der ived
= 1 . & + '1 1
11 -11) xd V12'Vll Vo-V
. - In eq. 10 , vo Is t h e ex t r apo la t ed frequency of the water pro tons a t ze ro water concen t r a t ion and I( is equ i l lb r lum cons tan t of eq. 9 . lndependent o f t e a p e r a t u r e and draw p l o t s of l / ( v o - q 1 ) VS.
l /Xd. The c o r r e c t v11 is taken t o be t h e value which makes' the
The au tho r s assume t h a t (v12-v11) is approximately
245. , . , ,
'e . ' .>. . , . .I
. .
P l o t s a t d i f f e r e n t temperntures come- t o a common i n t e r c e p t . the P l o t s a n q e q . 10 , t h e va lues of X and v are obtwlned.
! 1 2 Equilibrium c o n s t a n t s and en tha lpy chan:es for wa te r
bonding t o N;N-diaethylformamlde (DW?) are l a r g e r t han the cor respondinq~ values f o r w~ter-N,J-disethylacetamlde ( D N A ) . This o rde r isf s u r p r i s i n g , since DXF is a nea.ker e lectron-donor than DX.4 to!vsrds phanol. I t may be t h a t t h e C 3 proton i n DMF func t ions R S ' P weak hydroqen donor t o t h e oxy3en of writer, t h e . Protons of which a r e bonded t o o t h e r DZF molecules. T'nis would r e s u l t i n a q t e a t e r hydro Ten-donor s t r e n q t h of we ter toward DXP the.n ton3rd DXA.
determlne proton chemlcsl s h l f t s f o r d i l u t e s o l u t l o n s o f water I n n l x t u r e s o f ' d i o x m e and carbon t e t r z h lo r ide . When the nole f r a c t l b n of water I s below 1.5 x 10⁻⁹, se l f -? . ssoc la t lon of w R t e r is ne.Tl l+ible , and. t h e e-uthors t r e a t t h e d?.ta as?u!ning t h a t t h e r e 2re t h r e e s o l u t e s p e c i e s , f r i e water, a 1:1 w s t e r - dioxnne complex, 2nd a 1.:2 conplex. Tne c h w x c t e r i s t i c f requencies o f t h e complexes a p p e a r t o he, Independent o f t e z g e r a t u r e i n t h e ranqe ll-7OoI4in accordwice w i t ' - t h e a.ssurnpt1on macie by Takahashi and ;L i
of hydro yen bonding betvieen 6-d I k e t o x s - thenoyl t r l f luoroace tone , hexaf luoroace ty lace tone , and t r i f l u o r o a c e t y l a c e t o c e - and s e v e r a l n e u t r a l orqanophosp3orus corngoun3s- t r i b u t y l phosphate, d i e t h y l e t h s l phosphoh?te, nnd t r l - n - o c t y l p::osp:iFne oxide. O f t h e three d ike tones s tud ied , hexaf luorosce ty lzce tone y ivss the most s table colnplex with a 7lven phosphorus c~mpoux l an4 t h i s is as expected, s i n c e at has two e l ec t ron -x i t3d ra r i ln j *- ur2 t roups i n the same molecule. I t s ?.rater hydrosen-donor s t en-;th i s i n l l n e wi th i t s Orea ter acid s t r e n 3 t h of hexa f luo rosce ty l ace tone , t h e n o y l t r i f l u o r o ~ c o t o n e znd t r l f l u o r o a c e t y l a c e t o n e = 4.35, 5.70 and 6.110, r s s p e c t i v e l y ) . 31 th a 'q lvan d ike tone , t he e q u l l l b r i u a c o n s t s n t of hydro-en bond form.rtion rilth t h e phosphorus coxpounds inc reases i n t h e o r d e r t r i b u t y l p:?osw;late, d i e t h y l e t h y l phoaphonite, 3n3 t r l - n - p ~ o s p ~ ~ l n e ' . o x l d e and. I s i n l l n e wl th t h e r e l a t i v e b p s l c i t y of t h e phosphorus coa?ounds.
o f hydroTen bondirs d s t a t o t k e c'.etrr:Gw :.io 1 of tine p re fe r r ed eno l form of t h e n o y l t r l f l u o r o m e t o i e (XTTA). In CC1 as s o l v e n t , two poss lb l e enol s t r u c t u r e s ( 1 , z n d 11) c ~ r i be p o s t u h t e d
From
16 I t ' $ s of i n t e r e s t t o no te t h a t Muller and. Slmon
and Tlng, e t al . l -5
8 -Dlketone comnlexes. Puknnlc, e t ai.'?, r e p o r t nmr s t u d l e s
Puknnlc, e t d7, clve::' a n ox?.rnple o f t h e a p p l i c a t l o n
II I1 ' 11 ( m c , ,c - C=C?!-J - CPj 5
/
I I1 '
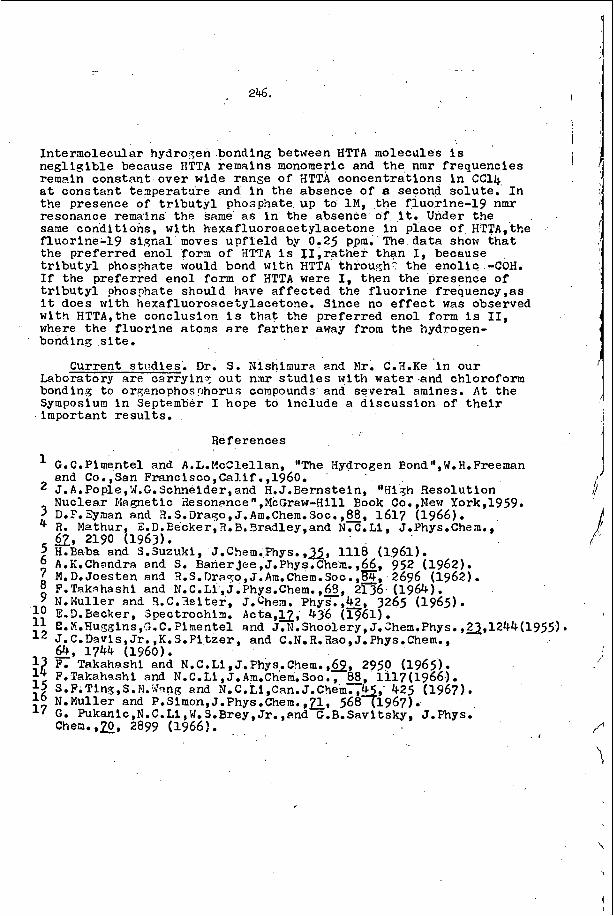
246.
In te rmolecular hydro7en bonding between HTTA molecules Is n e g l i g i b l e because HTTA reioains monomeric and t h e nmr f requencles rem3ln cons tan t ove r wide range of XTTA concen t r a t ions i n C C l 4 a t c o n s t a n t te-nperature and i n the absence of 8 second so lu t e . I n the presence of t r i b u t y l phosphate u p to 1M, t h e f luor ine-19 nmr resonance remalns the sane a s i n t h e absence of it. Under t h e same cond i t ions , w i t h hexaf luoroace ty lace tone i n place of HTTA, t he f luor ine-19 s igna l moves u p f l e l d by 0.25 ppm. The d a t a show t h a t the p re fe r r ed enol f o r a of XTTA is I I , r a t h e r than I, because t r i b u t y l phosphate would bond with HTTA through‘ the e n o l i c -COH. I f t he prefer red eno l form of ilTTA were I, then the presence of t r i b u t y l phosp9ate should have a f f e c t e d t h e f l u o r i n e frequency,as I t does with hexafluoroacetylacetone. Slnce no e f f e c t was observed w i t h HTTA,the conclusion Is t h a t t h e p re fe r r ed enol form Is 11, where t h e f l u o r i n e atom a r e f a r t h e r away from t h e hydrogen- bondinq s i t e .
Current s t t ‘d ies . Dr. S. Nishlmura 2nd Nr. C.:I.Ke i n our Laboratory a r e cs r ry in? o u t n m s t u d i e s wi th wa te r and chloroform bondinq t o orqanophosohorus compounds and s e v e r a l amines. A t t h e Symposium In September I hope t o inc lude a d i s c u s s i o n of t h e l r important r e s u l t s . I
Re f e rence s I i 1 G. C.Pimente1 and A.L.McClellan, “The Xydrogen Eond”, W. H. Freeman
and Co.,San Francisco,Cal.if.,1960. J.A.Pople,W.G.Sck!eider,and H. J .Bernsteln, “Hi3h Resolu t ion Nuclear I?IAgngnetlc Zesonance “,McGraw-Rill Book Co. ,New York,1959.
A. Mzthur, 2.D. Eecker, 3. B. Sradley,and N. C. L l , J.Phys .Chein., 3 D.F.Synan and R.S.Drago,J.Am.Chern.Soc. ,88, 1617 (1966) .
Q, 2190 (1963).
/
1 /’
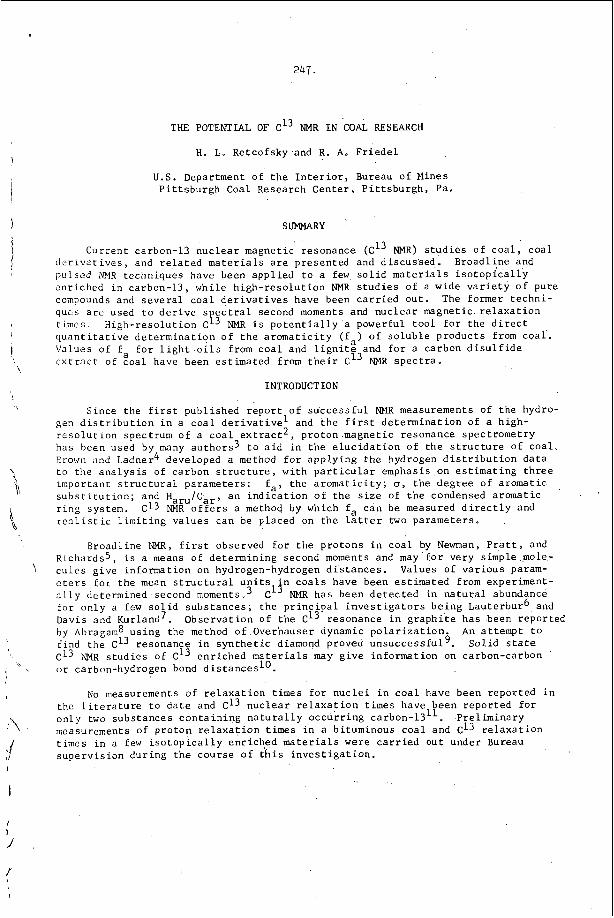
247
\
THE POTENTIAL OF C I 3 NMR I N COAL RESEARCH
H. L. Retcofsky and R. A . F r i e d e l
I
1 \
U.S. Department of t h e I n t e r i o r , Bureau of Mines P i t t s b u r g h Coal Research C e n t e r , P i t t s b u r g h , Pa.
SUMMARY
Current carbon-13 n u c l e a r magnetic' resonance (CI3 NMR) s t u d i e s of c o a l , c o a l d e r i v a t i v e s , and r e l a t e d m a t e r i a l s a r e p r e s e n t e d and discus 'sed. p u l s e d NMR techniques have been a p p l i e d t o a few s o l i d m a t e r i a l s i s o t o p i c a l l y enr iched i n carbon-13, w h i l e h i g h - r e s o l u t i o n N h s t u d i e s of a wide v a r i e t y o f pure compounds and s e v e r a l c o a l d e r i v a t i v e s have been c a r r i e d o u t . The former t e c h n i - ques a r e used t o d e r i v e s ec t r a l second moments and n u c l e a r magnet ic r e l a x a t i o n t i m e s . q u a n t i t a t i v e d e t e r m i n a t i o n o f t h e a r o m a t i c i t y ( f a ) o f s o l u b l e p r o d u c t s from c o a l . Values of f a f o r 1 i g h t . o i l s from c o a l and l i g n i t e and f o r a carbon d i s u l f i d e e x t r a c t of c o a l have been e s t i m a t e d from t h e i r C13 NMR s p e c t r a .
Broadl ine and
H i g h - r e s o l u t i o n Cp3 NMR i s p o t e n t i a l l y a powerful t o o l f o r t h e d i r e c t
INTRODUCTION
Since t h e f i r s t publ i shed r e p o r t o f s u c c e s s f u l NMR measurements of t h e hydro- gen d i s t r i b u t i o n i n a c o a l d e r i v a t i v e ' and t h e f i r s t d e t e r m i n a t i o n of a h igh- r e s o l u t i o n spectrum o f a c o a l e x t r a c t z , p r o t o n .magnetic resonance spec t romet ry has been used by many a u t h o r s 3 t o a i d i n t h e e l u c i d a t i o n of t h e s t r u c t u r e o f c o a l . Erown and Ladner4 developed a method f o r a p p l y i n g t h e hydrogen d i s t r i b u t i o n d a t a t o t h e a n a l y s i s o f carbon s t r u c t u r e , w i t h p a r t i c u l a r emphasis on e s t i m a t i n g t h r e e impor tan t s t r u c t u r a l parameters : f a , t h e a r o m a t i c i t y ; u , t h e d e g r e e of a romat ic s u b s t i t u t i o n ; and H a r u / C a r , a n i n d i c a t i o n o f t h e s i z e of t h e condensed aromat ic ' . '
r i n g system. r e a l i s t i c l i m i t i n g v a l u e s can be p laced on t h e l a t te r two parameters .
C13 NMR o f f e r s a method by which fa c a n be measured d i r e c t l y and
Broadl ine NMR, f i r s t observed f o r t h e p r o t o n s i n c o a l by Newman, P r a t t , and Richards5 , i s a means of de te rmining second moments and m a y ' f o r very s imple mole- c u l e s g i v e informat ion on hydrogen-hydrogen d i s t a n c e s . Values of v a r i o u s param- e t e r s f o r t h e mean s t r u c t u r a l u n i t s l $ n c o a l s have been e s t i m a t e d from experiment- a l l y determined second momentse3 C NMR h a s been d e t e c t e d i n n a t u r a l abundance f o r o n l y a few s o l i d s u b s t a n c e s ; the p r i n c i p a l i n v e s t i g a t o r s b e i n g Lauterbur6 , and Davis and Kurland7. by Abragam8 u s i n g the method of .Overhauser dynamic p o l a r i z a t i o n . An a t t e m p t t o
S o l i d s ta te CI3 NMR s t u d i e s of CL3 e n r i c h e d m a t e r i a l s may g i v e i n f o r m a t i o n on carbon-carbon
)
O b s e r v a t i o n o f t h e C I 3 resonance i n g r a p h i t e h a s been repor ted
1 f ind t h e C L 3 resonance i n s y n t h e t i c diamond proved u n s u c c e s s f u l 9 .
, h ~ , o r carbon-hydrogen bond dis tances 'O.
No measurements of r e l a x a t i o n t imes f o r n u c l e i i n c o a l have been r e p o r t e d i n t h e l i t e r a t u r e t o d a t e and C I 3 n u c l e a r r e l a x a t i o n t i m e s have been r e p o r t e d f o r o n l y two s u b s t a n c e s c o n t a i n i n g n a t u r a l l y o c c u r r i n g carbon-1311. P r e l i m i n a r y measurements of p r o t o n r e l a x a t i o n t imes i n a bi tuminous c o a l and c13 r e l a x a t i o n t imes i n a few i s o t o p i c a l l y e n r i c h e d m a t e r i a l s were c a r r i e d o u t under Bureau s u p e r v i s i o n d u r i n g t h e c o u r s e of t h i s i n v e s t i g a t i o n .
"\. '
I
I
t
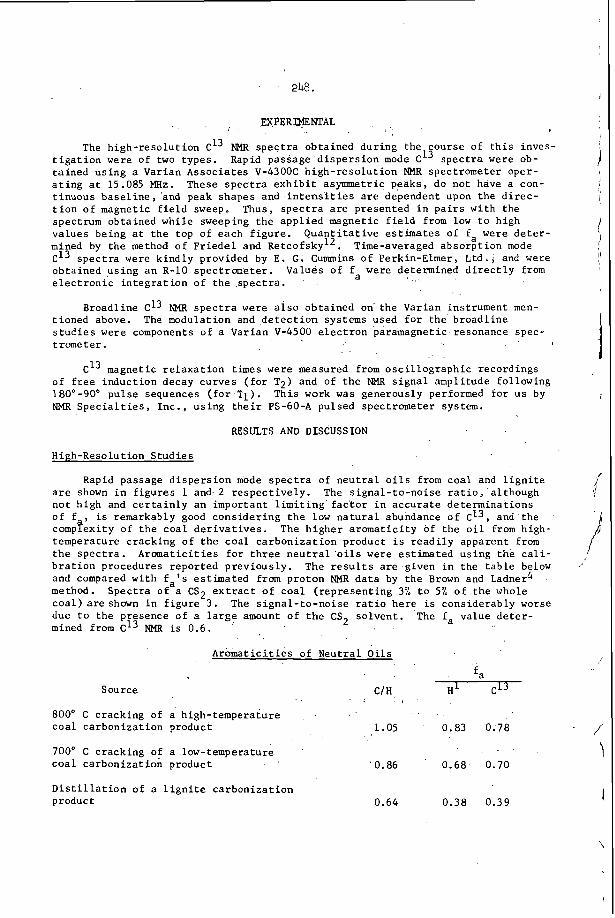
248.
EXPERWITl'AL
The h i g h - r e s o l u t i o n C I 3 NMR s p e c t r a obta ined d u r i n g t h e course o f t h i s inves- t i g a t i o n were of two t y p e s . Rapid passage d i s p e r s i o n mode C13 s p e c t r a were ob- t a i n e d u s i n g a Var ian A s s o c i a t e s V-43OOC h i g h - r e s o l u t i o n NMR spec t rometer o p e r - a t i n g a t 15.085 MHz. t i n u o u s b a s e l i n e , ' a n d peak shapes and i n t e n s i t i e s a r e dependent upon t h e d i r e c - t i o n o f magnet ic f i e l d sweep. Thus, s p e c t r a are p r e s e n t e d i n p a i r s w i t h t h e spectrum obta ined w h i l e sweeping t h e a p p l i e d magnet ic f i e l d from low t o high va lues being a t t h e top of each f i g u r e . Q u a n t i t a t i v e e s t i m a t e s of f were d e t e r - mined by t h e method o f F r i e d e l and Retcofsky12. C L 3 s p e c t r a were k i n d l y provided by E. G . Cummins of Perkin-Elmer, Ltd. , and were obta ined u s i n g a n R-10 s p e c t r o m e t e r . Values o f f were determined d i r e c t l y from e l e c t r o n i c i n t e g r a t i o n o f t h e s p e c t r a .
These s p e c t r a e x h i b i t asymmetric peaks , do not have a con-
Time-averaged absor:tion mode
Broadl ine C I 3 NMR s p e c t r a were a l s o o b t a i n e d on t h e Var i an ins t rument men- t i o n e d above. The modulat ion and d e t e c t i o n systems used f o r t h e b r o a d l i n e s t u d i e s were components of a Var i an V-4500 e l e c t r o n paramagnet ic resonance spec- t rometer .
C I 3 magnetic r e l a x a t i o n t i m e s were measured from o s c i l l o g r a p h i c r e c o r d i n g s of f r e e i n d u c t i o n decay c u r v e s ( f o r T2) and of t h e NMR s i g n a l ampl i tude fo l lowing 18Oo-9O0 p u l s e sequences ( f o r Ti). T h i s work was gene rous ly performed f o r u s by NMFt S p e c i a l t i e s , I n c . , u s i n g t h e i r PS-60-A pulsed spec t rometer system.
RESULTS AND DISCUSSION
High-Resolut ion S t u d i e s
Rapid passage d i s p e r s i o n mode s p e c t r a of n e u t r a l o i l s from c o a l and l i g n i t e a r e shown i n f i g u r e s 1 and 2 r e s p e c t i v e l y . The s i g n a l - t o - n o i s e r a t i o , a l though n o t h igh and c e r t a i n l y an impor tan t l i m i t i n g f a c t o r i n a c c u r a t e d e t e r m i n a t i o n s o f f i s remarkably good c o n s i d e r i n g t h e low n a t u r a l abundance o f C13, and t h e compf ix i ty of t h e c o a l d e r i v a t i v e s . The h i g h e r a r o m a t i c i t y of t h e o i l from high- tempera ture c r a c k i n g of t h e c o a l c a r b o n i z a t i o n product i s r e a d i l y apparent from t h e s p e c t r a . A r o m a t i c i t i e s f o r t h r e e n e u t r a l o i l s were e s t i m a t e d u s i n g t h e c a l i - b r a t i o n procedures r e p o r t e d p r e v i o u s l y . The r e s u l t s a r e g iven i n t h e t a b l e below and compared w i t h f a ' s e s t i m a t e d from p r o t o n NMR d a t a by t h e Brown and Ladner4 method. c o a l ) areshown i n f i g u r e 3. The s i g n a l - t o - n o i s e r a t i o h e r e i s c o n s i d e r a b l y worse
S p e c t r a o f a CS2 e x t r a c t of c o a l ( r e p r e s e n t i n g 3% t o 5% of t h e whole
due t o t h e presence o f a l a r g e amount of t h e CS2 s o l v e n t . mined from C I 3 NKR is 0.6.
A r o m a t i c i t i e s of N e u t r a l O i l s
Source C/H
800" C c r a c k i n g of a h igh - t empera tu re c o a l c a r b o n i z a t i o n product 1.05
700" C c r a c k i n g of a low-temperature c o a l c a r b o n i z a t i o n product ' '0 .86
'
D i s t i l l a t i o n of a l i g n i t e c a r b o n i z a t i o n product 0.64
The f a v a l u e d e t e r -
H L
0.83
0.68
0.38
fa c13
0.78
0.70
0.39
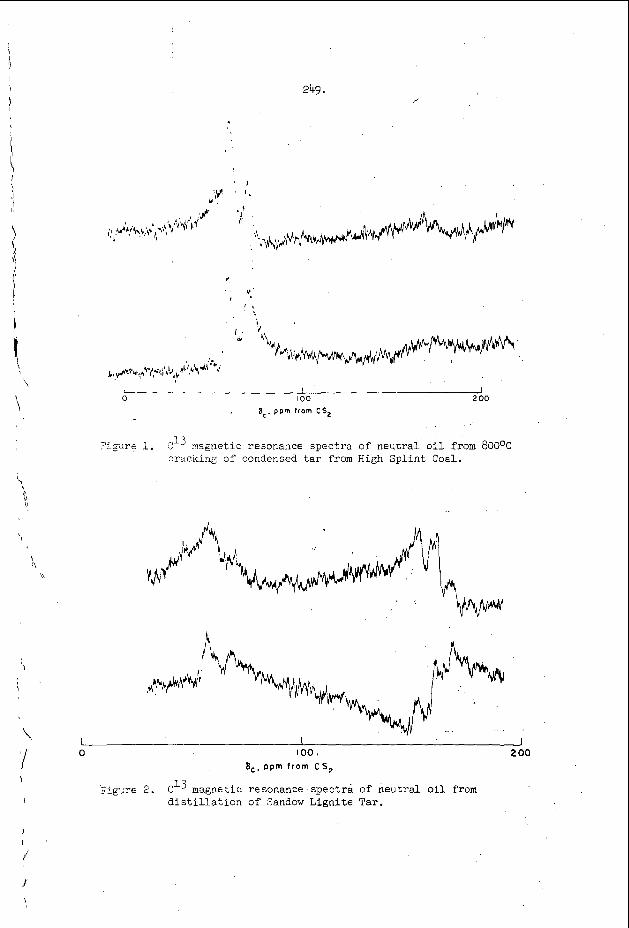
\
\
'I \
I
0 I I
I O 0 2 00 , 8 . p p m f rom CS2
1i;Lire 1. :13 magnetic resonance spectra of neutral oil from 8OO0C cricking of condensed tar from High Splint Coal.
1. ::g,re 2 . c13 magnetic resonance spectra of n e u t r a o i l from distillation of Sandow Lignite T a r .
I
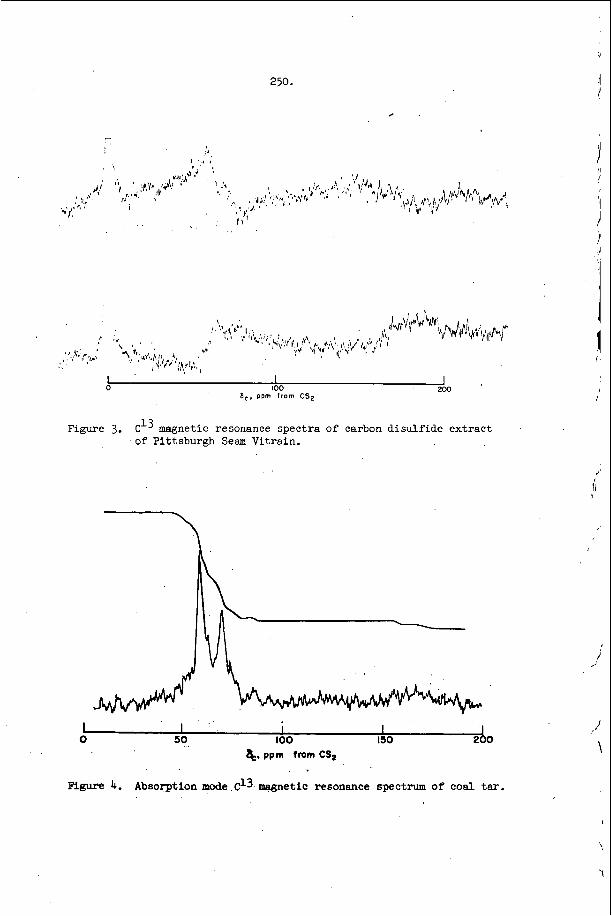
250.
. . I 0
I I 100 200
8 , . ppm from C S z
Figure 3. C" magnetic resonance spectra of carbon disulfide extract of Pittsburgh Seam Vitrain.
I I I I 0 50 100 IS0
&.ppm from CS2
Figure 4. Absorption mode $3 magnetic resonance spectrum of coal tar.
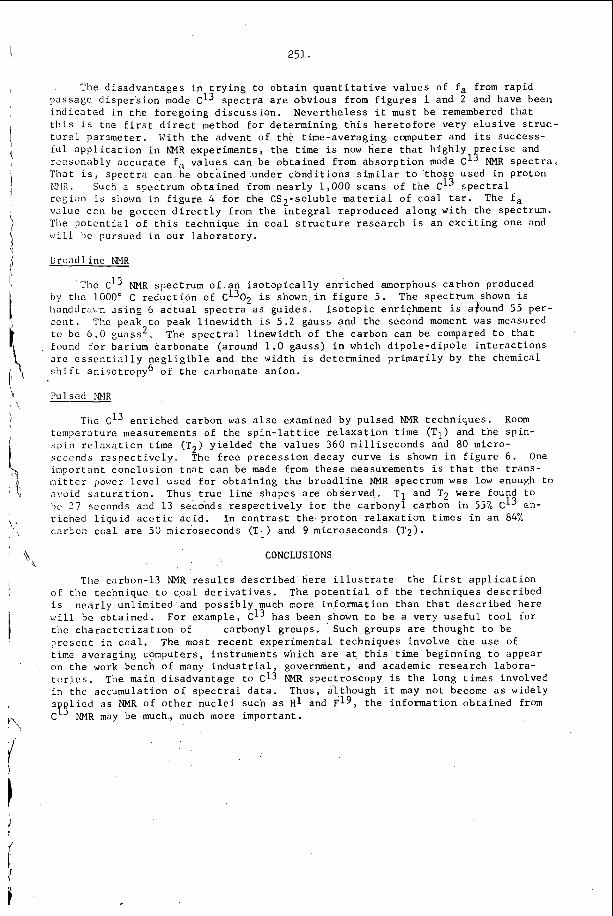
251.
The d i s a d v a n t a g e s i n t r y i n g t o o b t a i n q u a n t i t a t i v e v a l u e s of f a from r a p i d
N e v e r t h e l e s s it must be remembered t h a t passage d i s p e r s i o n mode C I 3 spectra a r e obvious from f i g u r e s 1 and 2 and have been i n d i c a t e d i n t h e foregoing d i s c u s s i o n . t h i s i s the f i r s t d i r e c t method f o r de te rmining t h i s h e r e t o f o r e very e l u s i v e s t r u c - t u r a l parameter . With t h e advent of t h e t ime-averaging computer and i t s success- f u l a p p l i c a t i o n i n NMR exper iments , t h e t i m e i s now h e r e t h a t h i g h l y reasonably a c c u r a t e f a v a l u e s can he o b t a i n e d from a b s o r p t i o n mode C I g NMR s p e c t r a . That i s , s p e c t r a can be o b t a i n e d .under c o n d i t i o n s s i m i l a r t o t h o s e used i n pro ton LNZ. Such a spectrum o b t a i n e d from n e a r l y 1,000 s c a n s o f t h e C I 3 s p e c t r a l reg ion i s shown i n f i g u r e 4 f o r t h e CS2-soluble material of c o a l t a r . va lue can be g o t t e n d i r e c t l y from t h e i n t e g r a l reproduced a l o n g w i t h t h e spectrum. The p o t e n t i a l of t h i s technique i n c o a l s t r u c t u r e r e s e a r c h i s a n e x c i t i n g one and ::ill be pursued i n o u r l a b o r a t o r y .
broad 1 i n e WIR
r e c i s e and
The f a
'The C L 3 NMR spectrum o f . a n i s o t o p i c a l l y e n r i c h e d amorphous carbon produced by tile 1000" C r e d u c t i o n of C1302 i s shown, in f i g u r e 5 . handdrat.:n u s i n g 6 a c t u a l s p e c t r a a s g u i d e s . c e n t . The peak t o peak l i n e w i d t h i s 5 . 2 gauss and t h e second moment was measured t o be 6 . 0 g u a s s 2 . found f o r barium c a r b o n a t e (around 1 .O gauss) i n which d i p o l e - d i p o l e i n t e r a c t i o n s a r e e s s e n t i a l l y n e g l i g i b l e and t h e wid th i s determined p r i m a r i l y by t h e chemical s h i f t an iso t ropy ' o f t h e carbonate an ion .
Pulsed XNR
The spec t rum shown i s I s o t o p i c enr ichment i s afound 55 per -
The s p e c t r a l l i n e w i d t h of t h e carbon can be compared t o t h a t
Tile CL3 e n r i c h e d carbon was a l s o examined by pulsed NMR t e c h n i q u e s . Room tempera ture measurements of t h e s p i n - l a t t i c e r e l a x a t i o n t i m e (T1) and t h e s p i n - s p i n r e l a x a t i o n time (T2) y i e l d e d t h e v a l u e s 360 m i l l i s e c o n d s and 80 micro- seccnds r e s p e c t i v e l y . The f r e e p r e c e s s i o n decay curve i s shown i n f i g u r e 6 . One impor tan t c o n c l u s i o n t h a t c a n be made from t h e s e measurements i s t h a t t h e t r a n s - m i t t e r power Level used f o r o b t a i n i n g t h e b r o a d l i n e NMR spectrum w a s low enough to avoid s a t u r a t i o n . Thus t r u e l i n e shapes a r e observed . !le 2 7 seconds and 13 seconds r e s p e c t i v e l y f o r t h e carbonyl carbon i n 55% CI3 en- r i c h e d l i q u i d a c e t i c a c i d . c a r t o n c o a l a r e 50 microseconds (T1) and 9 microseconds (T2).
TI and T2 were found t o
I n c o n t r a s t t h e pro ton r e l a x a t i o n t i m e s i n a n 84%
CONCLUSIONS
The carbon-13 NMR r e s u l t s d e s c r i b e d h e r e i l l u s t r a t e t h e f i r s t a p p l i c a t i o n o f t h e technique t o c.oal d e r i v a t i v e s . The p o t e n t i a l o f t h e t e c h n i q u e s d e s c r i b e d i s n e a r l y u n l i m i t e d and p o s s i b l y much more i n f o r m a t i o n t h a n t h a t d e s c r i b e d h e r e v i 1 1 be obta ined . t h e c h a r a c t e r i z a t i o n of carbonyl groups. Such groups a r e thought t o be p r e s e n t i n c o a l . The most r e c e n t exper imenta l t e c h n i q u e s involve t h e use of time averaging computers , i n s t r u m e n t s which a r e a t t h i s time beginning t o appear on t h e work bench of many i n d u s t r i a l , government, and academic r e s e a r c h l a b o r a - t o r i e s . i n t h e accumulat ion o f - s p e c t r a l d a t a . a p y l i e d a s NMR of o t h e r n u c l e i such a s Hl and F19, t h e i n f o r m a t i o n o b t a i n e d from C NMR may be much, much more impor tan t .
F o r example, C I 3 h a s been shown t o b e a v e r y u s e f u l t o o l f o r
The main d i s a d v a n t a g e t o C13 NMR spec t roscopy i s t h e l o n g times involved Thus, a.l.though i t may n o t become a s widely
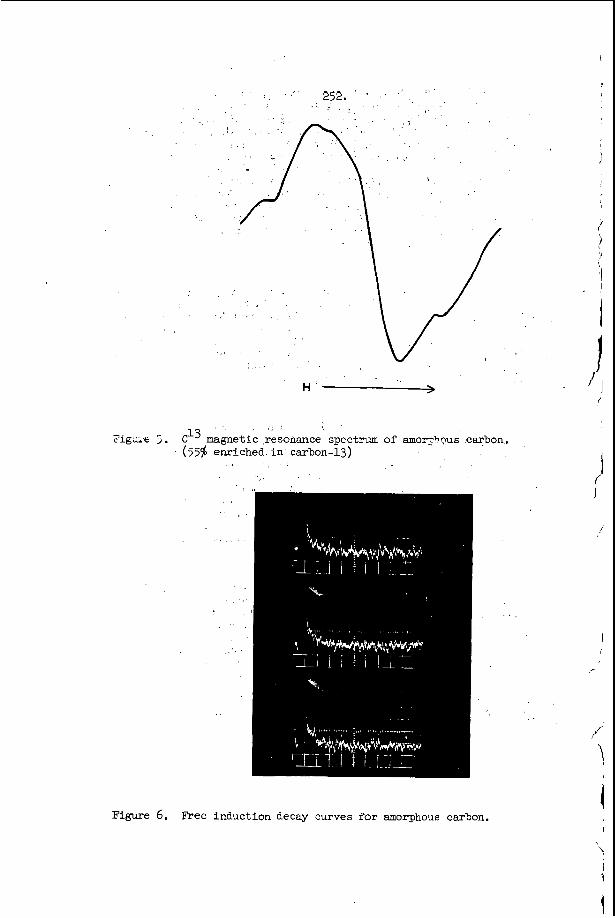
7ig-t j. C I 3 magnetic resonance spectrum of a m o ~ h ~ u s carbon. (55$ enriched i n carbon-13)
Figure 6. Free induction decay curves f o r amorphous carbon.
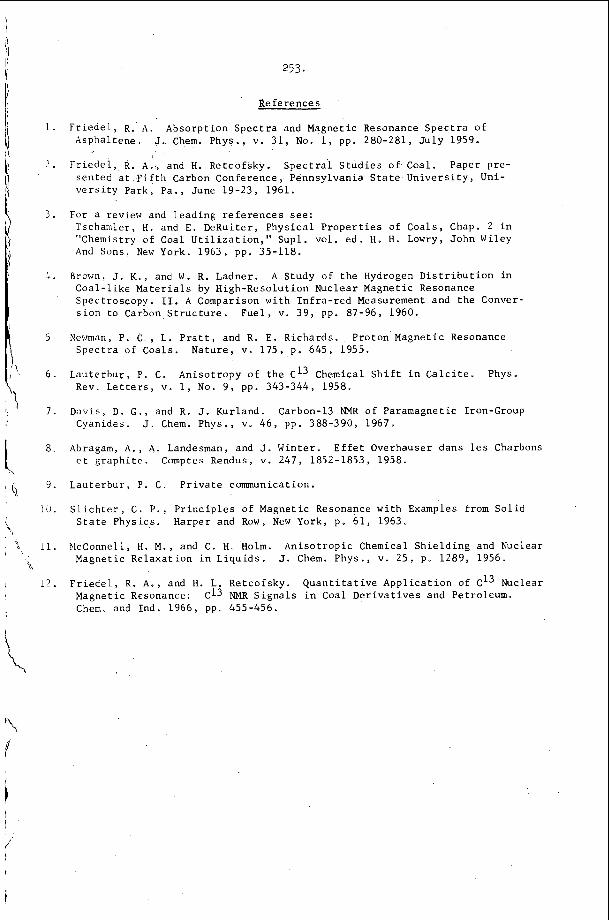
253.
Refe rences
1. F r i e d e l , R. A . Absorp t ion S p e c t r a and Magnetic Resonance S p e c t r a of Asphal tene. J. Chem. Phys. , v . 3 1 , No. 1, pp. 280-281, J u l y 1959.
2 . F r i e d e l , R. A . , and H. Retcofsky. S p e c t r a l S t u d i e s o f Coal. Paper p re - s en ted a t F i f t h Carbon Conference, Pennsylvania S t a t e U n i v e r s i t y , Uni- v e r s i t y Park, Pa . , June 19-23, 1961.
3 . For a review and l ead ing r e f e r e n c e s s e e : L
Tschamler, H . and E . DeRuiter , P h y s i c a l P r o p e r t i e s of Coals , Chap. 2 i n "Chemistry o f Coal U t i l i z a t i o n , " Supl . vo l . e d . H. H . Lowry, John Wiley And Sons, New York, 1963, pp. 35-118.
Brown, J. K . , and W . R. Ladner. A Study of t h e Hydrogen D i s t r i b u t i o n i n C o a l - l i k e M a t e r i a l s by High-Resolut ion Nuclear Magnetic Resonance Spectroscopy. 11. A Comparison w i t h I n f r a - r e d Measurement and t h e Conver- s i o n to Carbon S t r u c t u r e . F u e l , v. 3 9 , pp. 87-96, 1960.
Newman, P. C . , L . P r a t t , and R. E . Richards. P ro ton Magnetic Resonance Spec t r a o f Coals . Na tu re , v . 175 , p. 645, 1955.
Lau te rbur , P . C . An i so t ropy of t h e C I 3 Chemical S h i f t i n C a l c i t e . Phys. Rev. Letters, v . 1, No. 9 , pp. 343-344, 1958.
Davis , D. G . , and R . J. Kurland. Carbon-13 NMR of Paramagnet ic Iron-Group Cyanides. J. Chem. Phys. , v . 46 , pp. 388-390, 1967.
Abragam, A . , A . Landesman, and J. Win te r . E f f e t Overhauser dans l e s Charbons e t g r a p h i t e . Comptes Rendus, V. 247, 1852-1853, 1958,
9 . Lau te rbur , P. C . P r i v a t e communication.
10. S l i c h t e r , C . P . , P r i n c i p l e s of Magnetic Resonance w i t h Examples from So l id S t a t e Physics . Harper and Row, New York, p. 61 , 1963.
11. hIcConnel1, H. M . , and C. H . Holm. A n i s o t r o p i c Chemical S h i e l d i n g and Nuclear Magnetic Re laxa t ion i n L i q u i d s . J . Chem. Phys . , v. 25, p. 1289, 1956.
t\
I 1 2 . F r i e d e l , R. A . , and H. L . Re tco f sky . Q u a n t i t a t i v e A p p l i c a t i o n of CI3 Nuclear Magnetic Resonance: Chem and Ind. 1966, pp. 455-456.
C13 NMR S i g n a l s i n Coal D e r i v a t i v e s and Petroleum.
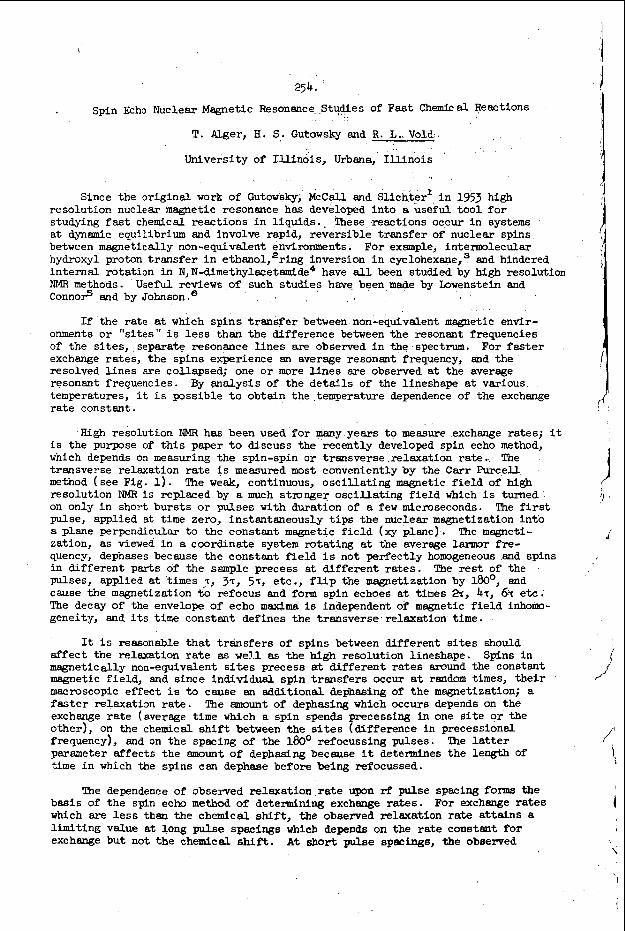
254.
Spin Echo Nuclear Magnetic Resonance Studies of Fast Chemical Reactions
T. Alger, H. S. Gutowsky and R. L. Vold
University of I l l ino is , Urbana, I l l i n o i s
Since the original work of Gutowsky; McCall and Slichter' i n 1953 high resolution nuclear magnetic resonance has developed in to a useful tool f o r studying fast chemical reactions i n l iquids. . These reactions occur i n systems a t dynamic equilibrium and involve rapid, reversible transfer of nuclear spins between magnetically non-equivdent environments. For example, intermolecular nydroxyl proton t ransfer i n ethanol, 'ring inversion i n cyclohexane, in te rna l rotation i n N,N-dimethylacetamide* have all been studied by high resolution NMR methods. Conno? and by Johnson.=
and hindered
U s e m reviews of such studies have been made by Irowenstein and
If the ra te at which spins t ransfer between non-equivalent magnetic envir- onments o r "s i tes" i s less than the difference between the resonant frequencies of the s i tes , separate resonance l i nes are observed i n the spectrum. exchange rates, the spins experience an average resonant frequency, and the resolved l i nes are collapsed; one o r more l i n e s are observed a t the average resonant frequencies. temperatures, it i s possible t o obtain the temperature dependence of the exchange r a t e constant.
For faster
By analysis of the de t a i l s of the lineshape at various
High resolution NMR has been used f o r many years t o measure exchange rates; it i s the purpose of t h i s paper t o discuss the recently developed spin echo method, wnich depends on measuring the spin-spin o r transverse relaxation ra te . The transverse relaxatian r a t e is measured most conveniently by the Carr Purcell method (see Fig. 1). resolution NMR i s replaced by a much s tmnger osc i l la t ing f i e l d which i s turned on only i n short bursts o r pulses with duration of a few microseconds. pulse, applied at time zero, instantaneously t i p s the nuclear magnetization in to a plane perpendicular t o the constant magnetic f i e l d (xy plene). zation, as viewed i n a coordinate system rotating at the average larmor fre- quency, depnases because the constant field is not perfectly homogeneous and spins in different parts of the sample precess a t d i f fe ren t ra tes . The r e s t of the pulses, applied a t times J, 3'1, 5'1, etc., f l i p the magnetization by 180°, and cause the magnetization t o refocus and form spin echoes a t times a, 4.r, 6.r e tc . The decay of the envelope of echo m a x i m a is independent of magnetic f i e l d inhom- geneity, and i t s time constant defines the transverse relaxation time.
The weak, continuous, osc i l la t ing magnetic field of high
The f i rs t
The magneti-
It i s reasonable tha t t ransfers of spins between different sites should affect the relaxation r a t e as w e 3 1 as the high resolution lineshape. magnetically non-equivalent s i t e s precess at different rates around the constant magnetic f ie ld , and since individual spin transfers occur at random times, t he i r macroscopic effect is t o cause an additional &phasing of the magnetization; a f a s t e r relaxation r a t e . The amount of dephasing which occurs depends on the exchange r a t e (average time which a spin spends precessing i n one s i t e o r the other), on the chemical. s h i f t between the sites (difference i n precessional frequency), and on the spacing of the 180' refocussing pulses. parameter affects the amount of dephasing because it determines the length Of time i n which the spins can dephase before being refocussed.
Spins in
The l a t t e r
The dependence of observed relaxation r a t e upon rf pulse spacing forms the basis of the spin echo method of determining exchange ra tes . For exchange ra tes which are l e s s them the chemical shift, the observed relaxation rate a t ta ins 8 limiting value a t long pulse spacings which depends on the r a t e constant f o r exchange but not the chemical shif't. A t short pulse spacings, the observed
;J ,
J
I
\
\
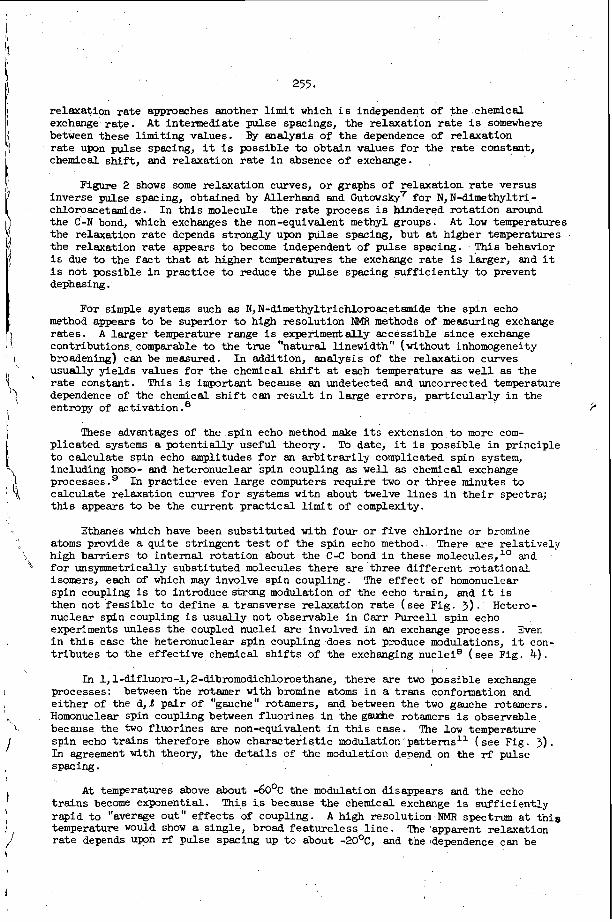
255.
relaxation ra te approaches another l i m i t which i s independent of the chemical exchange ra te . A t intermediate pulse spacings, the relaxation r a t e is somewhere between these limiting values. r a t e upon pulse spacing, it is possible to obtain values f o r the r a t e constant, chemical shift, and relaxation r a t e i n absence of exchange.
Figure 2 shows some relaxation curves, o r graphs of relaxation r a t e versus inverse pulse spacing, obtained by Allerhand and Gutowsky7 f o r N,N-dimethyltri- chloroacetamide. the C-N bond, which exchanges the non-equivalent methyl groups. the relaxation r a t e depends strongly upon pulse spacing, but at higher temperatures the relaxation ra te appears to become independent of pulse spacing. This behavior is due t o the f a c t t ha t at higher temperatures the exchange r a t e i s larger, and it i s not possible i n practice to reduce the pulse spacing suf f ic ien t ly t o prevent dephasing .
By analysis of the dependence of relaxation
In t h i s wlecule the r a t e process is hindered rotation around A t low temperatures
For simple systems such as N,N-dimethyltrichlomaetemide the spin echo method appears t o be superior t o high resolution NMR methods of measuring exchange ra tes . contributions comparable to the t rue "natural linewidth" (without inhomogeneity broadening) can be measured. usually yields values f o r the chemical shift at each temperature as well as the r a t e constant. dependence of the chemical s h i f t can r e su l t i n large errors, par t icu lar ly i n the entropy of activation .'
A larger temperature range i s experimentally accessible since exchange
In addition, analysis of the relaxation curves
This i s important because an undetected and uncorrected temperature
These advantages of the spin echo method make i t s extension t o more com- plicated systems a potentially useful theory. t o calculate spin echo amplitudes f o r an a rb i t r a r i l y complicated spin system, including homo- and heteronuclear spin coupling as well as chemical exchange processes.' In practice even large computers require two or three minutes t o calculate relaxation curves f o r systems witn about twelve l ines i n t h e i r spectra; t h i s appears t o be the current practical l i m i t of complexity.
To date, it i s possible i n principle
Ethanes which have been substituted with four o r f ive chlorine o r bromine atoms provide a quite stringent t e s t of the spin echo method. high barriers to internal rotation about the C - C bond i n these molecules,10 and f o r unsymmetrically substituted molecules there are three different rotational isomers, each of which may involve spin coupling. The effect of homonuclear spin coupling is t o introduce scrmg modulation of the echo train, and it is then not feasible t o define a transverse relaxation r a t e (see Fig. 3 ) . nuclear spin coupling i s usually not observable i n C a r r &cel l spin echo experiments unless the coupled nuclei are involved in an exchange process. Even i n t h i s case the heteronuclear spin coupling does not produce modulations, it con- t r ibu tes t o the effective chemical s h i f t s of the exchanging nucleis (see Fig. 4 ) .
There are relatively
Hetero-
I I n 1,l-difluoro-1, 2-dibromodichloroethaneJ there are two possible exchange
processes: between the rotamer with bromine atoms i n a trans conformation and e i ther of the d,d pa i r of "gauche" rotamers, and between the two gauche rotamers. Homonuclear spin coupling between fluorines i n thegauche rotamers is observable because the two fluorines are non-equivalent in t h i s case. The low temperature spin echo t r a i n s therefore show characterist ic modulation pa t te rns l l ( see Fig. 3 ) . I n agreement with theory, the de t a i l s of the moduletion depend on the rf pulse spacing.
A t temperatures above about -6OOC the modulation disappears and the echo t r a ins become exponential. rapid t o "average out" effects of coupling. temperature would show a single, broad featureless l i ne . r a t e depends upon rf pulse spacing UP t o about -2OoC, and the (dependence can be
This i s because the chemical exchange i s sufficiently
The 'apparent relaxation A high resolution NMR spectrum a t tn ie
256.
analysed t o yield values of the f r ee energy bar r ie r f o r gaucktrans internal rotation (11.0 kcal/mole) and, f o r gauch-gauche in te rna l rotation (12.0 kcal/mole) .
For l-fluoro-l , l , 2,2-tetra.chloroethane, only one exchange process i s observable by magnetic resonance: the interchange of the mtamer with hydrogen and f luorine i n a trans conformation with e i ther of the magnetically equivalent "gauche rotamers". served echo t r d n s should be a sum of two contributions, each corresponding t o a two s i t e exchange process.12 The two processes occur at the same rate but with different effective cnemical sh i f t s , given by tlne t rue proton chemical s h i f t between gauche and t rans rotamers, plus o r minus one half the difference of the heteronuclear coupling constants for each ro tmer . A t the f i e l d strengths used (corresponding to proton resonance a t 26.8 and 17.7 MHz) the chemical s h i f t i s s m a l l , and the two effect ive chemical. sh i f t s are equal, and independent of f i e l d strength (see Fig. 4 ) . conversion of the gauche and trans ro tmers w a s found t o be about 8.7 kcal/moie. It i s less than the b a r r i e r s found in CF2BrCCkBr because i n tne former compound the activated complex involves eclipse of smaller atoms than i n the l a t t e r .
It Ls e$y t o show t h a t for spin echo experiments, the ob-
I n t h i s compund the free energy bar r ie r for inter-
References
'H. S. Gutowsky, D. W . McCelL1, and C . P. Slichter, J. Chem. Phys. 3 279 (1953).
2J. T. Arnold, Phys. Rev. 102, 136 (1956).
9. A. L. Anet, M . Ahmad, end L. D. H a l l , Proc. Chem. SOC. (London) p. 145 (1964).
4M. T . Rogers and J. C . Woodbrey, J. Phys. Chem. & 540 (1962).
5A. Lowenstein end T. M. Connor, Ber. Bunsenges. Physik. Chem.
'C. S. Johnson, Jr., Advances i n Magnetic Resonance 1, 33 (1965).
7A. AJ.lerhand and H. S. Gutowsky, J. Chem. Phys. l& 2l15 (1964).
..
280 (1963).
'A. Allerhand, H . S. Gutassky, J. Jonas and R. Meinzer, J. Am. Chem. Soc. 3 3165 (iPj6).
%. S. Gutowsky, R . L. Vold and E. J. Wells, J. Chem. Phys. 43-, 4107 (1965).
'OR. A. Newmark and C . H. Sederholm, J. Chem. Phys. 42, 602 (1965).
llR. L. Vold and H. S. Gutbwsky, J. Chem. Phys. (submitted)
L2 T. mer, H. S. G u t m s ~ and R. L. Vold, ( t o be published).
.2
- I I O
\\ I O 0 0
.I 0 0 ’/2 ?- Rzo
1 1 I I I I I 1-1 I I I I I I I I I l f I I
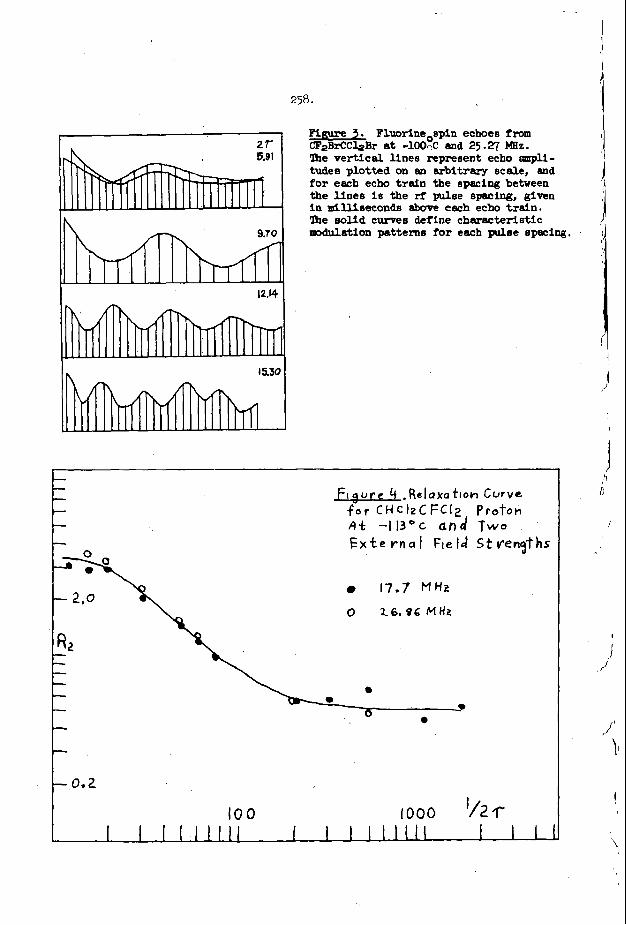
1 2r
- 0.2 100 1000 Y 2 . f
I I I111111 I 1 I I I l l 1 1 I I I 1
I 12.14
Figure 3. Fl.wrineoepin echoes i r o m CFzBrCCkBr at -100~ C and 25.27 MBz . The vertical l ines represent echo mnpli- tudes plotted on BD arbitrary scale, and for each echo train the spacing between the l ines is the rf pulse spacing, given in laiWseconde above each echo train. The s o l i d curves define characteristic modulation patterns f o r each pulse spacing.
Fi!ure 4 .R claxa t i o n Curve f o r C H c l 2 C F C 1 2 Proton fit - 1 1 3 ~ c and T W O
0 17.7 MHz
0 1 6 . 9 6 MHz
E x t e r n a l Fie ld Strengths
0 0
,W
t
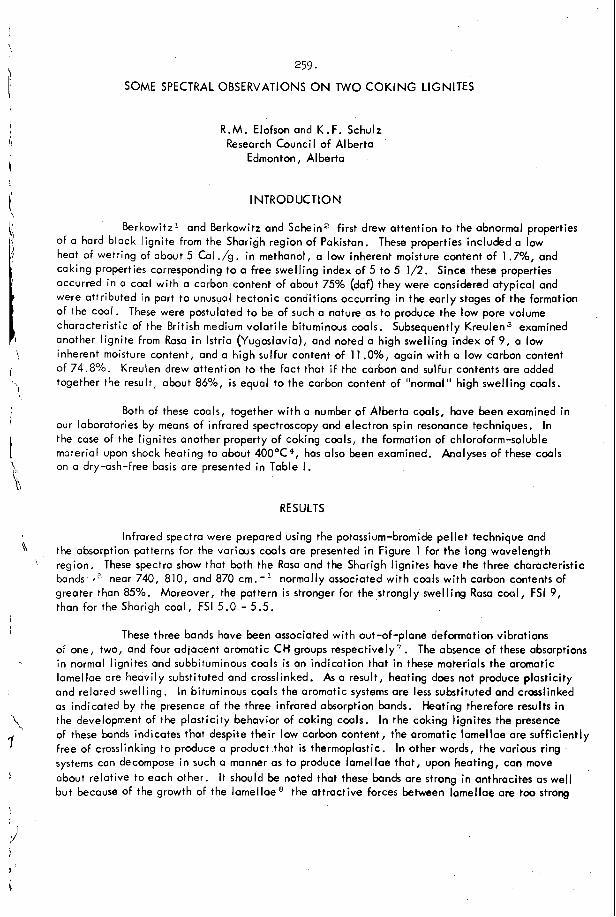
259.
SOME SPECTRAL OBSERVATIONS ON TWO COKING LIGNITES
R.M. Elofson and K.F. Schulz Research Counci I of AI berta
Edmonton, AI berta
1 NTRODUCTION
Berkowitz? and Berkowitz and Schein" first drew attention to the abnormal properties of a hard black lignite from the Sharigh region of Pakistan. These properties included a low heat of wetting of about 5 CUI ./g. in methanol, a low inherent moisture content of 1.7%, and caking properties corresponding to a free swelling index of 5 to 5 1/2. Since these properties occurred in a coal with a carbon content of about 75% (daf) they were considered atypical and were attributed in part to unusual tectonic conditions occurring in the early stages of the formation of the coal. These were postulated to be of such a nature as to produce the low pore volume characteristic of the British medium volatile bituminous coals. Subsequently Kreulen3 examined another lignite from Rosa i n lstria (Yugoslavia), and noted a high swelling index of 9 , a low inherent moisture content, and a high sulfur content of 1 1 .O%, again with a low carbon content of 74.8%. Kreulen drew attention to the fact that i f the carbon and sulfur contents are added together the result, about 86%, i s equal to the carbon content of "normal" high swelling coals.
Both of these coals, together with a number of Alberta coals, have been examined in our laboratories by means of infrared spectroscopy and electron spin resonance techniques. In the case of the lignites another property of coking coals, the formation of chloroform-soluble material upon shock heating to about 4OO0C4, has also been examined. Analyses of these coals on a dry-ash-free basis are presented in Table I.
RESULTS
Infrared spectra were prepared using the potassium-bromide pellet technique and the absorption patterns for the variws coals are presented i n Figure 1 for the long wavelength region, bands t 3 near 740, 810, and 870 cm.- l normally associated with coals with carbon contents of greater than 85%. Moreover, the pattern i s stronger for the strongly swelling Rasa coal, FSI 9, than for the Sharigh coal, FSI 5.0 - 5 . 5 .
These spectra show that both the Rosa and the Sharigh lignites have the three characteristic
These three bands have been associated with out-of-plane deformation vibrations of one, two, and four adjacent aromatic CH groups respectively7. The absence of these absorptions in normal lignites and subbituminous coals i s an indication that in these materials the aromatic lamellae are heavily substituted and crosslinked. As a result, heating does not produce plasticity and related swelling. In bituminous coals the aromatic systems are less substituted and crosslinked as indicated by the presence of the three infmred absorption bands. the development of the plasticity behavior of coking coals. In the coking lignites the presence of these bands indicates that despite their low carbon content, the aromatic lamellae are sufficiently free of crosslinking to produce a product that i s thermoplastic. In other words, the various ring systems can decompose in such a manner as to produce lamellae that, upon heating, can move about relative to each other. It should be noted that these bands are strong in anthracites as well but because of the growth of the lamellaeB the attractive forces between lamellae are too strong
Heating therefore results in
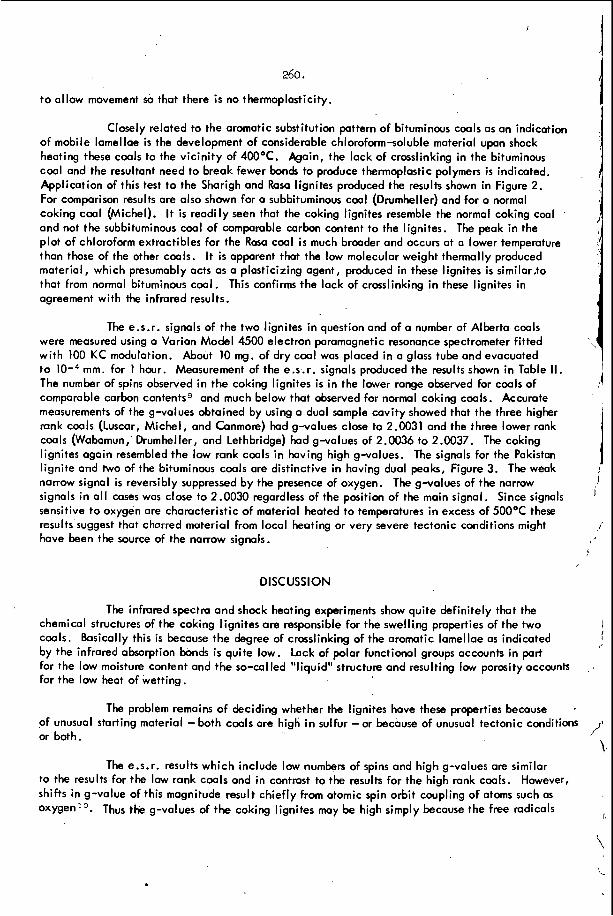
I
(
260.
to allow movement so that there i s no thermoplasticity.
Closely related to the aromatic substitution pattern of bituminous coals as an indication of mobile lamel lae i s the development of considerable chloroform-soluble material upon shock heating these coals to the vicinity of 400OC. Again, the lack of crosslinking in the bituminous coal and the resultant need to break fewer bonds to produce thermoplastic polymers i s indicated. Application of this test to the Sharigh and Rasa lignites produced the results shown in Figure 2. For comparison results are also shown for a subbituminous coal (Drumheller) and for a normal coking coal (Michel). It i s readily seen that the coking lignites resemble the normal coking coal and not the subbituminous coal of comparable carbon content to the lignites. The peak in the plot of chloroform extractibles for the Rasa coal i s much broader and OCCUK at a lower temperature than those of the other cools. I t i s apparent that the low molecular weight thermally produced material, which presumably acts as a plasticizing agent, produced in these lignites i s similar.to that from normal bituminous coal. This confirms the lack of crosslinking i n these lignites in agreement with the infrared results.
The e.s.r. signals of the two lignites in question and of a number of Alberta coals were measured using a Varian Model 4500 electron paramagnetic resonance spectrometer fitted with 100 KC modulation. About 10 mg. of dry coal was placed in a glass tube and evacuated to The number of spins observed i n the coking lignites i s in the lower range observed for coals of comparable carbon contentsg and much below that observed for normal coking coals. Accurate measurements of the g-values obtained by using a dual sample cavity showed that the three higher rank cools (Luscar, Michel, and Conmore) had g-values close to 2.0031 and the three lower rank coals (Wabamun, Drumheller, and Lethbridge) had g-values of 2.0036 to 2.0037. The coking lignites again resembled the low rank coals in having high g-values. The signals for the Pakistan lignite and two of the bituminous coals are distinctive in having dual peaks, Figure 3. The weak narrow signal i s reversibly suppressed by the presence of oxygen. The g-values of the narrow signals in a l l cases was close to 2.0030 regardless of the position of the main signal. Since signals sensitive to oxygen are characteristic of material heated to temperatures i n excess of 50OOC these results suggest that charred material from local heating or very severe tectonic conditions might have been the source of the narrow signals.
rnm. for 1 hour. Measurement of the e.s.r. signals produced the results shown i n Table II.
DISCUSSION
The infrared spectra and shock heating experiments show quite definitely that the chemical structures of the coking lignites are responsible for the swelling properties of the two coals. Basically this is because the degree of crosslinking of the aromatic lamellae as indicated by the infrared absorption bonds i s quite low. Lack of polar functional groups accounts in part for the low moisture content and the so-called "liquid" structure and resulting low porosity accounts for the low heat of wetting.
The problem remains of deciding whether the lignites have these properties because *
,of unusual starting material -both coals are high i n sulfur -or because of unusual tectonic conditions or both. /'
1 The e.s.r. results which include low numbers of spins and high g-values are similar
to the results for the low rank coals and in contrast to the results for the high rank coals. However, shifts in g-value of this magnitude result chiefly from atomic spin orbit coupling of atoms such as oxygen10. Thus the g-values of the coking lignites may be high simply because the free radicals
I
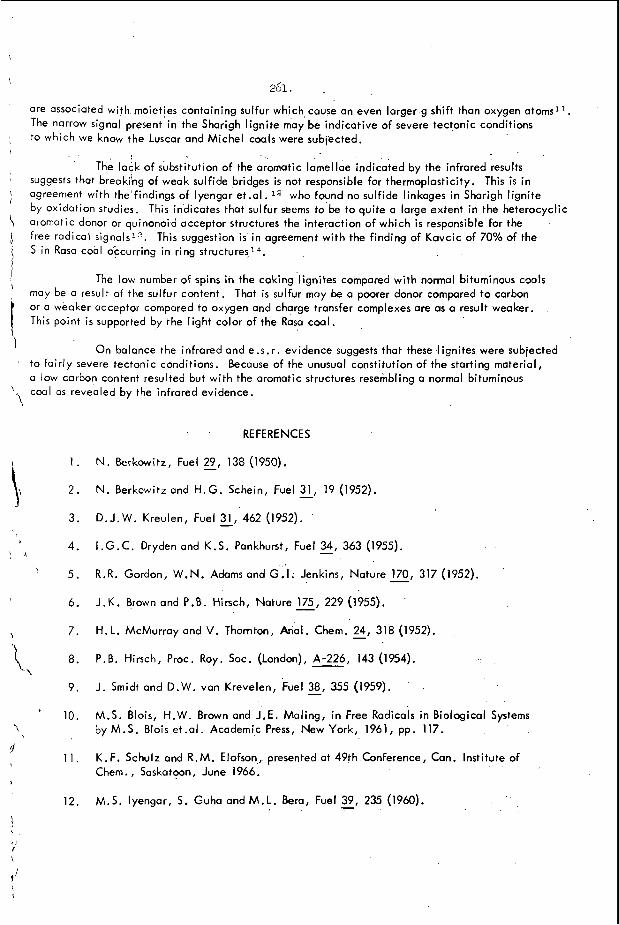
I 261
are associated with moieties containing sulfur which cause an even larger g shift than oxygen atomsll. The narrow signal present in the Sharigh lignite may be indicative of severe tectonic conditions to which we know the Luscar and Michel coals were subjected. ,
I
The lack of substitution of the aromatic lamellae indicated by the infrared results ’ 1
\ ’
1 ’/
suggests that breaking of weak sulfide bridges i s not responsible far thermoplasticity. This i s i n agreement with the findings of lyengar et.al. l a who found no sulfide linkages in Sharigh lignite by oxidation studies. This indicates that sulfur seems to be to quite a large extent in the heterocyclic aromatic donor or quinonoid acceptor structures the interaction of which i s responsible for the free radical signals’”. This suggestion i s in agreement with the finding of Kavcic of 70% of the S in Raso coal o‘ccurring in ring structuresl4.
I
r The low number of spins in the coking lignites compared with normal bituminous coals
may be a result of the sulfur content. That i s sulfur may be a poorer donor compared to carbon or a weaker acceptor compared to oxygen and charge transfer complexes are as a result weaker. This point i s supported by the light color of the Rasa coal.
On balance the infrared and e.s.r. evidence suggests that these lignites were subjected 1 1 to fairly severe tectonic conditions. Because of the unusual constitution of the starting material,
a low carbon content resulted but with the aromatic structures resembling a normal bituminous coal as revealed by the infrored evidence.
I ‘ 1
REFERENCES
I 1 . N. Berkawitz, Fuel - 29, 138 (1950).
2 .
3.
N. Berkowitz and H.G. Schein, Fuel - 31, 19 (1952).
D.J. W. Kreulen, Fuel c 31, 462 (1952).
4.
5.
I .G.C. Dryden and K.S . Pankhurst, Fuel - 34, 363 (1955).
R.R. Gordon, W.N. Adams and G.1: Jenkins, Nature - 170, 317 (1952).
) I\
>
6.
7.
8.
9.
J.K. Brown and P.B. Hirsch, Nature - 175, 229 (1955).
\ H.L. McMurrayand V. Thamton, Anal. Chem. - 24, 318 (1952).
\ P.B. Hirsch, Proc. Roy. Sac. (London), E 6 , 143 (1954).
J. Smidt and D.W. van Krevelen, Fuel 38, - 355 (1959). \
* 10. M.S. Blois, H.W. Brown and J.E. Maling, i n Free Radicals in Biological Systems
by M.S. Blois et.al. Academic Press, New York, 1961, pp. 117.
K.F. Schulz and R.M. Elofson,, presented at 49th Conference, Can. Institute of Chem., Saskatoon, June 1966.
M.S. lyengar, S . Guha andM.L. Bera, Fuel - 39, 235 (1960).
\
9 1 1 .
I
12. I
I ?
I
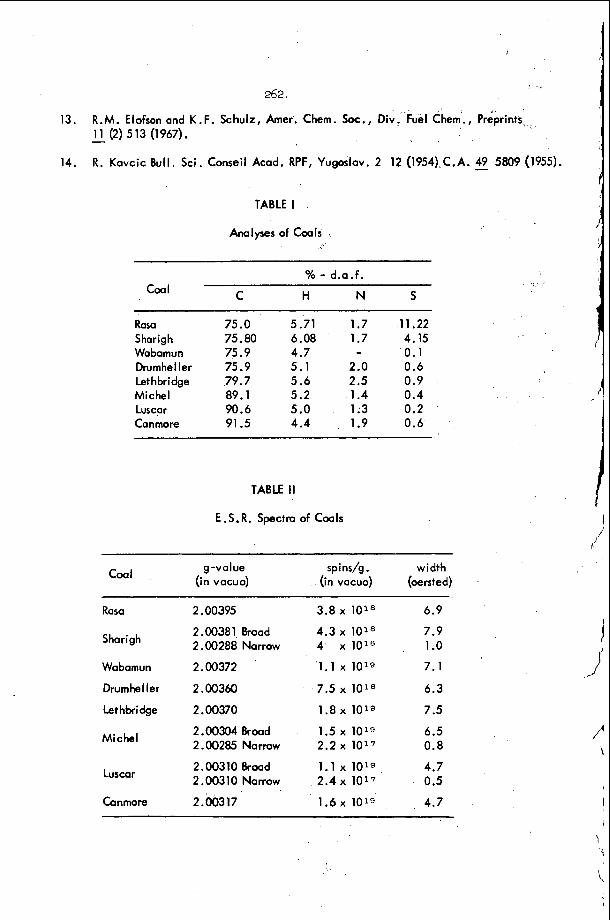
262.
13. R.M. Elofson and K.F. Schulz, h e r . Chem. SOC., Div. Fuel Chem., Preprints - 11 (2) 513 (1967).
8. Kavcic Bull. Sci. Conseil Acad. RPF, Yugoslav. 2 12 (1954)<C.A. 49 5809 (1955). 14. 1 TABLE I
Analyses of Coals
% - d.a.f.
C H N 5 Coal
Rosa Sharigh Wabamun Drumheller Let h bridge Michel Luscar Canmore
75.0 5.71 1.7 11.22 75.80 6.08 1.7 4.15 75.9 4.7 - 0.1 75.9 5.1 2.0 0.6 79.7 5.6 2.5 0.9 89.1 5.2 1.4 0.4 90.6 5 .O 1.3 0.2 91.5 4.4 1.9 0.6
TABLE I I
E.S.R. Spectro of Coals
t g -Val ue spins/g . width
(in vacuo) (in vacuo) (oersted) Coal
Rosa 2.00395 3.8 x 101' 6.9
2.00381 Broad 4.3 x 10'8 7.9 2.00288 Narrow 4 x 10'6 1 .o 5 hari g h
Wabamun 2.00372 1 .1 1019 7.1
Drumheller 2.00360 7.5 x l0l8 6.3
Lethbridge 2.00370 1.8 1019 7.5
2.00304 Broad 1.5 1019 6.5 2.00285 Narrow 2.2 1017 0.8
2.00310 Broad 1.1 1019 4.7 2.00310 Narrow 2.4x 10¹⁷ 0.5 Luscar
Conmore 2.00317 1.6 1019 4.7
Michel
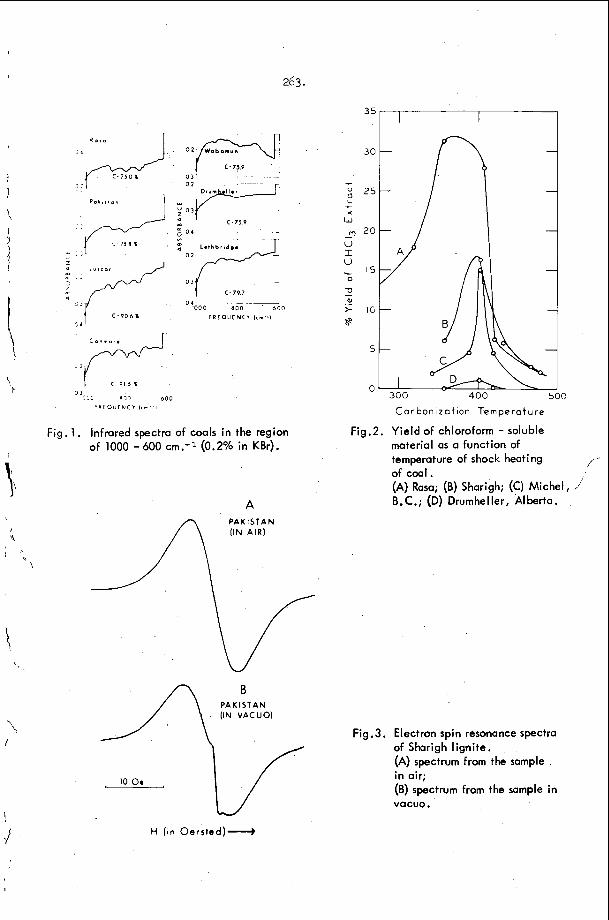
263.
-
c-797
1000 1100 . ._ .___
600 0 4
F R E O U E N C Y I c m I ]
Fig. 1. Infrared spectra of coals i n the region of 1000 - 600 crn.-l (0.2% in KBr).
A
P A K I S T A N
10 oe
H (in Oersted)-
30
-,- 25
L f
X w m 20 -
U I U L ' 5
z! ,? t IG *
5
0
Cor bon I z at ion Tern pe ro t u re
Fig.2. Yield of chloroform - soluble material as a function of
of cool. (A) Rasa; (B) Sharigh; (C) Michel, / B.C.; (D) Drumheller, Alberta.
- temperature of shock heating i
Fig.3. Electron spin resonance spectra of Shorigh lignite. (A) spectrum from the sample in air; (B) spectrum from the sample in vacuo.
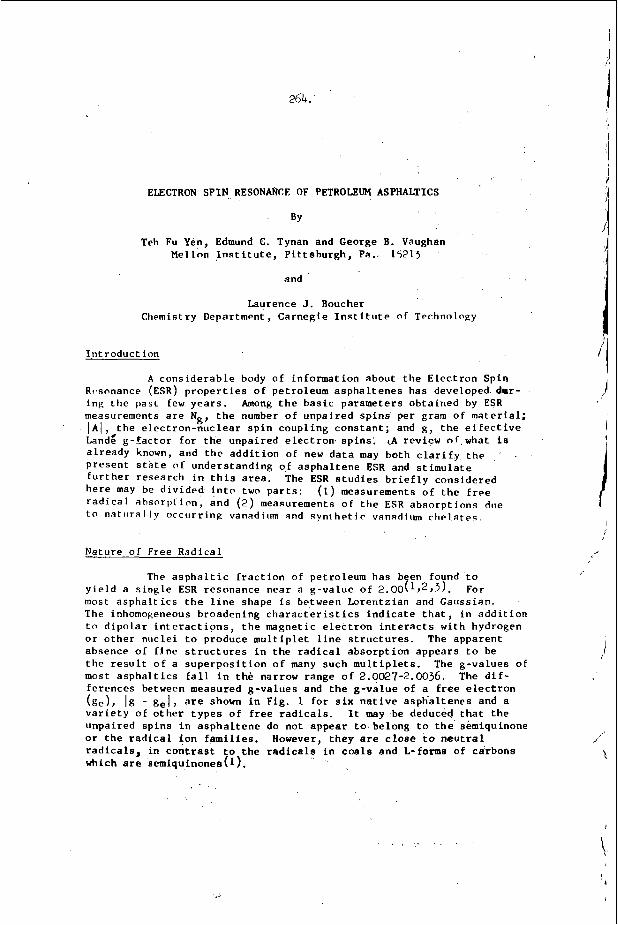
264.
ELECTRON SPIN RESONAfKE OF PETROLEUM ASPHALTICS
BY
Teh Fu Yen, Edmund C. Tynan and George B. Vaughan Mellon Institute, Pittshurgh, Pa. 15215
and
Laurence J . Boucher Chemistry Department, Carnegie Institute o f Technology
Introduction
A considerable body of information about the Electron Spin Rtsonance (ESR) properties of petroleum asphaltenes has developed dur- ing the past few years. measurements are Ng, the number of unpaired spins per gram O f material; [ A I , the electron-nuclear spin coupling constant; and g, the effective Land: g-Factor for the unpaired electron spins. already known, and the addition of new data may both clarify the present state of understanding of asphaltene ESR and stimulate further research in this area. here may be divided into two parts: radical ahsorption, and (2) measurements of the ESR absorptions dlle to natiiral l y occurring vanadiiim and synthetlc vanadillm chelates
Among the basic parameters obtained by ESR
(A review o f what is
The ESR studies briefly considered ( 1 ) measurements of the free
Nature of Free Radical
The asphaltic fraction of petroleum has been found to yield a single ESR resonance near a g-value of 2.00('J2J5). most asphaltics the line shape is between Lorentzian and Gaussian. The inhomogeneous broadening characteristics indicate that, in addition to dipolar interactions, the magnetic electron interacts with hydrogen or other nuclei to produce multiplet line structures. The apparent absence of flne structures in the radical absorption appears to be the result of a superposition of many such multiplets. The g-values of most asphaltics fall in the narrow range of 2.0027-2.0036. The dif- ferences between measured g-values and the g-value of a free electron (ge), Ig - gel, are shown in Fig. 1 for s i x native asphaltenes and a variety of other types of free radicals. It may be deduced that the unpaired spins in asphaltene do not appear to belong to the semiquinone or the radical ion families. However, they are close to neutral radicals, in contrast t o the radicals in coals and L-forms of carbons which are semiquinonee(1).
For
i
,
265.
Intensity measurements are usually troublesome, but when properly done with suitable modulation amplitude and correct power levels (not causing saturation), the s p i n concentration, Ngr can be used as a basis for differentiating or classifying different asphaltic samples. different sources: 5 hrnt-treated a~phaltenes(~), 3 carbenes, 4 cokes and one lithium- reduced asphaltene. for these materials is apparently linearly related to log Ng. data indicate that the free radical sites of these materials are associated with the aromatic moities of the a phaltic skeleton. Present findings confirm the previous observatinn(l! t a different families o f carbonaceous substances, e.g., asphaltenes, resins?6!, coals, and carbono, show a characteristic slope and intercept when their fa values are plotted against Ioe. Ng.
Figure 2 displays the Ng data for 11 native asphaltenes from 2 native gilsnnite asphaltenes, 3 refinery asphaltenea,
Aromaticity, fa, 413 obtained f r o m x-ray analyrls(5) These
No effects on Ng were observed due to the action of light, oxygen or solve r ; however, these factors do affect the spin-lattice relaxation timeY77. The free radical specie f asphaltics are stable, in contrast to coal hydrogenation asphaltenet87. that the color intensity of asphaltics, i.e., the integrated intensity obtained by absorption spectrometry over the 600-800 q region also in- creases with the ESR intensity (Fig. 3). These data indicate that the free radical is stabilized by the resonance of the delocalized n-system in the asphaltic structure.
Vanadium Unpaired Spin
Further, it was found(1)
Most asphaltics contain vanadium in concentrations ranging from 6000 to less than 1 ppm. Common valence states of vanadium are +2, +3, +4, and +5. The +5 state is diamagnetic. The 13 state, al- though paramagnetic, is usually not observable by ESR due to internal electric field effects. Both the +2 and the +4 states can, however, be detected at room temperature. Vt2 is unstable and easily oxidized. The +4 state requires a non-cubic field for ESR observabil't and this is fulfilled by the oxovanadium (IV) VO+2 type complexest9~[ The vanadium 51 nucleus (-1oO$ abundance) has a nuclear spin 7 / 2 , and so a magnetic electron coupled to it can exhibit an absorption spectrum of either 8 symetric lines (isotropic case), or 8 unsymmetric lines (anisotropic case: perpendicular features in the first derivatlve of the spectrum).
In contrast to oxovanadium (IV),
8 parallel and 8
For native asphaltenes in general a 16-feature anisotropic spectrum has been observed for this dl system in either solid form or in solution in non-polar organic solvents (Fig. 4). Assignment of the absorption lines is in general agreement with the assignment for the axial synunetry case as described previously by O'Reilly(10).
The format liphs, and with multi-amplitude recordings (F ig . 5 ) . The line positions of the vanadium resonance.for nine different asphaltenes have recently been measured and are shown in Pig. 6. When compared with a eample of vanadyl etioporphyrin I , whoee line poeitions are also
ositions have been carefully examined in a second derivative
256.
siwwn i n Fig. 6, a number o f a d d i t i o n a l l i n e s are observed f o r t he a spha l t enes . Whether t h e a d d i x i o n a l l i n e s r e p r e s e n t o t h e r paramagnetic s p e c i e s OK o t h e r s t r u c t u r a l environments f o r t h e vanadium i n t h e a s p h a l t e n e samples i s s t i l l unknown. However, such a d i f f e r e n c e is u s e f u l i n q u a l i t a t i v e l y d i f f e r e n t i a t i n g a s p h a l t e n e s from d i f f e r e n t sou rces .
Another e m p i r i c a l c r i t e r i o n f o r d i f f e r e n t i a t i n g among a s p h a l - t e n e s i s obta ined by measuring t h e spac ings of t h e g , , f ea tu re s : 211 - 11, and 811 - 7,,. T e n t a t i v e l y , two parameters can be de r ived (Table I ) ; one i s t h e A l l v a l u e which i s t h e ave rage spac ing o f t h e p a r a l l e l f e a t u r e s , and the o t h e r i s t h e d i f f e r e n c e o f t h e spac ings , A, r e p r e s e n t i n g a second-order e f f e c t a r i s i n g because of t h e dependence of t h e spectrum on t h e s t r e n g t h o f t h e e x t e r n a l magnet ic f i e l d . The r e a l meaning o f t h e l a t t e r q u a n t i t y has no t y e t been f u l l y explored , bu t it is thought to r e p r e s e n t d e v i a t i o n s from a x i a l symmetry. It appea r s t h a t a11 a s p h a l t e n e s s t u d i e d h e r e have a x i a l symmetry except i o r t h e samples from Bachaquero (CY) , B a x t e r v i l l e (GS), and Wafra A-1. Since both t h e A,, and A v a l u e s of Bachaquero (CY) a s p h a l t e n e d i f f e r Lrom t hose o f Wafra A-1 a s p h a l t e n e , i t might be expec ted t h a t t h e r e would be a s t r u c t u r a l d i f f e r e n c e between t h e two a s p h a l t e n e s . Analys is of t h e a n i s o t r o p i c spec t rum o f t h e a s p h l t e n e s t o y i e l d complete v a l u e s of 81, g , , and AL , A,, i s h inde red by ove r l app ing l i n e s t r u c t u r e s and t h e d i f f i c u l t y of c o n v e r t i n g t h e spec t rum i n t o an i s o t r o p i c one:
Conversion o f an a n i s s t r o p i c spectrum ("bound") o f t h e vanadium ,
i n a spha l t ene i n t o a n i s o t r o p i c spec t rum (" f ree") can be e f f e c t e d by d i s s o l v i n g t h e a s p h a l t e n e s i n a p o l a r s o l v e n t such a s benzyl n-butyl e t h e r t e t r a h y d r o f u r a n o r d iphenylmethane and h e a t i n g a t an e l e v a t e d t empera tu re ( i2 ) . Such a convers ion i s r e v e r s i b l e . From t h e r e l a t i v e i n t e n s i t i e s of t h e i s o t r o p i c and a n i s o t r o p i c s p e c t r a t aken a t d i f f e r e n t tempera tures , t h e d i s a s s o c i a t i o n energy can b e ob ta ined . For a g i v e n a s p h a l t e n e , i d e n t i c a l energy va lues have been observed r e g a r d l e s s o f t h e s o l v e n t system. energy va lues o f t h r e e a s p h a l t e n e s a r e g i v e n i n Tab le 11. sugges t t h a t t h e observed "bound" vanadium is a s s o c i a t e d wi th t h e asphal - t e n e molecule ,probably with t h e a romat i c p o r t i o n . The f a c t t h a t t h i s "a s soc ia t ed" or "bound" t y p e o f vanadium becomes d i s a s s o c i a t e d i s f u r t h e r suppor t ed by d i l u t i o n s t u d i e s i n a g iven s o l v e n t system. In d i l u t e s o l u t i o n s (-0.4 W t . $) a n e a r l y i s o t r o p i c " f r ee" t y p e of spectrum w a s
The These r e s u l t s
observed . I n s o l v e n t s w i t h d i f f e r i n g b a s i c i t i e s t h e vanadium-containing a s p h a l t e n e u s u a l l y shows some i n d i c a t i o n s , though small, of t h e i s o t r o p i c vanadium ESR a b s o r p t i o n s even a t room tempera ture . ness of s o l v e n t s f o r producing t h e " f r ee" vanadium s p e c i e s may be ranked as fo l lows: d iphenylmethane < benzyl n - b u t y l e t h e r < 1-e thy lnapb tha lene < benzene < n i t r o b e n z e n e < p y r i d i n e < t e t r a h y d r o f u r a n .
The r e l a t i v e e f f e c t i v e -
N i t rogen Supe rhype r f ine S p l i t t i n g s ( s . h . f . 1
The l i t e r a t u r e i n d i c a t e s no n i t r o g e n s . h . f . f o r t h e oxovanadium ( I V ) i n a q u a d r i d e n t a t e n i t r o g e n l i g a n d except f o r t h e c a s e of vanadyl t e t f y j y e n y l p o r p h i n i n ch lo ro fo rm or ca rbon d i s u l f i d e "glass" r e p o r t e d by Lee . We have been a b l e to obse rve n i t r o g e n 8 .h . f . f o r vanadyl
267.
;~ ; i t i l a iocyanine doped a t a c o n c e n t r a t i o n of 2000 ppm i n t o e i t h e r a con- ( i L i i i s a L 1 m polymer o f a n t h r a c e n e o r o f phenanthrene, o r a g i1 , soni tc ~ i s ; ~ i i a I c c n c ( n a t u r a l vanadium c o n t e n t < 1 ppm). F igure 7 shows t h e 9- 1 Lnc pat- tcrn of n i t r o g e n s . h . f . s t r u c t u r e s superimposed on t h e vanadium Xc. itL l i n e f o r vanadyl ph tha locyanine doped i n t o a polymer made from . ~ n i i i r . i ~ ~ e r i c niid formaldchydc. . For lour c q u i v o l c n t n i t r o g e n n u c l e i t h e i - c l a t i v c i n c c n s i t i e s of t h e n i n e l i n e s a r e expec ted t o be 1, 4, 10, 16, 1:'. 16, 10, I + , 1. The i n t e n s i t y d i s t r i b u t i o n p a t t e r n s o f t h e n i t r o g e n l i n e s ior vanadyl p h t h a l s c y a n i n e e i t h e r i n an thracene polymer o r i n t h e : ; i l soni te a s p h a l t e n e drop o f f r a p i d l y f o r t h e o u t e r n i t r o g e n l i n e s , b u t i n ::enera1 r e t a i n t h e b e l l shape. However, when 2OCO ppm vanadium i n t h e f o r m o f vanadyl e t i o p o r p h y r i n I was doped i n t o g i l s o n i t e a s p h a l t e n e o r an a romat ic medium such as p e r y l e n e , t h e r e were no n i t r o g e n s . h . f . s t r u c t u r c s observed. On t h e o t h e r hand, t h e r e i s i n d i c a t i o n t h a t t h e r e m y bc n i t r o g e n s p l i t t i n g s i n t h e p e t r o p o r p h y r i n s (vanadium) o f n a t i v e asphal tene . Tlic r e ? e a t e d s c a n o f t h e No. 2 r e g i o n i n a second d e r i v a t i v e format f o r aaciiaquero (W> a s p h a l t e n e is given i n F ig . 8. I n a d d i t i o n t o t h e i i n i . siiown, f i n e s t r u c t u r e s u g g e s t i v e o f n i t r o g e n l i n e s appears i n t h e over lapping reg ion of t h e Nos. 1 1 ~ and 4,, T y p i c a l p o o r l y re- so lved n i t r o g e n l i n e s superimposed on a vanadium l i n e are i l l u s t r a t e d i n Pi;. 9. The coupl ing c o n s t a n t observed f o r bo th t h e vanadyl p h t h a l o - cyanine and p e t r o p o r p h y r i n (vanadium) i s AT = 2.6 G. t h e n i t r o g e n s p l i t t i n g observed f o r the vanadyl t e t r a p h e n y l p o r p h i n i n chloroform o r carbon d i s u l f i d e , A: and Caughey(l4) a t t r i b u t e t h e appearance of t h e n i t r o g e n s . h . f . t o a c o n f i g u r a t i o n i n t e r a c t i o n r a t h e r t h a n to c o v a l e n t bonding. A t p r e s e n t i t seems t h a t t h e added a r o m a t i c i t y i n t h e macrocycle does p o s s i b l y b r i n g out t h e n i t r o g e n s . h . f . It may be t h a t t h e n - e l e c t r o n system provides e x c i t a t i o n f o r c o n f i g u r a t i o n i n t e r a c t i o n . The s l i g h t n i t r o g e n s . n . f . found i n a s p h a l t e n e may i n d i c a t e t h a t t h e r e a r e minor c o n s t i t u e n t s o f t h e macrocycles i n t h e form o f b e n z - s u b s t i t u t e d porphins . Such s t r u c t u r e s have been demonstrated by mass spec t romet ry t o be p r e s e n t i n a s p h a l t e n e s , e. g . , t h e proposed p ,p-benzoporphin( l5) .
Xodels f o r Non-porphyrin Vanadium
*
L.
f e a t u r e s .
T h i s v a l u e a g r e e s w i t h
2 2 .9 G . , A: 'v 2.8 G . ( ' 3 ) . Rober ts , Koski
"Xon-porphyrin" i s used h e r e t o i n d i c a t e any q u a d r i d e n t a t e nncrocycle which does not belong t o t h e a l k y l - o r cyc loa lkano-porphins ( E t i o and DPEP s e r i e s ) , e . g . , t h e rhodoporphyr in( l5 ,16) , mixed q u a t e r e n e s , C L C . Two c l a s s e s o f non-porphyrin vanadium were s y n t h e s i z e d and
mcso-aromatic r i n g - s u b s t i t u t e d porphins . T h i s s e r i e s c o n s i s t s of vanadyl complexes of t e t r a p h e n y l p o r p h y r i n (TPP), t e t r a - 1 - n a p h t h y l p o r p h i n ( T ~ N P ) , and t e t r a - 4 - b i p h e n y l p o r p h i n (T4BP). The a n i s o t r o p i c s c a n s o f t n e vanadyl d e r i v a t i v e of TlNP and T4BP a r e s i m i l a r t o t h a t of vanadyl TPP. Each of t h e s e compounds i s a 4 n i t r o g e n l i g a n d system.
c i i a r a c t e r i z e d by ESR. The f i r s t class is vanadyl complexes o f t h e /
268. i
The second c l a s s is t h e vanadyl complexes of p-ke to imines , . i . e . , q u a d r i d e n t a t e having 2 n i t r o g e n and 2 oxygen donor atoms. s e r i e s c o n s i s t s of vanadyl complexes of bisacetylacetone-ethylenediimine (Acen), bisacetylacetonepropylenediimine (Acpn), b i sbenzoylace tone- c t h y l e n e d i i m i n e (Bzen) and bisbenzoylacetoncpropylenediimine (Bzpn). Tile g - v a l u e s and vanadium n u c l e a r coupl ing c o n s t a n t s f o r some o f - t h e non-porphyrin vanadium model compounds a r e t a b u l a t e d i n T a b l e 111. O n e o f t h e q u a l i t a t i v e f e a t u r e s o f t h e vanadium s p e c t r a o f ,B-ketoimines ' i s t h a t t h e Kos. 4 1 and 4,r l i n e s are r e s o l v e d i n c o n t r a s t t o t h e case of e t i o p o r p h y r i n I.
This
A p l o t of vs . go ( t h e i s o t r o p i c coupl ing c o n s t a n t and g - v a l u e r e s p e c t i v e l y ) f o r a v a r i e t y o f vanadyl s q u a r e - p l a n a r complexes, both p o r p h y r i n and non-porphyr in , i s u s e f u l t o c h a r a c t e r i z e the p a r t i c u l a r t y p e s o f l i g a n d s (F ig . 10). Samples a t t h e upper l e f t are t h o s e con- t a i n i n g l i g a n d s which d e l o c a l i z e t h e unpai red vanadium s p i n s , and t h e s e are c h a r a c t e r i z e d by low A, v a l u e and a go v a l u e approaching t h a t o f t h e f r e e e l e c t r o n , ge = 2.0023. Samples a t t h e lower r i g h t c o r n e r u s u a l l y have l i g a n d s of a d e l e c t r o n e g a t i v e n a t u r e , and t h e s e are c h a r a c t e r i z e d by h i g h A. v a l u e s and low go v a l u e s . s u l t i n g t h r e e groups of vanadyl complexes a r e shown from l e f t t o r i g h t a s : and t h e 1 oxygen t y p e ( a c e t y l a c e t o n a t e s ) . It can be p r e d i c t e d t h a t t h e J n i t r o g e n , 1 oxygen type and t h e 1 n i t r o g e n , 3 oxygen type l i g a n d s w i l l a l s o f a l l i n t o the n e a r l y s t r a i g h t l i n e r e l a t i o n s h i p . The d a t a f o r a s - p h a l t e n e s (Bachaquero, VX; Boscan, VY) i n c l u d e d i n t h e p l o t were o b t a i n e d from a p o l a r s o l u t i o n a t e l e v a t e d tempera tures . 'The r e l a t i v e l o c a t i o n ,
of t h e s e two p o i n t s f a l l s i n t h e r e g i o n t y p i c a l o f t h e 4 n i t r o g e n donor system. It is hoped t h a t by u s i n g t h i s p l o t non-porphyrin t y p e s of vanadium c h e l a t e s c o n t a i n e d i n a s p h a l t e n e s may be r e a d i l y i d e n t i f i e d .
The average v a l u e s from t h e re-
4 n i t r o g e n type ( p o r p h i n s ) , 2 n i t r o g e n , 2 - oxygen t y p e (p-ke to imines) , '
ACKXOKLZIXXEhT
T h i s work was sponsored by Gulf Research & Development Company a s p a r t of t h e r e s e a r c h program of t h e M u l t i p l e Fe l lowship on Petroleum.
REFEREKCES
(i) T. F. Yen, 3. G. Erdman, and A. J. Saraceno, Anal. Chem. , &, 694 (1562).
I i:
L
I I
)I ,
'I
( 2 ) T. F. Yen, 3 . G. Erdman, and A , J. Saraceno, Bitumen, T e r r e , Asphal te , Peche, I'
z, 141 (1964). \
( 3 ) J. Q. Adams, K. ti. A l t g e l t , R. L. LeTourneau, and L. P. Lindeman, ACS, Div. Pe t ro leum Chem., P r e p r i n t s , 11 (2) B140 (1966).
( 4 ) J. G. Erdmn, and J. P. Dickie , ACS, Div. Pe t ro leum Chem., P r e p r i n t s , 2 (2) ~ 6 9 (ish).
269.
( 5 ) T. F. Yen, and J. G. Erdman, i n "Encyclopedia of X-Rays and Gamma Rays" (G. L. C lark , Ed . ) , Reinhold P u b l i s h i n g Company, N e w York, 1963, p p . 65-68.
(6) R. A. Gardncr , H. F. Hardman, A. L. Jones , and R. B. W i l l i a m s , J. Chem. Eng. Data, b, 155 (1959). i s used r a t h e r t h a n r e s i n . These petroleum f r a c t i o n s were thermal d i f f u s i o n c u t s , p repared by Gardner and coworkers from t h e pentane s o l u b l e f r a c t i o n o f an 85 t o LOO p e n e t r a t i o n a s p h a l t d e r i v e d from a b lend of Illinois and Oklahoma c r u d e s by oxida- t i o n o f a 200 p e n e t r a t i o n vacuum d i s t i l l a t i o n residuum.
I n t h i s r e f e r e n c e , t he t e r m "pe t ro lene"
(7) A. J,. Saraceno and N. D. Coggeshal l , J. Chem. Phys. , 2, 260 (1961).
(8) R . A. F r i e d e l , J. Chem. Phys. , 2, 280 (1959).
(9) A. J. Saraceno, D. T. Fana le , and N. D. Coggeshal l , Anal. Chem., z, 500 (1961).
(10) D. E. O ' R e i l l y , J. Chem. Phys. , 3, 1188 (1958).
(11) C , L. Wolfe, E. C. Tynan, and T. F. Yen, P i t t s b u r g h Conference on A n a l y t i c a l Chemistry and Applied Spectroscopy, Paper No. March, 1s7. 54,
(12) E. C. Tynan, and T. F. Yen, ACS, Div. Petroleum Chem. , P r e p r i n t s , 12
(13) S. K. Lee, M. S. T h e s i s , UCLA -(1%>); c f . D. Kivelson and S. K. Lee,
( 2 ) A89 (1967).
J. Chem. Phys., 41, 18% (1964).
(14) E . M. Rober t s , W. S. Koski, and W. S. Caughey, J. Chem. Phys., 2, 591 (1961).
(15) E. W. Baker, T. F. Yen, J. P. Dickie , R. E. Rhodes, and L. F. Clark , J. Am. Chem. SOC., J u l y 5 i s s u e (1967).
(16) M. F. Millson, D. S. Montgomery, and a. 8. Brown, Geochim. Coemochim. Acta, 30, 207 (1966).
(17) L. J. Boucher, E. C. Tynan, and T. F. Yen, t o b e publ i shed .
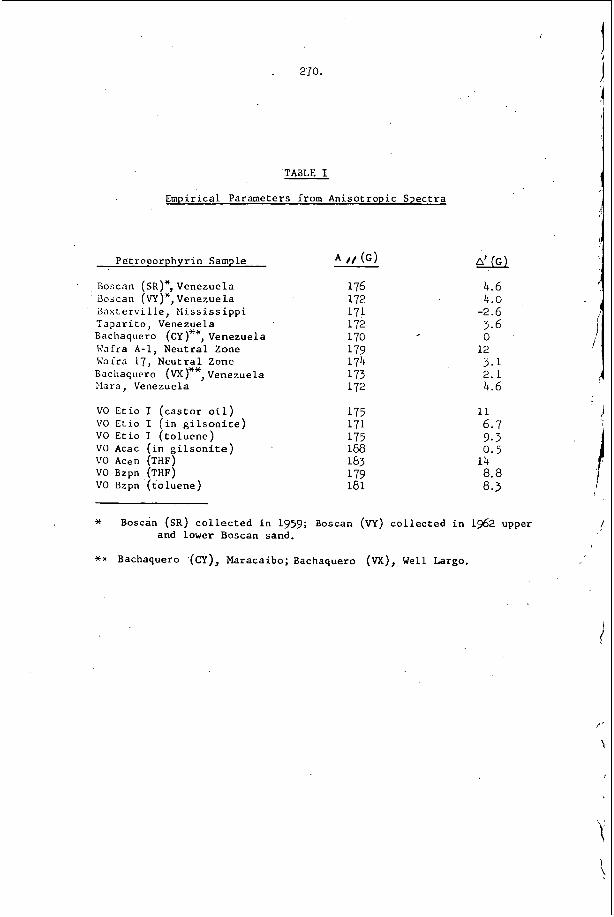
. 270.
.TABLE I
Empir ica l Parameters from Ani so t rop ic Spec t r a
Pe t rnporphyr in Sample
Iioscan (sR)", Venezuela Lioscan (w)*, Venezuela Z a s t e r v i l l e , X i s s i s s i p p i Yapa r i t 0, Venezuela B a c haq ue r o (CY )**, Venezue 1 a h'aira A - 1 , N e u t r a l Zone Waira 17, N e u t r a l Zone B a c ii aq ucr o >:ara, Venezuela
vo E t i o I ( c a s t o r o i l ) VO E t i o I ( i n g i l s o n i t e ) VO E t i o I ( t o l u e n e ) VO Acac (in g i l s o n i t e ) VO Acen (THF) VO Bzpn (THF) VO Bzpn ( t o l u e n e )
(VX )**, Vene z ue la
A ' o
4.6 4.0
-2 .6 3.6 0
12
,
5 . 1 2.1 4.6
11 6.7 9.3 0.5
14 a. a 8.3
* Boscan (SR) c o l l e c t e d i n 1959; Boscan (VY) c o l l e c t e d i n 1962 upper and lower Boscan sand.
** Bachaquero (CY), Maracaibo; Bachaquero (VX), Well Largo.
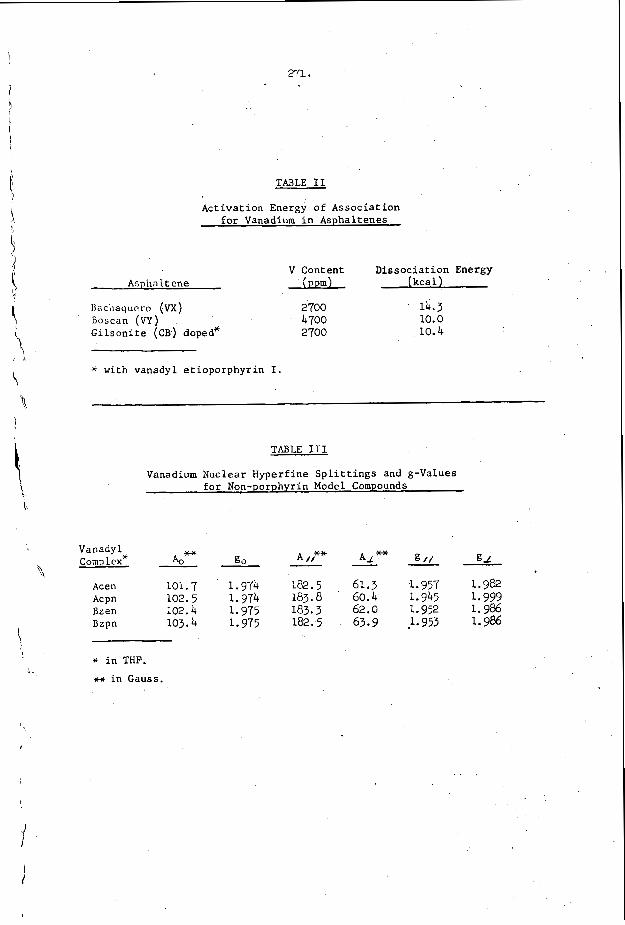
\
7 271.
TABLE I1
Activation Energy of Association for Vanadium in Asphaltenes
I /
V Content Dissociation Energy Asphnltene 0 (kcal)
Baciiaqucro (VX) 2700 14.3
Gilsonite (CB) doped* 2700 10.4 "uscan (VY) 4700 10.0
* with vanadyl etioporphyrin I.
TABLE I11
Vanadium Nuclear Hyperfine Splittings and g-Values b for Non-porphyrin Model Compounds
\\
Acen 101.7 1.974 182.5 61.3 1.957 1.982
Bzen 102.4 1.975 183.3 62.0 1.952 1.986 Bzpn 103.4 1.975 182.5 63.9 J.953 1.9%
Acpn 102.5 1.974 183.8 60.4 1.945 1.999
I
* in THP. )HC in Gauss.
i .
I
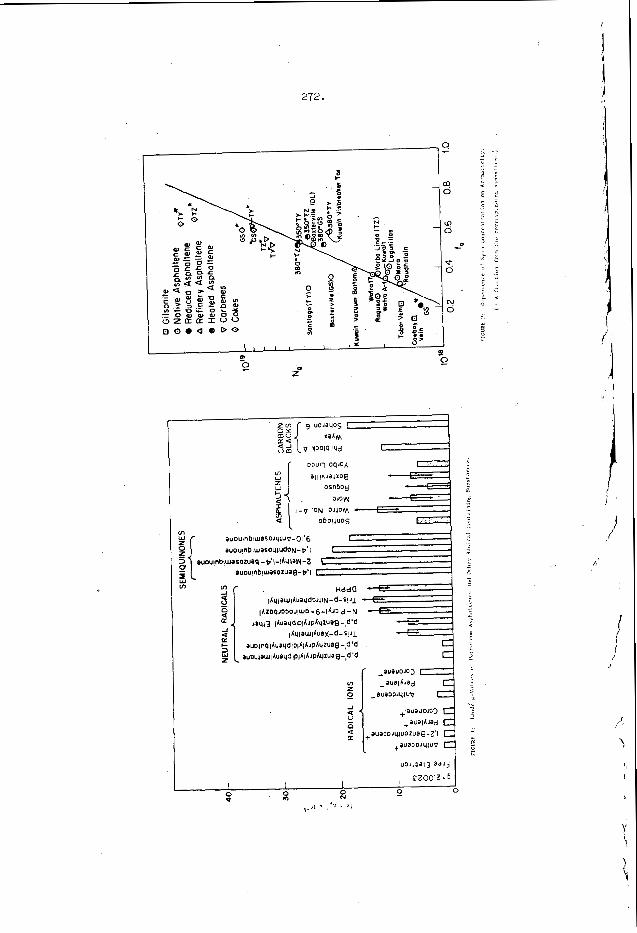
i II
J
I' \
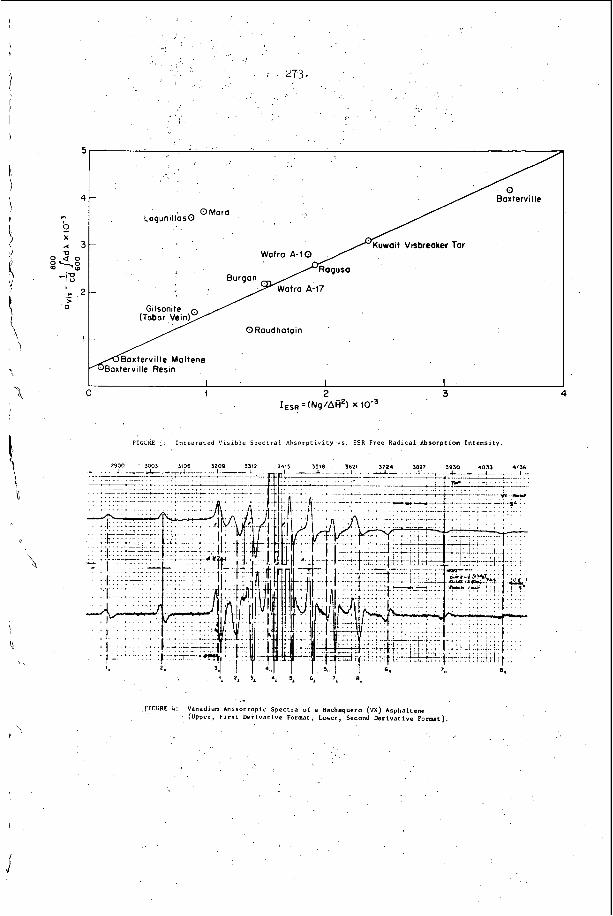
'i 273.
B
OMora Logunillas0
0 Raudhatoin
I I I 1 2 3
xESR = ( N Q / A ~ * ) x
FIGURE - : I n t c u r a r e d i'~sib1e S p e c r r a l Ahrorprivlry vs. ESR Free Radical Absorption Intensity.
3106 1209 3
. . . -- . -. ... . , ... . -
FIGURE &: Vanadium Anirorropic Spectra of a Bachaquero (VX) Asphaltene , (Upper, F i r s t Derivative Format;'Lover, Second Derivative Format).
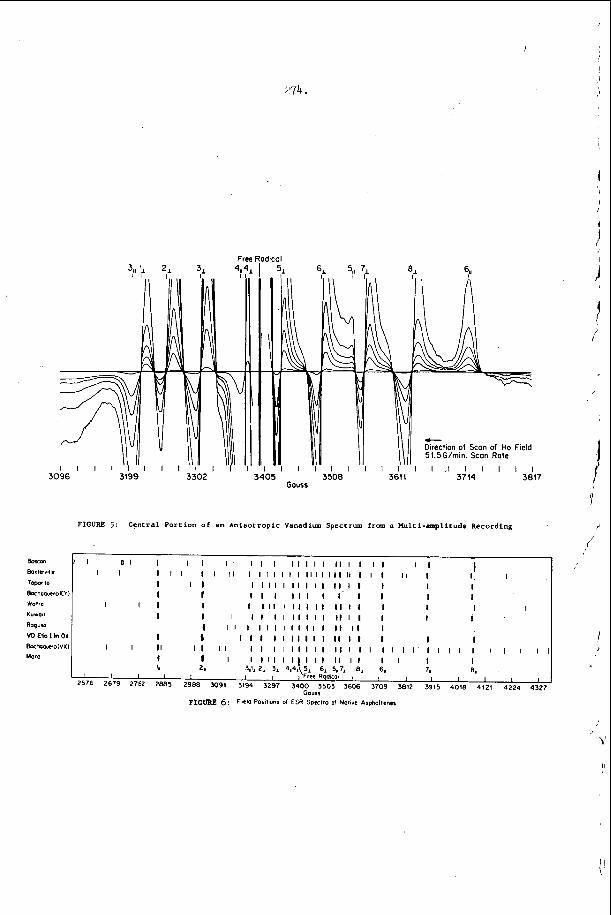
274.
f FIGURE 5: Central Portion of an Anisotropic Vanadium Spectrum from a Multi-ampllcude Recording
t,
I I I I 2. %IL 2, 3, 4rn4~[$~~ ~ d , ~ 1 7 ~ 8, 6. 7, 8,
I I I 1 9 I I I I I I 1 I 2576 2679 2782 2885 2988 3091 3194 3297 3400 3503 3606 3709 3012 3315 4018 412! 4224 432
G O W
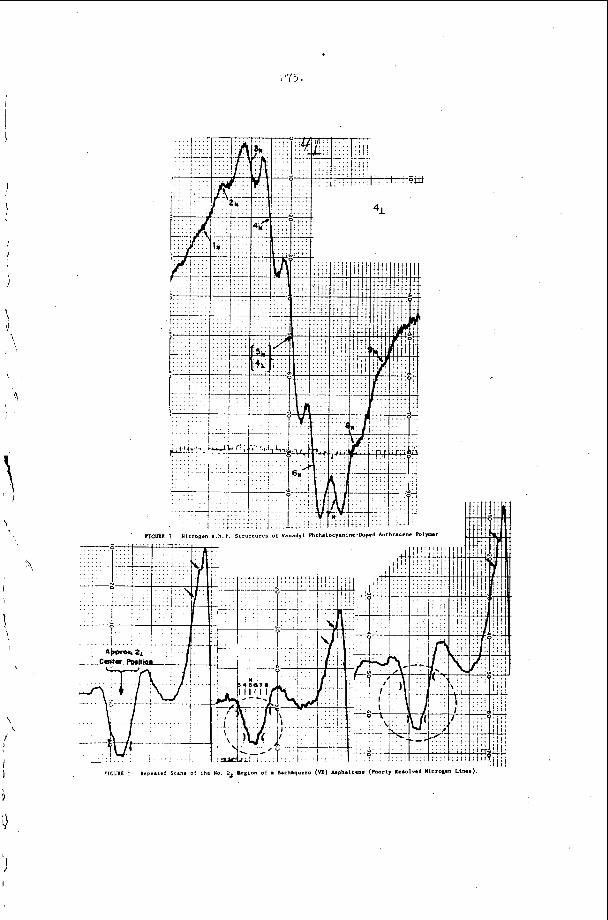
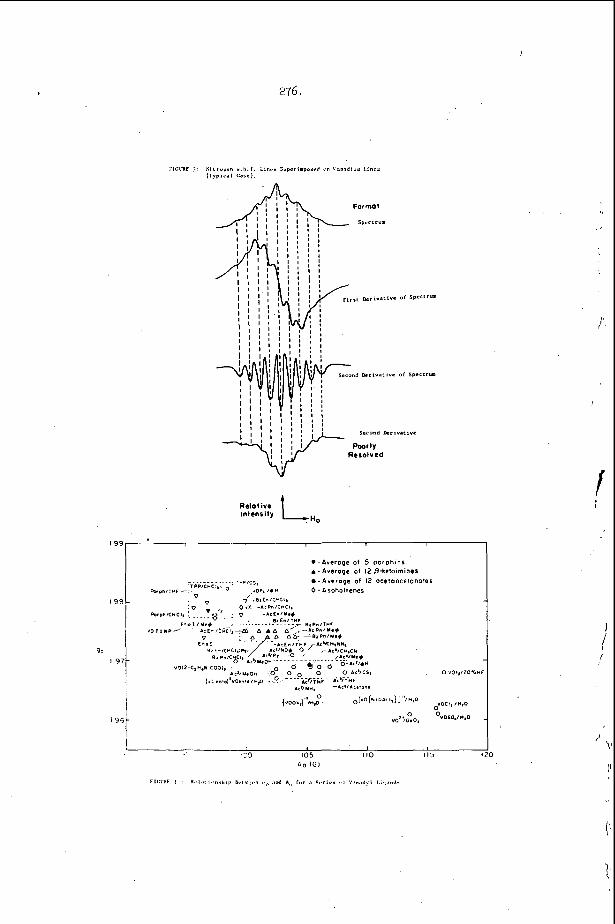
276.
Relative Intensity tH0
*.*F
I
I i
f
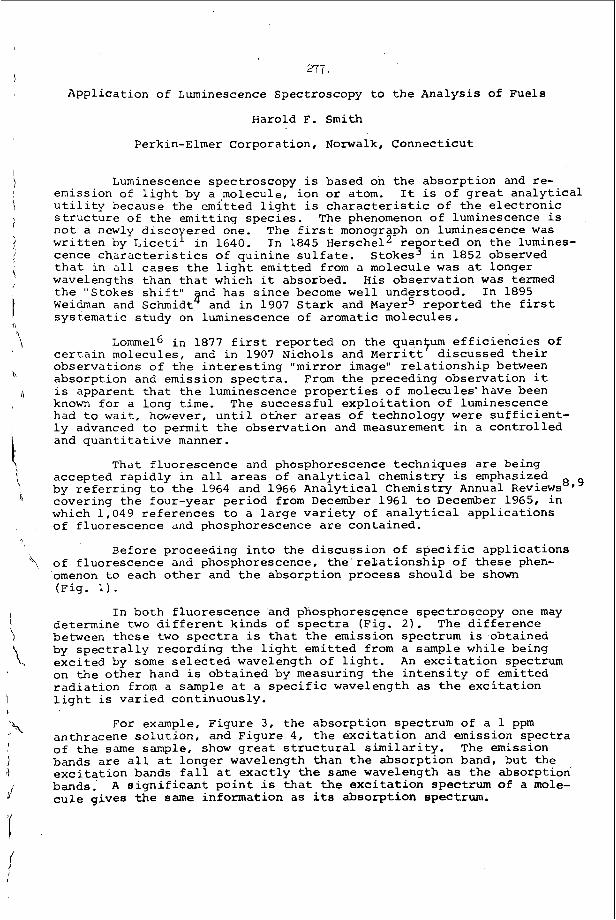
277.
Appl ica t ion of Luminescence Spectroscopy t o t h e Analys is of Fuels
Harold F. Smith
Perkin-Elmer Corporation, Norwalk, Connect icu t
Luminescence spectroscopy is based on t h e absorp t ion and re- emission of l i g h t by a molecule, ion o r atom. I t is of g r e a t a n a l y t i c a l u t i l i t y because the emit ted l i g h t is c h a r a c t e r i s t i c of t h e e l e c t r o n i c s t r u c t u r e of t h e emi t t i ng species . The phenomenon of luminescence is n o t a newly d i s c o ered one. The f i r s t monograph on luminescence was w r i t t e n by L i c e t i ' i n 1640. cence c h a r a c t e r i s t i c s of qu in ine s u l f a t e . t h a t i n a l l ca ses t h e l i g h t emit ted from a molecule was a t longer wavelengths than t h a t which it absorbed. H i s observa t ion was termed t h e "Stokes s h i f t " 2nd has s i n c e become w e l l understood. I n 1895 Weidman and Schmid t and i n 1907 S t a r k and Mayer5 r epor t ed t h e f i r s t systematic s tudy on luminescence of aromatic molecules.
I n 1845 Herschel2 re o r t e d 0x1 t h e lumines- Stokes5 i n 1852 observed
Lomme16 i n 1877 f i r s t r epor t ed on t h e quanfum e f f i c i e n c i e s Of c e r t a i n molecules, and i n 1907 Nichols and Merr i t t d i scussed t h e i r observa t ions of t h e i n t e r e s t i n g "mi r ro r image" r e l a t i o n s h i p between absorpt ion and emission s p e c t r a . From t h e preceding observa t ion it i s apparent t h a t t h e luminescence p r o p e r t i e s of molecules' have been known f o r a long t i m e . The success fu l e x p l o i t a t i o n of luminescence had t o wa i t , however, u n t i l o t h e r a r e a s o f technology were s u f f i c i e n t - l y advanced t o p e r m i t t h e observa t ion and measurement i n a c o n t r o l l e d and q u a n t i t a t i v e manner.
That f luorescence and phosphorescence techniques a r e being accepted r a p i d l y i n a l l a r e a s of a n a l y t i c a l chemis t ry i s emphasized by r e f e r r i n g t o t h e 1964 and 1966 Ana ly t i ca l Chemistry Annual Reviews'" covering t h e four-year per iod from December 1961 t o December 1965, i n which 1,049 r e fe rences t o a l a r g e v a r i e t y of a n a l y t i c a l a p p l i c a t i o n s o f f luorescence and phosphorescence are contained.
Before proceeding i n t o the d i scuss ion of s p e c i f i c app l i ca t ions o f f luorescence and phosphorescence, t h e r eLa t ionsh ip of t h e s e phen- omenon t o each o t h e r and t h e absorp t ion process should be shown (Fig. 1).
determine two d i f f e r e n t k inds of s p e c t r a (Fig. 2 ) . The d i f f e r e n c e between t h e s e two s p e c t r a is t h a t t h e emission spectrum i s obtained by s p e c t r a l l y record ing t h e l i g h t emi t ted from a sample wh i l e being exc i t ed by some s e l e c t e d wavelength of l i g h t . An e x c i t a t i o n spectrum on t h e o t h e r hand i s obta ined by measuring t h e i n t e n s i t y of emit ted r a d i a t i o n from a sample a t a s p e c i f i c wavelength a s t h e e x c i t a t i o n l i g h t is v a r i e d cont inuously.
I n both f luo rescence and phosphorescence spectroscopy one may
For example, F igure 3 , t h e abso rp t ion spectrum of a 1 ppm anthracene s o l u t i o n , and Figure 4, t h e e x c i t a t i o n and emission s p e c t r a of t h e same sample, show g r e a t s t r u c t u r a l s i m i l a r i t y . The emission bands a r e a l l a t longer wavelength than the abso rp t ion band, b u t t h e e x c i t a t i o n bands f a l l a t e x a c t l y the same wavelength a s t h e absorption bands.' A s i g n i f i c a n t p o i n t i s t h a t t h e e x c i t a t i o n spectrum of a mole- c u l e g ives the same in format ion a s i t s abso rp t ion spectrum.
I
278.
. . .. . .. . . . . . -A. -i ... .. __ . - _ _ "_ :-.--A L L Z i i V L-? -1 -I .. i. .- ._._- L-,-cl;>/ :.-. - L A - 5 c*-.::.[L:A 1, ' . . . .. .
ti i: a t iv e l y i P 2 i n a be;-.z?ze-qr?e matrix.
i n iris z.-. tk r zc e:. s e:. d : 32 5.a 1 en e a t 1 ow c G:: c e:-::: a t ioii Y T:-.a - - - = - L;.-t.t: Emmatic types represent t ne
majority ;f aronat ic moleccl*s i n f - ~ e l e . . .
Ex3erimental
All standard s m p l e s were pr2:jzed using reagent grade anthra- cene and naphthalene a f t e r rec,rygt&;lization from a sa tura ted hydro- carbon. The matrix was made fron + '50 /50 volune/volume mixture of to l - ' uene and o-xylene, spec t roqual i ty fzs;:: :*:atheson, Coleman and Bell.
The s?ectra were run oa a ~Lia~hi-Perl<in-Elmer MPP-2A Fluores- cence Spectrophotometer. High quali-cy, low-fluoresc,ence, s i l i c a saiiple c e l l s w e r e used f o r obtaining the data .
3isccssion of Results
A sample containing 10 ppm naphthalene and 10 ppm anthracene i n the matrix was prepared and the q u a l i t a t i v e emission spec t ra of t he sample determined a t severa l exc i ta t ion wavelengths. Figure 5 shows the emission spec t r a obtained from the sample exci ted a t 270mw and a t 280mi;. The pr inc ipa l eniss ion, Spectrum A , i s observed i n the region between 360 and 440mw, wit;? a low i n t e n s i t y emission band i n the 300 t o 3 4 0 ~ range. The emission between 380 and 44Qmw a r i s e s from the anthracene whereas t h a t i n t h e 300 t o 340mw region a r i s e s from the naphthalene. Spectrum B i n +Ais f igu re was taken from the sample without reiioving it from the instrument. The only change was the exc i ta t ion wavelength from 270 t o 2 8 0 ~ . Some ra the r dramatic changes in the spectrum a re evident. The ove ra l l i n t ens i ty of both band systems has been increased g rea t ly and the r a t i o of t he naphthalene t o anthracene emission has completely reversed. It is apparent from t h i s spectrum t h a t one could e a s i l y determine the concentration of each of these components independently of t he o ther i n t h i s aromatic . matrix. One cannot do such an ana lys i s by absorption spectroscopy.
The spectrum ,shown,in Figure 6 was from the sample excited a t 2 9 0 ~ . In t h i s case t h e naphthalene in t ens i ty continued t o increase sharply, whereas the anthracene decreased. The spec t r a shown i n Figure 7 show the anthracene i n t e n s i t y increasing and the naphthalene i n t e n s i t y fading. The S p e c t r m 2- was produced by exci t ing t h e sample at 300mp whereas Spectrum B was pzoduced by the 310mp exc i ta t ion .
The series of spec t r a sl-.own in 'F igu re 8 w e r e run while ex- c i t i n g with 320, 330 and 340m~ exc i ta t ion respec t ive ly and i n . these spec t ra a l l evidence of naphthalene presence was l o s t . The s igni f - icance of the behaviour noted i n Z'igures 6, 7 and 8 is t h a t one C a n take a n ix ture of a rona t i c hydrocarSoas and produce d i f f e r e n t . s p e c t r a dependent on the wavelength of exc i ta t ion . p r i a t e exc i ta t ion wavelengths, one can emphasize the presence of one component r e l a t i v e t o the o thers aiid i n many cases completely el iminate the appearance of any component o ther than the one of s p e c i f i c i n t e re s t .
By choosing the appro-
O u r next po in t of concern was a b i l i t y t o se l ec t ive ly excite the three aromatic types, benzene, naphthalene and anthracene,. individ- ually. Tor t h i s experiment t he sample containing 10 ppm naphthalene anti 1 0 ppm anthracene in the o-xylene-toluene matrix was d i lu t ed 1:lOO with isooctane giving concentrations o f . 0 .1 ppm naphthalene, 0 .1 ppm ar.t;?racene and 1% o-xylene-toluene. *he . s e r i e s of three spec t ra showr.' i n i'iwres 9. 10 and 11 w e r e obtain& by exc i t ing t h i s so lu t ion with '2C, 290 m d 3 5 0 ~ . r ad ia t ion respect ively. Figure 9 shows the c i i s s i o n
279. spectrum of the benzene-type aromatics. and Figure 11 i s that of anthracene. i d e n t i f y t h e s e t h r e e a romat ic types , b u t can de termine t h e i r approximate coficentrat ion by simply a l t e r i n g t h e e x c i t a t i o n wavelength and measuring t h e emission from each aromatic type independently of t h e o t h e r s .
While t h e d a t a shown'in the preceding d i scuss iun i n d i c a t e t h e q u a l i t a t i v e a p p l i c a b i l i t y of luminescence spec t roscopy t o t h e basic types of a romat ic molecules found i n petroleum and c o a l based f u e l s , it does n o t provide an i n s i g h t i n t o t h e use fu lness o f the technique f o r q u a n t i t a t i v e a n a l y s i s . Hercules has shown t h a t luminescence i n t e n s i t y and concen t r a t ion are related as follows:
Where abc are t h e molar a b s o r p t i v i t y , cel l pa th and concen t r a t ion r e spec t ive ly : f ( 0 ) is t h e s o l i d angle o f i n t e r c e p t i o n of r a d i a t i o n by t h e d e t e c t o r : g is t h e quantum conversion f a c t o r f o r t h e de- t e c t o r which is a l h h t i o n of wavelength: I is t h e i n t e n s i t y of t h e e x c i t i n g r a d i a t i o n and Of is t h e quantum e fy ic i ency of the molecule. There a r e two concen t r a t ion regions where t h i s arrangement may be g r e a t l y s i m p l i f i e d . The one o f g r e a t e s t i n t e r e s t t o t h e a n a l y t i c a l chemist is t h e one i n which t h e concen t r a t ion of f l u o r e s c e n t m a t e r i a l s is small. I n such case abc 0.05. This allows u s t o w r i t e Equation
F igu re 1 0 i s t h a t of naphthalene One n o t on ly can q u a l i t a t i v e l y
c.
S V ) ~ = ( ~ J ~ [ ~ ) L & d t C I I - T + k BL e----* CW+II! 3.
From t h i s equat ion it may be s e e n t h a t t h e r e l a t i o n s h i p between f l u o r - escence i n t e n s i t y and concen t r a t ion w i l l b e l i n e a r through a p o i n t of maxinium ccncen t r a t ion , Cmax =0.05,where (a) i s t h e molar a b s o r p t i v i t y
of t h e compound a t t h e wavelength of e x c i t a t i o n . I t should be empha- s i z e d t h a t t h i s concen t r a t ion i s n o t t h e maxiinurn a t which u s e f u l d a t a nay b e obtained. Beyond t h i s l e v e l t h e curve r e l a t i n g f luo rescence i n t e n s i t y t o concen t r a t ion i s n o t l i n e a r . A c a l i b r a t i o n curve r e l a t i n g concen t r a t ion t o f luo rescence i n t e n s i t y can be used t o extend t h e range of u s e f u l a n a l y s i s over a t l e a s t another o rde r of magnitude.
The o t h e r extreme cond i t ion where equat ion one may be s i m p l i f i e d is t h a t of ve ry h igh concen t r a t ion o f absorb ing and e m i t t i n g molecules such t h a t the abso rp t ion o f i n c i d e n t r a d i a t i o n is almost complete. I n t h a t case, equat ion one may be reduced t o
(a)hb h
(SF)? = f[e)(#4 (3F showing t h a t t h e d e t e c t o r s i g n a l is independent of f l u o r e s c e r concen- t r a t i o n . Th i s cond i t ion is impor tan t i n determining quantum e f f i c i e n - cies f o r quantum coun te r s and s c i n t i l l a t i o n counters . Analys is under t h e s e cond i t ions is most e f f e c t i v e l y done by us ing f r o n t s u r f a c e i l lum- i n a t i o n and viewing of t h e sample. With t h i s geometry, p e n e t r a t i o n e f f e c t s and s e l f - a b s o r p t i o n problems a r e minimized. T h i s geometry is g e n e r a l l y r e q u i r e d when t h e f luo rescence o r phosphorescence spectrum o f a s o l i d , opaque o r h i g h l y t u r b i d sample is analysed. Using t h e f r o n t s u r f a c e viewing geometry even raw crude o i l samples may be e x c i t e d and t h e i r lumincscence observed.
As i n d i c a t e d by t h e terms i n Equation (1) there is an i n t e r - mediate concen t r a t ion range f o r each absorber and f l u o r e s c e r a t which t h e i n t e n s i t y Concent ra t ion r e l a t i o n s h i p w i l l become non l inea r . One g e n e r a l l y observes t h a t t h e f luo rescence i n t e n s i t y approaches a l i m i t - i n g va lue as the concen t r a t ion is increased. The p r i n c i p a l p recau t ion ,
I
280.
. . t;:iea Cor 'cr,un;i.:l.h.tive analysis
is t o r e a l i z e t ; ia t there is c rar.5.e akwe which the coilcentration in- ' icnsity curve w l i l becone noni inear , a d i f it i s rccpircd t o work i n < , t he nonl inear region, a s u f f i c i e n t nurber of standard po.ints be taken t o 'accurately descr ibe t h e i n t e n s i t y concentration curve.
0
I1 naphthalene and anthracene i n Figures 1 2 and 13. were prepared in, 0-xylene-tolaene ixGkrix. anthracene. The anthracene s-kandazds v7c're prepared i n t h e same matrix I
and each containeci 10 ppmof naphthtie5e. The curves ar,e practical-ly l i n e a r i n t h e lower concentrat ion range; but begin, t o , deviate 'from--- \
l i n e a r i t y a t the higher _ _ . . -' .. .., - .,_ .i ..Lsa~~+.:.- p 3 i n t s be t aken I
I n order f o r a m e ~ e r r e n t ' technique ..to benusefub .for quanti-
! - . cLiL-L, i.., ._ ..~-.~. . . - -" -. L:&-LL;-2s
. . . , - . . . . - . . __- - . Curves showing the i n t e n s i t y . concentration r e l a t ionsh ip for
The aaphthalene s tandards Each contained 10 ppm
of the range. . , ';c >,,<> 1' , 'I' . .
' t a t i v e ana lys i s , s t a b i l i t y of t h e measurement system must be such t h a t good. r epea tab i l i t y ' is .possible. .-UnfortunaLolyy !tliecfeeXs,ngcexists. . that fluorescence measurement is :imprecise..; Admittedly. , .r th~,~lhasl b e e n i a ~ d s tr.uc ~n.~m~y-icases,-bu~oi. t-waS:;aniequipment r , a ~ i e r o ~ ~ . r j a c i t B e h ~ ~ ~ e 1 inkta-tiolit. t h ree s p e c t r , a ;of ,a' 10 p2b ariithr,gcene - s ~ ~ p l e ~ ~ ~ e c s u p e ~ i m ~ ~ s ~ ~ ~ c ~ O ~ e l l y i?ould :be .:h tiidpress ea cto. cshow, :bet te r ..r.qp+atab i b 5 Q t i J b ~ o a r i ~ v d e r from analyi;ic+it;technique; : &-r.< 0: the L-L.:CC~
{ I E iyur,e -14- :..shows ;;in ;.exiUTipl e,of pxc:gl.l-edt inep&atab$l?ityfr i x
. ' '--~,cr.t techr:ic,Jc to be u s e f u l for quanti- .- L ~ . C r . ~ ~ ? ~ . r c . . e n t system must be .such
., L i L . a i . n e s . c c n c e ' s p c c t r o s c o ~ ~ ~ ~ a s b r ~ o ~ d , r a p p l . i . c a k l o ~ h $ n f ~ e i a r 3 a ~ . ~ ~ t s : s . of I . f u Q l s r ,anacl.el.a~eb,pr,oducts.. lsA1k;aronabic ty:pes.tar;~ysubidcthto been analyd is 1 b y fluorescencd ;or:.phosphocdscencerc::Lt.~i-is.nppss~i~1.c~b~q~s,ing thc incr men t a l exc i ta t ion . . technique *,to OWiairi ;.Spectra. cof aeaklildrcpat i c tyae c s i q l e t e l y i n d e p c r , j c n . ~ r . o ~ r t h e : . o t h e r s ~ l p r e s e n ~ u ~ n d ~ . ~ t ~ e ~ ~ f o r ~ ~ ~ ~ o r e e f f e c t i v e l y -a?alyzedfoc co2qonents ;-of imixtur,e5 i t s by any other
~ . ,. :i .. L C L L 2 1
281.
Bibl ioqraphy
1. I. B. Berlman, "Handbook of Fluorescence Spec t r a of Aromatic Molecules"
2. J. Herschel , P h i l . Trans. Roy. SOC. (London) 135, 143 (1845). 3. G. G. Stokes, P h i l . Trans. Roy. SOC. (London) 142, 463 (1852). 4. E. Wiedeman and .G. C. Schmidt, Ann. Physik. , 56, 18 (1895). 5. J. Sta rk and R. Meyer, Physik. 2. 8,250 (1907). 6. E. Lommel, PocJg. Ann. 160, 75 (1877). 7. E. L. Nichols and E'. Merrit, Phys. Rev. 31, 376 (1910). 8. C. E. White, Ana ly t i ca l Chemistry Annual Reviews, Part One, 116R, 1964. 9. C. E. White, Ana ly t i ca l Chemistry Annual Reviews, 1 5 5 R , 1966. 10. D. M. Hercules : Ana ly t i ca l Chemistry, 38, 29A, 1966.
p. 2, Academic P res s , New York, 1965. I
3 1' 1 I/

I:I
1 la
I I I I I I I
0 a >
I I m a - 0
>
..: .. . . .. . :
.. - .
. . . . . I I . . ' . . . . .
I . ' : *. . .
283.
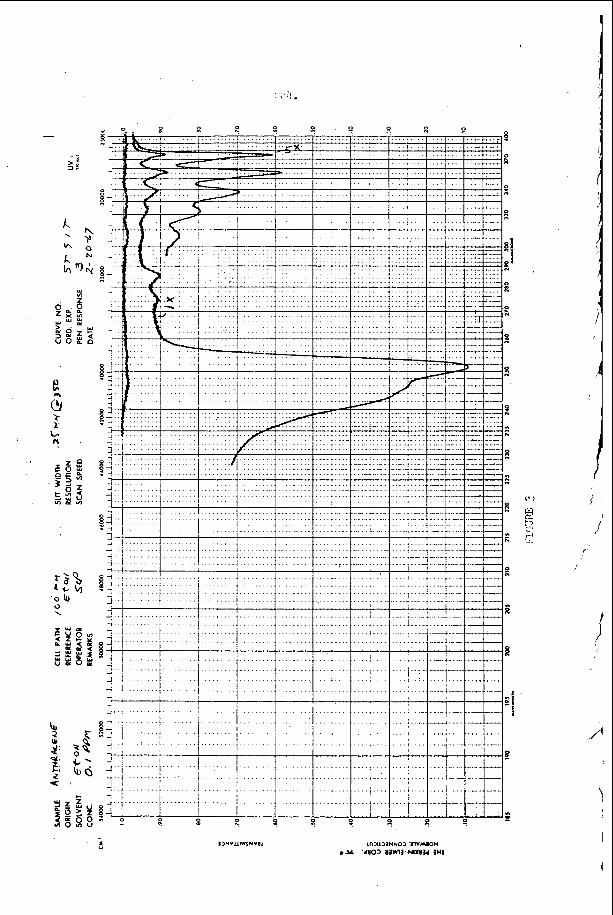
a
2 Y
U
R i;;
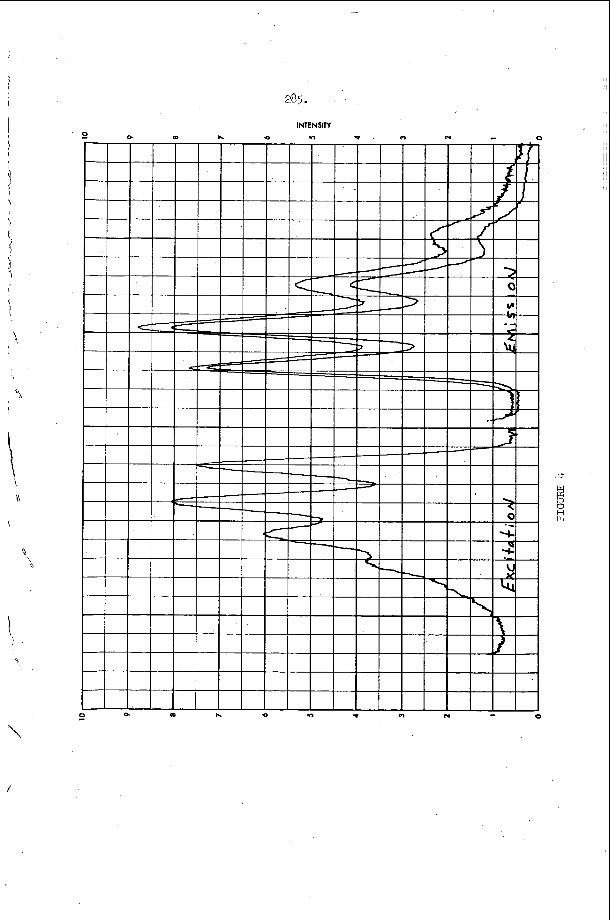
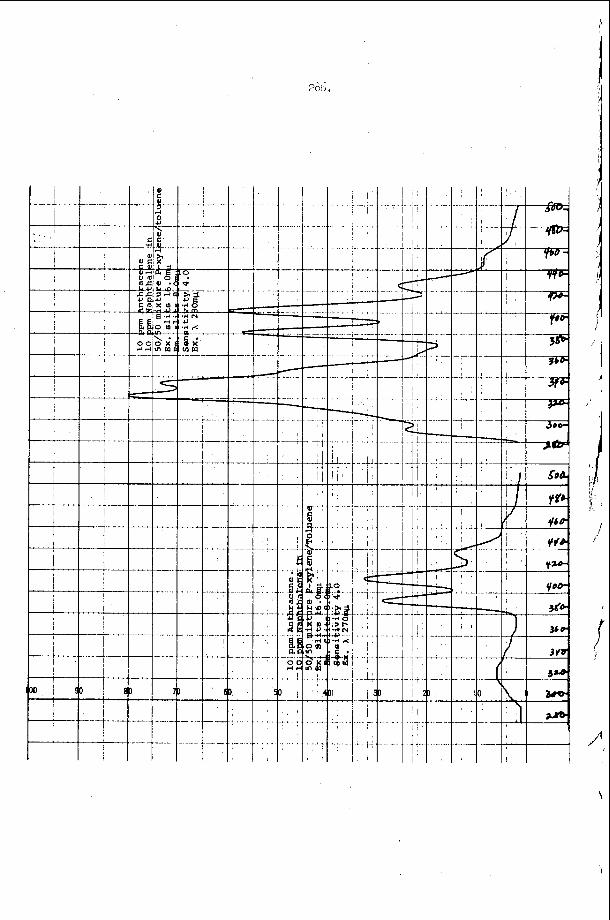
-.. 0
P
.
P
I
.
-- --
......
I ---
.....
.--.
.....
d
. . . .
.....
I
. . .
. . _
. . .
-- .
.
- 1 ...... ."
I .-. -. ' i --- ..... , I
I i 1 ...... t i
. -.. I
- .. ._
. __
- . I
.--I-. !
. . . . . . A ........ ... .-,+ - ..........
t-:.
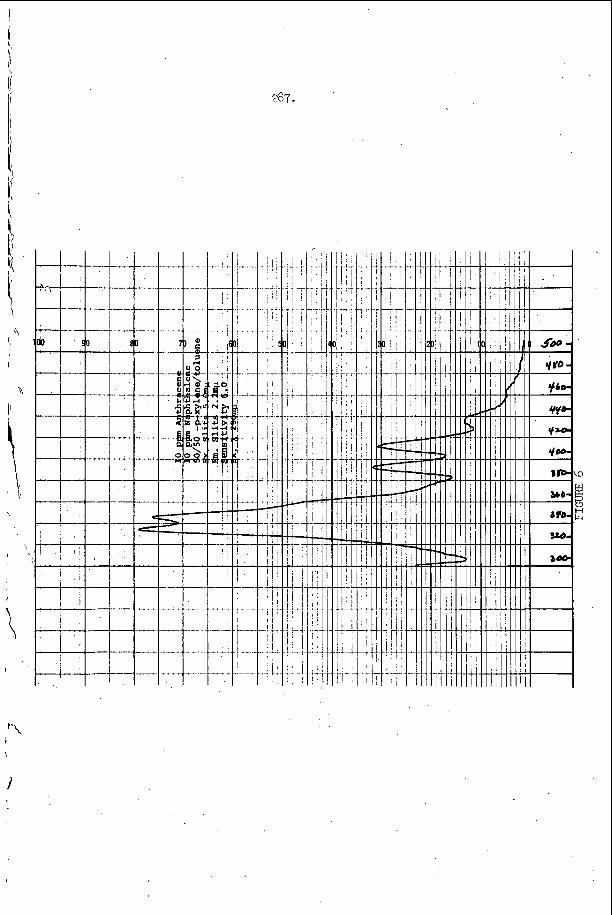
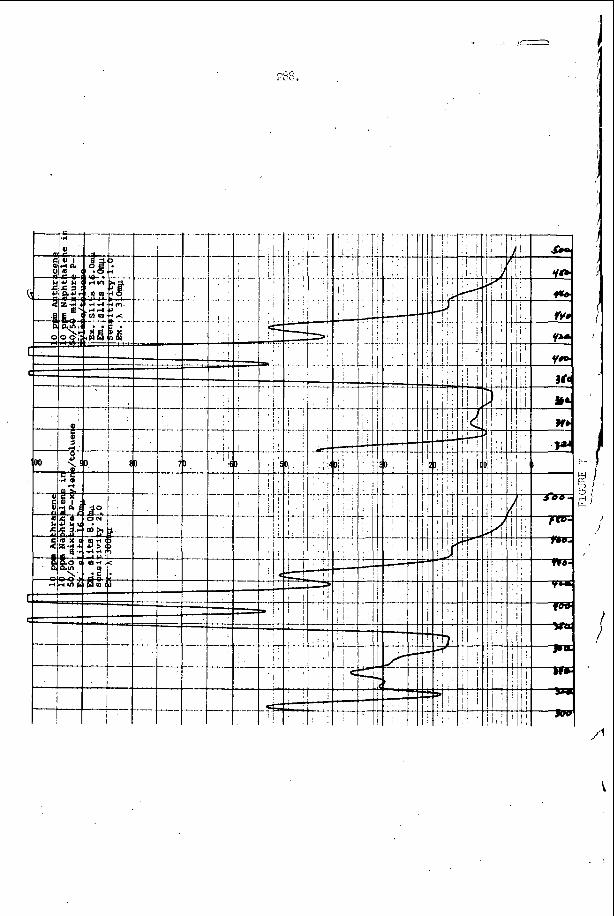
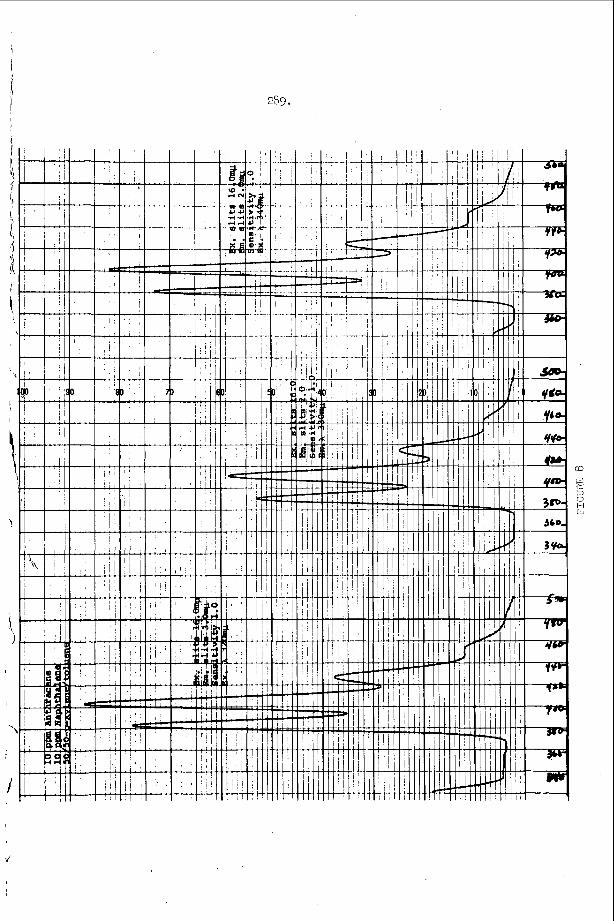
289.
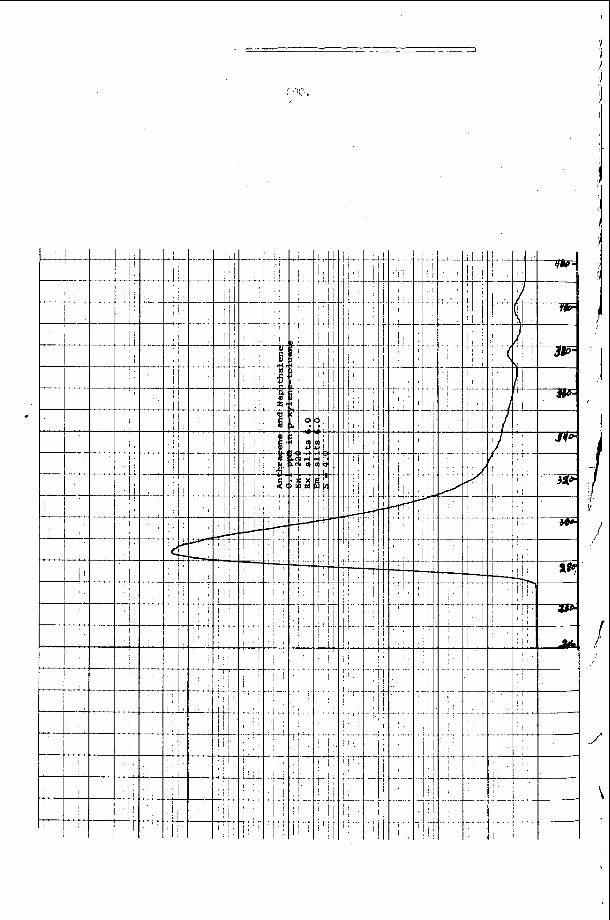
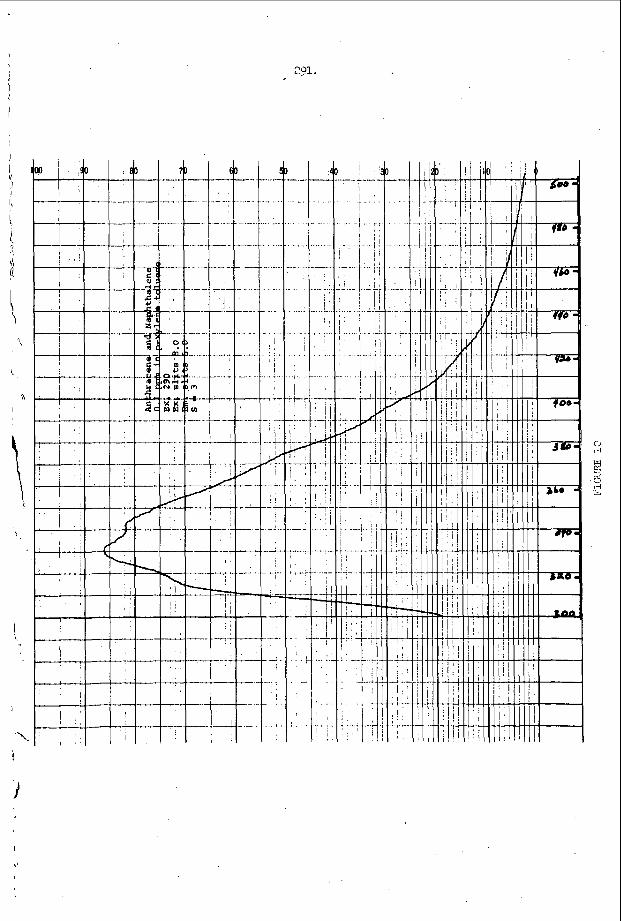
. . .
~ ' I -7- t---- '.' ' 1 . ' ' .
I '
... .I ..
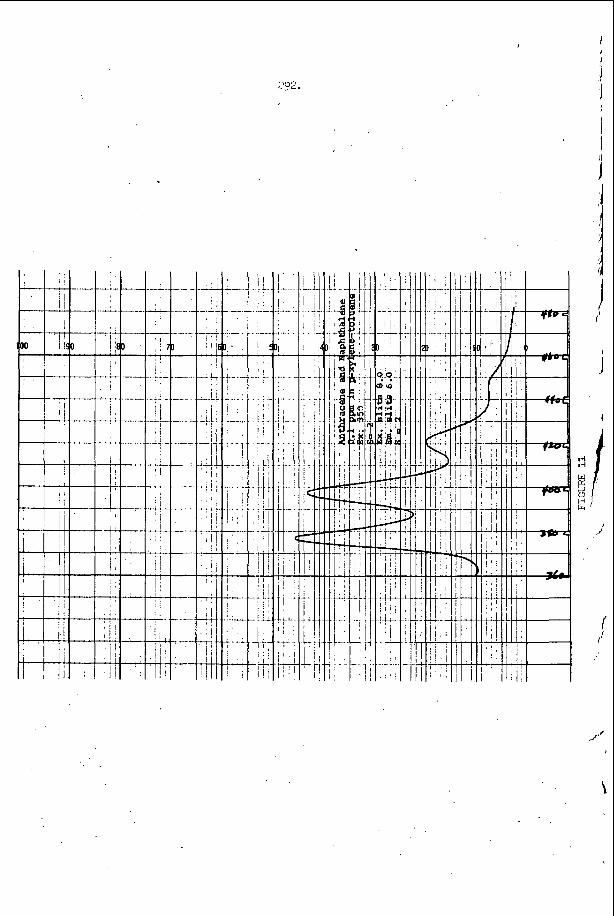
I I
J
. .
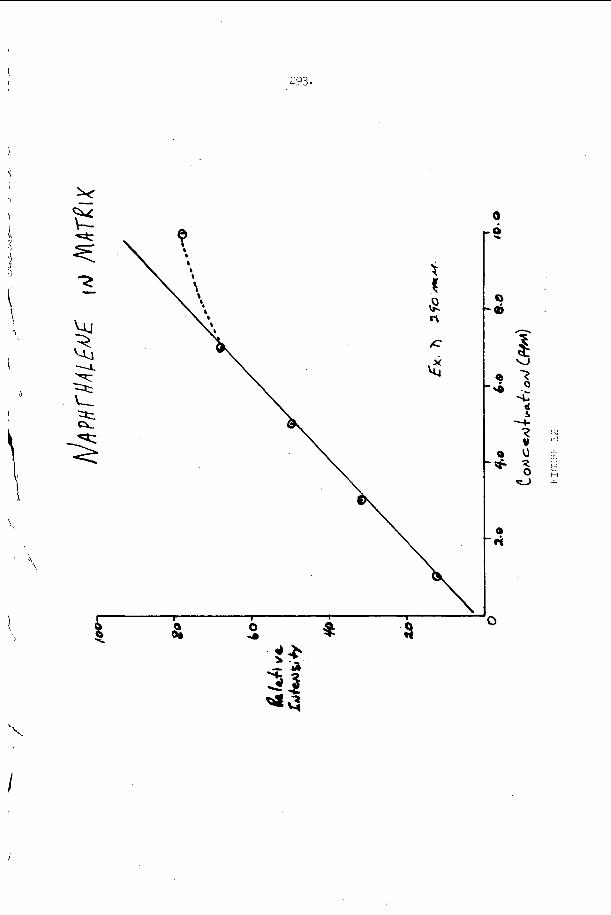
\
!
\ t
0 ?
0 ,ai
3
I
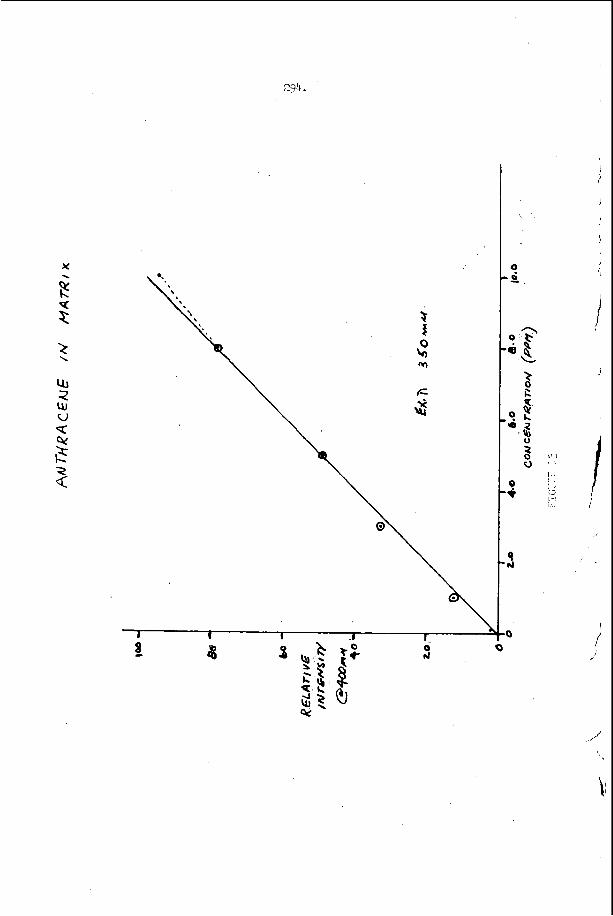
294.
Y . E i
I
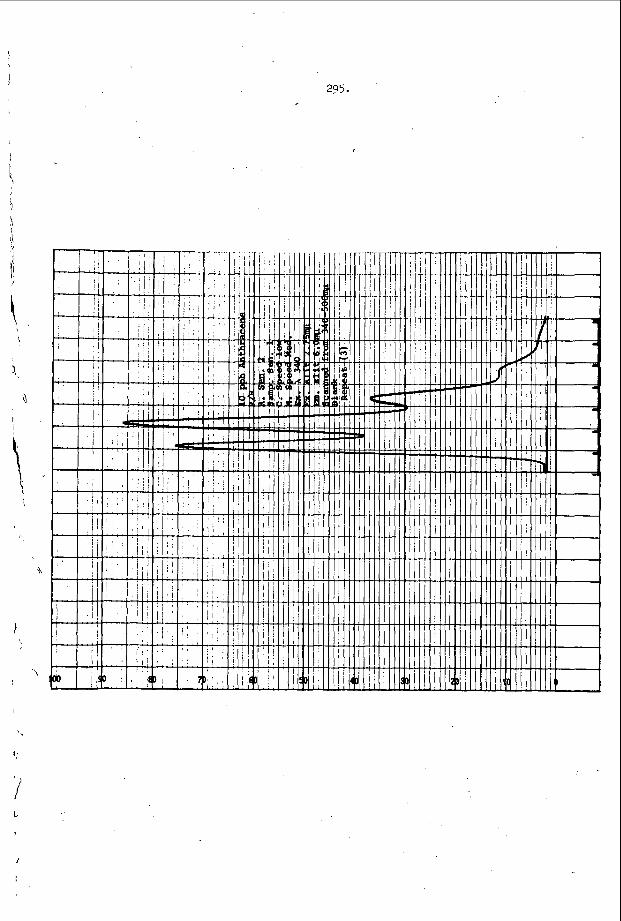
296. DOUBLE RESONANCE MODUIATED MICRWAVE SPECTRasCOPY
G. We F W , 0. StlefVater, and Re Volpicelli
Research Systems Inc., 236 Grime St., l;e9Lagton, Mass.
I. Introduct ion A l a rge number of molecular systems which have nieasurzble
vapor pressures a t d r y i c e o r room temperature can be studied by microwave spectroscopy. In general i t i s necessary t h a t these molecules possess a permanent d ipole moment (usual ly g r e a t e r than 0.1 Debye) and have r o t a t i o n a l s t a t e s with energy l e v e l spacings which correspond t o frequencies-.ri the microwave s p e c t r a l range (8-40 GHz, or 0.29 - 1.33 cm ) . Most moleculesllhave been s tudied in t h e microwave range with a "standard Hughes and I.lilson Stark-modulated spectrometer. I n t h i s sytem the molecule i s placed 1.n a waveguide c e l l a t a pressure of 10-100 c: o f Hg. 1-licrowave r a d i a t i o n is passed through the c e l l and absorbed by the molecular system a t f requencies corresponding t o the energy l e v e l separat ions of c e r t a i n p a i r s of r o t a t i o n a l s t a t e s . It i s important t o rez l ize t h a t t h i s resonance absorpt ion f o r l e v e l s i, j w i t h
(where E E a r e the energ ies of s t a t e s i , J md h LsPlanck's cons tan t ) involves only two levels(we neglect here poss ib le overlap between two or more t r a n s i t i o n s and degeneracies). I n order t o enhance the s e n s i t i v i t y f o r de tec t ion of the absorbed rnicror.:ave rad ia t ion , a l a r g e e l e c t r i c f i e l d (0-200OV/cni) 1s appl ied to the gas i n the c e l l . The i n t e r a c t i o n of the molecular d i p o l e moment with t h i s f i e l d causes a s h i f t i n t h e r o t a t i o n a l energy l e v e l spacings and a consequent s h i f t In the microwave absorpt ion frequencies. The la rge e lec t r i c f i e l d i s modulated i n square wave fashion, usua l ly a t lGOKHz, and hence the absorp- t i o n of r a d i a t i o n i s a l s o modulated a t the same frequency and can be de tec ted with a phase s e n s i t i v e de tec tor .
The standard S t a r k spectrometer can be character ized a s a s i n g l e resonance device beczuse i t involves the resonant absorp t ion f o r only a single l i n e (one p a i r of r o t a t i o n a l energy l e v e l s ) . It is a l s o poss ib le t o simultaneously i r r a d i a t e a gaseous system with two rn1crov;ave r a d i a t i o n f i e l d s with frequencies corresponding t o two d i f f e r e n t r o t a t i o n a l resonances of the 2-4 molecule. in S t a r k modulated spectrometers where the basic detect ion scheme s t i l l involves the molecular S t a r k e f f e c t . However, when two microwave f i e l d s are appl ied to a gaseous sample, It I S poss ib le t o e l imina te the standard high voltage Stark modulated c e l l by modulating one of the microwave f i e l d s Instead. This l a s t spectroscopic scheme has been character ized a s double resonance modulated microwave spectroscopy and cons t i tu tes the Rain concern of t h i s a b s t r a c t .
i' J E -E. = h V i j i J
Such experiments have been pursued by severa l authors
5,6
297.
11. The ore t i c a l Considerations
resonance l i n e s a r e pressure broadened. The average l i f e t h e Of' a r o t a t i o n a l s t a t e is taken as the niean time between col- l i s i o n s . only three r o t a t i o n a l energy l e v e l s , 1, 2, 3 with energies E,cE2<E3 a r e considered. 2+3 a r e assumed t o be allowed with dipole moment matrix elements
p12 23 Two r a d i a t i o n f ie lds are ,a l l?ued t o impinge upon t h e gaseous semple, a s t rong f i e l d E = EOcosw't and a weak f i e l d E = Eo C O S 3 t with 9' near ILI' and rn near w
f igure l a ) T is defined t o be the average c o l l i s i o n l i fe t ime f o r the s t a t e s 1, 2, 3 and nl, n2* n3 a r e the number cf molecules per cm3 in s t a t e s 1, 2, 3 for the gas a t thermal equilibrium.
The t h e o r e t i c a l treatiaent used here assurries t h a t the
The t r a n s i t i o n s 1+2 and
' and U and resonance frequencies U.'O = 2nvl2, wo = 2nv23.
b u t 1w'-a1> IGHz. (See 0 0
It is u s e f u l t o def ine the parameters x = (P E )/(2h) and 23 0 Y = (Pl2E;)/(2h)* .
A l l double resonance experkients of i n t e r e s t In t h i s work ?re such t h a t the t r a n s i t i o n s induced by the f i e l d s E and E occur between p a i r s of r o t a t i o n a l l e v e l s which have ore co:irT.ion energy l e v e l (%.e. l e v e l 2 for 1 -* 2, 2 -* 3) . The paver in the r a d i a t i o n f i e ld E ' is taken t o be s u f f i c i e n t t o "sa tura te the t r a n s i t i o n 1 -+ 2. T h i s is equivalent t o saying 1 Y1 2 ~ 2 > > 1 . so low that the 2 + 3 t r a n s i t i o n is not ( 1 X 1 7 G I ) . Physically, s a t u r a t i o n corresponds t o a s i t u a t i o n where the r a t e of t r a n s i t i o n s induced by a r a d i a t i o n f i e l d between two l e v e l s i s s u c h t h a t the population difference between the l e v e l s involved i n the t r a n s i t i o n i s no longer described by the thermal e q u i l i b r i u m value.
spectroscopy are: (1) the s t rong (high power) f i e l d E i s used t o modulate the gaseous molecular sample by i n t e r a c t i n g w i t 4 the energy l e v e l s 1 and 2; (2) the modulation produced by E c iuses small b u t r e a d i l y de tec tab le changes i n the absorption of r a d i a t i o n from the weak f ie ld E by t r a n s i t i o n s between the l e v e l s 2 and 3; (3) the s i g n a l detected c o n s i s t s e s s e n t i a l l y of the Tower absorbed from the weak f i e l d E; (4) t h e s t rong f i e l d E detected.
The power In E howexer is assumed t o be saturated' '
2 2
The main f e a t u r e s of microwave modulated double resonance
i s blocked from the c r y s t a l rece iver and is never
Javan7 I n a c l a s s i c paper has given a mathematical de- s c r i p t i o n of a th ree l e v e l system i n t e r a c t i n g with two r a d i a t i o n f i e l d s . The theory i s d i r e c t l y appl icable t o microwave double resonance b u t the mathematical d e t a i l s a r e too complex t o present here. Therefore only a very q u a l i t a t i v e and I n t u i t i v e descr ip t ion w i l l be given i n what follows.
298.
For weak r a d i a t i o n f i e l d s i t i s genera l ly t rue t h a t only s i n g l e quantum t r a n s i t i o n s can take place In a molecular system due t o absorpt ion of rad ia t ion . Thus a niolecule c a n a s o r b a photon from f i e l d E 2nd go from s ta te 2 t;o s t a t e 3. In the presence of a very large f i e l d such a s E a t the 1 -+ 2 molecular resonance frequency and a weaker f i e l d E a t the 2 3 3 molecular resonance frequency, it i s possible f o r a molecule i n s t a t e 1 t o simultaneously absorb a photon from both E' and E and make a t r a n s i t i o n t o s t a t e 3 d i r e c t l y v i a a double quantum transi t ion. Such t r a n s i t i o n s a r e allowed que t o the s t rong quantum mechanical mixing of s t a t e s 1 and 2 by E . I n a double resonance experiment the power absorbed from E c o n s i s t s of two terms: absorbed by molecules making the usual s i n g l e quantum t rans i t ion 2 -f 3; ( 2 ) power absorbed by molecules making a two quantum Jump from 1 -+ 3.
I n a,microwave modulate'd double resonance spectrometer the f i e l d E is square wave modulated between the values E'= Ehcosu't
f o r power l e v e l s i n the E f i e l d of the order of one watt o r less, E ' = EA cos x 2 t genera l ly has only a small e f f e c t on the molecular system because poss ib le t o take E = 0 f o r ha l f the square wave cycle without introducing much error .8 If phave s e n s i t i v e de tec t ion lacked t o the modulation frequency of E is used t o d e t e c t the power absorbedfrom E, the power absorbed from E during the E = 0 h a l f of the modulation cyc le w i l l be e s s e n t i a l l y ident ica l t o an drdinary ?ingl$ resonance absorption. dWMg the E resonance shape predic ted by Javan's theory.
Pressure Dependence and I n t e n s i t y of Double Resonance Signal
(1) power
= IU' and la2' - - LU ' I = 2WHz. I n such a s i tua t ion , 0'
f
I 1 is so far from wo. Thus It is
1 2
The power absorbed = Eg C O S a t h a l f cyc le w i l l have t h e double 0
-In. - I n the case where E ' i s only an 0.1 w a t t f i e l d a t the
J=O-1 resonance frequency t h e l ineshape f o r t h e OCS J=1-2 transition w i l l have ttfe appearance shovrn i n f igure l b . the s i g n a l height" S w i l l decrease and the " l i n e width" w i l l Increase i n a somewhat complex rnanner.9
As the pressure Increases
" 1 f l
Usin# a computer t o simulate l i n e shapes in 02.9, the . h e i n t e n s i t y S f o r the J d + 2 t r a n s i t i o n w i t h an 0.1 Watt pump .eld a t the J=O-1 resonance frequency has been determined a8 a
funct ion of pressure. These c a l c u l a t i o n s correspond t o the line shape shown i n f igure l b . A t a b l e of S versus pressure and 7 I s given i n Table 1 below for t h i s case. -
* Table 1 . s P
3.15 2 3.19 10 .3.03 20
. 1.05 100 0 248 0.77 200 0.124
(sec x710 4) 12.40 2.48 1.24
( a r b i t r a r y u n i t s ) (p of Hg)
*Av = 12 I ~ I z / ~ , f u l l width a t h a l f height , see ref.--&?...: 1 ._,_,- ......
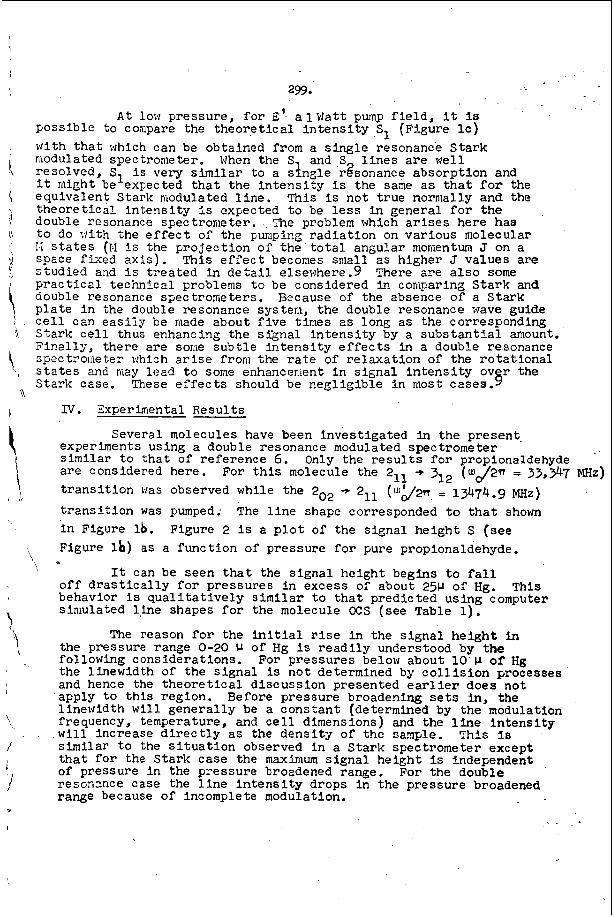
\
. . . . 299.
A t low pressure, f o r E'- a lWat t pump f i e l d , i t is poss ib le t o compare the theo re t i ca l i n t e n s i t y ,S1 (Figure I C ) with t h a t which can be obtained from a s ing le resonance S ta rk modulated spectrometer. When the S and ,S l i n e s a r e well resolved, S1 i s very s i m i l a r t o a s?ingle rgsonance absorpt ion and it might be expected t h a t the i n t e n s i t y is, the same as tha t for the equivalent Stark modulated l i n e . This is not t rue normally and the theo re t i ca l i n t e n s i t y i s expected to be iess in general f o r the double resonance spectrometer. .. The problem which a r i s e s here has t o do x i t h the e f f e c t of the puriiping r ad ia t ion on var ious molecular 1.i s t a t e s (I.1 is the p ro jec t ion of the t o t a l angular monientum J on a space f k e d axis). This e f f e c t becomes small as higher J va lues a r e s t u d i e d and i s tFeated in d e t a i l elsewhere.9 There a r e a l s o some Frac t i c a l t echnica l problems t o be considered in comparing S ta rk and aouble resonance spectrometers. Because of the absence of a S ta rk p l a t e i n the double resonance systerii, the double resonance wave guide c e l l cEn e a s i i y be made about f i v e times 2s long a s the corresponding Stark c e l l thus efihancing the si'gnal i n t e n s i t y by a s u b s t a n t i a l amount. F ina l ly , there a r e some sub t l e i f i t ens i ty e f f e c t s i n a double re.sonance spec tyoiiieter which a r i s e frorii the r a t e of r e l axa t ion of t he r o t a t i o n a l s t a t e s and may lead t o Solie enhancmient i n s igna l i n t e n s i t y ov r the Stark case. These e f f e c t s should be neg l ig ib l e i n most cases . 5
IV. Sxperinrental R e s u l t s
experiments using a double resonance modulated spectrometer similar t o t h a t of re fe rence 6. a r e considered here. t r a n s i t i o n kcas observed while the 202 -+ 211 ( U 9 2 n = 13474.9 M H Z )
t r a n s i t i o n was pumped; The l i n e shape corresponded t o t h a t shown In Figure I b . Figure 16) a s a func t ion of p r e s s u r e f o r pure propionaldehyde.
It can be seen t h a t t h e s igna l he ight begins t o f a l l off d r a s t i c a l l y f o r pressures i n excess of about 2511 of Hg. behavior i s q u a l i t a t i v e l y s i m i l a r t o t ha t predicted using computer. siniulated 1,lne shapes for the molecule OCS (see Table 1).
Several molecules have been inves t iga ted in the present.
Only the r e s u l t s for propionaldehyde For t h i s molecule the 211 + 312 ("@ = 33,347 MHZ)
Figure 2 i s a p l o t of the s igna l he igh t S (see
\ e
This
The reason for the i n i t i a l r ise i n the s igna l height in the pressure range 0-20 CI of Hg i s r e a d i l y understood by the following considerat ions. For pressures below about 10 CI of Hg the l inewidth of the s igna l is not determined by c o l l i s i o n processes and hence the t h e o r e t i c a l d i scuss ion presented ear l ie r does not apply t o t h i s region. Before pressure broadening s e t s i n , the l inewidth will genera l ly be a cons tan t (determined by the modulation frequency, temperature, and c e l l dimensions) and the l ine i n t e n s i t y
s imi l a r t o the s i t u a t i o n observed i n a S tark spectrometer except that f o r the S tark case the maximum s igna l he ight i s independent of pressure i n the pressure broadened range. resonznce case the l i n e i n t e n s i t y drops i n the pressure broadened range because of incomplete modulation.
"\ 1
. w i l l increase d i r e c t l y as the dens i tg of the smple. This I s '\ /
For the double
7
I
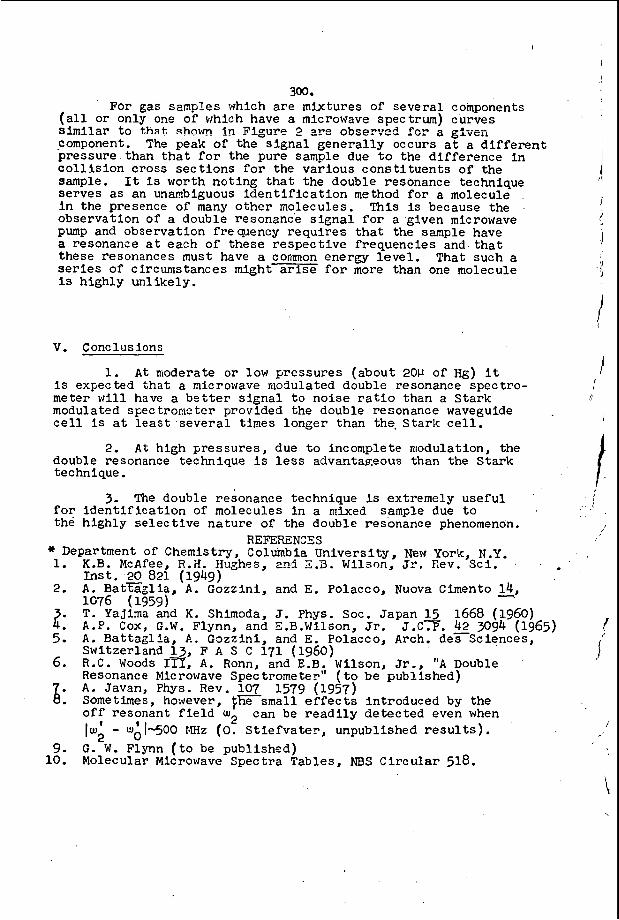
I
300. For gas semljles which a r e mixtures of several components
( a l l o r only one of which have a microwave spectrum) curves Similar t o that shown In Figi~re 2 =re &ser~.~ed f e r component. The peak of the s i g n a l genera l ly occurs a t a d i f f e r e n t pressure than t h a t for the pure sample due t o the d i f fe rence In c o l l i s i o n cross sec t ions f o r the var ious c o n s t i t u e n t s of the sample. It i s worth not ing t h a t the double resonance technique serves a s an unambiguous i d e n t i f i c a t i o n method for a molecule i n the presence of many o ther molecules. This i s because the observation of a double resonznce s i g n a l f o r a given microwave pump and observation frecpency r e q u i r e s t h a t the sample have a resonance a t each of these respec t ive frequencies and t h a t these resonances must have a cormon energy l e v e l . That such a series of circumstances might a r i s e for more than one molecule is highly unl ikely.
g:t.efi
V. Conclusions
1. A t moderate o r low pressures (about 20cI of Hg) it is expected tha t a microwave modulated double resonance spectro- meter will have a b e t t e r s i g n a l t o noise ra t io than a S tark modulated spec trorneter provided the double resonance waveguide c e l l i s a t l e a s t severa l times longer than the. S ta rk c e l l .
double resonance technique is less advantageous than the Stark technique.
2. A t high pressures , due t o incomplete modulation, the
1.
2.
2:
8:
5. 6.
9. 10.
3. The double resonance technique Is extremely u s e f u l f o r i d e n t i f i c a t i o n of molecules i n a mixed sample due t o the highly s e l e c t i v e nature of the double resonance phenomenon.
REFEFENZES * Department of Chemistry, Columbia University, New York, N.Y. K.B. McAfee, R.H. Hughes, a 1 X . 3 . Wilson, E. Rev. Sc i . I n s t . 20 821 (1949) A . B a t E g l i a , A. Gozzini, and E. Polacco, Nuova Cimento 14, 1076 (1959) _- ~, T.'Yajima and K. Shimoda, J. Phys. SOC. Japan 15 1668 (1960) A.P. Cox, G.W. Flynn, and E.B.Wilson, Jr. A . Bat tag l ia , A . Gozzini, and E. Polacco, Arch. des Sciences, Switzerland z, F A S C 171 (1960) R.C. Woods 111, A. Ronn, and E.B. Wilson, Jr., "A Double Resonance Microwave Spectrometer" ( t o be published) A. Javan, Phys. Rev. 107 1579 (1957) Sometimes, however, t h e s m a l l e f f e c t s introduced by the off resonant f i e l d u2 1.; - W; 1-00 KHz (0. S t i e f v a t e r , unpublished r e s u l t s ) .
G. W. Flynn ( t o be published) Molecular Microwave Spectra Tables, NBS Circular 518.
J.C.P. 2 3094 (1965)
i
can be r e a d i l y detected even when /
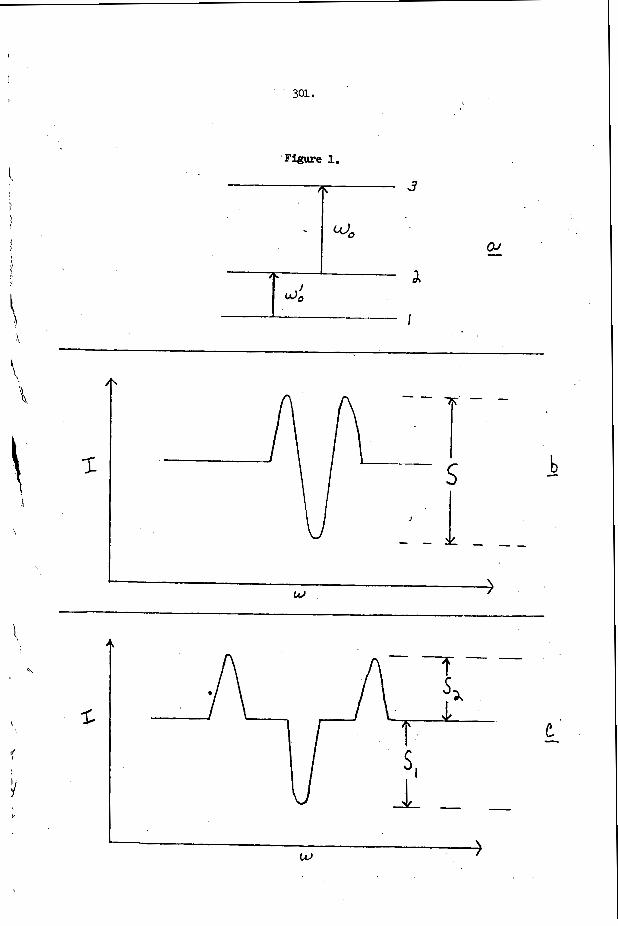
301.
i a
'\
\
!
li t.
- -
J
W 3
L T sx
--
T -
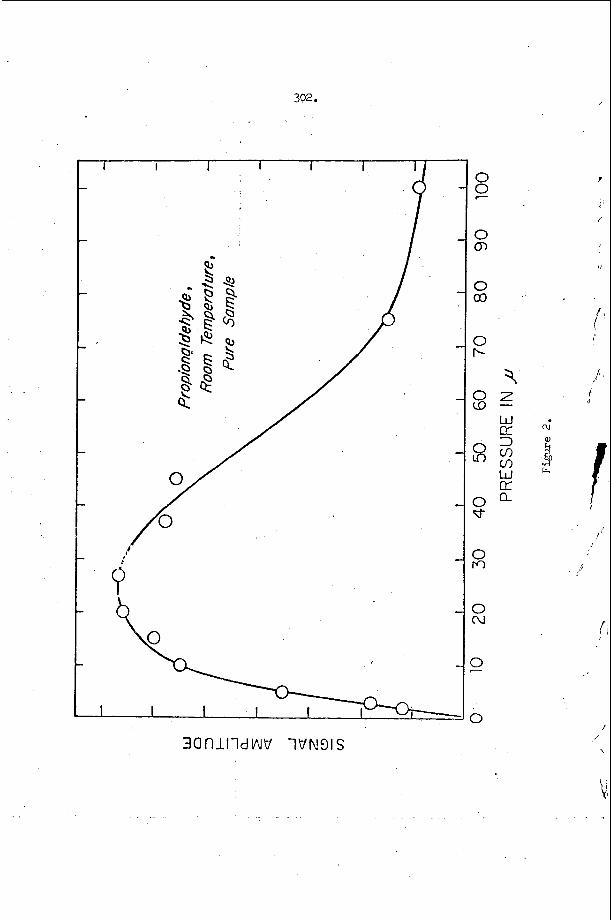
302.
i
,
.
INVESTIGATIONS I N NQR SPECTROSCOPY
W i l l i a m L. T r u e t t
Wilks S c i e n t i f i c Corporation, So. Nowalk, Conn.
NQR Spectroscopy r e f e r s t o t h a t branch of spectroscopy i n which energy i s absorbed by var ious atomic n u c l e i i n t h e region from 1-1000 Mc/s. A f u l l and e x c e l l e n t discussion of a l l the t h e o r e t i c a l and experimental aspec ts of t h e sub- j e c t has been #ven3;y Semin'. Amon the more i o r t a n t n u c l e i which show t h e e f f e c t a r e C 1 and V S 1 ; i n a l l 131 i so topes can absorb RF energy.
, C 1 , B r B 1 , B r 7 9 , I l g 7 , SblZ1, S 3 2 3 , A l Z 7 , N 1 4 , Ga6', Ga71,
The p r e c i s e p o s i t i o n of the absorpt ion depends upon t h e e l e c t r o n densi ty about the nucleus and the number of allowed absorpt ion bands upon the nuc lear sp in . chemically d i s t i g u i s h a b l e nucleus. the number of bands t o be expected i n the i n d i c a t e d s t r u c t u r e s .
I n genera l wi th n u c l e i of s p i n 312, one l i n e w i l l be observed from each Thus with C 1 3 5 , s p i n 3/2, Table 1 summarizes
TABLE I
STRUCTURE ABSORPTION BANDS
1
1
2
3
U n t i l recent ly nqr s p e c t r a could be obtained only with considerable d i f f i c u l t y due t o t h e wide range of f requencies over which any p a r t i c u l a r i so tope might absorb (50-100 Mc/s) and the slowness of search due t o t h e frequent necess i ty of a d j u s t i n t h e o s c i l l a t o r s used. The instrument developed by Pe terson and Bridenbaugh' has made a dramatic d i f f e r e n c e i n t h e e a s e of search over wide ranges by an e s s e n t i a l l y automatic and unattended spectrometer .
In a d d i t i o n t o t h e components customari ly present in an o s c i l l a t o r of t h e superregenerat ive s o r t , the Peterson instrument contains an electro-mechanical servo loop which serves t o s t a b i l i z e t h e o s c i l l a t o r over wide ranges by feeding back a vol tage to t h e g r i d of the o s c i l l a t o r tube, customari ly a 12AU7, which r e s u l t s i n a s t a b i l i z e d output a t cons tan t no ise . Thus, searches a r e readi ly conducted over ranges of 20-40 Mc/s vhich conta in the v a s t major i ty of organo chloro compound absorpt ion bands, or 200-300 MC/S which contain t h e v a s t major i ty of organ0 bromo compounds; t h e time requi red f o r such searches i s 2 t o 4 hours.
304.
Some addi t iona l ref inements t o the Peterson spectrometer have been noted by Graybeal? , b u t f u l l d e t i a l s on r e l a t i v e performance have not been publ ished.
Previous examination o f the q u a n t i t a t i v e aspec ts of nqr spectroscopy has l a r g e l y been l imi ted t o determinat ion of t h e e f f e c t of impur i t ies on the peak i n t e n s i t i e s of absorpt ion bands4 wi th minor references t o the u t i l i t y of peak i n t e n s i t i e s t o determine t h e r e l a t i v e numbers of chemically d i f f e r e n t n u c l e i p resent i n a m ~ l e c u l e ~ ’ ~ . concerned with nqr spectroscopy with regard t o sample s i z e . from papers containing absorp t ion d a t a on l a r g e numbers of compound^^'^ t h a t while chemical s h i f t s comparable i n p r i n c i p l e t o those observed i n nmr spec t ra are p r e s e n t , s p l i t t i n g s due t o the e f f e c t s of neighboring atoms a r e not present .
Rela t ive ly minor references w i l l be noted i n papers It is a parent
Unfortunately, a type of s p l i t t i n g is encountered which has t o do with t h e f a c t t h a t spec t ra can be determined only upon c r y s t a l l i n e s o l i d s and is designated c r y s t a l s p l i t t i n g . I t i s due t o the f a c t t h a t chemically equivalent n u c l e i i n a c r y s t a l l i n e l a t t i c e may b e phys ica l ly non equiva len t by v i r t u e of r e l a t i v e l a t t i c e pos i t ions . 2.0.2 Mc/s, and the equal i n t e n s i t i e s of the two bands*. I n c e r t a i n cases i t s i m p l i f i e s the i n t e r p r e t a t i o n of a spectrum f o r i t has been found t h a t v i r t u a l l y a l l t r ichloromethyl groups show a t r i o of bands of equal i n t e n s i t y separa ted by about 0.1-0.2 Mc/s.
Normally, i t can be recognized by t h e ex ten t of t h e s p l i t t i n g
Examination of mixtures of p-dichlorobenzene and p-dibromobenzene along t h e l i n e s noted by Dean9 g ive very similar r e s u l t s using the Wilks S c i e n t i f i c Corporation NQR-lA NQR Spectrometer . Addit ional examples of p-dichlorobenzene and y-hexachlorocyclohexane i n d i c a t e s t h a t the peak he ight is an e x c e l l e n t way t o determine the concent ra t ion of i m p u r i t i e s p r e s e n t i n a c r y s t a l of a chloro compound i n the range from 0 .01 t o 1.0%, and t h a t c a l i b r a t i o n curves of t h e s o r t genera l ly usefu l i n q u a n t i t a t i v e i n f r a r e d measurements can e a s i l y be constructed.
With regard t o the amount of sample requi red i t has been found t h a t employing t h e NQR-1A i t i s p o s s i b l e t o determine usable s p e c t r a of p-dichlorobenzene on samples of 25-50 mg.. although rout ine ly 500mg w i l l s u f f i c e f o r any unknown. I t has baen found t h a t i n genera l a much s m a l l e r sample, 100mg, rout ine ly s u f f i c e s f o r any bromo compounds where t h e absorp t ion frequencies a r e much h igher , while compounds t h a t absorb a t f requencies near 5 Mc/s w i l l r equi re lOOOmg rout inely f o r de tec t ion .
Careful examination of a number of s p e c t r a of d iverse types of organic ch loro compounds makes i t apparent t h a t n q r s p e c t r a can be used t o determine t h e r e l a t i v e numbers of the d i f f e r e n t types of c h l o r o atoms p r e s e n t . It has been found t h a t peak h e i g h t alone is s u f f i c i e n t t o t h i s end and t h a t i n t e g r a t i o n of the area i s unnecessary. Thus, with 2,4-dichlorophynoxy a c e t i c a c i d w e f i n d two bands of matched i n t e n s i t y , Spectrum 1. A molecule of y-hexachlorocyclohexane i s known t o conta in 3 a x i a l and 3 e a u i t o r i a l ch loro atoms. and due t o t h e i r s p a t i a l arrangement there are e f f e c t i v e l y 4 types of chloro atoms present . shows 4 l i n e s of a 1:2:2:1 peak he ight r e l a t i o n s h i p which f i t s the known s t r u c t u r e ” .
The spectrum
Unfortunately, ins t ruments of the Peterson type cannot be used rout ine ly f o r t h e measurement of t h e s p e c t r a of n i t r o g e n compounds due t o s a t u r a t i o n phenomena p r e c i s e l y encountered i n o t h e r types of resonance measurements. The u s e of ,
o t h e r types o f o s c i l l a t o r s such as t h e Robinson o r P-K-W o s c i l l a t o r 1 1 - 1 2 can f u r n i s h d a t a on many types of n i t r o g e n compounds.
t h e u s e o f nqr t o determine t h e s t r u c t u r e of an o r g a n i c molecule; Kozima has
\
A t t h e present time t h e r e are r e l a t i v e l y few examples i n the l i t e r a t u r e of
t
\
R
305
u s e d t h i s technique t o d i f f e r e n t i a t e between t h e c h l o r i n a t i o n products of cyclo- hexane, 2,2-dichlorocyclohexane and 2,6-dichlorocyclohexaneone 3 .
Applicat ion of the nqr technique t o y-hexachlorocyclohexane has been noted above. only a s i n g l e s t r o n g band is observed n e a r 37.0 MC/S. This agrees w i t h the known s t r u c t u r e i n which t h e ch loro atoms a r e a l l t rans and a l l possess t h e e q u i t o r i a l configurat ion. I t is of i n t e r e s t t o note t h a t the only e a s i l y a t t a i n e d isomer of 1,2,3,4,5,6-hexabromocyclohexane has a very complex spectrum and is c l e a r l y not r e l a t e d t o the B-chloro isomer above.
A similar s tudy of ~-1,2,3,4,5,6-hexachlorocyclohexane revealed t h a t
Y-1 ,2,3,4-tet rachloro - 1,2,3,4-tet rahydronapthalene has been the s u b j e c t o f a recent nmr i n ~ e s t i g a t i o n ’ ~ and has t h e conf igura t ion noted symbolically below:
An nqr spectrum of t h i s compound shows two bands of e q u a l i n t e n s i t y a t 35 and 36.5 Mc/s and is i n agreement with t h e nmr assignment.
The nqr spectrum of 2,4-dichlorobenzotrichloride, Formula I, might be expected t o show t h r e e bands repres n t i n g t h e t h r e e types of ch loro atoms
a,=cp3 /-k present i n a 1:1:3 i n t e n s i t y , wi th probable s p l i t t i n g of t h e band due t o the t r ich loromethyl group i n t o a t r i p l e t . t h e expected 3 bands, however, the band a t 39.0 M c / s which is due t o CC13 is s p l i t i n t o a d i s t i n c t doublet a t a 2:l i n t e n s i t y . t a t i o n o f t h i s e f f e c t i s t h a t t h e o r t h o ch loro group i s i n t e r f e r r i n g s t e r i c a l l y with t h e f r e e r o t a t i o n of t h e t r ich loromethyl group. As a r e s u l t of t h i s t h e two chloro atoms of the t r ich loromethyl group n e a r e r t h e o r t h o ch loro group a r e d i f f e r e n t from t h e one which i s f a r t h e r .
The a c t u a l spectrum (Spectrum 2) shows
A reasonable i n t e r p r e -
\
‘\ I f c o l l e c t i o n of d a t a of t h e s o r t i n re ferences 1 t o 7 are s tudied , it i s p o s s i b l e t o develop c o r r e l a t i o n c h a r t s of t h e Colthrup type which have proved so popular i n i n f r a r e d spectroscopy. In such a c h a r t i t w i l l be noted t h a t i n the c a s e o f organic ch loro compounds t h a t a range o f 30-55 Mc/s embraces v i r t u a l l y a l l classes o f ch loro compounds. Acid ch lor ides show bands near 30 Mc/s whi le N-chloro compounds l i e a t t h e o t h e r end of the range n e a r 55 Mc/s. Aromatic and a l i p h a t i c ch loro compounds absorb near 34-35 Mc/s f o r t h e simple types whi le t h e more highly s u b s t i t u t e d types absorb a t h igher f requencies , f o r example; t h e t r i c h l o r w e t h y l group near 39Mc/s. t a i n i n g as many as 5 chemically d i f f e r e n t ch loro atoms have shown f i v e d i s t i n c t bands.
Spectra of compounds con-
1.
2.
3 .
4.
5 .
6.
7 .
8.
9.
10 *
11.
1 2 .
13.
1 4 .
I
a
306.
REFERENCES
Semin, G.K., and Fedin, E.I. , ' h e o f Nuclear Quadrupole Resonance i n Chemical Crystallography." 227 West 1 7 S t r e e t , New York,.New York. Unl i s ted chapters i n t h e Mossbauer E f f e c t a n d Its Applicat ions i n Chemistry, V. I . Gol 'danski i .
Avai lable through Consul tants Bureau, New York (1964)
Peterson, G.E., and Bridenbaugh, P.M., The R e v i e w of S c i e n t i f i c Instruments , - 35, 698 (1964).
Graybeal, J .D. , 122 (1967)
and Croston, R.P., The R e v i e w of S c i e n t i f i c Instruments , -9 38
Duchesne, J., and M m f i l s , A,, Canpt. Rend., 238, 1801 (1954).
Holmes, R.R., Carter, R.P., and Peterson, G.E., %olecular S t r u c t u r e s of PClhF, PC13F2 and PC12F-j: and Low Temperature F '9 NMR Spectra ," The Journal of Chemical Physics , 3, 1748 (1964).
Pure Chlorine Nuclear Quadrupole Resonance
Lorenzo, J.V.D., and Schneider , R.F., Inorganic Chemistry, 5. 766 (1967).
Hooper, H.O., and Bray, P.J . , The J o u r n a l of Chemical Physics , 33, 334 (1960)-
Dewar, M.J.S., and Lucken, E., Journa l of Chemical Soc ie ty , 426 (1958)
I I
Dean, D., The J o u r n a l of Chemical Physics , 23, 1734 (1955).
B r a m e , E.G., Analytical Chemistry ( I n p r e s s ) .
Schempp, E., and Bray, P.J., The Journa l of Chemical Physics , 46, 1186 (1967)
O'Konski , C .T., %Nuclear Quadrupole Resonance Spectroscopy," Determination o f Ornanic S t r u c t u r e s as Phys ica l Matters, 2, Ch. 11, Academic Press , New York (1962).
I
Kozima, K. and S a i t o , S., "Nuclear Quadrupole Resonance of di-ChlorOCyclO- nexanone, " The J o u r n a l of Chemical Physics , 2, 560 (1961).
De l a Mare, P.B.D., e t a l , Journal of Chemical Soc ie ty 3, 827 (1966). i
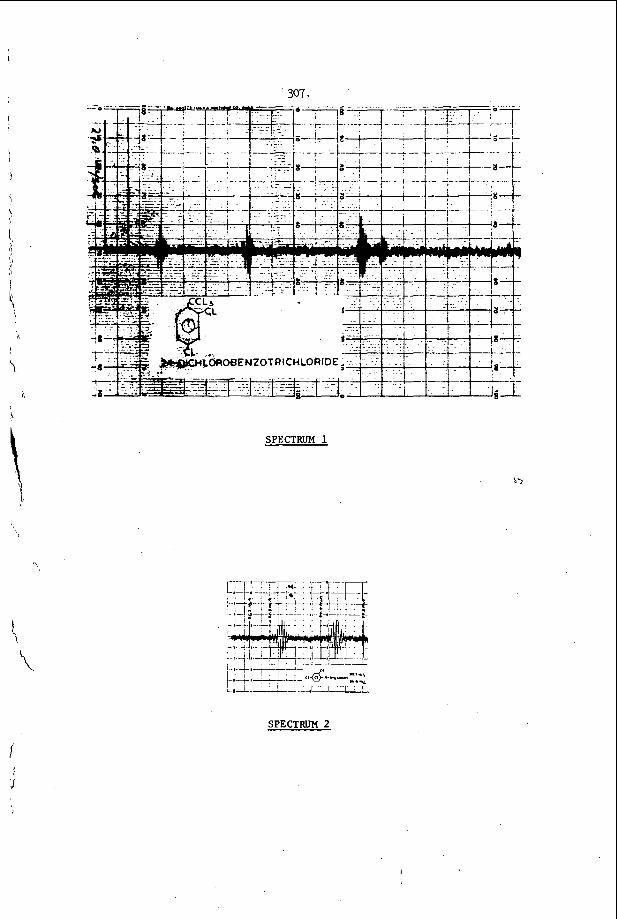
I
307.
SPECTRUM 1
SPECTRUM 2
308.
MOSSBAUER SPECTROSCOPY: PRINCIPLE AND PRACTICE
C a r l W . Seidel
Nuclear Science & Engineering Corporation P i t t sburgh , Pennsylvania 15236
ABSTRACT
Msssbauer Spectroscopy h a s s t a r t ed t o come into its own as a n analytical In o r d e r to understand what h a s been accomplished and the potential applica- tool.
tions of the MBssbauer Effect, one m u s t understand nuc lear resonance absorption and how i t i s effected by the environment of the absorbing nucleus. The per turba- tion of the nuclear ene rgy levels of MBssbauer nuclides and the resu l tan t cha rac t e r - i s t i c s of Mdssbauer spec t r a a r e reviewed. ,This includes the i s o m e r shift and i t s dependence on the e lec t ron dens i ty about the nucleus, quadrupole splitting and magne- t ic hyperfine splitting as wel l as the t e m p e r a t u r e dependence of these proper t ies . Corre la t ions of the above p rope r t i e s with the ionic s ta te , electronegativity of a bond- ing component or with theore t ica l e lec t ron density calculations c a n b e accomplished. The Debye-Waller fac tor f o r both the sou rce and abso rbe r ma te r i a l places cer ta in r e s t r i c t ions on the ability to obse rve the MBssbauer Effect with all poss ib le M b s s - hauer nuclides. Two typical MBssbauer spec t romete r sys t ems a r e descr ibed . One ut i l izes a constant velocity mode of operation fo r obtaining data, at one velocity a t a t ime . The other u t i l i zes a constant acce lera t ion mode of operation which scans the chosen velocity range repeti t ively, storing the counting data in a multichannel ana lyzer . devices m a y differ. effects such a s adsorption and the study of the bonding of some organo meta l l ic compounds will be d iscussed .
The bas ic detection sys t em is the s a m e for both sys t ems but the readout Application of M6ssbauer Spectroscopy in the study of sur face
\nother technique h a s been added in the f ie ld of spectroscopy. This new method of analysis depends upon the observance of nuclear resonance absorption which in tu rn depends upon the recoi l f r e e emis s ion and recoil f r e e absorption of g a m m a r a y s , o r the Mbssbauer effect. applied t o th i s new and v e r y useful ins t rumenta l method which complements the m o r e established techniques of NMR, ESR and x - ray diffraction.
The t e r m MBssbauer Spectroscopy has been
The theory behind the MBssbauer effect h a s been fully desc r ibed by Mass- hauc r ( 2 3 ) , Frauenfelder (24 ) and Wertheim ( 3 ) and will not be descr ibed in detai l h e r e . Ce r t a in nuclides (MBssbauer nuc1ides)exhibit a nuclear decay scheme where the t rans i t ion f rom the f i r s t excited nuclear leve l (and somet imes second excited nuclear leve ls ) to the ground s ta te may occur with the recoi l less emis s ion of a gamma r a y . This gamma r a y is uniquely capable of ra i s ing a s i m i l a r nucleus i n the s a m e type environment f r o m the ground s ta te to the f i r s t ( o r second) excited nuclear leve l by recoi l less absorp t ion ( resonant absorption). Most of the e l emen t s that have one or m o r e of t h e s e MBssbauer nuclides a r e shown on the accompanying cha r t (F ig . 1) . The resonant absorp t ion p r o c e s s depends on the fac t that the e m i t - ting ( sou rce ) and absorbing (sample) spec ie s a re bound in a c rys t a l la t t ice .
- -
Resonance absorp t ion m a y be destroyed by employing the Doppler effect. If n c - e e i ther source 3r a b s o r b e r re la t ive t o the o ther we may a l t e r the conditions
309. necessa ry for resonance absorption. e i ther the source o r abso rbe r toward the other (a positive Doppler velocity) we inc rease the energy of the gamma r a y a s s een by the absorbing species . ing one away f r o m the other (a negative Doppler velocity) we d e c r e a s e the energy of the gamma ray a s s een by the absorbing species. t r u m would therefore be the plot of the r a t e of t r ansmiss ion of the gamma ray through the absorbing sample a s a function of th i s Doppler velocity. condition resu l t s i n a noticeable dec rease in t r ansmiss ion (resonant peak). The p a r a m e t e r s of such a spectrum include M ( o r € ), the percent d e c r e a s e in t r ans - mission (magnitude of the peak) a t the resonant velocity and r, the width of the r e - sonant peak a t half maximum a s shown in Fig. 2.
Essent ia l ly what happens is that by moving
By mov-
A complete Mbssbauer spec-
The resonant
Resonance absorption occur s a t ze ro velocity only i f both the emitt ing and absorbing species a r e in the same physical environment. the resonance absorption may occur a t a non-zero velocity. This displacement of the resonance f r o m ze ro velocity is called the chemical o r i s o m e r (I.S.=cr) (Fig. 3) . The i somer shift value is a l inear function of the 5 electron density and f o r Fe-57 dec reases with increasing - s electron density (1). The 4 electron density affects the i somer shift mostly by shielding the s e l e c t r o n f r o m the nucleus. Adding d elec- t rons to the atom of in te res t d e c r e a s e s the electronic charge density a t t henuc leus , an effect just the opposite of that resul t ing f r o m the addition of 5 electrons. The contribution to the shift f r o m the p electrons i s ve ry sma l l (2).
If th i s is not t rue then
Since the electron density a t the nucleus i s a function of the oxidation state of the absorbing atom and of the electronegativity of i t s n e a r e s t neighbors we have a means of qualitatively identifying compounds, determining oxidation s ta tes and s t ructural information concerning the absorbing mater ia l . F o r example, i n Fig. 4 we can see how different t in (IV) hal ides give ve ry noticeably different i somer shifts . of surrounding F atoms (i t i s believed to have a polymer l ike s t ruc ture) .
The SnF4 gives a quadrupole splitting because of the inhomogeneous field
Quadrupole splitting (QS=A= distance between the two resonance peaks) is due t o the interaction of the inhomogeneous e lec t r ic field at the nucleus (due to the environment) with the electr ic quadrupole moment of the exci ted nucleus. The re-
,sul t i s a doublet or two resonant peaks. This occur s because the f i r s t nuclear ex- 'cited level spl i ts into two sublevels and two t ransi t ions (of slightly different energy) may occur (Fig. 5). tion state and the nature of the chemical bonding of the absorbing a tom (L). It a l so may be used a s a method of determining the symmet ry of c r y s t a l s and crys ta l dis- tort ion incu r red by substitution in the compound a s shown in Fig. 6. The i s o m e r shift of a quadrupole split spec t rum i s taken a s the displacement of centroid f r o m ze ro velocity. of the ferrocyanide due to the fact that the 5 electron density about the i ron atom has changed when one of the l igands changed.
Quadrupole splitting may be related quantitatively to the oxida-
In Fig. 6 the i s o m e r shift of the ni t roprusside is different than that
. Another interaction, that of the nuclear magnetic moments and the external o r intermolecular magnetic fields resu l t s in magnetic hyperfine splitting (MHS) of the spec t r a (a nuclear Zeeman effect) , (Fig. 7) In the case of i r o n we may obtain a spectrum with s ix resonances. Identification of magnetically o r d e r e d s t ruc tu res and determination of Curie and Ne'el t empera tu res for many m a t e r i a l s may be accomplished by studying their MHS spec t r a (2). l ic compounds h a s been used t o determine the magnetic p rope r t i e s and s t ruc ture of these ma te r i a l s (25).
The MHS of r a r e e a r t h intermetal-
-
310. Double six l ine s p e c t r a may be obtained when the i ron p resen t in the absorb-
e r may be in e i ther of two different environments (having different nea res t neighbors) o r two different c rys ta l s t r u c t u r e s ( te t rahedra l and octohedral) where the internal maenetic field i s different a t each site. *A. ccr.p=si:s. of a six L i e and d one or two l ine spec t rum may occur when two f o r m s (magnetic and nonmagnetic) of a mater ia l such as F e z 0 3 a r e p re sen t i n the abso rbe r .
The . i somer shift f o r spli t spec t r a i s r eco rded by taking the centroid of the spec t rum and measuring i t s displacement f r o m zero velocity.
MBssbauer spec t r a m a y not always be as uncomplicated a s one of the three basic f o r m s descr ibed. But combinations and per turbat ions of the basic f o r m s can usually be separated into component factions (bas ic f o r m s ) with l i t t le difficulty, (especial ly with computer cu rve fitting p rograms) providing a wealth of information about the abso rbe r sample. General ly i t may be said that the a r e a under the reson- ance peak i s proportional t o the amount of the element under investigation in a p a r - t i cu la r type of sample (%). Mgssbauer Spectroscopy can provide quantitative inform- ation a s well a s qualitative information about the sample.
Examples of some of the information obtained using MEssbauer spectroscopy m a y be shown with a few typical spec t r a . of the tin (IV) halide compounds. typical , a s shown in Fig. 8 (a wide splitting for f e r r o u s and a narrow splitting for f e r r i c compounds) .
We have seen the different i somer shifts In most i ron compounds a quadrupole splitting i s
Many different i r o n compounds have the i r i s o m e r shifts and quadrupole spli t- t ings l i s ted in a table compiled by Fluck et al . The accompanying d i ag ram (Fig. 10) shows cer ta in band locat ions on the velocity ax is where i s o m e r shift and quadrupole spli t values may be found. a l ly l inear f r o m -12OoC to t8OoC (1). t o the c rys ta l s t ruc ture (22).
The influence of t empera tu re on these values is gene r - The influence of p r e s s u r e v a r i e s according -
Tempera tu re dependence of the e lec t r ic quadrupole splitting and i somer shif t values can provide much information on chemical s t ruc tu re and bonding (26). F o r exam l e , the sixth e l ec t ron in excess of the half f i l led shell in f e r r o u s com- /
the lower t empera tu re the lowest molecular orbi ta l i s most populated and therefore we find the highest quadrupole splitting. A s the t empera tu re r i s e s all molecular orb i ta l s a r e populated equally and A E approaches ze ro . The d5 configuration for i ron has a much sma l l e r t e m p e r a t u r e dependency. Brady, Duncan and Mok have r epor t ed the t empera tu re dependence on a number of high and low spin i r o n com- pounds ( 2 7 ) .
1
pounds (d r? ) causes a s h a r p t e m p e r a t u r e dependence on the quadrupole splittigg. At
-
P r e s s u r e dependence of MBssbauer spec t r a may be much sma l l e r than t empera tu re dependence un le s s the ma te r i a l can be significantly compressed to a l te r the bond lengths or the environment of the absorbing nucleus. s y m e t r i c and changed equally with p r e s s u r e the electron density would change r e - sulting in an i somer shift. tnetry i s present in the a b s o r b e r . M6ssbauer Spectroscopy may thus detect s m a l l a c y m m e t r i e s which a r e not m e a s u r a b l e by x - r a y diffraction (28).
If al l the bonds were
Quadrupole spli t t ings may change with p r e s s u r e if a s y m -
i - Other studies of i s o m e r shifts have been made on i ron compounds (E), i r o n <
Croanic compounds (Li), tin compounds (2.15,16), and iodine compounds (17).
311.
i
\
Studies on the bonding of c la therates (Kr) and rare gas compounds (3) have been made using MBssbauer Spectroscopy. such a s i ron carbonyls, ferrates ' , dipyridyl i r o n complexes and SnF4 (polymer-like s t ructure) ( 1 , 2 ) have a l so been studied using this new non-destructive method of analysis.
Structural data on many 'compounds
- -
Wertheim and co-workers have co r re l a t ed the i s o m e r shift values of Fe-57 Their diagram is shown in a s a function of 3d and 4 s electron charge density (2).
Fig. 9 and i t provides a useful aide in determining electron charge density f o r com- pounds of interest .
Since most of the original work in the field of MBssbauer Spectroscopy h a s been with i ron, many potential applications of th i s technique in the non-destructive testing of me ta l s and alloys have a l r eady been discussed (2,k). Mzssbauer Spectro- scopy may be used in quality control or for the study of alloy s t ruc tu re and i t s re la - tion to the magnetic hyperfine f ie lds of the alloy. defects on me ta l s or gas absorption on me ta l su r f aces (e.g. catalysts) may a l so be studied using th i s technique. tain minority ingredient can usually be detected i n a host m a t r i x (2).
Cor ros ion and ce r t a in surface
Mineral a s s a y methods a r e being developed since c e r -
Many of the above studies r equ i r e thick samples which prohibit t r ansmiss ion type experiments. both the sou rce and detector be on the s a m e s ide of the abso rbe r (shielded from one another). The re-emit ted radiation ( f rom the decaying resonantly excited absorber nucleus) i s detected and instead of a d e c r e a s e in counting ra te a t resonance we ob- se rve an inc rease in detection of the Mbssbauer gamma ray , resul t ing i n a MESS- bauer spectrum just the inve r se obtained in a t r ansmiss ion experiment.
Therefore a scat ter ing technique is used. This r equ i r e s that
Investigation of i ron compounds h a s extended the use of Mbssbauer Spectro- scopy to the f ie ld of biology. globin and some of the i r r e s u l t s a r e shown on Fig. 11. sult f r o m different l igands bound t o the cent ra l i r o n atom. of hemoglobin has recent ly been published by Lang, e t al.
Gonzer, Grant and Kregzde (10) have studied hemo- The different spec t r a r e -
A m o r e extensive study Other work h a s been
\
\done with heme and hemin compounds (12) ferrodoxin (11) and i ron porphyrins (5). Iodine is another element that h a s recent ly allowed Mbssbauer Spectroscopy
t o be used in the biological field.
I
\
Cryogenic techniques ( to provide a stiff ma t r ix ) have been developed that allow the experimenter t o study spec ie s s table or m o r e easi ly available i n solution. Some of these techniques and the general application of MBssbauer Spectroscopy in Biology were the subject of discussion a t a 1965 symposium (9).
The study of other Mbssbauer e l emen t s is discussed extensively i n recent
This MBssbauer Effect Data Index the p a r a m e t e r s by nuclide.
publications (18, 19.22). vestigations h a s recently been published (E). ' h a s the compilation of al l the data obtained and lists
A new index of a l l publications concerning Mzssbauer in- --- ( 1
! '
I
Although many applications have been found using M6asbauer Spectroscopy.
Spectra must be compiled and in s t rumen t s compared to a s t anda rd reference the field is jus t blossoming. basis . point in o r d e r that the values obtained by different invest igators b e co r rec t ly inter- preted.
Most of the r e s u l t s mus t be in t e rp re t ed on a n empir ical
'
312. i r It is interesting to note that the National Bureau of Standards in the United
r Sta tes now of fers a s tandard r e fe rence c rys t a l of sodium ni t ropruss ide which gives a sha rp ly defined quadrupole spli t spec t ra . m m / s e c . ) provides an a c c u r a t e calibration of t he inves t iga tors velocity sca le . Dr . J. J . Spijkerman of the NBS Labora tory h a s au thored a recent review a r t i c l e on Mdssbauer Spectroscopy which provides a compilation of publications f o r 1965, ca tegor ized by element with comments on the na tu re of each study, as well as an excellent l i s t of re ferences(22) . Greenwood in England (26).
The d is tance between the peaks (in
Another excellent review was recently published by - /
It is obvious f r o m the expanding number of publications that the Massbauer The fac t that M8ssbauPr
I
Effect is becoming a m o r e effective analytical technique. Spectroscopy h a s been accepted as a member of the spec t roscopy family is a l so obvious f r o m the availability of commerc ia l Msssbaue r Effect Spec t rometers .
I i Commerc ia l and homemade Massbauer Spec t romete r s m a y be divided into
two bas ic types, mechanical (usually constant velocity) and e lec t ro-mechania l (usually constant acceleration). p rec is ion la thes , c a m dev ices , pulley a r r angemen t s and piston type dr ives . of t hese devices a r e l imi t ed to the relatively low ve loc i t ies (usually less than 2 cm/ sec . ) but may be used t o s tudy most i ron and t i n sys t ems . A prec is ion lathe type of M6ssbauer Spec t rometer tha t is commerc ia l ly available (Fig. 12 ) moves e i ther the sou rce o r abso rbe r at a given velocity (between 0.05 and 15 mm/sec . ) . This i n s t rumen t employs a synchronous motor , and a ba l l -d isc in tegra tor t r ansmiss ion ' s y s t e m t o v a r y the velocity. s tee l l ead screw which i n t u r n moves the sou rce or a b s o r b e r stage. When operat- ing a constant velocity s y s t e m , taking data f o r one velocity a t a t ime , one must be v e r y ca re fu l that the detection e lec t ronics do not dr i f t o r the resu l tan t spec t rum will be wor th less .
The mechanical s y s t e m s a r e many and include
1 A l l
,
An O-ring coupling moves the prec is ion machined
An e lec t romechanica l t r ansduce r i s the type of ins t rument used f o r a constant acce lera t ion type of M8ssbaue r Spec t rometer . A voltage signal ( t r iangular , saw- tooth o r sinesoidal) i s t r a n s f o r m e d into a velocity in the t r ansduce r . Thus the t r a n s - duce r may sweep through a spec t rum of ve loc i t ies ( f rom the maximum in one direction4 through z e r o to a maximum i n the other d i rec t ions) dur ing each cycle. A feedback s y s t e m c o r r e c t s f o r any deviation f rom the r e fe rence voltage signal.
/;'
''
/ When operating at cons tan t velocity the da ta is accumulated in one o r two
-4 multichannel ana lyze r operating in the mul t i s ca l e r mode is r equ i r ed s c a l e r s . when operating at constant acce lera t ion . a given velocity. the MCA while i t is advancing through i t s channels. Synchronization is most f r e - quently established by slaving the Miissbauer spec t romete r t o the MCA by deriving the r e fe rence velocity signal f r o m the a d d r e s s r e g i s t e r of the MCA.
Each channel will r ep resen t a scaler for The re fo re t h e motion of the t r ansduce r must be synthronized t o
/ I 1' The National Bureau of Standards s y s t e m u s e s the analog signal f r o m the f ,
I a d d r e s s r e g i s t e r to d r ive the t r a n s d u c e r , with a max imum velocity of 20 c m / s e c .
c i ty mode of operation is a l so included in the NBS sys t em. ( commerc ia l units a r e ava i lab le up to 60 c m / s e c . ) (F igs . 13A.B). A constant velo-
The usual detection s y s t e m used with a Mgssbaue r Spec t rometer would in- clude a de tec tor , a high voltage supply pre-ampl i f ie r , a l i nea r ampl i f ie r , single channel ana lyzer s ca l e r and t i m e r . A multichannel ana lyze r capable of operating in the mul t i s ca l e r mode should be included i f opera t ing in the constant acce lera t ion
313 * 1
, 1 1 below 40 Kev. i
mode. ,drift problems in the detection system. the gamma ray of interest .
This mode of operation i s favored because i t ave rages a n y smal l e lectronic The type of detector chosen'depends upon
G a s filled proport ional counters are general ly used
Velocity spec t ra may be obtained d i rec t ly f r o m the MCA by using an X-y r eco rde r . i s necessary if you wish to pe r fo rm a computer analysis of the data .
Digital d.ata i s obtained with a typewri ter o r paper readout system. This
Cryogenic accesso r i e s t o cool both source and absorber during MBssbauer experiments a r e sometimes necessary . Cooling is requi red in o r d e r t o measu re the MBssbauer effect in sys t ems containing cer ta in nuclides (ones with low Debye tempera tures) . ent cryogenic liquids including helium. by the Joule-Thomson expansion of hydrogen gas . t empera ture var ia t ion f r o m 160K to 70°K t o bet ter than *O. 5OK. sys t em one mus t be ex t remely careful that the unit does not introduce any vibration to the source o r absorber o r resonance absorpt ion may be destroyed.
Many commerc ia l ly available dewars are designed to contain differ- Another sys t em available provides cooling
Control of gas p r e s s u r e allows In any cryogenic
Massbauer sources for many nuclides a r e a l s o available commercial ly and Some may be electroplated (Co-57 on copper,palladium
Absorbers a r e eas i ly may vary in composition. o r platinum) o r jus t potted in plast ic (Sn-119m a s BaSnOj). made by mounting the sample (foil or powder) between two shee ts of 5 mil mylar with the help of double backed tape. t e r heat conduction proper t ies .
Cryogenic mounts a r e usually meta l l ic for bet-
Studies into the bonding of organo metal l ic compounds (especial ly organo-tin Interpretat ion of i somer shift values and a compounds) have been fa i r ly numerous.
compilation of different data h a s been summar ized in two pape r s by Herbe r e t a1 (29.30). F ig . 14 shows how the Mzssbauer p a r a m e t e r s fo r a number of t in com- pounds may be grouped. Various organo-tin compounds fal l in the crosshatched
i kt --
\I
+ a reas .
A recent investigation into the bonding of i r o n i n coal using Mcssbauer i\
'\\Spectroscopy w a s done by Lefelhocz and Kohman of Carnegie-Mellon University and Fr iede l of the Bureau of Mines in P i t t sburgh (2). Various coal samples were run to study the organically bound i ron in the coal. f i r m s that the i ron sulfide in coal consis ts mainly of pyr i te and indicates that non- pyri te i ron is in a high spin i ron (11) s ta te having octohedral coordination.
The i r pre l iminary work con-
\ \
The MBssbauer spec t r a obtained by Lefelhocz e t al. could not be compared Some spec t r a with s imi l a r d and Avalues ' di rec t ly to any other repor ted spec t ra .
h a s l ed them to believe that the i ron may be bound to heterocycl ic nitrogen aromat ic groups in the coal m a c e r a l s o r possibly in a clay-like s i l icate mine ra l o r gel.
Another a r e a of usefulness for Mbssbauer Spectroscopy is the investigation of catalysts and the i r functions. NSEC has recent ly been working with a number of companies i n th i s a rea . r e su l t s have shown different M8ssbauer pa t te rns fo r new and used ca ta lys t s of i ron oxides a s w e l l as complex i ron compounds. m a y somet imes be p re sen t in different ra t ios for the new and used catalysts . fully future work will include investigation of t hese ca ta lys t s i n working sys t ems t o s e e what influence adsorpt ion (and perhaps react ion) m a y have on the M8ssbauer Spe ct r urn.
Very little h a s been published on this type of work. I
Initial
' Both magnet ic and non-magnetic f o r m s Hope-
. '
I
314.
Some work has been done on adsorpt ion studies using the M6ssbauer effect. FIin5 2nd co-.??orkerc studied i r o n o n the siirface 0: A i 22'3 i32j. An anisotropy of t he rma l vibration re la t ive t o the sur face was observed. This resu l ted in unequal peaks in the quadrupole sp l i t spec t rum. The l a r g e quadrupole spli t a l so indicated tha t the i ron was p re sen t in a highly a s s y m e t r i c e lec t r ica l field. vibration was g rea t e s t along the axis of the e lec t r ic field gradient (normal to the, s u r - face) compared to that pa ra l l e l to the .surface.
The amplitude of
Other adsorpt ion s tudies have been made by Sur ton , Goodwin and Frauen- fe lder a t the University of Illinois (33) and by Shpinel and co-workers i n Russia (34) and o thers ( 3 5 , 3 6 , 3 7 ) . Compar isons were made between a toms in the bulk of the- ma t r ix , in the surface of the ma t r ix and 2 the su r face of the mat r ix . of the resu l tan t spec t ra with t empera tu re f o r each type sample were used to ex- plain the sur face dynamics of a n atom. It is hoped tha t M6ssbauer Spectroscopy will prove m o r e useful in t h e study of the sur face dynamics, chemical s ta tesand magnet ic proper t ies of adso rbed pa r t i c l e s (including v e r y thin fi lms).
--- Variations
This explanation of MEssbauer Spectroscopy, description of equipment avail- able, and the examples of the applications that have been given a r e all too brief. Much new information concerning the e lements we a r e able to study has been ob- tained using th i s ve ry sens i t ive analytical technique. be obtained by no other method. I
tained using NMR, ESR and x - r a y diffraction and other analytical techniques. Therefore , we can look forward to inc reased r e fe rences t o data obtained f rom M b s s - bauer spec t r a and fur ther ref inement of MBssbauer Spectrossopy.
Some of this information can Other information compliments what h a s been ob-
. .
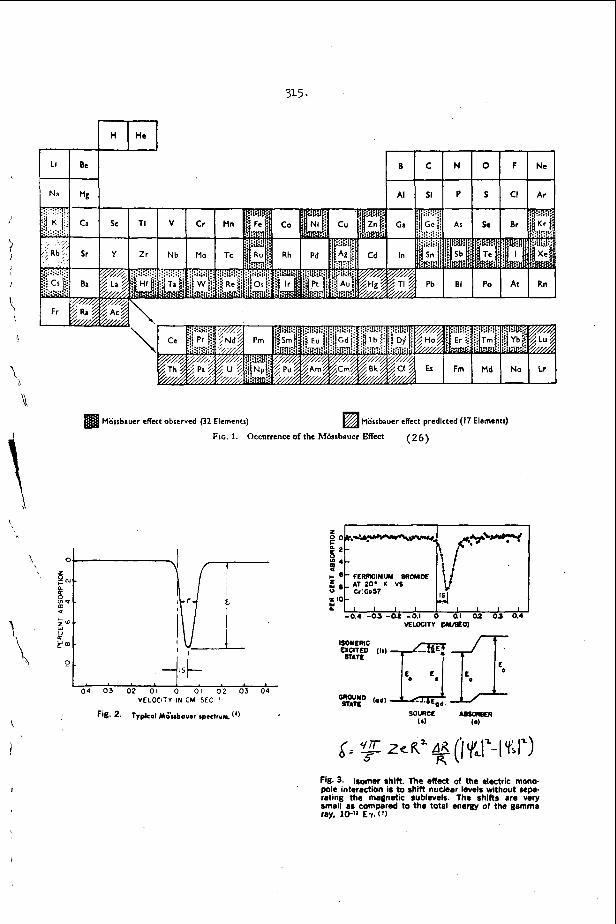
Mosrbauer effect observed (32 Elements) Marsbauer effect predlcted (17 Elements)
FIG. 1. Occurrence of the Morsbauer EfTect (26)
,
Fig. 3. Isomer shift. The effect of the electric mono. pole interaction Is to shift nuclear lwels without rp.. rating the magnetic rublwelr. The shifts are very small as compared to the total energy of the gamma ray, 10-12 ET. (7)
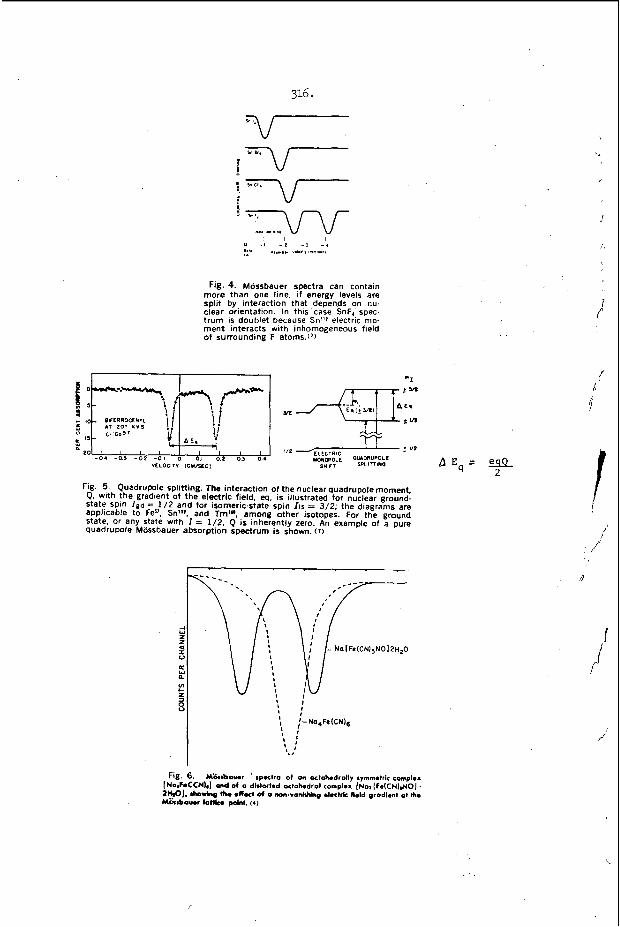
316.
Fig. 4. Mossbauer spectra can contain more than one line, if energy levels are split by interaction that depends on nu. clear orientation. In this'case SnF, spec- t rum is doublet because Sn"e electric rno ment interacts with inhomogeneous field of surrounding F atoms.(')
Fig. 5. Quadrupole splitting. The interaction of the nuclear quadrupole moment Q. with the gradient of the electric field, eq. i s illustrated for nuclear ground: state spin Igd = 1/2 and for isomeric-state spin Its = 3/2; the diagrams are applicable to Fe". Snl1*. and TrnlW. among other isotopes. For the ground state. or any state with I = 1/2. Q is inherently zero. An example of a pure quadrupole Mossbauer absorption spectrum is shown. ( 1 )
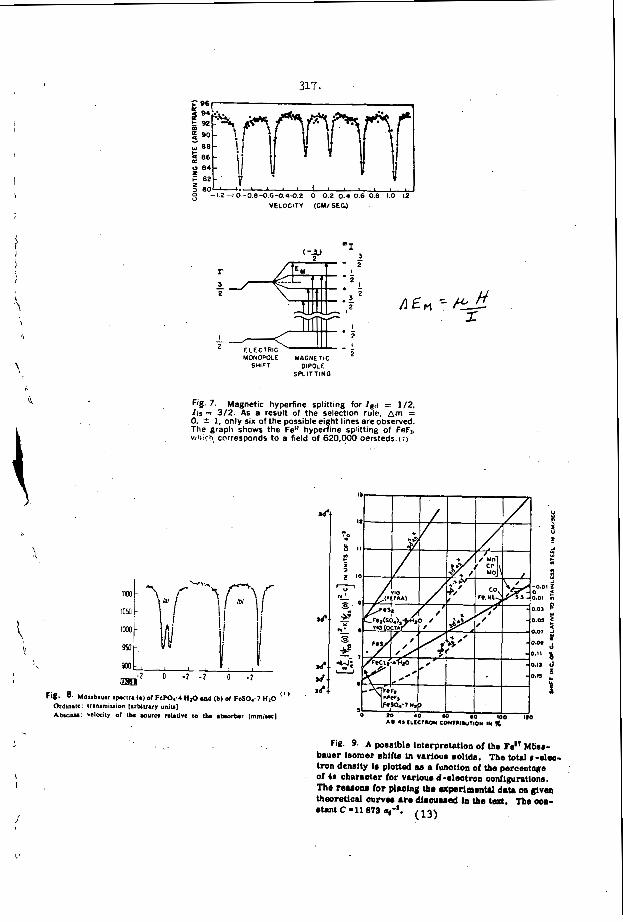
317.
\
\,
h
a
5 e o L : ' ' " 1 1 1 * 1 I , I 2 - - ' .2-1.0-08-0.6-0.4~.2 0 0.2 0.40.6 0.8 1.0 1.2
VCLOClTY (CWSEG)
ELECTRIC - _ MONOPOLE MAGNETIC '
SHIFT DIPOLE SPLITTING
L
FiB. 7. Magnetic hyperfine splitting for I,,r = 1/2 l is = 3/2. As a result of the selection rule. a m 2 0, t 1, only six of the possible eight lines are observed. The graph shows the Fe" hyperfine splitting of FnF,. v11ii.rh. corresponds to 8 field of 620,000 oersteds.(r)
Fig. 9. A posaible interpretation of the Po" Mber- bauer ieomer rhifta in variour solidr. The tow r-el-- tron denrity b plotted M a function of the percentage of 48 character for varioum d-electron oonfigurations. The ? O M O M for plrolng tho Uperlrnontrl drta on given theoretlcal ourva uo dIoouered k the t d . The 008- rtmt C - 11 873 (13)
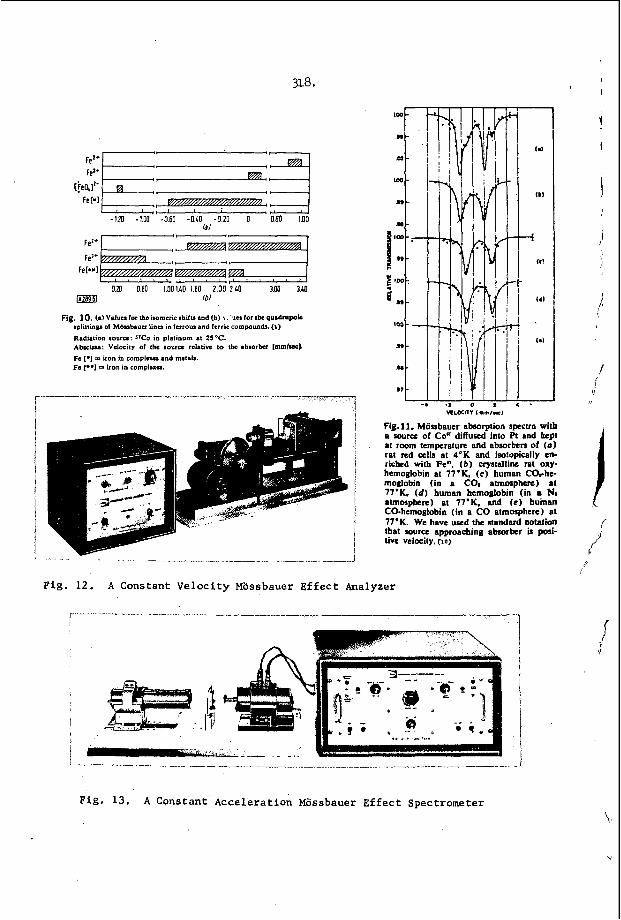
318.
[ieO,f- fe ?z=El 1.1 -120 -1.00 -060 - o a -020 o oeo 100
fez+
Fe3* Fe[**l
m lbl
/a/ c---(
l--Ezza
!??EFE! 0.a 0.60 l O O l l O 1 6 0 2.002lO 300 340
Fig. 10. (a) Values lor the isomeric abilu and (b) \. 'ocs lor the qusdrupolc splittinplol Mbssbauo l inp in lmou and ferric compounds. (1)
Radiation source: 5'Co in plarinum at 25 'C. Abscissa: Velocity 01 the source relative to the absorber IVMl/SCCl
Fe I*] - iron in complcrcr and metals. Fo [**I - iron in u)mpIcxu.
Fie.11. Mossbauer absorption spectra with a source of Co" diffuscd into PC and kept at room temperature and absorbers of (01 rat red cells at 4'K and isotopically en- riched with Pen. ( b ) crystalline rat OXY. hemoglobin at 77.K. (e) human COrhc- moglobin (in a COS atmosphere) at 77°K. ( d ) human hernodobin (in a N, atmosphere) at 77°K. and (e) human CO-hemoglobin (in a CO atmosphere) at 77'K. We have used the standard notation that aourcc approaching absorber is posi- tive velocity. (IO)
Fig. 12. A Constant Velocity Kossbauer Effect Analyzer
7 r-- II--- -1_--
---- - - _I
Fig. 13. A Constant Acceleration Mossbauer Effect Spectrometer
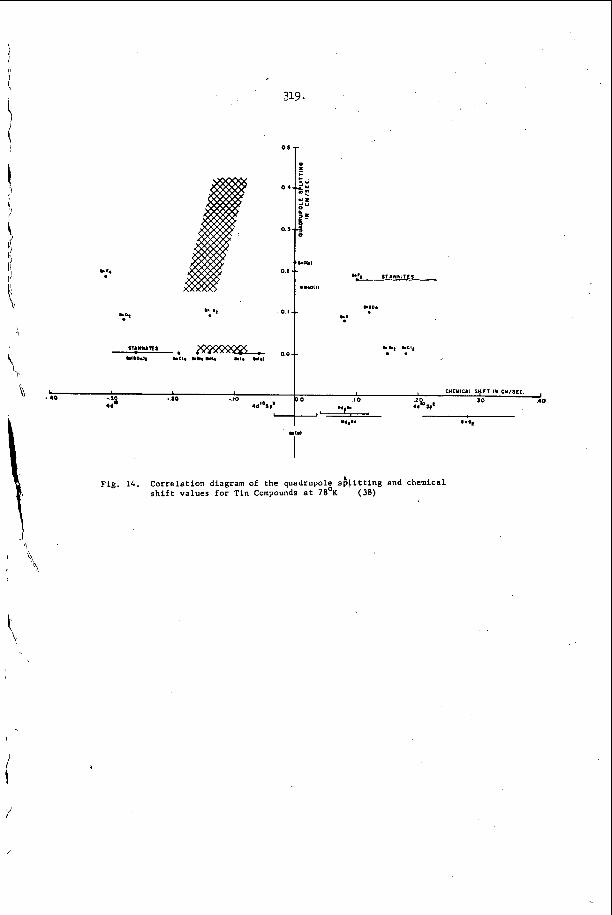
STANNITCS
Fig. 14. Correlation diagram of the quadrupole s b l i t t i n g and chemical s h i f t values for Tin Compounds a t 78'K (38)
320. References
1. 7.. G o ! d ~ n s k i i , V. !. , !ntCin. Scieiice & Tech. , Gecember ( l Y b 5 ) .
Fluck, E . , Ker l e r , W . , Neuwirth, W . , Angew. Chem. 75 461 (1963). . .--.
3. Wertheim, G. K., "MEssbauer Effect, Pr inc ip les and Applications", i1 Academic P r e s s , New York, 1964.
4. Herbe r , R.H. , J. Chem. Ed. 42, 180 (1965). 1 I
5. Johnson, C .E . , Ridout, M.S., Cranshaw, T .E . , ,Madsen , P.E., Phys. Rev. 1 1 Let t e r s 6, 450 (1961). -
6. Wertheim, G.K. , Phys. Flev. Le t t e r s , 12, 24 (1964).
8. blalillg, J. E . , Neissbluth, M., "M&sbauer Resonance Studies in Iron 7. Wertheim, G.K., Science - 144, 253 (1964). 11
1 Porphyrins and Heme-proteins" , in Elec t ronic Aspects of Biochemistry, -- B. Pullman, Ed . , Academic Press (1964).
P r e s s (1905) .
Pi l l inger , W . L . , Stone, J . A . , AEC Report D P 8 7 8 T 9 6 4 ) .
Acad. Sci. 53, 1246 (1965).
(100 1).
9. Kettering Foundation Symposium, March 1965, A . San .Pie t ro , Ed . , Antioch ' I , ,
10. Gonser , U . , Grant, 3 . W., Kregzde, J . , Science 143 (1964). 11. 12. Bearden, A. J., Moss, T.H. , Caughey, W . S . , Beaudreau, C.A., Proc , Nat.
13.
14. Herbe r , R . H., King, R . B., Wertheim, G. K., Inorg, Chem. 2, 101 (1963). 15. Bryukhanov, V . A . e t a t , Soviet P h y s . J E T P (English Translation), 16, 321
16. Cordey-Hayes, M . , J. Inorg. and Nuclear Chem. 26, 9 15 (1964). 17. DeWaard, H., DePasqilall , G., Hafemeister , D . , Phys. Le t t e r s 2, 217
18.
Walker, L.-<., Wertheim, C .K. , Jaccar ino , V . , Phys. Rev. Le t t e r s - 6, 98 / $ I
d -
(1963); s e e a l so ibid 3 310 (1963); 879 (1963).
-
(1963); R e v . Mod. Phys . 36, 358C (1964). Fluck, E . , Advances in Inorganic Chemis t ry and Radiochemistry - Vol. 6, Emeleus, H. J. Sharpe , A.G., eds : , Academic P r e s s , New York (1964). Proceedings of the 3rd International Conference on the Mossbauer Effect, Rev. Mod. Physics 3, #1 P a r t I1 ( Jan . 1964). 1 "The MEssbauerEffec t and I t s Application in Chemistry" in
10.
L O . Muir, A . H. e t al, "Mossbauer Effect Data Index", 1958- 1965 Interscience -
21. Lana, G., Marsha l l , W . , P roc . Phys. SOC. 87, 3 (1966). 22. DeVoe, J . R . , Spi jkerman, J. J . , Anal. Chem. - Annual Reviews 38, 38LR
23. Mossbauer, R.L., Ann. Rev. Nuclear Sci. 12, 123 (1962). 24. Frauenfelder , H., "The MEsabauer Effect"; W. A. Benjamin Inc., New York
(1962). 25. Nowik, I . , Bell Telephone Labora tor ies , M u r r a y Hill, New J e r s e y (to be
published). 26. Greenwood, N. N . , Chemis t ry in Br i ta in 1, No. 2 56- 72 (1967). 27. Brady, P . R . , Duncan, J.F., Mok, K . F . , Proc. Royal SOC. (London) -- 287-4,
John Wiley and Sons , New York City (1967). J/'
- - -
( 1966).
>[ -
343-62, (1965). 28. Chr is t , B.W., Spi jkerman, J. J., Giles, P .M. , Ruegg, F. C., T r a n s . Met. i'
SOC. of AIME (Tech. L e t t e r t o be published).
(lOb5). 1
Lefelhocz, J. F. , F r i ede l , R . A . , Kocman, T. P., (Submitted to Geochimica e t Cosmochimica A k a A p r i l 1967).
-. 1. :inn, P. A . , Ruby, S. L. , Kehl, W. L., Science 143, 1434 (1964).
29. H e r b e r , R.H., S toeckler , H.A., Reichle, W.T., J. Chem. Phys. 4 3 2447
30. Herbe r , R.H., Nuclear Sci . Abstr . 19 No. 8 13518 (1965). 31. $1
\
321. 33. Burton, J. W. , Frauenfe lder , H., Coodwin, R . P . , Nuclear Sci. Abs t rac ts
34.
35.
37. Hobson, M. C., Nature - 214 79 (1967). 38.
' No. 20 40078 (1905). '\
\ 36. Suzdalen, I. P. et a \ , J. E. T. P. 22, 979 (1966).
\
K a r z e v , A . N , , Polak, L.S., Shlikhter, E.B., Shpinel, V.S., Kinetika i Kataliz 6 710 (1965). Kundig, W . et al, Phys. Rev. 142 327 (1966).
-
Spijkerman, J. J . , Symposium on "The MEssbauer Effect and Its Application in Chemis t ry" t o b e published in the Advances in Chemis t ry Series (1967) by A.C.S. I
1 a
I
322. . . -
GASIFICATION OF CAKING COAL I N A FREE-FALL, FLUID-BED REACTOR
A . J . Forney, R. F . Kenny, and J. H . F i e ld
P i t t sbu rgh Coal Research Center , U. S. Bureau of Mines, 4800 Forbes Avenue, P i t t sbu rgh , Pennsylvania 15213
INTRODUCTION
The Bureau of Mines i s i n v e s t i g a t i n g the g a s i f i c a t i o n of caking c o a l s i n a f lu id-bed r e a c t o r a s p a r t of t he Bureau's o v e r a l l program of conver t ing c o a l t o l i q u i d o r gaseous f u e l s . The caking c o a l s , common t o t h e Eas t and Midwest, cannot be g a s i f i e d wi thout b e i n g p r e t r e a t e d , u s u a l l y wi th s t e a m and oxygen. The method of g a s i f i c a t i o n d iscussed i n t h i s r e p o r t i s f r e e - f a l l p re t rea tment combined with f lu id-bed g a s i f i c a t i o n .
The primary o b j e c t i v e s of the p ro jec t a r e : 1) To check OUK e a r l i e r method of p r e t r e a t i n g caking c o a l s before gas i f ica t ion ;=/ minimum amount of oxygen needed f o r pre t rea tment ; 3) t o maximize the methane con ten t i n the product gas . A secondary a i m , which developed from the above t e s t s , i s t o s tudy a method of s u b s t i t u t i n g a i r f o r oxygen.
2) t o determine t h e
EXPERIMENTAL PROCEDURE
The pre t rea tment i s achieved by dropping Pittsburgh-seam c o a l (70 percent through 200 mesh) through a f r e e - f a l l r e a c t o r 6 inches i n 'diameter and 10 f e e t h igh ( l a t e r reduced t o 7 f e e t ) . This p r e t r e a t e r i s loca ted above 'a f lu id-bed r e a c t o r 3 inches i n diameter and 3 f e e t h igh ( l a t e r increased t o 6 f e e t ) . The oxygen and steam f o r t he g a s i f i c a t i o n e n t e r t h e bottom of the r e a c t o r , f i g u r e s 1 and 2 . The gases from the g a s i f i e r flow up through the f r e e - f a l l s e c t i o n t o p r e t r e a t and carbonize t h e c o a l as i t f a l l s . They a r e enr iched with an oxygen- steam feed e n t e r i n g t h e s i d e of the f r e e - f a l l s e c t i o n t o f u r t h e r p r e t r e a t t he coa l because the gases r i s i n g from t h e g a s i f i e r d i d no t p r e t r e a t s u f f i c i e n t l y t o prevent agglcmeration.
P res su res from 2.5 t o 2 0 atmospheres, temperatures of 835O t o 955" C , and oxygen-coal r a t i o s from 0 t o 5.9 were used.
RESULTS AND DISCUSSION
Pressure E f f e c t s
The pressure was g radua l ly increased from 2 - 1 / 2 t o 20 atmospheres as shown in t a b l e 1 and f i g u r e 3. The methane con ten t g radua l ly increased t o 14 volume percent of t he product gas . This means t h a t more methane can be produced i n t h i s g a s i f i c a t i o n than would be produced i n subsequent methanation t o produce high-Btu gas. For example, i n experiment N-12 the 50. percent Hz+CO would y i e ld l e s s methane du r ing methanation than the 14 percent methane a l r eady produced i n g a s i f i c a t i o n . As the p re s su re was increased from 2 - 1 / 2 t o 20 atmospheres,
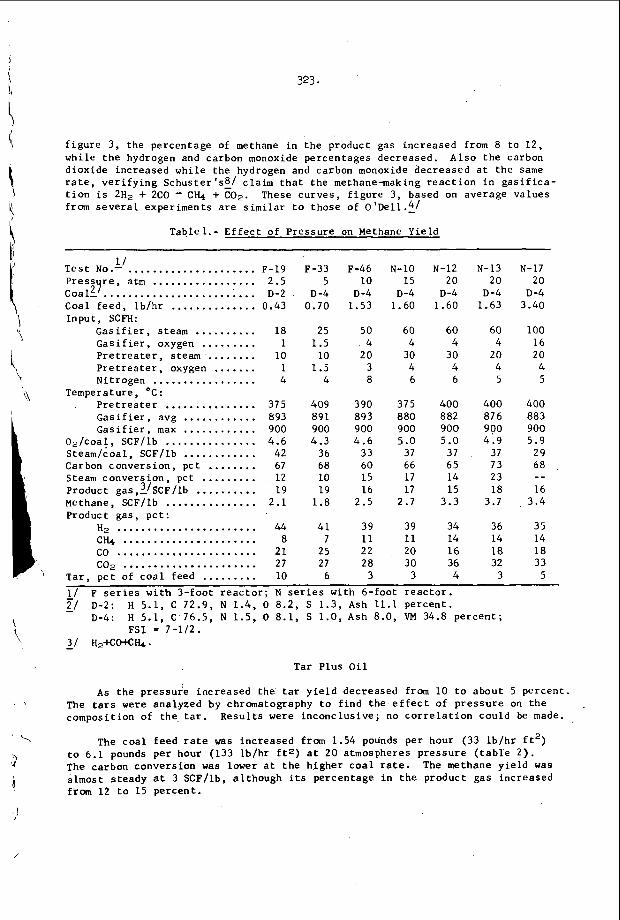
f i g u r e 3, the percentage of methane i n the product gas increased from 8 t o 1 2 , while t h e hydrogen and carbon monoxide percentages decreased. A l so the carbon dioxide increased while the hydrogen and carbon monoxide decreased a t t he same r a t e , v e r i f y i n g Schuster I s s f claim t h a t the methanemaking r e a c t i o n i n g a s i f i c a - t i o n is 2H2 + 2CO -. CHq + C 0 2 . These curves , f i gu re 3, based on average values from s e v e r a l experiments a r e s imi l a r t o those of O ' D e l l . ~ /
Table1.- E f f e c t of Pressure on Methane Yield
1/ Tes t N O - - ..................... F-19 Pressure , atm ................. 2.5 Coa l l f ..................... i . . . D-2 Coal f eed , l b /h r .............. 0.43 Input , SCFH:
G a s i f i e r , steam .......... 18 G a s i f i e r , oxygen ......... 1 P r e t r e a t e r , steam ........ 10 P r e t r e a t e r , oxygen ....... 1 Nitrogen ................. 4
P r e t r e a t e r ............... 375
G a s i f i e r , max ............ 900 Opfcoa!, SCF/lb ............... 4.6 Steamfcoal, SCFflb ............ 42 Carbon convers ion , pc t ........ 67 Steam convers ion , pct ......... 1 2 Product gas,?/SCF/lb .......... 19 Methane, SCFflb ............... 2 . 1 Product gas, pc t :
H2 ....................... 44
Temperature, 'C:
G a s i f i e r , avg ............ 893
C& ...................... a co ....................... 21 c02 ...................... 27
Tar , pc t of c o a l feed ......... 10
F-33 5
D -4 0.70
25 1.5
10 1.5
4
409 891 900 4.3
36 68 10 19
1.8
41 7
25 27 6
F-46 10
D -4 1.53
50 4
20 3 8
390 893 900 4.6
33 60 15 16
2.5
39 11 22 28
3
N-10 15
D-4 1.60
60 4
30 4 6
375 880 900 5.0
37 66 17 17
2.7
39 11 20 30 3
N - 1 2 20
D-4 1.60
60 4
30 4 6
400 882 900 5 .O
37 65 14 15
3.3
34 14 16 36 4
N-13 20
D -4 1.63
60 4
20 4 5
400 876 900 4 .9
37 7 3 23 18
3.7
36 14 18 32
3
N-17 20
D-4 3.40
100 16 20 4 5
400 883 900 5.9
29 68
16 3.4
35 14 18 33
5
--
- 1/ - 2 1 D-2: F s e r i e s w i th 3-foot r e a c t o r ; N s e r i e s with 6-foot r e a c t o r .
H 5.1, C 72.9, N 1 .4 , 0 8.2, S 1 .3 , Ash 11.1 percent . D-4: H 5.1, C 76.5, N 1.5, 0 8.1, S 1 .0 , Ash 8.0, VM 34.8 pe rcen t ;
FSI = 7-112. - 31 n2+CO+CH,.
Tar Plus O i l
As the pressure increased the t a r y i e l d decreased from 10 t o about 5 percent . The tars were analyzed by chromatography t o f ind the e f f e c t of p re s su re on the composition of the tar. Resul t s were inconclus ive ; no c o r r e l a t i o n could be made.
The coa l feed r a t e was increased from 1.54 pounds per hour (33 l b f h r f t 2 ) t o 6.1 pounds per hour (133 lb /h r f t 2 ) a t 20 atmospheres pressure ( t a b l e 2 ) . The carbon conversion w a s lower a t t h e h igher c o a l r a t e . The methane y i e ld was almost s teady a t 3 SCF/lb, although i t s percentage i n the product gas increased from 1 2 t o 15 percent .
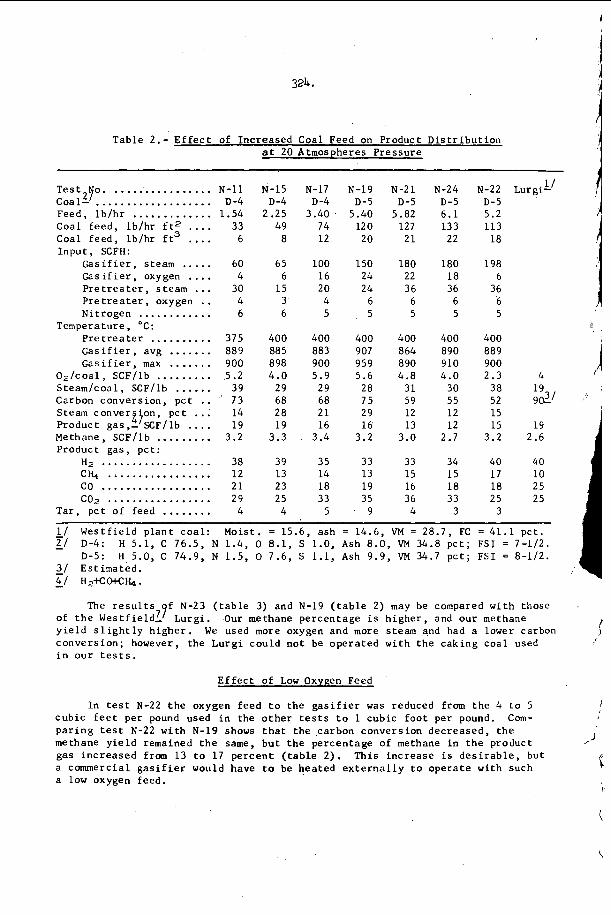
324.
Table 2 . - E f f e c t of Increased Coal Feed on Product D i s t r i b u t i o n a t 20 Atmospheres Pressure
~~ ~ ~ ~ ~~
Test270. 11 ................ N - 1 1 N - 1 5 N-17 N-19 N - 2 1 N-24 N-22 Lurgi- Coal- ................... D-4 D-4 D - 4 D - 5 D-5 D-5 D-5 Feed, l b / h r ............. 1.54 2.25 3.40 5.40 5.82 6 . 1 5.2 Coal feed , l b /h r f t 2 .... 33 49 74 120 127 133 113 Coal feed , l b /h r f t 3 .... 6 8 12 20 2 1 22 18
G a s i f i e r , steam ..... 60 65 100 150 180 180 198 G a s i f i e r , oxygen .... 4 6 16 24 22 18 6 P r e t r e a t e r , s team ... 30 15 20 24 36 36 36
Nitrogen ............ 6 6 5 5 5 5 5
Inpu t , SCFH:
P r e t r e a t e r , oxygen . . 4 3 4 6 6 6 6
Temperature, 'C: P r e t r e a t e r .......... 375 400 400 400 400 400 400 G a s i f i e r , avg ....... 889 885 883 907 864 890 889 G a s i f i e r , max ....... 900 898 900 959 890 910 900
0 2 / c o a l , SCF/lb ......... 5.2 4.0 5.9 5.6 4.8 4.0 2.3 4 S team/coal , SCF/lb ...... 39 29 29 28 31 30 38 19 Carbon conversion, pc t .. 73 68 68 75 59 55 52 902'
Product gas,- SCF/lb .... 1 9 19 16 16 13 12 15 19 Methane, SCF/lb ......... 3.2 3.3 3.4 3.2 3.0 2.7 3.2 2 .6 Product gas , pc t :
Steam conver t jon , p c t ... 14 28 21 29 12 12 15
H 2 .................. 38 39 35 33 33 34 40 40 C& ................. 1 2 13 14 13 15 15 1 7 10 co .................. 2 1 23 18 19 16 18 18 25 co2 ................. 2 9 25 33 35 36 33 25 25
Tar , p c t o f feed ........ 4 4 5 9 4 3 3
- 1/ West f i e ld p l an t c o a l : Moist. = 15.6, ash = 14.6, VM = 28.7, FC = 41.1 pc t . - 2 / D-4: H 5.1 , C 76.5, N 1.4, 0 8.1, S 1.0, Ash 8 .0 , VM 34.8 p c t ; FSI = 7-112.
D-5: H 5.0, C 74.9, N 1.5, 0 7.6, S 1.1, Ash 9.9, VM 34.7 p c t ; FSI = 8-1/2. - 31 Est imated. - 4 1 H2+COtCH, .
The r e s u l t s f N-23 ( t a b l e 3) and N-19 ( t a b l e 2) may be compared wi th those of t h e Westfield17 Lurgi . Our methane percentage is h ighe r , and ou r methane
conversion; however, t he Lurg i could n o t be operated wi th t h e caking coa l used i n ou r t e s t s .
y i e l d s l i g h t l y h ighe r . We used more oxygen and more steam and had a lower carbon ,I E f f e c t of Low Oxygen Feed
In t e s t N-22 t h e oxygen feed t o t h e g a s i f i e r was reduced from t h e 4 t o 5 cub ic f e e t per pound used i n the o t h e r tests t o 1 cubic f o o t per pound. Com- p a r i n g t e s t N-22 with N-19 shows t h a t t he carbon conversion decreased , t h e methane y i e l d remained t h e same, bu t t h e percentage of methane i n the product gas inc reased from 13 t o 17 pe rcen t ( t a b l e 2) . This inc rease i s d e s i r a b l e , but a cormnercial g a s i f i e r would have to be heated e x t e r n a l l y t o ope ra t e with such a low oxygen feed.
i
,I
f l <
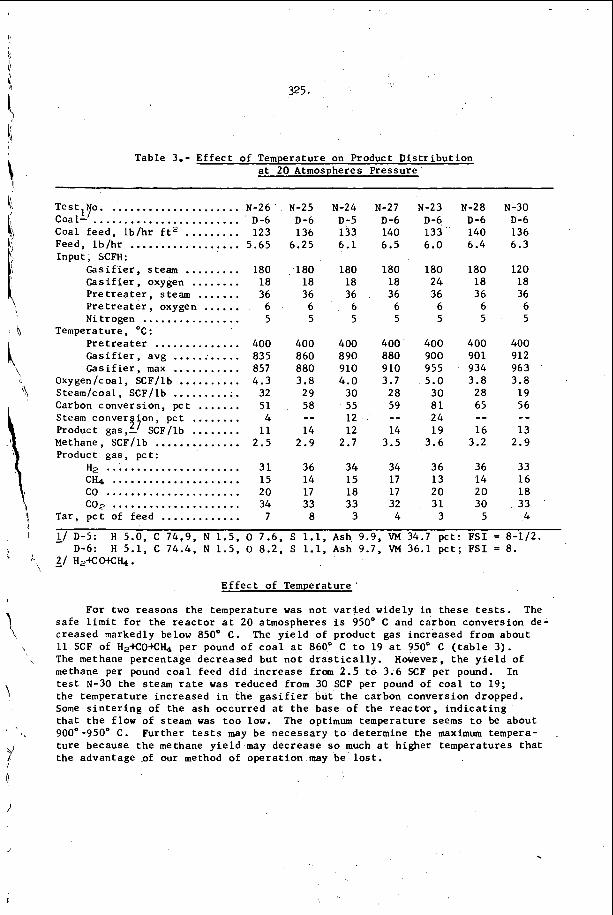
Table 3.- E f f e c t of Temperature on Product D i s t r i b u t i o n a t 20 Atmospheres Pressure
T e s t l y . ..................... N-26 Coal- ......................... D-6 Coal feed , l b / h r f t 2 ......... 123 Feed, l b / h r .................. 5.65 Input ; SCFH:
G a s i f i e r , steam ......... 180 G a s i f i e r , oxygen ........ 18 P r e t r e a t e r , steam ....... 36 P r e t r e a t e r , oxygen ...... 6 Nitrogen ................ 5
P r e t r e a t e r .............. 400 G a s i f i e r , avg ........... 835 G a s i f i e r , max ............ 857
Oxygen/coal, SCF/lb .......... 4.3 S t e a d c o a l , SCF/lb ........... 32 Carbon conversion, p c t ....... 51 Steam conver j jon , pct ........ 4 Product gas,- SCF/lb ........ 11 Methane, SCF/lb .............. 2.5 Product gas , pct :
Temperature, O C :
H 2 ...................... 31 C k ..................... 15 co ...................... 20 co2 ..................... 34
Tar, p c t of feed ............. 7
N-25 D-6 136
6.25
;180 18 36
6 5
400 860 880 3.8
29 58
14 2.9
36 14 17 33
8
--
N-24 D -5 133 6.1
180 18 36
. 6 5
400 890 910 4.0
30 55 12 12
2.7
34 15 18 33 3
N-27 D -6 140 6.5
180 18 36
6 5
400 880 9 10 3.7
28 59
14 3.5
34 17 17 32 4
--
N - 2 3 D-6 133 6 .0
180 2 4 36
6 5
400 900 955 5.0 30 81 24 1 9
3.6
36 13 20 31
3
N-28 D-6 140 6.4
180 18 36
6 5
400 901 934 3.8
28 65
16 3.2
36 14 20 30
5
--
N-30 D-6 136 6 .3
120 18 36 6 5
400 912 963 3.8
19 56
1 3 2.9
--
33 16 18 33
4
- 1/ D-5 :
- 2 / H2+C(HCH,.
H 5.0, C 74.9, N 1.5, 0 7.6, S 1.1, Ash 9.9, VM 34.7 pct : FSI = 8-112. D-6: H 5.1, C 74.4, N 1.5, 0 8.2, S 1.1, Ash 9.7, VM 36.1 p c t ; FSI = 8.
E f f e c t of Temperature
For two reasons the temperature was n o t v a r i e d widely i n these t e s t s . The s a f e l i m i t f o r the r e a c t o r a t 20 atmospheres is 950' C and carbon conversion de- creased markedly below 850' C . The y i e l d of product gas increased from about 11 SCF of H2+COSC& per pound of c o a l a t 860' C t o 19 a t 950' C ( t a b l e 3) . The methane percentage decreased but n o t d r a s t i c a l l y . However, t h e y i e l d of methane per pound c o a l feed d id i n c r e a s e from 2.5 t o 3.6 SCF per pound. In t e s t N-30 the steam r a t e was reduced from 30 SCF per pound of coa l to 19; the temperature increased i n the g a s i f i e r but t h e carbon conversion dropped. Some s i n t e r i n g of the ash occurred a t t h e base of the r e a c t o r , i n d i c a t i n g t h a t t h e flow of steam was t o o low. The optimum temperature seems t o be about 900"-950' C . Further t e s t s may be necessary t o determine the maximum tempera- t u r e because t h e methane y i e l d may decrease so much a t higher temperatures t h a t the advantage of our method of o p e r a t i o n may be l o s t .
.
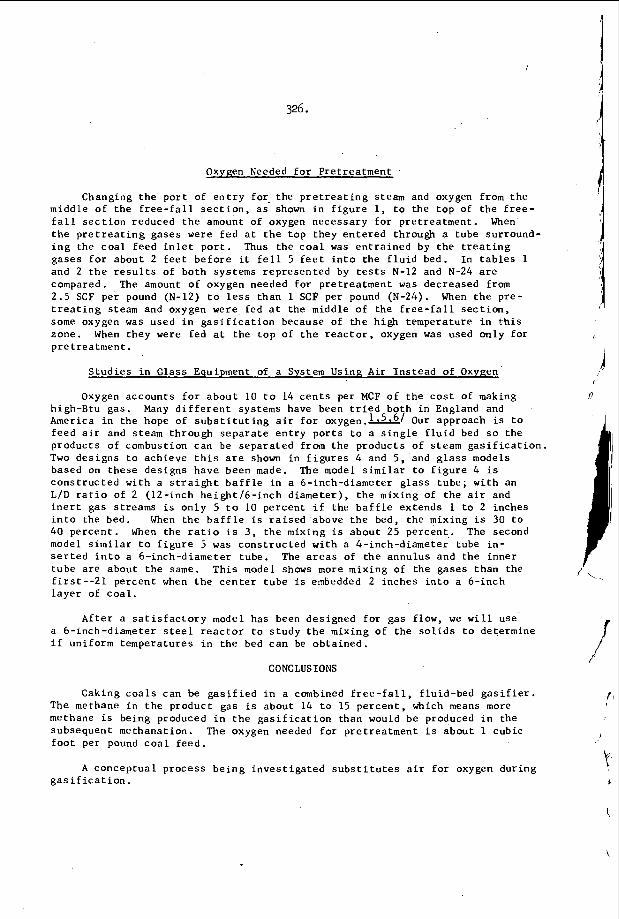
326.
Oxygen Needed f o r Pretreatment
Changing the po r t of e n t r y for. the p r e t r e a t i n g steam and oxygen from the middle of the f r e e - f a l l s e c t i o n , a s shown i n f i g u r e 1, t o the top of t he f r e e - f a l l s e c t i o n reduced t h e amount of oxygen necessary f o r pre t rea tment . When t h e p r e t r e a t i n g gases were f ed a t t h e top they en te red through a tube surround- i n g the coa l feed i n l e t p o r t . Thus the c o a l was en t r a ined by the t r e a t i n g gases f o r about 2 f e e t be fo re it f e l l 5 f e e t i n t o the f l u i d bed. In t a b l e s 1 and 2 t h e r e s u l t s of both systems represented by t e s t s N-12 and N-24 a r e compared. The amount of oxygen needed f o r pre t rea tment was decreased from 2 .5 SCF per pound (N-12) t o l e s s than 1 SCF per pound (N-24). When t h e pre- t r e a t i n g steam and oxygen were fed a t the middle of the f r e e - f a l l s e c t i o n , some oxygen was used i n g a s i f i c a t i o n because of t he h igh temperature i n t h i s zone. When they were fed a t the top of the r e a c t o r , oxygen was used only fo r pre t rea tment .
S tud ie s i n Glass Equipment of a System Using A i r I n s t ead of Oxygen
Oxygen accounts f o r about 10 t o 14 c e n t s per MCF of t he c o s t of making high-Btu gas . Many d i f f e r e n t systems have been t r i e d both i n England and America i n the hope of s u b s t i t u t i n g a i r f o r oxygen.-/ Our approach i s t o feed a i r and steam through sepa ra t e e n t r y p o r t s t o a s i n g l e f l u i d bed so the products of combustion can be separa ted from the products of steam g a s i f i c a t i o n Two des igns t o achieve t h i s a r e shown i n f i g u r e s 4 and 5, and g l a s s models based on these des igns have been made. The model similar t o f i g u r e 4 is cons t ruc t ed with a s t r a i g h t b a f f l e i n a 6-inch-diameter g l a s s tube ; wi th an L/D r a t i o of 2 (12-inch he igh t /6 - inch d iameter ) , t he mixing of the a i r and i n e r t gas streams is only 5 t o 10 percent i f the b a f f l e extends 1 t o 2 inches i n t o the bed. When t h e b a f f l e i s r a i s e d above t h e bed, the mixing is 30 t o 40 percen t . en the r a t io i s 3 , t he mixing i s about 25 percent . The second model s i m i l a r t o f i g u r e 5 was cons t ruc ted wi th a 4-inch-diameter tube i n - s e r t e d i n t o a 6-inch-diameter tube. The a r e a s of t h e annulus and the inner tube a r e about the same. Th i s model shows more mixing of the gases than the f i r s t - - 2 1 percent when the c e n t e r tube i s embedded 2 inches i n t o a 6-inch l aye r of c o a l .
Af t e r a s a t i s f a c t o r y model has been designed f o r gas flow, we w i l l use a 6-inch-diameter s t e e l r e a c t o r t o s tudy t h e mixing of the s o l i d s t o determine i f uniform temperatures i n t h e bed can be obta ined .
CONCLUSIONS
Caking c o a l s can be g a s i f i e d i n a combined f r e e - f a l l , f lu id-bed g a s i f i e r . The methane i n t h e product gas is about 14 t o 15 pe rcen t , which means more methane i s being produced i n t h e g a s i f i c a t i o n than would be produced i n the subsequent methanation. f o o t per pound c o a l feed .
The oxygen needed f o r pre t rea tment i s about 1 cubic
A conceptua l process be ing inves t iga t ed s u b s t i t u t e s a i r f o r oxygen dur ing gas i f i c a t ion . I
1.
2.
3 .
4.
5 .
6 .
7 .
a.
327.
BIBLIOGRAPHY
Curran, G. P . , C . H. Rice, and E . Gorin. Carbon Dioxide Acceptor Gas i f i ca - t i o n Process. Divis ion of Fuel Chemistry, A.C.S., Ph i l ade lph ia , Pa., Apr i l 5-10, 1964.
Forney, A. J . , R. F. Kenny, S . J. Gasior, and J. H . F i e l d . Fluid-Bed Gas i f i ca t ion of P re t r ea t ed Pittsburgh-Seam Coal. A.C.S., N e w York, N . Y . , Sept. 1966.
Forney, A . J. , R. F. Kenny, S . J. Gasior, and J. H. F i e l d . Decaking of Coals i n a F lu id Bed. BuMines Rept. of Inv. 6797, 1966, 22 pp.
O ' D e l l , W . W . and Leuna Slagging Type Gas Producer Processes. BuMines I n f . C i r c . 7415, 1946, 46 pp.
P i e ron i , L. J. , G. T. Skaperdas, and W. H. Hef fner . Development of the Kellogg Coal G a s i f i c a t i o n Process. A.1.Ch.E. Symposium on Processing of Coal and i t s Byproducts, Ph i l ade lph ia , Pa., Dec. 5-9, 1965.
Raynor, J. W. R . G a s i f i c a t i o n by the Moving Burden Technique. Gas i f ica- t i o n and Liquefact ion of C o a l Symposium, A . I . M . E . , New York, N . Y . , Feb. 20-21, 1952.
R i c k e t t s , T. S . The Operat ion of the Westf ie ld Lurg i P l an t and the High P res su re Grid System. The I n s t i t u t i o n of G a s Engineers 100th Annual General Meeting, May 1963, London, England.
Schus te r , F r i t z . The Chemical Reaction of Methane Formation i n Oxygen Pressure Gas i f i ca t ion . Das Gas und Wasserfach 104 (49), 1963, pp. 1418-1419.
Divis ion of Fuel Chemistry,
G a s i f i c a t i o n of Sol id Fuels i n Germany by the Lurg i , Winkler
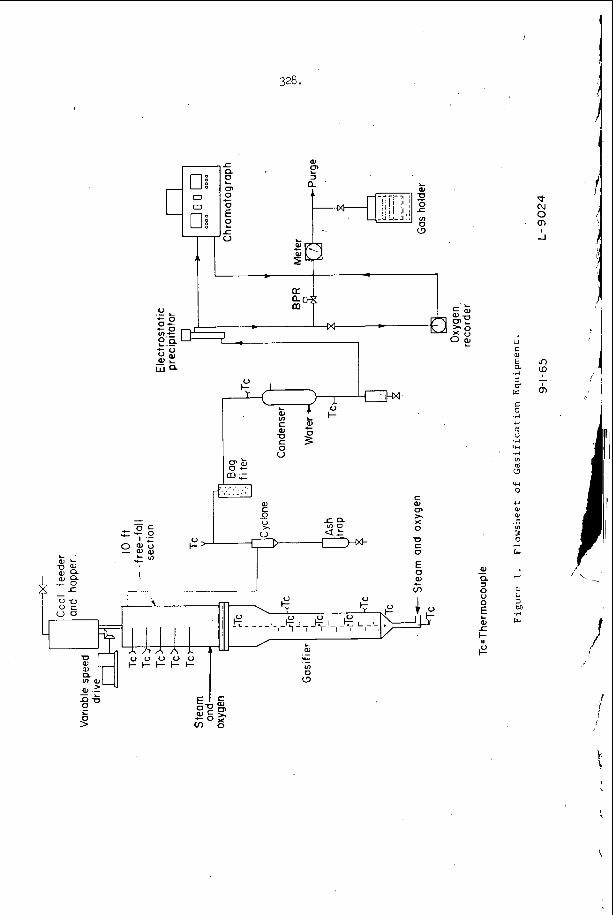
326.

I , Figure 2 . Gasification Equipment.
\
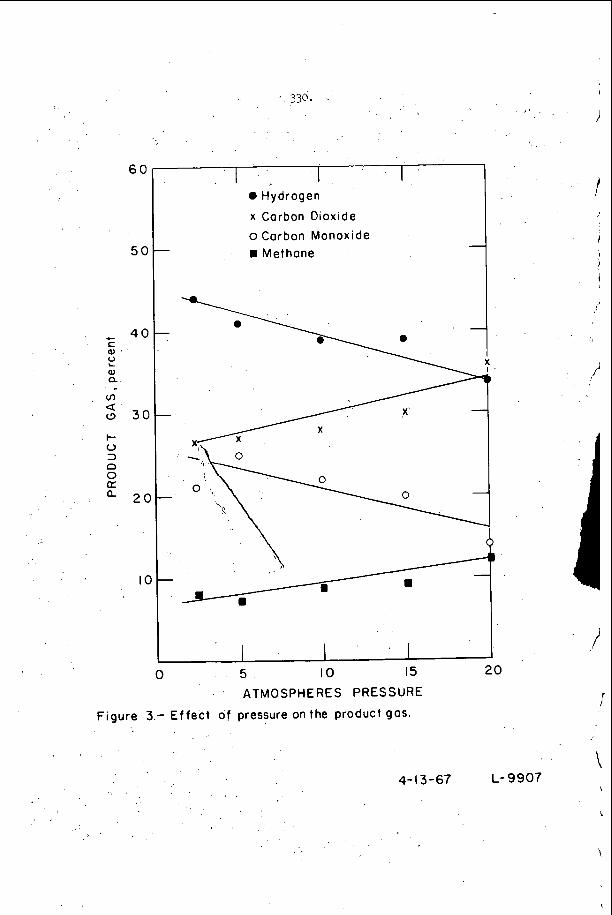
O U a
6 0
50
4 0
3c
2c
I (
. 330. ~
0 Hydrogen
x Carbon Dioxide o Carbon Monoxide 8 Methane
\
0 5 I O 15
ATMOSPHERES PRESSURE
Figure 3 - Ef fec t o f pressure on the product gas.
4- 13-67
I
20
L- 9907
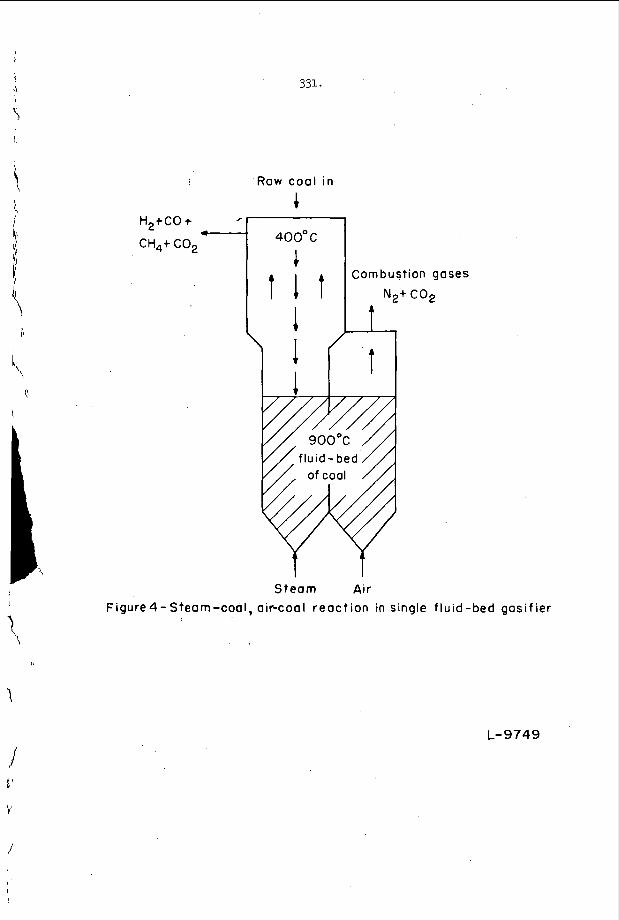
331.
4 c
H,tCO + 0
t-- CH4t C 0 2
h I
h
Raw coal i n
c 4OO0C
4 t l t Combustion gases
N2+ CO2
T 1 S t e a m Air
Figure 4 - Steam -coal, air-coa I r e a c t ion in single f I u id -bed gasif ier I
L-9749
I
t
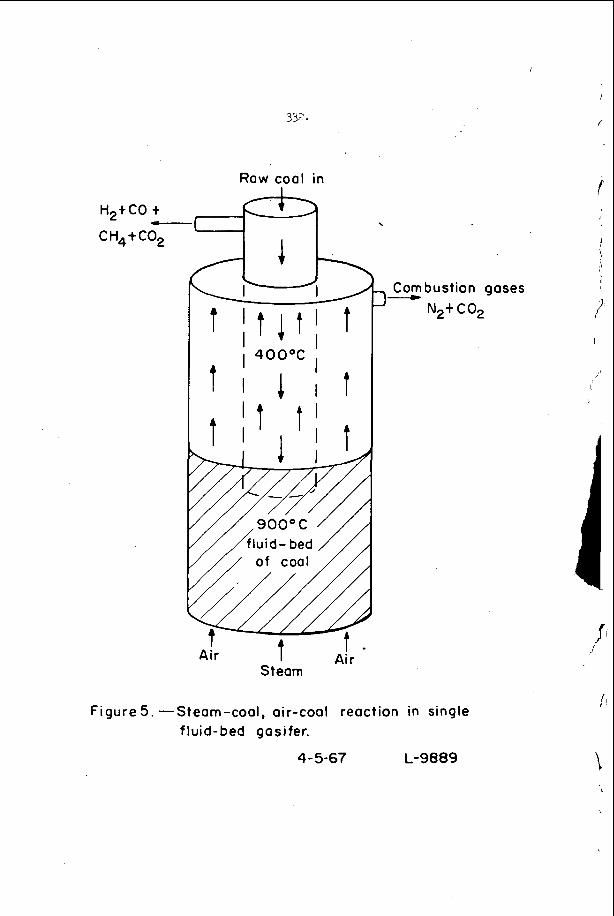
I
33;:. I
I
H 2 t C 0 t
CH4+C02 c-- I
t
Raw coal in 2 t
.
Corn bustion gases '- Net CO,
I'
I
Figure 5 . -Steam-coal, oir-cool reaction in single fluid-bed gosifer.
4-5-67 L-9889
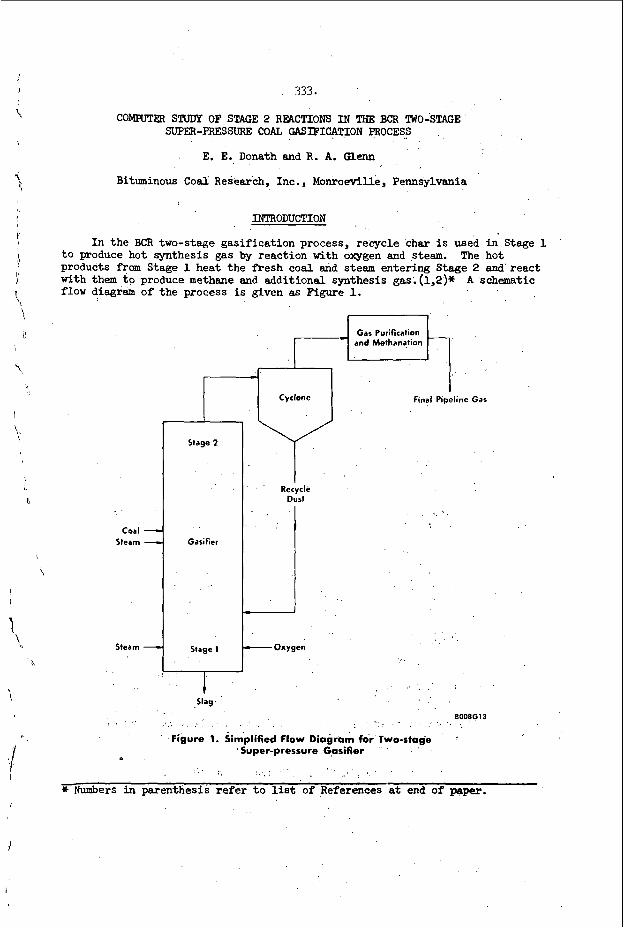
333.
C O W E R STUDY OF STAGE 2 REACTIONS IN THE BCR TWO-STAGE SUPER-PRESSURE COAL GASIFICPTION PROCESS
E. E. Donath and R. A. Glenn
Bituminous C o a l Research, Inc., MonroeviUe, Pennsylvania
INTRODUCTION
In the BCIi two-stage gasification process, recycle char i s used i n Stage 1 t o produce hot synthesis gas by reaction with oxygen and steam. products from Stage 1 heat the fresh coal and steam entering Stage 2 and react with them t o produce methane and additional synthesis gas.(l,2)* A schematic flow diagram of the process is given as Figure 1.
The hot
Gas Purification and Methanation
Slag
Recycle Dust
- Oxygeri
8008G 13 . . Figure 1. Simplified flow Diagram for Two-stage
' Super-pressure Gasifier
.
* Numbers i n parenthesis refer to l ist of References at end of paper.
334.
For the past two years, laboratory research has been under way t o estab- l i s h the optimum conditions for operation of Stage 2 of t h i s conceptual process. Results of some of these experimental studies have already been reported. (3,4) This paper reports the results of a ccarputer study of the thermochemistry of the -:stage process with emphasis on the ef lects of variations i n the operating condltlons. (a) to guide the experimental studies; and, (b) t o indicate the corresponding ef- fects of these variables on the final cost of pipeline gas as derived in the i n i t i a l economic evaluation of the process. (1,2)
These data were needed:
According t o the i n i t i a l economic evaluation of the overall process (l), the yield of methane produced directly from coal is of major importance for the economics of the process. consideration must be given t o th i s reaction and means must be available for determining the extent it occurs.
I n a study of the thermochemistry involved,
A t the time the study was begun, kinet ic data for the ra te of methane formation were not available; however, it was known tha t methane formation at the temperatures visualized for Stage 2 is a very rapid reaction ( 5 ) , and tha t observed methane yields correspond t o the thermodynamic equilibri? of the reaction
i f an act ivi ty that varies from 1 t o 3.4 is assumed for the carbon.(6) c + 2 * = cH4 (1)
Therefore, it was arb i t ra r i ly assumed for the present study that methane yields computed on t h i s basis would be apt t o respond t o changes in Stage 2 temperature and pressure, and thus, they would be more r e a l i s t i c than selec- t ion of fixed methane yields. In addition, it was assumed that the r e s t of the carbon would be converted t o CO + I@ by reaction with steam and oqgen.
reaction came t o equilibrium a t reaction temperature according t o the e q u t ion :
For the well known water-gas sh i f t reaction, it was assumed that the
co + *o = co t * (2 1 For the evaluation of the effects of the various operating parameters,
such as oxygen/coal ra t io , steam/coal ra t io , operating pressure, preheat temperatures, etc., one M h e r assumption is necessary--namely, thermal equilibrium i n each stage of the gasif ier i s achieved.
BASIS AND PROCEDURE FOR COMHJ'lZR PROGRAM
In making the ccmputer calculations, values for the Various operating conditions prevailing in Stage 1 and Stage 2 are first designated, together with an a rb i t ra r i ly chosen Stage 1 product gas composition. Then, the heat of reaction is calculated for the reaction of recycle char with oxygen and steam i n Stage 1 t o form the Stage 1 product gas of the a rb i t ra r i ly chosen composition. The heat of reaction is calculated from the heating value of the recycle the Stage 1 gas exit temperature.
and of the Stage 1 product gas, and then used t o calculate
Assuming that the water-gas s h i f t equilibrium is established a t this temperature of Stage 1, a new gas canposition is calculated next and then used t o correct the gas temperature. Stage 1 exi t gas temperature is found that has a calculated accuracy of
This process i s repeated until a
2 5 c.
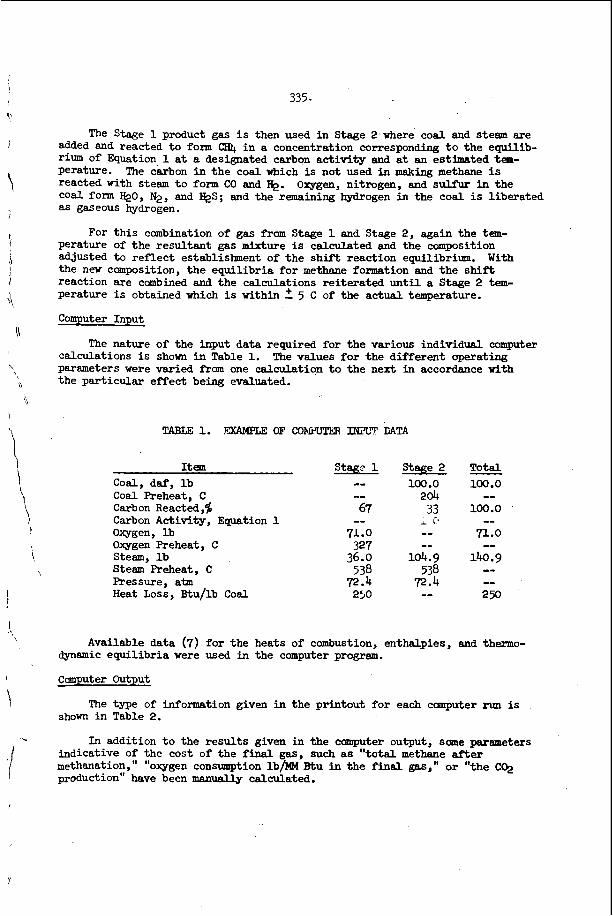
335.
I
I
The Stage 1 product gas i s then used i n Stage 2,where coal and steam are added and reacted t o form CHI+ i n a concentration corresponding t o the equilib- rium of Equation- 1 a t a designated carbon act ivi ty and at an estimated tern- Perature. reacted Kith steam t o form CO and 9. coal form QO, %, and &S; and the remaining hydrogen i n the coal is liberated as gaseous hydrogen.
The carbon i n the coal which is not used in making methane is Oxygen, nitrogen, and sulfur in the
For th i s combination of gas from Stage 1 and Stage 2, again the tern- perature of the resultant gas mixture is calculated and the camposition adjusted t o ref lect establishment of the shift reaction equilibrium. W i t h the new composition, the equilibria for methane formation and the shift reaction are cmbined and the calculations reiterated u n t i l a Stage 2 tem- perature i s obtained which i s within 2 5 C of the actual temperature.
Computer Input
The nature of the input data required for the various individual Computer calculations is shown i n Table 1. parameters were varied from one calculation t o the next i n accordance Kith the particular effect being evaluated.
The values for the different operating
!.
\
I tem coal, daf, l b Coal Preheat, C Carbon Reacted,$ Carbon Activity, Equation 1 Oxygen, l b Oxygen Preheat, C Steam, l b Steam Preheat, C Pressure, a b Heat Loss, Btu/lb Coal
Stag? 1 -- "- 67
71.0 327
36.0 538
72.4 250
--
Stage 2 100.0
204 33
I C -- -- 104.9
538 72.4 --
Total 100.0
100.0
71.0
140.9
- -- -- --
Available data (7) for the heats of cambustion, enthalpies, and thermo- , dynamic equilibria were used in the computer program.
I computer output
The type of information given in the printout for each computer run is
In addition t o the resul ts given in the ccPnputer output, sane paremeters
shown in Table 2. \
indicative of the cost of the f inal gas, such as "total methane after methanation," "oxygen consumption l b m Btu in the final gas," or "the co;! i '- production" have been manually calculated.
I
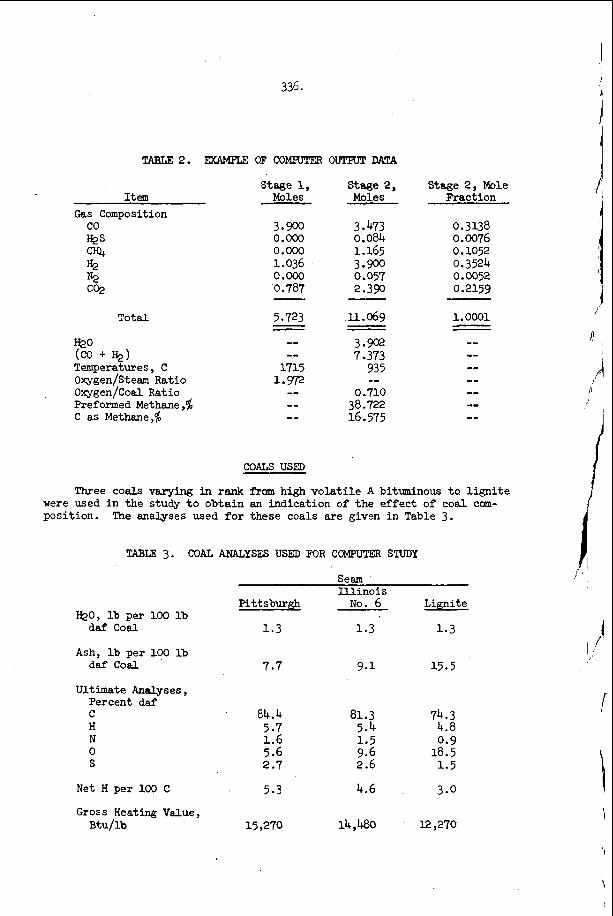
336.
Stage 1, Item Moles
co 3.900 &S O.OO0
0.000 1.036
CH4
O.OO0 H2
0.787 N2 CQJ
Gas Composition
-
Stage 2, Moles
3.473 1.165 0.084
3-90 0.057 2.390
Total
WO Temperatures, C Oxygen/Steem Ratio Oxygen/Coal Ratio Preformed Methane,$ C as Methane,'$
(a + % I
Stage 2, Mole Fraction
0.3138 0.0076 0.1052 0.3524 0.0052 0.2159
1.0001 - -
COALS USED
Three coals varying in rank from high volatile A bituminous tc) lignite were used in the study to obtain an indication of the effect of coal cam- position. "he analyses used f o r these coals are given in Table 3.
!!!ABLE 3 . COAL ANALYSES USED FOR COMPUTER STUDY
WO, lb per 100 lb daf Coal
Ash, lb per 100 lb daf Coal
Ultimate Analyses, Per cent daf C H N 0 S
Net H per 100 C
Gross Heating Value, Btu/lb
Seem Illinois
Pittsburgh NO. 6 Lignite
1.3 1.3 1-3
7.7 9.1 15.5
84.4 81.3 74.3 5.7 5.4 4.8 1.6 1.5 0.9 5.6 9.6 18.5 2.7 2.6 1.5
5.3 4.6 3.0
i I
I
I I
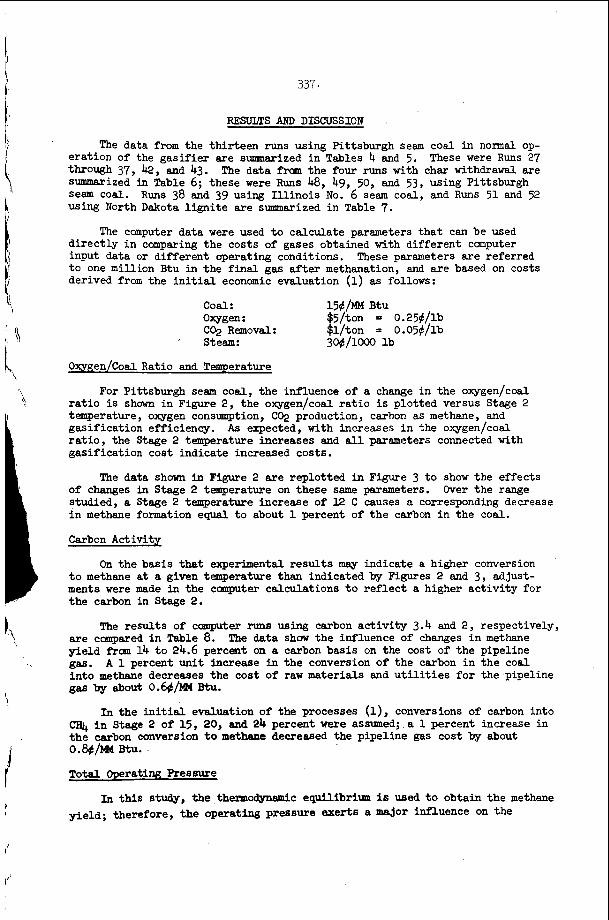
337.
RESULTS ANI) DISCUSSION
The data from the thirteen runs using Pittsburgh seam coal in normal op- These were Runs 27
The data from the four runs with char withdrawal are
Runs 38 and 39 using I l l i no i s No. 6 seam coal, and Runs 5 1 and 52
eration of the gasif ier are summarized in Tables 4 and 5. through 37, k , and 43. summarized in Table 6 ; these were R u n s 48, 49, 50, and 53, using Pittsburgh Seam coal. using North Dakota l ign i te are s m e r i z e d i n Table 7.
The computer data were used t o calculate parameters tha t can be used direct ly i n camparing the costs of gases obtained with different computer input data or different operating conditions. t o one million Btu in the f i n a l gas a f t e r methanation, and are based on costs derived from the i n i t i a l econcrmic evaluation (1) as follows:
These parameters are referred
coal: 15#/MM Btu oxygen: $5/ton = 0.25#/lb C q Removal: $l/ton = O.O5#/lb
' Steam: 30$/1000 l b
Owgen/Coal Ratio and Temperature
For Pittsburgh seam coal, the influence of a change in the oxygen/coal r a t i o is shown in Figure 2, the owgen/coal r a t io is plotted versus Stage 2 temperature, oxygen consumption, CCQ production, carhon as methane, and gasification efficiency. r a t io , the Stage 2 temperature increases and all parameters connected with gasification cost indicate increased costs.
As expected, with increases i n the oxygen/coal
The data shown in Figure 2 are replotted in Figure 3 to show the effects of changes in Stage 2 temperature on these same parameters. studied, a Stage 2 temperature increase of l2 C causes a corresponding decrease i n methane formation equal t o about 1 percent of the carbon in the coal.
Over the range
Carbon Activity
On the basis that experimental results m a y indicate a higher conversion t o methane a t a given temperature than indicated by Figures 2 and 3, adjust- ments were made in the ccanputer calculations t o re f lec t a higher act ivi ty f o r the carbon in Stage 2.
are cornpared in Table 8. The data show the influence of changes i n methane yield frcun 14 t o 24.6 percent on a carbon basis on the cost of the pipeline gas. A 1 percent uni t increase in the conversion of the carbon in the coal in to methane decreases the cost of raw materials and u t i l i t i e s fo r the pipeline
The resul ts of ccnnputer runs using carbon ac t iv i ty 3.4 and 2, respectively,
gas by about o.@/UM Btu.
In the initial evaluation of the processes ( l ) , conversions of carbon into cR1, in Stage 2 of 15, 20, and 24 percent were assumed; a 1 percent increase i n the carbon conversion t o methane decreased the pipeline gas cost by about O.&/M Btu.
Total Operating Pressure
In th i s Study, the thermodynamic equi l ibr im is Used t o obtain the methane yield; therefore, the operating pressure exerts a major influence on the
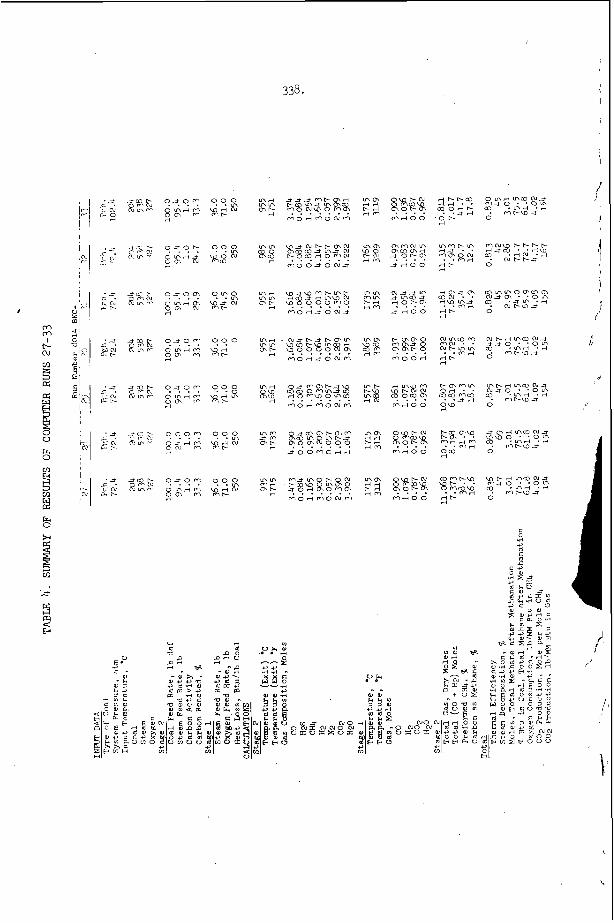
I
m rn A N
f 0
V
8
8
338.
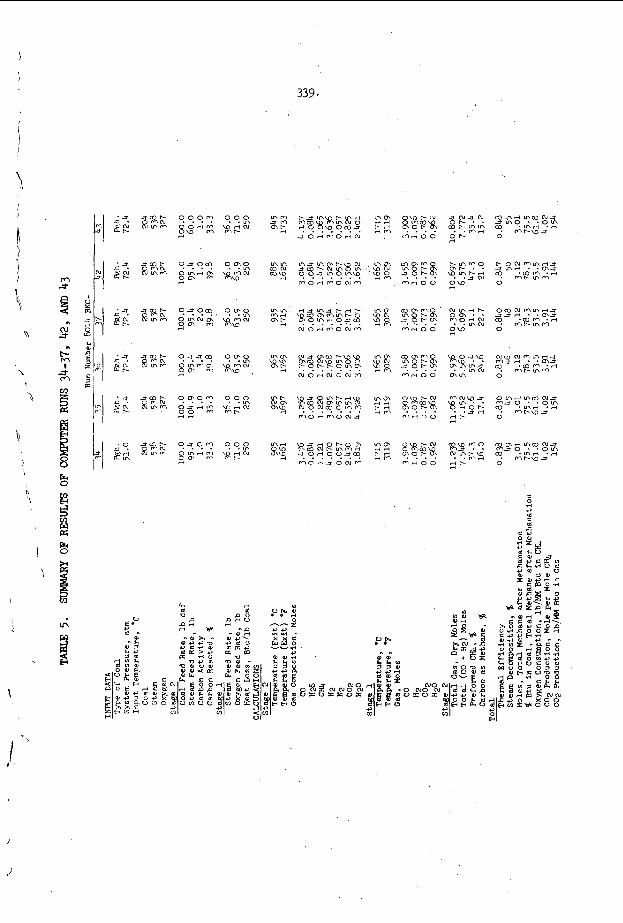
339.
c +J
N O (UNO N x e v x
OJO 0 a0 hr U P U P
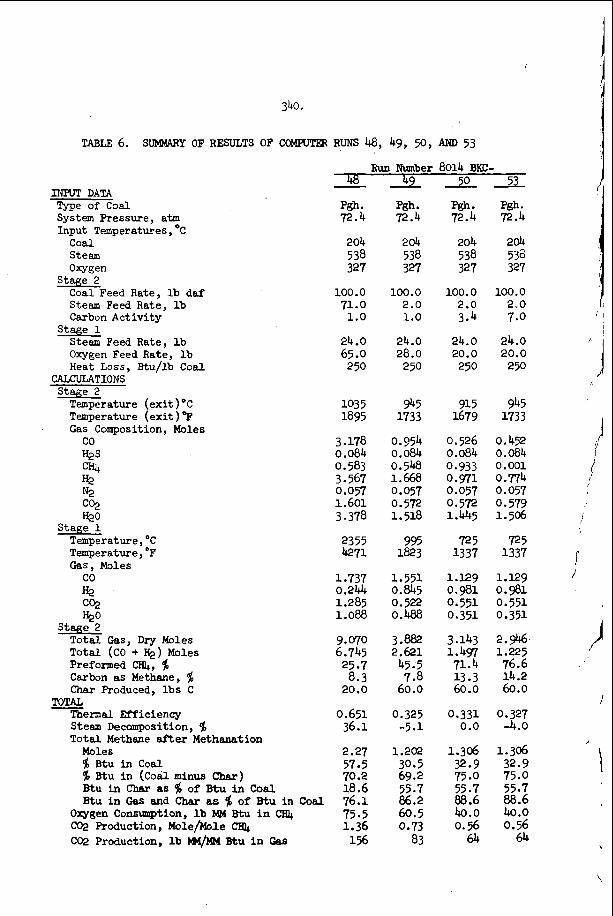
/
340.
TABLE 6. SUMMARY OF RESULTS OF COMAPPER RUNS 48, 49, 50, AND 53
INAIT DATA Type of Coal System Pressure, atm Input Temperatures , OC
coa l Steam Oxygen
stage -2 Coal Feed Rate, l b daf Steam Feed Rate, l b Carbon Activity
Stem Feed Rate, l b Oxygen Feed Rate, l b Heat Loss, Btu/lb Coal
Stage 1
CALCULATIONS Stage 2
TemDerature (exit 1 O C
Temperature (exit) "F Gas Composition, Moles
co H2s w % N2 C% Ik20
Stage 1 Temperature, O C
Temperature, O F
Gas, Moles co H2 co;, %O
stage-2 Total Gas, D r y Moles Total (CO + Hp) Moles Preformed m, $ Carbon as Methane, (g Char Produced, lbs C
TOTAL Thernal Efficiency Steam Decamposition, $ Total Methane after Methanation
Moles (g Btu in Coal $ M u i n (Cod minus char) Btu in char 8 8 $ of Btu in Coal tu i n as and char as $ of mu i n c o d
Oxygen Consumption, l b MM Btu i n CH4 C@ Production, M o l e B l e C@ Production, l b M/MM Btu i n Oas
48
pgh. 72.4
204 538 327
100.0 71.0 1.0
24.0
250
-
65.0
1035 1895
3.178 0.084 0.583 3.567
1.601 3.378
0.057
2355 e71
1.737 0.244 1.285 1.088
9.070 6.745 25 -7 8.3
20.0
0.651 36.1
2.27 57.5 70.2 18.6 76.1 75.5 1.36 156
L
Pgh . 72.4
204 538 327
100.0 2.0 1.0
24.0 28.0 250
945 1733
0.354 0.084 0.548 1.668 0 057 0 - 572 1.518
995 1823
1.551 0.845 0.522 0.488
3.882 2.621 45.5 7.8
60.0
0.325 -5.1
1.2m 30.5 69.2 55.7 86.2 60.5 0.73
83
Run Number 8014 BKC- lr9 50 2 2 -
Pgh. Pgh. 72.4 72.4
204 204
327 327
100.0 100.0 2.0 2,o
538 538
3.4 7.0
24.0 24.0 20.0 20.0 250 250
915 945 1679 1733
0.526 0.452 0.084 0.084 0.933 0.001 0.91 0.74 0.057 0.057
1.445 1.506 0.572 0.579
725 725 1337 1337
1.129 1.129 0.981 0 . 9 1 0.551 0.551 0.351 0.351
3.143 2.946 1 . 4 g 1.225 71.4 76.6 13.3 14.2 60.0 60.0
0.331 0.327 0.0 -4.0
1.306 1.306 32.9 32.9 75.0 75.0 55.7 55.7 88.6 88.6 40.0 40.0 0.56 0.56 64 64
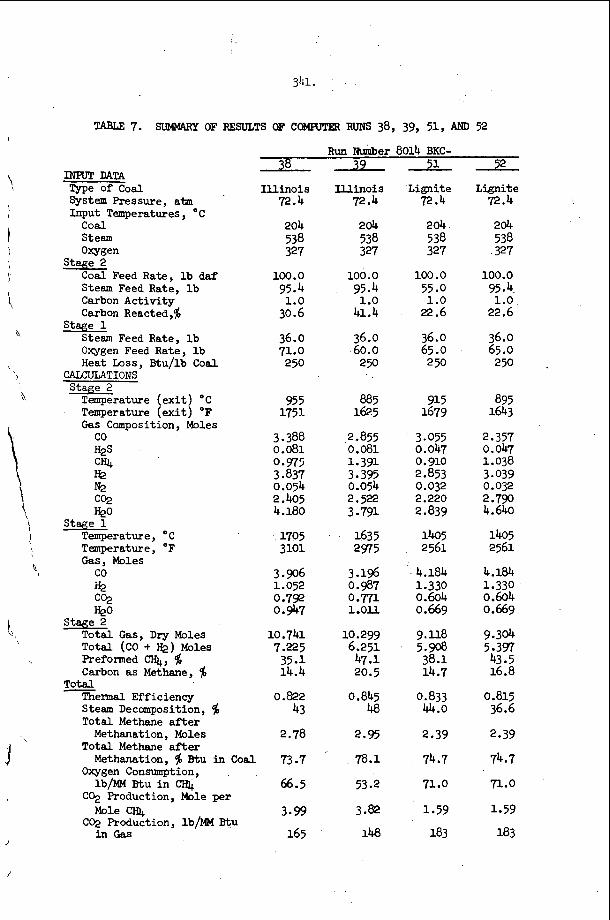
INAPT DATA Type of Coal System Pressure, atin Input Temperatures, OC coal Steam Ovgen
Coal Feed Rate, lb daf Steam Feed Rate, l b Carbon Activity Carbon Reacted,$
Stage 2
Stage 1 Steam Feed Rate, lb Oxygen Feed Rate, l b Heat Loss, Btu/lb Coal
Temperature (exit) OC Temperature (exit) OF Cas Composition, Moles
CALCULATIONS Stage 2
co H2S cH4 &? F2 c?2 %O
Stage 1 Temperature, OC Temperature, OF Gas, Moles co % co;, %O
Stage 5 Total Gas, Dry Moles Total (CO + e) Moles Preformed q, $ Carbon as Methane. 4&
. I
Total - Thermal Efficiency Steam Decomposition, $ Total Methane a f t e r Methanation, Moles
Total Methane after Methanation, Btu in Coal
Oxygen Consumption, lb/MM Btu in CIP,
C% Production, Mole per Mole C€R+
CO;, Production, lb/hM Btu inGas
Run Number 8014 BKC- 38395152 Illinois
72.4
204 538 327
100.0 95.4 1.0
30.6
36.0 71.0 2 50
955 1751
3.388 0.081 0.975 3.837 0.054 2 .bo5 4.180
' 1705 3101
3.906 1.052 0.792 0.947
10.741 7.225 35 -1 14.4
0.822 43
2.78
73.7
66.5
3.99
165
Illinois 72.4
204 538 327
100.0
1.0 41.4
95.4
36.0 60.0 250
885 1@5
2.855 0.081 1 * 391 3.395 0.054 2.522 3 -791
1635 2975
3.196 0.987 0.771 1.oll
10.299 6.251 47.1 20.5
0.845 48
2.95
78.1
53.2
3 .&
148
Lignite 72.4
204 538 327
100.0 55 .O 1.0
22.6
36.0 65 .o 2 50
915 1679
3 * 055 0.047 0.910 2.853 0.032 2.220 2.839
1405 2561
4.184
0.604 0.669
1.330
9.118 5.908 38.1 14.7
0.833 44.0
2.39
74.7
71.0
1-59
183
Lignite 72.4
204 538 327
100.0 95.4. 1.0
22.6
36.0 65.0 250
895 1643
2.357 0.047 1.038 3 - 039 0.032
4.640
1405 2561
2.790
4.184
0.604 0.669
1.330
9.304 5.397 43.5 16.8
0.815 36.6
2.39
74.7
71.0
1.59
183
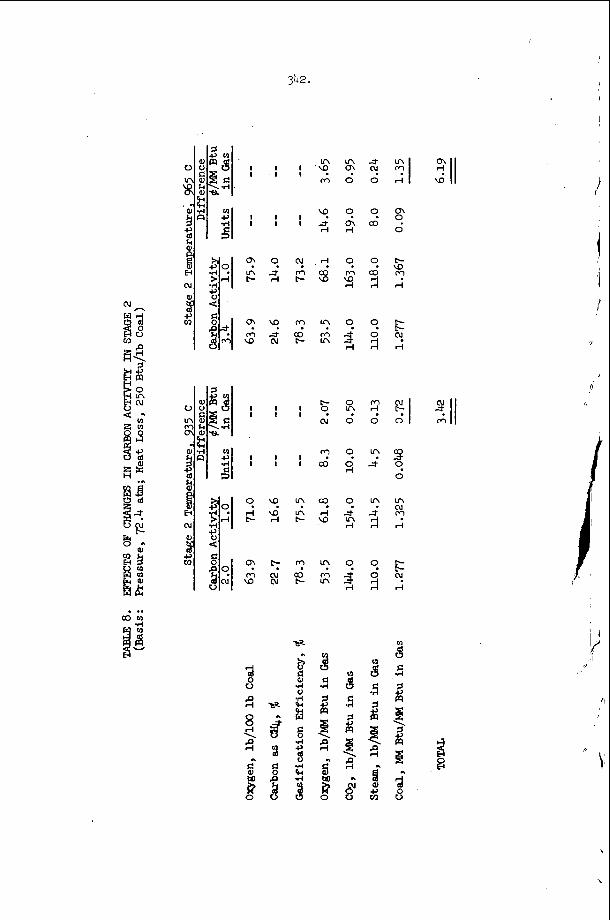
342.
Ln
'4 In
0 o!
3
0 'u. I
I I
. I I I
m
? m rl
9 co
a\
0 9 '9
f r(
I I
I I
I I
c In b
? f rl
cu. 0 P-
? =I co
c pr) u)
'9 f (u
";' m In s rl
9 3 cu.
rl
t- 9 5?
0
? 0 rl
a 0 cu
In
f 3 9 0
'4 u) rl
c9 rl \o
9 t, rl
a? W \o
p: (u 01
? a3 b
";' W In s rl
2
i!i
.a 7d 0 0 2 5 c
.rl I I
s 8 .=I 5
B E fl \ s
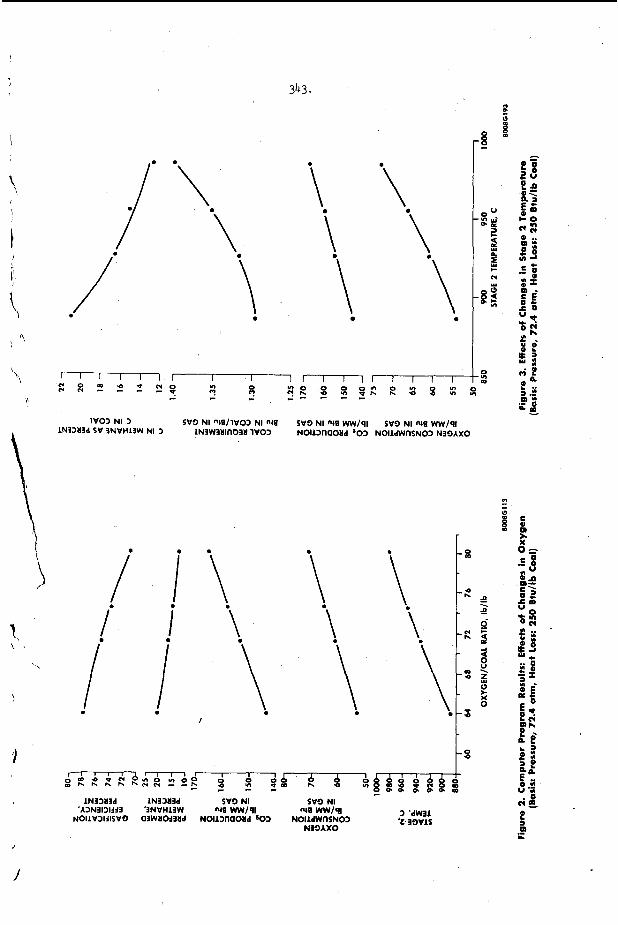
\
3
343.
N
* I
l V O 3 NI 3 5\13 NI "48/1V03 NI n4B SV9 NI WE WW/qI SV9 NI "(E WW/91 lN3383d SV 3NVH13W NI 3 lN3W381nO38 lVO3 N0113na01d '03 NOlldWtlSN03 N39AXO
I
I I
P e . g d 4 8 t e .
344.
yield. By comparing the results from Run 33 and Run 34 with thcae from a run a t the standard operating pressure, it i s noted tha t a change i n pressure, e i ther fram 72.5 t o 51 a b , o r from 72.5 t o 102 a b , produces a change i n raw material and u t i l i t y costs equivalent t o about 295/MM Btu pipeline gas; op- eration a t the higher pressure gives the cheaper gas i n each case. ison, the same change i n gas cost of 2#/M Btu would be produced by a change of about $10 million i n the investment costs for a 250 MM scfd plant. economic evaluations and experimental results w i l l be needed t o find the optimum pressure for the lowest cost of gas and/or c a p i t a investment.
By ccmrpar-
Further
Heat Loss and Preheat Temperature
Another factor influencing the gas yield i s the heat loss in the gasifier. A s reference value, a heat l o s s of 250 Btu/lb of coal, or 1.6 percent of the heating value of Pittsburgh seam coal, has been assumed. This i s an arbitrar- i l y chosen figure tha t i s based on extrapolation of mai lable data t o pressure operation. coal, respectively, were compared with resul ts f o r 250 Btu heat loss at the same Stage 2 temperature. increases the gas cost by about 2$/1.pI Btu pipeiine gas. studies will be needed t o determine whether the actual methane yield i s influenced t o the extent indicated here. plant wil l establish rel iable data for the heat loss i n a commercial unit.
A study of different preheAt temQei-a:uz:: L iet:ia+z l:5 n;t api;ear necessary. Differences i n the enthalples of tht various Ira-c--.rials due t o changes i n preheat temperature, have the srunr: iiifluence a.: changes i n heat loss.
Computer Runs 29 and 30 for heat losses of 500 and 0 Btu/lb o f
A n increase i n heat loss of 250 Btu/lb coal Again, experimental
?nly experiments i n a large p i lo t
Steem/Coal Ratio
Several computer runs were uade us i -g varl JUS S! ia~,’ccai ratios:
I n Computer Runs 28 and 35, data for 24.0 and 104.9 pound stem per 100 pound coal i n Stage 2 were obtained for cmparison t o the “standard” quantity of 95.4 pound; no changes were made in th2 amount of steam entering Stage 1, 36.0 pound steam per pound coal being used i n all instances.
In Computer Run 26 with 60 pound t o t a l stem? per 100 pound coal, the Stage 2 temperature was 20 C above that i n Run 35, being 945 C, as canpared t o 925 c.
Unless reaction kinetics demand a high steam/coal ra t io , a r a t io below 130 lb/100 l b coal should be selected fo r purely heat balance reasons. Further study of the u t i l i za t ion of the gasification steam i n the s h i f t reactor i s indicated. gas plant.
A
Such a reactor would be par t of a n integrated pipeline
Withdrawal of Recycle Char
Cn the premise tha t it may become desirable t o withdraw recycle char for use as boiler fuel rather than fresh coal, Computer R u n s 48, 49, 50, and 53 were made t o indicate resul ts which m i g h t be expected with such an operation. The Part ia l gasification shows lower costs for pipeline gas i n all cases: the lowest difference is 2.4 cents, the highest 13.3 cents per MM Btu b e e d on raw material and u t i l i t y costs only, assuming a char credit a t the Btu price of the coal and only a minor char handling expense.
345.
Additional experimental data w e needed t o bet ter define the methane yield and operating temperature for char withdrawal i n canparison t o these same parameters for complete gasification.
Changes in Coal Feed Stock
To obtain data on the effect of coal rank on the cost of pipeline gas, Several computer runs were made with coals differing i n rank from Pittsburgh Seam coal, namely, Runs 38 and 39 with I l l i no i s No. 6 coal and Runs 51 and 52 with l igni te . Price per MM Btu in the dried coal and the same Stage 2 temperature, the Pipeline gas cost i s similar. On the same basis, the greater thermal bal las t i n the l igni te , mainly i t s high owgen content, leads t o a higher cost of gas made from l igni te . for l ign i te , the gas cost becmes the same.
For Pittsburgh seam coal and I l l i no i s No. 6 coal a t the same
However, if one assumes a 60 C lower Stage 2 temperature
Again, further experimentation w i l l lead t o a bet ter definition of the best operating temperature for the various coals and a bet ter comparison of cost will be possible.
CcPnparison of Experimental and Computer Results
E?cperimental Stage 2 gasification data fo r l i gn i t e (3) are compared with COqYuter resul ts i n Table 9. The experimental resul ts show a somewhat higher methane yield i n sp i te of higher Stage 2 temperatures. not surprising since the methane yield is determined by reaction kinetics and factors such as pa r t i a l pressures of reactants and the ra t ios of Stage 1 gas, steam, and coal, rather than by the thermodynamic equilibria.
This discrepancy is
The higher experimental yield of .(CO + (2%) w i l l lead t o a smal ler amount of char available fo r Stage 1 than used i n the computer run. This will, a t the same oxygen/coal ra t io , lead t o a higher Stage 1 temperature. the higher temperature i n Stage 2 indicated by the experiments, a higher owgen/lignite r a t io than the 0.65 lb/lb assumed in computer Run 51 will be needed. I n the feed streams entering Stage 2 in the experimental runs, the pa r t i a l pressure of (CO + e) is lower; and tha t of C i s higher than i n the computer run. This i s i n accord with a higher oxygen$.gnite r a t io as required t o a t t a in the higher temperature used in the experimental runs. may be noted tha t the Stage 1 gas/lignite ra t ios and the steam/lignite ra t ios i n the two experimental runs bracket these same parameters i n the ccmrputer runs
The computer data reported i n t h i s study have been useful i n providing
To a t ta in
It
guidance for the selection of experimental parameters such as feed stream composition and reactant ra t ios fo r the externally-heated experimental 5 lb/hr flow reactor being used for the study of Stage 2 reactions. They w i l l be equally useful in the operation of the intern--heated 100 lb/hr process and equipnent developent uni t now being erected.
The computer program used i n t h i s study mey also be useful as a basis i n preparing an improved program in which the methane content of the Stage 2 gas is determined by kinetic data. 5 lb/hr unit, and later the 100 lb/hr unit, w i l l . supply such data.
It i s expected that *her operation of the
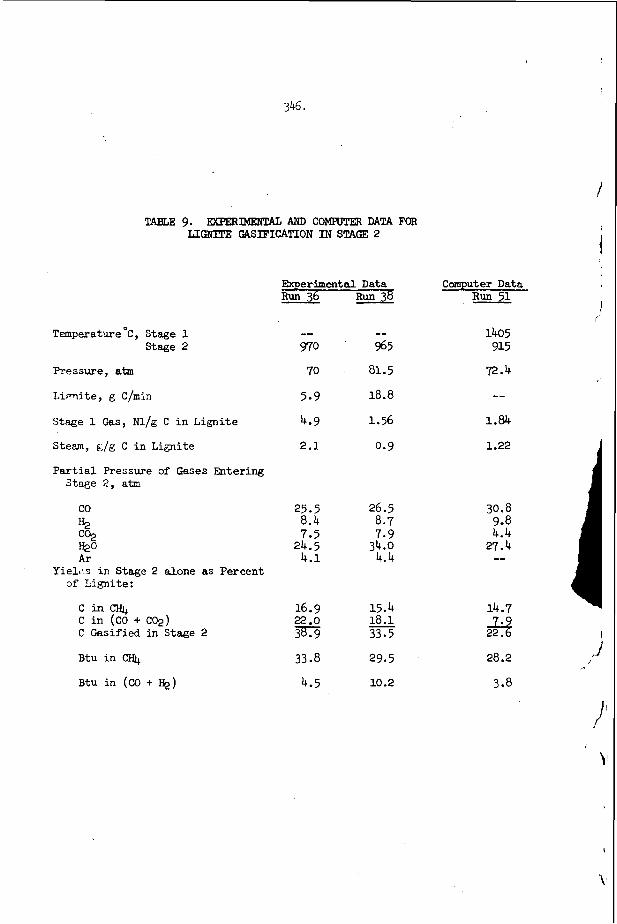
Temperature’C, Stage 1 Stage 2
Pressure, a b
Limi te , g C/min
Stage 1 Gas, Nl/g C i n Lignite
Steam, d/g C i n Lignite
Par t ia l Pressure of Gases Entering Stage 2, atm
co H2 co, H20 A r
YieLls i n Stage 2 alone as Percent of Lignite :
C i n C H q c in (CO + CQ) C Gasified in Stage 2
Btu in CI-4
Btu in (CO + %)
Experimental Data Run 36 E&
-- -- 970 965 70 81.5
5.9 18.8
4.9 1.56
2.1 0.9
25.5 26.5 8.4 8.7 7.5 7.9 24.5 34.0 4.1 4.4
16.9 15.4 18.1 33.5 -
33.8 29.5
4.5 10.2
I
346.
TABLE 9. EXPERlME3TAL AM) COMRPPER DATA FOR LIGNlTZ W I F I C A T I O N IN STAGE 2
Computer Data RU 51
1405 915
72.4
1.84
1.22
30.8 9.8 4.4 27.4 --
14.7 5s 28.2
3.8
347.
This paper reports resu l t s fran a program of research being conductedby Bituminous Coal Research, Inc., Kith support fmrm the Office of Cod Research, U.S. Department of the Interior, under Contract No. 14-01-0001-324. authors wish t o thank the Office of Coal Research f o r permission t o publish t h i s paper.
The
The authors also wish t o express the i r thanks t o Epr. E. J. Vidt and the Blaw-Knox Company for preparing the computer program and making the com- putations.
1.
2.
3.
4.
5.
6 .
7.
REFEFENCES
"Gas Generator Research and Development - Survey and Evaluation," (Bituminous C o a l Research, Inc., Report L-156), Two Volumes, 650 pp, Washington, D.C. :
Donath, E. E. and Glenn, R. A., "Pipeline gas from coal by --stage entrained gasification,
U.S. Government Printing Office, 1965.
Proc. AGA Production Conference, a, 65-P-147 t o 65-P-151 (1965).
GleM, R. A., Donath, E. E., and Grace, R. J., "Gasification of coal under conditions simulating stage 2 of the BCR two-stage super-pressure gasifier," Am. Chem. Soc., Div. Fuel Chem. Preprints 2 (4) , 97-12 (1966).
Glenn, R. A. and Grace, R. J., "Iaboratory-scale flow reactor for studying gasification of coal under conditions simulating stage 2 of the BCR two- stage super-pressure gasif ier , '' Presented a t North-Central Regional AIChE Symp. on Current Trends i n P i lo t Plants, Pittsburgh, Pa., 1967. Peters, W., "Schnellentgasung von Steinkohlen," Thesis, Aachen, 1963; Peters, W. and Bertling, H., '%hetics of the rapid degasification of coals ," Fuel 44, 37-31 (1965).
.
S q u i r e s , A. M., "Steam-oxygen gasification of f ine sizes of coal i n a fluidised bed a t elevated pressure," Trans. Inst. Chem. Ehgrs. (London) a (11, 3-22 (1961).
W a e , D. D., e t al, "Heats, free energies, and equilibrium constants of some reactions involving 02, %, %O, C, CO, C02, and CH4," U.S. Dept. Conrmerce, N a t l . Bur. Std., Res. Rept. 1634 (1945).
348.
CATALFTiC DEHYDROGKNATIM OF COAL 111. HYDROGEN EVOLUTION AS A FUNCTION OF RANK*
R. Raymond, L. Reggel, and I. Vender
Pit tsburgh Coal Research Center, U . S. Bureau of Mines, 4800 Forbes Avenue, Pit tsburgh, Pa. 15213
Dehydrogenation of coa l us ing a one percent palladium on calcium carbonate ca ta lys t i n the presence of phenanthridine as solvent g ives almost pure hydrogen gas as the product. v i t r a i n ; fo r coals ranging from high v o l a t i l e C bituminous t o an th rac i t e , the hydrogen evolution decreases gradually w i t h increasing rank of coa l ; l i g n i t e s and subbituminous coa ls give less hydrogen than do l o w rank bituminous coals. bituminous coa ls , the hydrogen evolution ( a t o m of hydrogen evolved per 100 carbon atoms i n the coal) is a l i n e a r function of the atomic HJC r a t i o and a l s o of the atomic O I C r a t i o . def in ing the bituminous coals. Some ideas on the process of coa l i f i ca t ion are presented: i t is suggested t h a t l i g n i t e s and subbituminous coa ls conta in some cyc l i c carbon s t ruc tu res which are ne i the r aromatic nor hydroaromatic; that low rank bituminous coals conta in la rge amounts of hydroaromatic s t ruc tu res ; and tha t higher rank bituminous coa ls conta in increasing amounts of aromatic s t ruc tu res .
The rank of coal a f f e c t s the y i e ld of hydrogen from the corresponding
For
Ligni tes and subbituminous coa l s f a l l outside of t he l i nea
INTRODUCTION
The vas t l i terature on chemical reac t ions of coal1s2 contains (un t i l qu i t e recently) very few refereuces to any work on dehydrogenation. This may be due In par t to the paucity of systematic s tud ie s on the dehydrogenation of organic compounds under condi t ions which might be expected t o cause r e l a t i v e l y l i t t l e d is rupt ion of the coal s t ruc tu re ; i .e., dehydrogenation in the l iqu id phase? below 40OoC. meta l l i c ca ta lys t s3 , ru l fur3 , aelenium3, and quinones3rk. of coal by su l fu r5 has received considerable a t t en t ion ; t h e hydrogen removed from the coa l i s evolved as hydrogen su l f ide . Selenium has no t , to our knowledge, been used with coa l ; because of the higher tempcrature required and the poor y i e lds usua l ly obtained, selenium seldom of fe r s any advantage over su l fur3 ; in a selenium dehydrogenation, the hydrogen removed is evolved as hydrogen selenide. Benzoquinone with coal has been investigated6; the reaction is a hydrogen t ransfer4 , giving hydroquinone, and the r e s u l t s are d i f f i c u l t t o interpret ' . Iodine as a dehydrogenation agent has a l s o been studied wi th coal8; the hydrogen removed from the coal is evolved as hydrogen iodide. Again, t he r e s u l t s are not easy to evaluate; the temperature of reac t ion is high; and there is very l i t t l e vork on organic compounds which can serve as a bas i s f o r c o m p a r i ~ o n ~ , ~ ~ . Bromine, one of the o ldes t dehydrogenation reagents f , has been of l i t t l e value'.
a t temperatures The dehydrogenation reagents usua l ly used f o r pure compounds are
The dehydrogenation
The f i r s t use of a metallic c a t a l y s t fo r the dehydrogenation of coa l v a s reported by the present au tho re l l ; the r eac t ion was conducted in t he presence of a solvent (vehic le ) , and almost pure hydrogen gas vas evolved. The r e v e r s i b i l i t y of the reduction and dehydrogenation of c o a l has also been investigated1*. paper we wish t o eumarize the development of the method, the experimental
In t h l e
*or the preceding papersin this serieli, see references 11 and 12. t For an exce l len t and up t o d a t e review .see r e f . 3.
349.
procedure, and, most important, the e f f e c t of the rank of the coal upon the amount of hydrogen formed. information which may give some insight i n t o the s t r u c t u r e of coal ; second, t o obtain large amounts of hydrogen from coal . It is hoped tha t development of cheaper solvents and c a t a l y s t s might enable hydrogen t o be produced economically; the coal residue could then be burned f o r fue l .
Thc purpose of these s tud ies is twofold: f i r s t , t o obtain
Preliminary experiments i n which coa l , c a t a l y s t , and vehicle were refluxed showed t h a t the hydrogen evolution was influenced by re f lux r a t e , heating r a t e , bath temperature, and depth of immersion of the react ion f lask i n t o the bath. Accordingly, the previous apparatus used a stirrer and a heating mantlel1,l2. A Hershberg tantalum wire s t i r r e r with a g l a s s bearing lubricated with s i l i cone grease was used; l a t e r , a magnetic s t i r r e r was found t o be more convenient, t o give superior r e s u l t s , and t o obviate c r u s t problems (see below). When the Wershberg s t i r r e r was used, the reactants (0.500 g of dr ied , -200 mesh coa l , 0.550 g of ca ta lys t , and 7.50 g of the vehicle) were weighed i n t o a 50 m l two- neck f l a s k . The charge was mixed thoroughly with a spatula . The f lask was then f i t t e d with the s t i r r e r and with an adapter which included both a dip-tube to serve a s a thermocouple well and a s ide arm which was attached t o a 250 m l gas buret . Provision was made f o r admission of helium t o the system and f o r sampling the evolved gas a f t e r the react ion. The apparatus was thoroughly flushed with helium and pressure-tested f o r leaks. admitting helium t o the system, expel l ing the gas, adding f resh helium, and repeating t h i s procedure three t o f ive times. f lushing, the l a s t expelled f lush can be sampled; it should contain a t l e a r t 99 percent helium (a l l gases were analyzed by mass spectrometry). was then vigorously refluxed (heating mantle) with s t i r r i n g for 5.0 h, preceded by a carefu l ly standardized 0.5-h period of heating up t o temperature. reduced 1 percent palladium on calcium carbonate c a t a l y s t w a s prepared by Engelhard Industr ies , hc.. Newark, N. J . "he s a m batch of c a t a l y r t was uued
Flushing consis ted e s s e n t i a l l y of
As a check upon the eff icacy of
The charge
Tha
i n - a l l of the runs described here , with the exceptions noted below-. Discussion.) constant w i g h t a t looo and 1 mm.
This experimental procedure yas ef fec t ive , but It was not convenient, and the s t i r r e r somqtimes j a m v d i n the bearing, requir ing r e p e t i t i o n of a run. some c a t a l y s t s were found t o convert the coa l t o a hard, b r i t t l e , insoluble
(See The catalyst was dr ied a t 6OoC and 1 nm~; coals were dried t o
Also,
I i.,
crust a f t e r only a short heat ing period; t h i s gave low and e r r a t i c values for hydrogen. heating t o ref lux.) problems and was a l s o m c h more convenient. an e l e c t r i c mantle was used. A pyrex-enclosed a l n i c o s t i r r i n g bar, 7/8 in. long, was placed In the f lask . An a ln ico horseshoe magnet (ca. 50 pound pul l ) vas located below the mantle and rotated by an ordinary s t i r r i n g motor. of the apparatus was as described above.
( C r u s t formation could sometimes be avoided by very slow and prolonged It was found t h a t magnetic s t i r r i n g c i rcuwented these
A 35 m 1 one-neck f l a s k heated by
The r e s t
-re vigorous and crue t formation urua l ly d id not take place. I f i n any With t h i s modification, stirring was
a s o l i d crust began t o form on the surface of the boi l ing l iqu id o r 011 the l r of the f l a r k , r t i r r i n g was stopped and a r r u l l a ln ico magnet warn brought
ar a point on the s ide of the f lask ; t h i s pulled the r t i r r i n g bar away f r a the rge magnet, and the bar w s moved around t o break the c r u s t . The s ~ l l uwt s then removed, and s t i r r i n g resumed v i t h the large magnet. A few repa t i t ions
For mnRt r n n l e , the h ~ l k =f the pee uos = F O ? V ~ ~ daring the first EYO hours of r e f lux , bu t gas evolution was s t i l l continuing a t a slaw rate (ca. 4 or 5 m1 i n 3 0 rain) a f t e r 5 h. A t the end of the reac t ion period, the gas volume was measured and the gas then thoroughly mixed and sampled. A typ ica l ana lys i s (helium-free b a s i s ) f o r the gas from an hvab coal is 96.4 percent U2, 0.5 percent N2, 0.4 percent CH4, 0.1 percent ethylene, 0.6 percent CO, 0.1 percent ethane, 1.5 percent CO2, and small amounts (0.1 percent) of o the r alkanes and alkenes. Lower rank coa l s gave la rger amounts of CO, C02, and CU4. hydrogen i t s e l f was considered t o be hydrogen evolved; hydrogen in hydrocarbons was disregarded. In the ca l cu la t ions , i t was assumed t h a t the gas was saturated v i t h vater vapor. In a l l instances, blank runs (vehicle and c a t a l y s t , no coa l ) were -de and cor rec t ions appl ied . The blanks were found t o be a function of both the vehic le and the c a t a l y s t ; two d i f f e r e n t batches of the same c a t a l y s t would give s l i g h t l y d i f f e r e n t blanks. Coal-vehicle blanks (without ca t a lys t ) vere found to be negl ig ib le and were disregarded. As would be expected, inadequate flushing of the apparatus led t o low hydrogen values. It was alsc found t h a t s l i g h t a i r oxidation of v i t r a i n s r e su l t ed in low hydrogen values; i t is des i r ab le t o use a sample wi th in a period of two weeks of grinding.
We thank D. E. Wolfaon f o r obtaining many of the coal samples used. We are very g ra t e fu l t o B. C. Parks, P i t t sburgh Mining Research Center, Bureau of Nines, who prepared the hand picked v i t r a i n samples.
Only the molecular
DISCUSSICN
I, I I
In the preliminary development of the method, some experiments were done on the dehydrogenation of 1,2,3,4,5,6,7,8-octahydrophenanthrene, using a 5 percent rhodium on alumina catalyst and re f luxing o-terphenyl (bp 332OC) as a vehicle. No s t i r r i n g w a s used. With a ba th temperature of 3OO0-35O0C f o r 1 h, about 98- 99 percent of the theo re t i ca l amount of hydrogen gas was obtained, but the hydrogen evolution was never qu i t e 100 percent. No formation of tr iphenylene (by cyclo- dehydrogenation of o-terphenyl) could be detected. phenanthrene was dehydrogenated in the presence of about 5 percent by weight of dibenzothiophene (no vehic le ) ; t he hydrogen evolution was high (in addi t ion , some hydrogen probably was used t o c leave carbon-sulfur bonds) and the y i e ld of phenanthrene was over 95 percent. It is thus apparent t h a t the s u l f u r in coa l should not poison the dehydrogenation c a t a l y s t . This i s in accord with several r epor t s on the dehydro ena t ion of p a r t i a l l y reduced he terocycl ic su l fu r lo , oxygen13, and nitrogenf4-l7 compounds, in good y i e l d , wi th l i t t le cleavage of the carbon-hetero a t w bond; f o r example, 1,2,3,4-tetrahydrodibenzothiophene is converted t o dibenrothiophene by palladium on carbon in 80 t o 94 percent y ie ld lo .
Experiments were then done on dehydrogenation of v i t r a i n from Bruceton coa l (hvab, P i t t sburgh Bed, Bruceton, Allegheny County, Pa.) with various ca t a lys t s . V i t r a in refluxed (without s t i r r i n g ) 2 h v i t h o-terphenyl and 30 percent palladium on calcium carbonate gave of f about 7.3 percent of the hydrogen in the v i t r a i n as hydrogen gas ; a pyridine-soluble ex t r ac t of Brucetm v i t r a i n under the same conditions gave 9.0 percent of i t s hydrogen; the pyridine soluble extract with phenanthridine as vehicle and 30 percent palladium on calcium carbonate gave 13.7 percent hydrogen i n 2 h r e f l u x and 30 percent hydrogen in 7 h . v i t r a i n with 30 percent palladium on carbon heated at 377O to 402% (no vehic le ) gave 0.2 percent hydrogen. Bruceton v i t r a i n refluxed vith o-terphenyl and various palladium, ruthenium, and rhodium ca ta lyo t s gave 3 t o 7 percent hydrogen. Bruceton v i t r a i n refluxed 2 h with o-terphenyl and a molybdenum s u l f i d e o r tungsten s u l f i d e Catalyst gave both hydrogen (about 2 percent) aod hydrogen s u l f i d e ; these r e s u l t s d id not seem p r w i s i n g and no fu r the r work was done with s u l f ide c a t a l y s t s .
,!i / I
il r i
In one experiment octahydro-
I I
\ Bruceton
A l l of the experiments dircussed above were done with a re f luxing system but no Stirrer. A t t e n t i m then turned t o the develo be s t i r r e d . Our previourly published ~ o r k ~ ~ . ~ w a r done us- the Hershberg stirrer. r t i r r e r (see ExperiPcntal), and is concerned v i t h the e f f e c t of the rank of the coa l upon the hydrogen evolved from the corresponding v i t r a i n . It should be pointed out t h a t comparison of t he present r e s u l t s with previous data shoued tha t , fo r must v i t r a i n s , magnetic stirring gave s ign i f i can t ly g rea t e r y i e lds of hydrogen than did the Herahberg s t i r r e r . v i t r a l n s and ca t a lys t s which have Little tendency t o form c r u s t s with the Hershberg stirrer, an ~ s o l u b i l i e a t i o n reac t ion (polymerization, cross-l inking, e t c . ) takes place during dehydrogenation~uhich r e s u l t s in the coa l being made too insoluble i n the vehicle t o r e a c t fu r the r , a f t e r partial but not complete dehydro- genation. more rapid r a t e and is campleted before in sb lub i l i r a t ion can have mich e f f e c t on the f i n a l hydrogen evolution. which show that for tvo representative v i t r a i n s (Harmattan and Pocahontas No. 31, which give more hydrogen with magnetic than wlth Herrhberg s t i r r i n g , the magnetically s t i r r e d run evolves gas a t a f a s t e r rate. However, f o r Bruceton v i t r a i n (the only v i t r a i n givlng e s sen t i a l ly the sa* hydrogen value f o r both s t i r r i n g methods) the r a t e s of gas evolution are almost the same f o r both runs.
Table 1 g ives the' i den t i ty and source of 36 coals used in t h i s work. Of these, cannel coal was taken with the thought that i t 8 high hydrogen content might lead t o a large hydrogen evolution, a hope which d id not mater ia l ize . Cannel coal was used as the d o l e coal. The two sendanthracites were a l s o whole coals ; micro- scopic examination rhoved that the Western Middle F ie ld contained over 90 percent v i t r a i n ; the Bernice F ie ld was less than 25 percent v i t r a i n . The other 33 coals were used i n the form of hand-picked v i t r a i n s . Tables 2 and 3 give the ult imate analyses of the ramples and the r e s u l t s of dehydrogenation. The results a r e expressed i n three m e : percent of the t o t a l hydrogen i n the coal which is evolved as hydrogen gas; atom of hydrogen evolved per 100 carbon atoms i n the r t a r t i n g material; and milliliters of hydrogen evolved per gram of s t a r t i n g material.* The last f igure (ml/g) can be converted t o cubic f e e t per ton by multiplying by 32.0. This would obviously be of i n t e r e s t in ind ica t i ag i n a very rough vay the possible economic value of the process. obtained is f o r the v i t r a i n f r a n a Utah hvcb coal (Liberty mine) vhich gives 9380 cubic f e e t of H2 gas per too on a dry b a r i r , or 9890 cubic f e e t per ton on a dry ash-free ba r i s . The second f igure (E/lOO C atoms) is r e l a t ed t o the hydroaromatic+ s t ruc tu re r i n the s t a r t i n g coal (neglecting s ide reac t ions fo r the present); any corp le ta ly reduced r t ruc tu re such 8s cyclohexane, decalin, or perhydrocormene vould give a value of 100 H/lW C. R2 evolved) is a l r o r e l a t ed t o the amount of hydroaromatic s t ruc tu re i n the coal , but not i n a eimple and d i r e c t nvPocr; it i o , however, a convenient f igure i n that it expresrer a yield of product.
n t of an apparatus which could
The remainder of the work discursed in th io paper used tb magnetic
It seem8 probable that even with those
With the more e f f i c i e n t IsPgnetic r t i r r i n g , dehydrogenation goes a t a
Sone data rubs tan t ia t ing t h i s ie given i n table 4,
The largest value
The f i r s t f i gu re (percent
*The f i r r t two of there are independent of ash content; the t h i r d is no t , and ie on an m f baris. t The term h y d r o a r a u t i c i r used i n the sense defined by F ie se r and Fierer l8 . Rydro der iva t iver of arautic coapounds are ca l l ed hydroaromatic. Alicyclic rubrUne88 containing r i x d e r e d ringr but having m b r t i t u e n t s t h a t block conversion t o the arovtic r a t e an le r r they are e l b l n a t e d (such as 1.1- d i r t h y k y c l o h e x a n e or I ) - ~ c t h y l d e u l l n ) are not c l a s r i f i e d as hydroarcpatic.
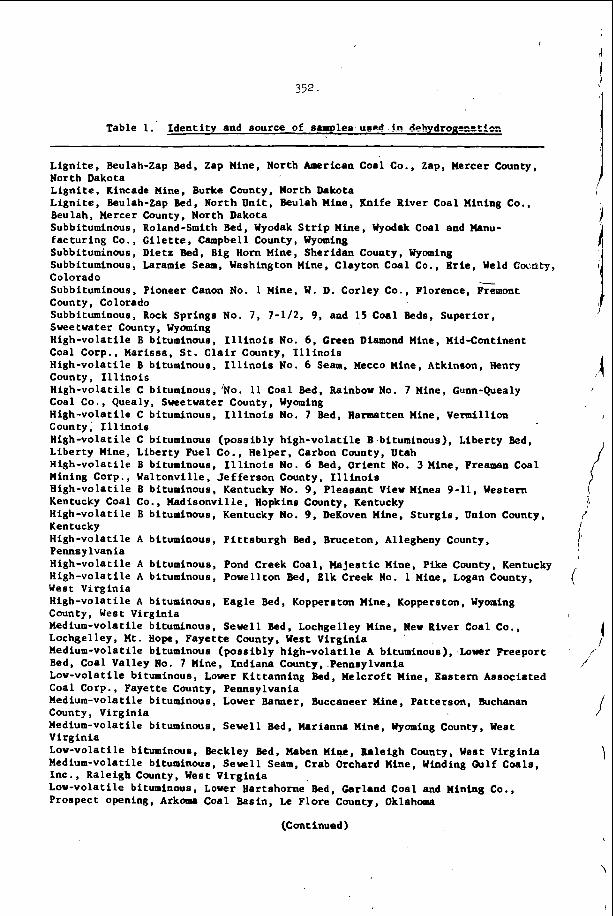
I
352.
Table 1. Iden t i ty and source of samples used %E dehy!rcge==ti=z
Lign i t e , Beulah-Zap Bed, Zap Mine, North American Coal Co., Zap, Mercer County, North Dakota Ligni te , Kincade Mine, Burke County, North Dakota L ign i t e , Beulah-Zap Bed, North Uni t , Beulah Mine, Knife River Coal Mining Co., Beulah, Mercer County, North Dakota Subbituminous, Roland-Smith Bed, Wyodak S t r i p Mine, Wyodak Coal and Manu- fac tur ing Co., C i l e t t e , Campbell County, Wyoming Subbituminous, Dietz Bed, Big Horn Mine, Sheridan County, Wyoming Subbituminous, Laramie Seam, Washington n ine , Clayton C o a l Co., Krie, Weld County, Colorado Subbituminous, Pioneer Canon No. 1 Mine, W. D. Corley Co., Florence, P%mont County, Colorado Subbituminous, Rock Springs No. 7, 7-112, 9, and 15 Coal Beds, Superior, Svee twater County, Wyoming High-volati le B bituminous, I l l i n o i s No . 6 , Green Dhmond Mine, MidContinent Coal Corp., Marissa, S t . Clair County, I l l i n o i s High-volati le B bituminous, I l l i n o i s No. 6 Seam, Mecco Mine, Atkinson, Henry County, I l l i n o i s High-volati le C bituminous, 'No. 11 Coal Bed, Rainbow No. 7 Mine, Gunn-Quealy Coal C o . , Quealy, Sweetwater County, Wyoming High-volati le C bituminous, I l l i n o i s N o . 7 Bed, Barmatten Mine, Vermillion County, I l l i n o i s High-volati le C bituminous (possibly h igh-vola t i le B bituminous), Liberty Bed, Liber ty Mine, Liberty Fuel Co., Helper, Carbon County, Utah High-volati le B bituminoue, I l l i n o i s No. 6 Bed, Orient No. 3 Mine, Preaman Coal Mining Corp., Waltonville. J e f f e r son County, I l l i n o i s High-volati le B bituminous, Kentucky No. 9 , Pleasant V i e w Mines 9-11, Western Kentucky Coal Co., Uadisonville, Hopkins County, Kentucky High-volati le B b i tudnoua , Kentucky No. 9 . DeKoven Mine, S turg is , Union County, Kentucky High-volati le A bituminous, P i t t sburgh Bed, Bruceton, Allegheny County, Pennsylvania High-volati le A bituminous, Pond Creek Coal, Majestic Mine, Pike County, Kentucky High-volati le A bituminous, Powellton Bed, Elk Creek No. 1 Mine, Logan County, West Virginia High-volati le A bituminous, Eagle Bed, Kopperston nine, Kopperston, Wyoming County, West Virginia Medium-volatile bituminous, Sewell Bed, Lochgelley n ine , Rev River Coal Co., Lochgelley. M t . Hope, Payet te County, West Virginia Medium-volat i l e bituminous (pose i b l y high-volati le A bituminous), Lower Preeport Bed, Coal Valley lo. 7 Mine, Indiana County, Pennsylvania Low-volatile bituminous, Lower Kittanning Bed, Melcroft Mine, Eastern Asrociated Coal Corp., Payette County, Pennsylvania Medium-volatile bituminous, Lower Banner, Buccaneer Mne , Patterson, Buchanan County, Virginia Medium-volatile bitumlnous, Sewell Bed, Marianna Mine, Wyoming County, West V i rg i n i a Low-volatile bituminous, Beckley Bed, Wben nine, italeigh County, West Virginia Medium-volatile bituminous, Sewell Seam, Crab Orchard Mine, Winding Gulf C o a l s , Inc . , Raleigh County, West Vi rg in ia Lou-volati le bituminous, Lower Hartshorne Bed, Carland Coal and nin ing Co., Prospect opening, Ark- Coal Basin, Le Plore County, Oklahwm
(Continued)
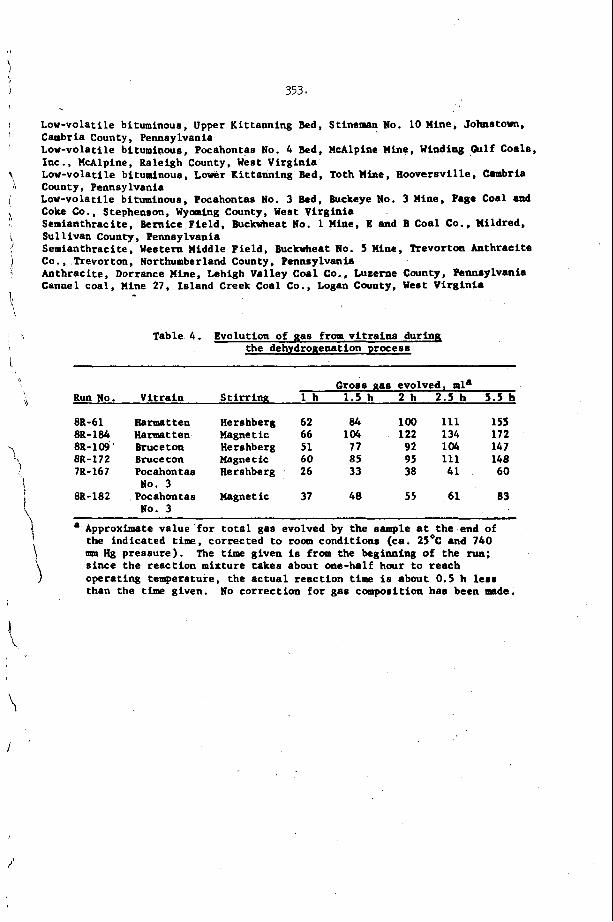
353. ~
Low-volatile bituminous, Upper Kittanning Bed, Stineman No. 10 Mine, Johnsto\l[l, Cambria County , Pennsylvania Low-volatile bituminous, Pocahontas No. 4 Bed, McAlpine Mine, Winding h l f Coals, Inc. , McAlpine, Raleigh County, West Virginia Low-volatile bituminous , Lover Kit taming Bed, Toth nine, Rooversvil le, Cmnbria County, Pennsylvania Low-volatile bituminous, Pocahontas No. 3 Bed, Buckeye No. 3 Mine, Page C o a l and C o b Co., Stephenson, Wyoming County, West Virginia Semianthracite, Bernice Field, Buckwheat No. 1 Mine, B and B Coal Co., Mildred, Sullivan County, Pennsylvania Semianthracite, Western Middle F ie ld , Buckwheat No. 5 Mine, Revor ton Anthracite Co., Trevorton, Northumberland County, Pennsylvania Anthracite, Dorrance Mine, Lehigh Valley C o a l Co., Lueetne County, Pennsylvania Cannel coal , Mine 27, Island Creek Coal Co., Logan County, West Virginia
Table 4. a the dehydrouenation process
Gross gas evolved, m l a Run No. Vi t ra in S tirring 1 h 1.5 h 2 h 2.5 h 5.5 h
8R-61 Harmatten Hershberg 62 a4 100 111 155 8R-184 Harmatten Magnetic 66 1% 1 2 2 134 172 8R- 1 @-' Bruce ton Herahberg 51 17 92 104 147 8R- 172 Bruce ton Uagnetic 60 85 95 111 148 71-167 Pocahontas Herahberg 26 33 38 41 60
No. 3
No. 3 88-182 Pocahontas Magnetic 37 48 55 61 83
a Approximate value for t o t a l gas evolved by the sample a t the end of the indicated time, corrected t o room conditions (ca. 25OC and 740 mm Hg pressure). The time given is from the beginning of the run; since the react ion mixture takes about one-half h a w to reach operating temperature, the a c t u a l react ion time is about 0.5 h l e s s than the t i m e given. No correct ion for gas composition has been mnds.
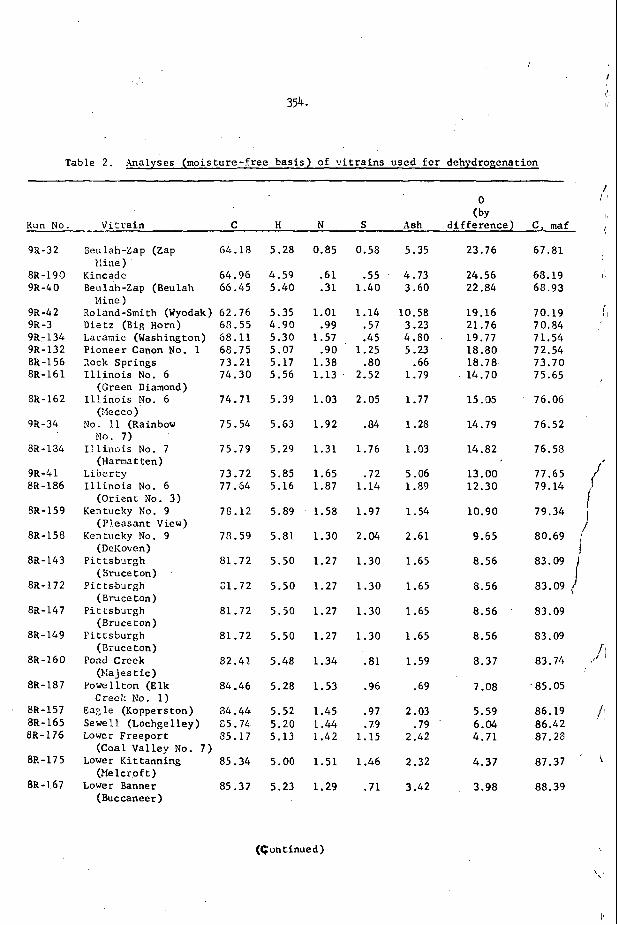
I
I
354. \ ,
I I
Table 2. Analyses (moisture-free basis) of v i t r a i n s used f o r dehydrogenation
0
difference )
23.76
24.56
(by
22.84
H N S Ash
5.28 0.85 0.58 ' 5.35
4.59 .61 .55 . 4.73 5.40 ' .31 1.40 3.60
ViLrain C -- C , maf
67.81
Run No.
98-32 Beulah-Zap (Zap >line)
Kincade Beu loh-Zap (Beulah
X n e ) Roland-Smith (Wyodak) Dietz (Big Horn) Laramie (Washington) Pioneer Canon No. 1 Bock Springs I l l i n o i s No. 6
I l l i n o i s No. 6
No. 11 (Rainbow
I l l i n o i s No. 7 (Harnn t ten)
Liber ty I l l i n o i s No. 6
(Orient No. 3) Kentucky No. 9
(Pleasant V i e w ) Kentucky No. 9
(DcKoven) Pit tsburgh
(Bruce ton) Pittsburgh
(Bruceton) P i t &burgh
(Bruce ton) Pit tsburgh
(Bi-uceton) Pond Creek
():a j es t i c ) Powellton (Elk
Creel: No. 1) E ~ Q l e (Koppers ton) Sewell (Lochgelley) Lower Freeport
(Coal Valley No. 7 ) Lower Kittanning
(Melcroft) Lower Banner
(Buccaneer )
(Green Diamond)
(:iecco)
No. 7 )
6 4 . 1 8
8R-190 9R-40
64.96 66 -45
68.19 / I
63.93
70.19 70.84 71.54 72.54 73.70 75.65
I 9R -4 2 9R-3 98-134 98-132 88-156 88-161
62.76 63.55 55.11 68.75 73.21 74.30
5.35 1.01 1.14 10.58 4.90 .99 .57 3.23 5.30 1.57 , .45 4.50 5.01 .90 1.25 5.23 5.17 1.38 -80 .66 5.56 1.13 2.52 1.79
19.16 21.76 19.77
18.78 14.70
18. ao
88-162 74.71 5.39 1.03 2.05 1.77 15.05 76.06
98-34
88-134
75.54
75.79
5.63 1.92 .84 1.25
5.29 1.31 1.76 1.03
14.79
14. 82
76.52
76.53
77.65 79.14
79.34
80.69 I
83.09 I I
9R-41 8R-186
8R-159
73.72 77.64
5.85 1.65 .72 5.06 5.16 1.87 1.14 1.89
13.00 12.30
78.12
73.59
5.89 1.58 1.97 1.54
5.81 1.30 2.04 2.61
5.50 1.27 1.30 1.65
10.90
81-158 9.65
8.56 8R-143 81.72
83.09 / 53.09
8R-172 21.72 5.50 1.27 1.30 1.65 5.56
88-147 81.72 5.50 1.27 1.30 1.65 8.56
88-149 81.72
82.41
5.50 1.27 1.30 1.65 8.56
8.37
83.09
/ I 83.74 8R-160 5.48 1.34 .81 1.59
5.28 1.53 .96 .69 88-187
88-157 88-165 81-176
84 -46 -85.05
86.19 /I 86.42 ' 87.28
87.37 ' i
7.08
5.59 6.04 4.71
84.44 G5.74- 35.17
5.52 1.45 .97 2.03 5.20 1.44 .79 .79 5.13 1.42 1.15 2.42
8F.- 17 5 85 -34
85.37
5.00 1.51 1.46 2.32 4.31
88-167 5.23 1.29 .71 3.42 3.98 88.39
(cant inued )
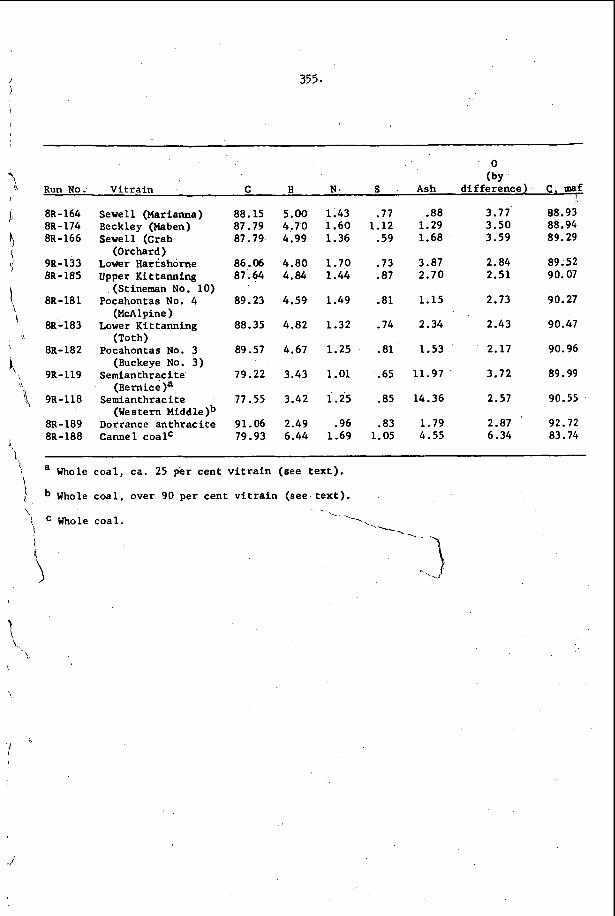
355.
0 (by
Run N o . Vitrain C H N S Ash difference) C, maf
811-164 Sewell (Marianna) 88.15 5.00 1.43 .77 .88 3.77 88.93 83-174 Beckley (Maben) 87.79 4.70 1.60 1.12 1.29 3.50 88.94 8R-166 Sewell (Crab 87.79- 4.99 1.36 .59 1.68 3.59 89.29
93-133 Lower Hartshorne 86.06 4.80 1.70 .73 3.87 2.84 89.52 8R-185 Upper Kittanning 87.64 4.84 1.44 .87 2.70 2.51 90.07
8R-181 Pocahontas No. 4 89.23 4.59 1.49 .81 1.15 2.73 90.27
(Orchard)
(Stinernan No. 10)
(McAlpine )
(Toth)
(Buckeye No. 3)
(Bernice )a
(Western
88-183 Lower Kittanning 88.35 4.82 1.32 -74 2.34 2.43 90.47
8R-182 Pocahontas No. 3 89.57 4.67 1.25 .81 1.53 2.17 90.96
9R-119 Semianthracite 79.22 3.43 1.01 .65 11.97 3.72 89.99
9R-118 Semianthracite 77.55 3.42 1.25 .85 14.36 2.57 90.55
8R-189 Dorrance an thrac i te 91.06 2.49 .96 .83 1.79 2.87 92.72 81-188 Cannel coalC 79.93 6.44 1.69 1.05 4.55 6.34 83.74
a Whole coa l , ca. 25 per cent v i t r a i n (see tex t ) .
b Whole coa l , over 90 per cent v i t r a i n (see t ex t ) . '>
C Whole coa l . i i
1
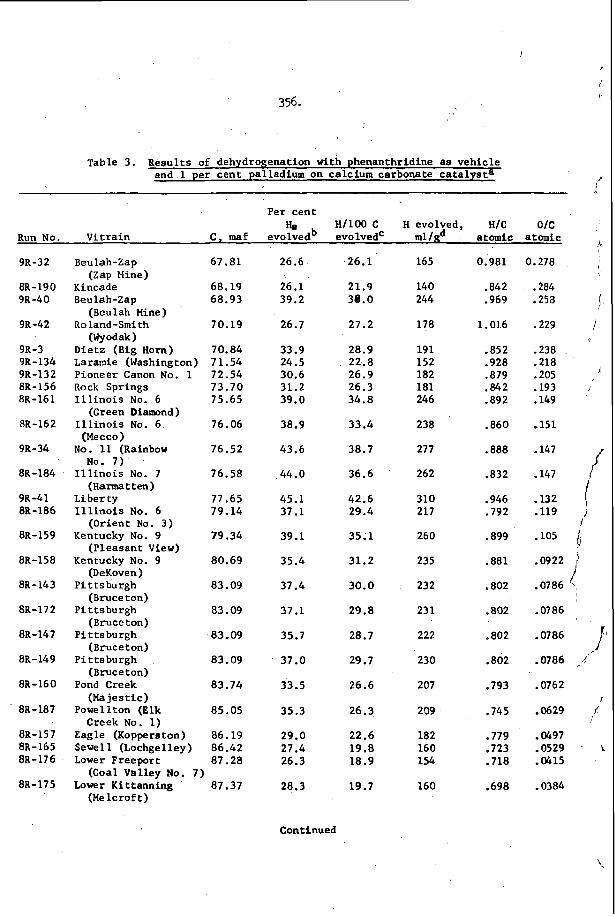
Table 3. Results of dehydrogenation with phenanthridine a s vehicle and 1 per cent palladium on calcium carbonate ca ta lys ta
)'
Per cent
Run No. Vi t ra in C, maf evolvedb evolved' ml/gd atomic atomic Ho H/100 C H evolved, H f C O/C
'7
9R-32
8R-190 9R-40
9R-42
9R-3 9R-134 98-132 8R-156 8R-161
88-162
98-34
88-184
9R-41 8R-186
88-159
8R-158
88-143
8R-172
88-147
8R-149
8R-160
88-187
88-157 83-165 8R-176
81-175
Beulah-Zap 67.81
Kincade 68.19 Beulah-Zap 68.93
Roland-Smith 70.19
Dietz (Big Horn) 70.84 Laramie (Washington) 7 1.54 Pioneer Canon N o . 1 72.54 Rock Springs 73.70 I l l i n o i s No. 6 75.65
I l l i n o i s No. 6 76.06
No. 11 (Rainbow 76.52
I l l i n o i s No. 7 76.58
Liberty 77.65 I l l i n o i s No. 6 79.14
Kentucky No. 9 79.34
(Zap Mine)
(Beulah Mine)
(YTodak 1
(Green Diamond)
(Mecco)
No. 7 )
(Ham t ten)
(Orient No. 3)
(Pleasant View)
(DeKoven )
(Bruce ton)
(Bruce ton)
(Bruceton)
(Bruceton)
(Majestic)
Creek No. 1)
Kentucky No. 9 80.69
Pittsburgh 83.09
Pittsburgh 83.09
Pi t t sburgh 83.09
Pittsburgh 83.09
Pond Creek 83.74
Powellton (Elk 85.05
Eagle (Kopperston) 86.19 Sewell (Lochgelley) 86.42 Lower Freeport 87,28
Lower Kittanning 87.37 (Coal Valley No. 7)
(Melcrof t)
26.6
26.1 39.2
26.7
33.9 24.5 30.6 31.2 39.0
38.9
43.6
44.0
45.1 37.1
39.1
35.4
37.4
37.1
35.7
37.0
33.5
35.3
29.0 27.4 26.3
28.3
Continued
26.1 165
21.9 140 38.0 244
27.2 178
28.9 191 22.8 152 26.9 182 26.3 181 34.8 246
33.4 238
38.7 277
36.6 262
42.6 310 29.4 217
35.1 260
31.2 235
30.0 232
29.8 231
28.7 222
29.7 230
26.6 207
26.3 2 09
22.6 182 19.8 160 18.9 154
19.7 160
0.981
.842
.969
1.016
.852
.928 -879 .842 .892
.860
.888
.832
.946
.792
-899
.881
.802
.802
.802
.802
.793
.745
.779
.723 -718
.698
0.278 ,
.284
.258
.229
I I
.238
.218
.205 -193 I
.149
,151
.147 *147
A
-132 I ,
i
.119 ) I
-105
.0786 '\
.0786
.0786
-0786 ,I!'
.0762
.0629 J'
.0497
.OS29 L
.0415
.0384
I
<I r
I
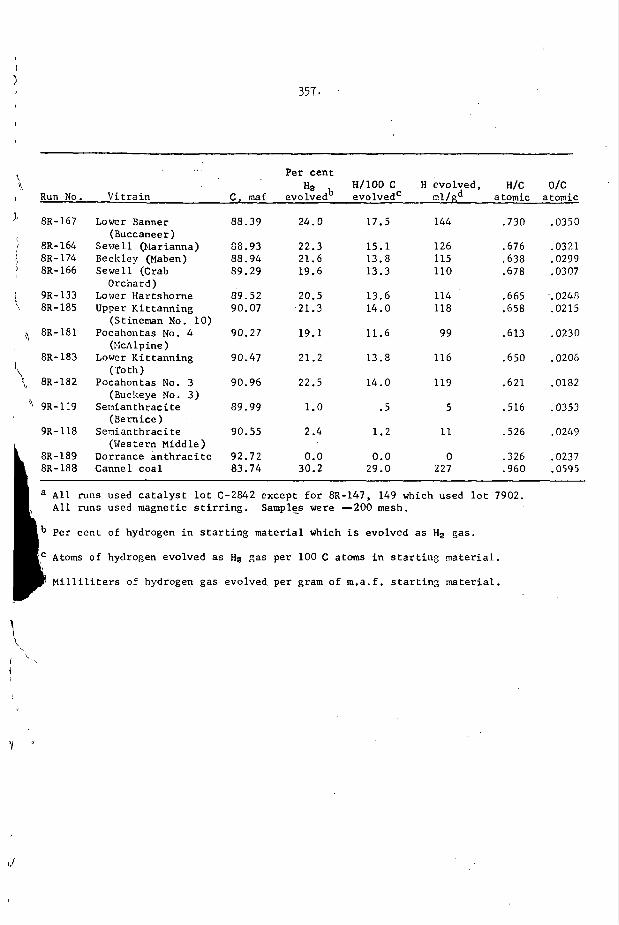
357.
Per cent Hz HI100 C H evolved, H/C O/C
C , maf evolvedb evolved' ml/gd atomic atomic \\
l Run No. Vi t ra in
8R-167
J 8R-164 \ 8R-174 1 8R-166
9R- 133 8R-185
\\ 8R-181
8R- 183 I \! 8R-182
" 9R-119
9R-118
Lower Banner (Buccaneer)
S e w 11 (t.lar ianna) Beckley (Maben) Sewell (Crab
Orchard) Lower Harts home Upper Kittanning
(Stineman N o . 10) Pocahontas No. 4
(14cAlpine ) Lower Kittanning
(Toth) Pocahontas No. 3
(Buckeye No. 3) Semianthraci t e
(Be rn ice ) Senianthracite
88.39
88.93 88.94 89.29
89.52 90.07
90.27
90.47
90.96
89.99
90.55 '
24.0
22.3 21.6 19.6
20.5 21.3
19.1
21.2
22.5
1.0
2.4
17.5
15.1 13.8 13.3
13.6 14.0
11.6
13.8
14.0
. 5
1 . 2
144
126 115 110
114 118
99
116
119
5
11 1 (Western Middle)
8R-189 Dorrance an th rac i t e 92.72 0.0 0.0 0 .326 8R-188 Cannel coal 83.74 30.2 29.0 227 .960
a A l l runs used ca t a lys t l o t C-2842 except fo r 8R-147, 149 which used l o t 7902. A l l runs used magnetic s t i r r i n g . Samplgs were -200 mesh.
Per cent of hydrogen i n s t a r t i n g material which is evolved as Hz gas.
I C Atoms of hydrogen evolved as Ha gas per 100 C atoms i n s t a r t i n g mater ia l . I ' M i l l i l i t e r s of hydrogen gas evolved per gram of m.a.f. s t a r t i n g material .
.730
.676
.638
.678
.665
.658
.G13
.650
.621
.516
.526
.0350
.0321
.0299
.0307
.024G
.0215
.0230
.020G
.0182
.0353
-0249
.0237
.0595
' I "
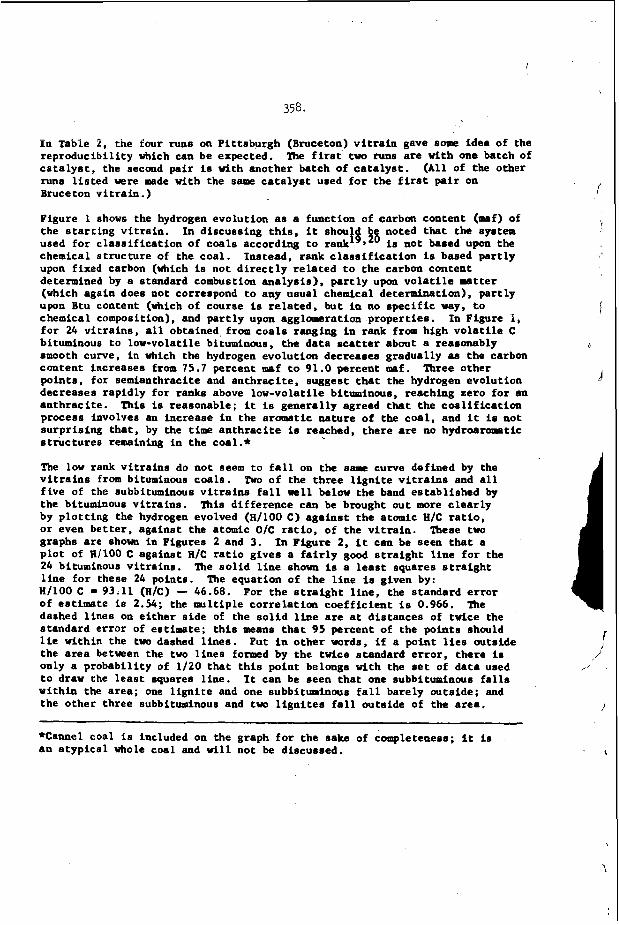
in Tabie 2, the four runs on Pi t t sburgh (Bruceton) v i t r a i n gave some idea of the reproducib i l i ty which can be expected. me f i r s t two tuns are with one batch of c a t a l y s t , the second pair is with another batch of c a t a l y s t . runs l i s t e d were made with the same c a t a l y s t ured for the f i r s t pair on Bruce ton v i tra in . )
Figure 1 shows the hydrogen evolution as a function of carbon content (maf) of noted t h a t the system
it sh":!l,49 is not based upon the the s t a r t i n g v i t r a i n . In discussing t h i s , used f o r c l a s s i f i ca t ion of coals according to rank chemical s t ruc tu re of the coa l . Instead, tank c l a s s i f i c a t i o n is based pa r t ly upon fixed carbon (which is not d i r e c t l y r e l a t ed t o the carbon content determined by a standard combustion ana lys i s ) , p a r t l y upon v o l a t i l e matter (which again does not correspond t o any usual chemical determination), par t ly upon Btu content (vhich of course is re l a t ed , but i n no spec i f i c way, t o chemical composition), and p a r t l y upon a g g l o a r a t i o n proper t ies . In Figure P, f o r 24 v i t r a i n s , a l l obtained from coa l s ranging i n rank from high v o l a t i l e C bituminous t o low-volatile bituminous, the da ta scatter about a reasonably smooth curve, i n which the hydrogen evolution decreases gradually an the carbon coa ten t increases from 15.7 percent maf to 91.0 percent maf. points. fo r semianthracite and an th rac i t e , suggest that the hydrogen evolution decreases rap id ly fo r ranks above low-volati le bituminous, reaching zero f o r an an th rac i t e . This is reasonable; i t is generally agreed that the C ~ a l i f i C a t f o n process involves an increase i n the aromatic na ture of the coal , and it i o not surpr i s ing tha t , by the time an th rac i t e is reached, there are no hydroaromatic s t ruc tu res remaining i n the coal.*
The low rank v i t r a i n s do not seem t o f a l l on the same curve defined by the v i t r a i n s from bituminous coals. Two of the three l i g n i t e v i t r a i n s and a l l f i v e of t he subbituminous v i t r a i n s f a l l vel1 below the band es tab l i shed by the bituminous v i t r a i n s . by p lo t t i ng the hydrogen evolved (H/100 C) aga ins t t he atomic H/C ratio, o r even be t t e r , aga ins t the atomic O/C r a t i o , of the v i t r a i n . These two graphs a r e shown i n Figures 2 and 3. I n Figure 2, it can be seen that a p l o t of A/l00 C agains t R/C r a t i o g ives a f a i r l y good s t r a i g h t l i n e f o r the 24 bituminous v i t r a i n s . l i n e f o r these 24 points. H/100 C - 93.11 (H/C) - 46.68. of estimete is 2.54; the multiple co r re l a t ion coe f f i c i en t i s 0.966. The dashed l i n e s on e i t h e r s ide of the s o l i d line are a t d is tances of twice the standard e r ro r of estimate; t h i s means t h a t 95 percent of the points should l i e within the tvo dashed l i nes . the a rea between the two l ines formed by the twice standard e r ro r , there i s only a probabi l i ty of 1/20 t h a t t h i s point belongs with the ret of da ta used t o drav rhe l e a s t squares l ine. It can be Been tha t one subbituminous f a l l s wi th in the a rea ; one l i g n i t e and one subbituminous f a l l barely outside; and the o ther three subbituminous and two l i g n i t e s f a l l outside of the a rea .
*Camel coal i s included on the graph f o r the sake of completeness; it is a n a typ ica l vhole coal and w i l l not be discussed.
( A l l of the other
Three other
This di f fe rence can be brought out more c l e a r l y
The s o l i d l i n e shown is a least squares s t r a i g h t The equation of the l i n e is given by:
For the s t r a i g h t l i n e , the standard e r r o r
Put i n o the r vords, i f a point lies au ts ide
f
!
/' '
i
' L
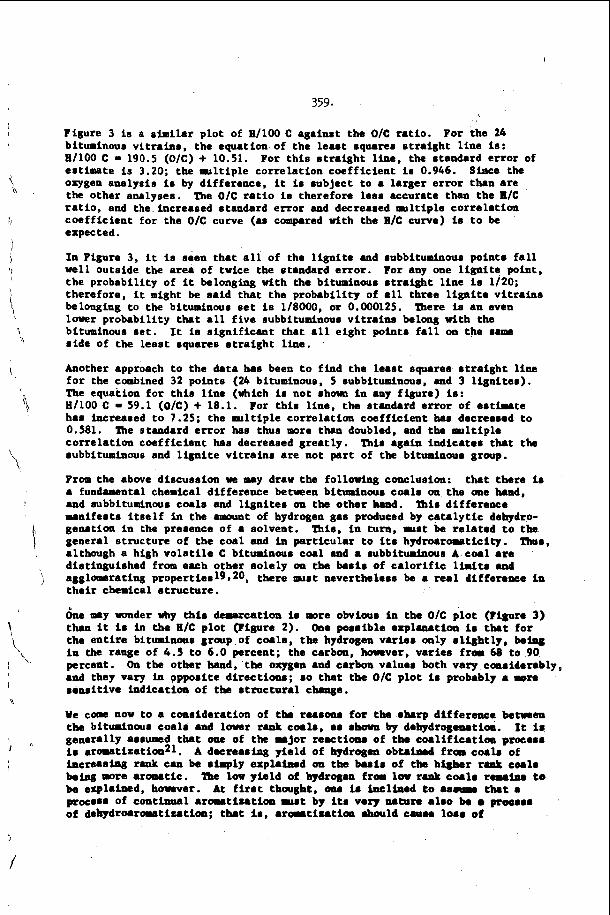
359.
i n
\
I h
/ "
Figure 3 is a similar p lo t of WlOO C agr in r t the O/C r a t i o . For the 24 bituminous v i t r a i n r , the equation of the leart sqcurer s t r a igh t l i n e is: E/1W C - 190.5 ( O K ) + 10.51. For t h i s s t r a i g h t l i ne , the standard e r ro r of estimate is 3.20; the u l t i p l e cor re la t ion coef f ic ien t i r 0.946. oxygen analysis is by difference, it is rubject t o a la rger e r r o r th8n a re the other amlyeer . The O/C r a t i o i r therefore 1080 accurate than the E/C r a t i o , and the increased standard e r r o r and decreased a a l t i p l e cor re la t ion coe f f i c i en t for the OIC curve (a0 compared with the E/C curve) is t o be expected .
S h e the
I n Figure 3, i t is seen t h a t a l l of the l i g n i t e .ad rubbi tuahous point. f a l l w e l l outside the area of twice the standard e r ro r . l o r any one l i g n i t e point, the probabi l i ty of it belonging with the bituminous r t r a i g h t l i ne is 1/20; therefore , i t might be ra id that the probabi l i ty of a11 three l i g n i t e v i t r a i n s belonging t o the bituminous set is l/8000, o r 0.000125. lover probabi l i ty that a l l f ive subbituminour v i t r a i m belong with the bituminous r e t . r i de of the least squares s t r a i g h t l i ne .
Another approach t o the da ta has been t o f ind the least squares s t r a i g h t l ine f o r the combined 32 points (24 bituminous, 5 subbituminous, and 3 l i g a i t e r ) . The equation f o r th io l i n e (which i r not ohow in any f igure) is: H/100 C - 59.1 (O/C) + 18.1. For t h i s l i ne , the standard e r r o r of ar thate ham increared t o 7.25; the m l t i p l e cor re la t ion coef f ic ien t har decrearod t o 0.581. cor re la t ion coef f ic ien t hae decreased grea t ly . rubbitminoun and l i g n i t e v i t r a i n r are not par t of the bituminour group.
From the above discussion we m y draw the following conclusion: a fundamental chemical difference between bituminour coal. on the me band, and subbituminous coa ls and l i g n i t e s on the othor h a d . u a i f e r t s i t s e l f in the amount of hydrogen gas produced by c a t a l y t i c dehydro- genation in the prerence of r solvent. This, in turn, mait be r e l a t ed t o the general s t ruc ture of the coal and in pa r t i cu la r t o f t r hydroarcmaticity. 'Ihor, although a high v o l a t i l e C b i N n o u r coal and a rubbiturinous A coal are distirrguished from each other so l e ly 09 the barir of c a l o r i f i c limitr and a g g l o ~ e r a t i n g propertier19,20, there m e t naverthelers be a real differonce in t h e i r chemical s t ruc tu re .
&e a y -der uhy t h io d t lorca t ion ir =re obvious in the O/C p lo t (?igure 3) than it is i n the ?l/C plo t (Figure 2). One per r ib l e explanation ir t h a t fo r the e n t i r e bituminous group of c0.10, the hydrogen var ie r only s l i g h t l y , be- in the raoge of 4.5 t o 6.0 percent; the carbon, hOIIver, va r i e s from 68 t o 90 percent. 00 the other hand, the oxygen and carbon valuor both vary caaoiderably, and they vary in oppori te d i rec t iana ; 80 tht the O/C plo t is probably a moro sens i t i ve indicat ion of the rtmctaral c w o .
There is an even
It is s ign i f i can t t ha t a l l e igh t point8 f a l l on the 8-
The standard e r r o r has thus =re than doubled, and the o u l t i p l e This again ind ica tor that tho
that there i o
This di f fe rence
We come now t o a considerat ion of tho rUIO9S for tho 8 h r p differonce betmen tho bituminous coal. and louer rank coalr, a8 rhoun by dehydrogenation. It is general ly arrumed tha t one of the u j o r reaction8 of tho coa l i f i ca t ion procrrr i 8 aromatiration21. A deeroaring y te ld of bydrogm obtaiuod f r m coalr of iaereaaIq5 rank CUL be rimply explatmod on the buir of tho h-r r m L emh kiag wre aromatic. The low y ie ld of hydrogen from low rank comlr r.uina Le be explained, h o r n n r . prwrrr of coptirrrml aroutizatiaa u r t by it# v.V Mtu- a l r o k proca$r of d e h y d r o a r o r a t i u t i m ; that i r , a r o u t f u t i o o rhould cmro lore of
A t f i r s t thought, o m ir i u c l k u d t o as- tht a
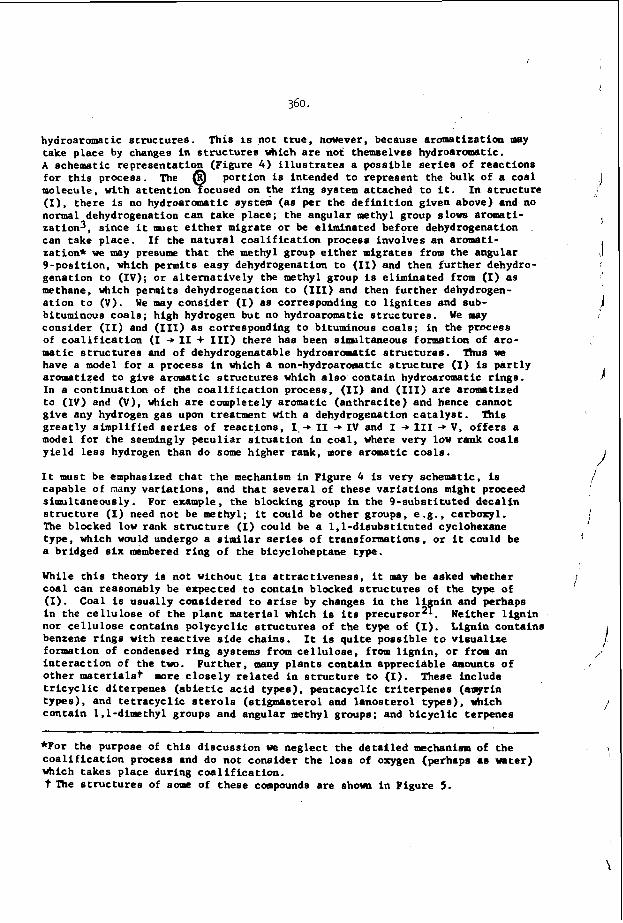
360.
hydroaromatic s t ruc tu res . Tinis 1s not t rue , however, because aromatization m y take place by changes in s t ruc tu res d t i c h a r e not themselves hydroaromatic. A schematic representation (Figure 4) i l l u s t r a t e s a possible s e r i e s of reactions f o r t h i s process. The 9 portion is intended t o represent the bulk of a coal molecule, with a t t en t ion ocused on the r ing system attached t o i t . (I), there i s no hydroaromatic system (as per the de f in i t i on given above) and no normal dehydrogenation can take place; the angular methyl group s lovs aromati- zetion3, since it rmst e i t h e r migrate o r be eliminated before dehydrogenation ,
can take place. If the na tu ra l coa l i f i ca t ion process involves an aromati- zation* we may presume that the methyl group e i t h e r migrates from the angular 9-posit ion, which permits easy dehydrogenation t o (11) and then fu r the r dehydro- genation to ( I V ) ; o r a l t e r n a t i v e l y the methyl group is eliminated from (I) as methane, which permits dehydrogenation t o (111) and then fu r the r dehydrogen- a t i o n t o (V). bituminous coa ls ; high hydrogen but no hydroaromatic s t rxc tu res . consider (11) and (111) as corresponding t o bituminous coa ls ; in the prmess of coa l i f i ca t ion (I +I1 + 111) there has been sirmltaneous formation of aro- matic s t ruc tu res and of dehydrogenatable hydroaromatic s t ruc tu res . have a model fo r a process i n which a non-hydroaromatic s t ruc tu re (I) is par t ly aromatized t o give aromatic s t ruc tu res which a l s o contain hydroaromatic r ings . In a continuation of the c o a l i f i c a t i o n process, (If) and (111) a r e aromatized to ( I V ) and (V), which a r e completely aromatic (an thrac i te ) and hence cannot give any hydrogen gas upon treatment with a dehydrogenation c a t a l y s t . g rea t ly simplified s e r i e s of reac t ions , I,+ 11 -* I V and I +I11 +V , of fe r s a model f o r the seemingly pecul ia r s i t ua t ion in coal , vhere very low rank coa l s y ie ld l e s s hydrogen than do some higher rank, more aromatic coals.
In s t ruc tu re
We may cons ider (I) a s corresponding t o l i g n i t e s and sub- We may
Thus we
This
It must be emphasized t h a t t he mechanism i n Figure 4 is very schematic, is capable of many va r i a t ions , and t h a t severa l of these var ia t ions might proceed simultaneously. For example, the blocking group i n the 9-subs t i tu ted deca l in s t ruc tu re (I) need not be methyl; i t could be other groups, e.g., carboxyl. The blocked low rank s t ruc tu re (I) could be a 1.1-disubsti tuted cyclohexane type, which would undergo a similar series of transformations, o r i t could be a bridged six membered r ing of the bicycloheptane type.
While t h i s theory is not without i ts a t t rac t iveness , it aay be asked whether coal can reasonably be expected t o contain blocked s t ruc tu res of the type of (I). Coal is usually considered t o a r i s e by changes in the l i n in and perhaps in the ce l lu lose of the p l an t material which is i ts precursor2f. Neither l i g n i n nor ce l lu lose contains polycyclic S t ruc tures of t he type of (I). benzene r ings with reac t ive s i d e chains. It is q u i t e possible to v i sua l i ze formation of condensed r ing systems from ce l lu lose , from l ign in , o r froa en i n t e rac t ion of the two. o ther mater ia l s ) more c l o s e l y r e l a t ed in s t ruc tu re t o (I). These include t r i c y c l i c diterpenes ( a b i e t i c ac id types). pentacyclic t r i t e rpenes (amgrin types), and t e t r acyc l i c s t e r o l s (st igmasterol and lanos te ro l types), which conta in 1.1-dimethyl groups and angular methyl groups; and b icyc l ic terpenes
Lignin contains
Fur ther , many p lan t s conta in appreciable auOunts of
*For the purpose of t h i s discussion we neglect the de t a i l ed mechanism of the c o a l i f i c a t i o n process and do not consider the lo s s of oxygen (perhaps as water) which takes place during coa l i f i ca t ion . t The s t r u c t u r e s of some of these compounds a re shown i n Figure 5.
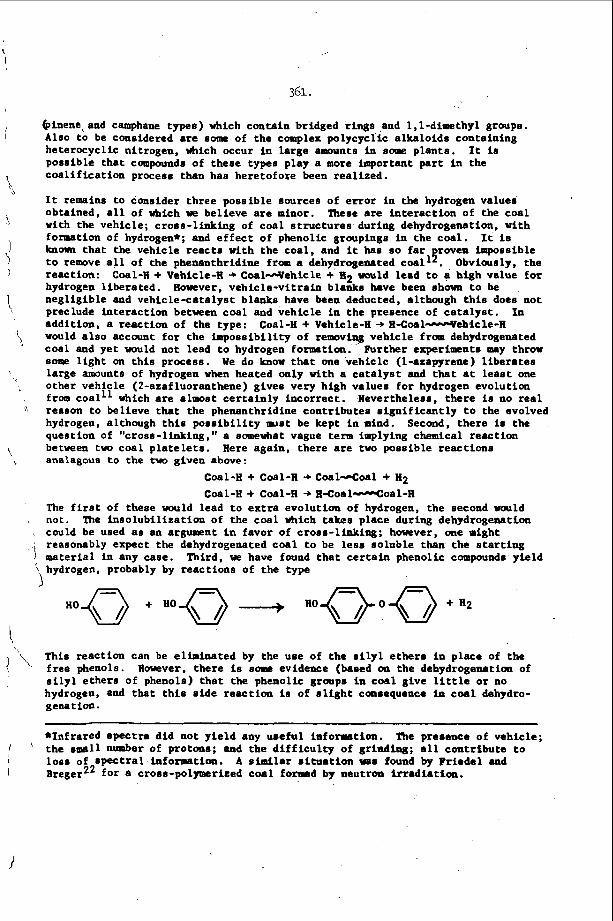
361.
binene, and camphane types) which contain bridged r ings and 1,l-dimethyl groups. Also t o be considered are some of the complex polycyclic a l b l o i d s containing heterocyclic nitrogen, which occur i n large amounts i n saate plants . possible that compounds of these types play a more important part i n the coa l i f i ca t ion process than has heretofore been real ized.
It remains to consider three possible sources of e r ro r i n the hydrogen values obtained, a l l of which we believe are minor. h e s e are in t e rac t ion of the coal w i t h the vehicle; c rors - l ink ing of coal s t ruc tu res during dehydrogenation, with formation of hydrogene; and e f f e c t of phenolic groupings i n the coa l . k a o m t ha t the vehicle r eac t s v i t h the coal , and it has so f a r roven impossible to remove a l l of the phenanthridine from a dehydrogenated coal14. Obviously, the reaction: Coal -H + Vehicle-H -* C o a l M e h i c l e + B2 w u l d lead t o a high value for hydrogen l iberated. However, vehic le -v i t ra in blanks have been shown t o be negl ig ib le and vehicle-catalyst blanks have been deducted, although t h i s does not preclude Interact ion between coal and vehicle i n the presence of c a t a l y s t . addi t ion, a reac t ion of the type: vould a l s o account f o r the impossibil i ty of removiqg vehicle f r m dehydrogenated coal and yet would not lead t o hydrogen formation. some l i gh t on t h i s process. We do know that one vehiclc (1-azapyrene) l i be ra t e s large amounts of hydrogen when heated only v i t h a c a t a l y s t and that a t least one other vehicle (2-azafluoranthene) gives very high values f o r hydrogen evolution from coal" which a r e almost ce r t a in ly incorrect . reason t o believe that the phenanthridine cont r ibu tes s ign i f i can t ly t o the evolved hydrogen, although t h i s p o s s i b i l i t y nust be kept i n mind. Second, there is the question of "cross-linking," a somewhat vague term implying chemical reaction between two coal p l a t e l e t s . analagoua to the two given above:
It is
It is
I n Coal-H + Vehicle-Ii +H-Coall.ruSchPcle-H
Further experiments may throw
Nevertheless, there is no r e a l
Here again, there a r e two possible reac t ions
Coal-H + Coal-H -+ Coal.rCOa1 + H2 Coal-H + Coal -H + R-Coal.rrrCoa1-H
The f i r s t of these vould lead t o ex t r a evolution of hydrogen, the second m l d not. could be used as an argument i n favor of crosr- l inking; however, one might reasonably expect the dehydrogenated coal t o be less soluble than the s t a r t i n g material i n any case. Third, we have found t h a t c e r t a i n phenolic compounds yield
\hydrogen, probably by reactions of the type
Ihe inso lubi l iza t ion of the coal which takes place during dehydrogenation
1 This reaction can be eliminated by the use of the o i ly1 ether. i n place of the i '\ f r ee phenols. flowever. there is some evidence (based on the dehydrogenation of s i l y l e thers of phenols) t h a t the phenolic groups i n coal give l i t t l e or no hydrogen, and that t h i s s ide reac t ion is of a l i g h t conrequence Fa coal dehydro- genation.
~~ ~-
*Infrared spectra did not y i e ld any usefu l information. the small number of protons; and the d i f f i c u l t y of griading; a l l cont r ibu te t o l o s r of spec t r a l i n f o w t i a a . BregerP2 f o r a c r o m - p o l p r i z e d coal formed by neutron i r r ad ia t ion .
The presence of vehicle; ' A similar r i t u a t i o n was found by Frieda1 and
I
I
362.
1
5
Lowry, a. R., e d i t o r , Chemistry of C o a l U t i l i z a t i o n (2 volumes). New Pork, 1945 Lowry, 8. R., e d i t o r , Chemistry of Coal U t i l i z a t i o n , Supplementary Volume. Wiley: New York, 1963 Valenta, Z., i n Technique of Organic Chemistry, volume XI, edi ted K. W. Bentley, pp. 581-642. Interscience: New York, 2963 Jackman, L. U., in Advances i n Organic Chemistry, volume I f , edi ted 8. A. Raphael, E. C. Taylor, and H . Wynberg, pp. 329-366. Interscience: New York, 1960 Mazumdar, B. K., Chakrabartty, S. K., De, 1. C., Ganguly, S., and Lahiri, A. Fuel, Lond. 1962, 4l, 121 Peover, n. E. J. Chem. Soe. , Lond. 1960, 5020 Uazumdar, 8. K., Bhattacharyya, A. C., Ganguly, S., and Lahi r i , A. Fuel, Lond. 1962, 4l, 105; Peover, n. B., Fuel, Load. 1962, 4l, 110 Uazumdar, B. K., Choudhury, S. S., and Lahir l , A. 179
Wiley:
Fuel, Lond. 1960, 39,
Shlshido, K. and Nozakl, A. Bberhardt, H . K. Tetrahedron 1965, 2, 1383. Eberhardt, It. K. Tetrahedron 1965, 2, 1391. Raley, J. R., nul l ineulx, R. D. a d Btttner, C. W. 3. Am. Chem. Soc. 1963, 85, 3174. Uullineaux, 8 . D. and Raley, J. E. J. Am. Cham. SOC. 1963, 85, 3178. Slaugh. L. El., lb l l lneaux , 1. D. and Raley, J. 8 . J. Am. Chem. SOC. 1963, g, 3180. King, 8. W. Hydrocarbon Processing 1966, 45, 189
l o Ebindran , K. and Ti lak , B. D. 11 Raymond, R., Yender, I. and Reggcl, L. l2 Beggel, L., Weader, I., and Raymond, R. l3 Baxter, R. A., h u g e , C. R . and T h o n , J. A. J. Chem. SOC. (Suppl. Issue
No. 1) 1949, S30 l4 Albert , A., Brown, D. J. and Duevell, H. l5 Horning, E. C . , Eorning, M. G. and Walker, C. 1. J. Am. Chem. SOC. 1948,
70, 3935 l6 s o b , C. A. and Rofer, B. l7 Horrobln, S. and Young, R. J. Br i t i sh Patent 745,400, 1956; Chem. Abstr.
1956, SO, 16875c Pieser , L. 1. and Fleser , U. Advanced Organic Chemistry p. 645. Retnhold: Hew York, 1961
l9 Ode, W. 8. and Frederick, W. R. United S t a t e s Department of the I n t e r i o r , Bureau of nines, 'The In te rna t iona l System of Berd-Coal Class i f ica t ion and Their Application t o Ascrican coah.' R e p t . of Inv. 5435, pp. 3-12, I). s. Governneat Pr int ing Off ice, 1958
2o 1965 Book of AS= Standards, Par t 19. -scour Fuels; Coal and Coke. Page 74.
21 Van Krevelen, D. U. Coal, pp. 101-109, 445-452. Elsevier : Amsterdam, 1961 22 Pr iede l , R. A. and Bregcr, I. A.
J. SOC. Chem. Ind. Japan 1944, 47, 819.
Proc. Indian Acad. Se i . 1953, 37A. 557 Science 1962, 137, 681-
/ Fuel, Lond. 1964, 43, 229
J. Chem. SOC. 1948, 1284
P Eelv. Chim. Acta. 1952, 35, 2095
i
American Society f o r Testing and Materials: Philadelphia, Pa.
Science 1959, 130, 1762-1763
1 ,' i
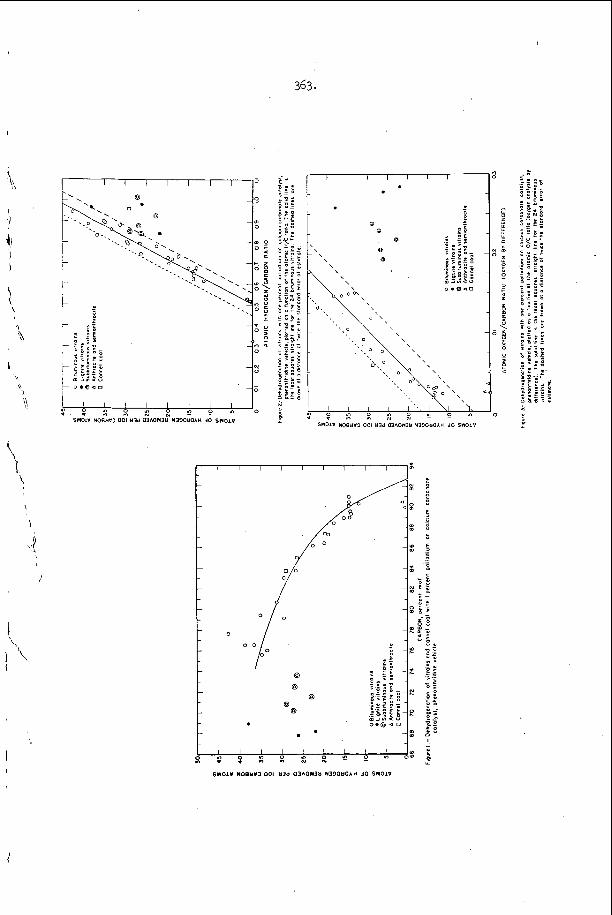
363.
\
i
\ !4 I
0
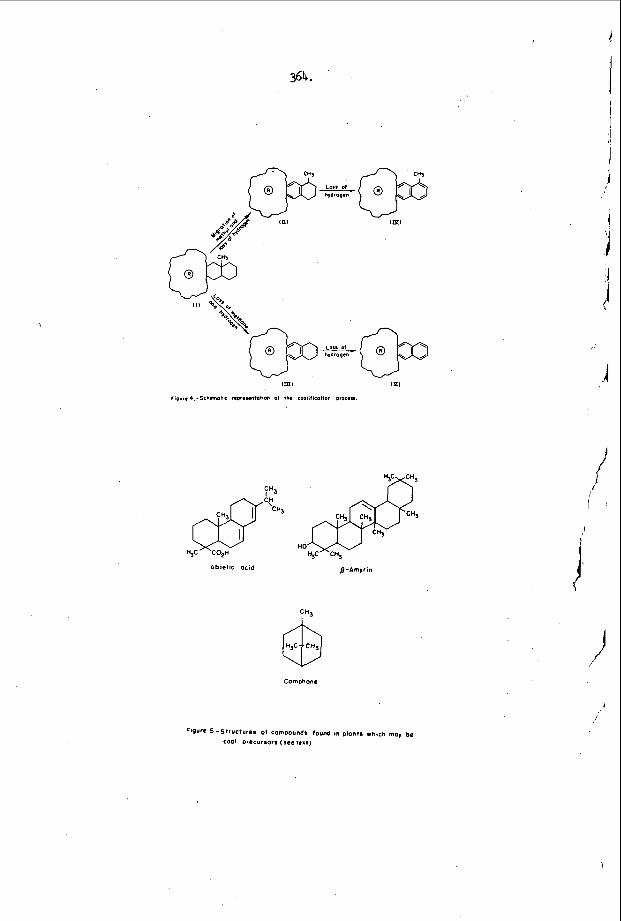
364.
Cornphone
Figure 5-Structures of Cornpound; lound ~n plontr r h l C h may be
COO1 D r O C U r S O I ; (See l C X 1 )
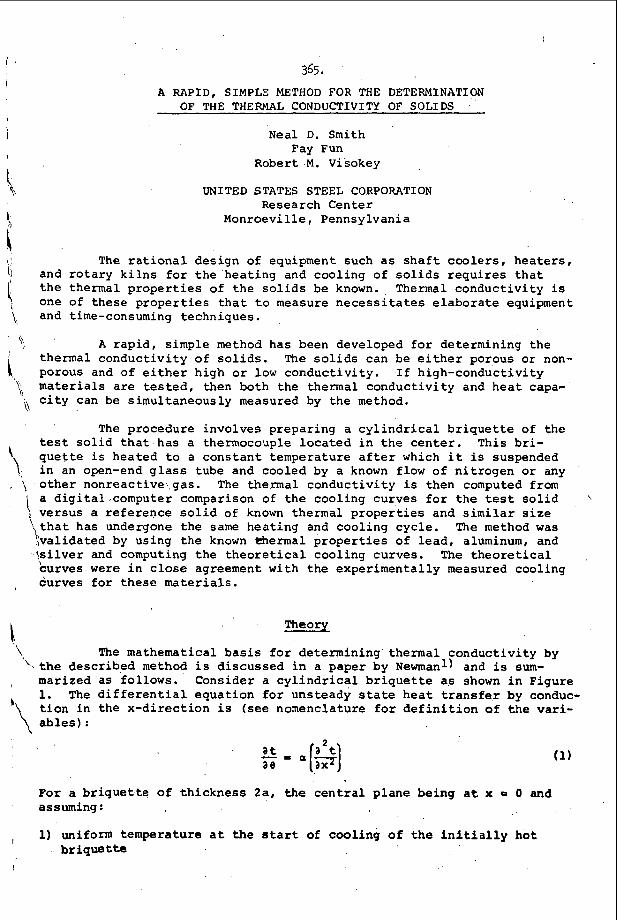
365. A RAPID, SIMPLE METHOD FOR THE DETERMINATION
OF THE THERMAL CONDUCTIVITY OF SOLIDS
Neal D. Smith Fay Fun
Robert M. Visokey
UNITED STATES STEEL CORPORATION Research Center
Monroeville , Pennsylvania
The r a t i o n a l d e s i g n of equipment such as s h a f t c o o l e r s , h e a t e r s , and r o t a r y k i l n s f o r t h e ' h e a t i n g and coo l ing of s o l i d s r e q u i r e s t h a t t h e thermal p r o p e r t i e s o f t h e s o l i d s be known., Thermal c o n d u c t i v i t y is one of t h e s e p r o p e r t i e s t h a t t o measure n e c e s s i t a t e s e l a b o r a t e equipment and time-consuming t echn iques .
A r a p i d , s imple method has been developed f o r de te rmining t h e The s o l i d s can be e i t h e r porous o r non- thermal c o n d u c t i v i t y of s o l i d s .
porous and of e i t h e r h i g h o r low c o n d u c t i v i t y . I f h igh -conduc t iv i ty m a t e r i a l s a r e t e s t e d , then both t h e thermal c o n d u c t i v i t y and h e a t capa-
a c i t y can be s imul t aneous ly measured by t h e method.
The procedure invo lves p r e p a r i n g a c y l i n d r i c a l b r i q u e t t e of t h e test s o l i d t h a t has a thermocouple l o c a t e d i n t h e c e n t e r . This b r i - q u e t t e i s hea ted t o a c o n s t a n t tempera ture a f t e r which it i s suspended i n an open-end g l a s s t u b e and cooled by a known flow of n i t r o g e n o r any
The thermal c o n d u c t i v i t y i s then computed from a d i g i t a 1 , c o m p u t e r comparison of t h e coo l ing cu rves f o r t h e t e s t s o l i d \
, \ o t h e r nonreac t ive gas .
I ver sus a r e f e r e n c e s o l i d of known thermal p r o p e r t i e s and similar s ize 'I t h a t has undergone t h e same h e a t i n g and coo l ing c y c l e . The method was ' ;validated by us ing t h e known a e r m a l p r o p e r t i e s of l e a d , aluminum, and
I \ s i l v e r and computing t h e t h e o r e t i c a l coo l ing curves . The t h e o r e t i c a l c u r v e s were i n close agreement wi th t h e expe r imen ta l ly measured cool ing
, curves f o r t h e s e m a t e r i a l s .
Theory
The mathemat ica l b a s i s f o r de te rmining thermal c o n d u c t i v i t y by 1
'% t h e desc r ibed method i s d i s c u s s e d i n a paper by Newmanl) and i s sum- /,
marized a s fo l lows . Consider a c y l i n d r i c a l b r i q u e t t e as shown i n F igure 1. t i o n i n t h e x - d i r e c t i o n i s (see nonenc la tu re f o r d e f i n i t i o n of t h e v a r i - '\ a b l e s ) :
The d i f f e r e n t i a l e q u a t i o n f o r uns teady s t a t e h e a t t r a n s f e r by conduc-
~ ' I '
I
For a b r i q u e t t e of t h i c k n e s s 2a, the c e n t r a l p l a n e be ing a t x = 0 and assuming :
1) uniform tempera ture a t the s ta r t of coo l ing o f t h e i n i t i a l l y ho t b r i q u e t t e
I
t
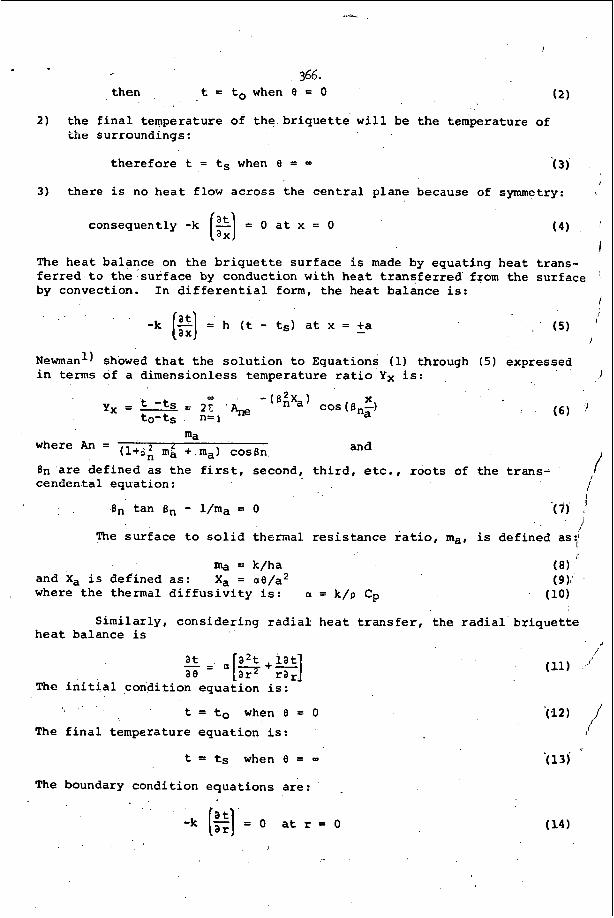
366. t = to when e = 0 ( 2 ) t hen
2 ) t h e f i n a l t empera tu re of t h e b r i q u e t t e w i l l be t h e tempera ture of the sur roundings :
t h e r e f o r e t = ts when e = ( 3 )
3) t h e r e i s no h e a t f l o w a c r o s s t h e c e n t r a l p l ane because of symmetry:
consequent ly -k [E] = o a t x = o ( 4 ) '
1 The h e a t ba lance on t h e b r i q u e t t e s u r f a c e is made by equa t ing h e a t t r a n s - f e r r e d t o t h e s u r f a c e by conduct ion w i t h h e a t t r a n s f e r r e d from t h e s u r f a c e by convec t ion . I n d i f f e r e n t i a l form, t h e h e a t ba l ance is:
I
-k [g] = h ( t - t,) a t x = +a
Newman') showed t h a t t h e s o l u t i o n t o Equat ions (1) through ( 5 ) expressed i n terms o f a d imens ion le s s tempera ture ra t io Yx is : I
and
6n are d e f i n e d a s t h e f i r s t , second, t h i r d , etc., r o o t s of the t r a n s - cenden ta l equat ion: i
' 1 6n t an Bn - l / m a = 0 (7 ) I
i The s u r f a c e t o s o l i d thermal r e s i s t a n c e ra t io , ma, is d e f i n e d as:/
ma = k/ha and Xa is def ined a s : Xa = ae /a2 where t h e thermal d i f f u s i v i t y is: a = k/p Cp
S i m i l a r l y , c o n s i d e r i n g rad ia l . h e a t t r a n s f e r , t h e r a d i a l b r i q u e t t e h e a t ba lance i s
4
at - a[:: ' a t ] a e - I + r a .
The i n i t i a l c o n d i t i o n e q u a t i o n is:
t = to when e = 0 '(12) / The f i n a l tempera ture e q u a t i o n is: ,/
The boundary c o n d i t i o n e q u a t i o n s a re : ' .
-k (%I,= 0 at r = 0 (14)
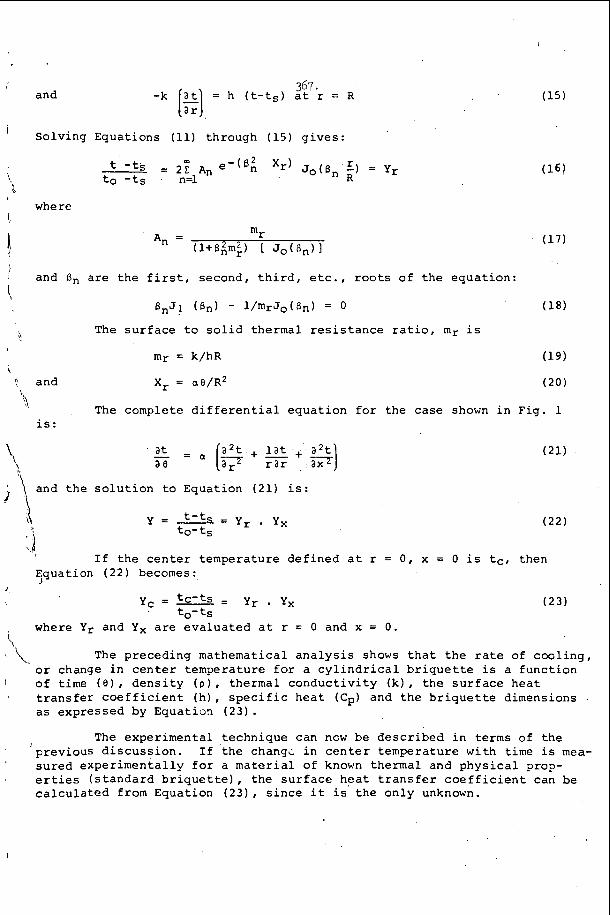
367. and = h (t-ts) a t r = R
I Solv ing Equat ions (11) through (15) g i v e s :
d
where 1,
and 8, a r e t h e f i r s t , second, t h i r d , e t c . , roots of t h e equa t ion :
B n J 1 (Bn) - l/mrJo(Bn) = 0 I
The s u r f a c e t o s o l i d thermal r e s i s t a n c e r a t i o , m r i s .\ m r = k/hR
L <, and X, = a0/R2
'A The complete d i f f e r e n t i a l equa t ion f o r t h e case shown i n F ig . 1 'h
i s :
and t h e s o l u t i o n t o Equation ( 2 1 ) i s :
. \
I f t h e c e n t e r tempera ture d e f i n e d a t r = 0 , x = 0 i s tc, then Equation ( 2 2 ) becomes : J
J ,
> YC = tc-ts = y r . YX to- t s
where Y r and Yx are e v a l u a t e d a t r = 0 and x = 0 .
The preceding mathematical a n a l y s i s shows t h a t t h e r a t e of c o o l i n g , o r change i n c e n t e r tempera ture f o r a c y l i n d r i c a l b r i q u e t t e i s a func t ion
' '\. 1 of time ( e ) , d e n s i t y ( p ) , thermal c o n d u c t i v i t y ( k l , t h e s u r f a c e h e a t
1 t r a n s f e r c o e f f i c i e n t ( h ) , s p e c i f i c h e a t (Cp) and t h e b r i q u e t t e dimensions . as expressed by Equation ( 2 3 ) .
The expe r imen ta l t echn ique can now be d e s c r i b e d i n terms of t h e I
' s u r e d expe r imen ta l ly f o r a m a t e r i a l of known thermal and p h y s i c a l prop- ' er t ies ( s t a n d a r d b r i q u e t t e ) , t h e s u r f a c e h e a t t r a n s f e r c o e f f i c i e n t can be
' 'previous d i s c u s s i o n . I f t h e chang; i n c e n t e r t empera tu re w i t h t i m e is m e a -
c a l c u l a t e d from Equation ( 2 3 ) , s i n c e i t is t h e o n l y unknown.
I
/
368. The s u r f a c e h e a t t r a n s f e r c o e f f i c i e n t (h) i s a f u n c t i o n of t h e
f l o w r a t e of t h e c o o l i n g g a s and t h e geometry and s i z e o f t h e b r i q u e t t e . it is independent of a l l o t h e r p h y s i c a l , thermal , or chemical p r o p e r t i e s o f t h e b r i q u e t t e . Therefore , any o t h e r b r i q u e t t e having s i m i l a r dimen- s i o n s and cooled a t t h e same f low r a t e w i l l have t h e same v a l u e f o r ( h ) .
Once (h) h a s been determined u s i n g t h e s t a n d a r d b r i q u e t t e , t h e thermal c o n d u c t i v i t y o f any t es t material can be determined from Equa- t i o n (23) s i n c e a l l o t h e r v a r i a b l e s a r e known.
A computer program has been w r i t t e n which through an i t e r a t i v e p r o c e s s determines t h e b e s t v a l u e of (h) which makes t h e c a l c u l a t e d v a l u e s f o r t h e d imens ionless tempera ture r a t i o e q u a l t o t h e experimental v a l u e s o b t a i n e d when t h e s t a n d a r d b r i q u e t t e is cooled.
With (h) de te rmined , a n o t h e r computor program i s run f o r t h e t e s t specimen. Thermal c o n d u c t i v i t y i s now t h e unknown v a r i a b l e and through a n o t h e r i t e r a t i v e scheme, t h e best va lue f o r (k) t h a t makes t h e ca lcu- l a t e d and exper imenta l v a l u e s f o r t h e tempera ture ratios e q u a l is found.
The i n p u t d a t a f o r bo th programs c o n s i s t of d e n s i t y , s p e c i f i c h e a t , t i m e , b r i q u e t t e dimensions, and s e v e r a l exper imenta l v a l u e s f o r t h e tempera ture r a t i o . The o u t p u t from t h e f i r s t program ( s t a n d a r d ) is t h e b e s t v a l u e f o r ( h ) . Using t h i s v a l u e f o r ( h ) , t h e second program used t o de termine t h e k v a l u e f o r any t es t m a t e r i a l . I f a h i g h l y conduc- t i v e m a t e r i a l i s t e s t e d , t h e n i t is p o s s i b l e t o determine i t s h e a t capa- c i t y s i n c e t h e s o l i d t h e r m a l r e s i s t a n c e w i l l be s m a l l compared t o t h e s u r f a c e thermal r e s i s t a n c e . A t r a n s i e n t h e a t ba lance can be w r i t t e n f o r t h e t es t s o l i d c o o l i n g i n a stream of c o o l a n t gas .
I n t h e above e q u a t i o n , t = t c s i n c e t h e thermal g r a d i e n t i n t h e s o l i d is ) n e g l e c t e d . I n t e g r a t i n g Equat ion ( 2 4 ) and u s i n g t h e d imens ionless t e m - p e r a t u r e r a t i o , Yc g i v e s :
/J
Y, = exp -(hA/pCpV) e (25)
i Thus, if t h e i n t e r n a l s o l i d thermal r e s i s t a n c e is n e g l i g i b l e , a plot of t h e exper imenta l Yc v e r s u s e d a t a on semilog paper should be l i n e a r as shown by Equat ion ( 2 5 ) . The h e a t c a p a c i t y , Cp, can be c a l c u l a t e d from t h e s l o p e of t h e l i n e f o r Yc v e r s u s 0 s i n c e (h) is t h e same as f o r t h e
the test m a t e r i a l a r e a l s o known.
i' s t a n d a r d b r i q u e t t e and t h e d e n s i t y , p , and t o t a l s u r f a c e area, A, for /
M a t e r i a l s and Experimental Work
A primary advantage .of t h e t r a n s i e n t technique for de termining thermal c o n d u c t i v i t i e s i s t h e e a s e and s w i f t n e s s w i t h which t h e e x p e r i - ment can be conducted.
I n so f a r a s sample p r e p a r a t i o n is concerned, any solid t h a t can be b r i q u e t t e d , c a s t , or f a b r i c a t e d around a c e n t r a l l y located r i g i d .
I .
369. thermocouple (x = 0; r = 0 ) may be t e s t e d . F in i shed t es t sample c y l i n - d e r s should be approximately one inch i n d i ame te r , and one-half inch i n
I h e igh t ; however, o t h e r dimensions can be used. I
Experimental Apparatus
The exper imenta l appa ra tus (see F igure 2 ) c o n s i s t s s imply o f a 3-inch diameter g l a s s tube approximately 3 f e e t i n l e n g t h . One end of t h e tube i s completely s toppered excep t f o r a one-half i nch c i r c u l a r opening through which t h e coo lan t gas f lows . The o t h e r end of t he tube i s open t o the atmosphere. A s m a l l e lectr ic fu rnace i s used t o h e a t t h e b r i q u e t t e , and an au tomat ic s i n g l e p o i n t tempera ture r eco rde r con- nec ted t o t h e embedded thermocouple is used t o measure t h e c e n t e r t e m - p e r a t u r e of the b r i q u e t t e .
Experimental Procedure
The exper imenta l p rocedure i s t h e same f o r bo th t h e s t anda rd and tes t b r i q u e t t e s . E i t h e r t h e s t a n d a r d (aluminum was chosen s i n c e i t s thermal p r o p e r t i e s a r e w e l l e s t a b l i s h e d ) , o r t h e t e s t b r i q u e t t e is con- nec ted t o t h e tempera ture r e c o r d e r by way o f t h e thermocouple l e a d s . The b r i q u e t t e is hea ted u n t i l t h e c e n t e r tempera ture has reached a con- s t a n t , predetermined va lue . The b r i q u e t t e i s then q u i c k l y removed from t h e furnace and suspended i n t h e cool ing tube wi th t h e coo l ing gas flowing a t a c o n s t a n t r a t e . The b r i q u e t t e i s u s u a l l y cooled t o t h e temperature o f t h e cool ing gas w i t h i n 20 minutes .
Data P rocess inq
For t h e stsandard b r i q u e t t e , t h e expe r imen ta l d imens ionless t e m - p e r a t u r e r a t i o ve r sus t i m e d a t a p o i n t s f o r t h e s t a n d a r d b r i q u e t t e a long wi th t h e known thermal p r o p e r t i e s a r e used t o c a l c u l a t e t h e s u r f a c e co- e f f i c i e n t , h , i n t h e fo l lowing manner. A d i g i t a l computer program i s w r i t t e n t o compute Yc from Equat ions ( 6 ) through (23). By i t e r a t i o n and assuming v a r i o u s va lues of ( h ) , t h e computed va lues of Y, can be made t o converge on each o f s e l e c t e d expe r imen ta l Yc ve r sus 0 d a t a p o i n t s . Thus, f o r a s e l e c t e d d a t a p o i n t , t h e b e s t expe r imen ta l (h ) is t h a t which when used i n Equat ions ( 8 ) and ( 1 9 ) r e s u l t s i n equa l va lues f o r t h e computed and expe r imen ta l Yc va lues .
For low c o n d u c t i v i t y test m a t e r i a l s , t h e same method is used t o determine t h e b e s t exper imenta l va lue of k by us ing t h e h determined f o r t h e s t anda rd and the o t h e r p r o p e r t i e s of t h e t e s t m a t e r i a l . I f t h e tes t material is a good conductor as d i s c u s s e d i n t h e theo ry s e c t i o n , then exper ience has shown t h a t h should be computed from t h e exper imenta l coo l ing curve and then t h i s va lue is used t o compute k by t h e same method a s f o r low c o n d u c t i v i t y t es t m a t e r i a l s .
0
Discussion and R e s u l t s
Three b r i q u e t t e s of aluminum, l e a d and s i l v e r were made t o t es t t h e v a l i d i t y of t h e expe r imen ta l t echnique s i n c e t h e i r thermal --opeYties were a v a i l a b l e from t h e l i t e r a t u r e as shown i n Table I.
S i n t e r e d , dense hemat i t e (FeZ03) and a b r i q u e t t e of porous carbon made from a p a r t i a l l y d e v o l a t i z e d c o a l were used as test m a t e r i a l s . lor t h e s e m a t e r i a i s , a l l p r o p e r t i e s e x c e p t t h e thermal c o n d u c t i v i t i e s shown i n Table I w e r e p r e v i o u s l y measured. Cooling cu rves f o r each b r i q u e t t e were measured f o r a n i t r o g e n f low rate o f 0 .9 s c f m . Sur- f a c e h e a t t r a n s f e r c o e f f i c i e n t s f o r l e a d , s i l v e r and aluminum were c a l c u l a t e d by t h e method d i s c u s s e d i n t h e d a t a p rocess ing s e c t i o n . F o r t hese m a t e r i a l s , t h e l i t e r a t u r e c o n d u c t i v i t y va lues were used t o c a l c u l a t e t h e s u r f a c e c o e f f i c i e n t . Table I shows t h a t t h e c a l c u l a t e d o r exper imenta l h va lues f o r each me ta l a r e n e a r l y i d e n t i c a l . This r e s u l t i s c o n s i s t e n t w i th t h e t h e o r e t i c a l b a s i s of t h e exper iment and may be cons idered as e s t a b l i s h i n g t h e v a l i d i t y o f t h e method. Also a s a d d i t i o n a l ev idence , aluminum was chosen a s t h e s t a n d a r d and k va lues f o r l e a d and s i l v e r w e r e c a l c u l a t e d us ing t h e h va lue f o r a lu- minum. Table I shows t h a t t h e c a l c u l a t e d o r expe r imen ta l k va lues were w i t h i n 0 . 5 p e r c e n t o f t h e l i t e r a t u r e v a l u e s . The c o n d u c t i v i t i e s f o r hemat i t e and porous ca rbon w e r e c a l c u l a t e d us ing aluminum as t h e s t anda rd . F igu re 3 shows t h e expe r imen ta l d a t a p o i n t s w i th t h e s o l i d l i n e s c a l c u l a t e d from t h e t h e o r y . Note t h a t t h e l i n e f o r t h e carbon is curved whereas t h o s e f o r t h e me ta l s and hemat i t e a r e l i n e a r . As d i scussed p rev ious ly , a l i n e a r coo l ing curve i s o b t a i n e d i f t h e s u r f a c e t o s o l i d thermal r e s i s t a n c e r a t i o s a r e r e l a t i v e l y l a r g e . N o t e t h a t f o r
f u s i v i t y cooled t h e f a s t e s t . eqn. ( 2 5 ) which shows t h a t f o r s imilar gas f l o w s and b r i q u e t t e dimen- s i o n s , t h e r a t e of coo l ing f o r d i f f e r e n t m a t e r i a l s i s de termined by t h e h e a t c o n t e n t , pCp. I t can be seen i n Table I t h a t t h e h e a t c o n t e n t f o r l e a d i s t h e lowest of a l l m e t a l s t e s t e d .
Summary
, t h e metals, l e a d which h a s t h e lowes t c o n d u c t i v i t y and thermal d i f - This r e s u l t i s exp la ined by examinat ion of
A r a p i d , s imple method f o r de t e rmin ing thermal c o n d u c t i v i t y f o r a s o l i d has been developed. The s o l i d can be e i t h e r porous o r non- porous and of e i t h e r h igh o r low c o n d u c t i v i t y . I f h igh c o n d u c t i v i t y m a t e r i a l s a r e t e s t e d , t hen bo th c o n d u c t i v i t y and h e a t c a p a c i t y can be s imul t aneous ly measured from one coo l ing exper iment . The method was v a l i d a t e d by us ing t h e known thermal p r o p e r t i e s o f l e a d , aluminum, and s i l v e r and t h e expe r imen ta l coo l ing cu rves i n a comparison w i t h t h e computed r e s u l t s . /
Ref e r ences
1. Newman, A. B . , I n d u s t r i a l and Engineer ing Chemistry, Vol. 2 8 , 1936, pp. 5 4 5 - 5 4 8 .
,/
a
A
An
cP
h
k
ma
mr
R
r
t
tC
t0
tS
3n.
Nomenclature
= Half h e i g h t of b r i q u e t t e ; f t
= Area: ft2
= C o e f f i c i e n t i n i n f i n i t e series s o l u t i o n f o r tempera ture d i s t r i b u t i o n i n b r i q u e t t e
= S p e c i f i c h e a t ; BTU/lb OF
= Surface h e a t t r a n s f e r c o e f f i c i e n t ; BTU/hr f t 2 OF
= Thermal conduc t iv i ty ; BTU/hr f t 2 OF/ft
= Axial s u r f a c e resistance; d imens ionless
= Radial s u r f a c e r e s i s t a n c e ; d imens ionless
= Maximum r a d i u s of b r i q u e t t e ; f t
= Radius of b r i q u e t t e ; f t
= Temperature; OF
= Temperature a t c e n t e r o f b r i q u e t t e ; O F
= I n i t i a l t empera ture of b r i q u e t t e ; OF
= Temperature o f coo l ing gas: OF
= Distance of d i r e c t i o n ; f t
- a 8 - 3 Dimensionless t i m e parameter f o r a x i a l component
= a e 3 Dimensionless t i m e parameter f o r r a d i a l component
= Symbol f o r tempera ture r a t i o , a x i a l component; d imens ionless
= Symbol f o r tempera ture r a t i o , r a d i a l Component; d imens ionless
= (k/pCp) Thermal d i f f u s i v i t y ; f t 2 / h r
= Time; minutes o r hours
= Densi ty; l b / f t 3 P
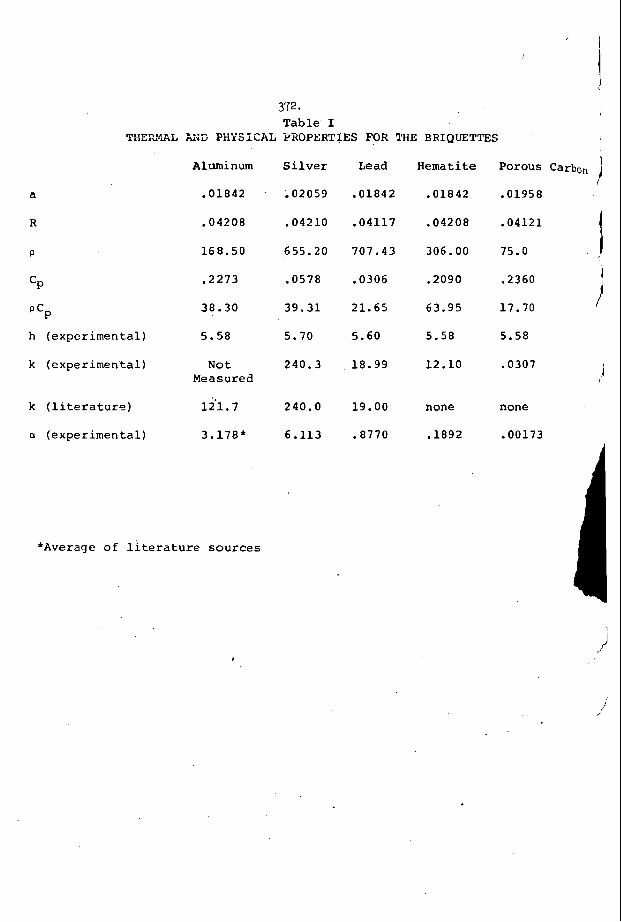
CP
cP
h (exper imenta l )
k (exper imenta l )
k ( l i t e r a t u r e )
a (exper imenta l )
Aluminum
.01842
.04208
168.50
.2273
38.30
5.58
N o t Measured
12'1.7
3.178*
Si lver
-02059
.04210
655.20
.OS78
39.31
5.10
240.3
2 4 0 . 0
6.113
Lead
.01842
.04117
707.43
.0306
21.65
5.60
18.99
19.00
.8770
Hematite
.01842
.04208
306.00
.2090
63.95
5.58
12.10
none
.1892
*Average of l i t e r a t u r e s o u r c e s
I I Porous Carbo,
.01958
.04121
75.0
.2360
17.70
5.58
.0307
I I ji
none
.00173
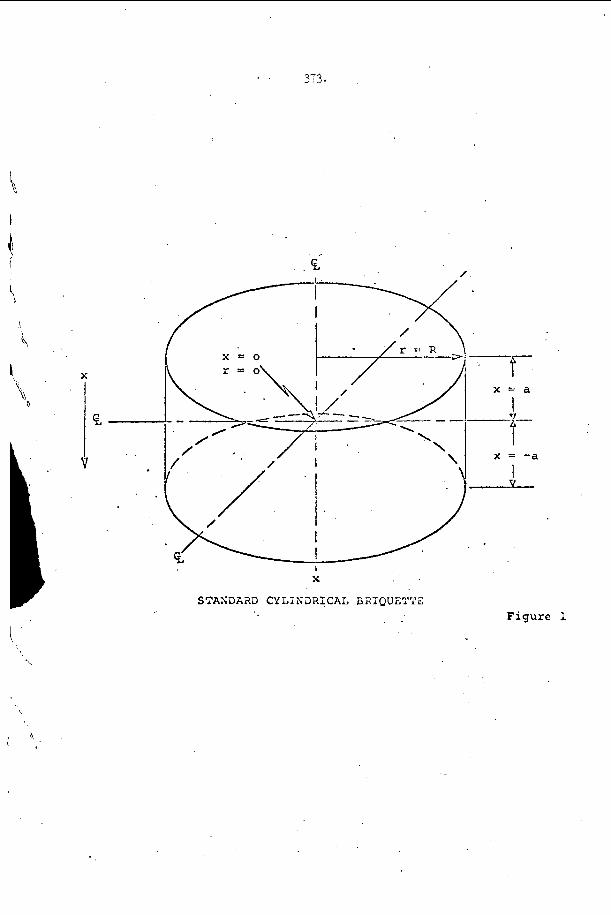
373. . .
\
i
Figure 1
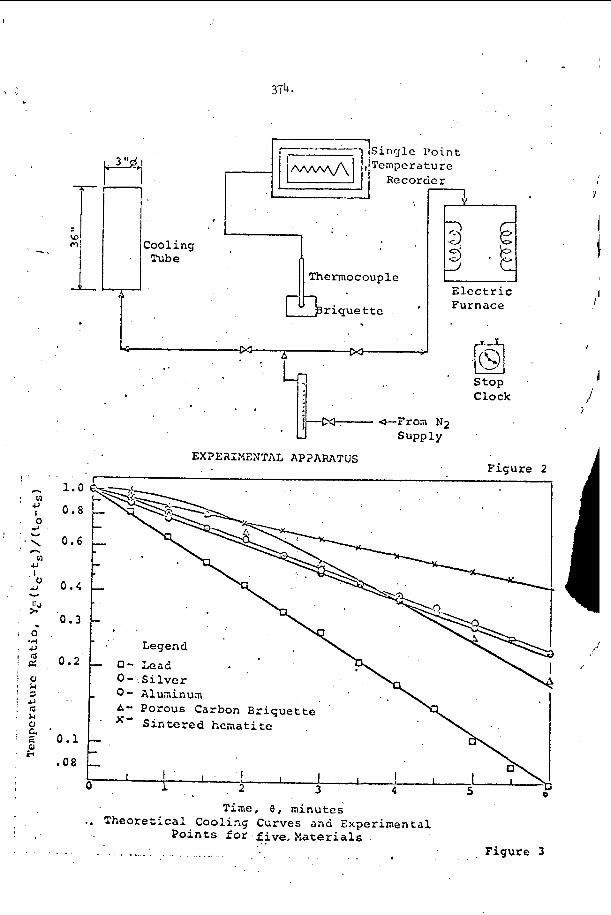
374.
--- Cooling Tube
I 'L
Thermocouple
r i q u e t t c
? r
Zlec t r ic Furnace
F i q u r e 2 EXPERINENTAL AP3ARnTUS
r
0 . 4 - 0.3 -
- . Legend
0- S i l v e r
A- Porous Carbon B r i q u e t t e x- S i n t e r e d heina t i te
0.2 - 0- Lead
- 0- Aluminua
0.1 - . 0 8 - -
Time, 8 , minutes .. T h e o r e t i c a l Cool ing Curves and Exper imenta l
P o i n t s for f ive . Materials .. .. . Figure 3