Embed Size (px)
Citation preview

Deutsche Bank Global Auto Industry ConferenceJanuary 11, 2017
Brad Hughes, President & Chief Executive Officer

Safe Harbor Statement
This presentation contains what the company believes are forward-looking
statements related to future financial results and business operations for
Cooper Tire & Rubber Company. Actual results may differ materially from
current management forecasts and projections as a result of factors over which
the company may have limited or no control. Information on certain of these risk
factors and additional information on forward-looking statements are included in
the company’s reports on file with the SEC and at the end of this presentation.
2

Leading Global Tire Company
• More than 100 years in the tire industry
• 5th largest tire manufacturer in North America and 12th largest
worldwide based on revenues
• Externally report two regions: Americas Tire Operations and
International Tire Operations
• Internally organized across four business segments: North America,
Latin America, Europe and Asia
• More than 10,000 employees across four continents
• Focus on replacement Passenger Car Radial (PCR), Light Truck (LT),
SUV and Truck and Bus Radial (TBR) Tires, as well as a growing OE
business in Asia
• Cooper is in the middle innings of a business transformation
– Drive Topline Profitable Growth Mix Enhancement and Investing in R&D,
Technology and New Products
– Build Competitive Cost Position Investing in Automation, Reduction in
procurement spend and other operating improvements.
– Build Capabilities & Enablers to Support Strategy Key investments in
Cooper Production System (CPS), OE, TBR, ERP and Technical & Business
Development
3

Business Overview

Our Value Proposition
Great
Products
Great
Service
$Great
Value
To be our customers' best
value/service supplier
+ +
5

EPS (diluted)Excluding gain of sale of
subsidiary
Net Sales
Operating Margin
$3.69
$3.0B
11.9%
2014
$2.53
$2.9B*
8.8%
2015
2015 – A Year of Successful Execution
* 2014 Excluding divested JV entity in China (CCT)
6

EPS (diluted)
Net Sales
Operating Margin
$3.24
$2.1B
13.1%
Sept YTD
2015
$2.65
$2.2B
11.5%
Sept YTD
2016*
Nine Months Ended September 30Margin Enhancement Continues
* GAAP—includes $11.5 million non-cash pension settlement charge.
7

• Nearly 200 years of combined auto/tire industry experience
• Generating strong total shareholder returns relative to peers
• Strong balance sheet, with $450 million in cash and cash equivalents as of
September 30, 2016, and low debt profile provide financial flexibility to
pursue growth opportunities
• Disciplined management team is a good steward of capital - ROIC
average 15% over past seven years
• Company committed to dividend and share repurchase
Why Invest in Cooper?
• Positive outlook for global tire demand – CAGR approximately 4.1%
• Majority of Cooper’s growth led by emerging markets, particularly China and
Latin America
• Continued demand shift to higher value/higher margin products
• Balanced supply and demand, with stable pricing in NA market in recent
years
• Focus on replacement tires (not OE) in the U.S.
• Capacity additions and manufacturing upgrades make for strong
manufacturing footprint that Cooper is able to leverage globally
• New product development, shift to premium/HVA products in key
markets enhance topline performance
• Company already achieving key profitability targets
Experienced Management Team
with Proven Track Record
Financial Strength/Discipline &
Commitment to Returning
Value to Shareholders
Middle Innings of Exciting
Transformation
Macro Environment Supportive
of Strategic Growth Objectives
8

Macro-Economic Environment

Source: LMC Data (Mar, 2016), RMA (Mar, 2016), TRAC (Mar, 2016)
China U.S. & Canada
PCR, LT, and TBR
Western Europe
Projected Market Growth Original Equipment Replacement
China 6% 9%
U.S. & Canada 1% 1%
Western Europe 2% 1%
Latin America 6% 4%
Global Tire Demand Continues Positive Trajectory China Leads Overall Market Growth
OE
Replacement
Latin America
58%60%
64% 85% 80% 80%78% 78% 78%
71% 74% 72%
42%
40%
36%
15%20%
20%
22% 22%22%
29%26%
28%
0
100
200
300
400
500
2010 2015 2020E 2010 2015 2020E 2010 2015 2020E 2010 2015 2020E
307
442
310348
364
319 317339
121137
173
M u
nit
s
234
• Robust overall market growth
• OE makes up 40% of total demand
• Replacement growing faster
• Conservative market growth
estimate
• Replacement makes up 80% of
volume
• OE and Replacement growing at
similar rate
• Moderate overall market growth
• Replacement makes up 78% of
volume
• Solid overall market growth
• Replacement makes up 74% of
volume
• OE growing faster than
Replacement due to increase in
new vehicle sales
7.6%1.0%
1.4%
4.7%
10

Passenger Tires Shifting with Global Trends
Source: RMA, IHS, JATO, ETRMA, Solidiance, Internal Cooper analysis
In the mature U.S. and European replacement tire markets, the shift to H-rated and above tires continues…
…while in emerging markets, significant mix transition is projected in Mexico with China’s current OE and future
replacement market dominated by H-rated and above tires
HR+
TR -3.5%
3.0%
2015-2020
CAGR
HR+
TR -1.5%
3.5%
2015-2020
CAGR
TR -1.5%
HR+ 6.0%
2015-2020
CAGR
67% 73% 79%
33% 27% 21%
0%
20%
40%
60%
80%
100%
2010 2015 2020E
34% 37%47%
66% 63%53%
0%
20%
40%
60%
80%
100%
2010 2015 2020E
HR+ 96%
TR 4%
50%62%
74%
50%38%
26%
0%
20%
40%
60%
80%
100%
2010 2015 2020E
2015-2020
CAGR
9.7%
11
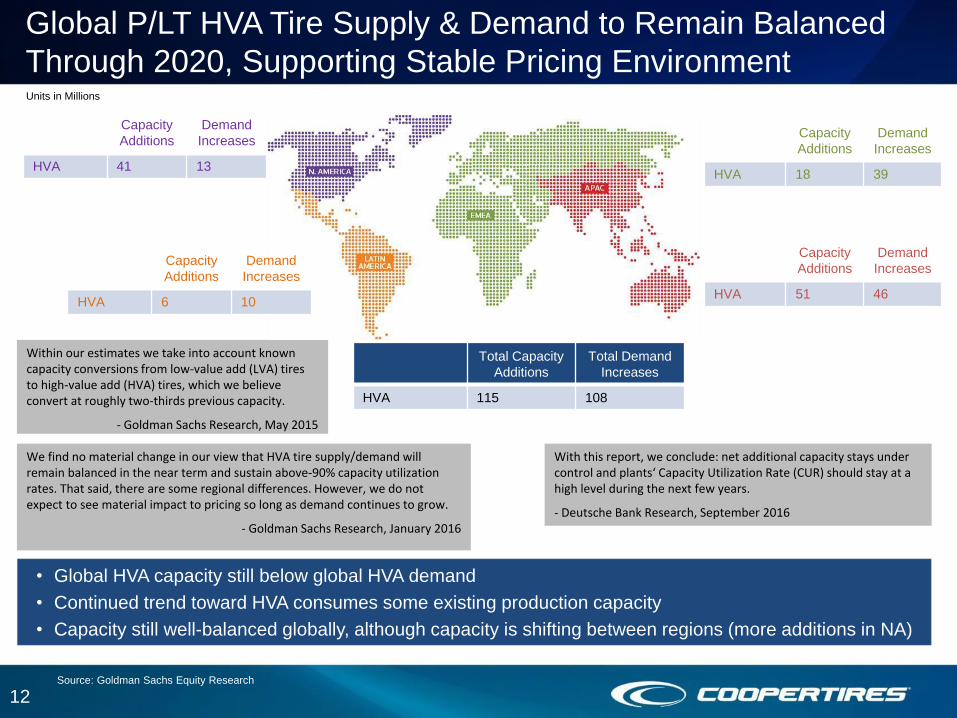
With this report, we conclude: net additional capacity stays under control and plants‘ Capacity Utilization Rate (CUR) should stay at a high level during the next few years.
- Deutsche Bank Research, September 2016
Within our estimates we take into account known capacity conversions from low-value add (LVA) tires to high-value add (HVA) tires, which we believe convert at roughly two-thirds previous capacity.
- Goldman Sachs Research, May 2015
Global P/LT HVA Tire Supply & Demand to Remain Balanced
Through 2020, Supporting Stable Pricing Environment
Capacity
Additions
Demand
Increases
HVA 41 13
Capacity
Additions
Demand
Increases
HVA 6 10
Capacity
Additions
Demand
Increases
HVA 18 39
Capacity
Additions
Demand
Increases
HVA 51 46
We find no material change in our view that HVA tire supply/demand will remain balanced in the near term and sustain above-90% capacity utilization rates. That said, there are some regional differences. However, we do not expect to see material impact to pricing so long as demand continues to grow.
- Goldman Sachs Research, January 2016
Total Capacity
Additions
Total Demand
Increases
HVA 115 108
Units in Millions
Source: Goldman Sachs Equity Research
• Global HVA capacity still below global HVA demand
• Continued trend toward HVA consumes some existing production capacity
• Capacity still well-balanced globally, although capacity is shifting between regions (more additions in NA)
12

Cooper’s Raw Material Price Index
• Industry has experienced downward trend in raw materials since 2011
• Raw materials began increasing in second half of 2016:
• Cooper’s global operational structure centered around succeeding within an increasingly
competitive environment
• Cooper’s pricing posture market-facing to remain competitive
0
50
100
150
200
250
300
2002 2003 2004 2005 2006 2007 2008 2009 2010 2011 2012 2013 2014 2015 2016
Raw Material Price Index - The Americas 2002-2016
*Expect
Q4 2016
Increase
13

Pending TBR Tariff Background
Truck and Bus Radial (TBR) Dynamics
• Cooper executed first step in diversification of TBR sourcing through
GRT investment in China:
• Investment of 600 million RMB (approximately $87 million
USD) including acquisition costs and initial investments in
operation/ramp up
• GRT facility will ultimately produce approximately 2.5 million
TBR tires annually within existing footprint with room for
expansion
• China is largest producer and consumer of TBR tires in the
world – own sourcing critical
• Cooper committed to evaluating other options for additional TBR
supply, inside and outside of China
Diversifying TBR Sourcing
• United Steel Workers petitioned ITC seeking import duties on TBR
tire imports from China into the U.S. in January 2016
• DOC and ITC are investigating implementing anti-dumping and
countervailing duties – the potential impact on industry could be
significant
• About 50% of U.S. TBR tires are imported
• China produces about 45% of the world’s TBR tires
• DOC announced its preliminary CVD tariff rate on June 28, 2016
and it was effective as of July 5, 2016
• The preliminary AD tariff rate was announced on August 29, 2016,
and was amended on Oct. 7, 2016. It is retroactive to June 8, 2016
• Combined, the two rates (minus a 0.41% offset) equal 50.17% for
Cooper/GRT
• Estimated tariff impact is included in Cooper’s 2016 full-year
guidance
• Final decision expected in March 2017
14

Transformation
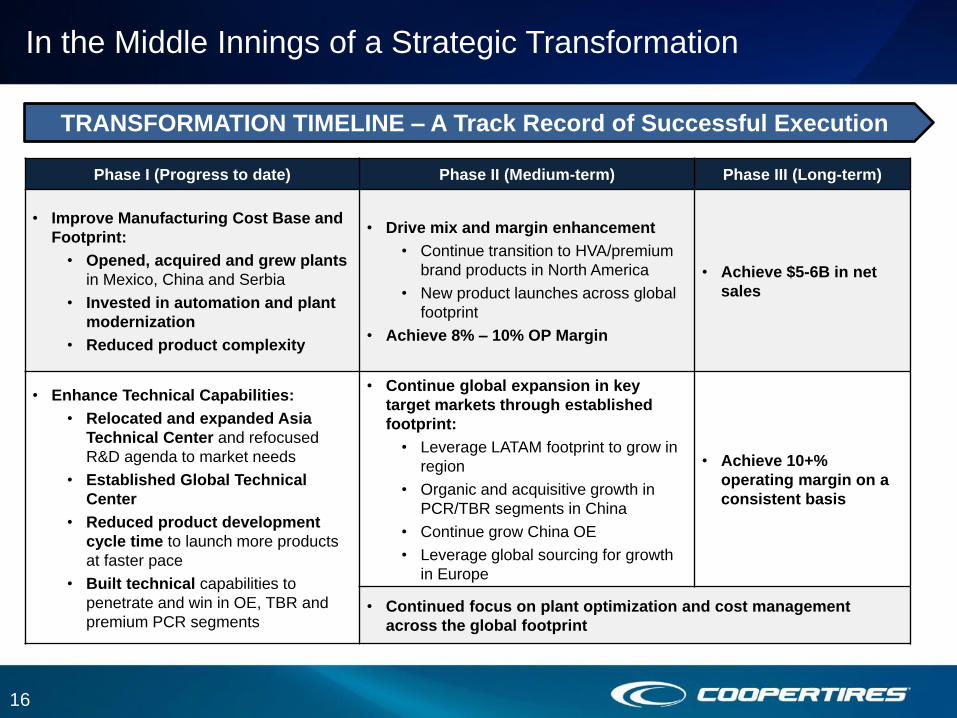
In the Middle Innings of a Strategic Transformation
TRANSFORMATION TIMELINE – A Track Record of Successful Execution
Phase I (Progress to date) Phase II (Medium-term) Phase III (Long-term)
• Improve Manufacturing Cost Base and
Footprint:
• Opened, acquired and grew plants
in Mexico, China and Serbia
• Invested in automation and plant
modernization
• Reduced product complexity
• Drive mix and margin enhancement
• Continue transition to HVA/premium
brand products in North America
• New product launches across global
footprint
• Achieve 8% – 10% OP Margin
• Achieve $5-6B in net
sales
• Enhance Technical Capabilities:
• Relocated and expanded Asia
Technical Center and refocused
R&D agenda to market needs
• Established Global Technical
Center
• Reduced product development
cycle time to launch more products
at faster pace
• Built technical capabilities to
penetrate and win in OE, TBR and
premium PCR segments
• Continue global expansion in key
target markets through established
footprint:
• Leverage LATAM footprint to grow in
region
• Organic and acquisitive growth in
PCR/TBR segments in China
• Continue grow China OE
• Leverage global sourcing for growth
in Europe
• Achieve 10+%
operating margin on a
consistent basis
• Continued focus on plant optimization and cost management
across the global footprint
16

Strong and Expanding Global Manufacturing Footprint
• January, 2016
signed
agreement to
acquire 65%
ownership of
GRT
• Adds TBR
capacity in
China for global
markets
• Site will
ultimately
produce
approximately
• 2.5 million TBR
tires annually
• Transaction
closed Dec. 1,
2016
• November 2015
LOI signed with
FATE to
distribute
Cooper
products and
opportunity to
explore other
opportunities
• Facility in San
Fernando,
Argentina
• FATE produces
passenger, light
truck, SUV and
TBR tires
17

Cost Structure and Global Manufacturing Footprint Provide
Foundation for Growth
Globally Competitive Cost Structure on Every Tire Produced
Cost Effectiveness AutomationProduct Portfolio
ManagementGlobal Sourcing
Americas Tire Operations
Mix and Margin
Enhancement
HVA Mix
Pursue OE
Business
Selectively
Grow in
Commercial
Vehicles
Leverage
Footprint to
Grow in
LATAM
No
rth
Am
eri
ca
International Tire Operations
Grow in China
PCR/TBR
Segments
Continue to
Grown in
China OE
Market
Profitable
Growth in
Western
Europe
Leverage
Sourcing for
Growth in
Eastern
Europe
Asia
Eu
rop
e
LA
TA
M
18

Investment in R&D and TechnologyNew Product Launches
• Reduced product development cycle time to launch new products at a faster
pace
• Relocated and expanded Asia technical center and refocused R&D agenda
on market needs
• Built technical capabilities to penetrate and win in OE, TBR, and premium
PCR segments
Emphasis on Investing in R&D and
Technology = Award Winning
Products and Increased Technical
Capabilities
The Cooper Discoverer SRX and Discoverer A/TW received “recommended buy” from Consumer ReportsApril 2015
Cooper Zeon RS3-A a Consumers Digest Best Buy … again!January 2015
The Discoverer A/TW
received Innovator of the Year award from Canadian Tire.September 2015
Vendor InnovationAward
The Cooper Discoverer STT Pro & Cooper Discoverer SRX tires won the 2015 GOOD DESIGN™ Award from the Chicago Museum of Architecture and Design and the European Centre for Architecture Art Design and Urban Studies. December 2015
The Cooper Zeon ECO C1 was awarded the “Best Energy Saving Tire for 2016” at the Auto Magazine and A Car awards ceremony.December 2015
The Cooper Discoverer UTS & CooperWeather Master Ice 100 tires won the 2015 GOOD DESIGN™ Award December 2015
Recommended by another leading consumer magazine
The Cooper Zeon RS3-G1 is an exciting new all-season passenger car tire for high performance vehicles and drivers. Alongside a sleek race-inspired sidewall, the tire’s tread compound and design deliver a host of leading innovative features to create grip, stability and durability.The product has been given the name G1 because it holds up to 1g on corners! The G1 was named a 2016 GOOD DESIGN™ Award winner December 2016.
19

Financial Strength and
Returning Value to Shareholders

Ample Financing Flexibility
Strong Balance Sheet Provides Financial Flexibility
Cash and cash equivalents ($M)
+46%
Q4 ‘15Q4 ’07
16
38
0
20
40
2015
-22
Debt/Enterprise value1
2008
1. Debt is short-term debt, current portion of long-term debt and long-term debt
Healthy Balance Sheet
$150MAccounts receivable
securitization program
$400MCash flow facility
Credit lines at Global
Operations
Recent Credit Rating Upgrades
Moody’s to Ba3
S&P to BB
21

Balanced Approach to Capital Allocation
Investing for Growth
• Capital to support organic growth and
margin improvement - plant optimization and
operational efficiency
• Track record of efficiently deploying capital
to return value to shareholders
Share Repurchases
• Completed $399 million in share
repurchases from August 2014 through
October 26, 2016 (approximately 18% of
outstanding)
• Additional $128 million remaining and
authorized through December 31, 2017
Dividend
• Announced 179th consecutive dividend
payment on October 27, 2016
• Continued commitment to quarterly dividend
Weighted Average ROIC = 15%
1.Return on Invested Capital, including non-controlling equity. Non-GAAP Measure: refer to appendix for definition and reconciliation to GAAP.
* 2016 guidance as communicated on October 31, 2016. Numbers in graph in millions (000,000)
16% 17%
12%
22%
11%13%
18%
0%
5%
10%
15%
20%
25%
2009 2010 2011 2012 2013 2014 2015
ROIC1
$180 $145
$183 $180 -$200
$87$200 $109
$108
$27
$26
$24
$23
2013 2014 2015 2016E*
CapEx M&A Share Repurchases Dividend
22

• Nearly 200 years of combined auto/tire industry experience
• Generating strong total shareholder returns relative to peers
• Strong balance sheet, with $450 million in cash and cash equivalents as of
September 30, 2016, and low debt profile provide financial flexibility to
pursue growth opportunities
• Disciplined management team is a good steward of capital - ROIC
average 15% over past seven years
• Company committed to dividend and share repurchase
Why Invest in Cooper?
• Positive outlook for global tire demand – CAGR approximately 4.1%
• Majority of Cooper’s growth led by emerging markets, particularly China and
Latin America
• Continued demand shift to higher value/higher margin products
• Balanced supply and demand, with stable pricing in NA market in recent
years
• Focus on replacement tires (not OE) in the U.S.
• Capacity additions and manufacturing upgrades make for strong
manufacturing footprint that Cooper is able to leverage globally
• New product development, shift to premium/HVA products in key
markets enhance topline performance
• Company already achieving key profitability targets
Experienced Management Team
with Proven Track Record
Financial Strength/Discipline &
Commitment to Returning
Value to Shareholders
Middle Innings of Exciting
Transformation
Macro Environment Supportive
of Strategic Growth Objectives
23

Risk Factors
It is possible that actual results may differ materially from projections or expectations due to a variety of factors, including but not limited to:
• volatility in raw material and energy prices, including those of rubber, steel, petroleum based products and natural gas or the unavailability of such raw materials or energy
sources;
• the failure of the company’s suppliers to timely deliver products or services in accordance with contract specifications;
• changes to tariffs or the imposition of new tariffs or trade restrictions, including changes related to the anti-dumping and countervailing duties for passenger car and light truck
tires imported into the United States from China; and duties from the ongoing investigation into truck and bus tires imported into the United States from China;
• changes in economic and business conditions in the world, including changes related to the United Kingdom’s referendum on withdrawal from the European Union;
• increased competitive activity including actions by larger competitors or lower-cost producers;
• the failure to achieve expected sales levels;
• changes in the company’s customer relationships, including loss of particular business for competitive or other reasons;
• the ultimate outcome of litigation brought against the company, including product liability claims, which could result in commitment of significant resources and time to defend
and possible material damages against the company or other unfavorable outcomes;
• a disruption in, or failure of, the company’s information technology systems, including those related to cyber security, could adversely affect the company’s business operations
and financial performance;
• changes in pension expense and/or funding resulting from the company’s pension strategy, investment performance of the company’s pension plan assets and changes in
discount rate, salary increase rate, and expected return on plan assets assumptions, or changes to related accounting regulations;
• government regulatory and legislative initiatives including environmental and healthcare matters;
• volatility in the capital and financial markets or changes to the credit markets and/or access to those markets;
• changes in interest or foreign exchange rates;
• an adverse change in the company’s credit ratings, which could increase borrowing costs and/or hamper access to the credit markets;
• failure to implement information technologies or related systems, including failure by the company to successfully implement an ERP system;
• the risks associated with doing business outside of the United States;
• the failure to develop technologies, processes or products needed to support consumer demand;
• technology advancements;
• the inability to recover the costs to develop and test new products or processes;
• the impact of labor problems, including labor disruptions at the company, its joint ventures, or at one or more of its large customers or suppliers;
• failure to attract or retain key personnel;
• consolidation among the company’s competitors or customers;
• inaccurate assumptions used in developing the company’s strategic plan or operating plans or the inability or failure to successfully implement such plans;
• risks relating to acquisitions, including the failure to integrate them into operations or their related financings may impact liquidity and capital resources;
• changes in the company’s relationship with its joint-venture partners or suppliers, including any changes with respect to the production of Cooper-branded products by CCT, the
company’s former joint venture in China;
• the ability to find sufficient alternative sources for products supplied by CCT;
• the inability to obtain and maintain price increases to offset higher production or material costs;
• inability to adequately protect the company’s intellectual property rights; and
• inability to use deferred tax assets.
24

Available Information
You can find Cooper Tire on the web at coopertire.com. Our company webcasts earnings calls and presentations
from certain events that we participate in or host on the investor relations portion of our website
(http://coopertire.com/investors.aspx). In addition, we also make available a variety of other information for
investors on the site. Our goal is to maintain the investor relations portion of the website as a portal through
which investors can easily find or navigate to pertinent information about Cooper Tire, including:
• Our annual report on Form 10-K, quarterly reports on Form 10-Q, current reports on Form 8-K, and any
amendments to those reports, as soon as reasonably practicable after we electronically file that material or
furnish it to the Securities and Exchange Commission (“SEC”);
• Information on our business strategies, financial results and selected key performance indicators;
• Announcements of our participation at investor conferences and other events;
• Press releases on quarterly earnings, product and service announcements and legal developments;
• Corporate governance information; and,
• Other news and announcements that we may post from time to time that investors may find relevant.
The content of our website is not intended to be incorporated by reference into this presentation or in any report
or document we file with or furnish to the SEC, and any references to our website are intended to be inactive
textual references only.
25

Appendix

Financial PerformanceNine Months Ended September 30, 2016
Amounts are unaudited and may not add due to rounding.
(millions USD, except EPS)
Net Sales by Segment
9 Months Ended
September 30, 2016
9 Months Ended
September 30, 2015
Change from
Prior Year
Americas Tire $ 1,907 $ 1,974 -3.4%
International Tire 340 351 -3.2%
Eliminations (105) (127) 17.3%
Total Company $ 2,141 $ 2,197 -2.6%
Operating Profit by Segment OP % OP %
Americas Tire $ 324 17.0 $ 301 15.3 $ 23
International Tire 5 1.4 (12) -3.4 16
Corporate (48) (40) (8)
Eliminations (1) 3 (4)
Total Company $ 279 13.0 $ 252 11.5 $ 27
Earnings Per Share (diluted) from continuing
operations attributable to common stockholders $ 3.23 $ 2.65 $ 0.58
Cash and Cash Equivalents $ 450 $ 424 $ 26
27

Preliminary TBR Tariffs
CVD AD** Offsets*** Total
Cooper/GRT 20.22% 30.36% -0.41% 50.17%
PCT 20.22% 30.36% -0.41% 50.17%
Guizhou Tyre* 23.80% 30.36% -0.41% 53.75%
Double Coin 17.06% 30.36% -0.41% 47.01%
Aeolus 20.22% 30.36% -0.41% 50.17%
Other - separate
rate20.22% 30.36% -0.41% 50.17%
Other - PRC-wide
rate20.22% 30.36% -0.41% 50.17%
Preliminary Tariffs on Chinese-Produced TBR Tires Imported
into the U.S.
Expected to be finalized March 2017
As of 11/1/2016
* Only company for which the preliminary CVD is retroactive.
** Preliminary AD retroactive for all companies.
***Expected to change to 12.61% when rates become final
28

Qingdao Ge Rui Da Rubber (GRT)
• Established in 2014 after Qingdao
Yiyuan Investment purchased the
assets of the then idle facility
• Employs approximately 600
workers
• Existing 1 million-square-foot
manufacturing facility
• Estimated full production capacity
of facility:
– Approximately 2.5 TBR tires
annually
– Nearly same number of passenger
car tires could be produced in the
future
• Land at the site for further
expansion, if neededGRT is located in Qingdao City, which is in
northeast China
29

Non-GAAP Measures
Non-GAAP financial measures should be considered in addition to, not as a substitute for,
net earnings, earnings per share, total debt or other financial measures prepared in
accordance with generally accepted accounting principles (“GAAP”). The company’s
methods of determining these non-GAAP financial measures may differ from the methods
used by other companies for these or similar non-GAAP financial measures. Accordingly,
these non-GAAP financial measures may not be comparable to measures used by other
companies.
Pursuant to the requirements of SEC Regulation G, detailed reconciliations between the
Company’s GAAP and non-GAAP financial results were posted by incorporation within the
appendix to this presentation. Investors are advised to carefully review and consider this
information as well as the GAAP financial results that are disclosed in the company’s
earnings releases and annual and quarterly SEC filings.
30

Non-GAAP Measures
Return on Invested Capital (ROIC)
Management is using non-GAAP financial measures in this document because it considers them to be important
supplemental measures of the company’s performance. Management also believes that these non-GAAP financial
measures provide additional insight for analysts and investors in evaluating the company’s financial and operating
performance.
The company defines ROIC as the trailing four quarters’ net income from continuing operations before interest, after
tax, divided by the total invested capital, which is the average of ending debt and equity for the last five quarters. The
company believes ROIC is a useful measure of how effectively the company uses capital to generate profits.
Return on Invested Capital
2015 2014 2013 2012 2011 2010 2009
Operating profit $ 354 $ 300 $ 241 $ 397 $ 163 $ 188 $ 156
Provision for income taxes, net
of valuation allowance release (118) (112) (79) (116) (32) (20) 0
Net interest tax effect (8) (9) (10) (8) (8) (4) 0
Net operating profit after tax $ 229 $ 180 $ 151 $ 272 $ 124 $ 164 $ 157
Total invested capital $ 1,272 $ 1,421 $ 1,392 $ 1,265 $ 1,019 $ 942 $ 963
Return on invested capital 18% 13% 11% 22% 12% 17% 16%
31

Non-GAAP Measures
Total Invested Capital
2015 2014 2013 2012
Dec. 31 Sep. 30 June 30 March 31 Dec. 31 Sep. 30 June 30
March
31 Dec. 31 Sep. 30 June 30 March 31 Dec. 31 Sep. 30 June 30 March 31
Equity $ 1,018 $ 965 $ 947 $ 927 $ 884 $ 935 $ 1,088 $ 1,050 $ 1,158 $ 1,027 $ 1,015 $ 968 $ 908 $ 878 $ 786 $ 968
Long-term debt 296 297 298 298 298 326 326 328 321 326 327 335 336 337 337 335
Current portion of long-term debt 1 1 2 2 2 16 16 19 18 18 21 17 2 2 7 17
Short-term notes payable 12 18 15 16 65 185 24 25 22 27 48 34 33 48 119 34
Total invested capital $ 1,327 $ 1,280 $ 1,261 $ 1,243 $ 1,249 $ 1,461 $ 1,455 $ 1,422 $ 1,519 $ 1,398 $ 1,411 $ 1,353 $ 1,280 $ 1,264 $ 1,249 $ 1,353
2011 2010 2009 2008
Dec. 31 Sep. 30 June 30 March 31 Dec. 31 Sep. 30 June 30
March
31 Dec. 31 Sep. 30 June 30 March 31 Dec. 31 Sep. 30 June 30 March 31
Equity $ 698 $ 517 $ 494 $ 471 $ 523 $ 523 $ 470 $ 404 $ 381 $ 433 $ 350 $ 353 $ 318 $ 707 $ 768 $ 785
Long-term debt 329 330 324 317 321 326 327 327 331 330 325 328 326 412 419 436
Current portion of long-term debt 21 27 21 17 6 5 5 5 16 107 119 141 148 51 39 17
Short-term notes payable 132 139 136 127 147 138 156 145 157 144 161 163 185 169 155 127
Total invested capital $ 1,180 $ 1,012 $ 976 $ 932 $ 997 $ 991 $ 958 $ 882 $ 884 $ 1,014 $ 955 $ 986 $ 977 $ 1,339 $ 1,381 $ 1,365
Net Interest Tax Effect
2015 2014 2013 2012 2011 2010 2009
Income from continuing operations before
income taxes $ 334 $ 349 $ 213 $ 368 $ 134 $ 160 $ 116
Provision for income taxes (118) (112) (79) (116) 135 (20) 0
Valuation allowance release - - - - 167 - -
Provision for income taxes, net of valuation
allowance release $ (118) $ (112) $ (79) $ (116) $ (32) $ (20) $ 0
Effective income tax rate 35.4% 32.0% 37.3% 31.5% 23.7% 12.5% -0.2%
Interest expense $ (24) $ (28) $ (28) $ (30) $ (36) $ (37) $ (47)
Interest income 2 2 1 3 3 5 5
Net interest expense $ (22) $ (27) $ (27) $ (27) $ (33) $ (31) $ (42)
Net interest tax effect $ (8) $ (9) $ (10) $ (8) $ (8) $ (4) $ 0
32


![Systems for the Rubber Tire Industry GB[1]](https://img.pdfslide.net/doc/110x75/547af145b47959a4098b4ca7/systems-for-the-rubber-tire-industry-gb1.jpg)