Embed Size (px)
Citation preview

Todd Wagner, PhDWei Yu, PhD
Josephine Jacobs, PhDJean Yoon, PhD
Angela Fan, MPH
Health Economics Resource Center (HERC)
February 27, 2017
Economics of Implementation: Developing a Cost Analysis Plan

HERC’s Plan to Support QUERI
We conducted a needs assessment in 2016 HERC developed two parallel work streams to
support the economics needs of the QUERI programs:– Tailored support for three QUERI programs– General support for twelve QUERI programs
2
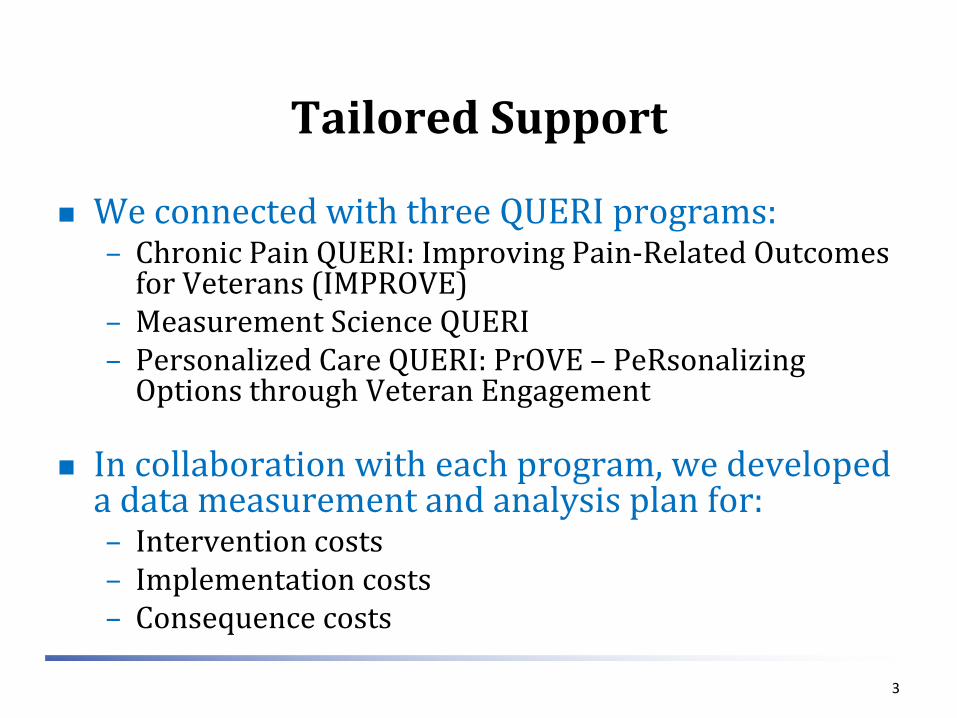
Tailored Support
We connected with three QUERI programs:– Chronic Pain QUERI: Improving Pain-Related Outcomes
for Veterans (IMPROVE)– Measurement Science QUERI – Personalized Care QUERI: PrOVE – PeRsonalizing
Options through Veteran Engagement
In collaboration with each program, we developed a data measurement and analysis plan for:– Intervention costs – Implementation costs– Consequence costs
3

General Support
We will utilize the lessons learned from the tailored support to develop tools and resources for the other QUERI programs.
These tools include: – A toolbox to inform economic data measurement and
analysis – Educational materials – A help desk
4

Objectives
Is economics important? Developing an economic plan
1. Estimating the costs of implementation
2. Estimating the costs of the intervention
3. Estimating consequence costs
5

Is a Cost Analysis Needed?
Good opportunities– Interventions that have a large impact on health care costs– Widely adopted interventions– Intervention designed to meet an economic objective or to
replace existing care Limited or uncertain opportunity use
– Close substitutes– If economic findings depend on proof of effectiveness– Basic science hypotheses– Low-cost interventions– Conditions with no current treatment
6
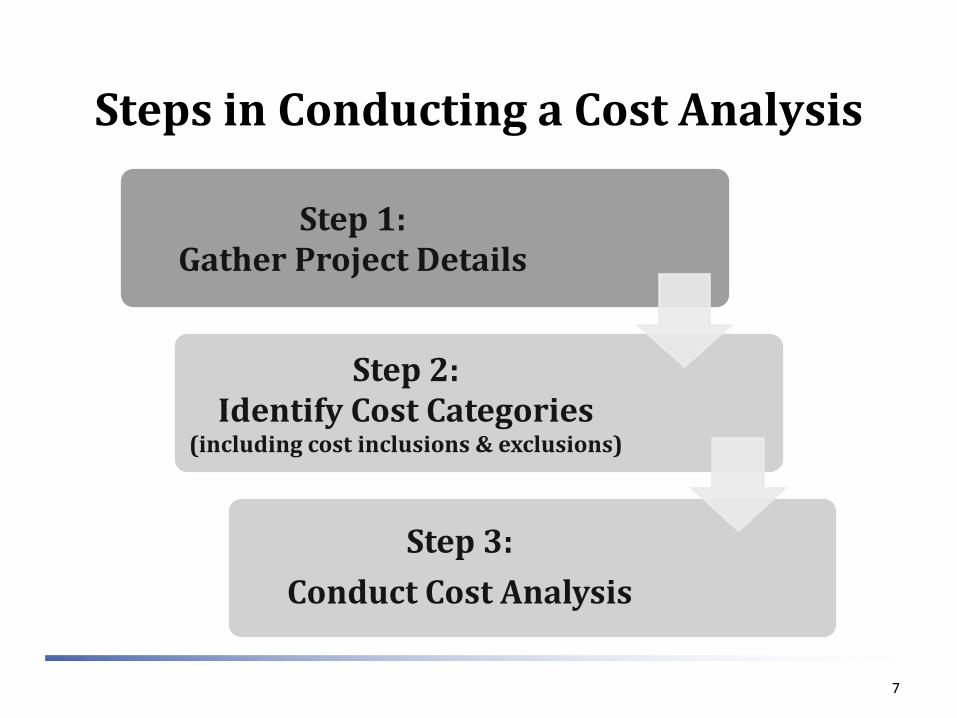
Steps in Conducting a Cost Analysis
7
Step 1: Gather Project Details
Step 2: Identify Cost Categories
(including cost inclusions & exclusions)
Step 3:Conduct Cost Analysis

Step 1: Gather Project Details
Gather the following background information for the project.
1. Perspective
2. Time Horizon
3. Treatment Alternatives
4. Patient Population
5. Outcome Measure Considerations
6. Sub-Group Analyses
8
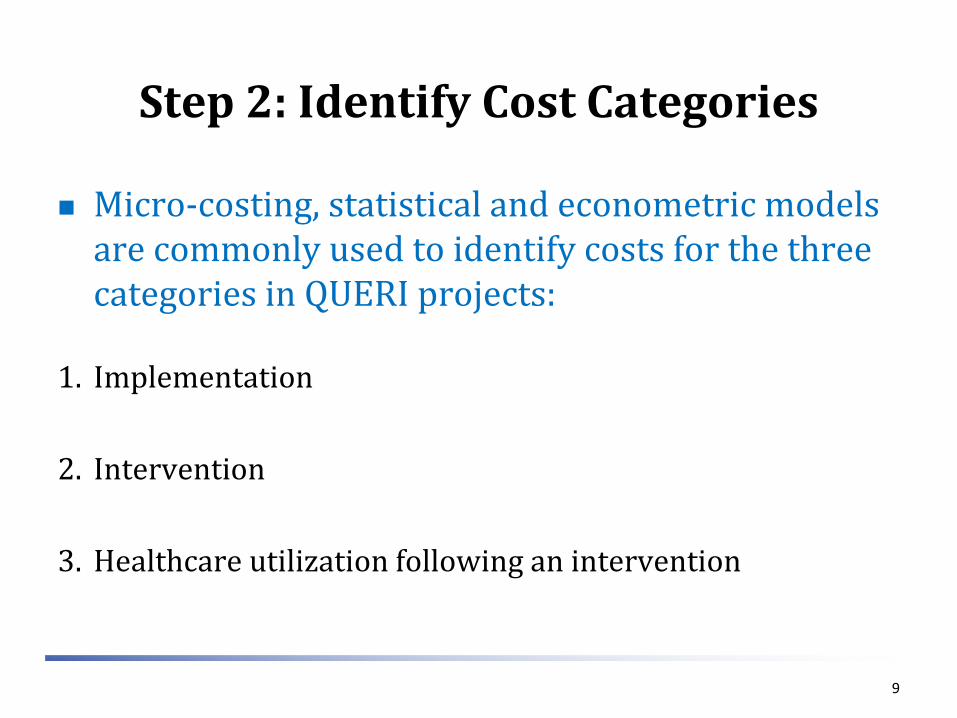
Step 2: Identify Cost Categories
Micro-costing, statistical and econometric models are commonly used to identify costs for the three categories in QUERI projects:
1. Implementation
2. Intervention
3. Healthcare utilization following an intervention
9
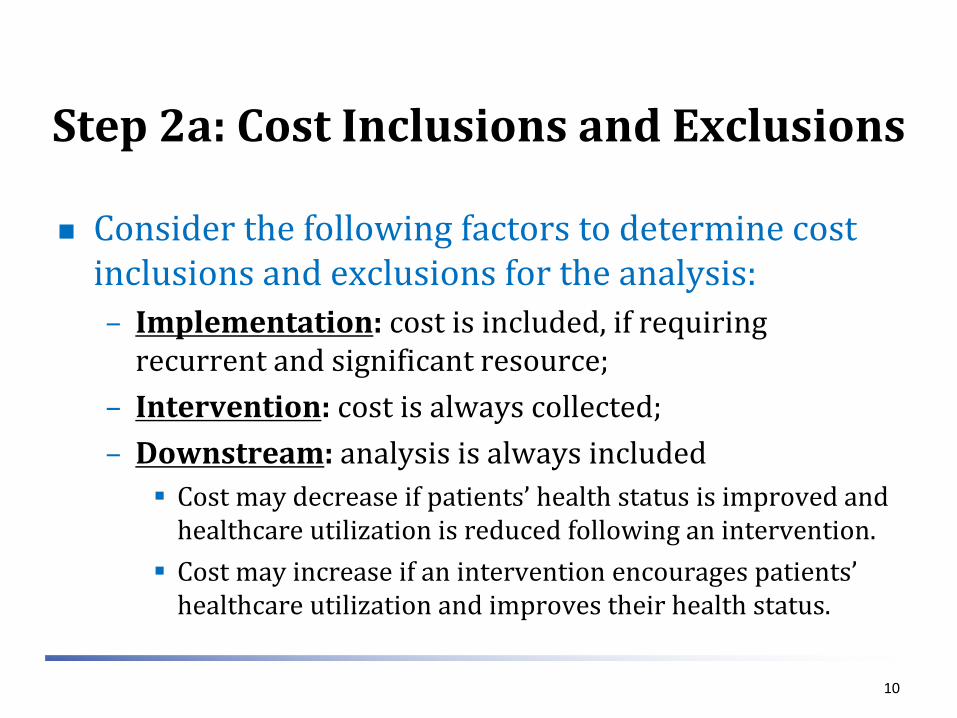
Step 2a: Cost Inclusions and Exclusions
Consider the following factors to determine cost inclusions and exclusions for the analysis:– Implementation: cost is included, if requiring
recurrent and significant resource;– Intervention: cost is always collected;– Downstream: analysis is always included Cost may decrease if patients’ health status is improved and
healthcare utilization is reduced following an intervention. Cost may increase if an intervention encourages patients’
healthcare utilization and improves their health status.
10

Step 2: Implementation Costs
Implementation costs are generally measured by a micro-costing method and commonly include the following cost items:
Staff – Project Implementation
Average time (in FTE) and title of people involved in the project implementation.
Indirect labor cost (training, vacation, etc.) should be considered.– Meeting Time of Participants
Average time and title of meeting participants (physicians, nurses, etc.) Supplies
– Equipment Equipment and shared time (if share with other services) needed to
implement an intervention. – Material
Manual, handbook, instruction, newsletter etc. – Telephone/email
Service fee and time of regular telephone and email communication
11
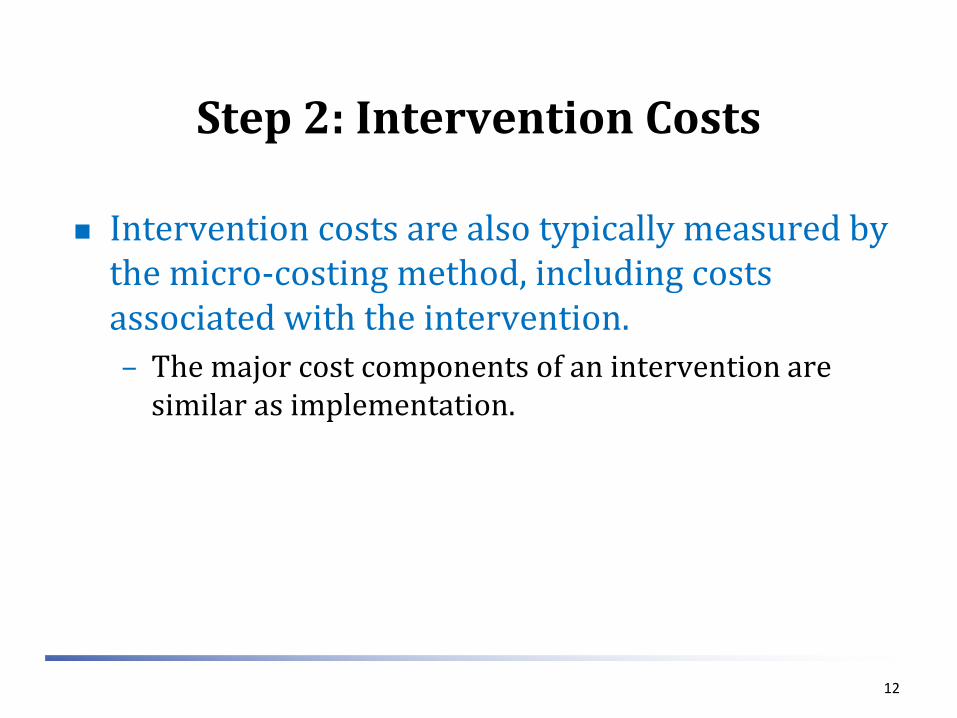
Step 2: Intervention Costs
Intervention costs are also typically measured by the micro-costing method, including costs associated with the intervention. – The major cost components of an intervention are
similar as implementation.
12

Step 2: Micro-costing ToolBelow is a tool that could be used to track provider time for micro-costing efforts.
13

Step 2: Micro-costing Tools
Need to be tailored to the study Track services provided (e.g., patient meeting) Track time, if there is variation within service and
precision is needed Useful to get input from those who will complete
the form
14

Step 2: Consequence Costs
Consider the following information regarding the study design and objectives to determine the most appropriate measurement model for the healthcare utilization costs:
Control group– Ensure similarity between patients in the control and intervention groups.– Assess sample size to ensure we have the power to statistically detect
differences.
Length of the study period– Determine an appropriate period pre-and post the intervention.
Relevant category of healthcare utilization– Identify healthcare utilization that is relevant to the study intervention,
which may not always be possible.
15

Step 2: Consequence Costs cont’d
Consider the following information regarding the study design and objectives to determine the most appropriate measurement model for the healthcare utilization costs:
Variation in medical treatment
– Healthcare practice varies across regions and facilities, which should be considered when we conduct a budget impact analysis for each facility and for the entire VA system.
– Two commonly used methods to identify net impact of an intervention: Difference-in-differences (before and after, control and
intervention) An interrupted time series
16

Step 3: Conduct Cost Analysis
Determine activities that should be included in cost analysis (Tables 1 to 2).
Choose a cost measurement method for each activity.
Determine the necessary factors for consequent cost analysis.
Develop a consequent cost analysis method.
Complete a cost analysis plan.
Data collection
Data analysis
Report
17

Table 1: Activity of Implementation Cost
Activity Description STAFF SUPPLIES OTHER
Total Staff
(FTE)
Length of Staff
on Project
Meeting Time of
Participants by
Employment Category
Equipment Material Telephone/
Email time (project
specific to all patients)
Other
18
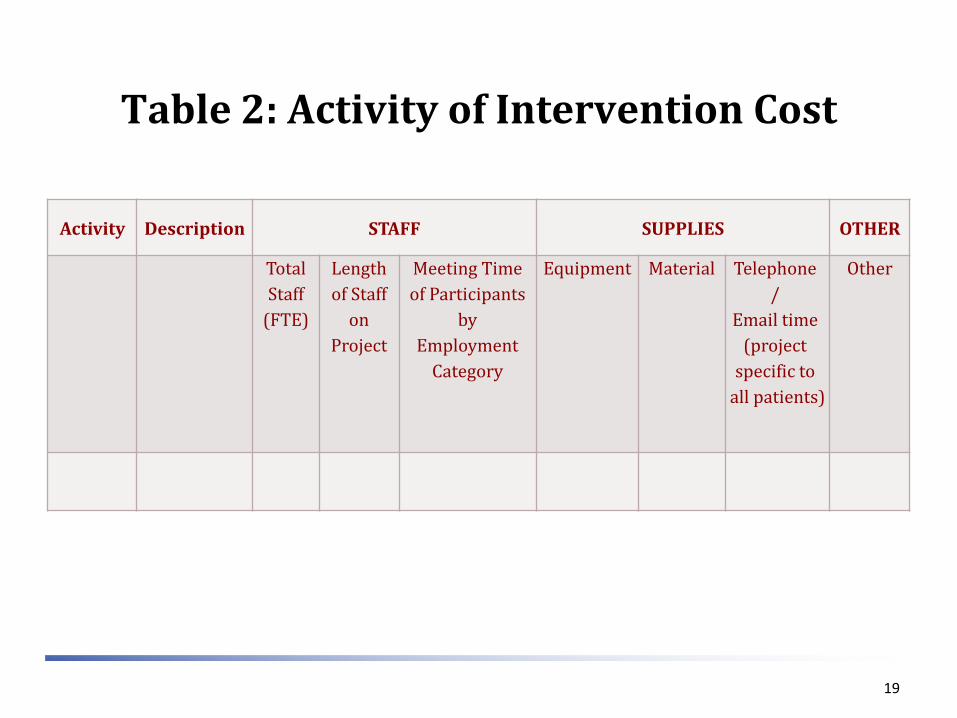
Table 2: Activity of Intervention Cost
Activity Description STAFF SUPPLIES OTHER
Total Staff
(FTE)
Length of Staff
on Project
Meeting Time of Participants
by Employment
Category
Equipment Material Telephone/
Email time (project
specific to all patients)
Other
19
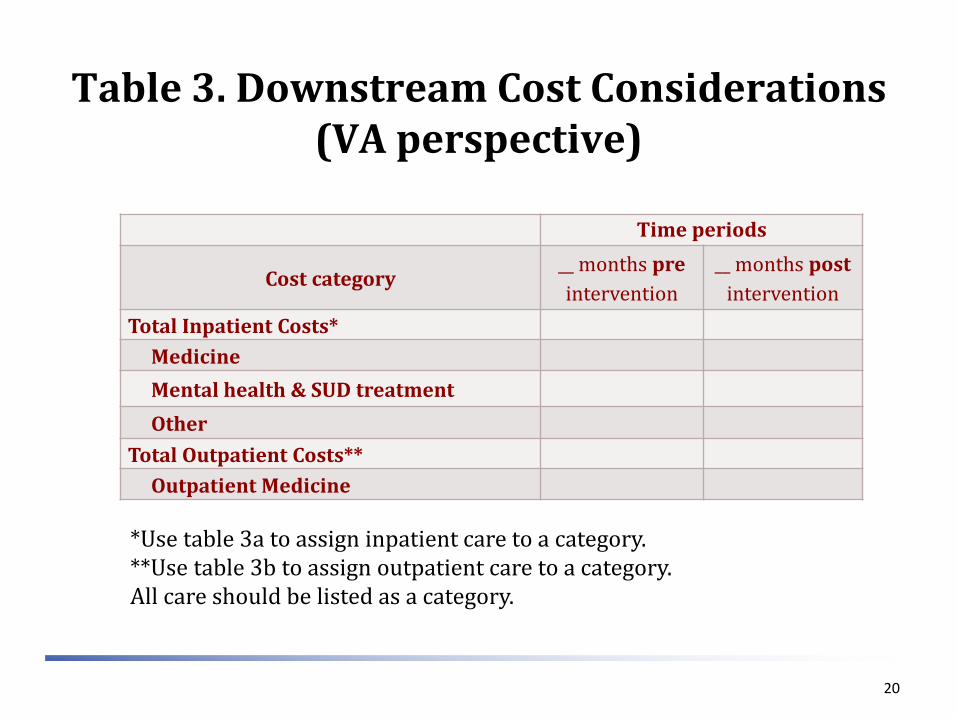
Table 3. Downstream Cost Considerations (VA perspective)
Time periods
Cost category__ months preintervention
__ months postintervention
Total Inpatient Costs*MedicineMental health & SUD treatmentOther
Total Outpatient Costs**Outpatient Medicine
*Use table 3a to assign inpatient care to a category.**Use table 3b to assign outpatient care to a category.All care should be listed as a category.
20

Table 3a: Examples of Inpatient Categories of Care
Category of Care Bedsection / Treating SpecialtyMedicine 1-19, 24, 30, 31, 34, 83, 1E, 1F, 1H, 1JMental health SUD Treatment
25, 26, 28, 29, 33, 38, 39, 70, 71, 75, 76, 77, 79, 89, 91-94, 1K, 1L 27, 72, 73, 74, 84, 90, IM
Rehabilitation 20, 35, 41, 82, 1D, INBlind Rehabilitation 21, 36Spinal Cord 22, 23Surgery 48-63, 65, 78, 97, 1GIntermediate 32,40Domiciliary 37, 85, 86, 87, 88Long Term Care 42-47, 64, 66-69, 80, 81, 95, 96, 1A, 1B, 1CPRRTP 25-29, 38, 39
NOTE: Decide which of these categories can be combined into an “Other” category.
21

Table 3b: Examples of Outpatient Categories Based on Clinic Stop
HERC Category of Care Name Clinic Stop NumberOutpatient Medicine 101-103, 110, 116, 130, 131, 142-144, 149, 153, 158, 159, 182, 185-188, 231, 301-326,
329-333, 335-342, 345, 348-353, 369-373, 394, 434, 436, 437, 439, 450-485, 511, 674, 683-686, 690-692, 694, 695, 706, 709, 710, 712
Mental health 156, 157, 501, 502, 504-506, 509, 510, 512, 515, 516, 520-522, 524-540, 542, 546, 550-554, 557-559, 561-584, 589-592, 731
SUD Treatment 507, 508, 513, 514, 517-519, 523, 543-545, 547, 548, 555, 556, 560, 588, 593-599, 707Pharmacy 180, 181Dialysis 602-604, 606-608, 611Ancillary Services 111, 117, 120, 122-125, 147, 160, 161, 163-169, 708, 711, 714, 999Rehabilitation 195-199, 201-211, 213, 214, 216-225, 228-230, 240, 250, 438, 715Diagnostics Services 104-109, 115, 126-128, 145, 146, 148, 150-152, 154, 212, 334, 701-705, 717, 718Prosthetics 417, 418, 423, 425, 449Surgery 327, 328, 401-416, 419-422, 424, 426-433, 435, 716Adult Daycare 190, 191Home Care 118, 119, 121, 170-179, 215, 503, 670, 680-682, 725-730Extended Care 650-652, 654, 656Other Contract Care 610, 640-643, 653, 655, 658Unassigned 801, 802, 900, 998
NOTE: Decide which of these categories can be combined into an “Other” category.
22

Example: Estimating Labor Costs by Direct Measurement
23
Wagner, T. H., Engelstad, L. P., Mcphee, S. J. & Pasick, R. J. (2007) The costs of an outreach intervention for low-income women with abnormal Pap smears, Prev Chronic Dis, 4, A11.
Wagner TH, Goldstein MK. Behavioral interventions and cost-effectiveness analysis. Prev Med 2004;39:1208-14.

Outreach Workers
A local county hospital routinely performed Pap smears in the ED.
Problem: Low rates of follow-up among abnormal Pap smears (~30% follow-up)
Question: what is the cost of using an outreach worker to improve follow-up?
24

Objective
We evaluated the cost and cost per follow-up of usual care (a mailed postal reminder) with a tailored outreach intervention compared to usual care alone.
Do costs vary by disease risk?
25
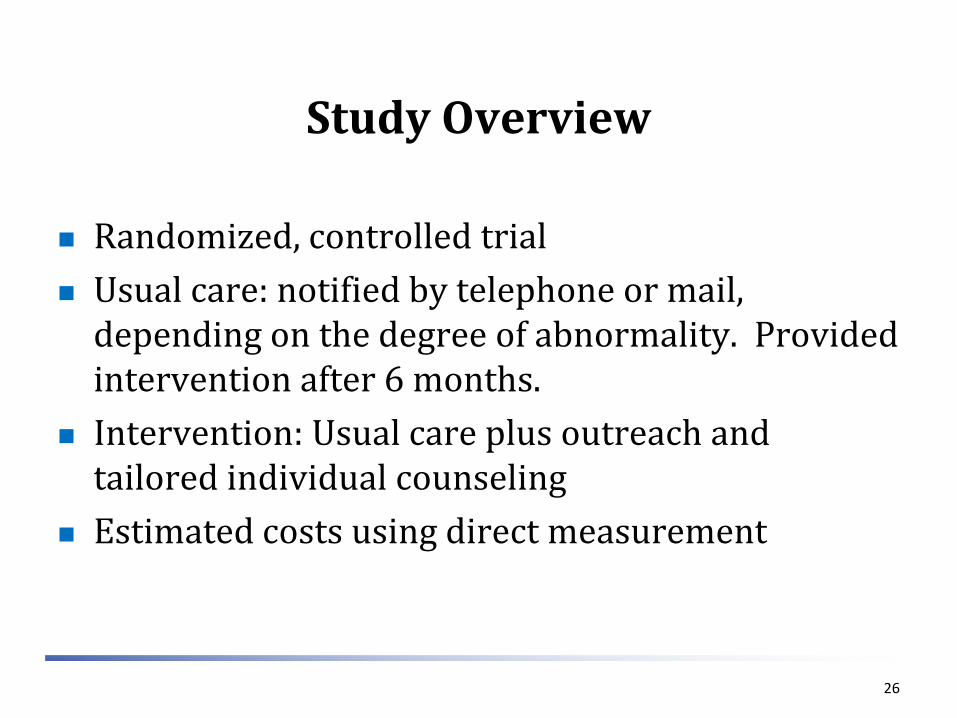
Study Overview
Randomized, controlled trial Usual care: notified by telephone or mail,
depending on the degree of abnormality. Provided intervention after 6 months.
Intervention: Usual care plus outreach and tailored individual counseling
Estimated costs using direct measurement
26

Methods
Method 1: Sum all the intervention costs and divide by number of participants (easy)
Method 2: Estimate the cost of the intervention for each patient (hard)
If you want to ask, “was the intervention more cost-effective for subgroups?”, then you need to use method 2?
27

Unit Costs2002 dollars
Intervention(n=178)
Usual care (n=170)
Outreach worker costs $142 $0
Travel costs at $.365 per mile $4 $0
Office space and supplies $28 $0
Outreach worker quality assurance $19 $0
Usual care $1 $1.00
Subtotal $47 $0
Patient Travel Costs for Follow-up $19 $9.9
Total unit cost from societal perspective $214 $10.9
Cost to add intervention from provider perspective $194 $0
28

EffectivenessAbnormal Pap Follow-up at Highland Hospital
non-OB Patients
0%
10%
20%
30%
40%
50%
60%
70%
80%
90%
100%
1 2 3 4 5 6 7 8 9 10 11 12 > 12
Months since Initial Pap
Cum
ulat
ive
% F
ollo
wed
Up
Intervention Control

Cost per follow-up
30
CostIncremental
costProbability of follow-up
Incremental follow-up
Incremental costper follow-up
OverallControl $77 0.32Intervention $355 $278 0.61 0.29 $959 Bootstrapped 95% CI (787-1367)
By severityASCUS/AGUS $75 0.32
$347 $272 0.57 0.25 $1,090LGSIL $74 0.30 (813-1658)
$374 $300 0.64 0.34 $882HGSIL $105 0.43 (579-4584)
$405 $300 0.87 0.44 $681(486-1989)