Embed Size (px)
Citation preview
WORK ING PAPER S ER I E SNO. 356 / MAY 2004
DEVELOPING A EURO AREA ACCOUNTING MATRIX: ISSUES AND APPLICATIONS
by Tjeerd Jellema,Steven Keuning, Peter McAdam and Reimund Mink
In 2004 all publications
will carry a motif taken
from the €100 banknote.
WORK ING PAPER S ER I E SNO. 356 / MAY 2004
DEVELOPING A EURO AREA
ACCOUNTINGMATRIX: ISSUES
AND APPLICATIONS 1
by Tjeerd Jellema 2,Steven Keuning 3, Peter McAdam 4
and Reimund Mink 5
1 Without implicating, we thank Dieter Gerdesmeier, Celestino Gíron, Jérôme Henry, Linda Kezbere, Kalle Siljander and, especially,two anonymous ECB working paper referees and the Editorial Board as well as seminar participants at a conference in honour
of Erik Thorbecke at Cornell University, October 2003 for their valuable contributions.The views expressed in thispaper are not necessarily those of the ECB.
2 DG Statistics, European Central Bank, Kaiserstrasse 29, D-60311, Frankfurt am Main, Germany.3 DG Statistics, European Central Bank, Kaiserstrasse 29, D-60311, Frankfurt am Main, Germany.4 DG Research, European Central Bank, Kaiserstrasse 29, D-60311, Frankfurt am Main, Germany.5 DG Statistics, European Central Bank, Kaiserstrasse 29, D-60311, Frankfurt am Main, Germany.
This paper can be downloaded without charge from http://www.ecb.int or from the Social Science Research Network
electronic library at http://ssrn.com/abstract_id=533025.
© European Central Bank, 2004
AddressKaiserstrasse 2960311 Frankfurt am Main, Germany
Postal addressPostfach 16 03 1960066 Frankfurt am Main, Germany
Telephone+49 69 1344 0
Internethttp://www.ecb.int
Fax+49 69 1344 6000
Telex411 144 ecb d
All rights reserved.
Reproduction for educational and non-commercial purposes is permitted providedthat the source is acknowledged.
The views expressed in this paper do notnecessarily reflect those of the EuropeanCentral Bank.
The statement of purpose for the ECBWorking Paper Series is available from theECB website, http://www.ecb.int.
ISSN 1561-0810 (print)ISSN 1725-2806 (online)
3ECB
Work ing Paper Ser ie s No . 356May 2004
CONTENT S
Abstract 4
Non-technical summary 5
1. Introduction 6
2. The EAAM: uses and methodological aspects 7
2.1 Potential uses of euro area accounting matrices 7
2.2 Specific methodological issues whencompiling a multi-countryaccounting matrix 9
3. An EAAM for 1999 11
3.1 Overall structure of the EAAM 11
3.2 Detailed EAAM 15
3.2.1 Supply and use of goods andservices 15
3.2.2 Allocation of primary incomeaccounts 17
3.2.3 Secondary distribution of incomeand use of income 18
3.2.4 The accumulation account due totransactions 19
3.2.5 Discrepancies 20
4. Conclusions 21
References 23
Annex 1: EAAM detailed table 24
Annex 2: EAAM classifications 27
Annex 3: Statistical sources to compilethe EAAM 32
Annex 4: EAAM compilation 37
European Central Bank working paper series 50
Abstract: An important part of external or policy shocks is transmitted throughout
the economy via various channels of transactions. To analyse such channels and to
predict the impact of shocks, it is expedient to know who recently exchanged what
with whom and for what purpose. The most appropriate format for presenting inter-
sectoral linkages at the national level is in a National Accounting Matrix (NAM). A
NAM is defined as the presentation of a sequence of integrated accounts and
balancing items in a matrix that elaborates the linkages between a supply and use
table and institutional sector accounts. This paper compiles the first pilot Euro Area
Accounting Matrix (EAAM) and considers its usefulness for the euro area’s
economic analysis. It also reports on the solution of a number of aggregation and
consolidation issues that arise when constructing a multi-country accounting matrix.
Keywords: National Accounts, National Accounting Matrix, Euro Area.
JEL classification: E00, E19.
4ECBWork ing Paper Ser ie s No . 356May 2004
Non Technical Summary
An important part of external or policy shocks is transmitted throughout the economy via various
channels of transactions. In order to analyse such channels and to predict the impact of shocks, it
is expedient to know who recently exchanged what with whom and for what purpose. The most
appropriate format for presenting inter-sectoral linkages at the national level is in a matrix
presentation of the system of national accounts.
The European System of Accounts (ESA) 1995 (Eurostat, 1996) puts this as follows: “A matrix
presentation permits each transaction to be represented by a single entry and the nature of the
transaction to be inferred from its position. Each account is represented by a row and column pair
and the convention is followed that resources are shown in the rows and uses are shown in the
columns.” In each account, the row total (total incomings) is then by definition equal to the
column total (total outgoings) and each cell describes how much the ‘sector’ in the corresponding
row received from the ‘sector’ in the corresponding column on the account concerned. A National
Accounting Matrix (NAM) is defined as the presentation of a sequence of national accounts and
balancing items in a matrix which elaborates the linkages between a supply and use table and
institutional sector accounts.
A very useful option of such a presentation of the accounts in a matrix is that different types of
actors and groupings thereof can be selected in each account, without giving up the coherence
and integration of the complete accounting system. Another advantage of a matrix format is that
it is suitable for mathematical treatment using matrix algebra, which is in turn quite expedient for
its use in all kinds of analyses and when balancing the accounts.
This paper serves to familiarise readers with the concepts and conventions of a NAM so that they
are able to better appreciate the value added such a statistic tool might offer. Secondly, it presents
a first, pilot Euro Area Accounting Matrix (EAAM) and considers its usefulness for the euro
area’s economic and policy analysis. It also reports on the solution of a number of aggregation
and consolidation issues that arise when constructing a multi-country accounting matrix. Finally,
the paper serves to stimulate discussion and to initiate further work, because only if EAAMs are
compiled with a sufficiently high frequency and with an acceptable delay, they can significantly
contribute to the understanding of the euro area economy.
5ECB
Work ing Paper Ser ie s No . 356May 2004
1. INTRODUCTION
An important part of external or policy shocks is transmitted throughout the economy via various
channels of transactions. In order to analyse such channels and to predict the impact of shocks, it
is expedient to know who recently exchanged what with whom and for what purpose. At the
macroeconomic level, such an analysis obviously requires considerable aggregation. For that
reason, the national accounts are often taken as a starting point. However, whereas conventional
national accounts contain much information on production, income, expenditure and financial
transactions, they are less well developed when it comes to the inter-sectoral linkages, or, in other
words, they lack “from-whom-to-whom” accounts. In view of the intricate relationship between
financial and non-financial transactions, the inter-sectoral linkages should ideally be shown in
both the financial and the non-financial accounts.
The most expedient format for presenting inter-sectoral linkages is in a matrix. The European
System of Accounts (ESA) 1995 (Eurostat, 1996) puts this as follows: “A matrix presentation
permits each transaction to be represented by a single entry and the nature of the transaction to be
inferred from its position. Each account is represented by a row and column pair and the
convention is followed that resources are shown in the rows and uses are shown in the columns.”
In each account, the row total (total incomings) is then by definition equal to the column total
(total outgoings) and each cell describes how much the ‘sector’ in the corresponding row received
from the ‘sector’ in the corresponding column on the account concerned.
National Accounting Matrices (NAM) are defined as the presentation of a sequence of national
accounts and balancing items in a matrix which elaborates the linkages between a supply and use
table and institutional sector accounts.1 A very useful option of such a presentation of the
accounts in a matrix is that different types of actors and groupings thereof can be selected in each
account, without giving up the coherence and integration of the complete accounting system. In
other words, in each account a unit (e.g. institutional units, kind-of-activity units, products,
financial assets) and a classification of units (e.g. sectors, industries, product groups, financial
asset categories) can be selected that are most relevant to the kind of transactions that are depicted
in that account (income distribution, production, supply and use of goods and services, financial
transactions, etc.). Thus it is not necessary to distinguish a certain subsector in all accounts just
because one would like to distinguish this subsector in some accounts. A case in point is the
financial corporations sector that should be broken down by subsector in the primary distribution
of income and the financial transactions, but can be consolidated in e.g. the secondary distribution
of income account. Another advantage of a matrix format is its suitability for mathematical
treatment using matrix algebra, which is in turn quite expedient for its use in all kinds of analyses
and when balancing the accounts.2
This paper considers the usefulness of such a NAM in the framework of the ECB’s monetary
policy analysis. Obviously, that requires a euro area instead of a national perspective, which poses
particular statistical challenges (e.g. on the split of national balance of payments data into intra-
and extra-euro area transactions so that a euro area rest-of-the-world account can be compiled,
1Cf. Chapter XX (Social Accounting Matrices) of the 1993 System of National Accounts (SNA 93), p.461ff. (United
Nations et al., 1993).
2See Keuning (1996, 1997) for a more elaborate discussion of the advantages of a matrix presentation and of the
estimation of such a matrix in both current and constant prices.
6ECBWork ing Paper Ser ie s No . 356May 2004
and on the elimination of asymmetries in the bilateral trade statistics) – henceforth, we will speak
about a euro area accounting matrix (EAAM). The EAAM has been designed in such a way that it
complies with the requirements centred on what is called the monetary transmission mechanism
(MTM): how does the ECB’s monetary policy affect the euro area economy; through what
channels does policy operate? Monetary policy is transmitted from the “monetary” part of the
economy to the “real” part. This view leads to concentrate on the relative importance of the
various links between these two parts. This follows earlier work in this area by Thorbecke et al.
(1992).
The rest of this paper is organised as follows. Section 2 reviews the potential uses and the specific
methodological issues raised by the construction of the multi-country EAAM. Section 3 presents
a first pilot version of an annual EAAM and also a detailed description of the transactions in order
to guide the reader through the matrix presentation of the accounts. Section 4 concludes.3 The
detailed EAAM, the classifications selected, the data sources used and more details on the
compilation method of the EAAM are presented in four Annexes at the end of this paper.
2. THE EAAM: USES AND METHODOLOGICAL ASPECTS.
The traditional rationale for the compilation of National and Social Accounting Matrices lies with
long-run structural issues such as income distribution, tax reform, welfare analysis, etc. (e.g.,
Thorbecke et al. 1992). Nevertheless, the widespread use of integrated systems of financial or
flow-of-funds accounts in central banks (e.g., McIntosh et al., 1999) suggests that the approach
also has an added value for such policy institutions. In this section, we discuss such issues: first
their potential uses (section 2.1) and then methodological and data-related issues which arise from
such usage (section 2.2).
2.1 Potential uses of Euro Area Accounting Matrices
The main merit of an EAAM is that it can help to understand the structure of the economy,
including the financial transactions, and its development over time (provided that a time-series of
such matrices is available). This may provide useful, for instance, to gain more insight into
(changes of) the monetary transmission mechanism at work in the euro area. Second, an EAAM
provides a consistent accounting framework that can be used in the calibration of general
equilibrium models. Third, a time-series of EAAMs can be used for more elaborate empirical
studies on relationships between sectors of the euro area economy.4
In a complex and data-demanding environment, EAAMs provide a consistent and coherent
statistical framework for both the real and the financial side of the economy.5 As such, they offer
the user a single, macro-economic accounting framework with harmonised statistical concepts
and the most “appropriate” level of classification of economic sectors, financial assets, and the
like. Among other uses, this is well suited to the ECB’s monetary policy strategy, which puts
3A further development of this NAM into a Social Accounting Matrix (SAM) may further enhance the monetary policy
analysis, particularly through its additional data on employment and wage rates by type of labour.
4Please note that a country breakdown can be inserted in (some accounts of) the EAAM, if and when relevant for the
analysis. This then follows the general rule in EAAMs, namely that in each account a breakdown is adopted that is
most relevant for the economic processes that are described in this account.
5Obviously, this advantage applies to an integrated set of financial and non-financial national accounts more generally,
albeit that a matrix integrates the so-called supply and use tables and sector accounts in a single presentation format, a
matrix allows for a more flexible selection of the most suitable classification in each account and allows for a more in-
depth analysis of inter-sectoral linkages, e.g. spill-over effects of external or policy shocks.
7ECB
Work ing Paper Ser ie s No . 356May 2004
emphasis on monitoring a wide range of economic indicators.6 Providing that EAAMs become
available at a sufficiently high, i.e. quarterly, frequency, and with an acceptable delay of one
quarter, say, it may allow a crosscheck of these indicators.
To give an example, central banks are clearly interested in the process by which monetary policy
affects prices and output in the economy – i.e., the “Monetary Transmission Mechanism” (MTM).
There are a number of (not necessarily competing) views on the transmission process.7 A more
in-depth empirical analysis of these views has been hampered by lack of sufficient data in three
respects. First, how do consumers and firms reallocate their portfolio asset or leverage ratios in
response to monetary policy changes (i.e. wealth composition effects); second, how sensitive are
different parts of the economy to monetary policy changes (i.e. distributional effects); and finally,
how can the validity of the various alternative MTM theories be tested. Without claiming that
accounting matrices are the panacea to resolving such uncertainties or uniquely delineate the
channels of importance for monetary policy, the “from-whom-to-whom” features that are an
essential ingredient of accounting matrices clearly facilitate an analysis of the interrelations in the
economy, including the various channels of the monetary transmission.
Furthermore, all economic models require an explicit accounting framework. That is to say, they
must fashion the data around a structure which has economic meaning. Obviously, this also
requires categorising and classifying the data according to various types: e.g. factors of
production (labour and capital), institutions (households, corporations and the government), and
types of transactions (between residents or between residents and non-residents). Providing such
an accounting framework also has implications for the type of data that must be collected and
their degree of disaggregation. The accounting framework then provides the basis for the
subsequent modelling assumptions, including the choice which variables are considered as
exogenous (e.g. tax rates, certain cross-border capital transactions) and which as endogenous.
This, in turn, illustrates one of the key benefits of the accounting matrix framework for modelling
purposes. The EAAM, notably in view of its from-whom-to-whom circulatory construction of
transactions, can provide a consistent statistical skeleton for macro-economic forecasting or
computable general equilibrium (CGE) models that incorporate both the financial and the non-
financial side of the economy, and their interrelationships. By contrast, it is not uncommon for
macro-econometric models to imperfectly models flows between different agents – this can be
expressed in trade volumes not adding up, incomplete circular flows of incomes between private
agents and the government sector, etc (see the discussion in e.g. Whitely, 1994).
Another aspect is that accounting matrices are often used to calibrate both the baseline and certain
parameter values of CGE models. Examples of such calibrated parameters include marginal
propensities to consume various goods, tax elasticities, and share and technology parameters of
the production process. Notably, this presupposes that the baseline values of the accounting
matrix represent a “normal” year. Whereas CGE- or macro-models additionally embody a number
of behavioural and other model specifications (e.g., uncovered interest parity, households and
firms’ optimisation, adjustment costs and other frictions, policy rules, etc.) as well as more
dynamic features, the underlying accounting matrix fixes the various channels of interest in the
economy and the related taxonomies. Such factors – e.g., accounting structure and calibration –
are discussed in Thorbecke (1985, 2000).
Of course, all tools involve trade-offs. Possible disadvantages of EAAMs are that they may
require additional data collection on the counterparts of transactions, some (limited) additional
data compilation efforts and some calibration to achieve consistency.8 For the time being, euro
6See ECB (2003).
7These various explanations and their associated literature are extensively discussed in McAdam and Morgan (2003).
8More actual data are available on the counterparts of transactions than is commonly assumed. For instance, the
counterpart sector of government transactions can often be inferred from the nature of the transaction (e.g. the type of
tax) and the same applies to many financial and concomitant property income transactions (e.g. conducting mortgage
loans and paying interest on them). On the other hand, some degree of estimation based on assumptions may be
indispensable for smaller items, like ‘other transfers’.
8ECBWork ing Paper Ser ie s No . 356May 2004
area countries do not compile NAMs on a regular basis, let alone every quarter.9 A direct
compilation at the euro area level may be more efficient, but would still require sufficient basic
data, particularly for the most important Member States. Moreover, compiling a multi-country
accounting matrix entails some particular methodological complexities. These are spelled out in
the next section.
2.2 Specific Methodological Issues when Compiling a Multi-country Accounting Matrix
In principle a NAM incorporates several semi-integrated accounting systems at the national
level10
. These are: the Supply and Use Table (SUT), the non-financial sector accounts, the
financial accounts or a flow-of-funds matrix, and the balance sheets. The latter three parts
together are also labelled the Integrated Economic Accounts (IEA)11
. A SUT provides a detailed
presentation of the supply and use of goods and services by production activities. The supply of
goods and services consists of the output by domestic production activities and imports, and the
use of goods and services consists of the intermediate consumption by production activities and
the final use categories: final consumption, capital formation and exports. The IEA on the other
hand provides an overview of all economic transactions by institutional sector, as well as other
changes and opening and closing balance sheets for non-financial and financial assets and
liabilities.12
In the NAM groups of transactions are shown by institutional sector of origin
(outgoings) and by institutional sector of destination (incomings). The challenge in the
construction of a NAM for a single country is the development of a series of transaction matrices
that are consistent with the data contained in the IEA. Conceptually, this adds a full dimension
(that of the counterpart institutional sector) to the IEA integration framework. At present, only
a few countries already compile transaction matrices as an integral part of the compilation of the
IEA. The construction of an accounting matrix for a multi-country area such as the euro area
poses additional methodological challenges. A multi-country area must be described as a single
economy, with a single economic boundary distinguishing between domestic transactions and
those with the rest of the world. As a consequence, when building up an EAAM from NAMs for
the Member States, all transactions occurring between economic agents of the different Member
States should no longer be treated as transactions between a national sector with an unspecified
Rest of the World, but as domestic transactions between specific counterpart sectors in the multi-
country area. A multi-country accounting matrix is therefore not equal to the sum of the NAMs of
the constituent countries.
The first step when deriving an EAAM from a set of national accounts for Member States is that
the national ROW accounts must be subdivided into cross-border transactions within the euro
area (the so-called intra transactions) and cross-border transactions outside the euro area (the so-
called extra transactions). As said before, the intra euro area transactions should then be reflected
as transactions between residents in the various transaction matrices of the EAAM.
To date, the compilation of the euro area ROW is a challenge because national SUT and IEA
statistics do not always provide a geographical breakdown between intra- and extra-euro area
9The Netherlands is the main exception, with an annual compilation frequency. See Leadership group SAM (2002) for
national pilot studies for Belgium, Finland, Greece, Italy, the Netherlands, Portugal and the United Kingdom.
10For a description of the relationship between SNA93 and the NAM, see SNA93 Chapter XX, or Keuning (1991).
11For a description of Supply and Use Tables see SNA 93, Chapter 15, Table 15.1. For a detailed description of the
Integrated Economic Accounts (IEA), refer SNA93 chapters 6 through to 14, and Annex V, Part 2. In ESA95 the
corresponding references with regards to Supply and Use tables are chapter 9, tables 9.5 and 9.6. The Integrated
Economic Accounts are discussed in ESA95 chapters 3 to 5, and the detailed IEA tables are presented in Annex IV,
Accounts.
12Conceptually the non-financial (flow) accounts and the financial flow accounts yield identical balances by
institutional sector (net lending). In practice, though, this is not achieved in all (euro area) countries.
9ECB
Work ing Paper Ser ie s No . 356May 2004

transactions. Additional data (e.g. the balance of payments) need to be integrated to obtain the
desired geographical split. Unfortunately, the ROW account and the balance of payments do not
always match at the national level.
However, even if the required intra- and extra- euro area breakdowns were readily available in all
national data sets, their summation at the level of the euro area as a whole would reveal that total
uses of certain intra-euro area flows do not equal the corresponding intra euro area resources.
Such ‘asymmetries’ on the intra-euro area ROW account arise because of different recording of
transactions by Member States.13
The elimination of these asymmetries implies that adjustments
are made at the level of the euro area, either to the domestic flows or to the extra euro area flows.
In any case, these asymmetries must be eliminated before the intra flows can be removed from the
ROW account and before they can be reflected as flows between domestic institutions in the
relevant transaction matrices. For that reason, it would be ideal to dispose of intra euro area
transaction data classified by country of origin and country of destination. Data at this level of
detail conceptually allows for a matrix presentation that distinguishes between Member Countries
as well as institutional sectors in relevant parts of the EAAM. It would enable a distinction of
transactions between the different institutional sectors located in different Member States.
In practice this level of detail is not available in source data and estimation methods must be used
to compute transaction matrices that describe both the domestic flows between institutions as well
as the intra–euro area flows between institutional sectors. The compilation of an EAAM is further
complicated because integrated SUT and IEA are not yet available in all euro area member
countries. At present, ten (out of twelve) Member States produce annual non-financial sector
accounts, while nine countries produce annual financial accounts. Likewise, only eight Member
States produce SUT tables. Only one Member State currently produces transaction matrices as
part of its regular statistical output. The timeliness of the production of these accounts is another
concern. For instance the transmission deadline for annual SUT tables is three years, whereas the
annual non-financial institutional accounts are made available after one year, and the annual
financial accounts are available after nine months.
Another issue is that international organisations that are located in a given country are not
considered to be resident in that country (SNA 1993). However, if the multi-country area includes
all Member States of the international organisation concerned, corresponding international
organisations should arguably be treated as resident in the multi-country area. In the case of the
euro area, this concerns the ECB, whereas in the case of the European Union (EU) this extends to
all other EU institutions. Therefore a complete set of accounts must be compiled for such
international organisations, to be aggregated with the sets of accounts describing the Member
States.
The production of high frequency EAAMs will depend on the availability of quarterly non-
financial and financial sector accounts as well as on the ‘quarterisation’ of euro area annual SUT
frameworks using available quarterly indicators. Currently much work is ongoing in the
development of quarterly non-financial sector accounts for the euro area, in accordance with the
priorities for EMU statistics as set by the Ecofin Council A sub-set of financial accounts for the
euro area, the Table on Financing and Investment (TFI), is already published by the ECB in its
Monthly Bulletin14
. Work is in progress to extend the coverage of the TFI to all sectors and
financial instruments.
3 An EAAM for 1999
This section presents a rather aggregate EAAM for 1999. It incorporates annual data for
transactions as shown in the SUT and in the production, income and accumulation (capital and
13Important asymmetries occur in the intra euro area trade statistics (Intrastat). Intra-EU exports (‘dispatches’) have
consistently grown faster than intra-EU imports (‘arrivals’).
14See ECB (2001) for an initial description of the TFI.
10ECBWork ing Paper Ser ie s No . 356May 2004
financial transaction) accounts by institutional sector. As a pilot exercise it brings together
different statistical data sources available at the ECB. They are described in Annex 2. Due to an
as yet limited data availability it was decided to opt for a rather straightforward EAAM layout,
corresponding to Table 20.4 of the 1993 SNA. To specifically accommodate the potential use of
the EAAM in the MTM analysis, the allocation of primary income account has been split into two
accounts: the ‘allocation of interest income’ account and the ‘allocation of other primary income’
account.15
This section is divided in two parts. Part one describes the overall structure of the EAAM in terms
of the sequence of accounts and of some selected balancing items.16
Part two provides more
details on the individual accounts. It also deals with specific features that are relevant to the
monetary policy framework.
3.1 Overall structure of the EAAM
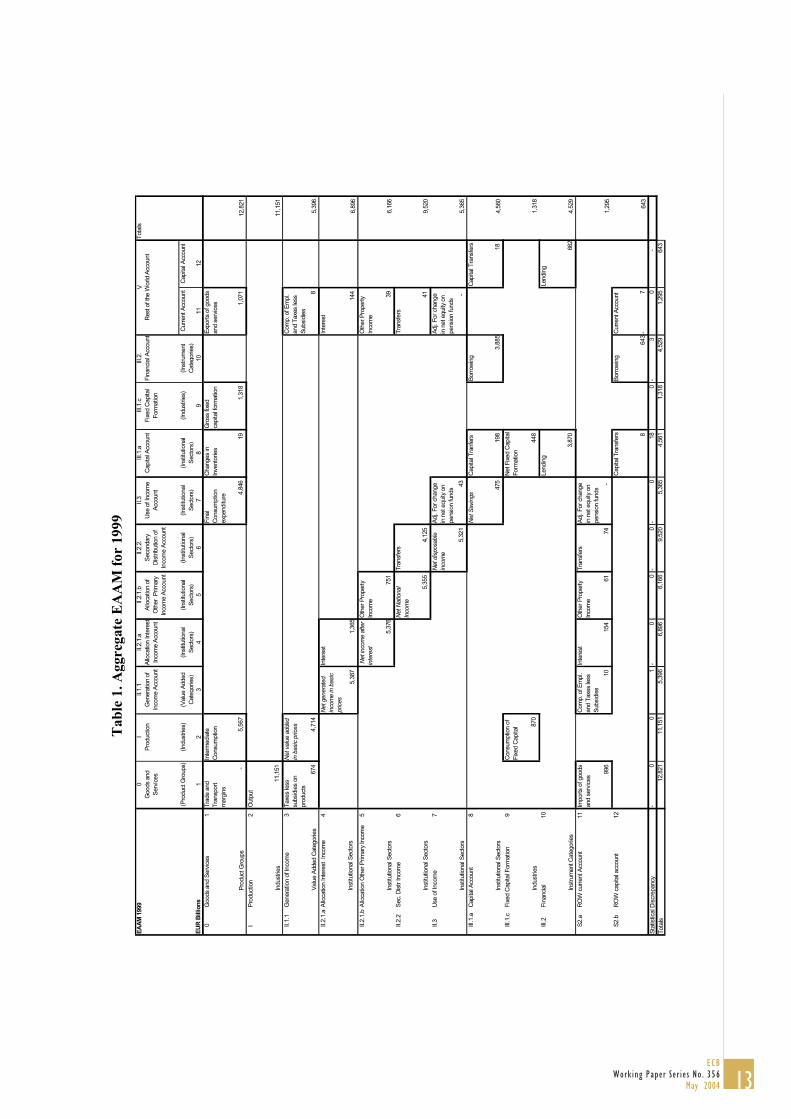
The aggregate EAAM is presented in Table 1 below. It contains 13 accounts describing the
processes of production, income generation and use, and accumulation of assets and liabilities, for
resident sectors and the rest of the world. This aggregate EAAM can be seen as a roadmap for the
more detailed tables shown in the following section. The amounts in each submatrix of the
detailed EAAM add up to a single number in a cell of Table 1.
The EAAM presents incoming transactions in the rows and outgoing transactions in the columns.
For instance the cell in row 1 and column 8 represents final consumption expenditure, which is an
incoming transactions or a resource in the goods and services account, and an outgoing
transactions or a use with respect to the institutional sectors in the use of income account.
Row 1 and column 1 contain the Goods and Services Account, and row 2 and column 2 contain
the Production Account. Together they show (in the more detailed EAAM) the production
structure of the euro area. Column 1 reveals that the total supply of goods and services is
composed of euro area production (EUR 11,151 billions; cf. row 2) and euro area imports (996
billions; cf. row 11), both recorded at basic prices. In order to adjust for the difference between
the basic prices valuation of supply and the purchasers’ prices (i.e. ‘market prices’) valuation of
demand, column 1 also contains two sets of adjustments: the adjustment for trade and transport
margins (0 in the aggregate matrix, but not in the more detailed tables; see below) as recorded in
row 1, and the adjustment for taxes on products less subsidies on products (EUR 674 billions) in
row 3. Row 1 presents the uses of goods and services: intermediate consumption (5,567) as a cost
to production activities in column 2, final consumption expenditure by households and
governments (4,846) in column 7, changes in stocks and net acquisition of valuables (19) in
column 8, gross fixed capital formation (1,318) in column 9 and exports of goods and services
(1,071) to the rest of the world (ROW) in column 11. Of course, total demand equals total supply
(EUR 12,821 billions).
Column 2 shows that the production costs of all industries equal intermediate consumption (EUR
5,567 billions), net value added (4,714; cf. row 3) and consumption of fixed capital (870; cf. row
9). The euro area GDP (EUR 6,258 billions) can be calculated by adding taxes on products less
subsidies on products (674 billions; cf. cell [3,1]) and consumption of fixed capital (870 billions;
cf. cell [10,2]) to net value added.
The Generation of Income Account in row and column 3 describes how production factors (e.g.
employees) generate income and hand it over to their institutional sectors (e.g. households). First,
in row 3 net value added generated by domestic activities is augmented by income earned outside
15See ECB (2000a) for an overview of the data that are collected by the ECB.
16See Keuning and De Ruijter (1988) and Leadership Group SAM (2002) for a more general discussion on the
structure and classifications to be used in such accounting matrices.
11ECB
Work ing Paper Ser ie s No . 356May 2004
the euro area (EUR 8 billions; cf. column 11). Then, in column 3 these incomes are paid out to
euro area institutional sectors (5,387; cf. row 4) and to the rest of the world (10 billions; cf. row
11).
12ECBWork ing Paper Ser ie s No . 356May 2004
Ta
ble
1.
Aggreg
ate
EA
AM
fo
r 1
99
9
EA
AM
1999
0I
II.1
.1II.2
.1.a
II.2
.1.b
II.2
.2.
II.3
III.1.a
III.1.c
III.2.
Tota
ls
Goods a
nd
Serv
ices
Pro
duction
Genera
tion o
f
Incom
e A
ccount
Allocation Inte
rest
Incom
e A
ccount
Allocation o
f
Oth
er
Prim
ary
Incom
e A
ccount
Secondary
Dis
trib
ution o
f
Incom
e A
ccount
Use o
f In
com
e
Account
Capital A
ccount
Fix
ed C
apital
Form
ation
Fin
ancia
l A
ccount
(Pro
duct G
roups)
(Industr
ies)
(Valu
e A
dded
Cate
gories)
(Institu
tional
Secto
rs)
(Institu
tional
Secto
rs)
(Institu
tional
Secto
rs)
(Institu
tional
Secto
rs)
(Institu
tional
Secto
rs)
(Industr
ies)
(Instr
um
ent
Cate
gories)
Curr
ent A
ccount
Capital A
ccount
EU
R B
illion
s1
23
45
67
89
10
11
12
0G
oods a
nd S
erv
ices
1T
rade a
nd
Tra
nsport
marg
ins
Inte
rmedia
te
Consum
ption
Fin
al
Consum
ption
expenditure
Changes in
Invento
ries
Gro
ss fix
ed
capital fo
rmation
Export
s o
f goods
and s
erv
ices
Pro
duct G
roups
-
5
,567
4,8
46
19
1
,318
1
,071
12,8
21
IP
roduction
2O
utp
ut
Industrie
s 1
1,1
51
11,1
51
II.1
.1G
enera
tion o
f In
com
e3
Taxes less
subsid
ies o
n
pro
ducts
Net valu
e a
dded
in b
asic
prices
Com
p. of E
mpl.
and T
axes less
Subsid
ies
Valu
e A
dded C
ate
gories
674
4
,714
8
5,3
96
II.2
.1.a
Allocation Inte
rest Incom
e4
Net genera
ted
incom
e in b
asic
prices
Inte
rest
Inte
rest
Institu
tional S
ecto
rs 5,3
87
1,3
65
1
44
6,8
96
II.2
.1.b
Allocation O
ther P
rim
ary
Incom
e5
Net in
com
e a
fter
inte
rest
Oth
er
Pro
perty
Incom
e
Oth
er
Pro
pert
y
Incom
e
Institu
tional S
ecto
rs 5
,376 751
39
6,1
66
II.2
.2S
ec. D
istr
Incom
e6
Net N
ational
Incom
e
Tra
nsfe
rsT
ransfe
rs
Institu
tional S
ecto
rs 5
,355
4
,125
41
9,5
20
II.3
Use o
f In
com
e7
Net dis
posable
incom
e
Adj. F
or
change
in n
et equity o
n
pensio
n funds
Adj. F
or
change
in n
et equity o
n
pensio
n funds
Institu
tional S
ecto
rs 5
,321
4
3
-
5,3
65
III.1.a
Capital A
ccount
8N
et S
avin
gs
Capital T
ranfe
rsB
orr
ow
ing
Capital T
ransfe
rs
Institu
tional S
ecto
rs 4
75
198
3
,885
18
4,5
60
III.1.c
Fix
ed C
apital F
orm
ation
9C
onsum
ption o
f
Fix
ed C
apital
Net F
ixed C
apital
Form
ation
Industrie
s 870
448
1,3
18
III.2
Fin
ancia
l10
Lendin
gLendin
g
Instr
um
ent C
ate
gories
3
,870
662
4,5
29
S2.a
RO
W c
urr
ent A
ccount
11
Imports o
f goods
and s
erv
ices
Com
p. of E
mpl.
and T
axes less
Subsid
ies
Inte
rest
Oth
er
Pro
perty
Incom
e
Tra
nsfe
rsA
dj. F
or
change
in n
et equity o
n
pensio
n funds
996
10
154
61
74
-
1,2
95
S2.b
RO
W c
apital account
12
Capital T
ransfe
rsB
orr
ow
ing
Curr
ent A
ccount
8
643 -
7
643
Sta
tistical D
iscre
pancy
0-
0
1
0-
0
0-
0-
18
0
3-
0
-
Tota
ls12,8
21
11,1
51
5,3
96
6,8
96
6,1
66
9,5
20
5,3
65
4,5
61
1,3
18
4,5
29
1,2
95
643
Rest of th
e W
orld A
ccount
V
13ECB
Work ing Paper Ser ie s No . 356May 2004
Accounts 4 and 5 present the allocation of primary incomes to the institutional sectors. In the EAAM, the
Allocation of Interest Income Account (#4) and the Allocation of Other Primary Income Account (#5) are
separated to emphasise the special role of interest in the transmission mechanism of monetary policy. The
allocation of interest income account precedes the allocation of other primary income account. Because
interest payments are typically contractual, accrue at a high frequency and are often established before the
other property incomes are known, it may indeed be assumed that institutions first assess the income after
interest flows before deciding/establishing the allocation of major other property incomes in the euro area,
such as dividends. Concerning rents, it may be noted that rents of dwellings, other buildings, machinery,
etc. are already settled in the production account, so that the rents as a part of ‘other property income’
only cover land rent. Assuming that land rent is settled after interest payments may not always be
appropriate, but this will thus not have a large impact in macroeconomic terms.
In row 4, the euro area institutional sectors receive the income generated by euro area production factors
(EUR 5,387 billions; cf. column 3) and the interest (1,365 billions; cf. column 4) from other euro area
sectors and from the ROW (144; cf. column 11). In column 4, these sectors hand over the interest payable
to other euro area sectors (in total: 1,365; cf. row 4) and to the ROW (154; cf. row 11). The balance of net
nationally generated income and interest (5,376) is then put on the next account, that is, on row 5.
In row 5, the allocation of primary income is completed with the allocation of the other property incomes.
The income transferred from column 4 is augmented with other property income receivable from other
euro area sectors (EUR 751 billions; cf. column 5) and from the ROW (39 billions; cf. column 11).
Likewise, in column 5 other property incomes payable are handed over to other euro area sectors (751
billions; cf. row 5) and to abroad (61; cf. row 11). The balance equals net ‘national’ income of the euro
area (EUR 5,355 billions), which is put on the secondary distribution of income account in row 6.
The Secondary Distribution of Income Account (row and column 6) contains all transfer payments
between institutional sectors. These transfer payments include taxes on income and wealth, social security
contributions and benefits, and miscellaneous current transfers. To a large extent, these flows occur
within the euro area (EUR 4,125 billions; cf. cell [6,6]), although some transfers are obtained from the
ROW (41 billions; cf. column 11) and some transfers are made to the ROW (74; cf. row 11). As usual, the
balance of the secondary distribution of income account, net ‘national’ disposable income of the euro area
(EUR 5,321 billions), is allocated to the next, Use of Income Account (cf. row 7).
From disposable income, final consumption expenditure (EUR 4,846 billions) by institutional sectors is
financed in row 1. In order to allow for changes in the net equity of private pension funds (43 billions)
that are shown as a transfer between the corporations and the household sector in the more detailed
EAAM, they are also included here, in row 7. The final balance of the current accounts, net euro area
saving (EUR 475 billions) , is allocated to the capital account (cf. row 8).
On the Capital Account (#8), net saving is augmented with capital transfers receivable from other euro
area sectors (EUR 198 billions; cf. row 8) and from the ROW (18 billions; cf. column 12) and with
liabilities incurred net, (3,885; cf. column 10). These funds are used, in the corresponding column, to
finance changes in inventories (EUR 19 billions; cf. row 1), net fixed capital formation17
(448 billions; cf.
row 9), inter-sectoral capital transfers payable to euro area sectors (198; cf. row 8) and to the ROW (8
billions; cf. row 12) and the net acquisition of financial assets (‘lending’) (EUR 3,870 billions; cf. row
10). However, this still leaves a discrepancy of EUR 32 billions between financing and investment, which
is shown, for the time being, in an additional, so-called Discrepancy Row at the bottom of the table.
The next, Fixed Capital Formation Account (#9) serves to show in the detailed EAAM which institutional
sector allocates net investment to what industry (here aggregated to cell [8,9]), which together with the
consumption of fixed capital (cell [9,2]) is then used to purchase capital goods (here aggregated to cell
[1,9]).
The Financial Transactions Account (#10) shows in the row the net acquisition of financial assets by euro
area sectors (EUR 3,870 billions; cf. column 8) and by the ROW (662 billions; cf. column 12). Column
10 then records the net incurrence of liabilities by euro area sectors (3,885; cf. row 8) and by the ROW
17In this EAAM, this item includes the acquisition of net non-produced non-financial assets.
14ECBWork ing Paper Ser ie s No . 356May 2004
(643; cf. row 12). At the aggregate level, the statistical discrepancy in this account rounds to EUR 3
billions; cf. the bottom row of the table.
The accounts 11 and 12 are the Current and Capital Accounts for the Rest of the World. The transactions
on these accounts are presented from the viewpoint of the ROW. Thus the euro area receivables are now
shown in the columns and the payables in the rows. All entries on these accounts have been described
above, except for the euro area current account balance (EUR 7 billions), which is here shown as a
negative balancing item of the ROW current account (cell [12,11]) that is put on its capital account.
Similarly, net lending of the euro area can be computed as borrowing by the ROW (EUR 643 billions,
cell [12,10]) minus lending by the ROW (662 billions, cf. cell [10,12]), that is, EUR –19 billions.
However, it should be borne in mind that in this pilot EAAM the statistical discrepancy on the ROW
capital account (analogous to the so-called errors and omissions of the balance of payments) still equals
EUR –37 billions (cf. the bottom row of the table).
The bottom row shows that the statistical discrepancies in the capital account (EUR 33 billions; cf.
column 8), the financial account (3, cf. column 10) and the ROW capital account (–37, cf. column 12)
cancel out (except for rounding errors), as must be the case by definition. Therefore, there is no need for
an additional column with statistical discrepancies.
3.2 Detailed EAAM
This section describes some key components of the detailed EAAM and also intends to follow some
transactions related to a specific sector throughout the system of accounts. The EAAM in its full detail is
shown in Table A1 annexed to this paper.
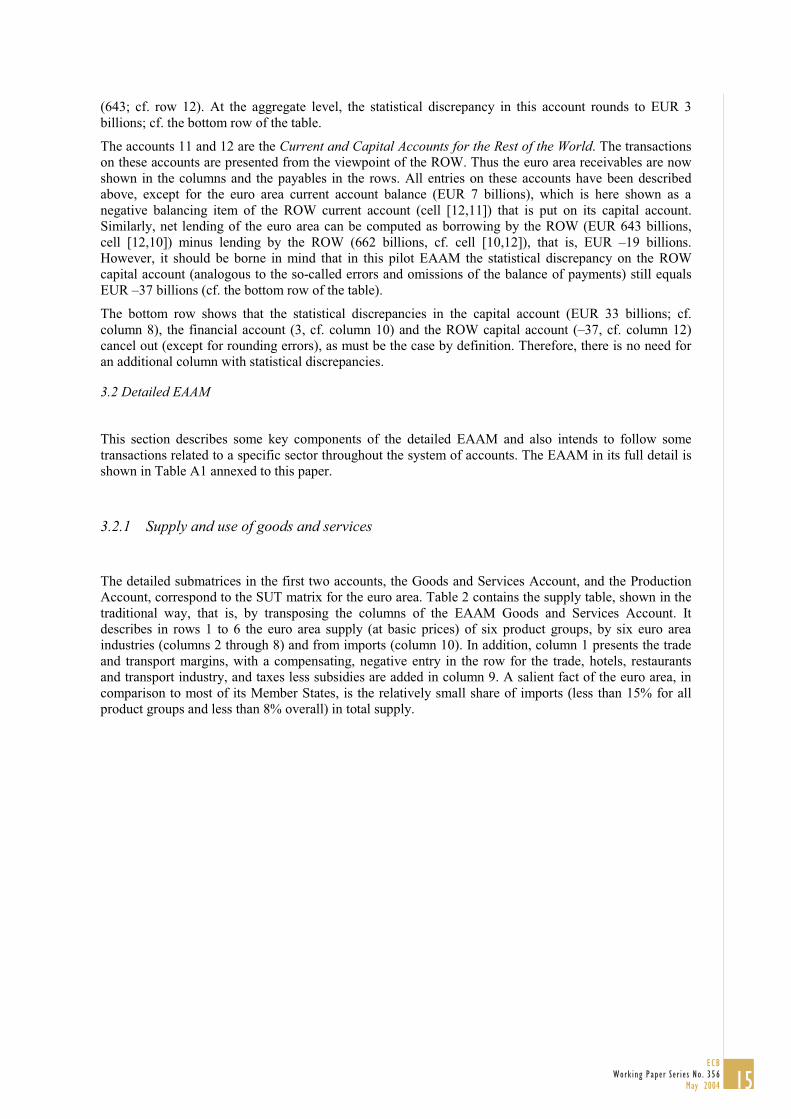
3.2.1 Supply and use of goods and services
The detailed submatrices in the first two accounts, the Goods and Services Account, and the Production
Account, correspond to the SUT matrix for the euro area. Table 2 contains the supply table, shown in the
traditional way, that is, by transposing the columns of the EAAM Goods and Services Account. It
describes in rows 1 to 6 the euro area supply (at basic prices) of six product groups, by six euro area
industries (columns 2 through 8) and from imports (column 10). In addition, column 1 presents the trade
and transport margins, with a compensating, negative entry in the row for the trade, hotels, restaurants
and transport industry, and taxes less subsidies are added in column 9. A salient fact of the euro area, in
comparison to most of its Member States, is the relatively small share of imports (less than 15% for all
product groups and less than 8% overall) in total supply.
15ECB
Work ing Paper Ser ie s No . 356May 2004
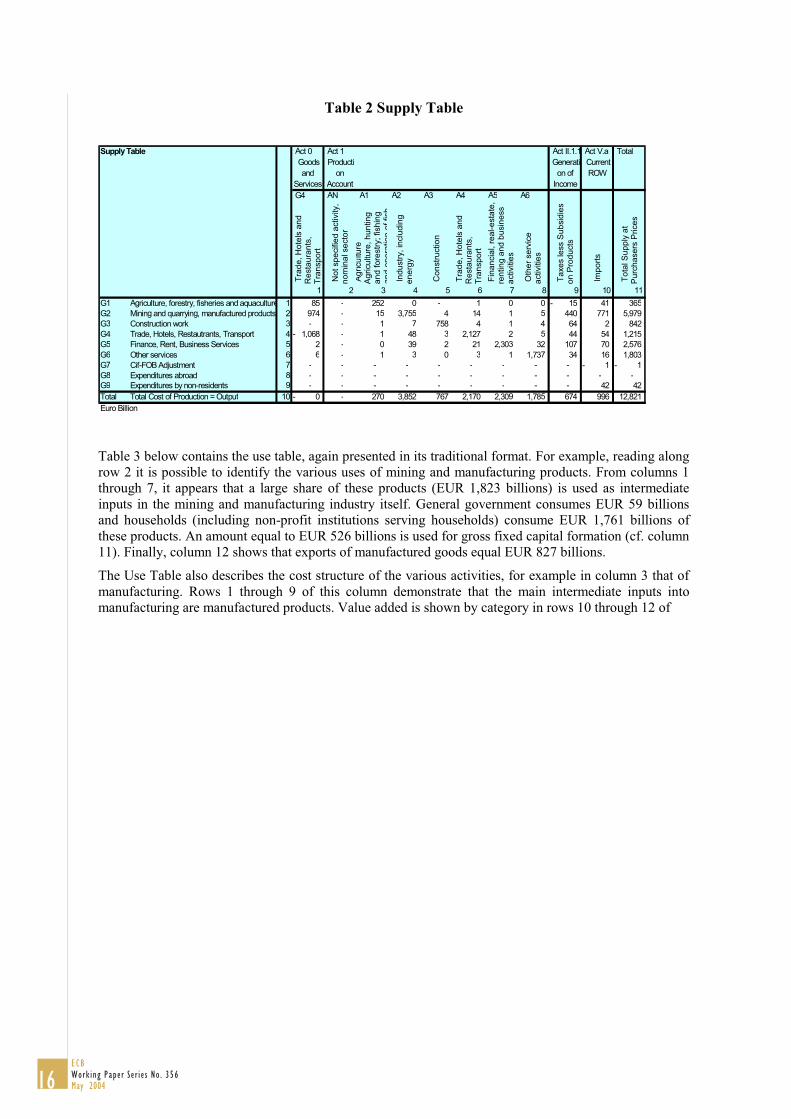
Table 2 Supply Table
Table 3 below contains the use table, again presented in its traditional format. For example, reading along
row 2 it is possible to identify the various uses of mining and manufacturing products. From columns 1
through 7, it appears that a large share of these products (EUR 1,823 billions) is used as intermediate
inputs in the mining and manufacturing industry itself. General government consumes EUR 59 billions
and households (including non-profit institutions serving households) consume EUR 1,761 billions of
these products. An amount equal to EUR 526 billions is used for gross fixed capital formation (cf. column
11). Finally, column 12 shows that exports of manufactured goods equal EUR 827 billions.
The Use Table also describes the cost structure of the various activities, for example in column 3 that of
manufacturing. Rows 1 through 9 of this column demonstrate that the main intermediate inputs into
manufacturing are manufactured products. Value added is shown by category in rows 10 through 12 of
Supply Table Act 0 Act 1 Act II.1.1 Act V.a Total
Goods
and
Services
Producti
on
Account
Generati
on of
Income
Current
ROW
G4 AN A1 A2 A3 A4 A5 A6
Tra
de
, H
ote
ls a
nd
Re
sta
ura
nts
,
Tra
nsp
ort
No
t sp
ecifie
d a
ctivity,
no
min
al se
cto
r
Ag
r icu
ltu
re
Ag
ricu
ltu
re, h
un
tin
g
an
d fo
restr
y; fish
ing
an
do
pe
ratio
no
ffish
In
du
str
y, in
clu
din
g
en
erg
y
Co
nstr
uctio
n
Tra
de
, H
ote
ls a
nd
Re
sta
ura
nts
,
Tra
nsp
ort
Fin
an
cia
l, r
ea
l-e
sta
te,
ren
tin
g a
nd
bu
sin
ess
activitie
s
Oth
er
se
rvic
e
activitie
s
Ta
xe
s le
ss S
ub
sid
ies
on
Pro
du
cts
Im
po
rts
To
tal S
up
ply
at
Pu
rch
ase
rs P
rice
s
1 2 3 4 5 6 7 8 9 10 11
G1 Agriculture, forestry, fisheries and aquaculture 1 85 - 252 0 - 1 0 0 15- 41 365
G2 Mining and quarrying, manufactured products 2 974 - 15 3,755 4 14 1 5 440 771 5,979
G3 Construction work 3 - - 1 7 758 4 1 4 64 2 842
G4 Trade, Hotels, Restautrants, Transport 4 1,068- - 1 48 3 2,127 2 5 44 54 1,215
G5 Finance, Rent, Business Services 5 2 - 0 39 2 21 2,303 32 107 70 2,576
G6 Other services 6 6 - 1 3 0 3 1 1,737 34 16 1,803
G7 Cif-FOB Adjustment 7 - - - - - - - - - 1- 1-
G8 Expenditures abroad 8 - - - - - - - - - - -
G9 Expenditures by non-residents 9 - - - - - - - - - 42 42
Total Total Cost of Production = Output 10 0- - 270 3,852 767 2,170 2,309 1,785 674 996 12,821
Euro Billion
16ECBWork ing Paper Ser ie s No . 356May 2004
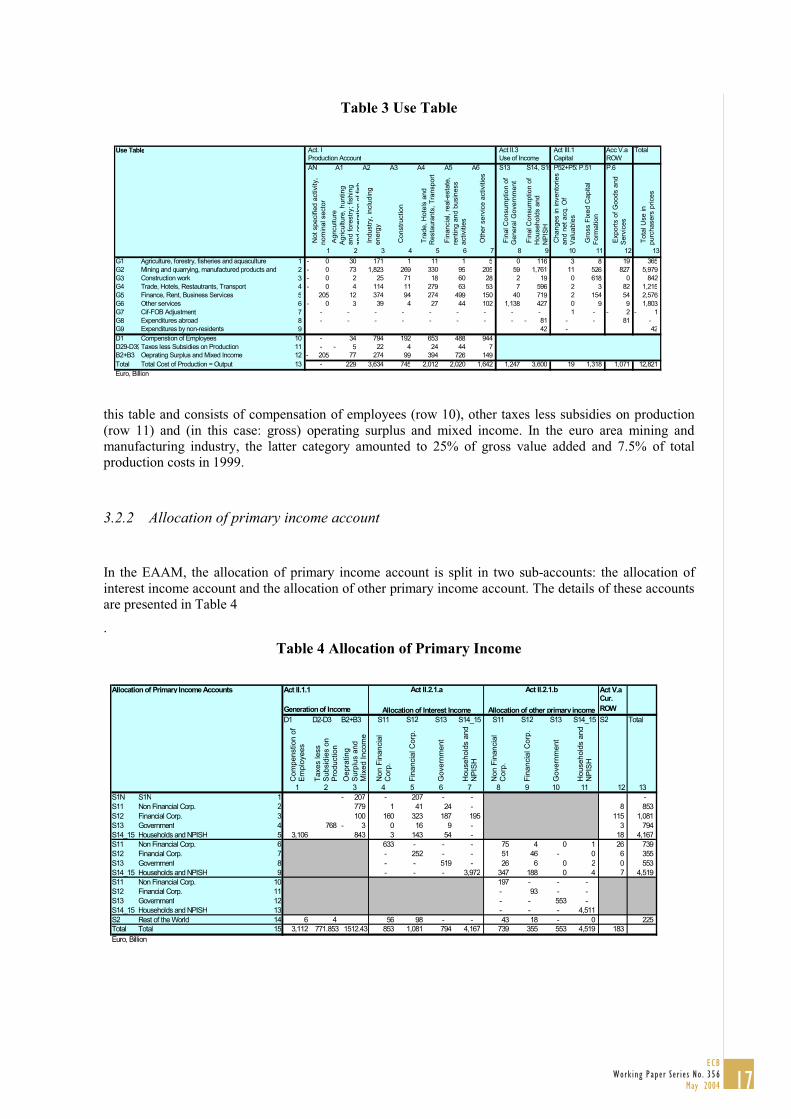
Table 3 Use Table
this table and consists of compensation of employees (row 10), other taxes less subsidies on production
(row 11) and (in this case: gross) operating surplus and mixed income. In the euro area mining and
manufacturing industry, the latter category amounted to 25% of gross value added and 7.5% of total
production costs in 1999.
3.2.2 Allocation of primary income account
In the EAAM, the allocation of primary income account is split in two sub-accounts: the allocation of
interest income account and the allocation of other primary income account. The details of these accounts
are presented in Table 4
.
Table 4 Allocation of Primary Income
Allocation of Primary Income Accounts Act II.1.1 Act V.a
Generation of Income
Cur.
ROW
D1 D2-D3 B2+B3 S11 S12 S13 S14_15 S11 S12 S13 S14_15 S2 Total
Co
mp
en
stio
n o
f
Em
plo
ye
es
Ta
xes less
Su
bsid
ies o
n
Pro
du
ctio
n
Oe
pra
tin
g
Su
rplu
s a
nd
Mix
ed
In
co
me
No
n F
ina
ncia
l
Co
rp.
Fin
an
cia
l C
orp
.
Go
ve
rnm
en
t
Ho
use
ho
lds a
nd
NP
ISH
No
n F
ina
ncia
l
Co
rp.
Fin
an
cia
l C
orp
.
Go
ve
rnm
en
t
Ho
use
ho
lds a
nd
NP
ISH
1 2 3 4 5 6 7 8 9 10 11 12 13
S1N S1N 1 207- - 207 - - -
S11 Non Financial Corp. 2 779 1 41 24 - 8 853
S12 Financial Corp. 3 100 160 323 187 195 115 1,081
S13 Government 4 768 3- 0 16 9 - 3 794
S14_15 Households and NPISH 5 3,106 843 3 143 54 - 18 4,167
S11 Non Financial Corp. 6 633 - - - 75 4 0 1 26 739
S12 Financial Corp. 7 - 252 - - 51 46 - 0 6 355
S13 Government 8 - - 519 - 26 6 0 2 0 553
S14_15 Households and NPISH 9 - - - 3,972 347 188 0 4 7 4,519
S11 Non Financial Corp. 10 197 - - -
S12 Financial Corp. 11 - 93 - -
S13 Government 12 - - 553 -
S14_15 Households and NPISH 13 - - - 4,511
S2 Rest of the World 14 6 4 56 98 - - 43 18 - 0 225
Total Total 15 3,112 771.853 1512.43 853 1,081 794 4,167 739 355 553 4,519 183
Euro, Billion
Act II.2.1.a
Allocation of Interest Income
Act II.2.1.b
Allocation of other primary income
Use Table Act. I Act II.3 Act III.1 Acc V.a Total
Production Account Use of Income Capital ROW
AN A1 A2 A3 A4 A5 A6 S13 S14, S15 P52+P53P.51 P.6
Not
specifie
d a
ctivity,
nom
inal secto
r
Agriculture
Agriculture
, hunting
and f
ore
str
y;
fishin
g
and
opera
tion
of
fish
Industr
y,
inclu
din
g
energ
y
Constr
uction
Tra
de,
Hote
ls a
nd
Resta
ura
nts
, T
ransport
Fin
ancia
l, r
eal-esta
te,
renting a
nd b
usin
ess
activitie
s
Oth
er
serv
ice a
ctivitie
s
Fin
al C
onsum
ption o
f
Genera
l G
overn
ment
Fin
al C
onsum
ption o
f
Household
s a
nd
NP
ISH
Changes in invento
ries
and n
et
acq.
Of
Valu
able
s
Gro
ss F
ixed C
apital
Form
ation
Export
s o
f G
oods a
nd
Serv
ices
Tota
l U
se in
purc
hasers
prices
1 2 3 4 5 6 7 8 9 10 11 12 13
G1 Agriculture, forestry, fisheries and aquaculture 1 0- 30 171 1 11 1 5 0 116 3 8 19 365
G2 Mining and quarrying, manufactured products and 2 0- 73 1,823 269 330 95 205 59 1,761 11 526 827 5,979
G3 Construction work 3 0- 2 25 71 18 60 28 2 19 0 618 0 842
G4 Trade, Hotels, Restautrants, Transport 4 0- 4 114 11 279 63 53 7 596 2 3 82 1,215
G5 Finance, Rent, Business Services 5 205 12 374 94 274 499 150 40 719 2 154 54 2,576
G6 Other services 6 0- 3 39 4 27 44 102 1,138 427 0 9 9 1,803
G7 Cif-FOB Adjustment 7 - - - - - - - - - 1 - 2- 1-
G8 Expenditures abroad 8 - - - - - - - - 81- - - 81 -
G9 Expenditures by non-residents 9 42 - 42
D1 Compenstion of Employees 10 - 34 794 192 653 488 944
D29-D39Taxes less Subsidies on Production 11 - 5- 22 4 24 44 7
B2+B3 Oeprating Surplus and Mixed Income 12 205- 77 274 99 394 726 149
Total Total Cost of Production = Output 13 - 229 3,634 745 2,012 2,020 1,642 1,247 3,600 19 1,318 1,071 12,821
Euro, Billion
17ECB
Work ing Paper Ser ie s No . 356May 2004
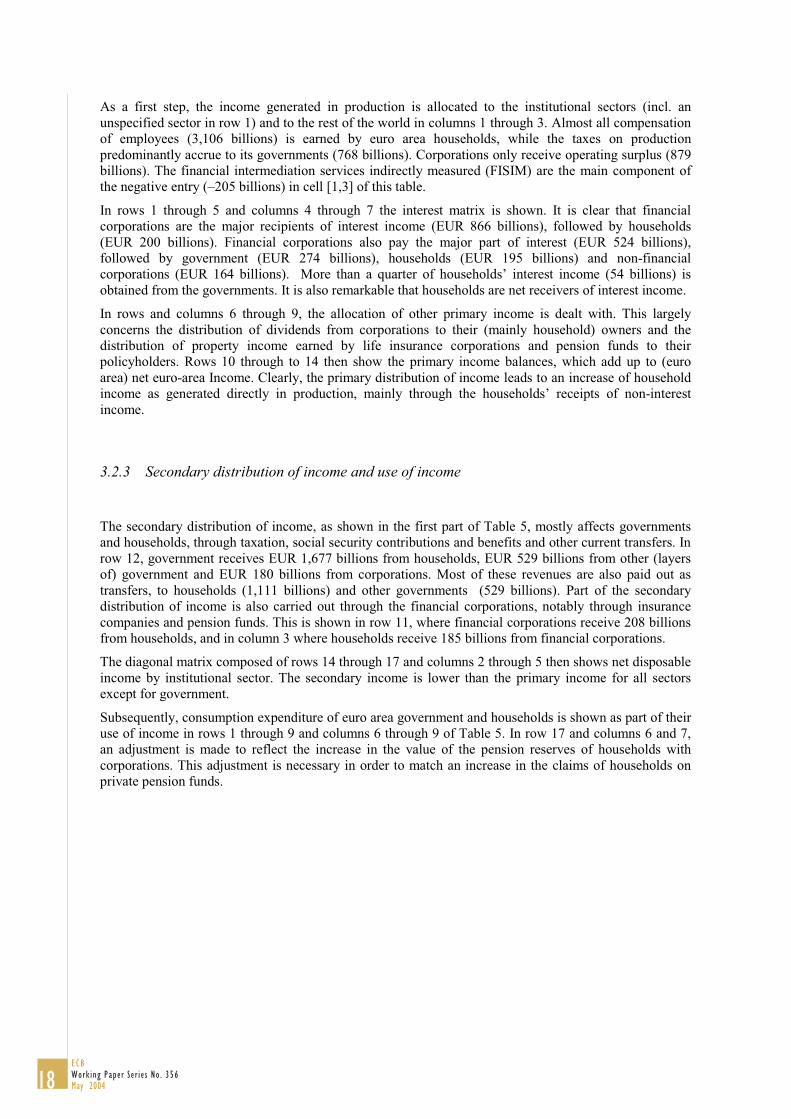
As a first step, the income generated in production is allocated to the institutional sectors (incl. an
unspecified sector in row 1) and to the rest of the world in columns 1 through 3. Almost all compensation
of employees (3,106 billions) is earned by euro area households, while the taxes on production
predominantly accrue to its governments (768 billions). Corporations only receive operating surplus (879
billions). The financial intermediation services indirectly measured (FISIM) are the main component of
the negative entry (–205 billions) in cell [1,3] of this table.
In rows 1 through 5 and columns 4 through 7 the interest matrix is shown. It is clear that financial
corporations are the major recipients of interest income (EUR 866 billions), followed by households
(EUR 200 billions). Financial corporations also pay the major part of interest (EUR 524 billions),
followed by government (EUR 274 billions), households (EUR 195 billions) and non-financial
corporations (EUR 164 billions). More than a quarter of households’ interest income (54 billions) is
obtained from the governments. It is also remarkable that households are net receivers of interest income.
In rows and columns 6 through 9, the allocation of other primary income is dealt with. This largely
concerns the distribution of dividends from corporations to their (mainly household) owners and the
distribution of property income earned by life insurance corporations and pension funds to their
policyholders. Rows 10 through to 14 then show the primary income balances, which add up to (euro
area) net euro-area Income. Clearly, the primary distribution of income leads to an increase of household
income as generated directly in production, mainly through the households’ receipts of non-interest
income.
3.2.3 Secondary distribution of income and use of income
The secondary distribution of income, as shown in the first part of Table 5, mostly affects governments
and households, through taxation, social security contributions and benefits and other current transfers. In
row 12, government receives EUR 1,677 billions from households, EUR 529 billions from other (layers
of) government and EUR 180 billions from corporations. Most of these revenues are also paid out as
transfers, to households (1,111 billions) and other governments (529 billions). Part of the secondary
distribution of income is also carried out through the financial corporations, notably through insurance
companies and pension funds. This is shown in row 11, where financial corporations receive 208 billions
from households, and in column 3 where households receive 185 billions from financial corporations.
The diagonal matrix composed of rows 14 through 17 and columns 2 through 5 then shows net disposable
income by institutional sector. The secondary income is lower than the primary income for all sectors
except for government.
Subsequently, consumption expenditure of euro area government and households is shown as part of their
use of income in rows 1 through 9 and columns 6 through 9 of Table 5. In row 17 and columns 6 and 7,
an adjustment is made to reflect the increase in the value of the pension reserves of households with
corporations. This adjustment is necessary in order to match an increase in the claims of households on
private pension funds.
18ECBWork ing Paper Ser ie s No . 356May 2004
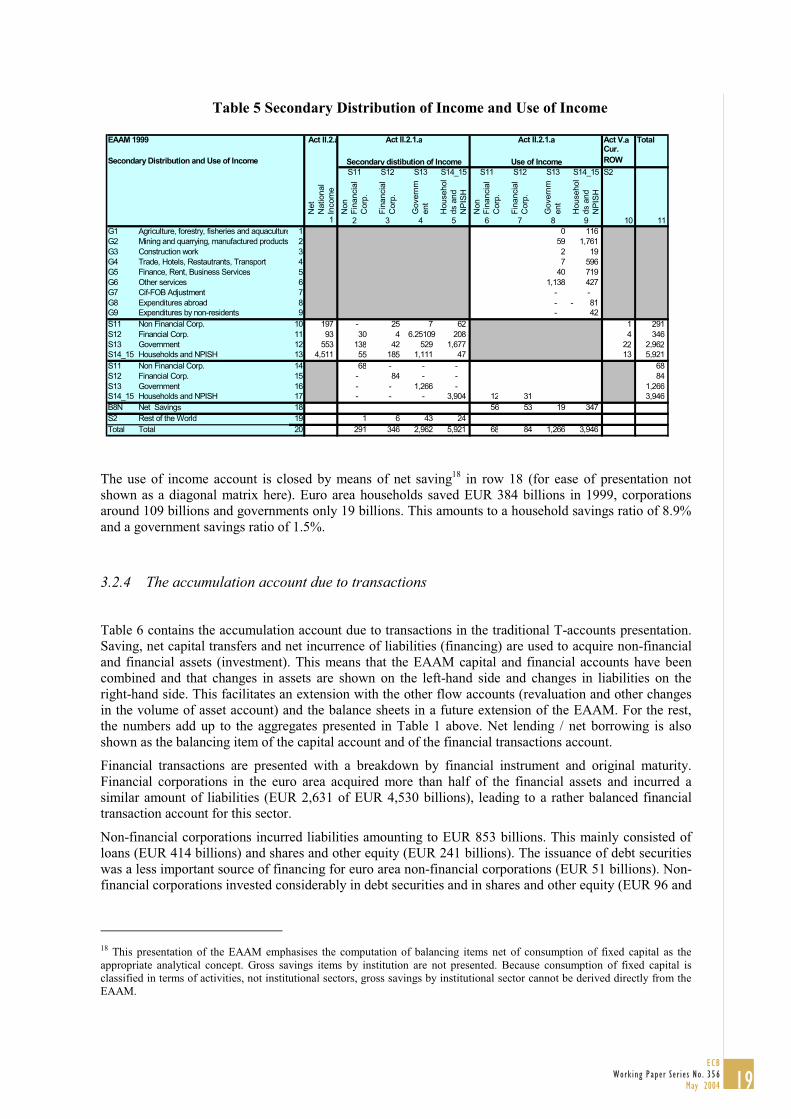
Table 5 Secondary Distribution of Income and Use of Income
The use of income account is closed by means of net saving18
in row 18 (for ease of presentation not
shown as a diagonal matrix here). Euro area households saved EUR 384 billions in 1999, corporations
around 109 billions and governments only 19 billions. This amounts to a household savings ratio of 8.9%
and a government savings ratio of 1.5%.
3.2.4 The accumulation account due to transactions
Table 6 contains the accumulation account due to transactions in the traditional T-accounts presentation.
Saving, net capital transfers and net incurrence of liabilities (financing) are used to acquire non-financial
and financial assets (investment). This means that the EAAM capital and financial accounts have been
combined and that changes in assets are shown on the left-hand side and changes in liabilities on the
right-hand side. This facilitates an extension with the other flow accounts (revaluation and other changes
in the volume of asset account) and the balance sheets in a future extension of the EAAM. For the rest,
the numbers add up to the aggregates presented in Table 1 above. Net lending / net borrowing is also
shown as the balancing item of the capital account and of the financial transactions account.
Financial transactions are presented with a breakdown by financial instrument and original maturity.
Financial corporations in the euro area acquired more than half of the financial assets and incurred a
similar amount of liabilities (EUR 2,631 of EUR 4,530 billions), leading to a rather balanced financial
transaction account for this sector.
Non-financial corporations incurred liabilities amounting to EUR 853 billions. This mainly consisted of
loans (EUR 414 billions) and shares and other equity (EUR 241 billions). The issuance of debt securities
was a less important source of financing for euro area non-financial corporations (EUR 51 billions). Non-
financial corporations invested considerably in debt securities and in shares and other equity (EUR 96 and
18This presentation of the EAAM emphasises the computation of balancing items net of consumption of fixed capital as the
appropriate analytical concept. Gross savings items by institution are not presented. Because consumption of fixed capital is
classified in terms of activities, not institutional sectors, gross savings by institutional sector cannot be derived directly from the
EAAM.
EAAM 1999 Act II.2.a Act V.a Total
Secondary Distribution and Use of Income
Cur.
ROW
S11 S12 S13 S14_15 S11 S12 S13 S14_15 S2
Net
National
Incom
e
Non
Fin
ancia
l
Corp
.
Fin
ancia
l
Corp
.
Govern
m
ent
Househol
ds a
nd
NP
ISH
Non
Fin
ancia
l
Corp
.
Fin
ancia
l
Corp
.
Govern
m
ent
Househol
ds a
nd
NP
ISH
1 2 3 4 5 6 7 8 9 10 11
G1 Agriculture, forestry, fisheries and aquaculture 1 0 116
G2 Mining and quarrying, manufactured products 2 59 1,761
G3 Construction work 3 2 19
G4 Trade, Hotels, Restautrants, Transport 4 7 596
G5 Finance, Rent, Business Services 5 40 719
G6 Other services 6 1,138 427
G7 Cif-FOB Adjustment 7 - -
G8 Expenditures abroad 8 - 81-
G9 Expenditures by non-residents 9 - 42
S11 Non Financial Corp. 10 197 - 25 7 62 1 291
S12 Financial Corp. 11 93 30 4 6.25109 208 4 346
S13 Government 12 553 138 42 529 1,677 22 2,962
S14_15 Households and NPISH 13 4,511 55 185 1,111 47 13 5,921
S11 Non Financial Corp. 14 68 - - - 68
S12 Financial Corp. 15 - 84 - - 84
S13 Government 16 - - 1,266 - 1,266
S14_15 Households and NPISH 17 - - - 3,904 12 31 3,946
B8N Net Savings 18 56 53 19 347
S2 Rest of the World 19 1 6 43 24
Total Total 20 291 346 2,962 5,921 68 84 1,266 3,946
Act II.2.1.a Act II.2.1.a
Secondary distibution of Income Use of Income
19ECB
Work ing Paper Ser ie s No . 356May 2004
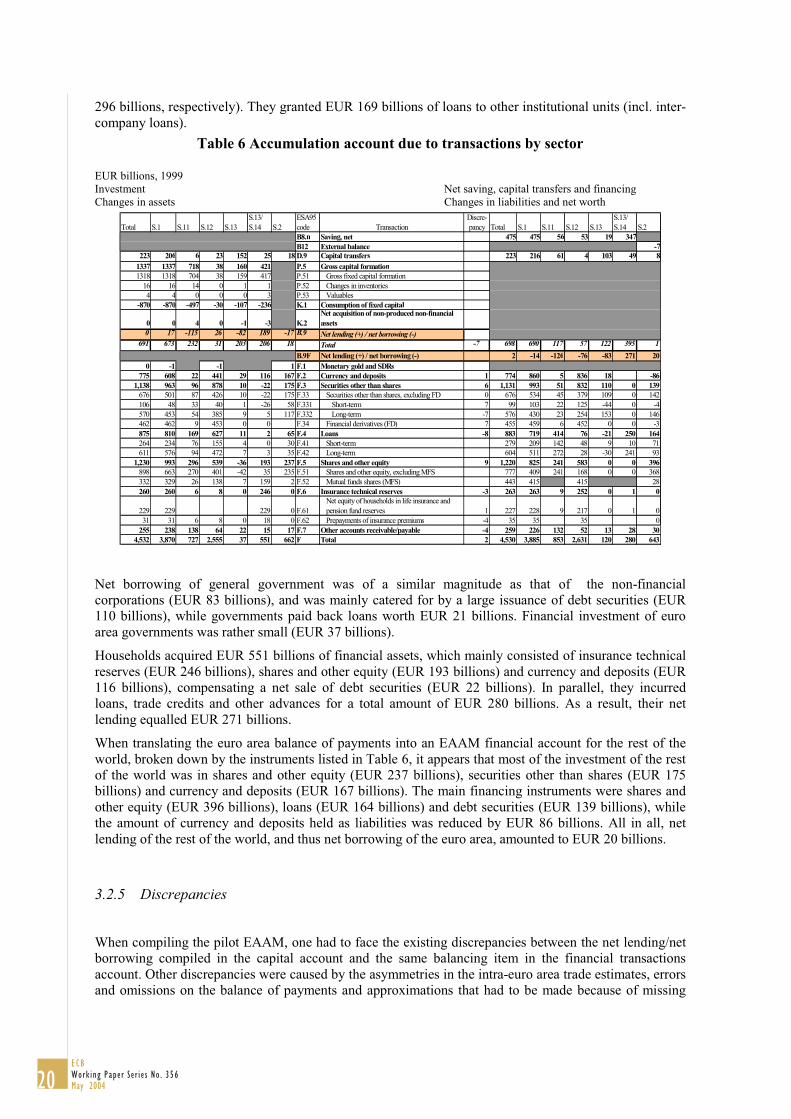
296 billions, respectively). They granted EUR 169 billions of loans to other institutional units (incl. inter-
company loans).
Table 6 Accumulation account due to transactions by sector
EUR billions, 1999
Investment Net saving, capital transfers and financing
Changes in assets Changes in liabilities and net worth
Total S.1 S.11 S.12 S.13
S.13/
S.14 S.2
ESA95
code Transaction
Discre-
pancy Total S.1 S.11 S.12 S.13
S.13/
S.14 S.2
B8.n Saving, net 475 475 56 53 19 347
B12 External balance -7
223 206 6 23 152 25 18 D.9 Capital transfers 223 216 61 4 103 49 8
1337 1337 718 38 160 421 P.5 Gross capital formation
1318 1318 704 38 159 417 P.51 Gross fixed capital formation
16 16 14 0 1 1 P.52 Changes in inventories
4 4 0 0 0 3 P.53 Valuables
-870 -870 -497 -30 -107 -236 K.1 Consumption of fixed capital
0 0 4 0 -1 -3 K.2
Net acquisition of non-produced non-financial
assets
0 17 -115 26 -82 189 -17 B.9 Net lending (+) / net borrowing (-)
691 673 232 31 203 206 18 Total -7 698 690 117 57 122 395 1
B.9F Net lending (+) / net borrowing (-) 2 -14 -126 -76 -83 271 20
0 -1 -1 1 F.1 Monetary gold and SDRs
775 608 22 441 29 116 167 F.2 Currency and deposits 1 774 860 5 836 18 -86
1,138 963 96 878 10 -22 175 F.3 Securities other than shares 6 1,131 993 51 832 110 0 139
676 501 87 426 10 -22 175 F.33 Securities other than shares, excluding FD 0 676 534 45 379 109 0 142
106 48 33 40 1 -26 58 F.331 Short-term 7 99 103 22 125 -44 0 -4
570 453 54 385 9 5 117 F.332 Long-term -7 576 430 23 254 153 0 146
462 462 9 453 0 0 F.34 Financial derivatives (FD) 7 455 459 6 452 0 0 -3
875 810 169 627 11 2 65 F.4 Loans -8 883 719 414 76 -21 250 164
264 234 76 155 4 0 30 F.41 Short-term 279 209 142 48 9 10 71
611 576 94 472 7 3 35 F.42 Long-term 604 511 272 28 -30 241 93
1,230 993 296 539 -36 193 237 F.5 Shares and other equity 9 1,220 825 241 583 0 0 396
898 663 270 401 -42 35 235 F.51 Shares and other equity, excluding MFS 777 409 241 168 0 0 368
332 329 26 138 7 159 2 F.52 Mutual funds shares (MFS) 443 415 415 28
260 260 6 8 0 246 0 F.6 Insurance technical reserves -3 263 263 9 252 0 1 0
229 229 229 0 F.61
Net equity of households in life insurance and
pension fund reserves 1 227 228 9 217 0 1 0
31 31 6 8 0 18 0 F.62 Prepayments of insurance premiums -4 35 35 35 0
255 238 138 64 22 15 17 F.7 Other accounts receivable/payable -4 259 226 132 52 13 28 30
4,532 3,870 727 2,555 37 551 662 F Total 2 4,530 3,885 853 2,631 120 280 643
Net borrowing of general government was of a similar magnitude as that of the non-financial
corporations (EUR 83 billions), and was mainly catered for by a large issuance of debt securities (EUR
110 billions), while governments paid back loans worth EUR 21 billions. Financial investment of euro
area governments was rather small (EUR 37 billions).
Households acquired EUR 551 billions of financial assets, which mainly consisted of insurance technical
reserves (EUR 246 billions), shares and other equity (EUR 193 billions) and currency and deposits (EUR
116 billions), compensating a net sale of debt securities (EUR 22 billions). In parallel, they incurred
loans, trade credits and other advances for a total amount of EUR 280 billions. As a result, their net
lending equalled EUR 271 billions.
When translating the euro area balance of payments into an EAAM financial account for the rest of the
world, broken down by the instruments listed in Table 6, it appears that most of the investment of the rest
of the world was in shares and other equity (EUR 237 billions), securities other than shares (EUR 175
billions) and currency and deposits (EUR 167 billions). The main financing instruments were shares and
other equity (EUR 396 billions), loans (EUR 164 billions) and debt securities (EUR 139 billions), while
the amount of currency and deposits held as liabilities was reduced by EUR 86 billions. All in all, net
lending of the rest of the world, and thus net borrowing of the euro area, amounted to EUR 20 billions.
3.2.5 Discrepancies
When compiling the pilot EAAM, one had to face the existing discrepancies between the net lending/net
borrowing compiled in the capital account and the same balancing item in the financial transactions
account. Other discrepancies were caused by the asymmetries in the intra-euro area trade estimates, errors
and omissions on the balance of payments and approximations that had to be made because of missing
20ECBWork ing Paper Ser ie s No . 356May 2004
countries and an incomplete coverage of transactions. As the pilot EAAM is directly or indirectly based
on national data, existing national discrepancies between the various data sets translate into euro area
discrepancies. Fortunately, sometimes these national discrepancies also cancel out.
All in all, the 1999 discrepancies are still rather substantial for households and for non-financial
corporations. While the discrepancies for financial corporations and for the rest of the world are also quite
(too) high, this item is relatively small for the government sector.
It is obvious that this pilot EAAM required many assumptions that can hopefully be replaced by more
comprehensive actual data in the future. The compilation methodology is elaborated in the Annex 4 to
this paper. The next section draws some preliminary conclusions.
4. CONCLUSIONS
This paper has set out a euro area accounting matrix (EAAM) and considered possible applications and
issues arising. The main advantage of an EAAM, in comparison to the traditional national accounting
framework, is its presentation of inter-sectoral linkages, not taking into account national borders with
monetary union and focusing on the matrix format presentation that shows the counterpart sectors to all
types of transactions. In turn, revealing these linkages assists in detecting the interrelationships between
portfolio shifts and restructuring of their liabilities of various sectors as a consequence of, or in
anticipation of, monetary policy decisions. In addition, this feature potentially enables tracing the impacts
of a monetary policy decision from the financial to the non-financial side of the economy and back.19
Finally, the EAAM can provide a consistent statistical skeleton for macro-economic forecasting models
that incorporate both the financial and the non-financial side of the economy.
As to date neither annual euro area supply and use tables nor institutional sector accounts were
completely available, the process of compiling the non-financial account components for the EAAM has
been lengthy, with many intermediate steps. In itself, these intermediate steps, such as the first ever
compilation of non-financial institutional sector accounts for the euro area and the first ever attempt to
construct a euro area Supply and Use framework, were already a valuable experience. In addition, the
integration of this work with the ongoing and much more advanced compilation process of quarterly euro
area financial accounts (ECB, 2000c, 2001, 2002a; Mink, 1999, 2002) has provided useful new insights.
The three guiding principles behind the compilation of the sectoral accounts in the EAAM have been the
following:
� Completion, that is, supplementary estimates have been made for Member States that do not provide
the full national accounts as outlined in the ESA95 transmission programme.
� Transformation, that is, the euro area has been transformed into a ‘national’ economy. Specifically,
the rest of the world accounts in the EAAM only reflect transactions of the euro area with countries
and institutions outside the euro area. For this purpose, cross-border transactions within the euro area
have been transformed into ‘domestic’ transactions between specific counterpart sectors.
� Consistency, that is, accounting relationships have been used together with additional information and
assumptions to yield internally consistent, EAAM accounts, apart from relatively small, remaining
discrepancies that could not yet be eliminated at this stage.
Yet, the results shown in this paper should be seen as a pilot version that serves as a basis for a further
elaboration, both concerning its compilation assumptions and the plausibility of the outcomes. Besides,
eliminating the statistical differences between the non-financial and the financial accounts, especially for
the private sectors and the ROW, remains high on the agenda.
The assembly of the EAAM would have been much easier if the different components such as euro area
supply and use tables and institutional sector accounts, had been readily and regularly (at least annually)
19See e.g. Defourny and Thorbecke (1984) for a method to trace ‘policy impact paths’ on the basis of a framework as laid out in
this paper.
21ECB
Work ing Paper Ser ie s No . 356May 2004
available. These components are anyhow in high demand by the ECB and other users. This should then be
step-by-step supplemented by sufficient and timely quarterly data. In that regard, existing EC Regulations
on quarterly government data, the forthcoming EC Regulation20
on quarterly euro area accounts for
institutional sectors and the ECB MUFA guideline are of great importance.
As regards the longer-term future, the ultimate objective is to take the framework to a quarterly
frequency. Indeed, in that regard, the present work on an annual EAAM should be seen as a first step and
as a diagnostic tool. A time-series of quarterly EAAMs would of course be more suited to timely and
relevant policy analysis. The key to reaching this stage is data availability. For example, whilst data for
financial transactions and balance sheets are mostly available at quarterly frequency, supply and use
tables are less well developed at that frequency. Investigating the options for a quarterly representation of
the EAAM is therefore an ongoing concern.
20Proposal for Parliament and Council Regulation 2003/0296 (COD)
22ECBWork ing Paper Ser ie s No . 356May 2004
References
Bacharach, M., (1970) “Bi-proportional matrices and input-output change”, Cambridge University Press.
Defourny, J. and Thorbecke, E. (1984). “Structural Path Analysis and Multiplier Decomposition within a
Social Accounting Matrix Framework”, Economic Journal, 94, 373, 111-136.
European Central Bank (2000a). “Statistical information collected and compiled by the ESCB,” ECB
Monthly Bulletin, May.
European Central Bank (2001). “Financing and financial investment of the non-financial sectors in the
euro area”, ECB Monthly Bulletin, May, 75-82.
European Central Bank (2002). “Saving, financing and investment in the euro area”, ECB Monthly
Bulletin, August, 65-76.
European Central Bank (2003). “The outcome of the ECB’s evaluation of its monetary policy strategy”,
ECB Monthly Bulletin, June, 79-92.
Eurostat (1996). European System of Accounts (ESA 1995), Eurostat, Luxembourg.
Keuning, S. J. and W. de Ruijter (1988). “Guidelines to the Construction of a Social Accounting Matrix”,
The Review of Income and Wealth, 34, 1, March.
Keuning, S. (1991) “Proposal for a Social Accounting Matrix which fits into the next system of national
accounts”, Economic Systems Research, 3, 3.
Keuning, S. J. (1996). Accounting for Economic Development and Social Change, IOS Press,
Amsterdam.
Keuning, S. J. (1997). “SESAME: an Integrated Economic and Social Accounting System”, International
Statistical Review, 65, 1, 111-121.
Leadership Group SAM (2002). Handbook on Social Accounting Matrices and Labour Accounts,
Populations and social conditions 3/2003/E/N 23, Eurostat, Luxembourg.
McAdam, Peter and J. Morgan (2004) “The Effects of Euro Area Interest Rate Changes: Evidence from
Macroeconomic Models”, National Institute Review, 187, January, 70-80.
McIntosh, S. H., J. M. Scherschel and A. M. Teplin (1999). “Use Of Flow Of Funds Accounts For Policy
Making At The Federal Reserve”, presented at Central Bank Uses of Financial Accounts, European
Central Bank, 22nd
November.
Mink, R. (1999). “Monetary Union Financial Accounts for ECB Monetary Policy Analysis”, presented at
Central Bank Uses of Financial Accounts, European Central Bank seminar, 22nd
November.
Mink, R. (2002). “Quarterly Monetary Union Financial Accounts for ECB Monetary Policy Analysis”,
IFC Bulletin, 12, October, 98-115.
Stone, R., Meade, J. E., Champernowne, D. G. (1942). “The precision of National Accounts Estimates”,
Review of Economic Studies, 9 (2), 11-125.
Stone, R. (1976). “The development of economic data systems”. In Social Accounting for Development
Planning with special reference to Sri Lanka (G. Pyatt et. al, eds.). Cambridge, Cambridge
University Press.
Teplin, A. M. (2001). “The U.S. Flow of Funds Accounts and Their Uses”, Federal Reserve Bulletin,
July, 431-441.
Thorbecke, E., (1985). “The Social Accounting Matrix and Consistency-Type Planning Models”, in G.
Pyatt and J. I. Round (Eds.), Social Accounting Matrix: A Basis for Planning, World Bank
Publications.
Thorbecke, E. (2000). “The Use of Social Accounting Matrices in Modelling”, paper presented at the 26th
General Conference of The International Association for Research in Income and Wealth, Cracow,
Poland, 27 August to 2 September.
Thorbecke, E. and associates (1992). Adjustment and Equity in Indonesia, Organisation for Economic
Cooperation and Development, Paris.
Thorbecke, E., B. Kim, D. Roland-Holst and D. Berrian (1992). “A Computable General Equilibrium
Model Integrating Real And Financial Transactions” in Thorbecke, E. and associates Adjustment
and Equity in Indonesia, Organisation for Economic Cooperation and Development, Paris.
United Nations, Eurostat, International Monetary Fund, Organisation for Economic Cooperation and
Development and World Bank (1993). System of National Accounts 1993, Series F, No. 2, Rev. 4,
United Nations, New York.
Whitely, J. (1994) A Course in Macro Economic Modelling and Forecasting, Harvester.
23ECB
Work ing Paper Ser ie s No . 356May 2004
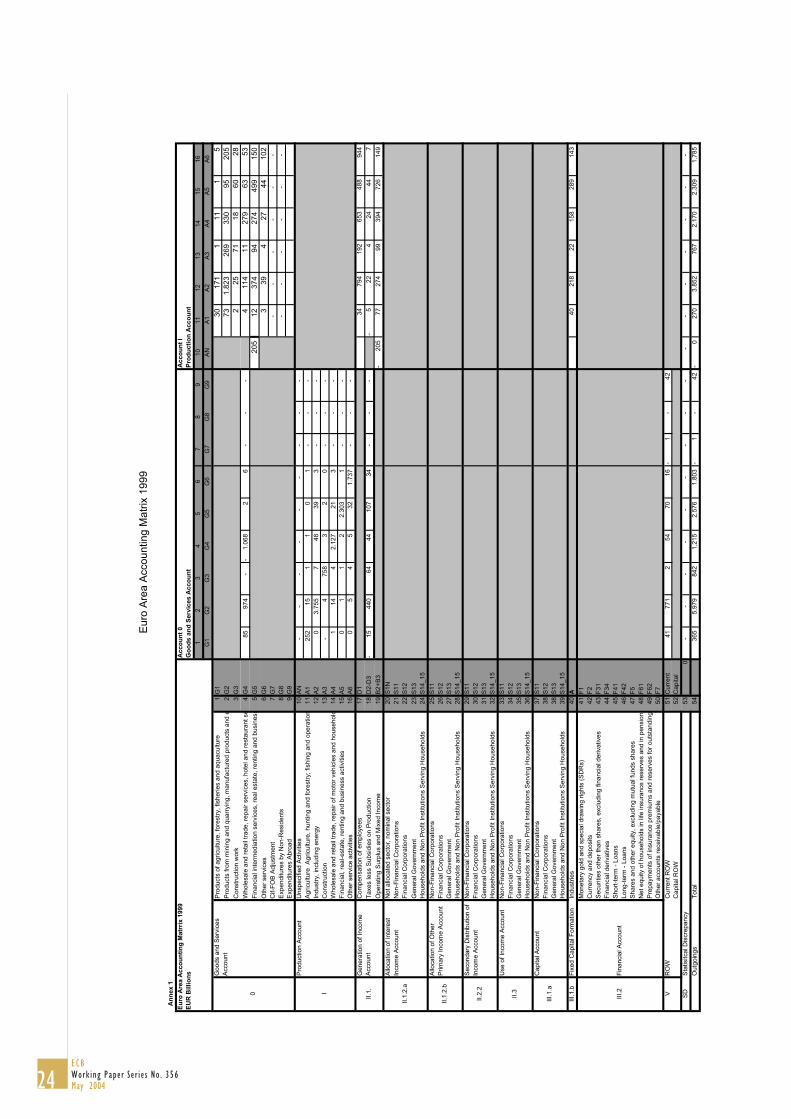
Euro
Are
a A
ccounting M
atr
ix 1
999
An
nex 1
Eu
ro
Area A
cco
un
tin
g M
atr
rix
1999
Acco
un
t 0
Acco
un
t I
EU
R B
illio
ns
Go
od
s a
nd
Servic
es A
cco
un
tP
ro
du
cti
on
Acco
un
t
12
34
56
78
91
011
12
13
14
15
16
G1
G2
G3
G4
G5
G6
G7
G8
G9
AN
A1
A2
A3
A4
A5
A6
Pro
ducts
of agriculture
, fo
restr
y, fisheries a
nd a
quaculture
1G
13
0
17
1
1
11
1
5
Pro
ducts
fro
m m
inin
g a
nd q
uarr
yin
g, m
anufa
ctu
red p
roducts
and e
2G
27
3
1.8
23
2
69
33
0
9
5
20
5
Constr
uction w
ork
3G
32
25
7
1
18
6
0
28
Whole
sale
and r
eta
il tra
de, re
pair s
erv
ices, hote
l and r
esta
ura
nt se
4G
485
974
-
1.0
68
-
2
6
-
-
-
4
1
14
11
2
79
63
5
3
Fin
ancia
l in
term
edia
tion s
erv
ices, re
al esta
te, re
nting a
nd b
usin
ess
5G
52
05
12
3
74
94
2
74
49
9
1
50
Oth
er
serv
ices
6G
63
39
4
27
4
4
10
2
Cif-F
OB
Adju
stm
ent
7G
7-
-
-
-
-
-
Expenditure
s b
y N
on-R
esid
ents
8G
8-
-
-
-
-
-
Expenditure
s A
bro
ad
9G
9
Unspecifie
d A
ctivitie
s10
AN
-
-
-
-
-
-
-
-
-
Agriculture
A
griculture
, hunting a
nd fore
str
y; fishin
g a
nd o
pera
tio
n11
A1
252
15
1
1
0
1
-
-
-
Industr
y, in
clu
din
g e
nerg
y12
A2
0
3.7
55
7
48
39
3
-
-
-
Constr
uction
13
A3
-
4
758
3
2
0
-
-
-
Whole
sale
and r
eta
il tra
de, re
pair o
f m
oto
r vehic
les a
nd h
ousehol d
14
A4
1
14
4
2.1
27
21
3
-
-
-
Fin
ancia
l, r
eal-esta
te, re
nting a
nd b
usin
ess a
ctivitie
s15
A5
0
1
1
2
2.3
03
1
-
-
-
Oth
er
serv
ice a
ctivitie
s16
A6
0
5
4
5
32
1.7
37
-
-
-
Com
pensation o
f em
plo
yees
17
D1
34
794
192
653
488
944
Taxes less S
ubsid
ies o
n P
roduction
18
D2-D
315
-
440
64
44
107
34
-
-
-
5-
22
4
24
44
7
Opera
ting S
urp
lus a
nd M
ixed Incom
e19
B2+
B3
205
-
77
274
99
394
726
149
Not allocate
d s
ecto
r, n
om
inal secto
r20
S1N
Non-F
inancia
l C
orp
ora
tions
21
S11
Fin
ancia
l C
orp
ora
tions
22
S12
Genera
l G
overn
ment
23
S13
Household
s a
nd N
on P
rofit In
stitu
tions S
erv
ing H
ousehold
s24
S14_15
Non-F
inancia
l C
orp
ora
tions
25
S11
Fin
ancia
l C
orp
ora
tions
26
S12
Genera
l G
overn
ment
27
S13
Household
s a
nd N
on P
rofit In
stitu
tions S
erv
ing H
ousehold
s28
S14_15
Non-F
inancia
l C
orp
ora
tions
29
S11
Fin
ancia
l C
orp
ora
tions
30
S12
Genera
l G
overn
ment
31
S13
Household
s a
nd N
on P
rofit In
stitu
tions S
erv
ing H
ousehold
s32
S14_15
Non-F
inancia
l C
orp
ora
tions
33
S11
Fin
ancia
l C
orp
ora
tions
34
S12
Genera
l G
overn
ment
35
S13
Household
s a
nd N
on P
rofit In
stitu
tions S
erv
ing H
ousehold
s36
S14_15
Non-F
inancia
l C
orp
ora
tions
37
S11
Fin
ancia
l C
orp
ora
tions
38
S12
Genera
l G
overn
ment
38
S13
Household
s a
nd N
on P
rofit In
stitu
tions S
erv
ing H
ousehold
s39
S14_15
III.1.b
Fix
ed C
apital F
orm
ation
Industr
ies
40
A40
218
22
158
289
143
Moneta
ry g
old
and s
pecia
l dra
win
g r
ights
(S
DR
s)
41
F1
Curr
ency a
nd d
eposits
42
F2
Securities o
ther
than s
hare
s, exclu
din
g fin
ancia
l derivatives
43
F31
Fin
ancia
l derivatives
44
F34
Short
-term
- L
oans
45
F41
Long-t
erm
- L
oans
46
F42
Share
s a
nd o
ther
equity, exclu
din
g m
utu
al fu
nds s
hare
s47
F5
Net equity o
f household
s in life insura
nce r
eserv
es a
nd in p
ensio
n
48
F61
Pre
paym
ents
of in
sura
nce p
rem
ium
s a
nd r
eserv
es for
outs
tandin
g49
F62
Oth
er
accounts
receiv
able
/payable
50
F7
VR
OW
Curr
ent R
OW
51
Curr
ent
41
771
2
54
70
16
1
-
-
42
Capital R
OW
52
Capital
SD
Sta
tisitcal D
iscre
pancy
53
0-
-
-
-
-
-
-
-
-
-
-
-
-
-
-
-
Outg
oin
gs
Tota
l54
365
5.9
79
842
1.2
15
2.5
76
1.8
03
1-
-
42
0-
270
3.8
52
767
2.1
70
2.3
09
1.7
85
I
Pro
duction A
ccount
Goods a
nd S
erv
ices
Account
0
II.1
.
Genera
tion o
f In
com
e
Account
II.1
.2.b
Allocation o
f O
ther
Prim
ary
Incom
e A
ccount
II.1
.2.a
Allocation o
f In
tere
st
Incom
e A
ccount
III.2
Fin
ancia
l A
ccount
II.2
.2
III.1.a
Capital A
ccount
II.3
Use o
f In
com
e A
ccount
Secondary
Dis
trib
ution o
f
Incom
e A
ccount
24ECBWork ing Paper Ser ie s No . 356May 2004
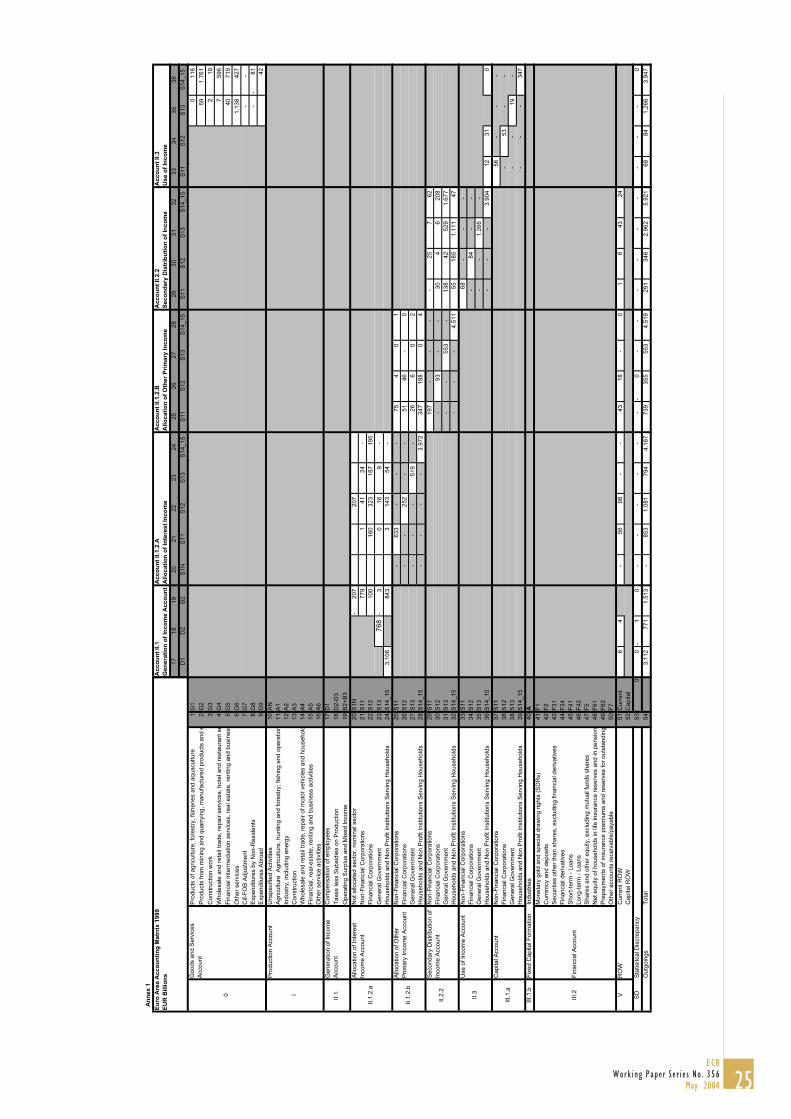
Ac
co
un
t II
.1A
cc
ou
nt
II.1
.2.A
Ac
co
un
t II
.1.2
.BA
cc
ou
nt
II.2
.2A
cc
ou
nt
II.3
Ge
ne
ra
tio
n o
f In
co
me
Ac
co
un
tA
llo
ca
tio
n o
f In
tere
st
Inc
om
eA
llo
ca
tio
n o
f O
the
r P
rim
ary
In
co
me
Se
co
nd
ary
Dis
trib
uti
on
of
Inc
om
eU
se
of
Inc
om
e
17
18
19
20
21
22
23
24
25
26
27
28
29
30
31
32
33
34
35
36
D1
D2
B2
S1
NS
11
S1
2S
13
S1
4_
15
S1
1S
12
S1
3S
14
_1
5S
11
S1
2S
13
S1
4_
15
S1
1S
12
S1
3S
14
_1
5
0
11
6
59
1.7
61
2
19
7
59
6
40
71
9
1.1
38
4
27
-
-
-
81
-
4
2
20
7-
20
7
77
9
1
41
24
-
10
0
16
0
32
3
18
7
19
5
768
3-
0
16
9
-
3.1
06
8
43
3
1
43
5
4
-
-
63
3
-
-
-
75
4
0
1
-
-
25
2
-
-
51
46
-
0
-
-
-
51
9
-
26
6
0
2
-
-
-
-
3.9
72
3
47
1
88
0
4
19
7
-
-
-
-
25
7
62
-
93
-
-
30
4
6
20
8
-
-
55
3
-
13
8
42
52
9
1.6
77
-
-
-
4.5
11
5
5
1
85
1
.11
1
47
68
-
-
-
-
84
-
-
-
-
1.2
66
-
-
-
-
3.9
04
1
2
31
0
56
-
-
-
-
53
-
-
-
-
19
-
-
-
-
3
47
6
4
-
56
98
-
-
43
18
-
0
1
6
43
24
0
1-
0
-
-
-
-
-
-
0-
-
-
-
-
-
-
-
-
-
0
3.1
12
7
71
1
.51
3
-
85
3
1.0
81
7
94
4
.16
7
73
9
35
5
55
3
4
.51
9
29
1
34
6
2.9
62
5
.92
1
68
8
4
1.2
66
3.9
47
An
ne
x 1
Eu
ro
Are
a A
cc
ou
nti
ng
Ma
trrix
19
99
EU
R B
illi
on
s
Pro
du
cts
of
ag
ricu
ltu
re,
fore
str
y,
fish
erie
s a
nd
aq
ua
cu
ltu
re1
G1
Pro
du
cts
fro
m m
inin
g a
nd
qu
arr
yin
g,
ma
nu
factu
red
pro
du
cts
an
d e
2G
2
Co
nstr
uctio
n w
ork
3G
3
Wh
ole
sa
le a
nd
re
tail t
rad
e,
rep
air s
erv
ice
s,
ho
tel a
nd
re
sta
ura
nt
se
4G
4
Fin
an
cia
l in
term
ed
iatio
n s
erv
ice
s,
rea
l e
sta
te,
ren
tin
g a
nd
bu
sin
ess
5G
5
Oth
er
se
rvic
es
6G
6
Cif-F
OB
Ad
justm
en
t7
G7
Exp
en
ditu
res b
y N
on
-Re
sid
en
ts8
G8
Exp
en
ditu
res A
bro
ad
9
G9
Un
sp
ecifie
d A
ctivitie
s1
0A
N
Ag
ricu
ltu
re
Ag
ricu
ltu
re,
hu
ntin
g a
nd
fo
restr
y;
fish
ing
an
d o
pe
ration
11
A1
Ind
ustr
y,
inclu
din
g e
ne
rgy
12
A2
Co
nstr
uctio
n1
3A
3
Wh
ole
sa
le a
nd
re
tail t
rad
e,
rep
air o
f m
oto
r ve
hic
les a
nd
ho
use
ho
ld1
4A
4
Fin
an
cia
l, r
ea
l-e
sta
te,
ren
tin
g a
nd
bu
sin
ess a
ctivitie
s1
5A
5
Oth
er
se
rvic
e a
ctivitie
s1
6A
6
Co
mp
en
sa
tio
n o
f e
mp
loye
es
17
D1
Ta
xe
s le
ss S
ub
sid
ies o
n P
rod
uctio
n1
8D
2-D
3
Op
era
tin
g S
urp
lus a
nd
Mix
ed
In
co
me
19
B2
+B
3
No
t a
llo
ca
ted
se
cto
r, n
om
ina
l se
cto
r2
0S
1N
No
n-F
ina
ncia
l C
orp
ora
tio
ns
21
S1
1
Fin
an
cia
l C
orp
ora
tio
ns
22
S1
2
Ge
ne
ral G
ove
rnm
en
t2
3S
13
Ho
use
ho
lds a
nd
No
n P
rofit
Institu
tio
ns S
erv
ing
Ho
use
ho
lds
24
S1
4_
15
No
n-F
ina
ncia
l C
orp
ora
tio
ns
25
S1
1
Fin
an
cia
l C
orp
ora
tio
ns
26
S1
2
Ge
ne
ral G
ove
rnm
en
t2
7S
13
Ho
use
ho
lds a
nd
No
n P
rofit
Institu
tio
ns S
erv
ing
Ho
use
ho
lds
28
S1
4_
15
No
n-F
ina
ncia
l C
orp
ora
tio
ns
29
S1
1
Fin
an
cia
l C
orp
ora
tio
ns
30
S1
2
Ge
ne
ral G
ove
rnm
en
t3
1S
13
Ho
use
ho
lds a
nd
No
n P
rofit
Institu
tio
ns S
erv
ing
Ho
use
ho
lds
32
S1
4_
15
No
n-F
ina
ncia
l C
orp
ora
tio
ns
33
S1
1
Fin
an
cia
l C
orp
ora
tio
ns
34
S1
2
Ge
ne
ral G
ove
rnm
en
t3
5S
13
Ho
use
ho
lds a
nd
No
n P
rofit
Institu
tio
ns S
erv
ing
Ho
use
ho
lds
36
S1
4_
15
No
n-F
ina
ncia
l C
orp
ora
tio
ns
37
S1
1
Fin
an
cia
l C
orp
ora
tio
ns
38
S1
2
Ge
ne
ral G
ove
rnm
en
t3
8S
13
Ho
use
ho
lds a
nd
No
n P
rofit
Institu
tio
ns S
erv
ing
Ho
use
ho
lds
39
S1
4_
15
III.
1.b
Fix
ed
Ca
pita
l F
orm
atio
nIn
du
str
ies
40
A
Mo
ne
tary
go
ld a
nd
sp
ecia
l d
raw
ing
rig
hts
(S
DR
s)
41
F1
Cu
rre
ncy a
nd
de
po
sits
42
F2
Se
cu
ritie
s o
the
r th
an
sh
are
s,
exclu
din
g f
ina
ncia
l d
eriva
tive
s4
3F
31
Fin
an
cia
l d
eriva
tive
s4
4F
34
Sh
ort
-te
rm -
Lo
an
s4
5F
41
Lo
ng
-te
rm -
Lo
an
s4
6F
42
Sh
are
s a
nd
oth
er
eq
uity,
exclu
din
g m
utu
al fu
nd
s s
ha
res
47
F5
Ne
t e
qu
ity o
f h
ou
se
ho
lds in
life
in
su
ran
ce
re
se
rve
s a
nd
in
pe
nsio
n
48
F6
1
Pre
pa
ym
en
ts o
f in
su
ran
ce
pre
miu
ms a
nd
re
se
rve
s f
or
ou
tsta
nd
ing
49
F6
2
Oth
er
acco
un
ts r
ece
iva
ble
/pa
ya
ble
50
F7
VR
OW
Cu
rre
nt
RO
W5
1C
urr
en
t
Ca
pita
l R
OW
52
Ca
pita
l
SD
Sta
tisitca
l D
iscre
pa
ncy
53
0
Ou
tgo
ing
sT
ota
l5
4
I
Pro
du
ctio
n A
cco
un
t
Go
od
s a
nd
Se
rvic
es
Acco
un
t
0
II.1
.
Ge
ne
ratio
n o
f In
co
me
Acco
un
t
II.1
.2.b
Allo
ca
tio
n o
f O
the
r
Prim
ary
In
co
me
Acco
un
t
II.1
.2.a
Allo
ca
tio
n o
f In
tere
st
Inco
me
Acco
un
t
III.
2F
ina
ncia
l A
cco
un
t
II.2
.2
III.
1.a
Ca
pita
l A
cco
un
t
II.3
Use
of
Inco
me
Acco
un
t
Se
co
nd
ary
Dis
trib
utio
n o
f
Inco
me
Acco
un
t
25ECB
Work ing Paper Ser ie s No . 356May 2004
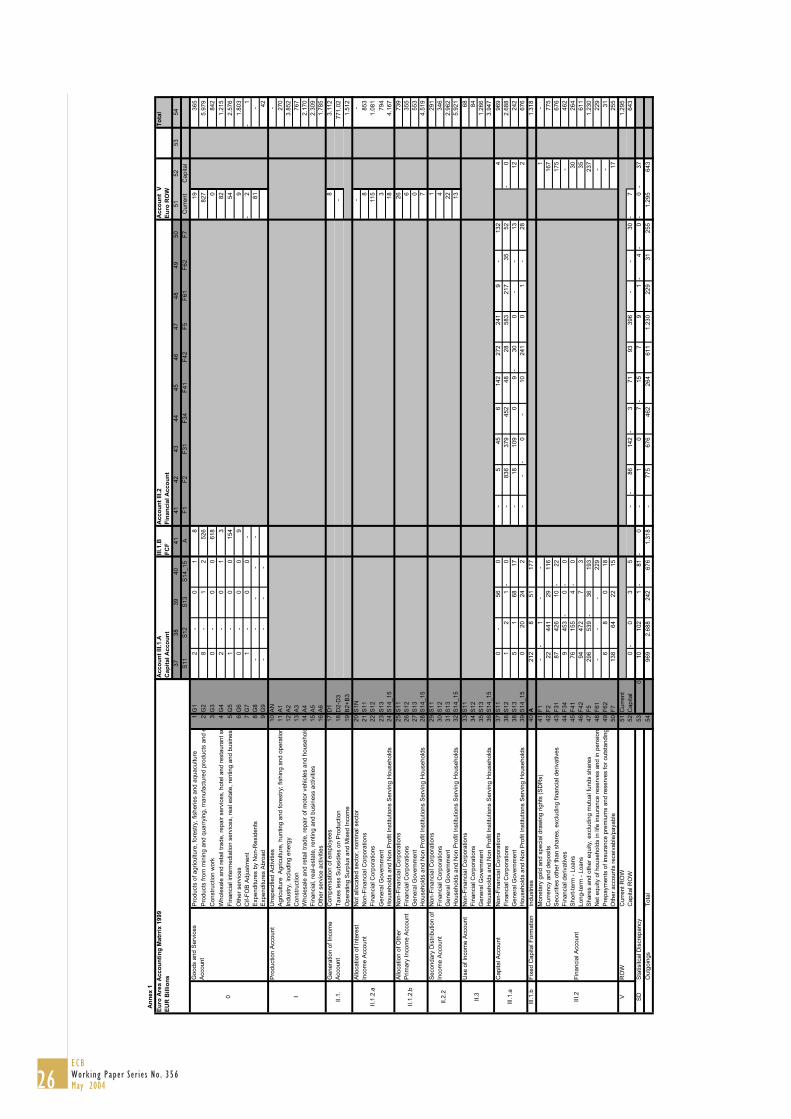
Ac
co
un
t II
I.1
. AII
I.1
.BA
cc
ou
nt
III.
2A
cc
ou
nt
VT
ota
l
Ca
pit
al
Ac
co
un
tF
CF
Fin
an
cia
l A
cc
ou
nt
Eu
ro
RO
W
37
38
39
40
41
41
42
43
44
45
46
47
48
49
50
51
52
53
54
S1
1S
12
S1
3S
14
_1
5A
F1
F2
F3
1F
34
F4
1F
42
F5
F6
1F
62
F7
Cu
rre
nt
Ca
pita
l
2
-
0
1
8
19
36
5
8
-
1
2
52
6
82
7
5.9
79
0
-
0
0
61
8
0
84
2
2
-
0
1
3
82
1.2
15
1
-
0
0
15
4
54
2.5
76
0
-
0
0
9
9
1.8
03
1
-
0
0
-
2-
1-
-
-
-
-
-
81
-
-
-
-
-
42
-
2
70
3.8
52
76
7
2.1
70
2.3
09
1.7
85
8
3
.11
2
-
77
1,0
2
1.5
12
-
-
8
85
3
11
5
1.0
81
3
79
4
18
4
.16
7
26
73
9
6
35
5
0
55
3
7
4
.51
9
1
29
1
4
34
6
22
2.9
62
13
5
.92
1
68
8
4
1.2
66
3.9
47
0
-
56
0
-
5
45
6
14
2
27
2
24
1
9
-
13
2
4
96
9
1
2
1
0-
-
83
6
37
9
45
2
48
28
58
3
21
7
35
52
0-
2.6
88
5
1
68
17
-
18
10
9
0
9
30
-
0
-
-
13
12
24
2
0
20
24
2
-
-
0-
-
10
24
1
0
1
-
28
2
6
76
21
2
8
51
17
7
1.3
18
-
1-
-
-
1
-
22
44
1
29
11
6
16
7
77
5
87
42
6
10
22
-
17
5
67
6
9
45
3
0-
0-
-
46
2
76
15
5
4
0-
30
26
4
94
47
2
7
3
35
61
1
29
6
53
9
36
-
19
3
23
7
1.2
30
-
-
-
22
9
-
22
9
6
8
0
18
-
31
13
8
64
22
15
17
2
55
1.2
95
0
0-
3
5
-
86
-
14
2
3-
71
93
3
96
-
-
30
7-
64
3
10
10
2
1
81
-
0-
-
1
0
7
15
-
7
9
1
4-
0-
0-
37
-
96
9
2.6
88
2
42
6
76
1
.31
8
-
77
5
67
6
46
2
26
4
61
1
1
.23
0
22
9
31
25
5
1.2
95
6
43
An
ne
x 1
Eu
ro
Are
a A
cc
ou
nti
ng
Ma
trrix
19
99
EU
R B
illi
on
s
Pro
du
cts
of
ag
ricu
ltu
re,
fore
str
y,
fish
erie
s a
nd
aq
ua
cu
ltu
re1
G1
Pro
du
cts
fro
m m
inin
g a
nd
qu
arr
yin
g,
ma
nu
factu
red
pro
du
cts
an
d e
2G
2
Co
nstr
uctio
n w
ork
3G
3
Wh
ole
sa
le a
nd
re
tail t
rad
e,
rep
air s
erv
ice
s,
ho
tel a
nd
re
sta
ura
nt
se
4G
4
Fin
an
cia
l in
term
ed
iatio
n s
erv
ice
s,
rea
l e
sta
te,
ren
tin
g a
nd
bu
sin
ess
5G
5
Oth
er
se
rvic
es
6G
6
Cif-F
OB
Ad
justm
en
t7
G7
Exp
en
ditu
res b
y N
on
-Re
sid
en
ts8
G8
Exp
en
ditu
res A
bro
ad
9
G9
Un
sp
ecifie
d A
ctivitie
s1
0A
N
Ag
ricu
ltu
re
Ag
ricu
ltu
re,
hu
ntin
g a
nd
fo
restr
y;
fish
ing
an
d o
pe
ration
11
A1
Ind
ustr
y,
inclu
din
g e
ne
rgy
12
A2
Co
nstr
uctio
n1
3A
3
Wh
ole
sa
le a
nd
re
tail t
rad
e,
rep
air o
f m
oto
r ve
hic
les a
nd
ho
use
ho
ld1
4A
4
Fin
an
cia
l, r
ea
l-e
sta
te,
ren
tin
g a
nd
bu
sin
ess a
ctivitie
s1
5A
5
Oth
er
se
rvic
e a
ctivitie
s1
6A
6
Co
mp
en
sa
tio
n o
f e
mp
loye
es
17
D1
Ta
xe
s le
ss S
ub
sid
ies o
n P
rod
uctio
n1
8D
2-D
3
Op
era
tin
g S
urp
lus a
nd
Mix
ed
In
co
me
19
B2
+B
3
No
t a
llo
ca
ted
se
cto
r, n
om
ina
l se
cto
r2
0S
1N
No
n-F
ina
ncia
l C
orp
ora
tio
ns
21
S1
1
Fin
an
cia
l C
orp
ora
tio
ns
22
S1
2
Ge
ne
ral G
ove
rnm
en
t2
3S
13
Ho
use
ho
lds a
nd
No
n P
rofit
Institu
tio
ns S
erv
ing
Ho
use
ho
lds
24
S1
4_
15
No
n-F
ina
ncia
l C
orp
ora
tio
ns
25
S1
1
Fin
an
cia
l C
orp
ora
tio
ns
26
S1
2
Ge
ne
ral G
ove
rnm
en
t2
7S
13
Ho
use
ho
lds a
nd
No
n P
rofit
Institu
tio
ns S
erv
ing
Ho
use
ho
lds
28
S1
4_
15
No
n-F
ina
ncia
l C
orp
ora
tio
ns
29
S1
1
Fin
an
cia
l C
orp
ora
tio
ns
30
S1
2
Ge
ne
ral G
ove
rnm
en
t3
1S
13
Ho
use
ho
lds a
nd
No
n P
rofit
Institu
tio
ns S
erv
ing
Ho
use
ho
lds
32
S1
4_
15
No
n-F
ina
ncia
l C
orp
ora
tio
ns
33
S1
1
Fin
an
cia
l C
orp
ora
tio
ns
34
S1
2
Ge
ne
ral G
ove
rnm
en
t3
5S
13
Ho
use
ho
lds a
nd
No
n P
rofit
Institu
tio
ns S
erv
ing
Ho
use
ho
lds
36
S1
4_
15
No
n-F
ina
ncia
l C
orp
ora
tio
ns
37
S1
1
Fin
an
cia
l C
orp
ora
tio
ns
38
S1
2
Ge
ne
ral G
ove
rnm
en
t3
8S
13
Ho
use
ho
lds a
nd
No
n P
rofit
Institu
tio
ns S
erv
ing
Ho
use
ho
lds
39
S1
4_
15
III.
1.b
Fix
ed
Ca
pita
l F
orm
atio
nIn
du
str
ies
40
A
Mo
ne
tary
go
ld a
nd
sp
ecia
l d
raw
ing
rig
hts
(S
DR
s)
41
F1
Cu
rre
ncy a
nd
de
po
sits
42
F2
Se
cu
ritie
s o
the
r th
an
sh
are
s,
exclu
din
g f
ina
ncia
l d
eriva
tive
s4
3F
31
Fin
an
cia
l d
eriva
tive
s4
4F
34
Sh
ort
-te
rm -
Lo
an
s4
5F
41
Lo
ng
-te
rm -
Lo
an
s4
6F
42
Sh
are
s a
nd
oth
er
eq
uity,
exclu
din
g m
utu
al fu
nd
s s
ha
res
47
F5
Ne
t e
qu
ity o
f h
ou
se
ho
lds in
life
in
su
ran
ce
re
se
rve
s a
nd
in
pe
nsio
n
48
F6
1
Pre
pa
ym
en
ts o
f in
su
ran
ce
pre
miu
ms a
nd
re
se
rve
s f
or
ou
tsta
nd
ing
49
F6
2
Oth
er
acco
un
ts r
ece
iva
ble
/pa
ya
ble
50
F7
VR
OW
Cu
rre
nt
RO
W5
1C
urr
en
t
Ca
pita
l R
OW
52
Ca
pita
l
SD
Sta
tisitca
l D
iscre
pa
ncy
53
0
Ou
tgo
ing
sT
ota
l5
4
I
Pro
du
ctio
n A
cco
un
t
Go
od
s a
nd
Se
rvic
es
Acco
un
t
0
II.1
.
Ge
ne
ratio
n o
f In
co
me
Acco
un
t
II.1
.2.b
Allo
ca
tio
n o
f O
the
r
Prim
ary
In
co
me
Acco
un
t
II.1
.2.a
Allo
ca
tio
n o
f In
tere
st
Inco
me
Acco
un
t
III.
2F
ina
ncia
l A
cco
un
t
II.2
.2
III.
1.a
Ca
pita
l A
cco
un
t
II.3
Use
of
Inco
me
Acco
un
t
Se
co
nd
ary
Dis
trib
utio
n o
f
Inco
me
Acco
un
t
26ECBWork ing Paper Ser ie s No . 356May 2004
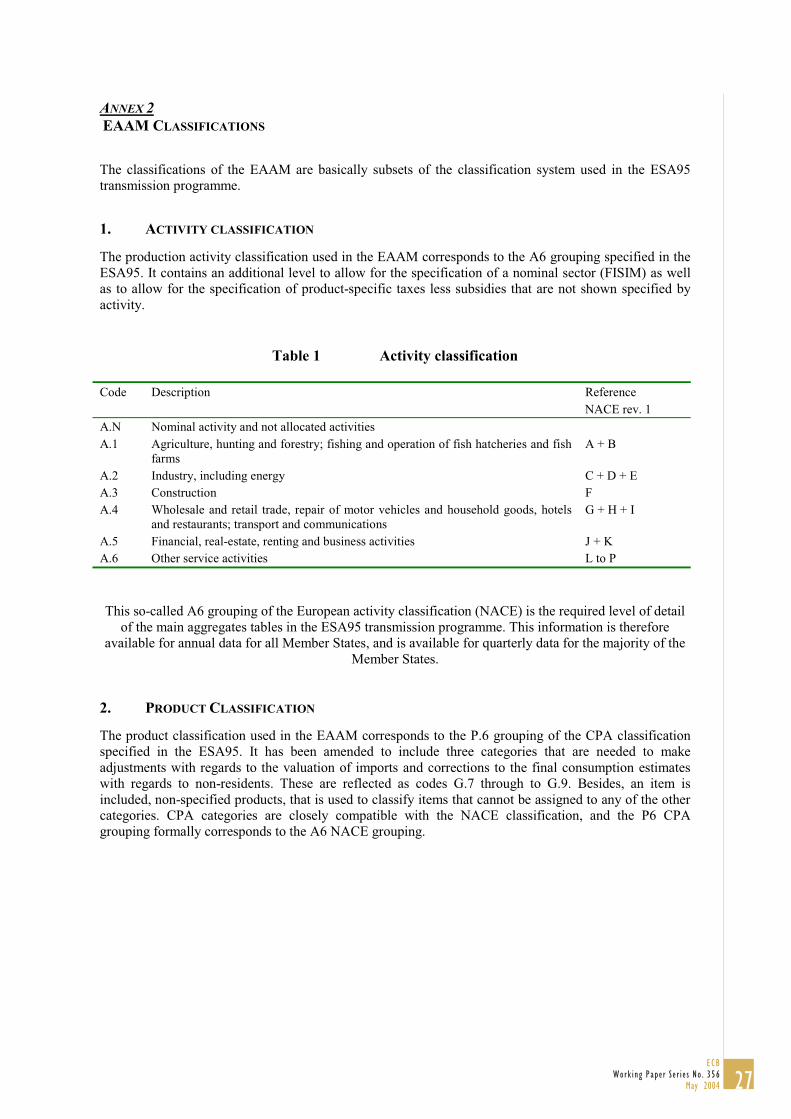
ANNEX 2
EAAM CLASSIFICATIONS
The classifications of the EAAM are basically subsets of the classification system used in the ESA95
transmission programme.
1. ACTIVITY CLASSIFICATION
The production activity classification used in the EAAM corresponds to the A6 grouping specified in the
ESA95. It contains an additional level to allow for the specification of a nominal sector (FISIM) as well
as to allow for the specification of product-specific taxes less subsidies that are not shown specified by
activity.
Table 1 Activity classification
Code Description Reference
NACE rev. 1
A.N Nominal activity and not allocated activities
A.1 Agriculture, hunting and forestry; fishing and operation of fish hatcheries and fish
farms
A + B
A.2 Industry, including energy C + D + E
A.3 Construction F
A.4 Wholesale and retail trade, repair of motor vehicles and household goods, hotels
and restaurants; transport and communications
G + H + I
A.5 Financial, real-estate, renting and business activities J + K
A.6 Other service activities L to P
This so-called A6 grouping of the European activity classification (NACE) is the required level of detail
of the main aggregates tables in the ESA95 transmission programme. This information is therefore
available for annual data for all Member States, and is available for quarterly data for the majority of the
Member States.
2. PRODUCT CLASSIFICATION
The product classification used in the EAAM corresponds to the P.6 grouping of the CPA classification
specified in the ESA95. It has been amended to include three categories that are needed to make
adjustments with regards to the valuation of imports and corrections to the final consumption estimates
with regards to non-residents. These are reflected as codes G.7 through to G.9. Besides, an item is
included, non-specified products, that is used to classify items that cannot be assigned to any of the other
categories. CPA categories are closely compatible with the NACE classification, and the P6 CPA
grouping formally corresponds to the A6 NACE grouping.
27ECB
Work ing Paper Ser ie s No . 356May 2004
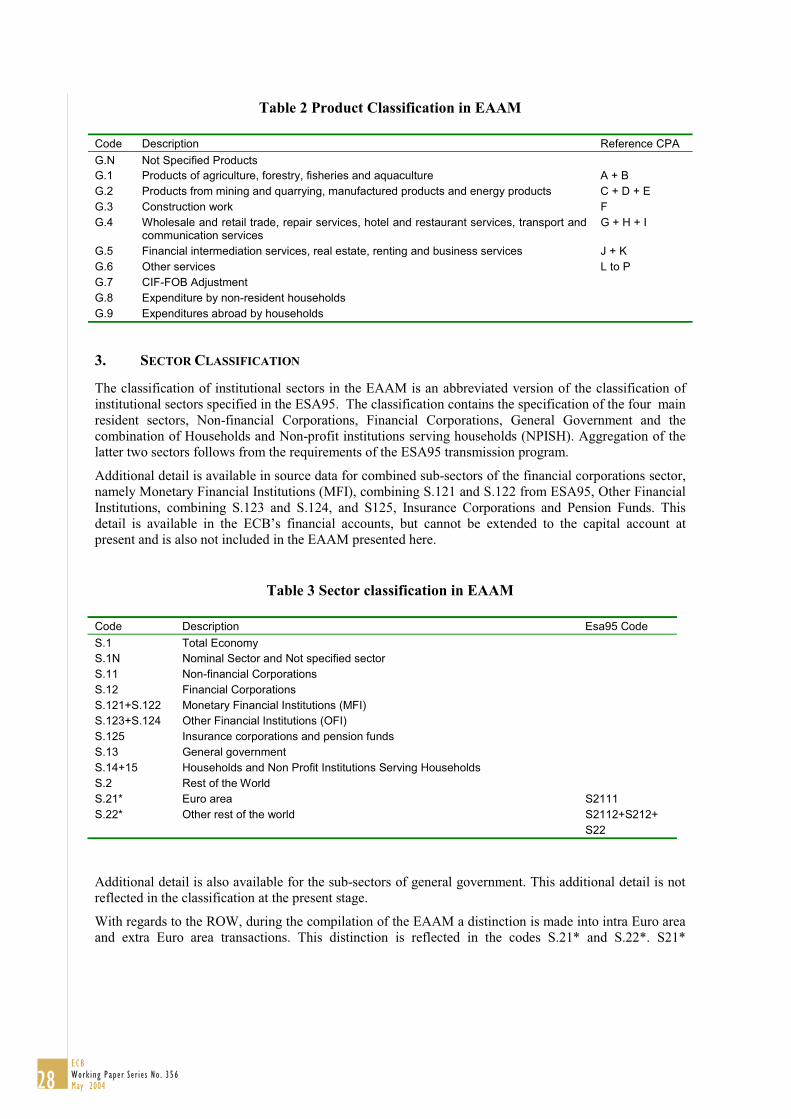
Table 2 Product Classification in EAAM
Code Description Reference CPA
G.N Not Specified Products
G.1 Products of agriculture, forestry, fisheries and aquaculture A + B
G.2 Products from mining and quarrying, manufactured products and energy products C + D + E
G.3 Construction work F
G.4 Wholesale and retail trade, repair services, hotel and restaurant services, transport and
communication services
G + H + I
G.5 Financial intermediation services, real estate, renting and business services J + K
G.6 Other services L to P
G.7 CIF-FOB Adjustment
G.8 Expenditure by non-resident households
G.9 Expenditures abroad by households
3. SECTOR CLASSIFICATION
The classification of institutional sectors in the EAAM is an abbreviated version of the classification of
institutional sectors specified in the ESA95. The classification contains the specification of the four main
resident sectors, Non-financial Corporations, Financial Corporations, General Government and the
combination of Households and Non-profit institutions serving households (NPISH). Aggregation of the
latter two sectors follows from the requirements of the ESA95 transmission program.
Additional detail is available in source data for combined sub-sectors of the financial corporations sector,
namely Monetary Financial Institutions (MFI), combining S.121 and S.122 from ESA95, Other Financial
Institutions, combining S.123 and S.124, and S125, Insurance Corporations and Pension Funds. This
detail is available in the ECB’s financial accounts, but cannot be extended to the capital account at
present and is also not included in the EAAM presented here.
Table 3 Sector classification in EAAM
Code Description Esa95 Code
S.1 Total Economy
S.1N Nominal Sector and Not specified sector
S.11 Non-financial Corporations
S.12 Financial Corporations
S.121+S.122 Monetary Financial Institutions (MFI)
S.123+S.124 Other Financial Institutions (OFI)
S.125 Insurance corporations and pension funds
S.13 General government
S.14+15 Households and Non Profit Institutions Serving Households
S.2 Rest of the World
S.21* Euro area S2111
S.22* Other rest of the world S2112+S212+
S22
Additional detail is also available for the sub-sectors of general government. This additional detail is not
reflected in the classification at the present stage.
With regards to the ROW, during the compilation of the EAAM a distinction is made into intra Euro area
and extra Euro area transactions. This distinction is reflected in the codes S.21* and S.22*. S21*
28ECBWork ing Paper Ser ie s No . 356May 2004
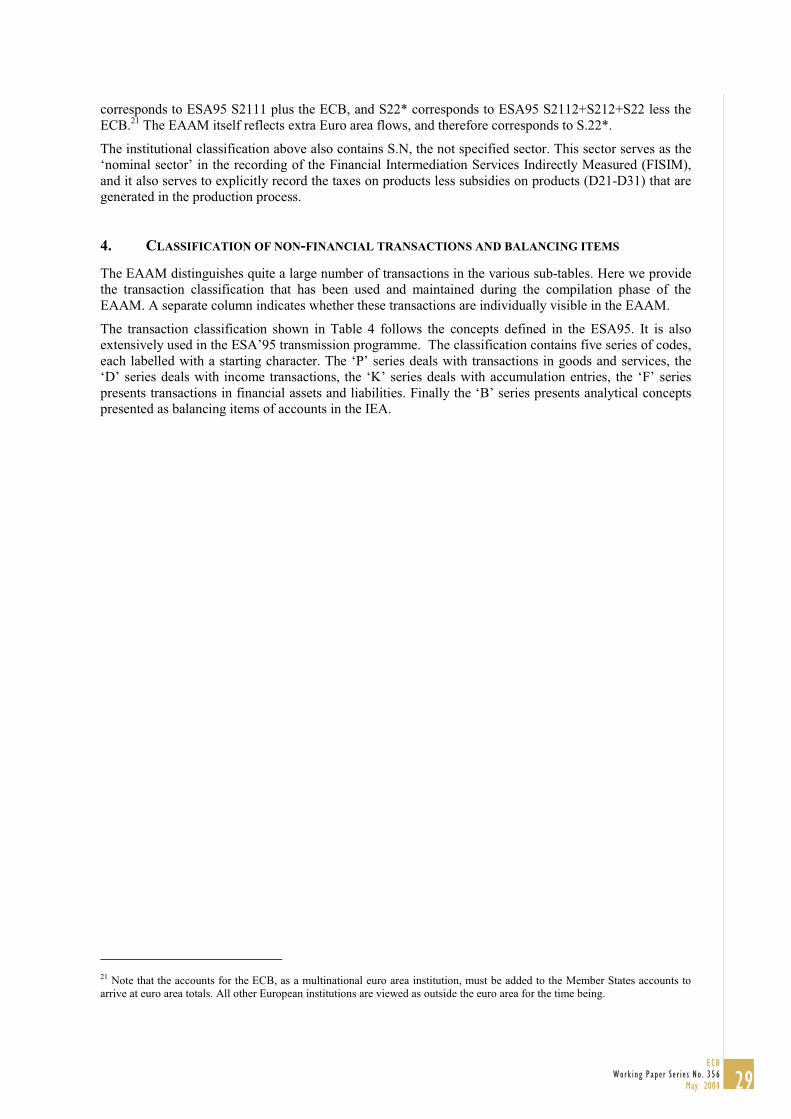
corresponds to ESA95 S2111 plus the ECB, and S22* corresponds to ESA95 S2112+S212+S22 less the
ECB.21
The EAAM itself reflects extra Euro area flows, and therefore corresponds to S.22*.
The institutional classification above also contains S.N, the not specified sector. This sector serves as the
‘nominal sector’ in the recording of the Financial Intermediation Services Indirectly Measured (FISIM),
and it also serves to explicitly record the taxes on products less subsidies on products (D21-D31) that are
generated in the production process.
4. CLASSIFICATION OF NON-FINANCIAL TRANSACTIONS AND BALANCING ITEMS
The EAAM distinguishes quite a large number of transactions in the various sub-tables. Here we provide
the transaction classification that has been used and maintained during the compilation phase of the
EAAM. A separate column indicates whether these transactions are individually visible in the EAAM.
The transaction classification shown in Table 4 follows the concepts defined in the ESA95. It is also
extensively used in the ESA’95 transmission programme. The classification contains five series of codes,
each labelled with a starting character. The ‘P’ series deals with transactions in goods and services, the
‘D’ series deals with income transactions, the ‘K’ series deals with accumulation entries, the ‘F’ series
presents transactions in financial assets and liabilities. Finally the ‘B’ series presents analytical concepts
presented as balancing items of accounts in the IEA.
21Note that the accounts for the ECB, as a multinational euro area institution, must be added to the Member States accounts to
arrive at euro area totals. All other European institutions are viewed as outside the euro area for the time being.
29ECB
Work ing Paper Ser ie s No . 356May 2004
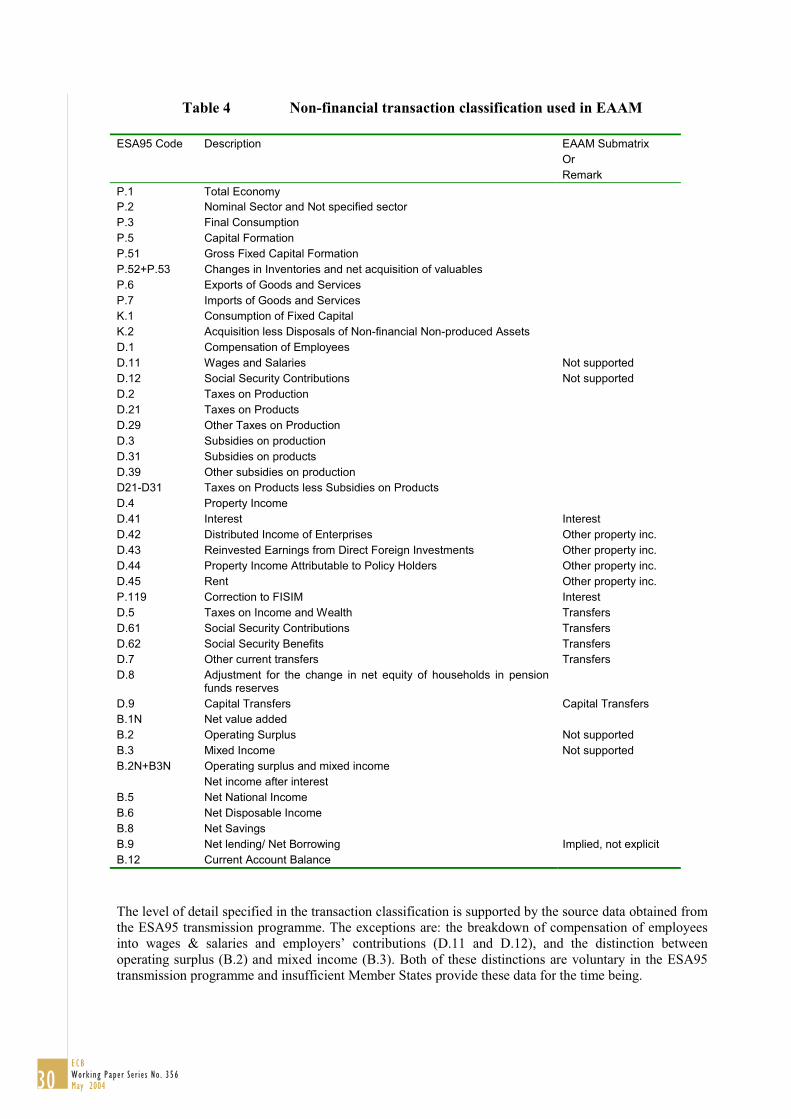
Table 4 Non-financial transaction classification used in EAAM
ESA95 Code Description EAAM Submatrix
Or
Remark
P.1 Total Economy
P.2 Nominal Sector and Not specified sector
P.3 Final Consumption
P.5 Capital Formation
P.51 Gross Fixed Capital Formation
P.52+P.53 Changes in Inventories and net acquisition of valuables
P.6 Exports of Goods and Services
P.7 Imports of Goods and Services
K.1 Consumption of Fixed Capital
K.2 Acquisition less Disposals of Non-financial Non-produced Assets
D.1 Compensation of Employees
D.11 Wages and Salaries Not supported
D.12 Social Security Contributions Not supported
D.2 Taxes on Production
D.21 Taxes on Products
D.29 Other Taxes on Production
D.3 Subsidies on production
D.31 Subsidies on products
D.39 Other subsidies on production
D21-D31 Taxes on Products less Subsidies on Products
D.4 Property Income
D.41 Interest Interest
D.42 Distributed Income of Enterprises Other property inc.
D.43 Reinvested Earnings from Direct Foreign Investments Other property inc.
D.44 Property Income Attributable to Policy Holders Other property inc.
D.45 Rent Other property inc.
P.119 Correction to FISIM Interest
D.5 Taxes on Income and Wealth Transfers
D.61 Social Security Contributions Transfers
D.62 Social Security Benefits Transfers
D.7 Other current transfers Transfers
D.8 Adjustment for the change in net equity of households in pension
funds reserves
D.9 Capital Transfers Capital Transfers
B.1N Net value added
B.2 Operating Surplus Not supported
B.3 Mixed Income Not supported
B.2N+B3N Operating surplus and mixed income
Net income after interest
B.5 Net National Income
B.6 Net Disposable Income
B.8 Net Savings
B.9 Net lending/ Net Borrowing Implied, not explicit
B.12 Current Account Balance
The level of detail specified in the transaction classification is supported by the source data obtained from
the ESA95 transmission programme. The exceptions are: the breakdown of compensation of employees
into wages & salaries and employers’ contributions (D.11 and D.12), and the distinction between
operating surplus (B.2) and mixed income (B.3). Both of these distinctions are voluntary in the ESA95
transmission programme and insufficient Member States provide these data for the time being.
30ECBWork ing Paper Ser ie s No . 356May 2004

5. CLASSIFICATION OF TRANSACTIONS IN FINANCIAL INSTRUMENTS
The classification of transactions in financial instruments is presented in Table 5. It lists the level of
transaction detail currently available from the ECB’s Monetary Union Financial Accounts. Some of these
transaction categories are not supported by the balance of payments (BoP) statistics and thus the
associated classification detail had to be suppressed in the EAAM.
Table 5 Financial transaction classification used in EAAM
ESA95 Code Description Supported in EAAM
F.1 Monetary Gold and SDR Yes
F.2 Currency and deposits Yes
F.21 Currency No
F.22 Transferable deposits No
F.29 Other deposits No
F.3 Securities other than shares Yes
F.31 Securities other than shares, excluding financial derivatives Yes
F.34 Financial derivatives Yes
F.4 Loans Yes
F.41 Short-term - Loans Yes
F.42 Long-term - Loans Yes
F.5 Shares and other equity, excluding mutual funds shares Yes
F.51 Shares and other equity, excluding mutual funds shares No
F.52 Mutual funds shares No
F.6 Insurance technical reserves Yes
F.61 Net equity of households in life insurance reserves and in pension
funds reserves
Yes
F.62 Prepayments of insurance premiums and reserves for outstanding
claims
Yes
F.7 Other accounts receivable/payable Yes
31ECB
Work ing Paper Ser ie s No . 356May 2004
ANNEX 3
STATISTICAL SOURCES TO COMPILE THE EAAM
The EAAM has been compiled for the year 1999. As this is not a very recent year, this pilot
EAAM can have only limited relevance to the analysis of monetary policy transmission in the
euro area. Yet, it can provide a useful perspective if an EAAM for a more recent year is compiled
at a later stage. The choice of the reference year depends on the data availability that increases
considerably for years further (but not too far) away in the past. Likewise, the choice for an
annual instead of a quarterly EAAM has only been made due to the limited scope and coverage of
the existing quarterly data sources in the euro area.
It should also be borne in mind that although many Member States have been compiling sector
accounts and Supply and Use tables, these data have only recently been transmitted to Eurostat.
This Annex lists the main data sources used for the compilation of the EAAM. Conceptually, the
compilation ought to start from a full set of Supply and Use tables and Integrated Economic
Accounts (Non Financial and Financial Sector Accounts) for all Member States. These are
indeed the main sources used for the compilation of the EAAM and they are discussed below.
Subsequently, data sources are described that were needed in addition, in order to complete the
accounts or to provide additional detail that was not available from the main data sources.
A final section in this annex explores the possibility that quarterly data sources currently under
development in the EU and the euro area may lead to the possible compilation of quarterly
EAAMs, overcoming the current timeliness problem.
1. ANNUAL NATIONAL SUPPLY AND USE TABLES
The ESA 95 transmission programme contains a provision for the transmission of Supply and Use
tables at a high level of detail (NACE and CPA division level, i.e. A60, P60 grouping). These
tables are to be provided annually, from 1995 onwards. The first transmission of Supply and Use
tables was scheduled for 2002, and initial results became available to users in the second quarter
of 2003.
The transmission delay specified for Supply and Use tables is 36 months, which corresponds with
the final GDP estimates for the Member States. It follows that the most recent Supply and Use
tables to date are the 1999 tables. Member states and Eurostat are currently gaining experience in
the transmission of SUT data and the timeliness of the SUT data may improve in the future.
The current availability of Supply and Use tables is summarised in Table 6 below.
32ECBWork ing Paper Ser ie s No . 356May 2004
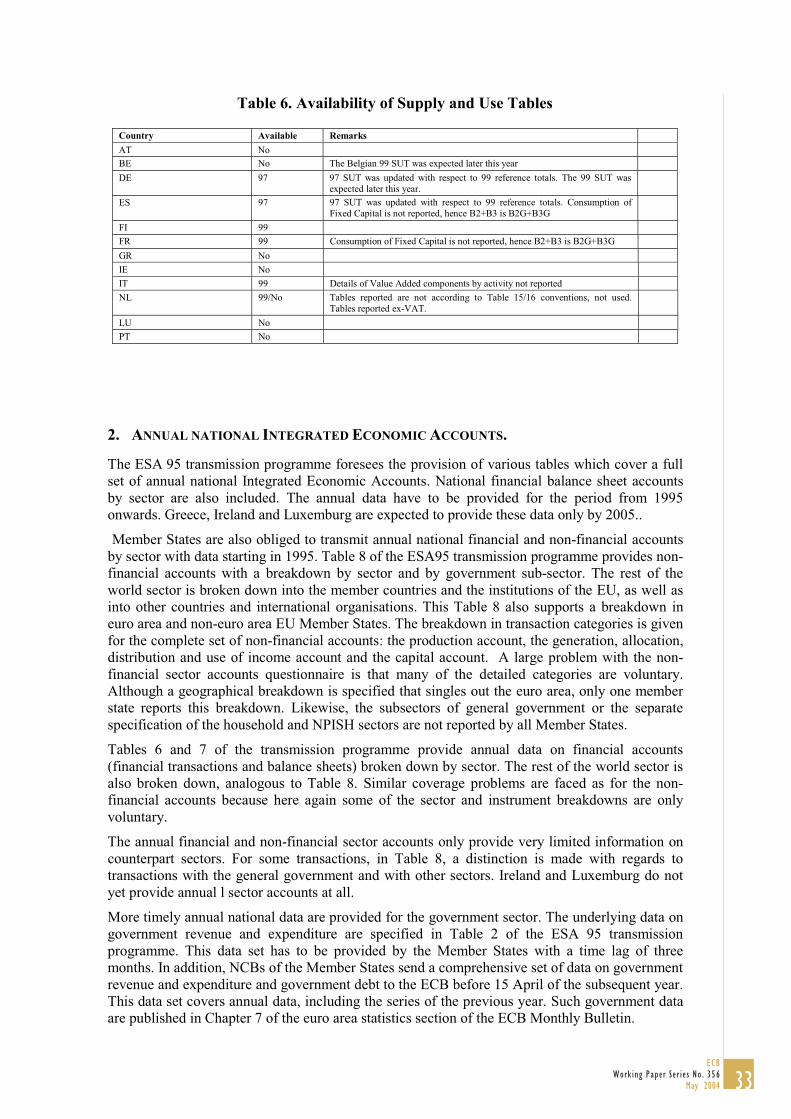
Table 6. Availability of Supply and Use Tables
Country Available Remarks
AT No
BE No The Belgian 99 SUT was expected later this year
DE 97 97 SUT was updated with respect to 99 reference totals. The 99 SUT was
expected later this year.
ES 97 97 SUT was updated with respect to 99 reference totals. Consumption of
Fixed Capital is not reported, hence B2+B3 is B2G+B3G
FI 99
FR 99 Consumption of Fixed Capital is not reported, hence B2+B3 is B2G+B3G
GR No
IE No
IT 99 Details of Value Added components by activity not reported
NL 99/No Tables reported are not according to Table 15/16 conventions, not used.
Tables reported ex-VAT.
LU No
PT No
2. ANNUAL NATIONAL INTEGRATED ECONOMIC ACCOUNTS.
The ESA 95 transmission programme foresees the provision of various tables which cover a full
set of annual national Integrated Economic Accounts. National financial balance sheet accounts
by sector are also included. The annual data have to be provided for the period from 1995
onwards. Greece, Ireland and Luxemburg are expected to provide these data only by 2005..
Member States are also obliged to transmit annual national financial and non-financial accounts
by sector with data starting in 1995. Table 8 of the ESA95 transmission programme provides non-
financial accounts with a breakdown by sector and by government sub-sector. The rest of the
world sector is broken down into the member countries and the institutions of the EU, as well as
into other countries and international organisations. This Table 8 also supports a breakdown in
euro area and non-euro area EU Member States. The breakdown in transaction categories is given
for the complete set of non-financial accounts: the production account, the generation, allocation,
distribution and use of income account and the capital account. A large problem with the non-
financial sector accounts questionnaire is that many of the detailed categories are voluntary.
Although a geographical breakdown is specified that singles out the euro area, only one member
state reports this breakdown. Likewise, the subsectors of general government or the separate
specification of the household and NPISH sectors are not reported by all Member States.
Tables 6 and 7 of the transmission programme provide annual data on financial accounts
(financial transactions and balance sheets) broken down by sector. The rest of the world sector is
also broken down, analogous to Table 8. Similar coverage problems are faced as for the non-
financial accounts because here again some of the sector and instrument breakdowns are only
voluntary.
The annual financial and non-financial sector accounts only provide very limited information on
counterpart sectors. For some transactions, in Table 8, a distinction is made with regards to
transactions with the general government and with other sectors. Ireland and Luxemburg do not
yet provide annual l sector accounts at all.
More timely annual national data are provided for the government sector. The underlying data on
government revenue and expenditure are specified in Table 2 of the ESA 95 transmission
programme. This data set has to be provided by the Member States with a time lag of three
months. In addition, NCBs of the Member States send a comprehensive set of data on government
revenue and expenditure and government debt to the ECB before 15 April of the subsequent year.
This data set covers annual data, including the series of the previous year. Such government data
are published in Chapter 7 of the euro area statistics section of the ECB Monthly Bulletin.
33ECB
Work ing Paper Ser ie s No . 356May 2004
The additional data sources needed for the compilation of the EAAM due to the above-mentioned
lack of coverage and geographical breakdown are described in the following two sections. First,
the additional data sources for the compilation of the non-financial accounts are presented, and
then the additional data sources for the financial accounts. The use of these additional data
sources is further elaborated in Annex 4, which describes the EAAM compilation methodology.
3. ADDITIONAL SOURCES FOR THE NON FINANCIAL ACCOUNTS IN THE EAAM
For the non-financial accounts, various additional data sources had to be used, as described in the
following sub-sections.
3.1 Macro Economic Aggregates
In the ESA 95 transmission programme, an extensive set of tables relating to macro-economic
aggregates is specified. These tables, collectively referred to as ‘Table 1’ of the ESA 95
transmission programme, contain annual and quarterly data, and are by and large mandatory for
all Member States. These tables provide the different breakdowns of GDP (income and
expenditure), employment data, and the calculation of gross national income. The information in
these tables provides reference totals that assist in coverage adjustments for missing countries in
the annual non-financial sector accounts.
3.2 Tables by industry
In the ESA 95 transmission schedule, a set of tables is specified that provide a breakdown by
economic activity (Table 3). This set of tables provides information on output, intermediate
consumption, value added components, etc. They provide data at the level of the A31 breakdown.
The information in these tables has been used for the completion of the Non-Financial Sector
Accounts and for the updating of Supply and Use tables from 1997 to 1999.
3.3 Balance of Payments Statistics
Because of the lack of geographical detail in the ROW account of the non-financial sector
accounts, additional information was obtained from quarterly national Balance of Payments
(BoP) statistics. Published data by Eurostat on annual national BoP statistics (for services and re-
invested earnings) also assisted in the compilation of the EAAM ROW account.
3.4 SAM LEG
Recently, an important initiative on the compilation of EU Social Accounting Matrices came to a
close, namely the SAM Leadership Group (2002). This has led to the publication of a SAM
compilation manual by Eurostat. Members of this group have produced a number of Social
Accounting Matrices for the year 1997. Although data for the two largest euro area Member
States are not included, the transaction matrices obtained from members of the SAM-LEG were
used to assist in the compilation of EAAM transaction matrices by sector and counterpart sector.
34ECBWork ing Paper Ser ie s No . 356May 2004
3.5 ECB Annual Report
The ECB annual report for 2000 was used for the compilation of the ECB non-financial sector
accounts.
4. ADDITIONAL SOURCES FOR THE FINANCIAL ACCOUNTS OF THE EAAM
The statistical sources to compile the financial part of the EAAM are monthly, quarterly and
annual financial data available at the ECB. Integrating these data sets into an accounting
framework for the euro area also enabled quality checks in terms of plausibility and consistency.
4.1 Financial institutions statistics
4.11 Euro area MFI balance sheet statistics
As shown in the ECB Monthly Bulletin (euro area statistics, Chapters 1 and 2), timely and high-
frequent balance sheet and transaction data are available for the Eurosystem (ESA 95 sector
S.121), other euro area monetary financial institutions (other MFIs, S.122), and euro area MFIs
on a consolidated basis (S.121/122). MFI statistics cover monthly and quarterly stocks and
transactions as originally specified in the Regulation (ECB/1998/16)22
concerning the compilation
of the consolidated balance sheet of the MFI sector. The data - available from 1997Q3 onwards -
are broken down by financial instrument, original maturity, institutional sector, currency, and
residency. These balance sheet data are the basis for the compilation of the euro area monetary
aggregates.
In general, transaction data are not directly collected but derived from changes in stocks with
adjustments made to remove the impact of other flows like reclassifications and revaluations23
.
While euro area Member States supply monthly adjustments on ‘reclassifications’ and
revaluations other than exchange rate changes, they have only recently started to report quarterly
adjustments for more detailed sectoral breakdowns necessary for quarterly Monetary Union
Financial accounts (MUFA).
For the compilation of quarterly MUFA, stock and transaction data on currency, deposits and
loans are taken from MFI balance sheet statistics. These time series only see liabilities incurred or
granted by euro area MFIs to the non-monetary euro area sectors.
4.1.2 Statistics on other financial intermediaries and financial auxiliaries
Data on other financial intermediaries, except insurance corporations and pension funds (OFIs),
are needed to monitor their role in financial intermediation, and – together with the MFI and
insurance corporations and pension funds statistics – to provide a comprehensive picture of
financial intermediation in the euro area. Since January 2003, stock data for OFIs are published in
the ECB Monthly Bulletin referring to stock data for investment funds starting in the last quarter
of 1999.
22From January 2003 replaced by Regulation ECB/2001/13 of 22 November 2001.
23For financial transactions, the term ‘true flows’ or ‘flows’ is used in MFI statistics.
35ECB
Work ing Paper Ser ie s No . 356May 2004
4.2 Balance of payments and international investment statistics
Euro area balance of payments and international investment position statistics are based on a
functional approach, which distinguishes direct investment, portfolio investment, financial
derivatives, other investment and reserve assets. Direct investment data are broken down into
equity capital, reinvested earnings and other capital, which mostly refers to inter-company loans.
Both categories are further split by counterpart sector (MFIs and non-MFIs). Portfolio investment
data distinguish between equity and debt instruments (bonds and notes as well as money market
instruments). The breakdown by counterpart sector covers data for the Eurosystem, MFIs, general
government and other sectors. Other investment data provide figures for loans or currency and
deposits, for trade credits and for other assets or liabilities with the same breakdown by
counterpart sector as for the portfolio investment data.
To achieve a complete and consistent integration of balance of payments and international
investment position data into the euro area rest of the world account, recommendations have been
outlined in Annex II of the SNA 93 and in Appendix I of the IMF Balance of Payments Manual,
5th Edition (BPM5) on the “Relationship between the SNA rest of the world account to the
balance of payments accounts and the international investment position.”
For the euro area, the requirements of the SNA 93 and the BPM5 have not yet been fully
implemented and a full 'translation’ of the euro area balance of payments and international
investment position data into the euro area rest of the world accounts is not yet available. The
ECB’s Working Groups on MUFA and on Balance of Payments have already started work to
achieve this.
Specific problems are related to the available instrument breakdowns of data covered by the
direct, portfolio and other investment categories. While some financial instruments can easily be
translated into the euro area rest of the world accounts, others cannot. In particular, a further
breakdown of direct, portfolio and other investment by instrument and original maturity would
help to improve the translation process. For example, transactions in and stocks of shares and
other equity by subcategory are included in direct and portfolio investment as well as in reserve
assets, but not separately specified. The same applies to the transactions in and stocks of
insurance technical reserves and to loans and deposits as part of other investment.
4.3 Capital market statistics
4.3.1 Statistics on securities issues
Securities issues statistics comprise statistics on securities issued by residents of the euro area in
both euro and other currencies, and by non-euro area residents in euro. The database contains
time series at different levels of aggregation according to the residency of the issuer, the issuing
currency and the issuing sector. In relation to the maturity, sector and instrument breakdown,
securities issues statistics conform to ESA 95. The issues of securities other than shares are,
however, recorded at nominal value.
At present, the published data see securities other than shares (debt securities) for which a
breakdown by original maturity (short and long-term), institutional sector (NCBs and ECB, other
MFIs, other financial intermediaries, insurance corporations and pension funds, non-financial
corporations, central government, state and local government, social security funds, and
international institutions) and security type (fixed, floating and zero-coupon) is available.
Moreover, stock data on quoted shares are published with the same sector breakdown.
36ECBWork ing Paper Ser ie s No . 356May 2004
ANNEX 4
EAAM COMPILATION
1. INTRODUCTION
The Euro area Accounting Matrix (EAAM) captures the production structure, the institutional
flows and the financial flows of the euro area. Its structure has been described above. In this
Annex, the construction of the EAAM is described.
The construction of the EAAM is particularly challenging in a number of aspects. In the case of
the National Accounting Matrices (NAM) the point of departure is that the compiling institution
already has elaborated the two component NA frameworks namely the Supply and Use table
(SUT) and the Integrated Economic Accounts (IEA) including the financial accounts. The main
challenge of the national compilers is therefore the elaboration of whom-to-whom or transaction
matrices to enable a NAM presentation.
With respect to the EAAM, the point of departure is much less satisfactory than at the national
level. First of all, with respect to the euro area there is at present no complete set of data. With
respect to both SUT and non-financial and financial accounts, coverage of the euro area is
incomplete. Not all Member States provide the relevant data. Therefore the component systems of
the EAAM, the SUT, the Non-Financial Accounts and the Financial Accounts all need to be
completed for coverage. These coverage adjustments are quite large in some respects; for instance
the SUT block in the EAAM is presently based on the data obtained from 5 Member States out of
the 12. With respect to the IEA the coverage is much better; only 3 smaller Member States do not
compile either the non-financial accounts by institutional sector or the financial accounts by
institutional sector.
Secondly, as the source data for the compilation of the EAAM are obtained through the ESA95
transmission programme, certain desirable components of the EAAM could not be fully
elaborated, because the level of transaction detail is not synchronised between the various tables
in the transmission programme. Therefore, particular transaction breakdowns could not be
elaborated, notably labour related income flows in the generation of income account.
Another complication in the compilation of the EAAM is that the euro area needs to be
represented as a single entity, and that SNA93 residency rules need to be re-interpreted with
respect to the euro area. This implies inter-alia that trade, income and financial transactions
between the Member States should not be reflected in the ROW Accounts of the EAAM. It is
therefore necessary to subdivide the ROW account into transactions between MS, the intra euro
area transactions, and transactions of MS with countries that do not belong to the euro area, the
extra euro area transactions. In order to remove the intra-euro area transactions, an additional set
of constraints is enforced on the EAAM, namely that the intra-euro area outgoing flows are equal
to the corresponding intra – euro area incoming flows. The allocation of flows between intra -
euro area and extra – euro area flows is in itself already a challenging task.
A final complication for the EAAM is that the ECB, which is regarded as an international
organisation from a national perspective, is a national organisation from a euro area perspective;
it should now be incorporated as a resident institution.
The compilation of the EAAM therefore includes the work normally done for the compilation of a
NAM, but by necessity it is preceded by the work required to complete the euro area SUT and
IEA, and the compilation of the geographical split.
As yet no regular compilation of euro area SUT or euro area non-financial accounts by
institutional sector has been established and therefore the work on the EAAM reported here is of
a highly experimental nature. Especially this refers to the compilation of transaction matrices,
because to date no detailed transaction matrices are available for the largest Member States.
37ECB
Work ing Paper Ser ie s No . 356May 2004
2. COMPILATION OF THE NON-FINANCIAL IEA BLOCK
The non-financial accounts by institutional sector, or non-financial IEA are the central
component in the EAAM. They connect to the production block (the SUT) as well as to the
Financial Accounts. Also these IEA provide the reference totals for the transaction matrices that
capture the from whom to whom flows required in the EAAM. From the compiled IEA it will be
possible to make a confrontation with the other components in the system, notably the financial
accounts, and to come to an assessment of the statistical discrepancies that arise between the
component data systems.
The source data for the non-financial IEA have been obtained through the ESA95 transmission
programme for 10 out of 12 Member States. Because of the central role of the non-financial IEA
to connect the various components in the EAAM, it is necessary to first compile the non-financial
IEA. Particular problems that were addressed in this process are:
� The IEA data transmitted to Eurostat were subject to consistency and comparability
problems. Adjustments are required to Member States data to make them conform to a
common set of conventions as well as to correct for data transmission errors;
� Although the two missing countries do not have a large impact on euro area GDP (around
1.5%), they seem to have a larger effect on the income transactions that are captured in the
IEA, and therefore on the EAAM. It was necessary to compile synthetic IEA datasets for each
of the two countries that are consistent with the national accounts aggregates and BoP data
published by these Member States
� The ECB is included as part of the MFI sector. It was therefore necessary to compile a set of
integrated non-financial accounts for the ECB.
� Virtually no Member State makes a distinction between intra and extra euro area flows. Such
detail is available from balance of payments statistics, but direct use of the euro area BoP
leads to conceptual and consistency problems. The BoP cannot provide the required detail in
the IEA transaction classification and the use of the euro area BoP data would immediately
introduce discrepancies that are as yet difficult to analyse and correct. It was therefore
necessary to compile an intra-extra euro area split in the ROW accounts of the Member States
using BoP data and a series of assumptions.
2.1 Completion of the Accounts
The compilation of the IEA for the euro area involves the estimation of the impact of two missing
countries, Luxembourg and Ireland. Because of the atypical economic structure of these
countries, it was decided to estimate the IEA for each of these countries separately, and then to
aggregate the results together with the available data on the remaining 10 Member States.
The estimation of the IEA for each of these countries took into account the following available
data
� GDP and its components
� The (highly) aggregated ROW account used for the GNI calculation
� The fully elaborated government sector account
� The Balance of Payments (BOP) data, quarterly and annual.
� The economic structure by institution of a ‘comparable’ country
The estimation was performed in such a way that the resulting estimation is consistent with the
macro economic aggregates and the government sector accounts. As structurally comparable
38ECBWork ing Paper Ser ie s No . 356May 2004
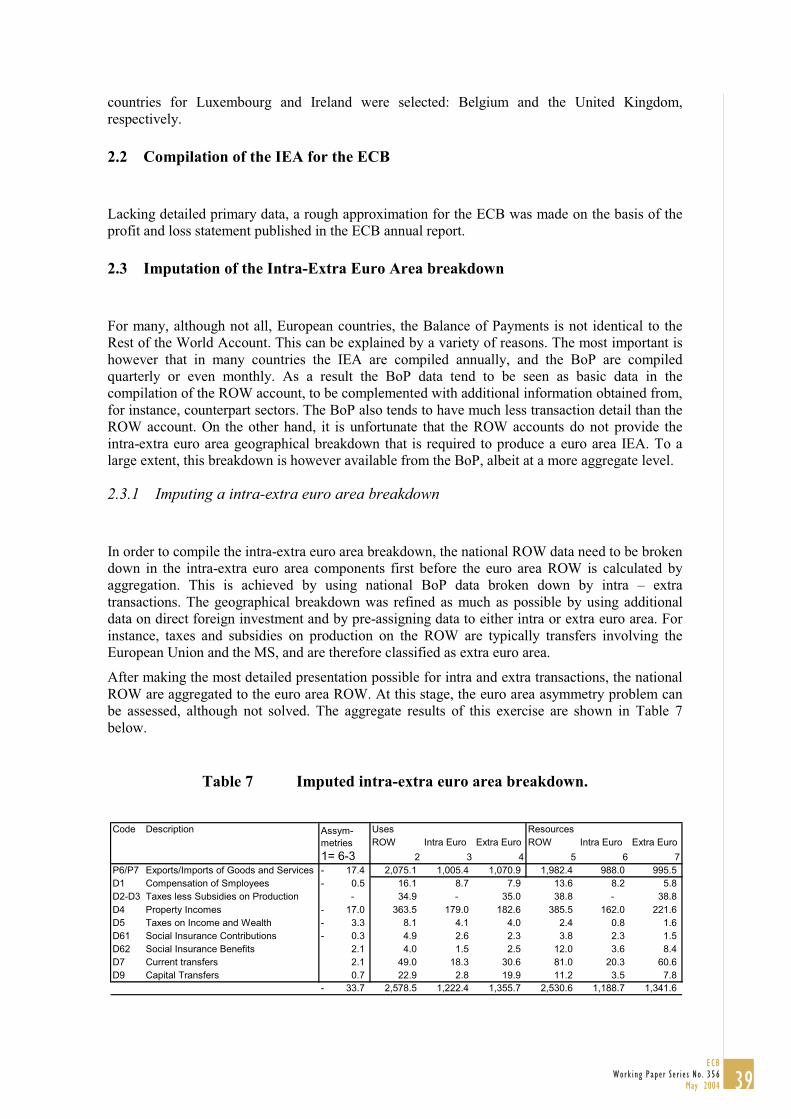
countries for Luxembourg and Ireland were selected: Belgium and the United Kingdom,
respectively.
2.2 Compilation of the IEA for the ECB
Lacking detailed primary data, a rough approximation for the ECB was made on the basis of the
profit and loss statement published in the ECB annual report.
2.3 Imputation of the Intra-Extra Euro Area breakdown
For many, although not all, European countries, the Balance of Payments is not identical to the
Rest of the World Account. This can be explained by a variety of reasons. The most important is
however that in many countries the IEA are compiled annually, and the BoP are compiled
quarterly or even monthly. As a result the BoP data tend to be seen as basic data in the
compilation of the ROW account, to be complemented with additional information obtained from,
for instance, counterpart sectors. The BoP also tends to have much less transaction detail than the
ROW account. On the other hand, it is unfortunate that the ROW accounts do not provide the
intra-extra euro area geographical breakdown that is required to produce a euro area IEA. To a
large extent, this breakdown is however available from the BoP, albeit at a more aggregate level.
2.3.1 Imputing a intra-extra euro area breakdown
In order to compile the intra-extra euro area breakdown, the national ROW data need to be broken
down in the intra-extra euro area components first before the euro area ROW is calculated by
aggregation. This is achieved by using national BoP data broken down by intra – extra
transactions. The geographical breakdown was refined as much as possible by using additional
data on direct foreign investment and by pre-assigning data to either intra or extra euro area. For
instance, taxes and subsidies on production on the ROW are typically transfers involving the
European Union and the MS, and are therefore classified as extra euro area.
After making the most detailed presentation possible for intra and extra transactions, the national
ROW are aggregated to the euro area ROW. At this stage, the euro area asymmetry problem can
be assessed, although not solved. The aggregate results of this exercise are shown in Table 7
below.
Table 7 Imputed intra-extra euro area breakdown.
Code Description Uses Resources
ROW Intra Euro Extra Euro ROW Intra Euro Extra Euro
1= 6-3 2 3 4 5 6 7
P6/P7 Exports/Imports of Goods and Services 17.4- 2,075.1 1,005.4 1,070.9 1,982.4 988.0 995.5
D1 Compensation of Smployees 0.5- 16.1 8.7 7.9 13.6 8.2 5.8
D2-D3 Taxes less Subsidies on Production - 34.9 - 35.0 38.8 - 38.8
D4 Property Incomes 17.0- 363.5 179.0 182.6 385.5 162.0 221.6
D5 Taxes on Income and Wealth 3.3- 8.1 4.1 4.0 2.4 0.8 1.6
D61 Social Insurance Contributions 0.3- 4.9 2.6 2.3 3.8 2.3 1.5
D62 Social Insurance Benefits 2.1 4.0 1.5 2.5 12.0 3.6 8.4
D7 Current transfers 2.1 49.0 18.3 30.6 81.0 20.3 60.6
D9 Capital Transfers 0.7 22.9 2.8 19.9 11.2 3.5 7.8
33.7- 2,578.5 1,222.4 1,355.7 2,530.6 1,188.7 1,341.6
Assym-
metries
39ECB
Work ing Paper Ser ie s No . 356May 2004
2.3.2 Reconciling the euro area integrated economic accounts (EA-IEA)
After obtaining the intra-extra split, the EA-IEA are still consistent with the underlying national
and institutional data sets. However at the level of the euro area, the debit and credit flows (uses
and resources) on the intra euro ROW account do not cancel out, creating the so-called
asymmetry problem. There are many reasons for this problem and there are two possible
approaches for resolving it. The first approach is called the ‘bottom-up’ approach, which requires
countries to compile and assess mirror statistics, and to resolve such problems bilaterally. The
second approach is called the ‘top down’ approach and relies on the use of reconciliation
techniques to remove the asymmetries.
The solution of the asymmetry problem by means of a top-down approach, which is the only
practical short-term solution , can only be applied at the euro area level, and it will have an effect
throughout the EA-IEA. Therefore, the direct link between Member States data sets and the euro
area estimates is broken. Euro area accounts are not equal to the sum of Member States IEA.
In the context of the (non financial) IEA compilation, a top-down method was chosen to reconcile
the asymmetries. The advantage of using a top-down method for the whole of the IEA rather than
its application to BoP data only is evident. Implications of the removal of asymmetries are
immediately reflected in certain types of transactions with certain national sectors and the
plausibility of the allocation of the asymmetries can be assessed immediately.
In the formulation of the balancing procedure, much attention needs to be paid to the construction
of the constraints as well as to the assignment of relative reliabilities. In the context of the EAAM
compilation, it was decided to allow asymmetries to spill over to the euro area extra ROW
account, as well as to the national sectors, except the government sector (in view of its more
extensive and more reliable data coverage in the euro area). A further constraint in the system was
that (given the importance and relative reliability of the GDP/GNI estimates) value added
estimates were fixed. Such additional constraints obviously translate into larger adjustments of
final demand, notably household consumption and capital formation. These adjustments lead to a
larger effect on the household savings rate. The outcome of this ‘top down’ approach is a
consistent set of accounts, but a sensitivity analysis is still required to fully understand and assess
the different outcomes.
40ECBWork ing Paper Ser ie s No . 356May 2004
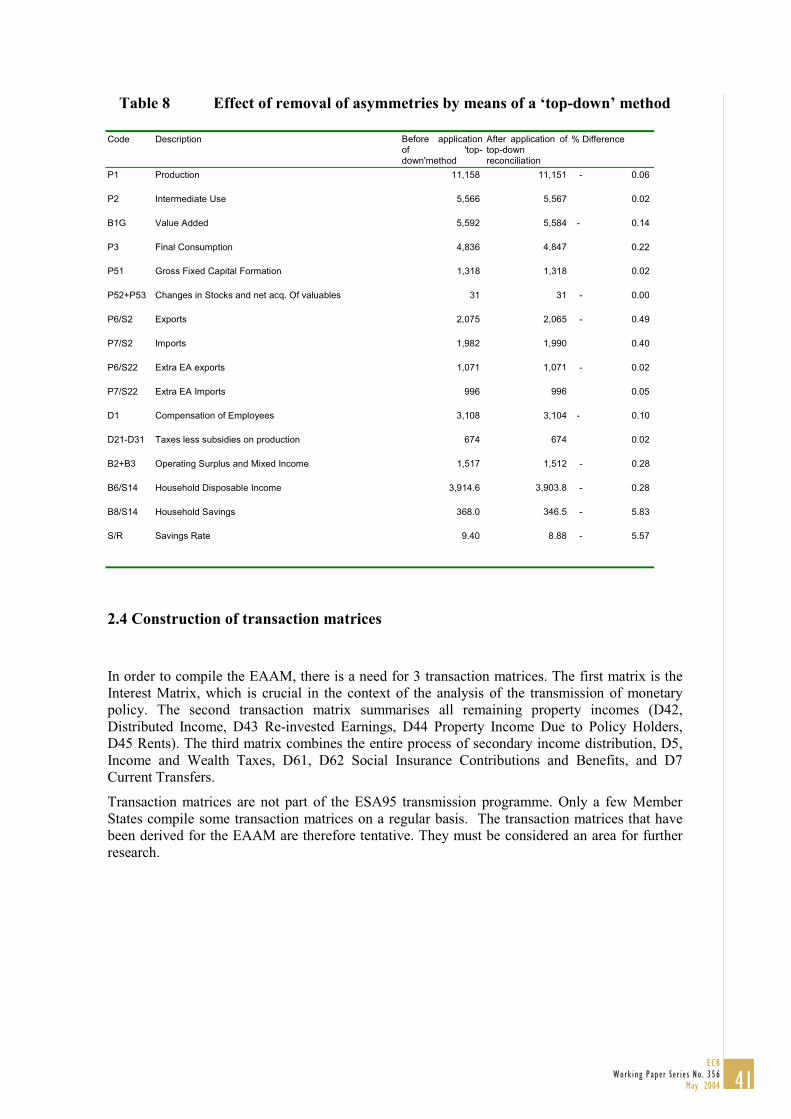
Table 8 Effect of removal of asymmetries by means of a ‘top-down’ method
Code Description Before application
of 'top-
down'method
After application of
top-down
reconciliation
% Difference
P1 Production 11,158 11,151 - 0.06
P2 Intermediate Use 5,566 5,567 0.02
B1G Value Added 5,592 5,584 - 0.14
P3 Final Consumption 4,836 4,847 0.22
P51 Gross Fixed Capital Formation 1,318 1,318 0.02
P52+P53 Changes in Stocks and net acq. Of valuables 31 31 - 0.00
P6/S2 Exports 2,075 2,065 - 0.49
P7/S2 Imports 1,982 1,990 0.40
P6/S22 Extra EA exports 1,071 1,071 - 0.02
P7/S22 Extra EA Imports 996 996 0.05
D1 Compensation of Employees 3,108 3,104 - 0.10
D21-D31 Taxes less subsidies on production 674 674 0.02
B2+B3 Operating Surplus and Mixed Income 1,517 1,512 - 0.28
B6/S14 Household Disposable Income 3,914.6 3,903.8 - 0.28
B8/S14 Household Savings 368.0 346.5 - 5.83
S/R Savings Rate 9.40 8.88 - 5.57
2.4 Construction of transaction matrices
In order to compile the EAAM, there is a need for 3 transaction matrices. The first matrix is the
Interest Matrix, which is crucial in the context of the analysis of the transmission of monetary
policy. The second transaction matrix summarises all remaining property incomes (D42,
Distributed Income, D43 Re-invested Earnings, D44 Property Income Due to Policy Holders,
D45 Rents). The third matrix combines the entire process of secondary income distribution, D5,
Income and Wealth Taxes, D61, D62 Social Insurance Contributions and Benefits, and D7
Current Transfers.
Transaction matrices are not part of the ESA95 transmission programme. Only a few Member
States compile some transaction matrices on a regular basis. The transaction matrices that have
been derived for the EAAM are therefore tentative. They must be considered an area for further
research.
41ECB
Work ing Paper Ser ie s No . 356May 2004
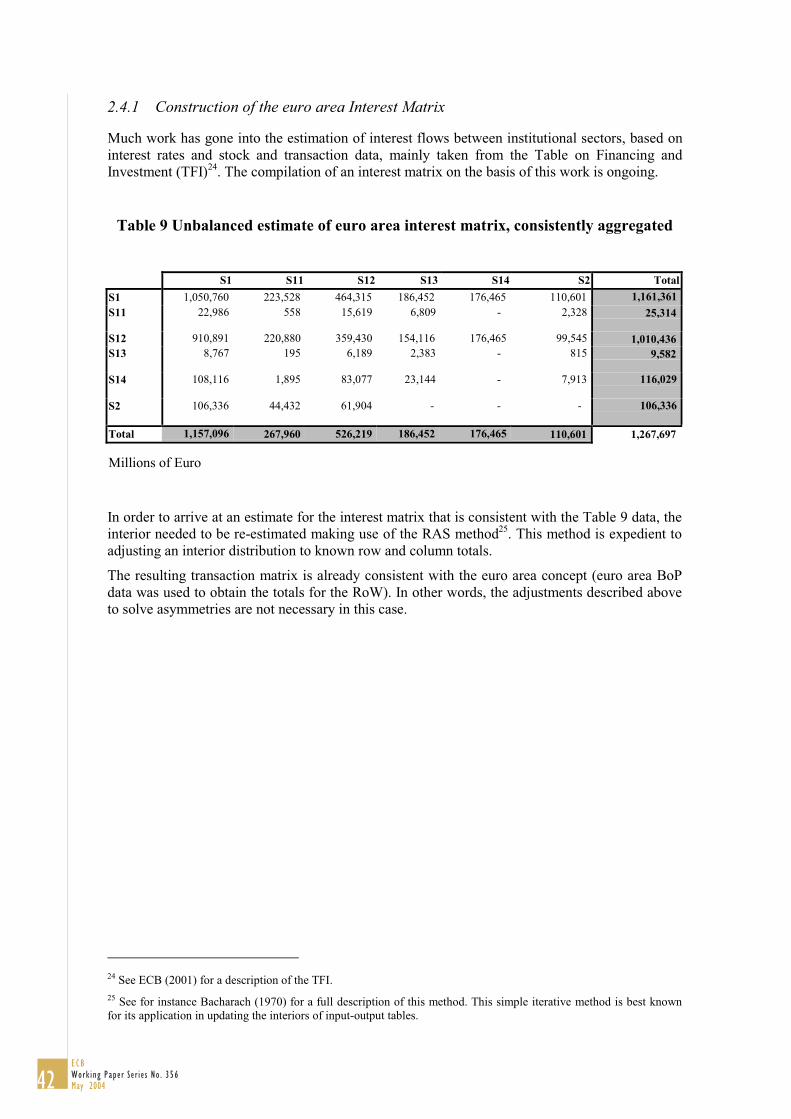
Much work has gone into the estimation of interest flows between institutional sectors, based on
interest rates and stock and transaction data, mainly taken from the Table on Financing and
Investment (TFI)24
. The compilation of an interest matrix on the basis of this work is ongoing.
Table 9 Unbalanced estimate of euro area interest matrix, consistently aggregated
S1 S11 S12 S13 S14 S2 Total
S1 1,050,760 223,528 464,315 186,452 176,465 110,601 1,161,361
S11 22,986 558 15,619 6,809 - 2,328 25,314
S12 910,891 220,880 359,430 154,116 176,465 99,545 1,010,436
S13 8,767 195 6,189 2,383 - 815 9,582
S14 108,116 1,895 83,077 23,144 - 7,913 116,029
S2 106,336 44,432 61,904 - - - 106,336
Total 1,157,096 267,960 526,219 186,452 176,465 110,601 1,267,697
Millions of Euro
In order to arrive at an estimate for the interest matrix that is consistent with the Table 9 data, the
interior needed to be re-estimated making use of the RAS method25
. This method is expedient to
adjusting an interior distribution to known row and column totals.
The resulting transaction matrix is already consistent with the euro area concept (euro area BoP
data was used to obtain the totals for the RoW). In other words, the adjustments described above
to solve asymmetries are not necessary in this case.
24See ECB (2001) for a description of the TFI.
25See for instance Bacharach (1970) for a full description of this method. This simple iterative method is best known
for its application in updating the interiors of input-output tables.
2.4.1 Construction of the euro area Interest Matrix
42ECBWork ing Paper Ser ie s No . 356May 2004
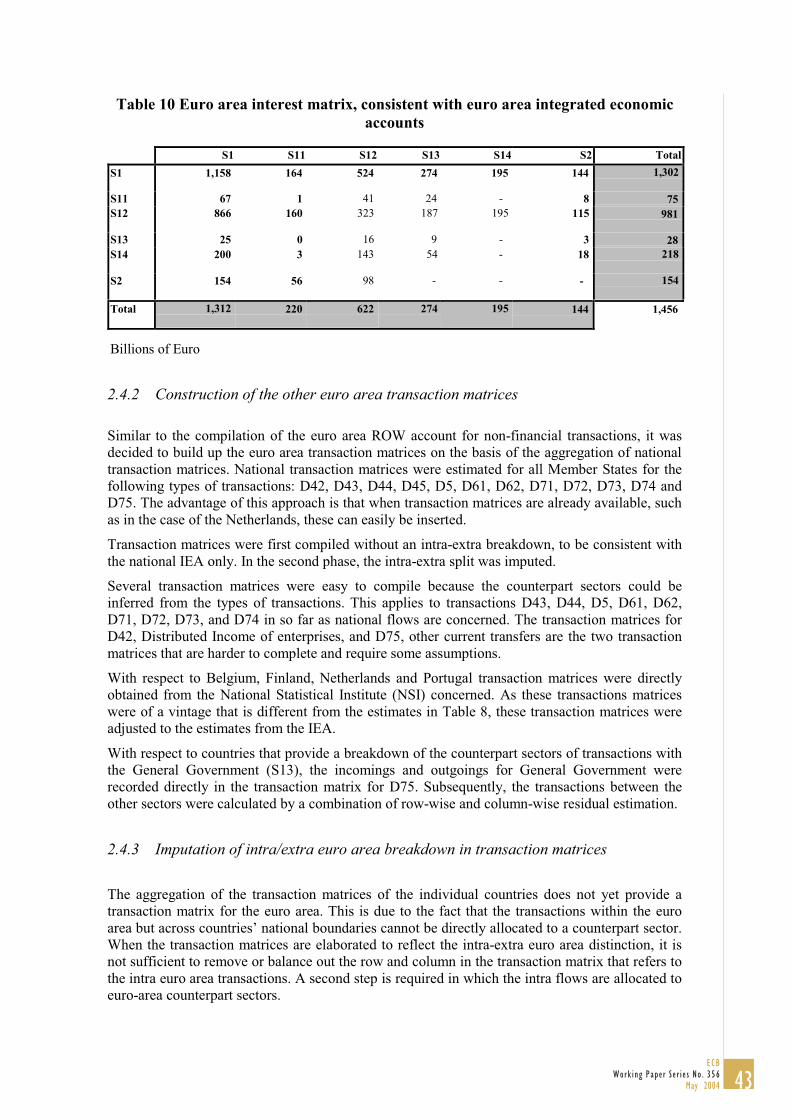
S1 S11 S12 S13 S14 S2 Total
S1 1,158 164 524 274 195 144 1,302
S11 67 1 41 24 - 8 75
S12 866 160 323 187 195 115 981
S13 25 0 16 9 - 3 28
S14 200 3 143 54 - 18 218
S2 154 56 98 - - - 154
Total 1,312 220 622 274 195 144 1,456
Billions of Euro
2.4.2 Construction of the other euro area transaction matrices
Similar to the compilation of the euro area ROW account for non-financial transactions, it was
decided to build up the euro area transaction matrices on the basis of the aggregation of national
transaction matrices. National transaction matrices were estimated for all Member States for the
following types of transactions: D42, D43, D44, D45, D5, D61, D62, D71, D72, D73, D74 and
D75. The advantage of this approach is that when transaction matrices are already available, such
as in the case of the Netherlands, these can easily be inserted.
Transaction matrices were first compiled without an intra-extra breakdown, to be consistent with
the national IEA only. In the second phase, the intra-extra split was imputed.
Several transaction matrices were easy to compile because the counterpart sectors could be
inferred from the types of transactions. This applies to transactions D43, D44, D5, D61, D62,
D71, D72, D73, and D74 in so far as national flows are concerned. The transaction matrices for
D42, Distributed Income of enterprises, and D75, other current transfers are the two transaction
matrices that are harder to complete and require some assumptions.
With respect to Belgium, Finland, Netherlands and Portugal transaction matrices were directly
obtained from the National Statistical Institute (NSI) concerned. As these transactions matrices
were of a vintage that is different from the estimates in Table 8, these transaction matrices were
adjusted to the estimates from the IEA.
With respect to countries that provide a breakdown of the counterpart sectors of transactions with
the General Government (S13), the incomings and outgoings for General Government were
recorded directly in the transaction matrix for D75. Subsequently, the transactions between the
other sectors were calculated by a combination of row-wise and column-wise residual estimation.
2.4.3 Imputation of intra/extra euro area breakdown in transaction matrices
The aggregation of the transaction matrices of the individual countries does not yet provide a
transaction matrix for the euro area. This is due to the fact that the transactions within the euro
area but across countries’ national boundaries cannot be directly allocated to a counterpart sector.
When the transaction matrices are elaborated to reflect the intra-extra euro area distinction, it is
not sufficient to remove or balance out the row and column in the transaction matrix that refers to
the intra euro area transactions. A second step is required in which the intra flows are allocated to
euro-area counterpart sectors.
Table 10 Euro area interest matrix, consistent with euro area integrated economic
accounts
43ECB
Work ing Paper Ser ie s No . 356May 2004
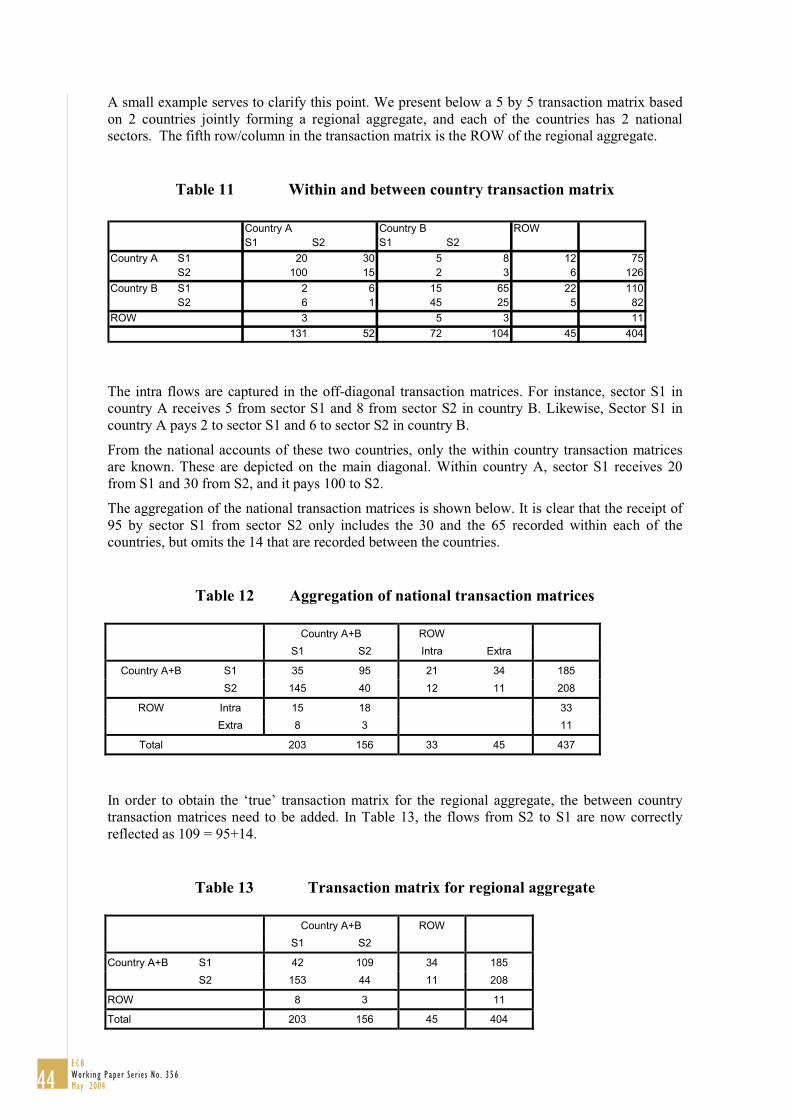
A small example serves to clarify this point. We present below a 5 by 5 transaction matrix based
on 2 countries jointly forming a regional aggregate, and each of the countries has 2 national
sectors. The fifth row/column in the transaction matrix is the ROW of the regional aggregate.
Table 11 Within and between country transaction matrix
Country A Country B ROW
S1 S2 S1 S2
Country A S1 20 30 5 8 12 75
S2 100 15 2 3 6 126
Country B S1 2 6 15 65 22 110
S2 6 1 45 25 5 82
ROW 3 5 3 11
131 52 72 104 45 404
The intra flows are captured in the off-diagonal transaction matrices. For instance, sector S1 in
country A receives 5 from sector S1 and 8 from sector S2 in country B. Likewise, Sector S1 in
country A pays 2 to sector S1 and 6 to sector S2 in country B.
From the national accounts of these two countries, only the within country transaction matrices
are known. These are depicted on the main diagonal. Within country A, sector S1 receives 20
from S1 and 30 from S2, and it pays 100 to S2.
The aggregation of the national transaction matrices is shown below. It is clear that the receipt of
95 by sector S1 from sector S2 only includes the 30 and the 65 recorded within each of the
countries, but omits the 14 that are recorded between the countries.
Table 12 Aggregation of national transaction matrices
Country A+B ROW
S1 S2 Intra Extra
Country A+B S1 35 95 21 34 185
S2 145 40 12 11 208
ROW Intra 15 18 33
Extra 8 3 11
Total 203 156 33 45 437
In order to obtain the ‘true’ transaction matrix for the regional aggregate, the between country
transaction matrices need to be added. In Table 13, the flows from S2 to S1 are now correctly
reflected as 109 = 95+14.
Table 13 Transaction matrix for regional aggregate
Country A+B ROW
S1 S2
Country A+B S1 42 109 34 185
S2 153 44 11 208
ROW 8 3 11
Total 203 156 45 404
44ECBWork ing Paper Ser ie s No . 356May 2004
It is clear therefore that the transaction matrices for D42..D45 and D5..D7 used in the EAAM
need to be adjusted to absorb the intra euro area flows as flows between national sectors. This
adjustment is based on the following steps, logically at the level of the euro area transaction
matrix estimates.
� The intra / extra euro breakdown for uses and resources of transactions at the most detailed
level is obtained from the euro area IEA, after the asymmetries have been resolved by means
of the balancing algorithm described above.
� The intra / extra euro area breakdown by counterpart sector is obtained by means of a
proportional allocation and subsequent rebalancing of the transaction matrices.
� The intra flows that are now consistent are extracted from the transaction matrix and used as
reference totals. The distribution of the intra flows across sectors and counterpart sectors is
obtained on the basis of the assumption that the available distribution of the flows between
national sectors is also representative for flows between sectors and counterpart sectors
located in two different countries of the euro area. This allocation is made using the RAS
method.
3. COMPILATION OF THE SUT BLOCK
The estimation of the SUT component for the EAAM uses two data sources. The first data source
concerns the SUT tables obtained under the ESA95 transmission programme as tables 15 and 16.
The second data source is the macroeconomic aggregates provided by all Member States under
table 1 of the transmission programme.
Because of the conformity of the SUTs transmitted to Eurostat, it is possible to aggregate them to
a partial European Aggregate. Currently, identically structured SUTs are available for AT, BE,
DE, FI, FR, IT, PT. With respect to ES and DE, a SUT for 1999 was not available and the
estimation was based on adjusted 1997 SUT’s. Although NL produces SUTs annually, these are
not in conformity with the requirements of Eurostat.
The estimation method itself consists of six steps and divides the work into the construction of
two separate SUTs. The first SUT is the aggregation of the reported SUTs of MS belonging to the
euro area, the second SUT is the estimated SUT for euro area MS for which no SUTs are
available. The latter SUT is estimated based on the structural relationships contained in the
former. After addition of the reported and estimated SUTs a final step is the calculation and
eventual removal of foreign trade asymmetries and the removal of intra flows.
The steps are as follows:
1. Aggregation of available SUT tables. This implies the aggregation of SUT tables for 1999, as
well as the aggregation of updated 1997 SUT tables for those MS for which 1999 tables are
not available.
2. Calculation of grossing up factors on the basis of Table 1 data. These grossing up factors are
specific for individual transactions and individual activities.
3. The grossing up of final consumption of households, export and imports requires that first an
assumption is made with respect to the contribution to final consumption, imports and exports
of the items ‘expenditures abroad by residents’ and ‘consumption of non-residents in the
domestic economy’. These adjustment items are separately grossed up on the basis of
reference data available from Table 5 of the ESA95 transmission programme. The
consumption, exports and imports columns are netted for these adjustment items, and
subsequently the netted values are grossed up. Finally, the final consumption, export and
import columns are recalculated by adding the appropriate adjustment columns. This
45ECB
Work ing Paper Ser ie s No . 356May 2004
treatment is necessary because the missing countries are smaller and therefore the grossing up
factors for imports and exports are much higher than those of final consumption.
4. Calculation of the SUT interiors for the aggregate of the missing countries, with the exception
of the trade and transport margins.
5. Calculation of trade and transport margins for the missing countries. For the available
countries, aggregate trade and transport margins by commodity are computed. These trade
and transport margins are then scaled such that the calculated trade and transport margins are
roughly consistent with total output of the trade and transport sector. The scaling factor
arrived at is 75%. Again, this reflects the importance of external trade for the missing
countries.
6. Reconciliation of Missing Countries SUT using a balancing algorithm.
7. Addition of the aggregated missing countries and aggregate available countries SUTs to a
euro area SUT.
The reconciliation of the missing countries’ SUTs in step 6 involves the application of the Stone
method26
to obtain commodity balances. The model is constructed in such a way that the known
aggregates from table 1 are not altered.
A refinement of the method involves the introduction of additional data on the product
composition of foreign trade and on the commodity composition of household final demand.
Unfortunately, no detailed information on the product composition of output is available for some
non-reporting countries.
3.1 Completion of the Accounts
3.1.1 Estimation of 1999 SUT for DE and ES
The 1999 SUTs for DE and ES were not available yet at the time of writing this article. Because
of the large impact on the euro area total of DE and ES combined, it was decided that the
estimation of 1999 data sets for DE and ES is the preferable procedure.
The procedure for obtaining 1999 SUT estimates for DE and ES is essentially the same. All the
flows in the SUT are related to a corresponding aggregate from ESA95, Table 1. Then the
estimates for the SUT1999 are calculated using the adjustment factor derived from the national
accounts aggregates (NAA) for 1997 and 1999 respectively, and the known data from the
SUT1997:
SUT1999 = NAA1999/NAA1997*SUT1997
The result will be a table that shows commodity imbalances. These are subsequently removed by
means of an automated reconciliation algorithm, which maintains consistency with the known
reference totals.
26The algorithm goes back to Stone et al. (1942). This is a well-known method to resolve discrepancies in national
accounts data, based on a quadratic minimisation problem Its application to a Social Accounting Matrix is described in
Stone (1976)
46ECBWork ing Paper Ser ie s No . 356May 2004
3.1.2 Estimation of the 1999 euro area SUT.
The euro area SUT is estimated on the basis of the available SUTs, by assuming that the
commodity distribution by transaction and activity of the available SUTs is representative for the
commodity distribution by transaction and activity of the missing country SUTs. Obviously, this
is a strong assumption and the method can certainly be improved upon by using wherever
possible additional data broken down by commodity for 1999. This should in principle be
possible for foreign trade (imports and exports of goods and services), private final consumption
by households, etc. At this stage, this approach was not yet pursued.
Therefore, the estimation method for the 1999 euro area SUT roughly follows the same
estimation scheme as the single country estimation for DE and ES. We chose to estimate first a
SUT for the missing countries (ESSUT99), and subsequently to balance this SUT, before adding
the available SUTs (AVSUT99) and obtaining the complete euro area SUT (EASUT). This
allows a separate assessment of the statistical discrepancies and resolution of these errors in the
context of the missing countries. Subsequent to the estimation of the estimated missing country
SUT, the commodity balances need to be resolved whilst maintaining consistency with the euro
area aggregates. This is done by means of the Stone reconciliation algorithm; while taking care
that consistency is maintained with the reference aggregates.
The adjustment factors used to compute the estimated SUT for missing country estimates is given
by:
ESSUT1999 = ESAGGR1999/AVAGGR1999*AVSUT1999
EASUT1999 = AVSUT1999 + ESSUT99
Essentially, the estimate for a flow in the euro area SUT is equal to the corresponding flow for the
SUT for the available countries times a grossing up factor, based on ESA Table 1 data.
3.2 Imputation of the Intra-Extra Euro Area breakdown of trade in goods and
services
The intra-extra breakdown with respect to exports and imports by product is achieved making use
of two additional data sources
� The Eurostat trade database (ComExt)
� Annual BoP published by Eurostat.
These data sources are used to obtain the proportions of intra and extra trade for each of the 6
products, as well as for the adjustment items. It is clear that the intra-extra breakdown thus
arrived at contains asymmetries, which need to be removed at a later stage.
In a second phase, the euro area SUT needs to be made consistent with the euro area sector
accounts using the euro area ROW (extra ROW). This implies adjustments to the SUT block to
make it consistent with the macro economic totals from the sector accounts, while at the same
time the asymmetries need to be removed from the import and export vectors. Because the
discrepancies are relatively minor in comparison to the other flows, it was decided to remove
these by means of a balancing algorithm.
47ECB
Work ing Paper Ser ie s No . 356May 2004
4. COMPILATION OF THE FINANCIAL IEA BLOCK
The source data for the financial IEA have been obtained through the ESA95 transmission
programme (table 6) for 9 out of 12 Member States. Only Greece, Luxembourg and Ireland do
not transmit Table 6 data. On the basis of these data, euro area annual financial and capital
accounts for the non-financial sectors are regularly compiled and published in the ECB Monthly
Bulletin27
.
The data however present the following short-comings that were addressed by using alternative
data sources and making simplifying assumptions:
� Although the missing countries do not have a large impact on euro area GDP, they are
relatively important for certain sectors and/or transactions. This is the case for the financial
sector in Luxembourg or for direct investment in Irish non-financial corporations. Therefore,
the accounts have been completed for the missing countries using alternative data sources,
and only for those sectors/instruments that are particularly affected by the absence of
corresponding country data.
� The ECB has been included using the aggregated MFI balance-sheet data.
� The aggregated rest of the world sector from Table 6 does not correspond to the euro area (9
countries) rest of the world account, as intra-euro area cross-border transactions are not
excluded from the aggregate. Moreover, virtually no Member State makes a distinction
between intra and extra euro area flows. Such detail is available from balance of payments
statistics. However, the BoP cannot be directly used for compiling the rest of the world sector
as the instrument breakdown follows the usual functional classification instead of the one
used in national accounts. Therefore, some assumptions have been used to bridge these
differences.
4.1 Completion of the Accounts
The sum of Table 6 data has been adjusted to account for the data shortcomings in the following
way:
� Deposits held and incurred and loans granted by MFIs have been compiled from the MFIs
balance sheet and transaction statistics. By doing so, the aggregate includes the important
Luxembourg data and the ECB data.
� The flows related to investment funds for Ireland and Luxembourg have been estimated and
added to the ESA Table 6 aggregate. The estimation method has been carried out in different
ways depending on data availability:
� For Ireland, the data on equity portfolio investment in the country from the national
balance of payments has been added to mutual fund shares (F.52) as liabilities. The
implicit assumption is that most of this inflow corresponds to investment funds liabilities.
Conversely, the portfolio investment abroad has been added to the corresponding asset
categories accounting for the investment of the resident investment funds abroad. It is
therefore assumed that the domestic flows for the Irish mutual funds are not important.
� For Luxembourg, the lack of national balance of payments and the availability of stock
data by the end of the year lead to a different strategy. The weight of Luxembourg
investment funds in the total euro area aggregate (according to euro area investment fund
27See ECB (2002) for a description and an analysis of these data.
48ECBWork ing Paper Ser ie s No . 356May 2004
statistics, which cover all 12 countries except Ireland) has been used to gross up the Table
6 data on OFIs. The weight mentioned is around 25% by the end of 1999. For grossing up
the corresponding investment categories, the weight of investment funds in the OFI sector
(according to a survey carried out by the ECB’s Money and Banking Statistics Division)
has also been used.
� Shares and other equity other than mutual fund shares (F.51) issued by Irish and Luxembourg
companies have been estimated by using data on direct investment. Again, the internal
transactions are considered as negligible. As a 1999 BoP for Luxembourg alone is not available,
direct investment has been estimated by applying the weight of Luxembourg in the joint
Belgium/Luxembourg national balance of payments in 2001 to the total 1999 direct investment in
Belgium and Luxembourg. For Ireland, the estimate has been allocated to Non-financial
corporations, whereas for Luxembourg it has been allocated to financial corporations.
� Securities other than shares issued by Irish and Luxembourg companies have been estimated
from the debt portfolio investment in the corresponding country. For Luxembourg, an estimation
of portfolio investment as described above has been carried out.
4.2 Estimation of the euro area rest of the world sector
The euro area BoP has been used to estimate the euro area rest of the world account. For many of
the instrument categories as used in the EAAM (ESA 95 economic categories), a direct link from
the BoP functional categories can be made. For instance, this is the case for equity portfolio
investment that corresponds to shares and other equity (F.50).
However, in most of these cases, a reliable additional breakdown into sub-categories cannot be
carried out. For example this concerns equity portfolio investment, in which the part
corresponding to mutual fund shares cannot be singled out and therefore the split of F.50 into
F.51 and F.52 cannot be done. This is the reason why such breakdown is not shown in the
EAAM.
In the particular case of loans and deposits, the following assumptions have been made:
� Deposits of resident abroad: estimated as the reserve assets other than gold, SDRs and
securities and the other investment in loans/deposits made by the monetary authority and other
resident sectors. The deposits held abroad are taken from MFI balance sheets and transaction
statistics.
� Loans granted by residents to non-residents: estimated as direct investment/other capital and
other investment in loans/deposits made by the general government and the MFIs (except the
deposits held abroad according to MFIs statistics).
� Deposits with residents held abroad: estimated as other investment in loans/deposits liabilities
of MFIs.
� Loans granted by non-residents to residents: estimated as direct investment/other capital in
the euro area and other investment in loans/deposits liabilities of the general government and the
other resident sectors.
49ECB
Work ing Paper Ser ie s No . 356May 2004
302 “Deposit insurance, moral hazard and market monitoring” by R. Gropp and J. Vesala, February 2004.
303 “Fiscal policy events and interest rate swap spreads: evidence from the EU” by A. Afonso and
R. Strauch, February 2004.
304 “Equilibrium unemployment, job flows and inflation dynamics” by A. Trigari, February 2004.
305 “A structural common factor approach to core inflation estimation and forecasting”
by C. Morana, February 2004.
306 “A markup model of inflation for the euro area” by C. Bowdler and E. S. Jansen, February 2004.
307 “Budgetary forecasts in Europe - the track record of stability and convergence programmes”
by R. Strauch, M. Hallerberg and J. von Hagen, February 2004.
308 “International risk-sharing and the transmission of productivity shocks” by G. Corsetti, L. Dedola
and S. Leduc, February 2004.
309 “Monetary policy shocks in the euro area and global liquidity spillovers” by J. Sousa and A. Zaghini,
February 2004.
310 “International equity flows and returns: A quantitative equilibrium approach” by R. Albuquerque,
G. H. Bauer and M. Schneider, February 2004.
311 “Current account dynamics in OECD and EU acceding countries – an intertemporal approach”
by M. Bussière, M. Fratzscher and G. Müller, February 2004.
�������������� ���������������������
������������� ����������������� ����� ���������������� ��� ���������� ��� ��
����!""���#��#���$#
312 “Similarities and convergence in G-7 cycles” by F. Canova, M. Ciccarelli and E. Ortega, February 2004.
313 “The high-yield segment of the corporate bond market: a diffusion modelling approach
for the United States, the United Kingdom and the euro area” by G. de Bondt and D. Marqués,
February 2004.
314 “Exchange rate risks and asset prices in a small open economy” by A. Derviz, March 2004.
315 “Option-implied asymmetries in bond market expectations around monetary policy actions of the ECB”
by S. Vähämaa, March 2004.
50ECBWork ing Paper Ser ie s No . 356May 2004
321 “Frequency domain principal components estimation of fractionally cointegrated processes”
by C. Morana, March 2004.
322 “Modelling inflation in the euro area” by E. S. Jansen, March 2004.
323 “On the indeterminacy of New-Keynesian economics” by A. Beyer and R. E. A. Farmer, March 2004.
324 “Fundamentals and joint currency crises” by P. Hartmann, S. Straetmans and C. G. de Vries, March 2004.
325 “What are the spill-overs from fiscal shocks in Europe? An empirical analysis” by M. Giuliodori
and R. Beetsma, March 2004.
326 “The great depression and the Friedman-Schwartz hypothesis” by L. Christiano, R. Motto and
M. Rostagno, March 2004.
327 “Diversification in euro area stock markets: country versus industry” by G. A. Moerman, April 2004.
328 “Non-fundamental exchange rate volatility and welfare” by R. Straub and I. Tchakarov, April 2004.
329 “On the determinants of euro area FDI to the United States: the knowledge-capital-Tobin's Q framework,
by R. A. De Santis, R. Anderton and A. Hijzen, April 2004.
330 “The demand for euro area currencies: past, present and future” by B. Fischer, P. Köhler and F. Seitz, April 2004.
331 “How frequently do prices change? evidence based on the micro data underlying the Belgian CPI” by
L. Aucremanne and E. Dhyne, April 2004.
332 “Stylised features of price setting behaviour in Portugal: 1992-2001” by M. Dias, D. Dias
and P. D. Neves, April 2004.
316 “Cooperation in international banking supervision” by C. Holthausen and T. Rønde, March 2004.
317 “Fiscal policy and inflation volatility” by P. C. Rother, March 2004.
318 “Gross job flows and institutions in Europe” by R. Gómez-Salvador, J. Messina and G. Vallanti, March 2004.
319 “Risk sharing through financial markets with endogenous enforcement of trades” by T. V. Köppl, March 2004.
320 “Institutions and service employment: a panel study for OECD countries” by J. Messina, March 2004.
333 “The pricing behaviour of Italian firms: New survey evidence on price stickiness” by
S. Fabiani, A. Gattulli and R. Sabbatini, April 2004.
334 “Is inflation persistence intrinsic in industrial economies?” by A. T. Levin and J. M. Piger, April 2004.
335 “Has eura-area inflation persistence changed over time?” by G. O’Reilly and K. Whelan, April 2004.
336 “The great inflation of the 1970s” by F. Collard and H. Dellas, April 2004.
337 “The decline of activist stabilization policy: Natural rate misperceptions, learning and expectations” by
A. Orphanides and J. C. Williams, April 2004.
51ECB
Work ing Paper Ser ie s No . 356May 2004

338 “The optimal degree of discretion in monetary policy” by S. Athey, A. Atkeson and P. J. Kehoe, April 2004.
339 “Understanding the effects of government spending on consumption” by J. Galí, J. D. López-Salido
and J. Vallés, April 2004.
340 “Indeterminacy with inflation-forecast-based rules in a two-bloc model” by N. Batini, P.Levine
and J. Pearlman, April 2004.
341 “Benefits and spillovers of greater competition in Europe: A macroeconomic assessment” by T. Bayoumi,
D. Laxton and P. Pesenti, April 2004.
342 “Equal size, equal role? Interest rate interdependence between the euro area and the United States” by
M. Ehrmann and M. Fratzscher, April 2004.
343 “Monetary discretion, pricing complementarity and dynamic multiple equilibria” by R. G. King
and A. L. Wolman, April 2004.
344 “Ramsey monetary policy and international relative prices” by E. Faia and T. Monacelli, April 2004.
345 “Optimal monetary and fiscal policy: A linear-quadratic approach” by P. Benigno and M. Woodford, April 2004.
346 “Perpetual youth and endogenous labour supply: a problem and a possible solution” by G. Ascari and
N. Rankin, April 2004.
347 “Firms’ investment decisions in response to demand and price uncertainty” by C. Fuss
and P. Vermeulen, April 2004.
348 “Financial openness and growth: Short-run gain, long-run pain?” by M. Fratzscher and M. Bussiere, April 2004.
349 “Estimating the rank of the spectral density matrix” by G. Camba-Mendez and G. Kapetanios, April 2004.
350 “Exchange-rate policy and the zero bound on nominal interest rates” by G. Camba-Mendez
and G. Kapetanios, April 2004.
351 “Interest rate determination in the interbank market” by V. Gaspar, G. P. Quirós and
H. R. Mendizábal, April 2004.
352 “Forecasting inflation with thick models and neural networks” by P. McNelis and
P. McAdam, April 2004.
353 “Towards the estimation of equilibrium exchange rates for CEE acceding countries: methodological
issues and a panel cointegration perspective” by F. Maeso-Fernandez, C. Osbat and B. Schnatz, April 2004.
354 “Taking stock: monetary policy transmission to equity markets” by M. Ehrmann and M. Fratzscher, May 2004.
355 “Production interdependence and welfare” by K. X. D. Huang and Z. Liu, May 2004.
52ECBWork ing Paper Ser ie s No . 356May 2004

356 “Developing a euro area accounting matrix: issues and applications” by T. Jellema, S. Keuning,
P. McAdam and R. Mink, May 2004.
53ECB
Work ing Paper Ser ie s No . 356May 2004