Embed Size (px)
DESCRIPTION
Developing a Measure of Innovativeness in the North American Forest Products Industry. Chris Knowles Research Assistant, Forest Products Marketing Oregon Wood Innovation Center Wood Science and Engineering Oregon State University Eric Hansen Professor, Forest Products Marketing - PowerPoint PPT Presentation
Citation preview
Wood Science & Engineering - Oregon State University
Developing a Measure of Innovativeness in the North
American Forest Products Industry
Chris KnowlesResearch Assistant, Forest Products Marketing
Oregon Wood Innovation CenterWood Science and Engineering
Oregon State University
Eric HansenProfessor, Forest Products Marketing
Wood Science and EngineeringOregon State University
IUFRO All-Division 5 Conference Thursday, November 1, 2007

Wood Science & Engineering - Oregon State University
Outline
• Study objectives
• Principles of scale development
• Scale development procedure
• Future work

Wood Science & Engineering - Oregon State University
Objective
• To develop a valid and reliable measure of firm innovativeness for firms in industrial manufacturing industries
Wood Science & Engineering - Oregon State University
Why develop a new measure?
• Inconsistent results from previous research
• Largely due to inconsistent measures and/or conceptualizations
• Call for development in previous literature– Deshpande and Farley (2004)– Crespell et al. (2006)
Wood Science & Engineering - Oregon State University
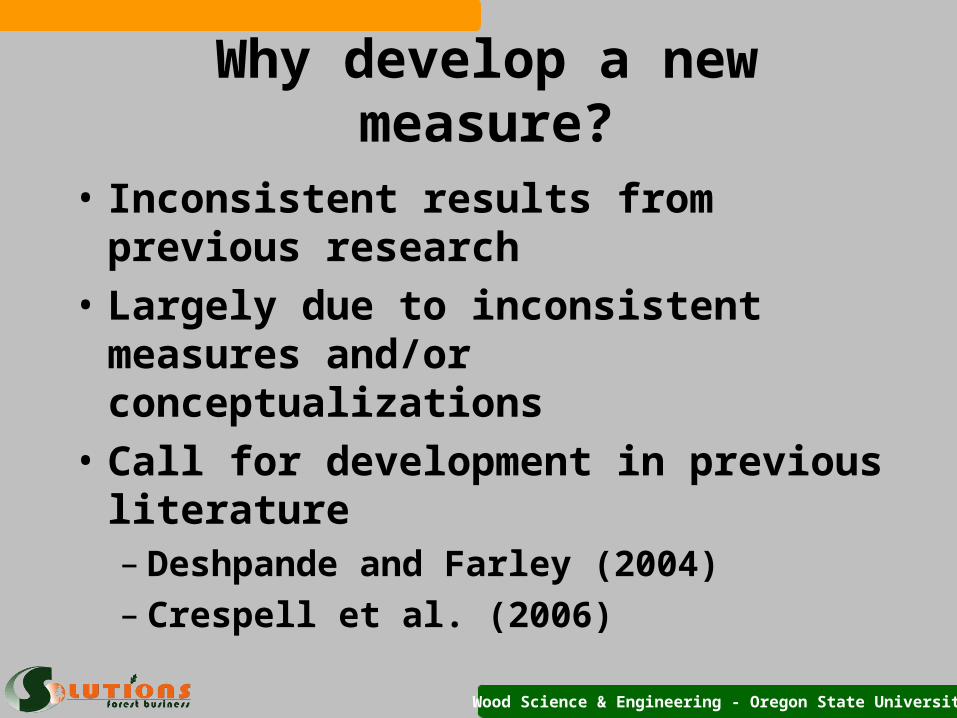
Stage I
Literature review
Identify critical factors of innovativeness
Generation of items
Scale refinement with expert opinions
Questionnairedevelopment
Data collection
Scale refinement
Pretest
Refine questionnaire
Data collection
Scale refinement
Innovativeness instrument
Stage IIA Two-Stage
Approach
Based on: Churchill (1979), DeVellis (2003) and Netermeyer et al. (2003)
Wood Science & Engineering - Oregon State University
In this study, innovativeness is defined as:
The propensity of firms to create and/or adopt new products, processes, and
business systems.
Literature Review

Wood Science & Engineering - Oregon State University
Previous Measures of Innovativeness

Wood Science & Engineering - Oregon State University
Previous Innovativeness Measures
• Current processing technology
• Self-rating
• Intellectual property
• R&D spending
Wood Science & Engineering - Oregon State University
Critical factors of innovativeness
• Wang and Ahmed (2004) identified five aspects of innovativeness– Product– Market– Market– Behavior– Strategic
Wood Science & Engineering - Oregon State University
Critical factors cont.
• Hovgaard and Hansen (2004) identified three aspects– Product– Process– Business systems
• Hansen et al. 2007 confirmed this view
Wood Science & Engineering - Oregon State University
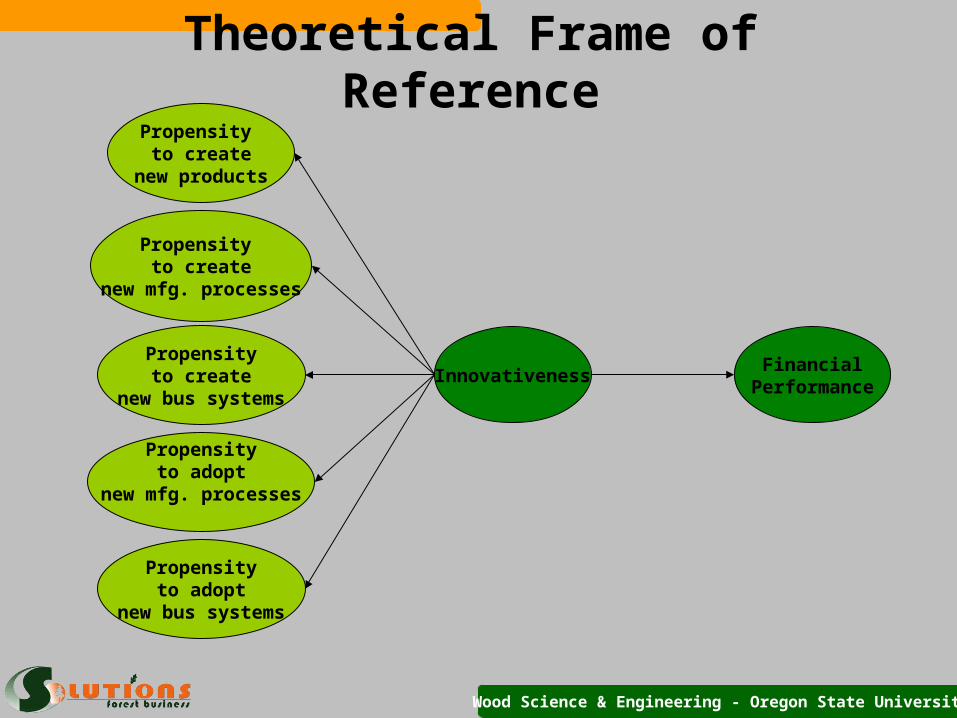
Theoretical Frame of ReferencePropensity
to createnew products
Innovativeness
Propensity to create
new mfg. processes
Propensityto create
new bus systems
Propensityto adopt
new bus systems
Propensityto adopt
new mfg. processes
FinancialPerformance
Wood Science & Engineering - Oregon State University
Generation of items
• 25 items generated
• 5 for each aspect of innovativeness
• Adapted previously developed items when possible

Wood Science & Engineering - Oregon State University
Generation of items
• 25 items generated
• 5 for each aspect of innovativeness
• Adapted previously developed items when possible
Example item for propensity to adopt new processes
Our company tends to be an early adopter of new manufacturing processes.
Wood Science & Engineering - Oregon State University
Scale refinement – expert opinions
• Two stages• Stage 1 – review by Forest Business
Solutions Team• Stage 2 – review by outside experts
– 3 from academia– 3 industry managers– 2 industry consultants
Wood Science & Engineering - Oregon State University
Scale refinement
• Exploratory factor analysis– Allows exploration of data– Don’t specify number of factors– Deletion of items with cross-loading– SPSS
• Confirmatory factor analysis– Used to confirm proposed factor structure– Specify number of factors– LISREL
Netermeyer et al. (2003)
Wood Science & Engineering - Oregon State University
Data collection – Stage I
• 500 sawmills in North America randomly selected from The Big Book
• Target respondent was mill manager
• 53 undeliverables / closed mills
• Adjusted sample size of 447
• 83 mills (18.6%)
Wood Science & Engineering - Oregon State University
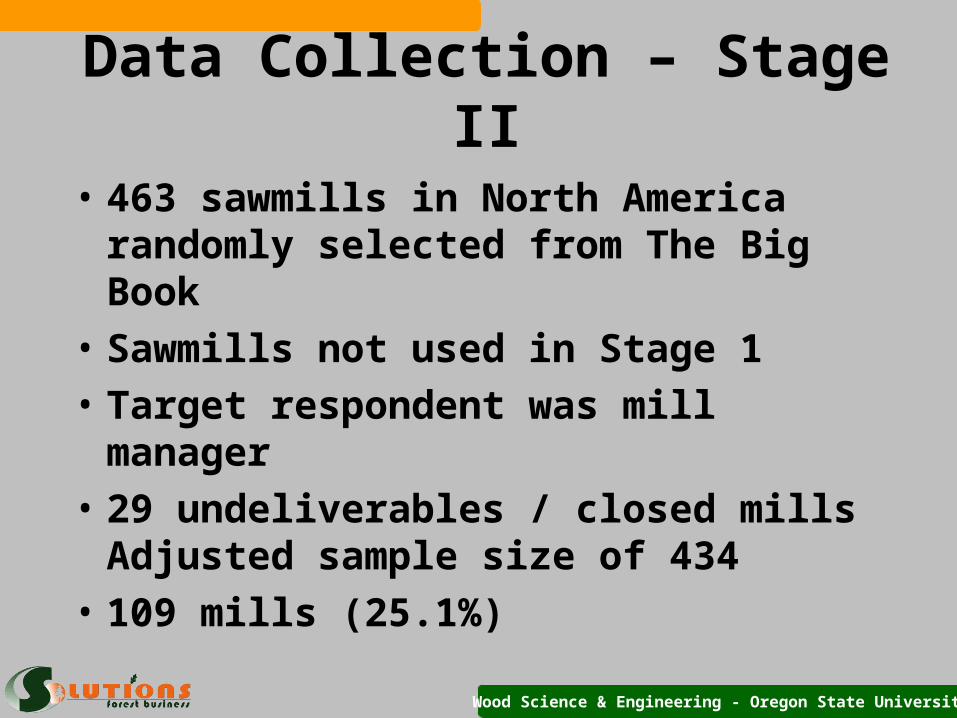
Data Collection – Stage II
• 463 sawmills in North America randomly selected from The Big Book
• Sawmills not used in Stage 1
• Target respondent was mill manager
• 29 undeliverables / closed mills Adjusted sample size of 434
• 109 mills (25.1%)

Wood Science & Engineering - Oregon State University
Stage I
Wood Science & Engineering - Oregon State University
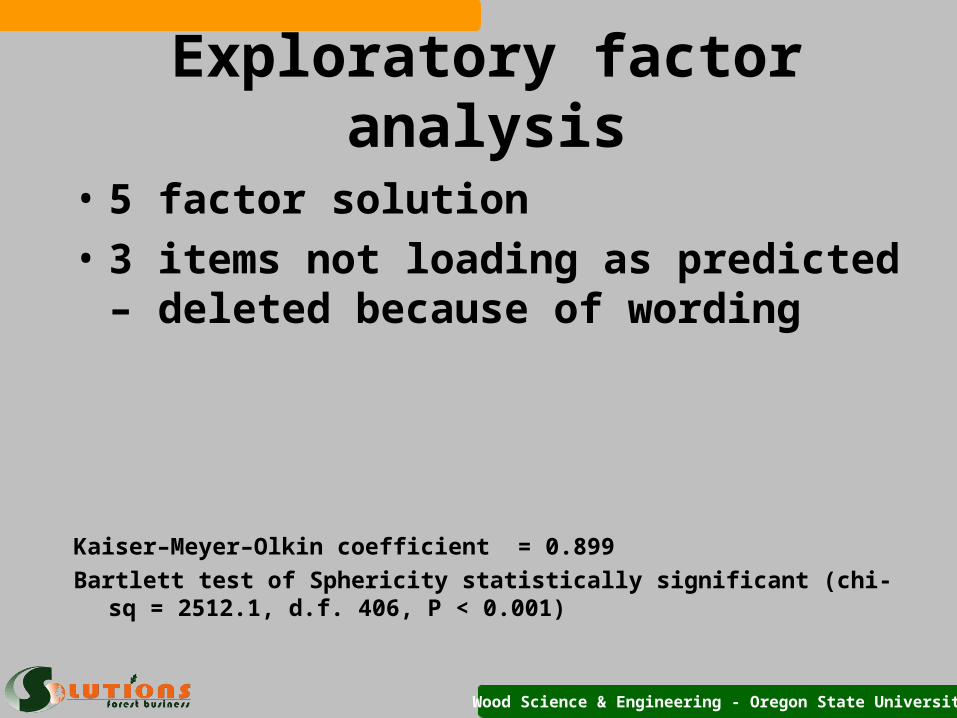
Exploratory factor analysis
• 5 factor solution
• 3 items not loading as predicted – deleted because of wording
Kaiser–Meyer–Olkin coefficient = 0.899
Bartlett test of Sphericity statistically significant (chi-sq = 2512.1, d.f. 406, P < 0.001)
Wood Science & Engineering - Oregon State University
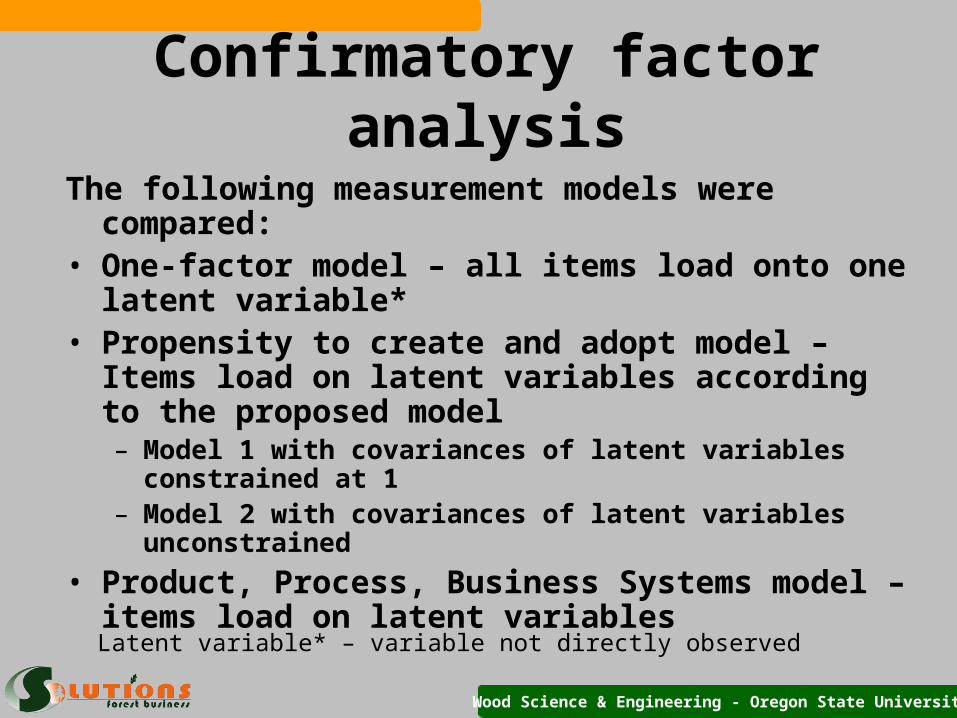
Confirmatory factor analysis
The following measurement models were compared: • One-factor model – all items load onto one latent
variable*• Propensity to create and adopt model – Items load
on latent variables according to the proposed model– Model 1 with covariances of latent variables constrained at
1– Model 2 with covariances of latent variables unconstrained
• Product, Process, Business Systems model – items load on latent variables
Latent variable* – variable not directly observed
Wood Science & Engineering - Oregon State University
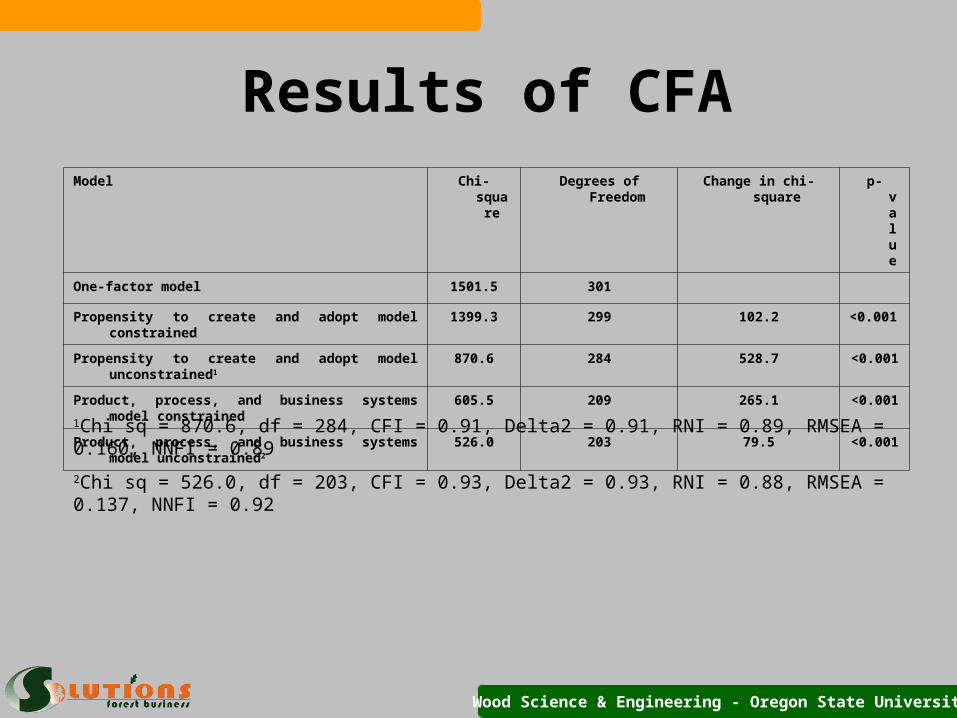
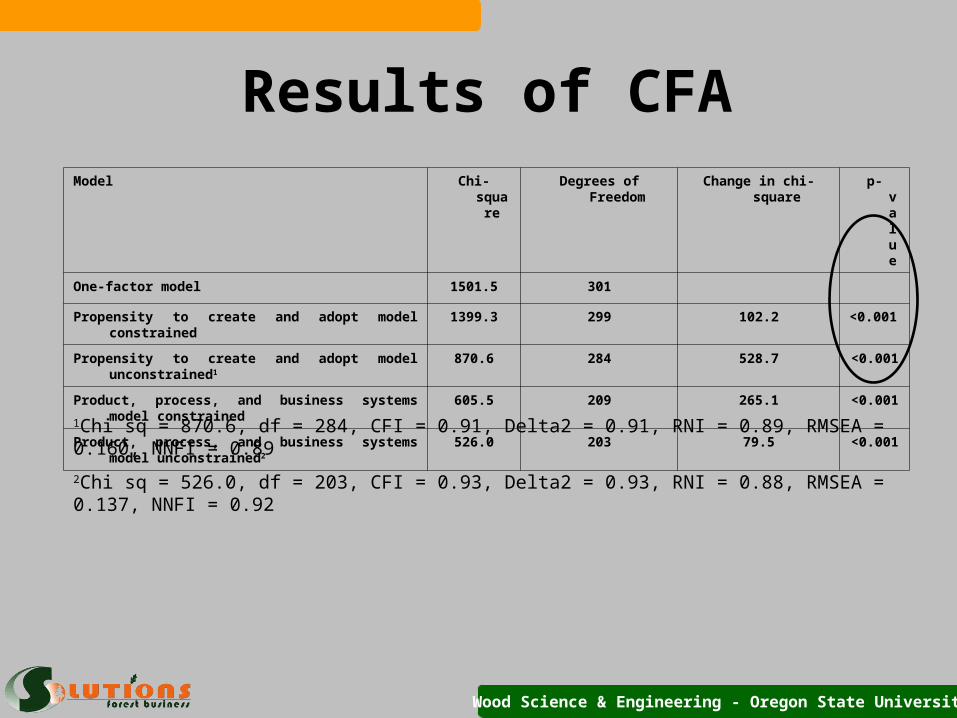
Results of CFAModel Chi-square Degrees of Freedom Change in chi-square p-value
One-factor model 1501.5 301
Propensity to create and adopt model constrained 1399.3 299 102.2 <0.001
Propensity to create and adopt model unconstrained1 870.6 284 528.7 <0.001
Product, process, and business systems model constrained
605.5 209 265.1 <0.001
Product, process, and business systems model unconstrained2
526.0 203 79.5 <0.001
1Chi sq = 870.6, df = 284, CFI = 0.91, Delta2 = 0.91, RNI = 0.89, RMSEA = 0.160, NNFI = 0.89
2Chi sq = 526.0, df = 203, CFI = 0.93, Delta2 = 0.93, RNI = 0.88, RMSEA = 0.137, NNFI = 0.92
Wood Science & Engineering - Oregon State University
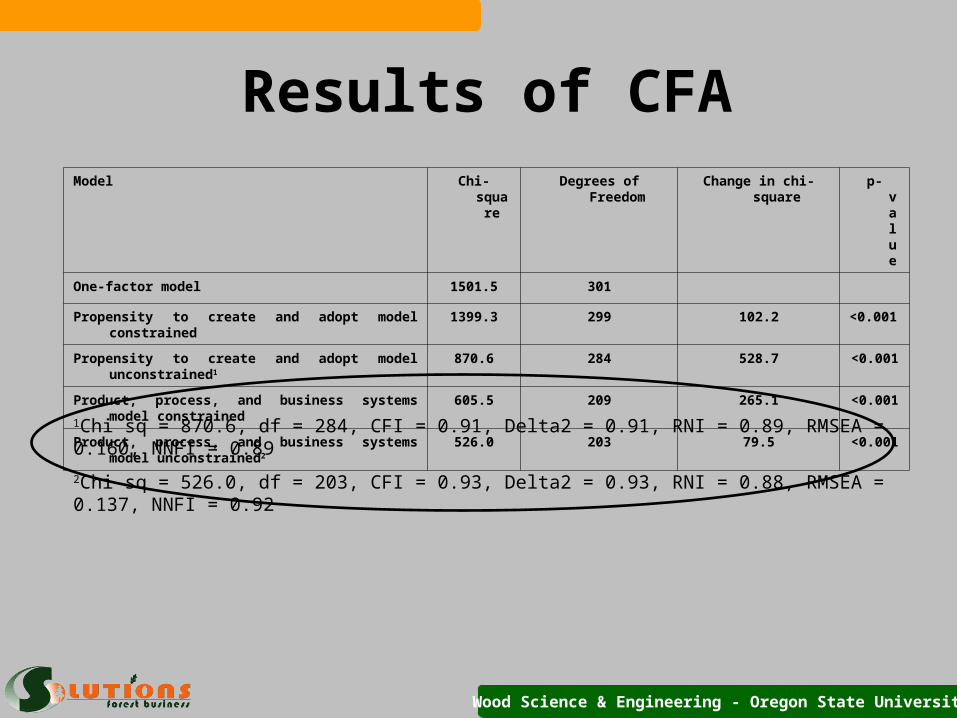
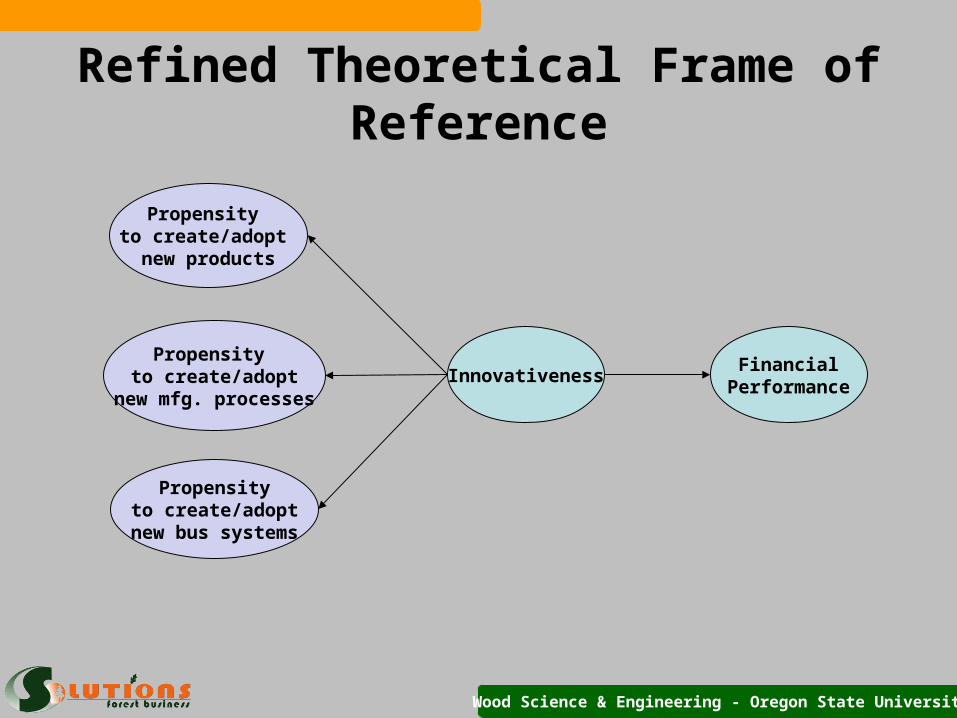
Refined Theoretical Frame of Reference
Propensity to create/adopt new products
InnovativenessPropensity
to create/adoptnew mfg. processes
Propensityto create/adopt
new bus systems
FinancialPerformance

Wood Science & Engineering - Oregon State University
Stage II
Wood Science & Engineering - Oregon State University
Scale Refinement
• Followed procedure used in Stage 1
Wood Science & Engineering - Oregon State University
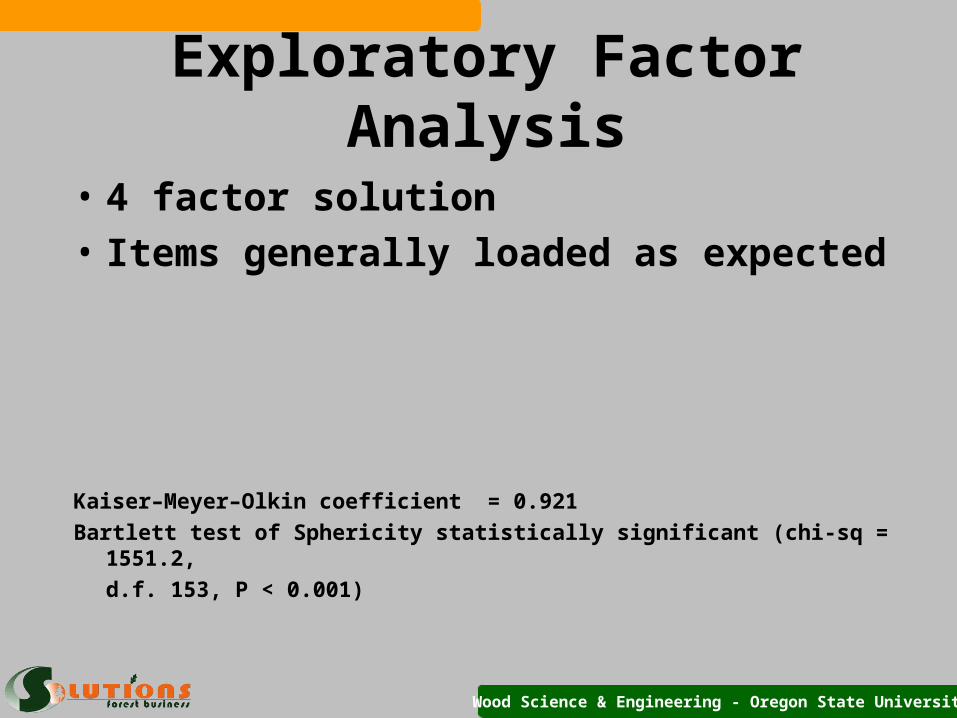
Exploratory Factor Analysis
• 4 factor solution
• Items generally loaded as expected
Kaiser–Meyer–Olkin coefficient = 0.921
Bartlett test of Sphericity statistically significant (chi-sq = 1551.2,
d.f. 153, P < 0.001)
Wood Science & Engineering - Oregon State University
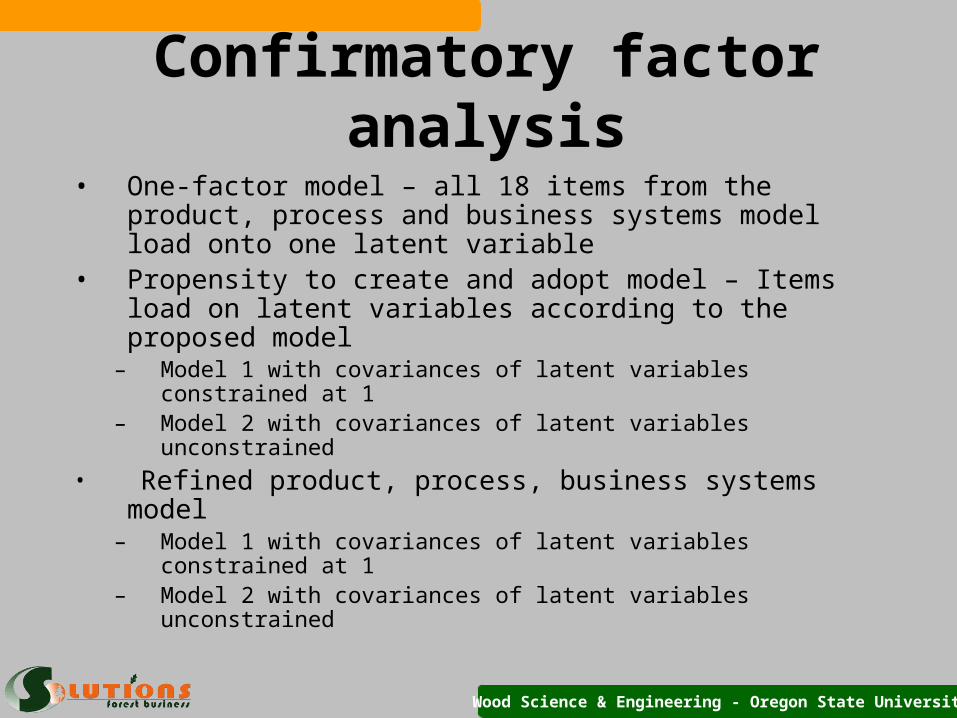
Confirmatory factor analysis
• One-factor model – all 18 items from the product, process and business systems model load onto one latent variable
• Propensity to create and adopt model – Items load on latent variables according to the proposed model
– Model 1 with covariances of latent variables constrained at 1– Model 2 with covariances of latent variables unconstrained
• Refined product, process, business systems model – Model 1 with covariances of latent variables constrained at 1– Model 2 with covariances of latent variables unconstrained

Wood Science & Engineering - Oregon State University
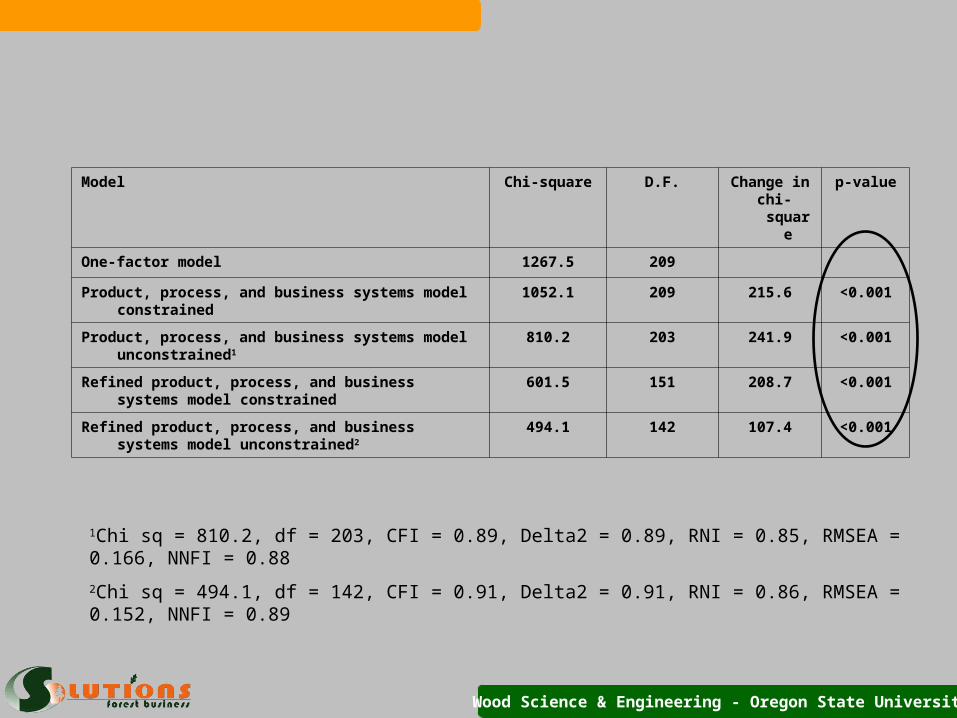
Model Chi-square D.F. Change in chi-square
p-value
One-factor model 1267.5 209
Product, process, and business systems model constrained
1052.1 209 215.6 <0.001
Product, process, and business systems model unconstrained1
810.2 203 241.9 <0.001
Refined product, process, and business systems model constrained
601.5 151 208.7 <0.001
Refined product, process, and business systems model unconstrained2
494.1 142 107.4 <0.001
1Chi sq = 810.2, df = 203, CFI = 0.89, Delta2 = 0.89, RNI = 0.85, RMSEA = 0.166, NNFI = 0.88
2Chi sq = 494.1, df = 142, CFI = 0.91, Delta2 = 0.91, RNI = 0.86, RMSEA = 0.152, NNFI = 0.89
Wood Science & Engineering - Oregon State University
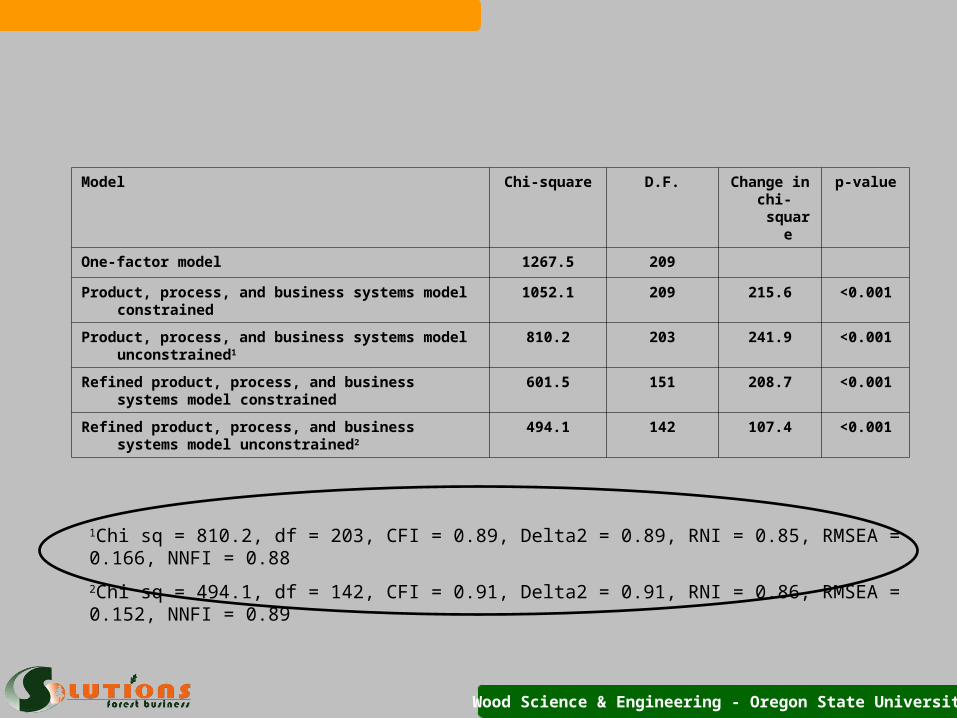
Model Chi-square D.F. Change in chi-square
p-value
One-factor model 1267.5 209
Product, process, and business systems model constrained
1052.1 209 215.6 <0.001
Product, process, and business systems model unconstrained1
810.2 203 241.9 <0.001
Refined product, process, and business systems model constrained
601.5 151 208.7 <0.001
Refined product, process, and business systems model unconstrained2
494.1 142 107.4 <0.001
1Chi sq = 810.2, df = 203, CFI = 0.89, Delta2 = 0.89, RNI = 0.85, RMSEA = 0.166, NNFI = 0.88
2Chi sq = 494.1, df = 142, CFI = 0.91, Delta2 = 0.91, RNI = 0.86, RMSEA = 0.152, NNFI = 0.89
Wood Science & Engineering - Oregon State University
Innovativeness Instrument
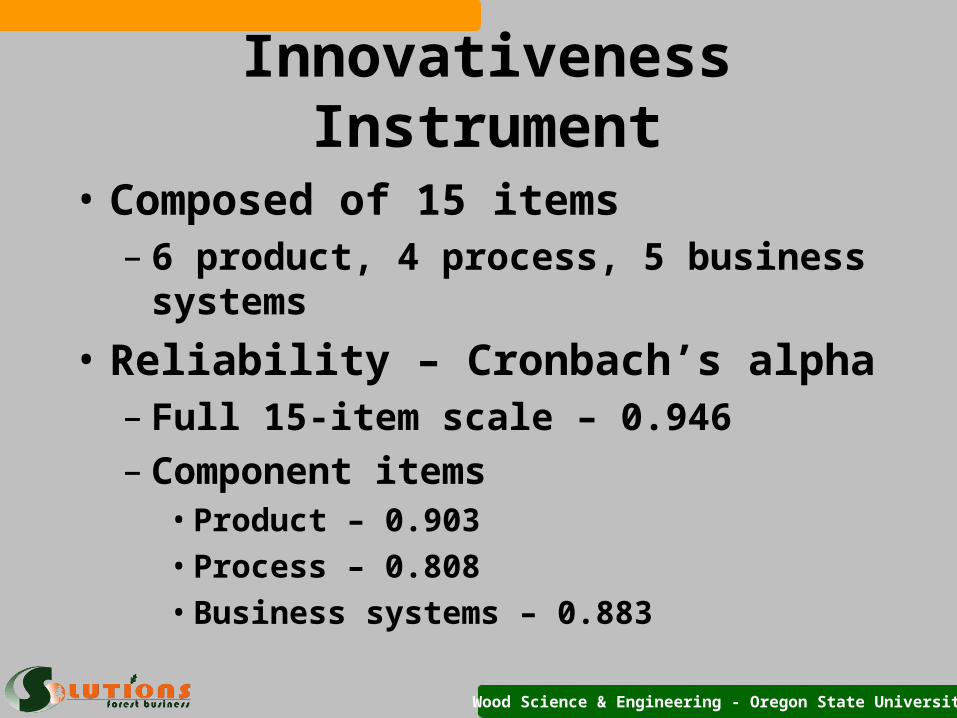
• Composed of 15 items– 6 product, 4 process, 5 business systems
• Reliability – Cronbach’s alpha– Full 15-item scale – 0.946– Component items
• Product – 0.903• Process – 0.808• Business systems – 0.883

Wood Science & Engineering - Oregon State University
So, do more innovative firms perform better?
Wood Science & Engineering - Oregon State University
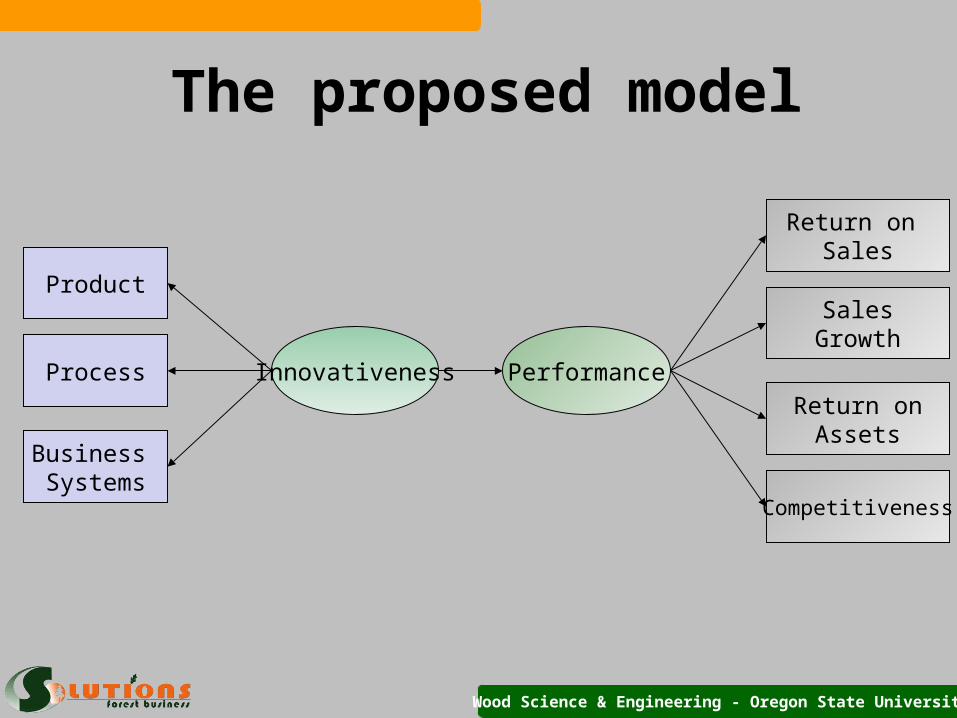
The proposed model
Innovativeness Performance
Return on Sales
SalesGrowth
Return onAssets
Competitiveness
Product
Process
Business Systems
Wood Science & Engineering - Oregon State University
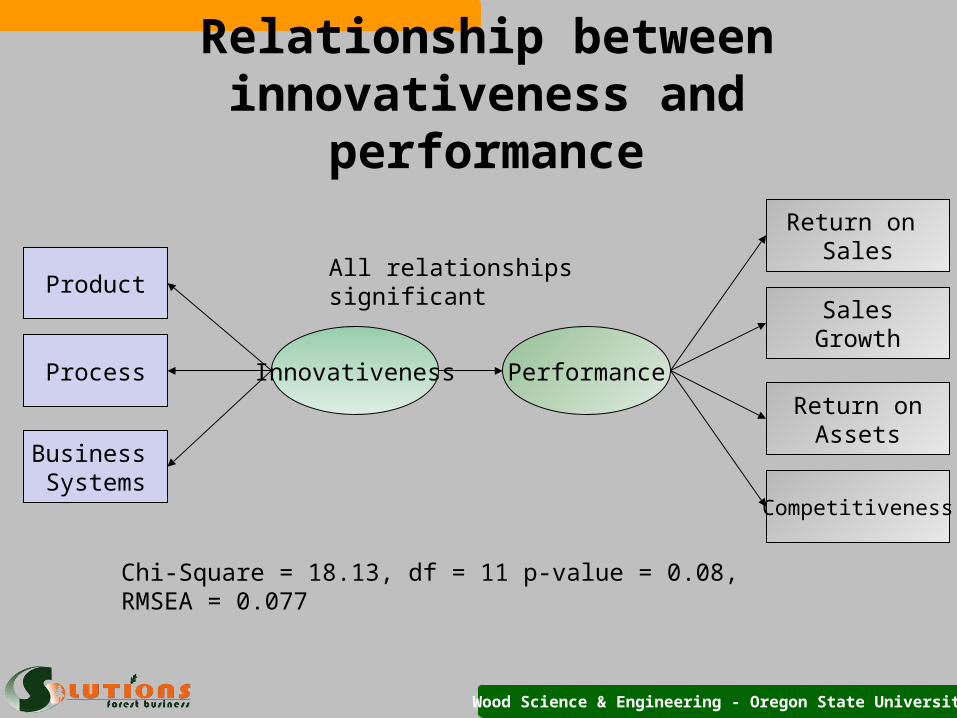
Relationship between innovativeness and performance
Chi-Square = 18.13, df = 11 p-value = 0.08, RMSEA = 0.077
All relationships significant
Innovativeness Performance
Return on Sales
SalesGrowth
Return onAssets
Competitiveness
Product
Process
Business Systems
Wood Science & Engineering - Oregon State University
Conclusions
• Scale refinement– Stage 1 – went from 25 to 18 items– Stage 2 – went from 18 to 15 items
• Strong fit for proposed model
• Significant, positive relationship between innovativeness and performance

Wood Science & Engineering - Oregon State University
Questions?