Embed Size (px)
Citation preview

IDENTIFICATION OF KEY PROCESS AREAS IN THE PRODUCTION OF AN E-CAPABILITY MATURITY MODEL FOR UK CONSTRUCTION ORGANISATIONS
Robert Eadie,
School of the Built Environment, University of Ulster
email:[email protected]
Srinath Perera,
School of the Built Environment, University of Ulster
email: [email protected]
George Heaney,
School of the Built Environment, University of Ulster
email: [email protected]
ABSTRACT
Uptake of e-procurement by construction organisations has been slow (Martin, 2008). Positive e-business achievements in other industries, point towards the potential for the construction industry to accomplish similar results. Since the Modernising Government White paper set targets through best value indicator BV157 for implementation in the public sector, Government has supported many initiatives encouraging e-procurement. These are based on documented efficiency and cost savings (Knudsen, 2003; Minahan and Degan, 2001; McIntosh and Sloan, 2001; Martin, 2008). However, Martin (2003, 2008) demonstrates only a modest increase in the uptake of e-procurement in the UK construction industry.
Alshawi et al (2004) identified the significance of possessing a model to sustain the embedment of any business process within an organisation. Saleh and Alshawi (2005) describe a number of model types used to gauge maturity in an organisation. One of these models is the capability maturity model. Paulk et al (1993) released the Software Capability Maturity Model (CMM) in 1991. Since then many CMM’s have evolved. This paper reports on how a CMM based on Drivers and Barriers to e-procurement identified in Eadie et al (2009) can be developed to gauge the maturity of an organisation in relation to e-procurement.
This paper presents details of a research project which used factor analysis to produce a set of Key Process Areas (KPA) from the drivers and barriers identified in Eadie et al (2009). These KPAs were then subjected to a mapping process linking them to maturity levels to develop a CMM to analyse the e-procurement capability of construction organisations. The mapping will be reported in a later paper. This termed as e-readiness of organisations will indicate the current state of a construction organisation in terms of its readiness to carry out e-procurement. The paper describes in detail the identification of the KPA’s.
KEYWORDS
Capability maturity model, Construction, e-procurement, e-readiness
1.0 INTRODUCTION
The increased use of the internet offers greater opportunity for E-Procurement and E-Tendering can offer viable electronic alternatives to traditional paper-based processes. National Procurement Strategy for Local Government (2003) defined procurement as “the process of acquiring goods, works and services, covering both acquisition from third parties and from in-house providers. The process spans the whole life cycle from
identification of needs, through to the end of a services contract or the end of the useful life of an asset. It involves options appraisal and the critical 'make or buy' decision.' Rowlinson and McDermott (1999) define procurement for construction as “the acquisition of project resources for the realisation of a constructed facility”. It has been identified as a strategic actor within the construction process (Egbu et al, 2003). E-Procurement improves numerous facets of the procurement process. (National Institute of Governmental Purchasing 2001, Minahan and Degan 2001, McIntosh and Sloan 2001, Ribeiro 2001).
The theory behind electronic procurement is provision of a system of transmitting electronic input from the contractor’s tender to contract management and final account. This removes the inefficiencies, delays and cost associated with manually completing the tender process and the retyping for assessment and contract management activity. E-Procurement can then be defined as “the use of electronic technologies to streamline and enable procurement activities” (Hawking et al 2004).
Despite Kheng et al (2002) stating that “Electronic commerce is one of the fastest growing sectors globally”, Martin (2008) and Martin (2003) have shown a slow uptake within the construction industry. This shows that there are obstacles to be overcome before e-procurement benefits can be maximised.
1.1 Business Maturity Modelling
In number of industry sectors it has been shown that the development of business process models has supported the embedment of the business process within the organisation (Alshawi et al, 2004). Saleh and Alshawi (2005) show that there are a number of different models which can be used to establish the maturity of a system and therefore embed it within the industry. This paper reports on a stage in the production of a standard model for e-procurement with implications for the complete construction industry. This current study into e-procurement produced a model in the normative category. Shere (2004) shows that capability maturity models look inward at a process ensuring that measurements are taken, policy exists, training is given and a review process is in place.
Humphrey (1989) constructed the concept of Capability Maturity Models(CMM) and produced a marking framework. This followed an initial paper published in 1987. Paulk et al (1993) from Carnegie Mellon University released the Software CMM in 1991. The Software CMM (SW-CMM) was superseded by the Capability Maturity Model Integration (CMMI) (Chrissis et al, 2007). CMMI is currently published in its second edition. A large number of models for various business processes have been developed since its publication.
Chrissis et al (2007) show that in the staged representation there are five levels of maturity. To move between these levels success in Key Process Areas (KPA) must be achieved. Under each KPA there are goals to be met. How well an organisation meets these requirements will result in an allocation of a maturity level to that organisation. This paper reports on the definition of these KPAs for the e-procurement process within construction using the drivers and barriers to e-procurement as the goals.
1.2 E-Procurement Drivers and Barriers
The e-procurement CMM was developed from the identification of the drivers and barriers to e-procurement in construction. The recognition of the process dynamics of e-procurement, both positively (drivers) and negatively (barriers) is vital to attaining a comprehension of how the benefits of e-procurement can be employed to maximise uptake and provide a model to embed e-procurement in construction. These identified drivers and barriers became the goals for the model. The ranking of the drivers and barriers was acted on by a data reduction technique to produce the KPAs for the e-procurement CMM.

A limited study had been carried out in order to identify the importance of drivers and barriers to construction e-procurement, where Eadie et al (2007) carried out a preliminary study into drivers and barriers from a Northern Irish Public Sector Construction Contractor’s perspective. As little work on ranking Drivers and Barriers from a construction perspective existed, the study applied drivers and barriers identified from other industries to e-procurement in construction and produced a ranking of driver and barrier importance. Eadie et al (2009a) further reported a rigorous verification process which produced a collated set of Drivers and barriers to construction e-procurement by defining the applicability of each driver and barrier identified from literature to construction e-procurement. This was completed through the application of a Delphi methodology to a group of domain experts and analysed the applicability of each driver and barrier to construction e-procurement throughout the UK construction industry. Eadie et al (2009b) followed this with a UK wide study which ranked these from the different construction industry perspectives. Eadie et al (2009b) produced a ranking which combined results from the different experts within the industry. This was then utilised to produce the e-procurement capability maturity model.
2. METHODOLOGY FOR DEVELOPING AN E-PROCUREMENT CAPABILITY MATURITY MODEL
This current study relied on the findings of Eadie et al (2009a, 2009b), the rankings of
the drivers and barrier found in this study were categorised by principle components
analysis. The Eadie et al (2009a) sample contained a total of 775 organisations who
ranked the drivers and barriers (483 surveyors, 42 Public Sector clients, 172 Architects,
35 Private sector clients and 43 Consulting Engineers) from January to March 2008. A
77% valid response rate was achieved.
Table 1 Sample Valid Response Breakdown by Discipline
Organisations
(Total No.)
Organisations
using E-
Procurement
Organisations
not using E-
Procurement
Organisations not
contactable, no
longer trading or
with no one
available for
comment
% valid
response
Quantity
Surveyors
483 83 247 153 68%
Public Sector
Clients
42 29 10 3 93%
Architects 172 12 156 4 98%
Private Sector
Clients
35 in sample 0 35 Unknown
Engineers 43 4 25 14 67%
775 128 473 174 77%
Table 1 shows the number of organisations contacted during the telephone survey and
the percentage valid response from the total sample. These figures show the extent of
the survey and show that the results can be generalised across the industry.
Once the organisations confirmed that they carried out e-procurement from the phone
survey they were asked to complete a ranking of the drivers and barriers to e-
procurement. For the purposes of data collection during this phase of the study
Limesurvey was mounted on webspace and used to conduct the survey in 2008. This
software package collected the responses through a web-based interface and stored
these in an on-line MySQL database. Data collected was exported directly into SPSS
for analysis.
2.1 Suitability of data for factor analysis
Tests confirming the suitability of the data collected via the web-based survey for factor analysis were carried out using internal SPSS tests. The correlation matrix produced for the drivers and barriers showed that the majority of the coefficients with values greater than 0.3 showing that the data is suitable for examination by this method. High correlations mean that these items are likely to be viewed as the same factor after analysis (Leech et al, 2005).
Further inspection of the Kaiser-Meyer-Oklin (KMO) value shows the sampling adequacy to be 0.731 for the drivers and 0.606 for the barriers which exceeds the 0.6 value that Kaiser (1970, 1974) suggested as adequate for accurate completion of analysis. The KMO value shows that there are enough items predicted by each factor.
Examination of the Bartlett’s test of Sphericity shows whether or not the variables are correlated enough to enable factor analysis to be carried out. Bartlett (1954) suggested that the significance should be less than a value of 0.05. As the value for both drivers and barriers was below this value the correlation is deemed strong enough to be accurate.
3. PRINCIPLE COMPONENTS ANALYSIS OF THE DRIVERS AND BARRIERS FOR E-PROCUREMENT
Principle Components analysis was carried out on the drivers for e-procurement. This showed that for both the raw and rescaled analysis options that the first five components had initial eigenvalues greater than 1. These five factors explained 73.309% of the variance being 38.667, 12.615, 9.474, 6.949 and 5.604 respectively. It was decided to retain all five components meeting the Kaiser criterion. Leech et.al (2005) point out that once an eigenvalue is less than one the factor would explain less information than a single item would have explained and therefore can be excluded from further consideration.
A similar Principle Components analysis was carried out on the barriers to e-procurement. This showed that for the first nine components had initial eigenvalues greater than 1. These nine factors explained 80.682% of the variance being 32.992, 13.662, 7.275, 5.839, 5.024, 4.817, 4.016, 3.701 and 3.356 respectively. However the scree plot suggested that only eight be analysed.
4. CLASSIFICATION OF THE PRINCIPAL COMPONENTS IDENTIFIED IN THE PRINCIPAL COMPONENTS ANALYSIS OF THE DRIVERS FOR E-PROCUREMENT
The component matrix is used to decide the loadings of the items on the factors. To allow easy interpretation of the factors, the factors are “rotated”. This does not change the result. There are a number of different types of rotation possible within SPSS. These are variants of orthogonal (uncorrelated) or oblique (correlated) factor solutions. As each of the drivers and barriers have been identified as independent items by the Delphi process, an orthogonal solution is appropriate. SPSS contains three orthogonal solutions. These are Varimax, Quartimax, and Equamax. Varimax is the most commonly used of the three as it minimises the number of variables that have high loadings on each factor resulting in a cleaner, easier interpreted result. Grover and Vriens (2006) recommend its use for orthogonal solutions. For this reason, it was chosen for this study. The results are shown in Table 4.
The loadings which result from carrying out the Varimax rotation are the correlation coefficients. These range in value for +1.0 to -1.0. Factor loadings of less than 0.3 are considered low (Leech et al, 2005) and during the analysis SPSS was asked to ignore loadings under 0.3.
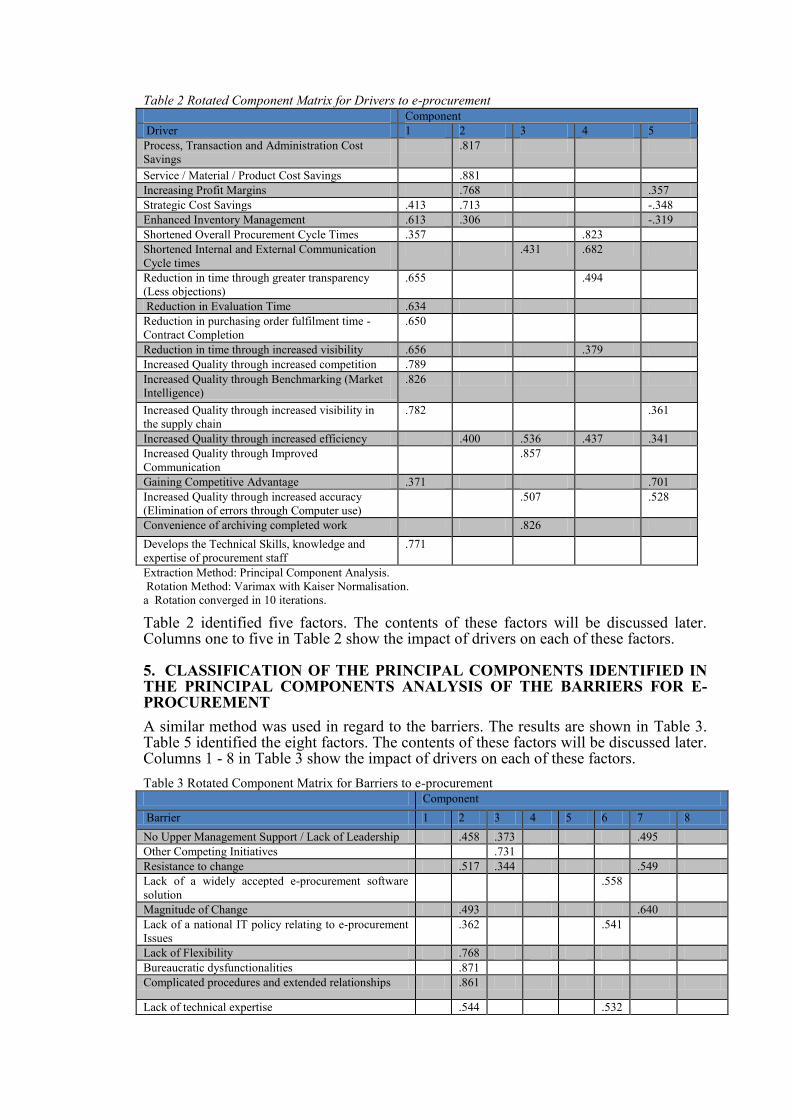
Table 2 Rotated Component Matrix for Drivers to e-procurement
Component
Driver 1 2 3 4 5
Process, Transaction and Administration Cost
Savings
.817
Service / Material / Product Cost Savings .881
Increasing Profit Margins .768 .357
Strategic Cost Savings .413 .713 -.348
Enhanced Inventory Management .613 .306 -.319
Shortened Overall Procurement Cycle Times .357 .823
Shortened Internal and External Communication
Cycle times
.431 .682
Reduction in time through greater transparency
(Less objections)
.655 .494
Reduction in Evaluation Time .634
Reduction in purchasing order fulfilment time -
Contract Completion
.650
Reduction in time through increased visibility .656 .379
Increased Quality through increased competition .789
Increased Quality through Benchmarking (Market
Intelligence)
.826
Increased Quality through increased visibility in
the supply chain
.782 .361
Increased Quality through increased efficiency .400 .536 .437 .341
Increased Quality through Improved
Communication
.857
Gaining Competitive Advantage .371 .701
Increased Quality through increased accuracy
(Elimination of errors through Computer use)
.507 .528
Convenience of archiving completed work .826
Develops the Technical Skills, knowledge and
expertise of procurement staff
.771
Extraction Method: Principal Component Analysis.
Rotation Method: Varimax with Kaiser Normalisation.
a Rotation converged in 10 iterations.
Table 2 identified five factors. The contents of these factors will be discussed later. Columns one to five in Table 2 show the impact of drivers on each of these factors.
5. CLASSIFICATION OF THE PRINCIPAL COMPONENTS IDENTIFIED IN THE PRINCIPAL COMPONENTS ANALYSIS OF THE BARRIERS FOR E-PROCUREMENT
A similar method was used in regard to the barriers. The results are shown in Table 3. Table 5 identified the eight factors. The contents of these factors will be discussed later. Columns 1 - 8 in Table 3 show the impact of drivers on each of these factors.
Table 3 Rotated Component Matrix for Barriers to e-procurement Component
Barrier 1 2 3 4 5 6 7 8
No Upper Management Support / Lack of Leadership .458 .373 .495
Other Competing Initiatives .731
Resistance to change .517 .344 .549
Lack of a widely accepted e-procurement software
solution
.558
Magnitude of Change .493 .640
Lack of a national IT policy relating to e-procurement
Issues
.362 .541
Lack of Flexibility .768
Bureaucratic dysfunctionalities .871
Complicated procedures and extended relationships .861
Lack of technical expertise .544 .532
Staff Turnover .514 .420 .371
Lack of a forum to exchange ideas .413 .701
Company Access to the Internet .664 .336
Reluctance to "Buy-into" one off systems .904
Insufficient assessment of systems prior to installation .316 .472 .593 -.321
Security in the process - Data transmission to the
wrong person
.718
Confidentiality of Information - unauthorised viewing .819 .362
Prevention of Tampering with Documents - changes to
documents
.754
Data Transmission reassembly - incorrect reassembly
of data transmitted in packets
.870
Partial Data Display - incomplete documents provided .877
Lack of Pertinent case law .636 -.402
Different national approaches to e-procurement .564 .320 .364 -.338
Proof of intent - electronic signatures .568 -.365 .310
Clarity of Sender and Tenderer Information .434 .713
Enforceability of Electronic Contracts .851
Information Technology Investment Costs .526 .499 .426
Perception of no Business Benefit Realised .553 .481 .313
Internal and External interoperability of e-procurement
software
.389 .319 -.354 .356 .542
Lack of publicity / awareness of best practice solutions .734
Investment in compatible systems .670 .455
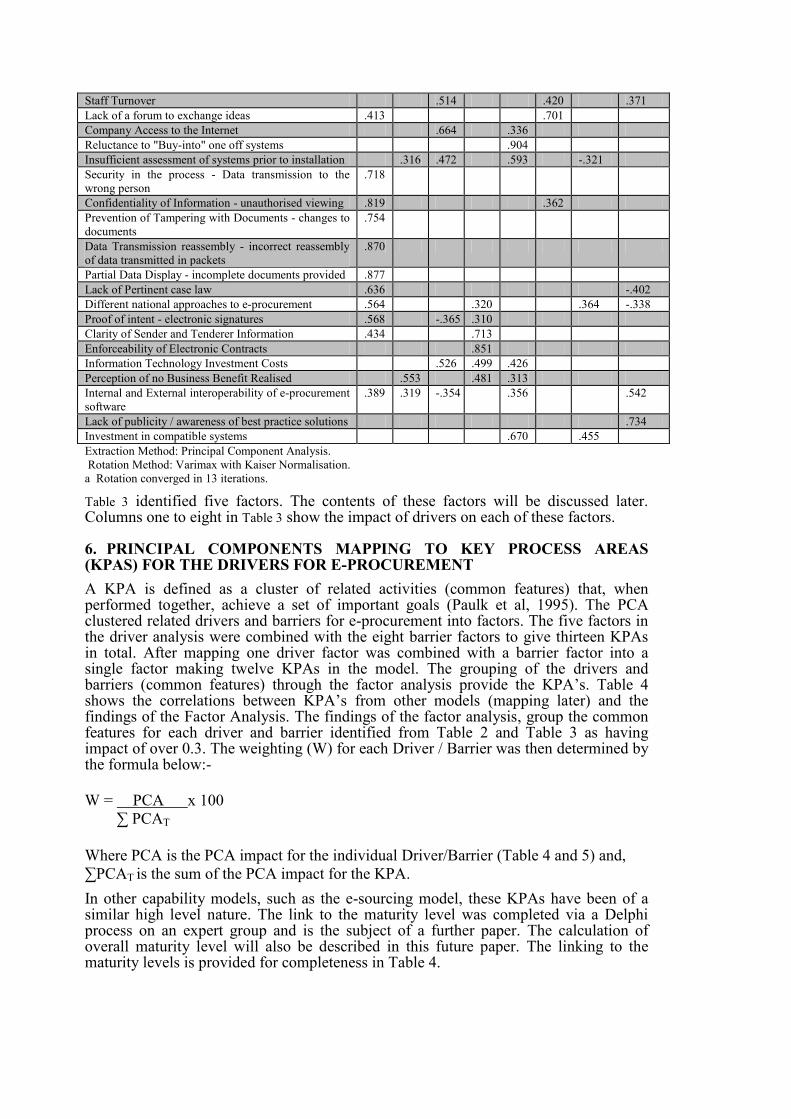
Extraction Method: Principal Component Analysis.
Rotation Method: Varimax with Kaiser Normalisation.
a Rotation converged in 13 iterations.
Table 3 identified five factors. The contents of these factors will be discussed later. Columns one to eight in Table 3 show the impact of drivers on each of these factors.
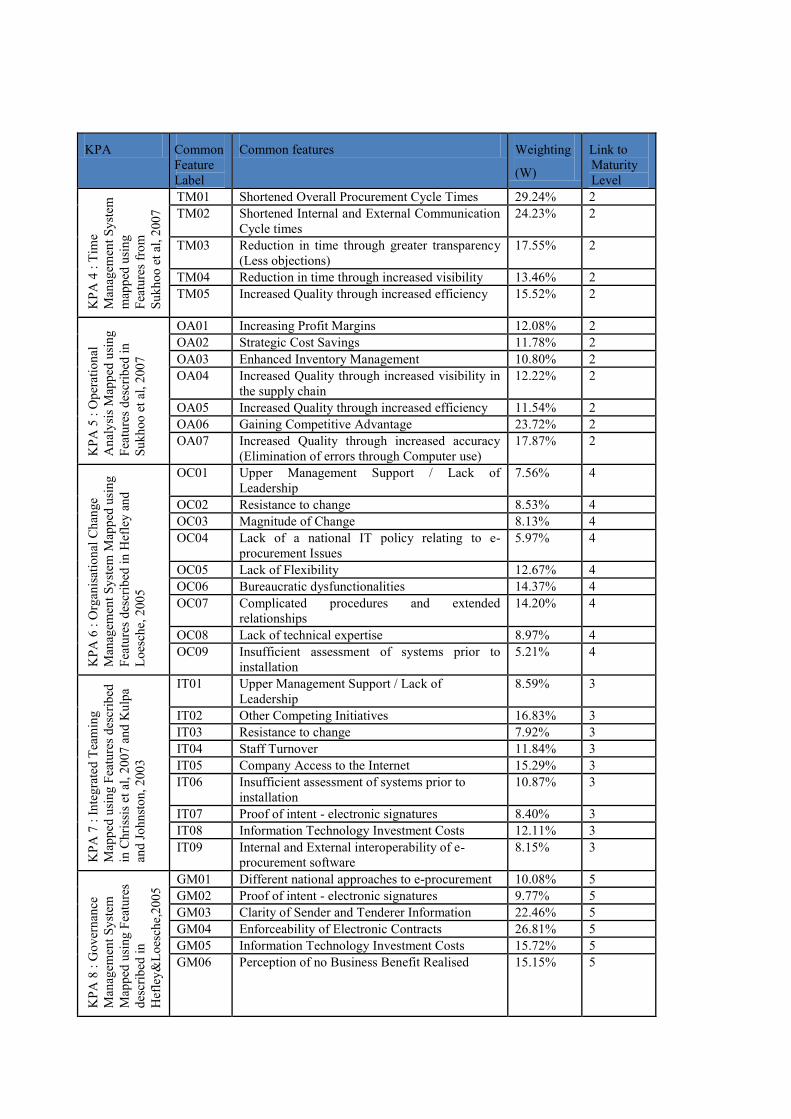
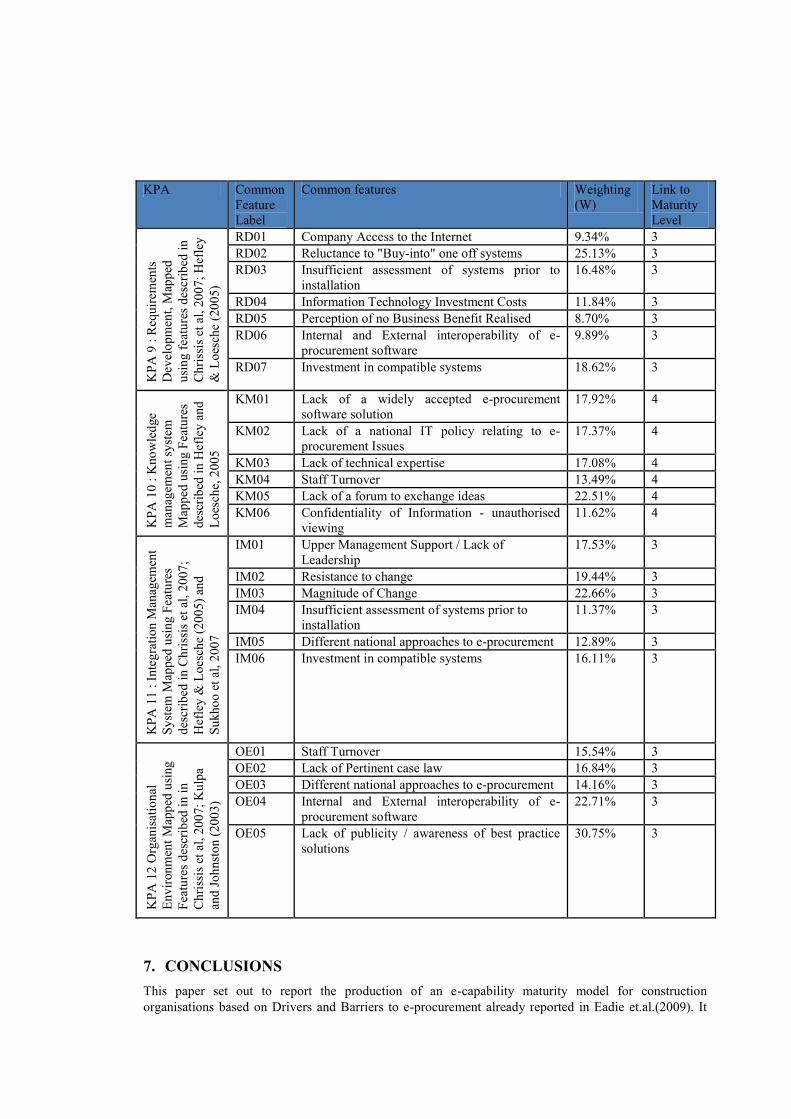
6. PRINCIPAL COMPONENTS MAPPING TO KEY PROCESS AREAS (KPAS) FOR THE DRIVERS FOR E-PROCUREMENT
A KPA is defined as a cluster of related activities (common features) that, when performed together, achieve a set of important goals (Paulk et al, 1995). The PCA clustered related drivers and barriers for e-procurement into factors. The five factors in the driver analysis were combined with the eight barrier factors to give thirteen KPAs in total. After mapping one driver factor was combined with a barrier factor into a single factor making twelve KPAs in the model. The grouping of the drivers and barriers (common features) through the factor analysis provide the KPA’s. Table 4 shows the correlations between KPA’s from other models (mapping later) and the findings of the Factor Analysis. The findings of the factor analysis, group the common features for each driver and barrier identified from Table 2 and Table 3 as having impact of over 0.3. The weighting (W) for each Driver / Barrier was then determined by the formula below:-
W = PCA x 100
∑ PCAT
Where PCA is the PCA impact for the individual Driver/Barrier (Table 4 and 5) and,
∑PCAT is the sum of the PCA impact for the KPA.
In other capability models, such as the e-sourcing model, these KPAs have been of a similar high level nature. The link to the maturity level was completed via a Delphi process on an expert group and is the subject of a further paper. The calculation of overall maturity level will also be described in this future paper. The linking to the maturity levels is provided for completeness in Table 4.
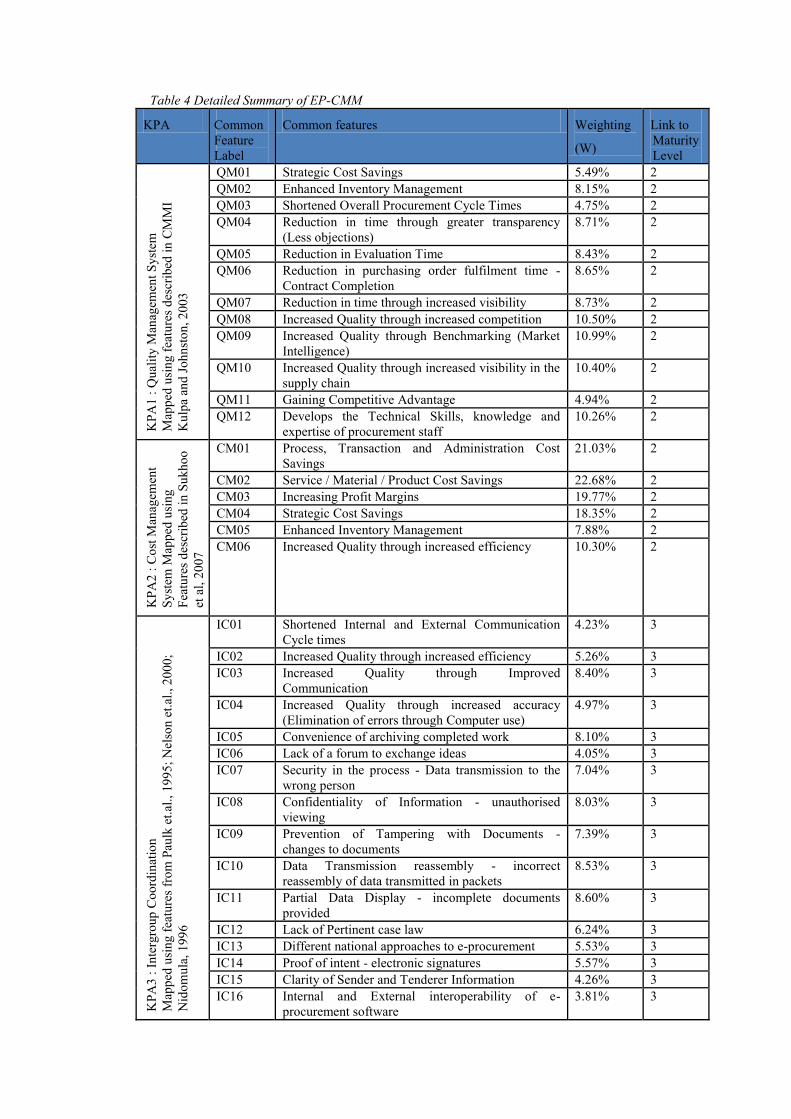
Table 4 Detailed Summary of EP-CMM
KPA Common
Feature
Label
Common features Weighting
(W)
Link to
Maturity
Level K
PA
1 :
Qu
alit
y M
anag
emen
t S
yst
em
Map
ped
usi
ng f
eatu
res
des
crib
ed i
n C
MM
I
Ku
lpa
and
Joh
nst
on
, 2
003
QM01 Strategic Cost Savings 5.49% 2
QM02 Enhanced Inventory Management 8.15% 2
QM03 Shortened Overall Procurement Cycle Times 4.75% 2
QM04 Reduction in time through greater transparency
(Less objections)
8.71% 2
QM05 Reduction in Evaluation Time 8.43% 2
QM06 Reduction in purchasing order fulfilment time -
Contract Completion
8.65% 2
QM07 Reduction in time through increased visibility 8.73% 2
QM08 Increased Quality through increased competition 10.50% 2
QM09 Increased Quality through Benchmarking (Market
Intelligence)
10.99% 2
QM10 Increased Quality through increased visibility in the
supply chain
10.40% 2
QM11 Gaining Competitive Advantage 4.94% 2
QM12 Develops the Technical Skills, knowledge and
expertise of procurement staff
10.26% 2
KP
A2
: C
ost
Man
agem
ent
Sy
stem
Map
ped
usi
ng
Fea
ture
s d
escr
ibed
in
Su
kh
oo
et a
l, 2
007
CM01 Process, Transaction and Administration Cost
Savings
21.03% 2
CM02 Service / Material / Product Cost Savings 22.68% 2
CM03 Increasing Profit Margins 19.77% 2
CM04 Strategic Cost Savings 18.35% 2
CM05 Enhanced Inventory Management 7.88% 2
CM06 Increased Quality through increased efficiency
10.30% 2
KP
A3
: I
nte
rgro
up
Co
ord
inat
ion
Map
ped
usi
ng f
eatu
res
fro
m P
aulk
et.
al.,
19
95
; N
elso
n e
t.al
., 2
00
0;
Nid
om
ula
, 19
96
IC01 Shortened Internal and External Communication
Cycle times
4.23% 3
IC02 Increased Quality through increased efficiency 5.26% 3
IC03 Increased Quality through Improved
Communication
8.40% 3
IC04 Increased Quality through increased accuracy
(Elimination of errors through Computer use)
4.97% 3
IC05 Convenience of archiving completed work 8.10% 3
IC06 Lack of a forum to exchange ideas 4.05% 3
IC07 Security in the process - Data transmission to the
wrong person
7.04% 3
IC08 Confidentiality of Information - unauthorised
viewing
8.03% 3
IC09 Prevention of Tampering with Documents -
changes to documents
7.39% 3
IC10 Data Transmission reassembly - incorrect
reassembly of data transmitted in packets
8.53% 3
IC11 Partial Data Display - incomplete documents
provided
8.60% 3
IC12 Lack of Pertinent case law 6.24% 3
IC13 Different national approaches to e-procurement 5.53% 3
IC14 Proof of intent - electronic signatures 5.57% 3
IC15 Clarity of Sender and Tenderer Information 4.26% 3
IC16 Internal and External interoperability of e-
procurement software
3.81% 3
KPA Common
Feature
Label
Common features Weighting
(W)
Link to
Maturity
Level
KP
A 4
: T
ime
Man
agem
ent
Sy
stem
map
ped
usi
ng
Fea
ture
s fr
om
Su
kh
oo
et
al,
200
7
TM01 Shortened Overall Procurement Cycle Times 29.24% 2
TM02 Shortened Internal and External Communication
Cycle times
24.23% 2
TM03 Reduction in time through greater transparency
(Less objections)
17.55% 2
TM04 Reduction in time through increased visibility 13.46% 2
TM05 Increased Quality through increased efficiency
15.52% 2
KP
A 5
: O
per
atio
nal
An
aly
sis
Map
ped
usi
ng
Fea
ture
s d
escr
ibed
in
Su
kh
oo
et
al,
200
7
OA01 Increasing Profit Margins 12.08% 2
OA02 Strategic Cost Savings 11.78% 2
OA03 Enhanced Inventory Management 10.80% 2
OA04 Increased Quality through increased visibility in
the supply chain
12.22% 2
OA05 Increased Quality through increased efficiency 11.54% 2
OA06 Gaining Competitive Advantage 23.72% 2
OA07 Increased Quality through increased accuracy
(Elimination of errors through Computer use)
17.87% 2
KP
A 6
: O
rgan
isat
ion
al C
han
ge
Man
agem
ent
Sy
stem
Map
ped
usi
ng
Fea
ture
s d
escr
ibed
in
Hef
ley
an
d
Lo
esch
e, 2
00
5
OC01 Upper Management Support / Lack of
Leadership
7.56% 4
OC02 Resistance to change 8.53% 4
OC03 Magnitude of Change 8.13% 4
OC04 Lack of a national IT policy relating to e-
procurement Issues
5.97% 4
OC05 Lack of Flexibility 12.67% 4
OC06 Bureaucratic dysfunctionalities 14.37% 4
OC07 Complicated procedures and extended
relationships
14.20% 4
OC08 Lack of technical expertise 8.97% 4
OC09 Insufficient assessment of systems prior to
installation
5.21% 4
KP
A 7
: I
nte
gra
ted
Tea
min
g
Map
ped
usi
ng F
eatu
res
des
crib
ed
in C
hri
ssis
et
al,
20
07
an
d K
ulp
a
and
Jo
hn
sto
n,
200
3
IT01 Upper Management Support / Lack of
Leadership
8.59% 3
IT02 Other Competing Initiatives 16.83% 3
IT03 Resistance to change 7.92% 3
IT04 Staff Turnover 11.84% 3
IT05 Company Access to the Internet 15.29% 3
IT06 Insufficient assessment of systems prior to
installation
10.87% 3
IT07 Proof of intent - electronic signatures 8.40% 3
IT08 Information Technology Investment Costs 12.11% 3
IT09 Internal and External interoperability of e-
procurement software
8.15% 3
KP
A 8
: G
ov
ern
ance
Man
agem
ent
Sy
stem
Map
ped
usi
ng F
eatu
res
des
crib
ed i
n
Hef
ley
&L
oes
che,
20
05
GM01 Different national approaches to e-procurement 10.08% 5
GM02 Proof of intent - electronic signatures 9.77% 5
GM03 Clarity of Sender and Tenderer Information 22.46% 5
GM04 Enforceability of Electronic Contracts 26.81% 5
GM05 Information Technology Investment Costs 15.72% 5
GM06 Perception of no Business Benefit Realised
15.15% 5
KPA Common
Feature
Label
Common features Weighting
(W)
Link to
Maturity
Level
KP
A 9
: R
equ
irem
ents
Dev
elo
pm
ent,
Map
ped
usi
ng
fea
ture
s d
escr
ibed
in
Ch
riss
is e
t al
, 2
00
7;
Hef
ley
& L
oes
che
(20
05)
RD01 Company Access to the Internet 9.34% 3
RD02 Reluctance to "Buy-into" one off systems 25.13% 3
RD03 Insufficient assessment of systems prior to
installation
16.48% 3
RD04 Information Technology Investment Costs 11.84% 3
RD05 Perception of no Business Benefit Realised 8.70% 3
RD06 Internal and External interoperability of e-
procurement software
9.89% 3
RD07 Investment in compatible systems
18.62% 3
KP
A 1
0 :
Kn
ow
led
ge
man
agem
ent
syst
em
Map
ped
usi
ng F
eatu
res
des
crib
ed i
n H
efle
y a
nd
Lo
esch
e, 2
00
5
KM01 Lack of a widely accepted e-procurement
software solution
17.92% 4
KM02 Lack of a national IT policy relating to e-
procurement Issues
17.37% 4
KM03 Lack of technical expertise 17.08% 4
KM04 Staff Turnover 13.49% 4
KM05 Lack of a forum to exchange ideas 22.51% 4
KM06 Confidentiality of Information - unauthorised
viewing
11.62% 4
KP
A 1
1 :
In
teg
rati
on
Man
agem
ent
Sy
stem
Map
ped
usi
ng
Fea
ture
s
des
crib
ed i
n C
hri
ssis
et
al,
20
07
;
Hef
ley
& L
oes
che
(200
5)
and
Su
kh
oo
et
al,
200
7
IM01 Upper Management Support / Lack of
Leadership
17.53% 3
IM02 Resistance to change 19.44% 3
IM03 Magnitude of Change 22.66% 3
IM04 Insufficient assessment of systems prior to
installation
11.37% 3
IM05 Different national approaches to e-procurement 12.89% 3
IM06 Investment in compatible systems
16.11% 3
KP
A 1
2 O
rgan
isat
ion
al
En
vir
on
men
t M
app
ed u
sing
Fea
ture
s d
escr
ibed
in
in
Ch
riss
is e
t al
, 2
00
7;
Ku
lpa
and
Jo
hn
sto
n (
20
03
)
OE01 Staff Turnover 15.54% 3
OE02 Lack of Pertinent case law 16.84% 3
OE03 Different national approaches to e-procurement 14.16% 3
OE04 Internal and External interoperability of e-
procurement software
22.71% 3
OE05 Lack of publicity / awareness of best practice
solutions
30.75% 3
7. CONCLUSIONS
This paper set out to report the production of an e-capability maturity model for construction
organisations based on Drivers and Barriers to e-procurement already reported in Eadie et.al.(2009). It

achieved this by using factor analysis as a data reduction technique to reduce the 20 drivers and 32
barriers identified as being applicable to e-procurement in construction to 12 Key Process Areas. The
twelve Key Process Areas used by the research were KPA1 : Quality Management System, KPA2 : Cost
Management System, KPA3 : Intergroup Coordination, KPA 4 : Time Management System, KPA 5 :
Operational Analysis, KPA 6 : Organisational Change Management System, KPA 7 : Integrated
Teaming, KPA 8 : Governance Management System, KPA 9 : Requirements Development, KPA 10 :
Knowledge management system, KPA 11 : Integration Management System and KPA 12 Organisational
Environment. The Key Process Area titles had been identified from other CMM’s and mapped to the
contents of each of the common features. The mapping is shown in Table 4.
These 12 Key Process Areas were then linked via a maturity mapping process by a group of domain
experts to a maturity level of one to five. This produced a model that linked each of the Drivers and
Barriers to construction e-procurement to a maturity level for a given organisation. The mapping process
and calculation of the final organisational maturity level is the subject of a future publication.
Further work will have to be completed to refine and prove the model in practice.
REFERENCES
Alshawi, M., Goulding, J., Salah, Y. (2004) E-Business in Construction: A model for Successful
Implementation, Proceedings of INCITE 2004 Designing, Managing and Supporting Construction
Projects through Innovation and IT solutions, pp 227-232, February 2004 Langkawi,
Malaysia.shawi
Bartlett, M (1954), “A note on multiplying factors for various chi square approximations” in Journal of
the Royal Statistical Society, Vol.16, Series B, Pp 296-298.
Chrissis M, Konrad M, Shrum S (2007), CMMI Second Edition Guidelines for Process Integration and
Product Improvement, Addison-Wesley MA USA.
Davila A, Gupta M, Palmer R (2003) “Moving Procurement Systems to the Internet : The Adoption and
Use of E-Procurement Technology Models” In European Management Journal Vol. 21 No. 1 Pp
11-23.
Eadie R., Perera S., Heaney G. (2009a) “Identification of E-Procurement Drivers and Barriers for UK
Construction Organisations and Ranking of these from the Perspective of Quantity Surveyors”,
Eadie R., Perera S., Heaney G. (2009b) “A Cross Discipline Comparison of Rankings of E-Procurement
Drivers and Barriers for UK Construction Organisations”,
Eadie, R., Perera, S., Heaney, G., Carlisle, J. (2007) Drivers and Barriers to Public Sector e-procurement
within Northern Ireland’s Construction Industry, ITcon Journal, Vol. 12, pp. 103-120,
http://www.itcon.org/2007/6
Earl, M. (1989) “Management Strategies for Information Technology”, Prentice Hall, Hemel Hempstead
UK.
Egbu C., Vines M. & Tookey J. (2004) “The Role of Knowledge Management in E-Procurement
Initiatives for Construction Organisations”. In: Khosrowshami,F (ed) ARCOM Proceedings
Twentieth Annual Conference 2004 September 1-3 Heriot Watt University Volume 1. Arcom
University of Reading Reading. Pages 661 – 671.
Galliers, R. and Sutherland, A. (1991) “Information systems management and strategy formulation: the
stages of growth model revisited”. Journal of Information Systems, 1(2), pp. 89 114.
Goodman S, Press L.,Ruth S., Rutkowski A(1994),”The global Diffusion of the Internet: Patterns and
Problems” Communications of the ACM Vol. 37 No. 8 Pp 10-14.
Hawking P, Stein A, Wyld D & Forster S (2004) “E-Procurement: Is the Ugly Duckling Actually a Swan
Down Under?”, In Asia Pacific Journal of Marketing and Logistics Vol. 16 No. 1 Pp 1-26.
Hefley and Loesche (2005) “The e-sourcing capability model for client organisations eSCM-CL ver 1.1”,
Carnegie Mellon University available on-line from http://itsqc.cmu.edu/models/escm-cl/index.asp
accessed March 2009
Humphrey WS (1989) “Managing the software process”, Addison-Wesley, Reading MA USA.
Humphrey WS (1987) Characterizing the Software Process: A Maturity Framework, Software
Engineering Institute CMU/SEI-87-TR-11, ADA182895. An identical paper was published in
IEEE Software, Vol.5 No.2, March 1988, PG 73-79.
Kaiser,H (1970), “A second generation little jiffy”, in Psychometrika, Vol. 35 Pg 401-415
Kaiser, H (1974), “An index of Factorial simplicity”, in Psychometrika, Vol. 39 Pg 31-36
Kheng C, Al-hawamdeh S (2002) “The Adoption of Electronic Procurement in Singapore” in Electronic
Commerce Research Vol 2 Pp 61-73.
Kulpa M and Johnston K (2003) “Interpreting the CMMI: A Process Improvement Approach” CRC Press
Auerbach Publications.
Leech,N, Barrett,K, Morgan,G (2005),”SPSS for intermediate statistics”, Second Edition, Lawrence
Erlbaum Associates, London, UK.
Martin, J. (2008) E-Tendering about time too, RICS paper, Available online
http://www.rics.org/NR/rdonlyres/5B41E38D-2433-4AEE-A3DC-
5B3C3BB84FB5/0/EtenderingabouttimetooJoeMartin.pdf [accessed December 2008].
Martin J. (2003) “E-Procurement and extranets in the UK Construction industry” Conference paper given
at FIG Working Week April 13th
-17th
Paris France. Available on-line at
http://www.fig.net/figtree/pub/fig_2003/TS_6/TS6_4_Martin.pdf [accessed December 2008]
Minahan, T. & Degan, G. (2001) Best Practices in e-Procurement, Boston: Aberdeen Group, The
Abridged Report, Available online http://www.hedgehog.com/resources/e-
ProcurementAbridged.pdf [accessed December 2008].
National Procurement Strategy for Local Government (2003) “National Procurement Strategy for Local
Government in England 2003-2006” available on-line at
http://www.communities.gov.uk/publications/localgovernment/nationalprocurementstrategy
[accessed December 2008].
Nidumolu S,(1996), “A comparison of the structural contingency and risk-based perspectives on
coordination in software-development projects”, Journal of Management Information Systems Fall
1996 Vol.13 No.2 Pg77.
Nolan, R. (1979), "Managing the crisis in data processing", Harvard Business Review, Vol. 57 No.2,
Pp.116-126.
OGC (2003) “End of SPRITE as we know it” Sit-ups Newsletter, issue 21 available on-line at
http://www.ogc.gov.uk/documents/SIT-UPS_issue_21.pdf [accessed January 2009]
Pallant, J (2001), “SPSS Survival Manual”, Open University Press, Buckingham, Philadelphia, USA.
Paulk M, Curtis B, Chrissis M, Weber C (1993), The Capability Maturity Model for Software, Software
Engineering Institute Carnegie Mellon University, available on-line at
http://citeseerx.ist.psu.edu/viewdoc/download?doi=10.1.1.34.3769&rep=rep1&type=pdf [accessed
January 2009]
Rowlinson S., and McDermott P. (1999) “Procurement Systems”, E& FN Spon
Saleh Y and Alshawi M (2005), “An Alternative Model For Measuring The Success Of IS Projects: The
GPIS Model” in Journal of Enterprise Information Management Vol. 18 Issue: 1 Pp 47 – 63
Shere K (2004) “Comparing Lean Six Sigma to the Capability Maturity Model” in Crosstalk available
online at http://www.bettermanagement.com/library/library.aspx?libraryid=8273&pagenumber=1
[accessed December 08]
Six Sigma Tutorial (2006) “Capability Maturity Models Process Areas” available online at
http://sixsigmatutorial.com/CMM/CMM-Key-Process-Area.aspx [accessed January 2009]

Skulmoski G, Hartman F and Khahn J (2007) The Delphi Method for Graduate Research, Journal of
Information Technology Education, Vol 6, 2007, pp 1-21 (Available on-line at
http://jite.org/documents/Vol6/JITEv6p001-021Skulmoski212.pdf [Assessed January 2009]).
Solingen, R. and Berghout, E. (1999) “The Goal/Question/Metric Method: a practical guide for quality
improvement of software development”, McGraw-Hill.
Sukhoo A, Barnard A, Eloff M, and Van der Poll J (2007), “An Evolutionary Software Project
Management Maturity Model for Mauritius” in Interdisciplinary Journal of Information,
Knowledge, and Management Volume 2, 2007 available on-line at
http://www.ijikm.org/Volume2/IJIKMv2p099-118Sukhoo183.pdf [accessed January 2009]