Embed Size (px)
Citation preview
Developing a Pedagogical Model for
Evaluating Learning Objects
Dr. Robin Kay and Dr. Liesel KnaackUniversity of Ontario Institute of Technology
Oshawa, Ontario
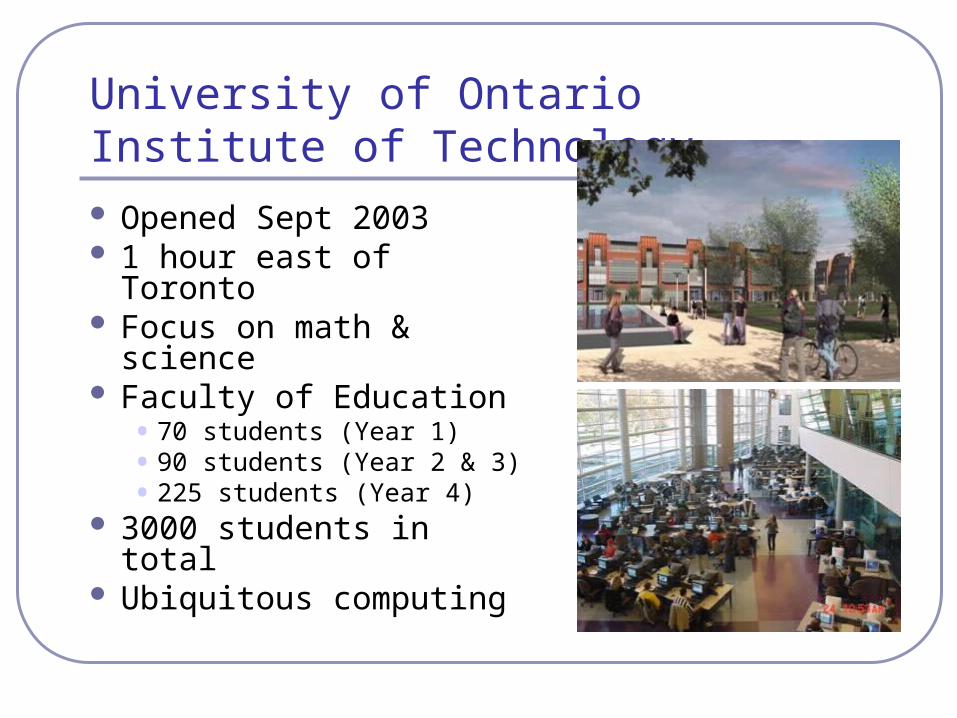
University of Ontario Institute of Technology Opened Sept 2003 1 hour east of Toronto Focus on math &
science Faculty of Education
• 70 students (Year 1)• 90 students (Year 2 & 3)• 225 students (Year 4)
3000 students in total Ubiquitous computing

Overview Background Defining Learning Objects Previous Research Our Approach Our Scale Sample & Procedure Results Conclusions Future Research
Background
A review of 58 articles• 11 studies focussed on evaluation, but only 2
evaluated learning
The “learning object” revolution will never take place unless instructional use and pedagogy are explored and evaluated (Muzio, Heins & Mundell, 2002; Richards, 2002; Wiley, 2000)
Defining Learning Objects
Majority of researchers have emphasized technological issues:• accessibility, adaptability, the effective use of
metadata, reusability, and standardization A second definitional pathway is emerging
• based on learning A question of values:
• learning object developers and designers
• programmers
• educators

Our Definition (Values)
For our study, learning objects were defined as” “interactive web-based tools that support the
learning of specific concepts by enhancing, amplifying, and guiding the cognitive processes of learners”
Previous Research – 6 features
1. Description of Learning Object Clear, often provide links Varied (assessment, tutorials, interactivity)
2. Multiple Sources of Data Surveys. Interviews, E-Mali, Tracking Use,
Think-aloud-protocols
3. Focus on One Learning Object
Previous Research – 6 features
4. Sample Size Small, limited description, exclusively
higher-education
5. Reliability & Validity None
6. Formal Statistics Largely absent Emphasis placed qualitative data
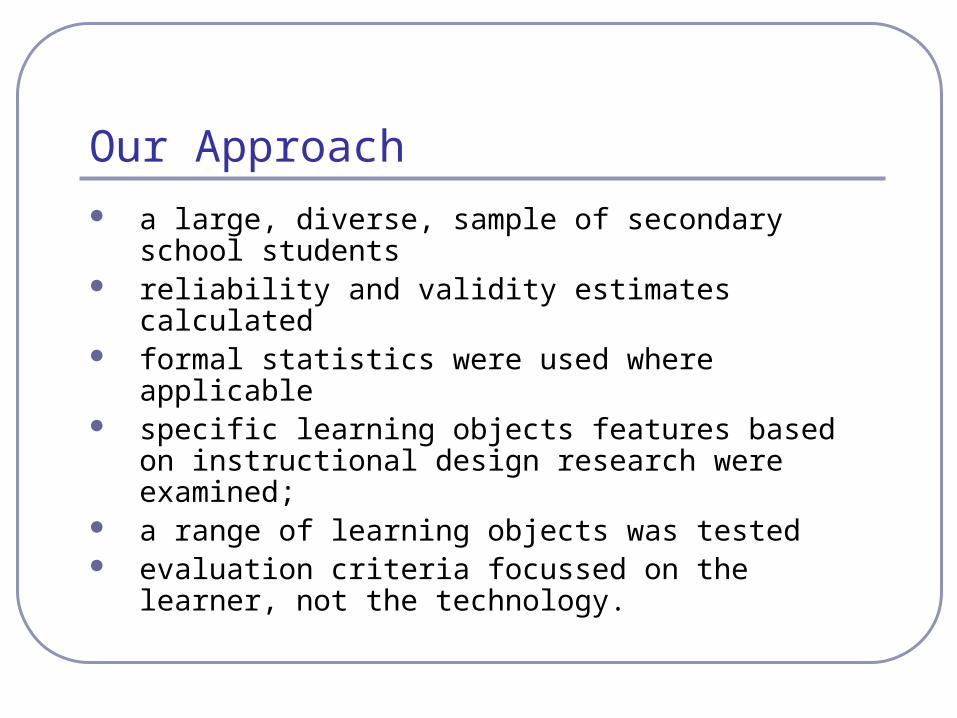
Our Approach
a large, diverse, sample of secondary school students
reliability and validity estimates calculated formal statistics were used where applicable specific learning objects features based on
instructional design research were examined; a range of learning objects was tested evaluation criteria focussed on the learner,
not the technology.
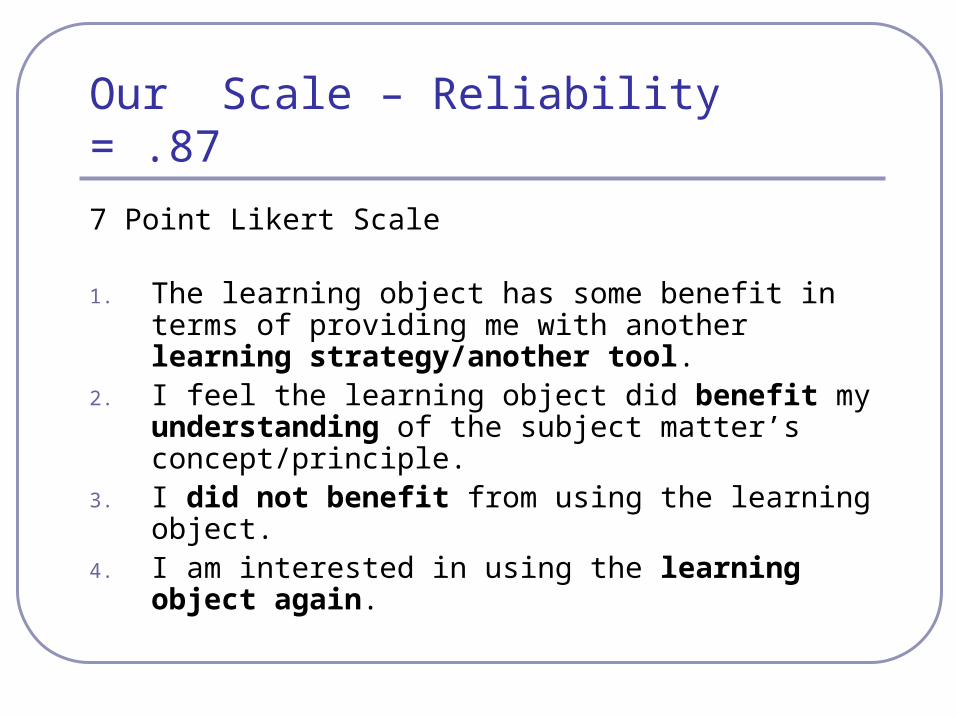
Our Scale – Reliability = .87
7 Point Likert Scale
1. The learning object has some benefit in terms of providing me with another learning strategy/another tool.
2. I feel the learning object did benefit my understanding of the subject matter’s concept/principle.
3. I did not benefit from using the learning object.4. I am interested in using the learning object again.
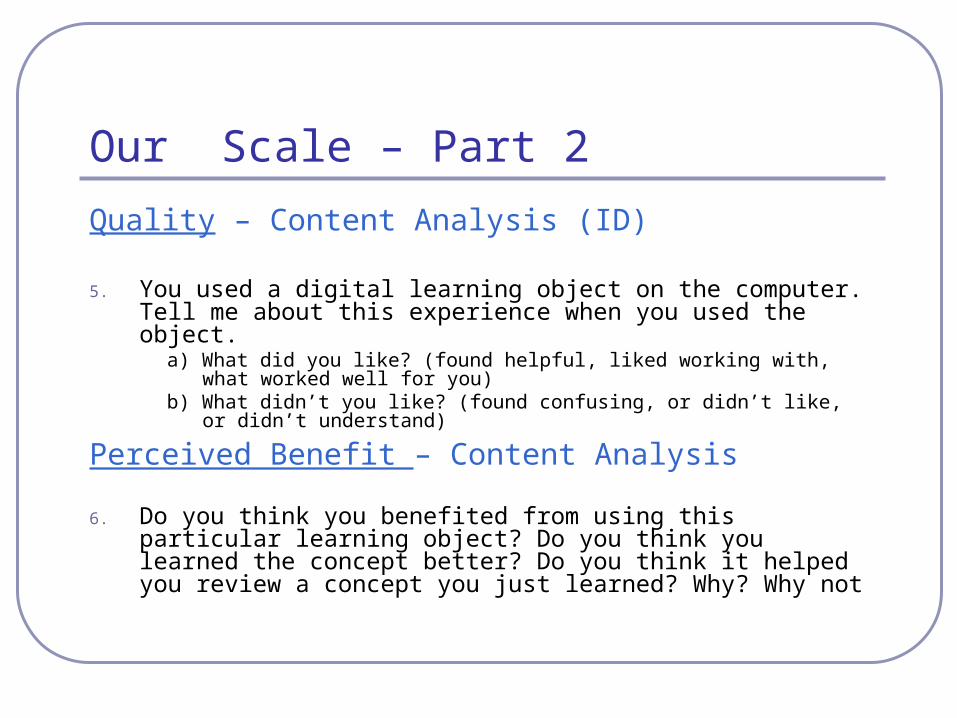
Our Scale – Part 2
Quality – Content Analysis (ID)
5. You used a digital learning object on the computer. Tell me about this experience when you used the object.
a) What did you like? (found helpful, liked working with, what worked well for you)
b) What didn’t you like? (found confusing, or didn’t like, or didn’t understand)
Perceived Benefit – Content Analysis
6. Do you think you benefited from using this particular learning object? Do you think you learned the concept better? Do you think it helped you review a concept you just learned? Why? Why not
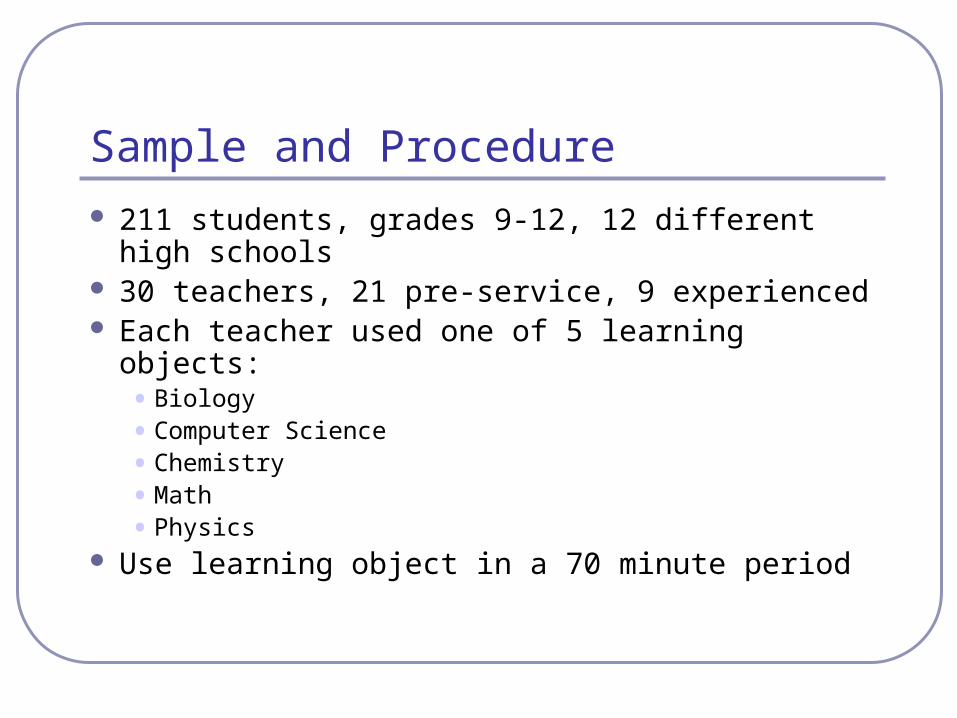
Sample and Procedure
211 students, grades 9-12, 12 different high schools
30 teachers, 21 pre-service, 9 experienced Each teacher used one of 5 learning objects:
• Biology
• Computer Science
• Chemistry
• Math
• Physics Use learning object in a 70 minute period
Results - Scales
Scale was reliable (r=.87) Correlation among quantitative scale and
qualitative results (r=.64, p <.001) – criterion validity
Rating of qualitative data – 100% agreement on quality and benefits content analysis
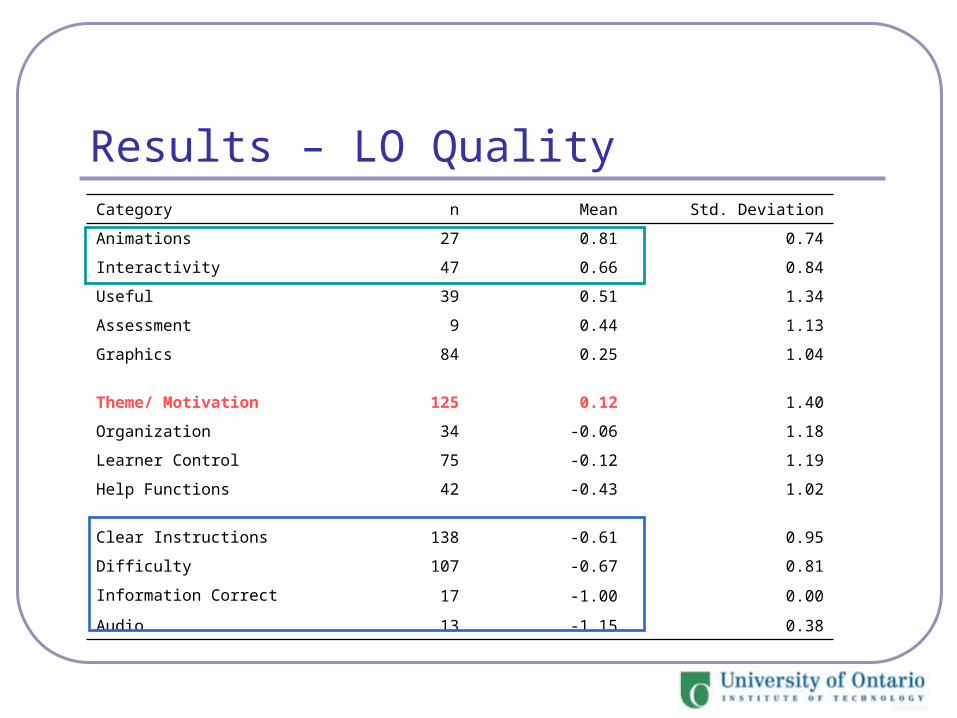
Results – LO QualityCategory n Mean Std. Deviation
Animations 27 0.81 0.74
Interactivity 47 0.66 0.84
Useful 39 0.51 1.34
Assessment 9 0.44 1.13
Graphics 84 0.25 1.04
Theme/ Motivation 125 0.12 1.40
Organization 34 -0.06 1.18
Learner Control 75 -0.12 1.19
Help Functions 42 -0.43 1.02
Clear Instructions 138 -0.61 0.95
Difficulty 107 -0.67 0.81
Information Correct 17 -1.00 0.00
Audio 13 -1.15 0.38
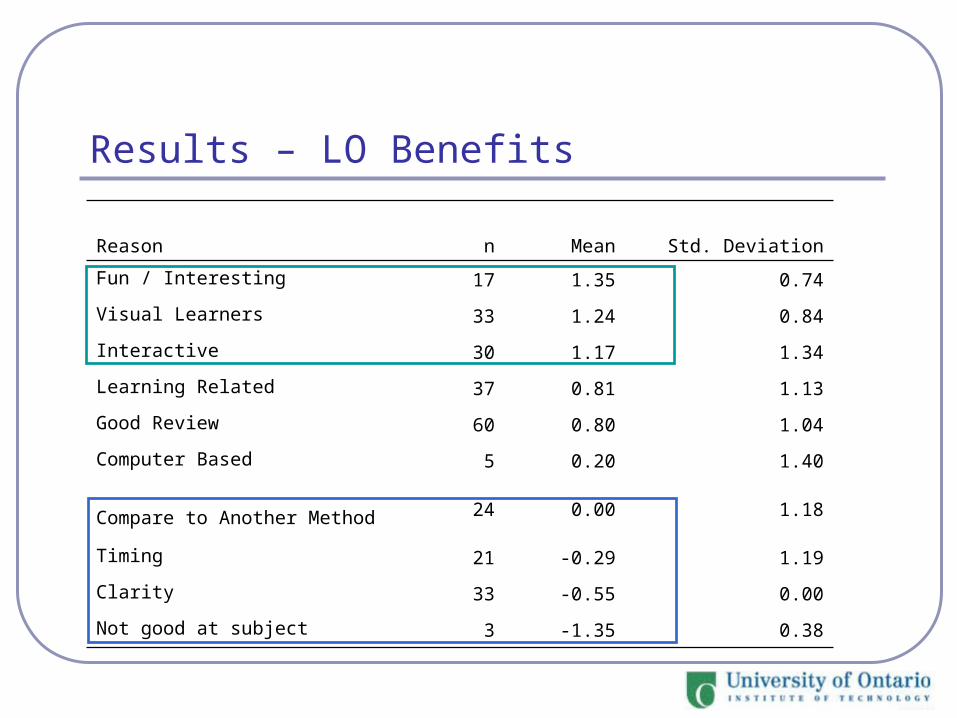
Results – LO Benefits
Reason n Mean Std. Deviation
Fun / Interesting 17 1.35 0.74
Visual Learners 33 1.24 0.84
Interactive 30 1.17 1.34
Learning Related 37 0.81 1.13
Good Review 60 0.80 1.04
Computer Based 5 0.20 1.40
Compare to Another Method 24 0.00 1.18
Timing 21 -0.29 1.19
Clarity 33 -0.55 0.00
Not good at subject 3 -1.35 0.38

Results - Comparing LOs
LO Quality (Q5) Benefit (Scale) Benefit (Q6)
Mean S.E. Mean S.E. Mean S.E.
Biology 0.05 0.10 22.35 0.89 0.80 0.17
Chemistry 0.35 0.07 22.58 0.52 0.77 0.11
Computer Science 0.09 0.11 19.21 0.87 0.87 0.18
Math -0.31 0.10 17.77 0.81 0.25 0.17
Physics -0.33 0.09 17.08 0.74 0.00 0.15
Results – Focus Group
Biology, Chemistry, Computer Science• Majority of suggestions were cosmetic
Math & Physics• Suggestions for change based on learning

Conclusions
Formative analysis• just the beginning
Data collection instruments• reliable and valid
LO qualities• Research on instructional design categories
provided a good base

Conclusions
LO – Benefits • Graphics and interactivity
• Learning is important to students
Comparing LOs• Tools sensitive to differences among LOS
Future Research
Developed a new scale based on qualitative content analysis and further review of instruction design literature• Recently tested on grade 7 & 8 math students
• Being tested on 48 classes, 1200 students, grades 5-12
• Further tests on 24 teachers – focussing on credit recovery and special needs students