Embed Size (px)
Citation preview
Developing a protocol to use remote sensing as a cost effective tool to monitor
contamination of mangrove wetlandsJohannes H. Schellekens, Fernando Gilbes-Santaella,
Augustine Rodriguez-Roman, and Belyneth Deliz
UPRM-Department of Geology
XXVI Symposium of the PR DNEROctober 25, 2007
Outline
– Remote sensing in mineral exploration or the search for chemical anomalies in the rocks
– The effect of chemical anomalies on vegetation– Reflectance of vegetation– Mangroves
• Importance of mangroves• Reflectance of mangroves
– Remote sensing to monitor mangroves for metal contamination
• Initial results
– Conclusions
Remote sensing in mineral exploration or the search for
chemical anomalies in the rocks
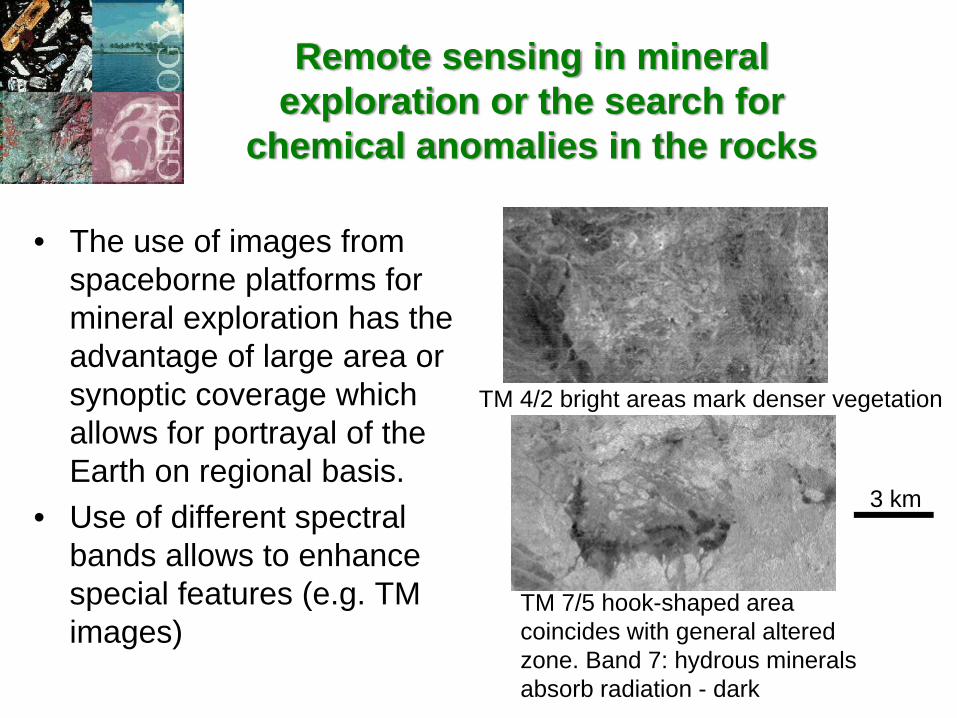
• The use of images from spaceborne platforms for mineral exploration has the advantage of large area or synoptic coverage which allows for portrayal of the Earth on regional basis.
• Use of different spectral bands allows to enhance special features (e.g. TM images)
TM 4/2 bright areas mark denser vegetation
TM 7/5 hook-shaped area coincides with general altered zone. Band 7: hydrous minerals absorb radiation - dark
3 km
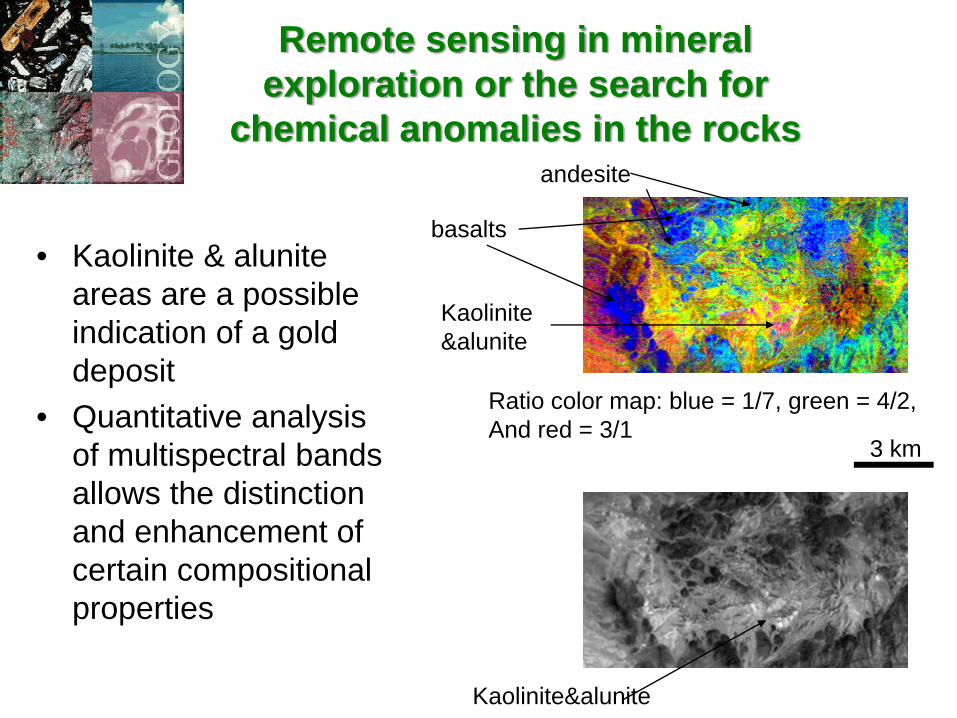
Ratio color map: blue = 1/7, green = 4/2,And red = 3/1
basalts
andesite
Kaolinite&alunite
Kaolinite&alunite
• Kaolinite & alunite areas are a possible indication of a gold deposit
• Quantitative analysis of multispectral bands allows the distinction and enhancement of certain compositional properties
3 km
Remote sensing in mineral exploration or the search for
chemical anomalies in the rocks
• The direct observation of rocks and alteration zones in the tropics is hampered by the presence of thick soils and dense vegetation.
• However remote sensing techniques have been developed to make use of the vegetation.
Remote sensing in mineral exploration or the search for
chemical anomalies in the rock
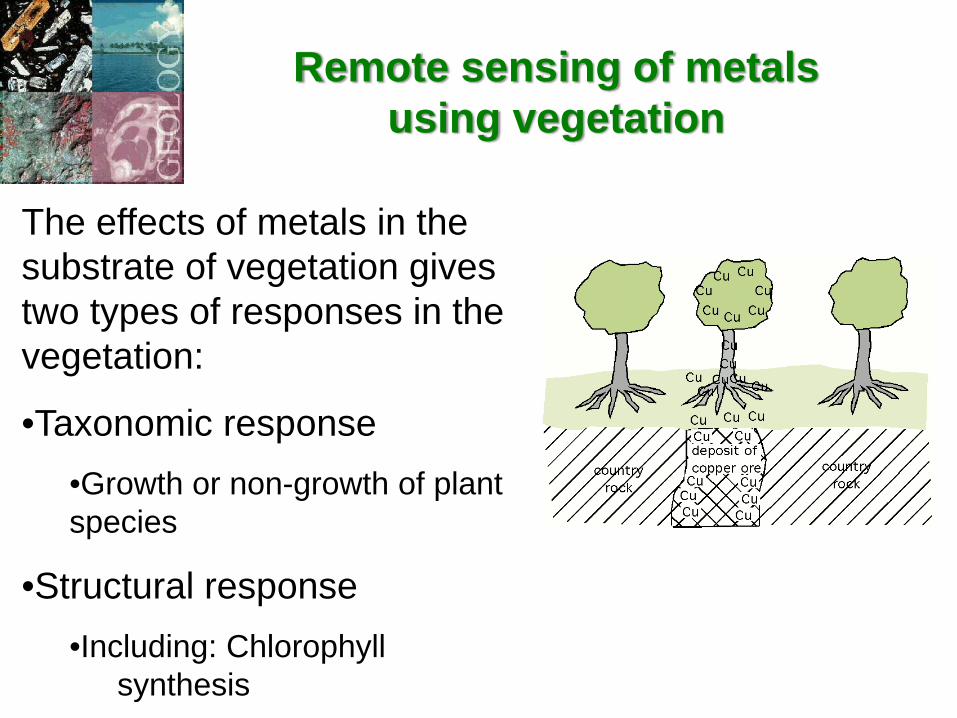
The effects of metals in the substrate of vegetation gives two types of responses in the vegetation:
•Taxonomic response•Growth or non-growth of plant species
•Structural response•Including: Chlorophyll
synthesis
Remote sensing of metalsusing vegetation
Reflectance of vegetation
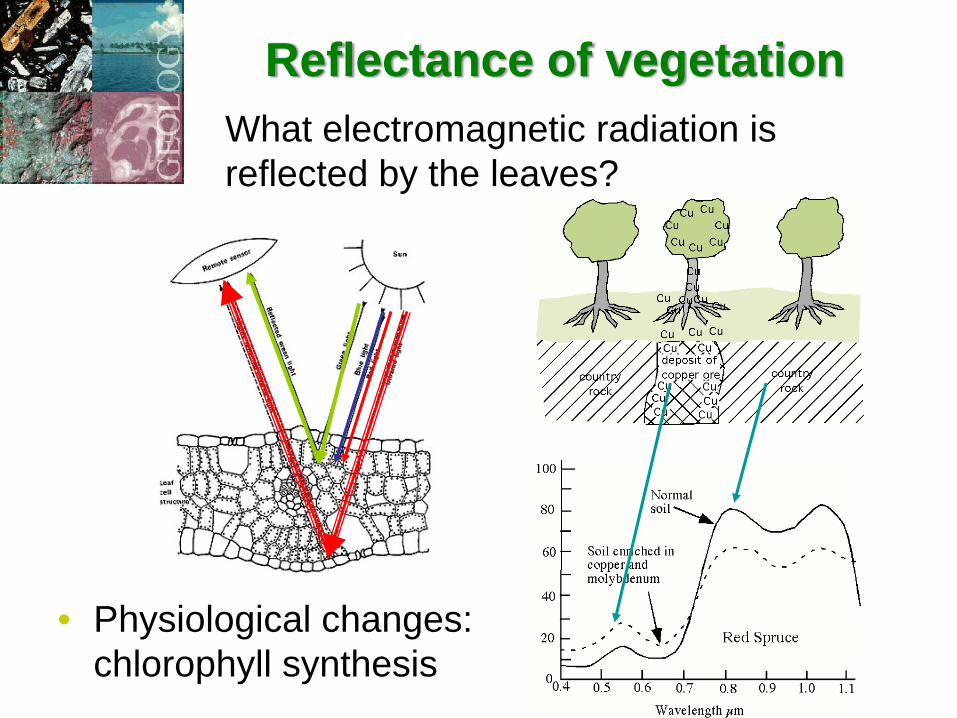
• Physiological changes: chlorophyll synthesis
What electromagnetic radiation is reflected by the leaves?
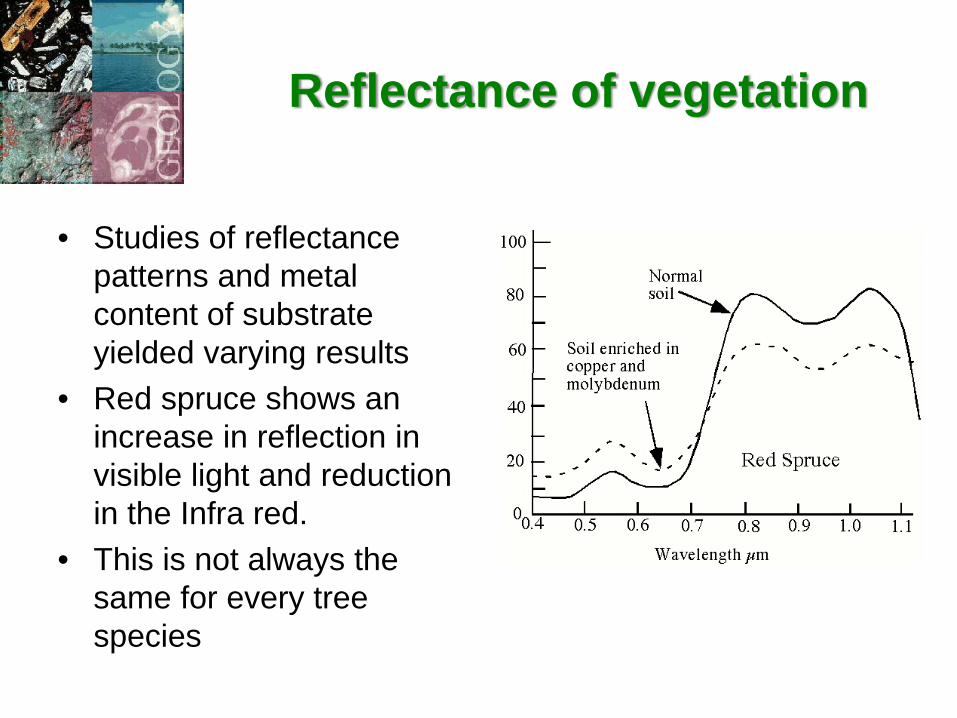
• Studies of reflectance patterns and metal content of substrate yielded varying results
• Red spruce shows an increase in reflection in visible light and reduction in the Infra red.
• This is not always the same for every tree species
Reflectance of vegetation
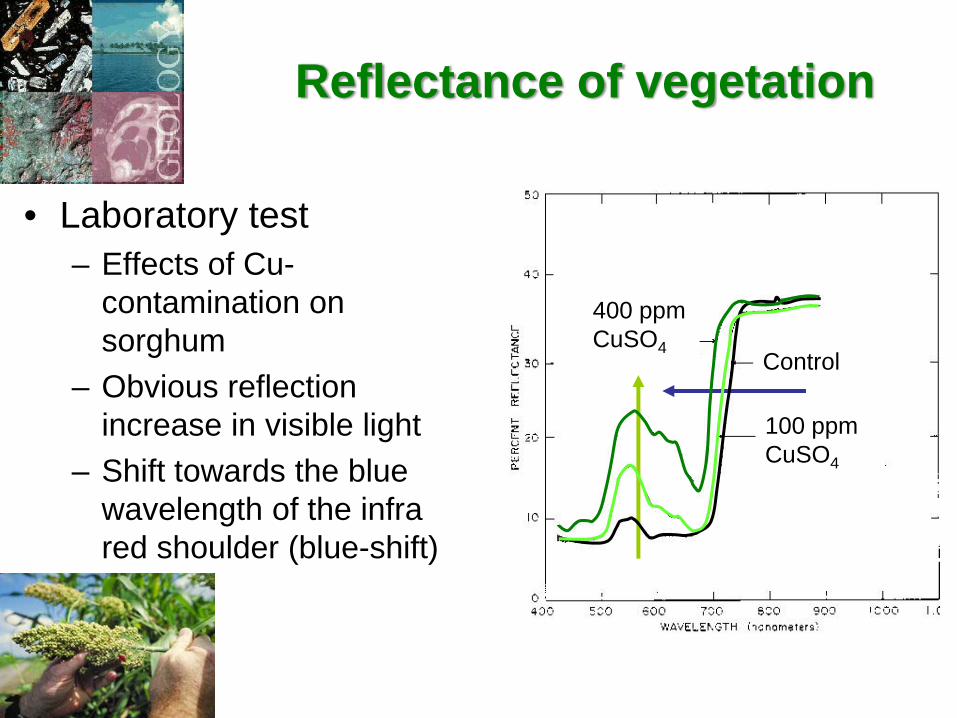
• Laboratory test– Effects of Cu-
contamination on sorghum
– Obvious reflection increase in visible light
– Shift towards the blue wavelength of the infra red shoulder (blue-shift)
Reflectance of vegetation
Control
100 ppmCuSO4
400 ppmCuSO4
• Remote sensing for mineral deposits using changes in the vegetation works, but with a lot of variables
• The use of vegetation is based on the detection of chemical anomalies in the substrate that influence pigments (e.g. chlorophyll) production
• Can the technique also be used to detect metal contamination in mangrove wetlands??
• A work in progress
Reflectance of vegetation
• Why mangroves?– The health of mangrove wetlands is of critical
importance to society in tropical marine regions; e.g. coastal protection, wildlife refuge, nursery for marine life
– Mangroves provide >10% of essential dissolved carbon in the oceans – influences global warming
– Mangrove wetlands have a more simple composition than the average tropical forest and may allow the use of remote sensing to detect anomalies
Importance of mangrove wetlands
Using remote sensing to detect heavy metals in substrate of mangroves
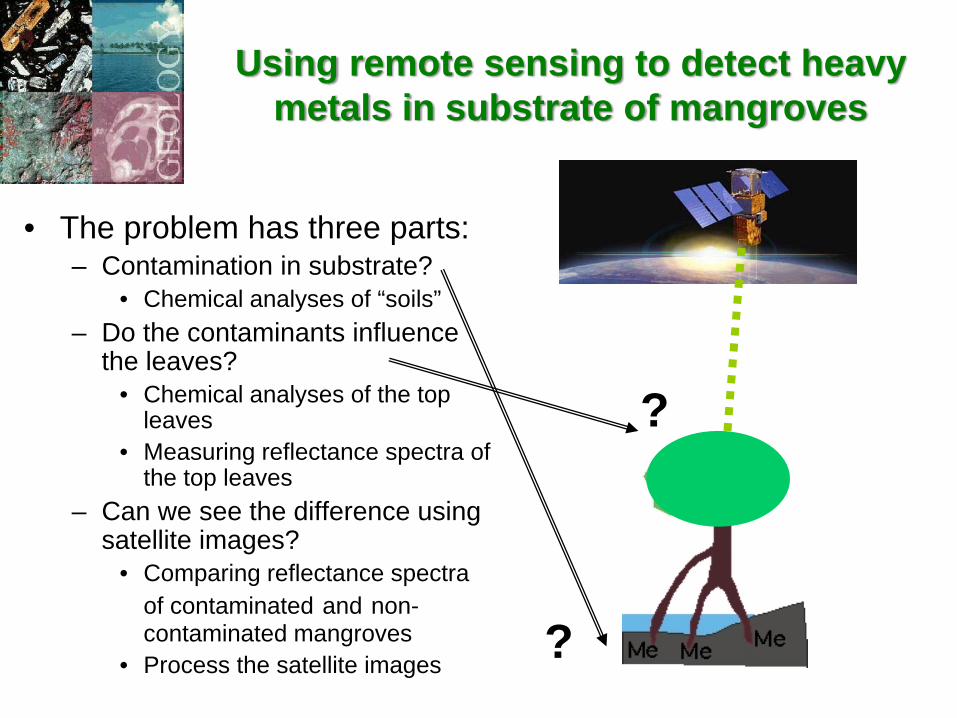
• The problem has three parts:– Contamination in substrate?
• Chemical analyses of “soils”– Do the contaminants influence
the leaves?• Chemical analyses of the top
leaves• Measuring reflectance spectra of
the top leaves– Can we see the difference using
satellite images?• Comparing reflectance spectra
of contaminated and non-contaminated mangroves
• Process the satellite images
?
?
Remote sensing to monitor mangroves for metal
contamination
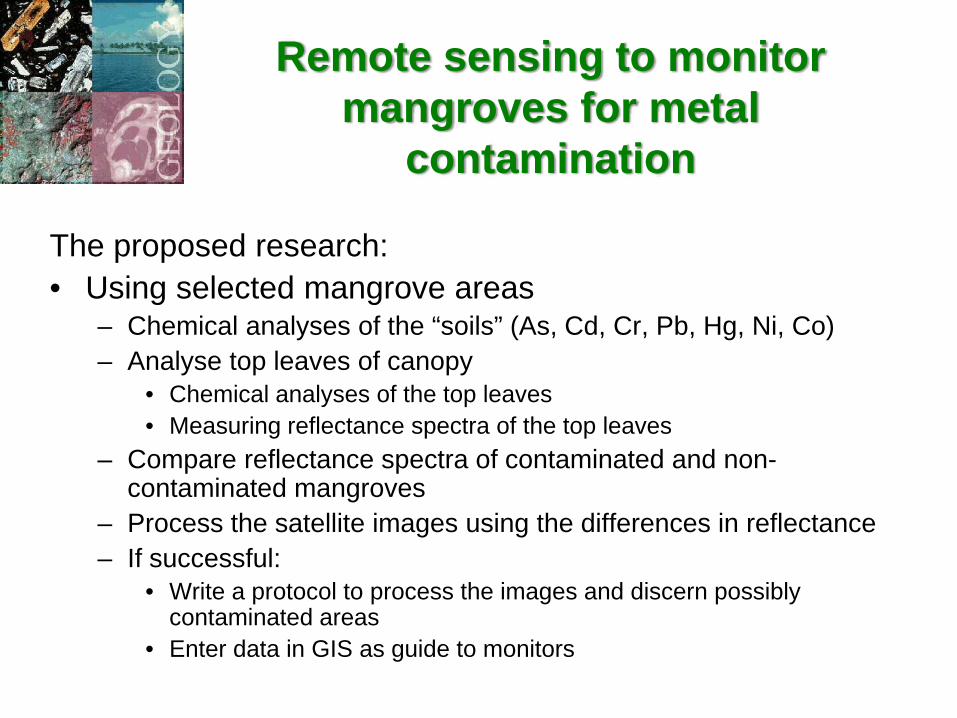
The proposed research:• Using selected mangrove areas
– Chemical analyses of the “soils” (As, Cd, Cr, Pb, Hg, Ni, Co)– Analyse top leaves of canopy
• Chemical analyses of the top leaves• Measuring reflectance spectra of the top leaves
– Compare reflectance spectra of contaminated and non-contaminated mangroves
– Process the satellite images using the differences in reflectance– If successful:
• Write a protocol to process the images and discern possibly contaminated areas
• Enter data in GIS as guide to monitors
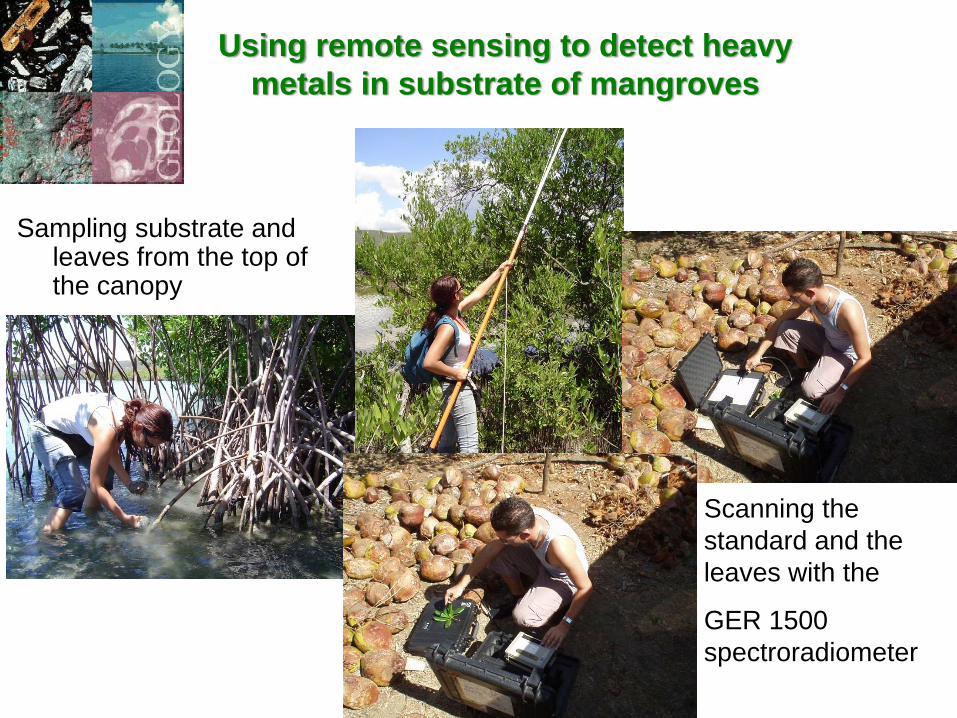
Sampling substrate and leaves from the top of the canopy
Using remote sensing to detect heavy metals in substrate of mangroves
Scanning the standard and the leaves with the
GER 1500 spectroradiometer
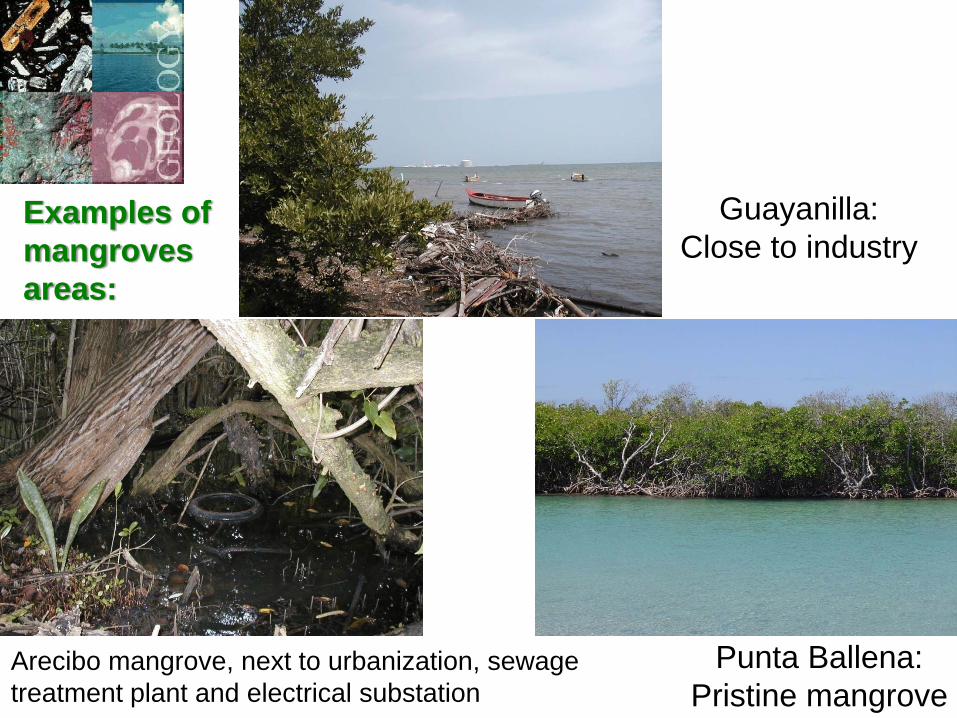
Guayanilla:Close to industry
Punta Ballena:Pristine mangrove
Arecibo mangrove, next to urbanization, sewage treatment plant and electrical substation
Examples of mangroves areas:
Using remote sensing to detect heavy metals in substrate of mangroves
• Pilot projects– Comparison of known heavy metal contaminated
mangroves with non-contaminated mangroves• Joyuda Lagoon next to Ni-Co laterite• Guayanilla reported Hg contamination• Arecibo in watershed with porphyry copper deposits• Guanica and Punta Ballena pristine environments
– Study of the transport of metals from the substrate to higher levels in the red mangrove
• Rhizophora mangle (red mangrove) Guayanilla and Joyuda – Use of AVIRIS
• Punta Ballena
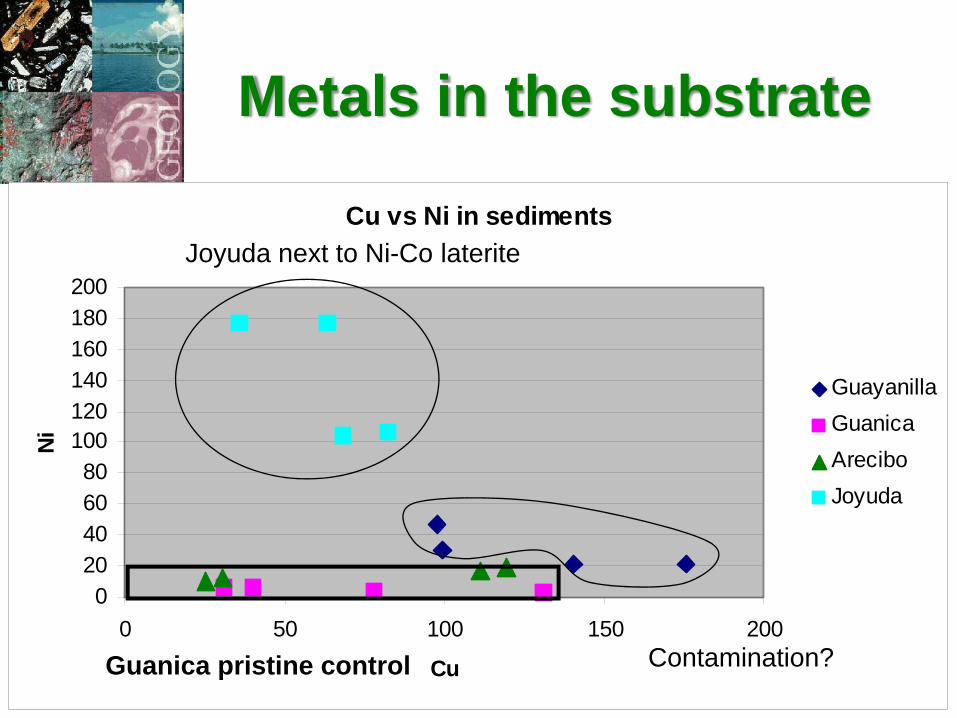
Metals in the substrate
Cu vs Ni in sediments
020406080
100120140160180200
0 50 100 150 200
Cu
Ni
GuayanillaGuanicaAreciboJoyuda
Joyuda next to Ni-Co laterite
Guanica pristine control Contamination?
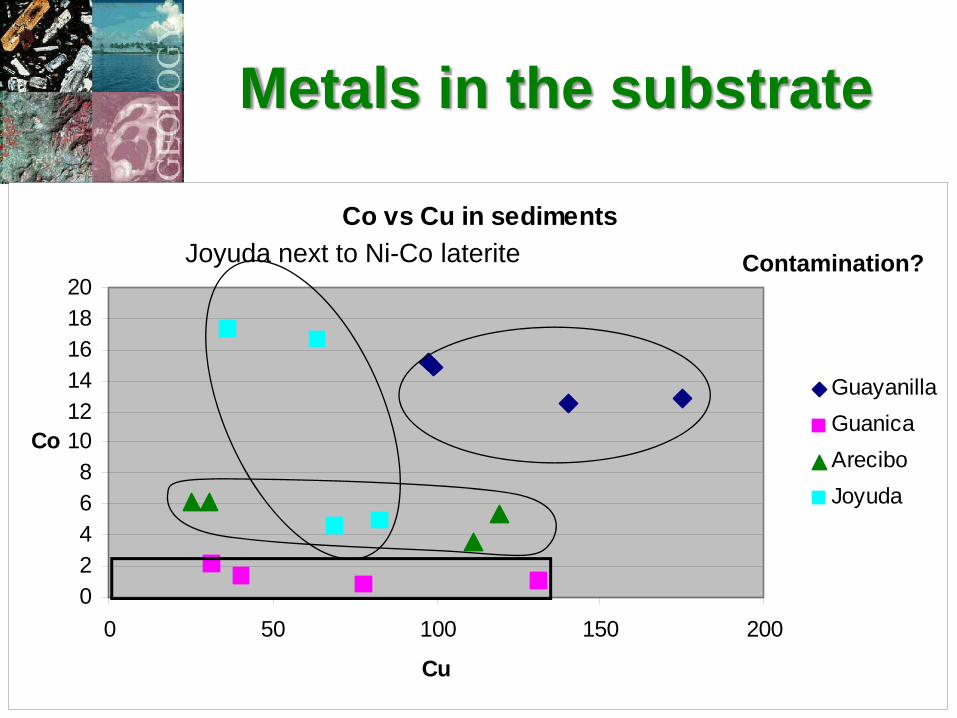
Co vs Cu in sediments
02468
101214161820
0 50 100 150 200
Cu
Co
GuayanillaGuanicaAreciboJoyuda
Contamination?Joyuda next to Ni-Co laterite
Metals in the substrate
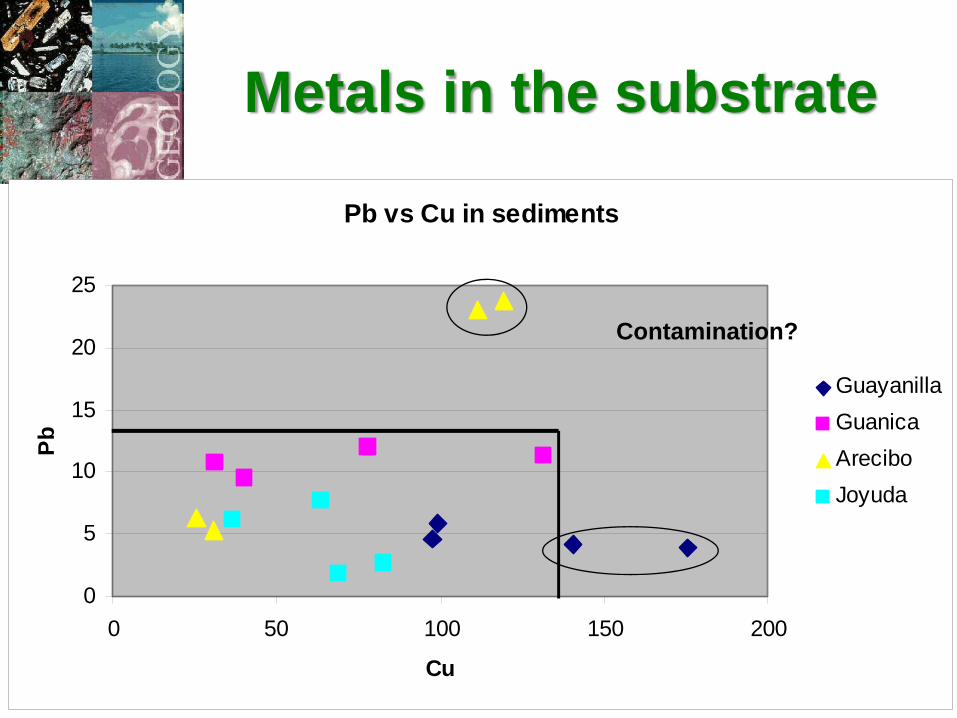
Pb vs Cu in sediments
0
5
10
15
20
25
0 50 100 150 200
Cu
Pb
GuayanillaGuanicaAreciboJoyuda
Contamination?
Metals in the substrate
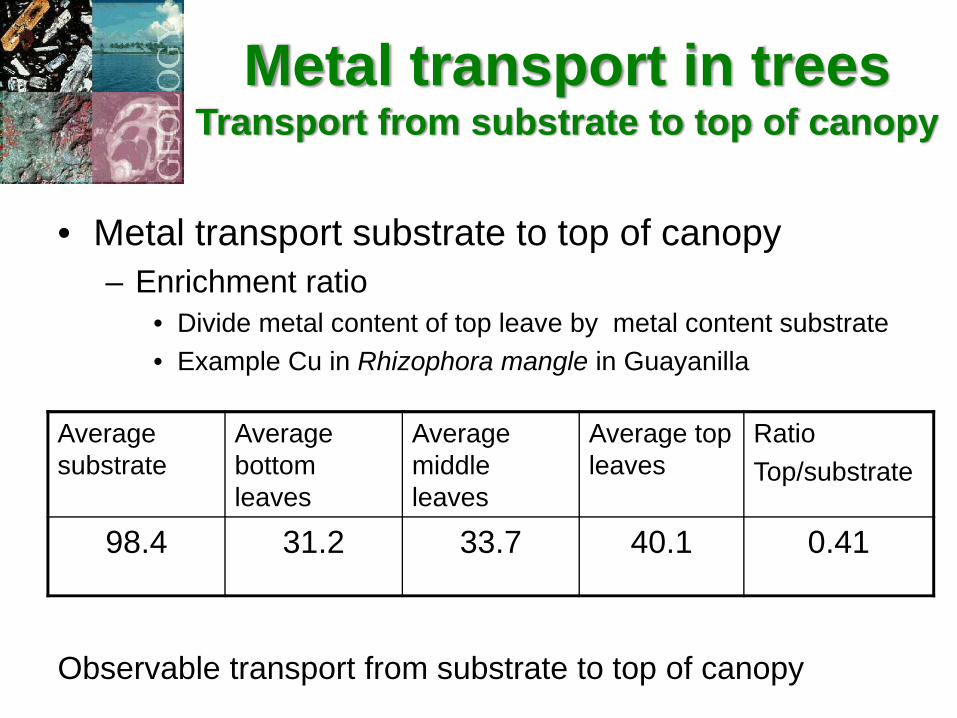
• Metal transport substrate to top of canopy– Enrichment ratio
• Divide metal content of top leave by metal content substrate• Example Cu in Rhizophora mangle in Guayanilla
Metal transport in treesTransport from substrate to top of canopy
Average substrate
Average bottom leaves
Average middle leaves
Average top leaves
Ratio Top/substrate
98.4 31.2 33.7 40.1 0.41
Observable transport from substrate to top of canopy
Metal transport in treesTransport from substrate to top of canopy
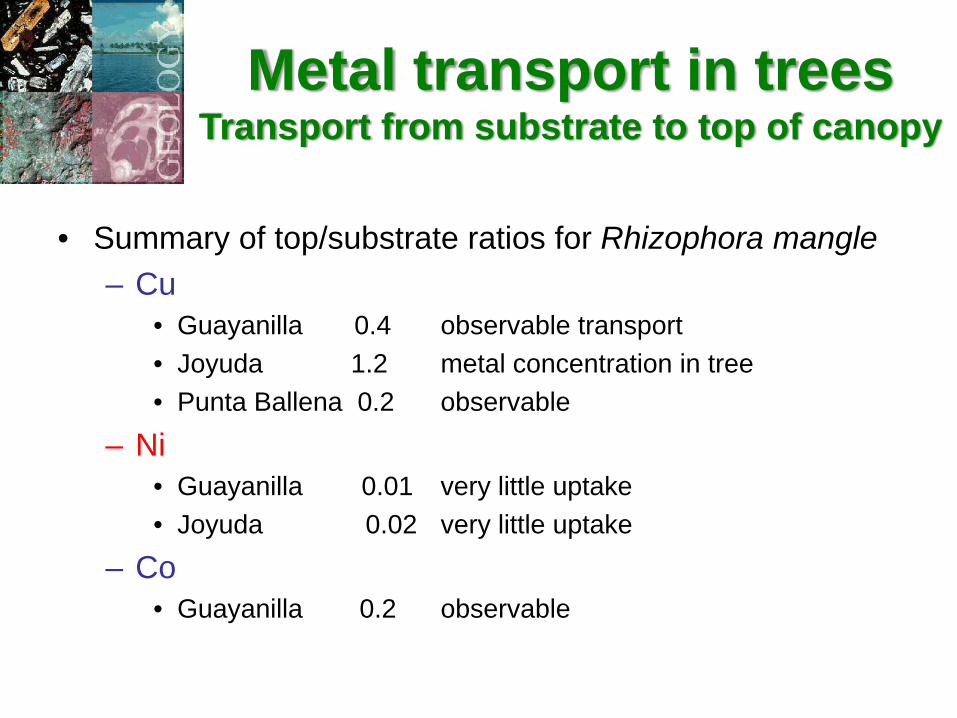
• Summary of top/substrate ratios for Rhizophora mangle– Cu
• Guayanilla 0.4 observable transport• Joyuda 1.2 metal concentration in tree• Punta Ballena 0.2 observable
– Ni • Guayanilla 0.01 very little uptake• Joyuda 0.02 very little uptake
– Co • Guayanilla 0.2 observable
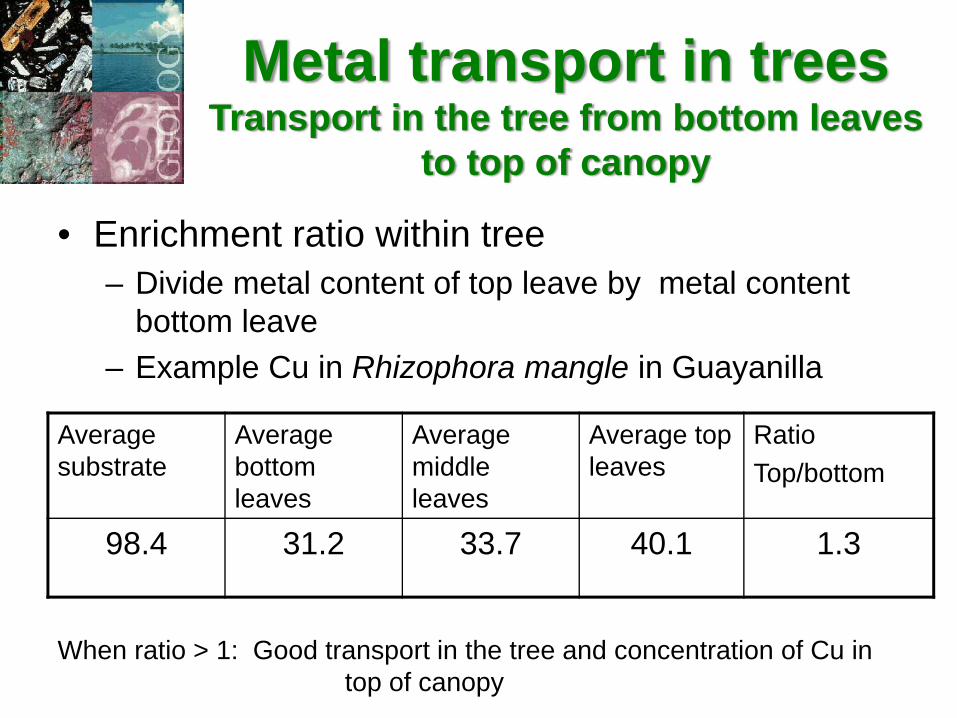
• Enrichment ratio within tree– Divide metal content of top leave by metal content
bottom leave– Example Cu in Rhizophora mangle in Guayanilla
Metal transport in treesTransport in the tree from bottom leaves
to top of canopy
Average substrate
Average bottom leaves
Average middle leaves
Average top leaves
Ratio Top/bottom
98.4 31.2 33.7 40.1 1.3
When ratio > 1: Good transport in the tree and concentration of Cu in top of canopy
Metal transport in treesTransport from within tree
to top of canopy
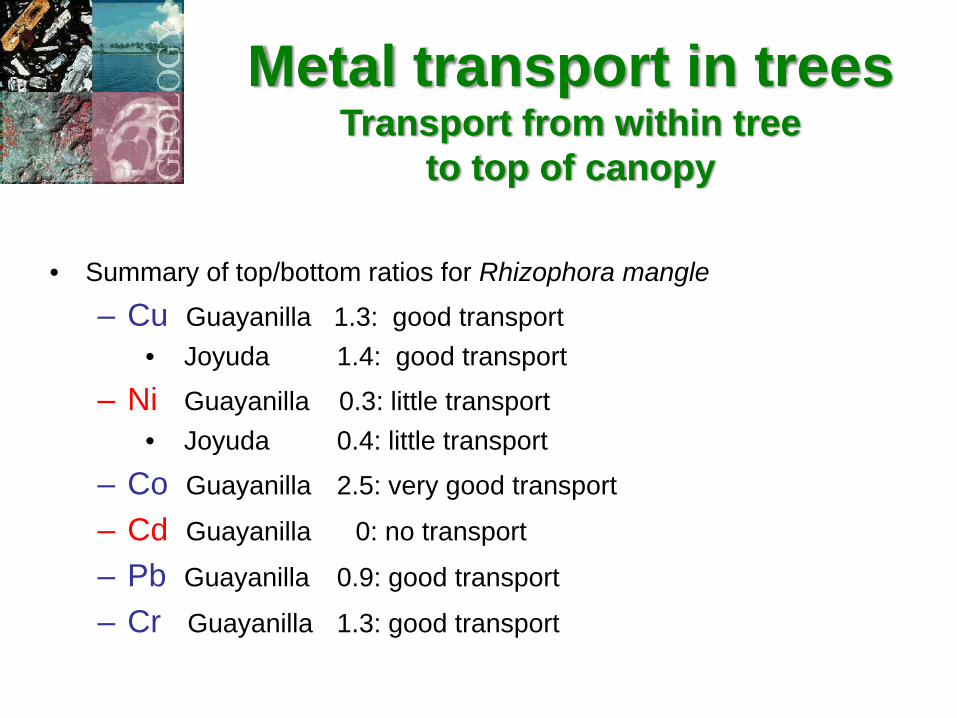
• Summary of top/bottom ratios for Rhizophora mangle
– Cu Guayanilla 1.3: good transport• Joyuda 1.4: good transport
– Ni Guayanilla 0.3: little transport• Joyuda 0.4: little transport
– Co Guayanilla 2.5: very good transport
– Cd Guayanilla 0: no transport
– Pb Guayanilla 0.9: good transport
– Cr Guayanilla 1.3: good transport
Summary
– In order to use mangrove as a monitor plant using remote sensing, the tree has to take up the metal from the substrate and transport it to the top of the canopy
– The present data suggest:• Rhizophora mangle can be used to monitor for Cu,
Co, and possibly Pb and Cr, but not for Ni and Cd• Avicennia germinans (black mangrove) can be
used to monitor for Cu, Co and Cd
AVIRISAdvanced Visible and InfraRed Imaging
Spectrometer
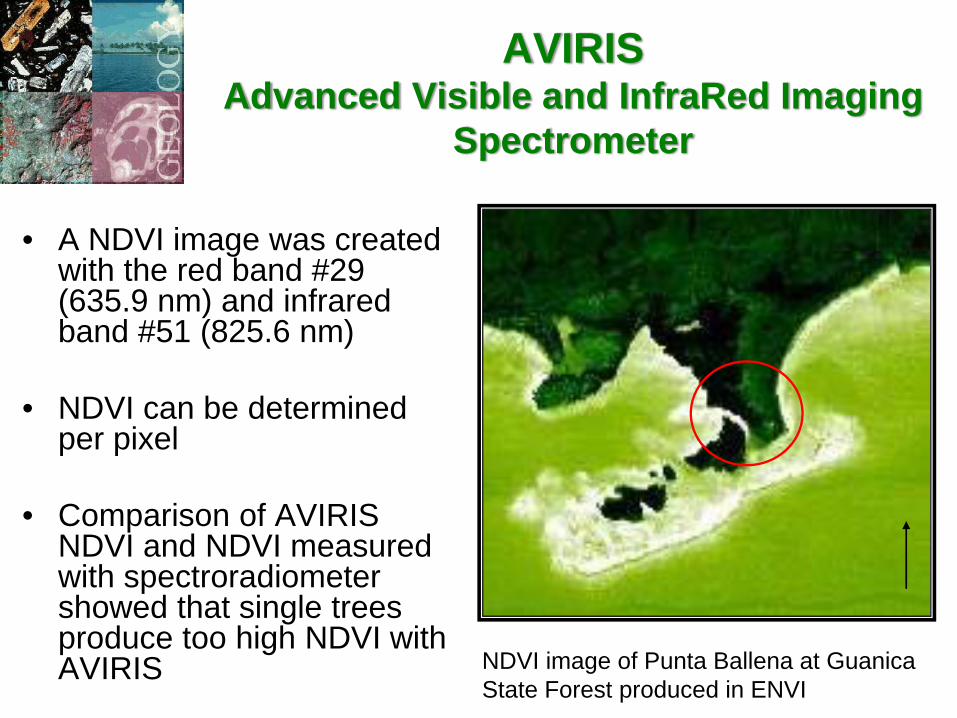
• A NDVI image was created with the red band #29 (635.9 nm) and infrared band #51 (825.6 nm)
• NDVI can be determined per pixel
• Comparison of AVIRIS NDVI and NDVI measured with spectroradiometer showed that single trees produce too high NDVI with AVIRIS NDVI image of Punta Ballena at Guanica
State Forest produced in ENVI
NDVI Analyses
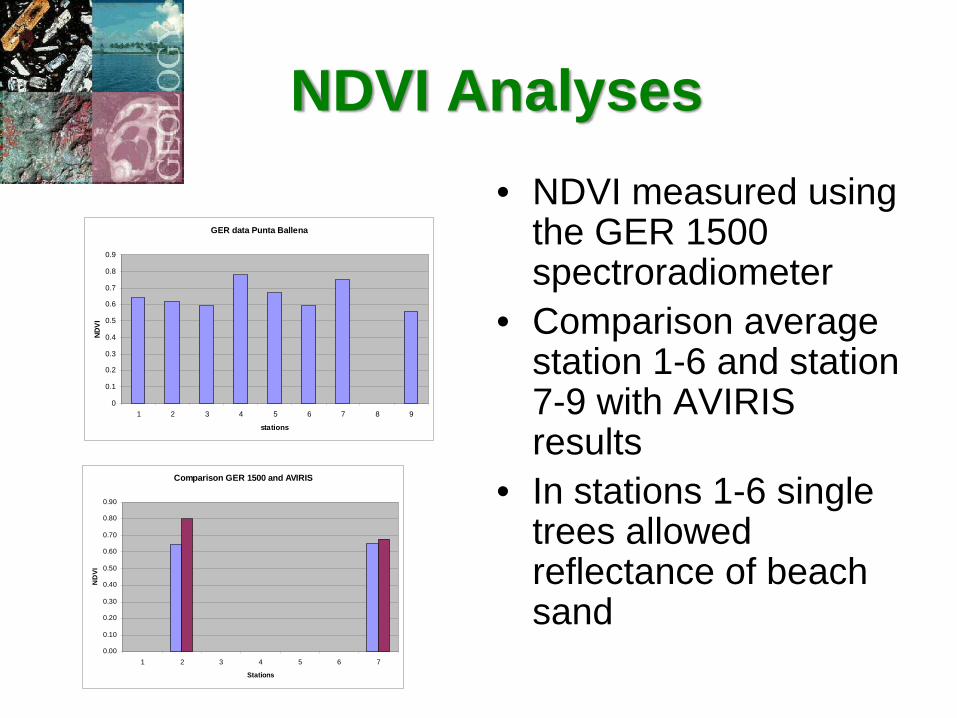
GER data Punta Ballena
0
0.1
0.2
0.3
0.4
0.5
0.6
0.7
0.8
0.9
1 2 3 4 5 6 7 8 9
stations
NDV
I
Comparison GER 1500 and AVIRIS
0.00
0.10
0.20
0.30
0.40
0.50
0.60
0.70
0.80
0.90
1 2 3 4 5 6 7
Stations
ND
VI
• NDVI measured using the GER 1500 spectroradiometer
• Comparison average station 1-6 and station 7-9 with AVIRIS results
• In stations 1-6 single trees allowed reflectance of beach sand
Conclusions
• The substrate of mangrove swamps does contain considerable amounts of heavy metals.
• Not all metals are taken up by mangroves– Cu, Co, Pb, Cr are taken up by Rhizophora mangle– Ni and Cd do not
• The reflectance spectra of mangroves when measured on the ground yield a wide range of reflectance spectra
• Averaging of these spectra seem to yield consistant results
• AVIRIS can be used, but ground truthing has to take into account the pixel size
Acknowledgments
– Dr. Arturo Massol– Ms. Elba Diaz– This work is funded by Sea Grant– Supported by the UPRM-Dept. of Geology