Embed Size (px)
Citation preview
WORKING PAPER SERIES IN PRODUCTION AND ENERGY
KIT – The Research University in the Helmholtz Associationwww.iip.kit.edu
Developing a three-stage heuristic
to design geothermal-based district
heating systems
Jann Weinand, Max Kleinebrahm, Russell McKenna,
Kai Mainzer, Wolf Fichtner
No. 33 | January 2019
Developing a three-stage heuristic to design geothermal-
based district heating systems
Jann Weinand, Max Kleinebrahm, Russell McKenna,
Kai Mainzer, Wolf Fichtner
*Corresponding author: Jann Michael Weinand, [email protected], +49
721 608 44444
Geothermal plants have been increasingly constructed in recent years to exploit the
high geothermal energy potential in Germany in district heating networks at the
municipal level. In order to use this potential economically, municipal planners need
instruments for designing the district heating network to supply households with the
geothermal heat. This paper presents a combinatorial mixed-integer linear optimisation
model and a three-stage heuristic to determine the minimum costs for geothermal
district heating systems in municipalities. The central innovations are the ability to
optimise both the structure of the district heating network and the location of the district
heating plant, the consideration of partial heat supply from district heating and the
scalability to many larger municipalities. A comparison of optimisation and heuristic for
three exemplary municipalities demonstrates the efficiency of the developed heuristic:
the optimisation takes between 500% and 10,000,000% more time than the heuristic.
The resulting deviations in the calculated total investment for the district heating from
the results of the optimisation are in all cases below 5% and in 80% of cases below
0.3%. The efficiency of the heuristic is further demonstrated by the comparison with
simpler heuristics like the Nearest-Neighbour-Heuristic. The latter is not only less
efficient, it substantially overestimates the total costs by up to 80% in all cases with
less than 100% heat coverage. Future work should focus on a more precise
consideration of heat losses in the district heating network, as well as taking additional
geological and topological conditions in the municipalities into account.

1
1. Introduction
The German energy sector is currently undergoing radical structural change due to ambitious
national climate targets and supportive energy policy. This change is dominated by the
expansion of renewable energy generation technologies, which are mainly exploited on a
decentralised basis due to their characteristics (Wirth 2018). Thereby the energy system
changes towards a more decentralised structure, which also applies to the owners and
operators of energy plants (McKenna 2018). In Germany, private individuals increasingly
invest in renewable energy systems or form energy cooperatives for this purpose. In fact, the
majority of regenerative plants in Germany are owned and operated by private individuals,
farmers and communities, which together are community energy in the wider sense
(trend:research 2017).
The above-mentioned development has led to the generation of 33% of the electricity in
Germany by renewable energies in 2017 (Statistisches Bundesamt 2017). In contrast, the
proportion of renewable heat supply is around 13 % (UBA 2018). The installed capacity of
renewable energies includes around 55 GW of wind energy (on- and offshore), 42 GW
photovoltaic (PV) systems, about 7 GW of bioenergy and 39 MW of geothermal energy (BMWi
2017; UBA 2018). In comparison to the other renewable energies, relatively little electricity is
generated by geothermal plants (GTPs) in Germany. Despite the fact that GTPs could make a
major contribution to reducing greenhouse gas emissions, the installed capacity is still very low
compared to the available resources (Agemar et al. 2018).
The currently (2017) installed 30 GTPs in Germany generate about 155 GWh of electricity and
1.3 TWh of heat annually, which is generally used for district heating (DH) applications (Weber
et al. 2016; Agemar et al. 2018; UBA 2018). However, the German district heating networks
(DHNs) are currently mainly supplied with heat by conventional gas and coal-fired plants
(AGFW et al. 2018). Most of the heat is consumed in the residential sector, in which the market
share of DH is 13.8% (Euroheat & Power 2017; AGFW et al. 2018). Between 2000 and 2017,
DHNs are constantly being expanded and the consumption of DH in the residential sector
increased by about 40% (AGFW 2017; AGFW et al. 2018).
The low emission of pollutants during operation of GTPs means that they could provide low-
carbon heat for future DH systems. They could thereby contribute to higher levels of renewable
heat supply, as is already achieved in some DHNs based on GTPs at the municipal level
(Hechler & Bredel-Schürmann 2011). As the literature review in Section 2 shows, planning
instruments are needed to support decision-making in the planning of municipal-level DHNs.
The focus of this study is on the development of a novel method for designing a DH system
based on geothermal heat in an arbitrary municipality. In comparison to existing work, this
paper presents a generic approach for the simultaneous optimisation of DHN and DH plant

2
locations under local geographic conditions. Due to the high complexity of this combinatorial
optimisation problem, an optimisation is not possible for a large number of settlements.
Therefore, a heuristic is developed for the planning of the DHNs, whose efficiency is evaluated
with the aid of the optimisation model. The location of the GTP as well as the DHN are designed
depending on the location, heat demand and heat density of the individual settlements within
a municipality. In the first stage of the three-stage heuristic, the integrated selection of the GTP
location and the initial design of the DHN is performed. In the second stage, an algorithm is
employed to optimise the design of the DHN. Based on the results, the optimum heat allocation
to the settlements connected to the DHN is determined in the third stage. Beyond the
development of this new approach, a way of using the results in a holistic energy system
optimisation is addressed.
The paper is structured as follows. Section 2 provides an overview of the literature and clarifies
the context of this paper. Section 3 then shows the methodology, before Section 4 presents
and discusses the results. The paper concludes with a summary and conclusions in Section 5.
2. Literature review
This chapter highlights the novelty of the methodology developed in this study. First of all,
Section 2.1 shows that previous energy system analyses with geothermal DH systems do not
include a dimensioning of the DHNs. Afterwards, approaches for dimensioning DHNs are
analysed and the differences to the evolved methods are identified (cf. Section 2.2).
Section 2.3 concludes by clarifying the differences between the developed methods and typical
combinatorial optimisation problems.
2.1. Energy system analyses with geothermal district heating
A few studies have already investigated energy systems in municipalities in which geothermal
DH is used. Østergaard et al. (2010) investigate the feasibility of supplying the municipality of
Aalborg in Denmark with renewable energy through a combination of low-temperature
geothermal heat, wind power plants and biomass. The results of the simulations show that
these technologies cannot cover the demand of Aalborg in every hour and that energy has to
be imported instead. The study of Østergaard & Lund (2011) on Frederikshavn in Denmark, in
which the city's energy demand should be 100% renewable, also takes deep geothermal
energy into account as a heat generation plant with DHN. The simulations demonstrate that
the operation of the GTP and the DHN reduces the energy imports of Frederikshavn. In the
study of Sveinbjörnsson et al. (2017), the municipality of Sønderberg in Denmark is
considered, which is aiming for zero net CO2 emissions by 2029. Exactly as in Østergaard &
Lund (2011), the GTP is combined with an absorption heat pump. The optimisations indicate
that by supplementing combustion with modern energy conversion technologies, the climate
targets can be achieved in a cost- and energy-efficient manner.
3
In the studies described above, the DHN already exists and is not further analysed. Besides,
the location of the DH plant is not optimised in these studies but is specified manually
beforehand. Some studies on DH in energy system analyses have been conducted in which
DH is not based on geothermal energy such as Möller & Lund (2010). The authors examine
the expansion of DH in a region in Denmark which is currently supplied with natural gas. The
energy system of the region, however, is not optimised, but only analysed with the help of
various scenarios. One conclusion is to replace natural gas with DH, especially in the vicinity
of cities, and to increase the share of DH in the heat supply from 46% to 50%-70%. However,
this paper indicates that the use of geothermal energy should be included in future analyses
when considering DH. To the best of the authors' knowledge, energy system optimisations of
entire municipalities in which the DHNs are designed simultaneously with other technologies
have not been implemented so far. Section A.2 in the appendix shows how this could be
accomplished in future energy system optimisations.
2.2. Algorithms for district heating design
Studies in which the design of DHNs is determined without the involvement of other energy
technologies, by contrast, have been conducted with several different approaches. In general,
however, these studies are based on a basic methodology, which is also the basis of our
analysis, in which different nodes / buildings / settlements are connected by edges / pipelines.
Table 1 summarises important characteristics of the studies discussed in this section. This
paper distinguishes between bottom-up methods, in which the calculations are based on data
of individual buildings and roads, and top-down approaches, which use e.g. heat and
population densities.
The majority of studies dealing with the dimensioning and placement of DHNs are limited to
DH pipelines within one urban area and do not consider the connection of several urban areas.
Casisi et al. (2009), for example, determine the optimum layout of a DHN in conjunction with
combined heat & power units in the city centre of Pordenone, Italy. The distances between the
six considered buildings are specified beforehand. The location of the DH plant is not optimised
here, but the authors note that this could lead to cost reductions. Damiana (2008) designs two
district heating and cooling networks in the municipality of Udine in Italy with the help of an
optimisation model. In designing the size and layout of the network, central and distributed
generation of heating and cooling are combined and compared in consideration of the network
costs. In the simulation model of Bratoev et al. (2017), the DHN with connections to the
buildings is first generated on the basis of a road network. Afterwards the location of the DH
plant can be selected, which is then connected to the DHN via the shortest distance. The
algorithm requires an extensive building database, which must be collected in advance, for
example through surveys. In Nielsen (2014), an algorithm is developed to economically

4
evaluate possible network expansions based on existing DHNs. This is done on the basis of
cost calculations for heat production, distribution and transmission, based on geographical
data. Although the model presented is transferable to Danish Regions, its application in
German municipalities would fail due to the availability of data. To the authors' knowledge,
shapefiles with building locations are not available for the whole of Germany. An extension of
existing DHNs is also investigated by Delangle et al. (2017). In addition to DH, gas boilers,
biomass boilers, heat pumps and heat storages are considered in a mixed-integer linear
optimisation. The model can identify the optimal investment schedule for a DHN extension by
a couple of buildings. The methodology can be applied to other DHNs, but in this case the
existing DHN and the potential buildings to be connected have to be known. However, a
planning instrument for German municipalities should focus more on the construction of new
DHNs than on DHN expansion, as the share of DH in residential heating systems is less than
5% in over 85% of German municipalities (Statistisches Bundesamt 2014).
In Fazlollahi et al. (2014) and Unternährer et al. (2017), the DHN is dimensioned based on
cluster analyses, in order to reduce the model complexity. The clustering of urban areas in
Fazlollahi et al. (2014) results in combined urban districts whose energy demand and
distribution costs of DH can be aggregated in order to subsequently optimise the DHN design.
In Unternährer et al. (2017), the optimum design of the DHN is determined for each cluster. As
in the present analysis, geothermal energy is used for DH. The authors highlight the economic
value of geothermal energy for DH supply. However, memory restrictions occur during this
analysis. Since only one settlement and not an entire municipality is analysed, this approach
is not suitable to meet the objectives of our study.
Marty et al. (2018) highlight the relevance of a simultaneous optimisation of the DHN and the
organic rankine cycle (ORC) as parts of a GTP. The optimisation of the DHN is integrated into
a larger energy system optimisation, namely the optimisation of a GTP. However, no
alternative energy generation technologies are taken into account in this energy system
optimisation. Nevertheless, some differences to our study are apparent. The location of the
DH plant is specified in the study and is not optimised. Furthermore, there is always a
consumer who is connected, i.e. the construction of the DH plant is not decided but the DHN
is built in any case. The heat demand of the consumers has to be completely covered and the
consumers are not settlements in which additional networks for connections have to be
included. No statement is made on the transferability of the model. Overall, however, it can be
stated that the model in the study cannot be used for the purposes intended by our study.
Dobersek & Goricanec (2009) determine the optimal tree branch path of a DHN in an urban
area taking economy and functionality into account. The influence of construction cost, pump
and electric energy cost on the type of optimal network is investigated. The locations of heat
5
source and consumers are defined in advance and the optimal network for a complete supply
of all consumers has to be determined. The edges are also fixed in advance and cannot lead
from each node to any other node. In the optimisation approach of DHNs in Bordin et al. (2016)
the tree configuration of a network is determined starting from one heat supply plant. An
existing network is assumed, which can be extended by potential pipelines and customers to
maximise the net profit. For more complex analyses in future studies, the authors propose the
use of heuristics to reduce computing times. Like the studies described above, the model from
Bordin et al. (2016) is suitable for the individual planning of a DHN, but not as part of a larger
energy system optimisation model of a municipality or region.
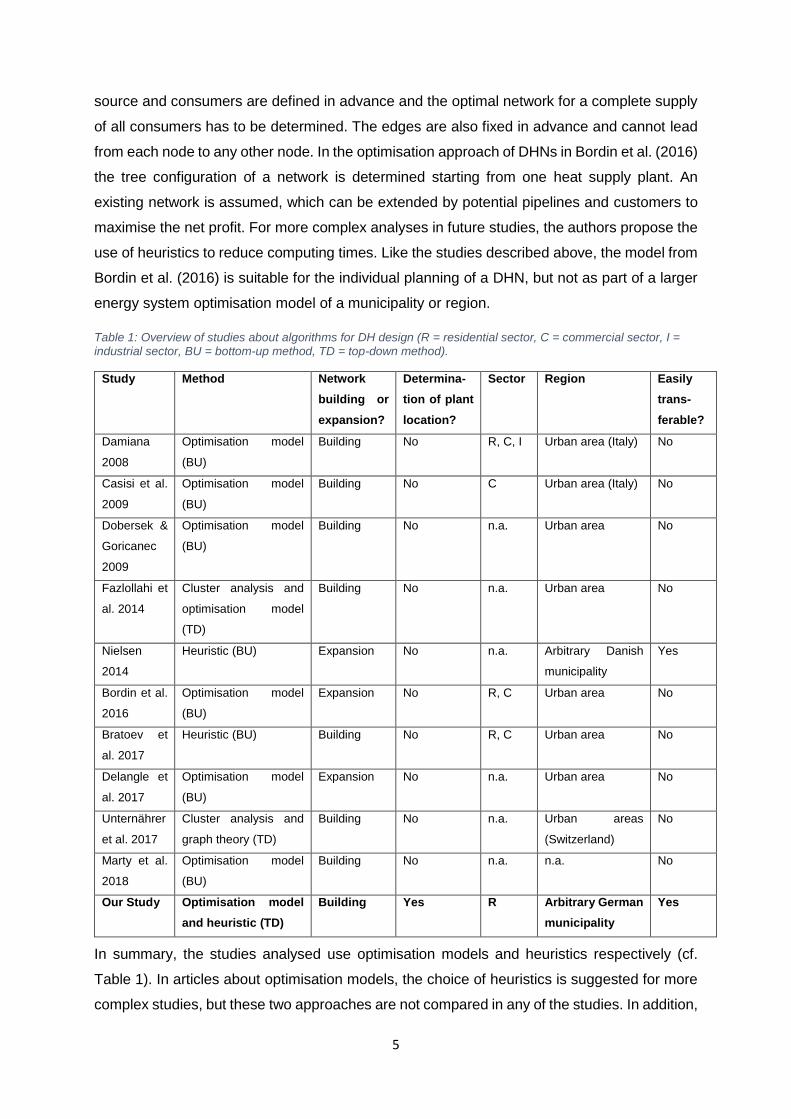
Table 1: Overview of studies about algorithms for DH design (R = residential sector, C = commercial sector, I = industrial sector, BU = bottom-up method, TD = top-down method).
Study Method Network
building or
expansion?
Determina-
tion of plant
location?
Sector Region Easily
trans-
ferable?
Damiana
2008
Optimisation model
(BU)
Building No R, C, I Urban area (Italy) No
Casisi et al.
2009
Optimisation model
(BU)
Building No C Urban area (Italy) No
Dobersek &
Goricanec
2009
Optimisation model
(BU)
Building No n.a. Urban area No
Fazlollahi et
al. 2014
Cluster analysis and
optimisation model
(TD)
Building No n.a. Urban area No
Nielsen
2014
Heuristic (BU) Expansion No n.a. Arbitrary Danish
municipality
Yes
Bordin et al.
2016
Optimisation model
(BU)
Expansion No R, C Urban area No
Bratoev et
al. 2017
Heuristic (BU) Building No R, C Urban area No
Delangle et
al. 2017
Optimisation model
(BU)
Expansion No n.a. Urban area No
Unternährer
et al. 2017
Cluster analysis and
graph theory (TD)
Building No n.a. Urban areas
(Switzerland)
No
Marty et al.
2018
Optimisation model
(BU)
Building No n.a. n.a. No
Our Study Optimisation model
and heuristic (TD)
Building Yes R Arbitrary German
municipality
Yes
In summary, the studies analysed use optimisation models and heuristics respectively (cf.
Table 1). In articles about optimisation models, the choice of heuristics is suggested for more
complex studies, but these two approaches are not compared in any of the studies. In addition,

6
none of the studies in which the networks are newly built is suitable for use in entire
municipalities, but only for planning DHNs in urban areas. Furthermore, the studies cannot
easily be applied to arbitrary municipalities in Germany. All these points are addressed with
the approaches in the present article.
2.3. Combinatorial optimisation of networks
Most, if not all of the studies in the previous section use the methodology of combinatorial
optimisation. As particularly evident in the studies by Dobersek & Goricanec (2009) and Bordin
et al. (2016), the optimisation of network design in DH systems falls within the scope of
minimum spanning tree (MST) problems. Therefore, papers on MST problems are analysed in
the following in order to draw conclusions for DHN optimisations.
Smith & Walters (2000) describe an evolutionary approach based on genetic algorithms to find
the optimal trees in undirected water, gas or material networks. Based on the construction and
operating costs, a network tree is identified that is close to the optimum. In order to be able to
execute the genetic algorithm, however, starting solutions must first be identified. Blanco et al.
(2017) extend the MST problem so that the nodes are not points but belong to regions with a
certain geometry to reflect uncertainty of the location of a node. Efficient algorithms and
formulations of the problem have been implemented by the authors to solve the problem in a
reasonable time. The methodology with the uncertain locations of the heat consumers could
also be relevant for DH designing models (cf. Section 4.4). Fernández et al. (2017) focus on
multiobjective spanning trees and aggregate the vector of the objective values. Formulations
of the problem are developed which reduce the number of decision variables and thus the time
needed to solve the problem.
Gao & Jia (2017), Salgueiro et al. (2017) and Gouveia et al. (2014) investigate another form
of the MST, the degree-constrained minimum spanning tree (DCMST). The problem
formulation of the DCMST contains additional restrictions regarding the degree of the nodes,
i.e. how many edges are connected to a node. This restriction is not meaningful for the DHNs
considered in our study, as an unlimited number of pipelines should be allowed to enter and
leave the nodes. In addition, there is no need to limit the number of end nodes / leaves as done
in Gouveia & Simonetti (2017). In this study, they develop a competitive model for the max-
leaves problem. Cerrone et al. (2014) show in their paper that a spanning tree with a minimum
number of leaves is better suited for minimising the number of light-splitting devices required
in optical networks than two other MST problems. In Marín (2015), the MST problem is
adjusted to minimise the number of branches, i.e. nodes with a degree greater than two. As in
our study, a multi-stage heuristic is being developed for this problem. However, the limitation
of the number of branches should not apply to DH systems either.

7
The approach for DHNs in our study differs from the MST problems described above in the
following points:
Not every node has to be connected (cf. Eq. 8-10 in Section 3.2).
Not only the edges, but also the nodes have weights (cf. Eq. 3 in Section 3.2).
Edges go from every node to all other nodes (cf. Eq. 2 in Section 3.2).
A decision must be made "to which percentage" a node is connected (cf. Eq. 3, 5
and 11 in Section 3.2).
Instead of one starting point / source, there is an arbitrary number of sources, of which
one must be selected (cf. Section 3.1 and Eq. 6 in Section 3.2).
The aim of this paper is not only to provide a unique optimisation problem / heuristic for the
planning of DHNs in municipalities, but also to solve the problem in a reasonable time.
Furthermore, the method presented in the following section should be applicable to every
municipality in Germany.
3. Methodology
The distance to the heat consumers is crucial for the costs of using heat in DHNs. Therefore,
an optimisation model as well as a heuristic for the designing of DHNs and the placement of
the DH plant is developed in this study. In the models, the location of the GTP and the
connection of the settlements by a DHN are determined for an arbitrary municipality
considering the minimisation of the investment for the DHN. Possible locations for the GTP are
specified in advance, as the following Section 3.1 shows, which describes the determination
of input data and the most important assumptions. The optimisation model for determining the
optimal DH system is presented in Section 3.2 and the heuristic in 3.3.
3.1. Input data generation and assumptions
The optimisation model and the heuristic are demonstrated using the German municipality
"Groß Kreutz", which is shown in Figure 1. The figure illustrates the possible locations for
placing the GTP as purple circles and the pink areas are CORINE Land Cover (CLC)
settlement areas from EEA (2016). The number of possible locations of the GTP can be
specified manually via the distances between the purple circles. The locations were set so that
35 locations are between the minimum and maximum longitude coordinates and/or latitude
coordinates. In Groß Kreutz this results in 497 possible locations i.e. 5 locations per km².
Section 4.3.2 shows that this number is sufficient, as a further increase does not significantly
affect the results. The shapefiles of these CLC areas are provided by the Federal Office of
Cartography and Geodesy (Lenk et al. 2017). Some of the purple circles are close to the
settlement areas, since GTPs do not have to keep a minimum distance to settlements as long
as measurements are taken to assess vibrations according to DIN 4150-3 (HLUG 2011). Using

8
OpenStreetMap, inadmissible areas such as settlements, water areas, forests, etc. were
excluded as locations for the GTP1. The settlements marked in pink differ in terms of their heat
demand and building density. The most important assumptions include the specific costs cp for
pipelines outside the settlements, which are estimated to be 200 €/m (C.A.R.M.E.N. e.V 2012;
Pfnür et al. 2016). The relatively low value of 200 €/m is supposed to reflect the receipt of a
subsidy in the context of the Combined Heat and Power Act (KWKG) amounting to 100 €/m of
DHN built (BMJV 2018). However, the 200 €/m are above the 160 €/m in the geothermal project
Grünwald (Erdwärme Grünwald GmbH 2013). The DH substations are assumed with a
reference size of 250 kW (Connolly et al. 2014; Le Truong et al. 2015). If the heat demand in
a settlement exceeds 250 kW, more than one substation has to be built. According to Connolly
et al. (2014) and Le Truong et al. (2015), the costs for one substation cs are assumed to be
4000 € and 70 €/kW, i.e. 21,500 € for 250 kW. The pipeline costs within the settlements are
estimated using the methodology of Persson & Werner (2011).
Figure 1: Possible locations (purple circles) for building the GTP in the municipality Groß Kreutz (Havel). The
background map in in this and the following figures is from OpenStreetMap contributors (2018).
Parameters for all German settlements required for this study are taken from Weinand et al.
(2018a), including the heat demands, living spaces, population densities, coordinates of the
centroids etc. This also includes the shares of existing DH supplies in the total heat supply,
1 The red encirclement at the right of Figure 1 represents a possible error in the placement of the purple
circles. The error occurs due to the fact that OpenStreetMap uses slightly different municipal boundaries,
which differ from the municipal boundaries of the shapefiles from the Federal Office of Cartography and
Geodesy used here to illustrate the municipality. These possible errors can be neglected as they only
occur at the municipal boundaries and are rather unlikely to be chosen as the location for the GTP due
to the large distance to the settlements.
1 km

9
which are subtracted from the heat demand of the settlements in the optimisation as well as in
the heuristic. This is intended to prevent district heating networks from being built where
networks already exist. These data for all German settlements and the heuristic are made
available as supplementary material. In addition, the necessary input data for the municipality
Groß Kreutz are provided as an example. Section A.2 in the Appendix additionally explains
and discusses in which way the results of the heuristic could be used in a holistic energy
system optimisation of a municipality.
In the following section, variables are marked in bold letters. A nomenclature of variables and
parameters can be found in Section A.1 of the appendix.
3.2. District heating system optimisation
The combinatorial optimisation model for the cost-optimised placement of the GTP as well as
the determination of the optimal DHN minimises the total costs Ctotal. These costs consist of
the costs for the DH pipelines in and outside the settlements, Cpipe,in and Cpipe,out, as well as the
DH substations Csub according to Eq. 1.
𝑚𝑖𝑛 𝑪𝒕𝒐𝒕𝒂𝒍 = 𝑪𝒑𝒊𝒑𝒆,𝒐𝒖𝒕 + 𝑪𝒑𝒊𝒑𝒆,𝒊𝒏 + 𝑪𝒔𝒖𝒃 1
𝑪𝒑𝒊𝒑𝒆,𝒐𝒖𝒕 = (∑ ∑ 𝒙𝑮,𝒍,𝒊 ⋅ 𝑙𝐺,𝑖,𝑙
𝑛
𝑖=1
𝑚
𝑙=1
+ ∑ ∑ 𝒙𝑺,𝒊,𝒋 ⋅ 𝑙𝑆,𝑖,𝑗
𝑛
𝑗=1
𝑛
𝑖=1
) ⋅ 𝑐𝑝 2
𝑪𝒑𝒊𝒑𝒆,𝒊𝒏 = ∑ (𝐻𝐷𝐶𝑖 ⋅ ∑ �̇�𝑖,𝑡
𝑇=8760
𝑡=1
⋅ 𝒑𝒊)
𝑛
𝑖=1
3
𝑪𝒔𝒖𝒃 = ∑(𝑁𝑆,𝑖 ⋅ 𝒑𝒊)
𝑛
𝑖=1
⋅ 𝑐𝑠 4
�̇�𝐺,𝑡 − ∑ �̇�𝑖,𝑡 ⋅ 𝒑𝒊
𝑛
𝑖=1
≤ 0 ∀𝑡 = 1, 2, … , 8760 5
∑ 𝒃𝑮𝑳,𝒍
𝑚
𝑙=1
= 1 6
∑ 𝒙𝑮,𝒍,𝒊
𝑛
𝑖=1
≤ 𝒃𝑮𝑳,𝒍 ⋅ 𝑛 ∀𝑙 = 1, … , 𝑚 7

10
𝒃𝑮𝑺,𝒊,𝟏 ⋅ 1 ≤ ∑ 𝒙𝑮,𝒍,𝒊
𝑚
𝑙=1
∀𝑖 = 1, … , 𝑛 8
𝒃𝑮𝑺,𝒊,𝟐 ⋅ 2 ≤ ∑ 𝒙𝑮,𝒍,𝒋
𝑚
𝑙=1
+ 𝒙𝑺,𝒋,𝒊 ∀𝑖, 𝑗 = 1, … , 𝑛 9
. . .
𝒃𝑮𝑺,𝒊,∑ 𝑛!/(𝑛−𝑎)!𝑛𝑎=1
⋅ 𝑛 ≤ ∑ 𝒙𝑮,𝒍,𝒋
𝑚
𝑙=1
+ 𝒙𝑺,𝒋,𝒌 + 𝒙𝑺,𝒌,𝒐 + ⋯ + 𝒙𝑺,𝒛,𝒊 ∀𝑖, 𝑗, 𝑘, 𝑜, … , 𝑧 = 1, … , 𝑛 10
𝒑𝒊 ≤ 𝒃𝑮𝑺,𝒊,𝟏 + 𝒃𝑮𝑺,𝒊,𝟐 + ⋯ + 𝒃𝑮𝑺,𝒊,∑ 𝑛!/(𝑛−𝑎)!𝑛𝑎=1
∀𝑖 = 1, … , 𝑛 11
The costs for the pipelines outside the settlements Cpipe,out are determined using the vectorised
geodetic distances lG,i,l between the GTP at location l and a settlement area i as well as the lS,i,j
between two settlement areas i and j (cf. Eq. 2). The binary variables xG and xS are used to
decide which pipelines should be constructed. Thereby m possible locations of the GTP and n
different settlements are given. One of the m different geothermal locations has to be selected
via the binary variable bGL (cf. Eq. 6). The variable bGL then also restricts the possible pipelines
that can be built using Eq. 7. This ensures that only connections starting from the chosen
geothermal location can be selected.
The costs for the DH pipelines inside the settlements Cpipe,in are determined with the help of
the specific heat distribution costs HDCi and the heat supply Q̇ per hour t in a settlement i (cf.
Eq. 3). The variable pi gives an indication of which proportion of the settlement is supplied with
heat and therefore takes values between 0 and 1. The heat distribution cost is calculated on
the basis of Persson & Werner (2011), depending on the population and building density as
well as the specific heat demand. The settlements have to consume the entire heat Q̇G of the
GTP (cf. Eq. 5). This amount of heat should be adjusted in advance according to the specific
use case or the geothermal potential available in the municipality. Figure 2 qualitatively
illustrates the influence of p on the proportion of heat demand to be covered in a certain
settlement. The variable p thus depends on the highest heat demand that occurs in a
settlement. For example, the red area and the two areas of heat demand shown below are
covered, if p = 1 is selected. The GTP, if operated during the whole year, would generate
surplus energy in summer. For this study, the use of the surplus energy is not relevant,
however, electricity could be generated in a GTP in this time period.
For each settlement at least one DH substation is required to connect the heating system of
the buildings with the DHN. The costs for one substation cs are multiplied by the number of
substations NS and the proportion of the settlement supplied with heat to determine the costs
for DH substations Csub in Eq. 4.

11
Figure 2: Influence of the variable p on the heat demand covered by the DH plant in a settlement.
A subtour is the term used when two or more coherent graphs are created as a solution instead
of one coherent graph. In order to prevent subtours, it must be ensured that each sink /
settlement is connected with the source / GTP via a coherent path. For this purpose, equations
are set up for each possible path from the source to the sink (cf. Eq. 8-10). The binary variable
bGS is used to decide by which path a certain settlement can be reached. This path must begin
at the GTP. For a certain settlement, several paths could be selected, but this would lead to
higher costs according to Eq.2. For example, in Eq.8 the pipeline would lead directly from the
GTP to a settlement, while in Eq.10 the pipeline would lead across all other settlements.
Thereby the number of restrictions depends on the number of settlements and can be
calculated via ∑ n!/(n − a)!na=1 . The number of equations therefore increases exponentially
with the number of settlement areas in a municipality. Eq. 11 has to be included so that no
settlement can be supplied with heat that is not connected to the GTP via DH pipelines.
3.3. Heuristic for designing district heating systems
The optimisation problem described above can only be solved for municipalities with less than
eight settlements due to calculation time limitations (cf. Section 4.1). Even the building of
equations is not possible for municipalities with more than ten settlements due to computational
constraints on the used computers (cf. Section 4.1). In order to solve the problem for larger
municipalities, a heuristic has been developed in addition to the optimisation problem. The
heuristic is similar to algorithms for solving the combinatorial optimisation problem of the
minimum spanning tree. In contrast to the general minimum spanning tree problem the nodes
to be connected are not previously fixed and the weights of the edges can change in each
iteration. The heuristic is executed for each possible GTP location, which are determined in
advance (cf. Figure 1). Before starting the heuristic, the percentage of the municipality's heat
demand to be covered by the GTP must be specified (cf. Figure 4). After determining the
1
25
6
51
1
76
6
10
21
12
76
15
31
17
86
20
41
22
96
25
51
28
06
30
61
33
16
35
71
38
26
40
81
43
36
45
91
48
46
51
01
53
56
56
11
58
66
61
21
63
76
66
31
68
86
71
41
73
96
76
51
79
06
81
61
84
16
86
71
Heat
[kW
h]
Time [h]
p = 1 p = 0.6 p = 0.3

12
distance matrices, a loop is performed for all GTP locations, therefore the boxes in Figure 4
are shown nested. The heuristic then selects a connection from the geothermal system to one
of the settlements in the municipality. In the example of the municipality Groß Kreutz a choice
must be made between 12 settlements. The decision is made on the basis of the investment
for the DH system per supplied amount of heat. If only costs for the pipelines would be
considered, the nearest and most densely built-up areas would be selected. This would lead
to high costs, as in most cases more settlements would have to be connected with DH
pipelines, since the first settlements that would be connected might not occur in the optimal
solution. Subsequently, the hourly heat demand of the settlement is subtracted from the heat
supply of the GTP. The next DH connection is selected if the GTP still has heat available and
there is still demand in the settlements. All settlements to which a connection already exists
are now included as possible heat sources. This means that in each iteration there is an
additional heat source that can be connected to the other settlements.
The first stage of the heuristic is completed as soon as the heat supply of the geothermal
system is exhausted and is a modified form of the algorithm from Weinand et al. (2018a). The
upper part of Figure 3 shows the result after the first stage for the case that 100% of the heat
demand is covered in Groß Kreutz. The red lines represent the DH pipelines originating from
the GTP, the blue ones those originating from a settlement and the GTP is illustrated as a
purple circle. The upper part of the figure shows, above all in the part encircled in red, that the
shortest connections are not always used. This is due to the iterative approach of the heuristic,
whereby one connection is chosen in each step. In previous iterations, connections could have
been selected that would not have been selected if all connected settlements had been known
beforehand. Therefore, the heuristic is extended by a second stage with another target
criterion: the costs for the connecting lines outside the settlements. However, the selection of
settlement areas in this second stage is limited to those settlements that were connected in
the previous stage. This leads to a more economical connection, as shown in the lower part of
Figure 3.
Another problem can be caused by the iterative approach. In case the heat demand is not be
met to 100%, the last selected settlement will only be partly supplied with heat (p < 1).
However, this last connected settlement could have a higher heat density than another
settlement connected to the DHN. Then it would be reasonable to supply the last selected
settlement with more heat and proportionally supply the settlement with the lowest heat density
and the highest specific heat distribution costs HDC respectively. Therefore, the heat supply
is reassigned to all selected settlements on the basis of the HDC in the third stage of the
heuristic. Finally, the DH connections and the associated costs and CO2 abatements per year

13
are given as output. For calculating the CO2 abatement, the actual heating technologies in the
various settlements were determined in Weinand et al. (2018a).
Figure 3: Location of the GTP (purple circle) and DH pipelines to the settlement areas for the target criteria investment per kW (upper part) and costs for the DH pipelines outside the settlements (lower part).
1 km

14
Figure 4: Heuristic for determining the cost-optimal DH system for an arbitrary municipality considering the heat demand, heat densities etc. of the settlements.
1. Stage 2. Stage 3. Stage
Calculate distances lG and lS
Connect DHN to settlement
with minimal investment per
kW
Subtract heat demand Q of
the settlement from heat
supply QG
Include settlement in DHN
as possible starting point
Heat supply
consumed?
Specify municipality
and heat supply
No
Yes
Keep settlements and GTP
location of DHN with
minimal investment per kW
Connect DHN to settlement
with minimal costs for
external pipelines
Subtract heat demand Q of
the settlement from heat
supply QG
Include settlement as
possible starting point for a
district heating pipeline
No
Yes
Heat supply
consumed?
Heat
demand covered
by 100% in all
settlements?
Reassign the heat supply
proportions p to settlements
considering the heat
demand densities
Output
No
Yes
Exclude all other GTP
locations and settlements

15
4. Results and discussion
In the previous study of Weinand et al. (2018b), the 11,100 German municipalities were
clustered into ten groups with regard to their suitability for decentralised energy systems. Two
of the 34 socio-energetic indicators in the cluster analysis were used to measure the potential
for geothermal energy: the attainable geothermal temperature and the required drilling depth.
The municipalities in Germany are suitable for low-temperature GTPs with achievable
temperatures up to 190°C. As case studies for the analysis in this paper, four municipalities
are selected from the clusters, which have a high potential for geothermal energy (cf. Table 2).
Municipalities are selected which differ particularly in the number of settlements, heat demand
and the population density. Three of the municipalities are located in the North German Basin
(NGB) and Bensheim lies in the Upper Rhine Graben (URG). The parameters of the
municipalities important for the following analyses are listed in Table 2.
Table 2: Characteristics of the municipalities examined in this study.
Municipality Biller-beck
Groß Kreutz
Bens-heim
Dümmer
Cluster (in Weinand et al. 2018b) 3 8 3 8
Basin (Agemar et al. 2014) NGB NGB URG NGB
Area [km²] 91 99 58 32
Population 11,593 8,133 40,051 1,430
Population density in municipality [1/km²] 127 82 693 46
Number of Corine settlement areas 3 12 7 5
Average Population density in settlements [1/km²] 3,000 1,000 3,300 1,300
Yearly heat demand [GWh] 135 55 320 9
Average share of DH in settlements [%] 2 4 2 8
First, the results and the solving time of the optimisation and the heuristic are compared in
Section 4.1. The results for the four municipalities from Table 2 are then presented in Section
4.2. Subsequently, the heuristic is examined in a sensitivity analysis in Section 4.3 and
discussed in Section 4.4. The results are determined for different heat supplies by DH. Namely,
10% steps were chosen, i.e. the results are shown in the following for heat supplies from the
GTP of 10%, 20%, 30%, etc. up to 100% of the heat demand of the municipalities. For example,
in the 10% case, the DH system provides 10% of the heat demand in the municipality. The
proportion of existing DH systems in the municipalities is subtracted from the heat demand in
the settlements.
4.1. Comparison of optimisation and heuristic approaches
The optimisation was carried out in GAMS by using the solver CPLEX and a computer with the
following performance properties: Intel Xeon E-1650 v2, 12 threads and 128 GB RAM. The
heuristic, however, was executed in Matlab on a computer with Intel Core i5-6200U, 4 threads
and 8 GB RAM. The results of the optimisation model and the heuristic are compared for the
municipalities of Billerbeck, Dümmer and Bensheim, which contain three, five and seven
settlements. The optimisation for Groß Kreutz with more than seven settlements was not

16
carried out because time constraints already arose during the optimisation for Bensheim with
seven settlements. Thus the optimisation for Bensheim had to be terminated after 7 days in
the case of 100% heat supply with a MIP gap of 4.8%. Building the equations in Matlab for a
municipality with 8 settlements alone would take two hours and the optimisation problem would
contain over 100,000 binary variables. In the municipalities of Billerbeck, Dümmer and
Bensheim, the equations take between 35 seconds and 12 minutes to build. The time required
to build the equations is not included in the following analysis.
Figure 5 shows the percentage by which the calculated total costs are lower in the optimisation
compared to the heuristic. In the case of 100% heat supply in Bensheim, the result of the lower
bound was adopted due to the above-mentioned termination of the optimisation. The deviation
could be much smaller in this case. Therefore, the following analysis will focus on how the
deviations in Billerbeck are caused in the 30% to 70% cases and the deviation in Dümmer is
caused in the 50% case.
Figure 5: Deviation of the total investment between optimisation and heuristic for the municipalities Billerbeck,
Dümmer and Bensheim.
In Billerbeck up to the 20% case, heat is supplied to settlement 2 in the heuristic as well as in
the optimisation, since this settlement has the highest building density (for settlement 2 see
left part of Figure 6). In the 30% case, however, there would still be heat remaining, so that
another settlement has to be supplied with heat. The error is caused by the fact that in the
heuristic, after selecting a settlement, the maximum possible amount of heat is supplied to this
settlement. Therefore, in the cases 30% to 70%, only settlement 3 with a lower building density
than settlement 2 is supplied in the heuristic (cf. left part of Figure 6). By contrast, in the
optimisation in these cases, settlement 2 is always supplied entirely with heat and settlement 3
-5%
-2%
-6%
-5%
-4%
-3%
-2%
-1%
0%
1%
10 20 30 40 50 60 70 80 90 100
Devia
tion
of to
tal i
nvestm
ent
% of heat supply
Billerbeck Dümmer Bensheim
[-5%,0%]

17
proportionately (cf. right part of Figure 6). Although this means that the costs for the pipelines
outside the settlements are higher, the overall costs are lower. After the 30% case, the
deviation between optimisation and heuristic decreases further, as the proportion of the heat
quantity delivered to settlement 2 becomes smaller and smaller in relation to the total heat.
Figure 6: DHN in the 30% case in Billerbeck with the heuristic (left part) and with the optimisation (right part). The
settlements are numbered from 1 to 3.
The difference in the municipality of Dümmer in the 50% case is for the same reason as in
Billerbeck. The right part of Figure 7 shows the DHN resulting from the optimisation. Here
settlement 4 represents an intermediate station and only 15% of the heat demand is covered.
This would not be possible in the heuristic again, since settlement 4 would have been supplied
with the complete remaining heat supply. Therefore, the more favourable solution in the
heuristic is to supply settlement 3 and 5 (cf. left part of Figure 7).
The two discussed examples show that with regard to the amount of heat that is delivered to
the settlements, there is still potential for improvement in the heuristic. However, the largest
deviation from the optimisation is only 5% and in most cases less than 0.1% of the total
investment. If the 100% case in Bensheim is neglected in the calculation due to the termination
of the optimisation, a mean absolute percentage error (MAPE) of 0.7% results. As these errors
are deemed acceptable for this application the heuristic can be used for estimating DH costs
and for planning the DHN including location planning of the plant.
3
2
1
1km

18
Figure 7: DHN in the 50% case in Dümmer with the heuristic (left part) and with the optimisation (right part). The settlements are numbered from 1 to 5.
Nevertheless, the use of the heuristic would not be reasonable, unless the application contains
a significant reduction of the solving time. As Figure 8 shows, the solving time of the heuristic
is between 2 and 35 seconds, depending on the case. Leaving aside the 100% case in
Billerbeck, the optimisations take between 5 and 100,000 times longer compared to the
heuristic. The more settlements that can be connected in a municipality, the longer the
optimisation takes (cf. 80% case and 90% case in Bensheim). Whilst the time increases linearly
in the heuristic, an exponential increase can be observed in the optimisation. Billerbeck has
the fewest settlement areas and yet in some cases the calculations / optimisations take longer
than in the other municipalities. This is due to the possible locations of the GTP, of which there
are about 200 more in Billerbeck compared to the other two municipalities.
Interpreting the fluctuations of the solution time when optimising the different cases is difficult
as no information is known about what causes problems for CPLEX in the specific cases.
However, it is certain that the solution space will become smaller or larger, depending on the
specified amount of heat. With a duration of up to 7 days, the optimisation would be quite time-
consuming. For municipalities with more than seven settlements, optimisation should be
avoided at all due to the computing constraints as stated at the beginning of this section.
1
23
4
5
1km

19
Figure 8: Solving time of the optimisation (dashed lines) and the heuristic (continuous lines) for the municipalities Billerbeck, Dümmer and Bensheim.
In order to show that the heuristic also runs in an acceptable time for larger municipalities, the
heuristic was executed for the municipality Gardelegen. This municipality has the eleventh
largest number of settlements of all municipalities in Germany with 42 settlements. In total, the
calculation of all 10 cases from 10% to 100% took 4 hours. The heuristic was not executed for
larger municipalities than Gardelegen, since in this case the limitation to only one heating plant
would not be appropriate due to district heating pipelines with a length of more than 100 km.
4.2. Resulting costs for district heating networks
Since the employment of the heuristic was evaluated as appropriate in the previous section, it
is applied to the four municipalities from Table 2. Thereby the assumptions from Section 3.1
are used. The comparison of the results reveals the following main interdependencies:
The higher the household density, the lower the investment.
The more settlements there are in a municipality and the further apart they are, the
higher the costs.
The smaller the largest settlement, the faster the costs increase with the proportion of
heat supplied.
As these findings mainly confirm expectations, no detailed explanation is given in this section,
but instead only a few aspects are discussed. The dependency of costs on household density
is clarified in Figure 9. The figure shows the investment in relation to the connected heat
capacity. The specific connection costs are between 500 €/kW and 1,900 €/kW when using
the assumptions from Section 3.1. Bensheim and Billerbeck with the highest household
1
10
100
1.000
10.000
100.000
1.000.000
10 20 30 40 50 60 70 80 90 100
So
lvin
gtim
e [s] (lo
g a
xis)
% of heat supply
Billerbeck Billerbeck Dümmer Dümmer Bensheim Bensheim
1,000,000
10,000
100,000
1,000

20
densities lead to the lowest costs per kW. The specific costs in Bensheim exceed those in
Billerbeck at the 100% case in which all settlements are supplied for the first time and thus a
long pipeline is built. In Dümmer and Groß Kreutz, the long distances between the settlements
play an important role in addition to the low household density, which leads to the high specific
costs. If the costs increase more strongly, as in the 50% case in Dümmer, this indicates that
more or different settlements are connected to the heating network than in the previous case.
Figure 9: Specific investment per kW for DH pipelines in the four municipalities depending on the proportion of heat supply compared to the mean value from German geothermal DH projects.
The calculated costs in Figure 9 are close to the average costs for the DHN for the geothermal
projects Grünwald, Unterföhring, Unterhaching and Neustadt-Glewe of 615 €/kW and can
therefore be interpreted as plausible (Enerchange 2009; Enerchange 2018; Erdwärme
Grünwald GmbH 2013; Geothermie Unterhaching 2017; GTN 2012). Since the percentage of
the heat demand satisfied by the geothermal projects in the municipalities is not known, the
615 €/kW are illustrated as a vertical line. The costs for the municipalities Dümmer, and Groß
Kreutz are above this average, as these municipalities have a low building and population
density. The costs in the municipalities of Billerbeck and Bensheim with higher building and
population density are lower, as the maximum length of the DHN outside the settlements in
these municipalities is 3 km and 15 km respectively and therefore below the average network
length of 38 km in the above mentioned geothermal projects.
The CO2 abatement cost curves are similar to those in Figure 9 and lie between 0.7 €/tCO2 and
2.4 €/tCO2 in the 100% case in Billerbeck and Dümmer respectively. The similar curves result
from the fact that the energy mix in the examined municipalities is almost similar, and therefore
the amount of CO2 abatement per kW of district heating is nearly the same.
500
700
900
1100
1300
1500
1700
1900
2100
10% 20% 30% 40% 50% 60% 70% 80% 90% 100%
Specific
investm
ent[€
/kW
]
% of heat supply
Billerbeck Groß Kreutz Bensheim Dümmer Average of GTP projects

21
4.3. Sensitivity analysis
A sensitivity analysis is conducted on the basis of the municipality of Groß Kreutz, which was
already used as an example in Section 3. Groß Kreutz is shown again in Figure 10 in reduced
form (left side), together with important information in the table on the right side. The black
squares represent the centroids of the settlements and above the squares the numbering of
the settlements is shown. The red circles indicate the size of the heat demand in the
settlements.
Figure 10: Settlement centroids in the municipality of Groß Kreutz as well as characteristics of the settlements.
The example presented in Section 3 with 497 possible locations for the DH plant as well as the
parameters and locations of the settlements shown in Figure 10 represent the reference case
for this section. The costs for the reference scenario are determined using the heuristic
developed in this study. Table 3 shows, which conditions have been changed as part of the
sensitivity analyses in this section. In Section 4.3.1, scenario 1 shows the influence of a
modification of the heat density on the solution. The variation regarding the number of possible
locations for the DH plant in scenarios 2 to 7 is the subject of Section 4.3.2. Subsequently,
Section 4.3.3 explores the impact of the stages of the heuristic using scenarios 8 and 9. Finally,
the heuristic developed for this study is compared with the Nearest-Neighbour-Heuristic in this
section.
1
2
4
6
10
8 7
5
3
9
11
12
Settle-
ment
Heat
demand
[GWh]
Heat
density
[GWh/
km²]
Heat
demand
proportion
[%]
1 0.8 4.8 1.4
2 2.2 7.2 4.0
3 1.2 6.3 2.2
4 0.2 1.8 0.4
5 17.7 5.1 32.1
6 12.1 9.6 22.0
7 1.5 10.0 2.7
8 1.0 3.2 1.8
9 5.7 9.4 10.4
10 0.8 6.4 1.4
11 6.6 13.0 12.0
12 5.3 7.7 9.6

22
Table 3: Scenarios examined as part of the sensitivity analysis. Changed conditions are shown in italics.
Scenario Heat density Number of possible
locations for DH plant
Heuristic
Reference cf. Figure 10 497 Stages 1, 2 and 3
1 Reduced to 0.5 GWh/km² for
settlement 5, for the other
settlements cf. Figure 10
497 Stages 1, 2 and 3
2 cf. Figure 10 1 Stages 1, 2 and 3
3 cf. Figure 10 9 Stages 1, 2 and 3
4 cf. Figure 10 46 Stages 1, 2 and 3
5 cf. Figure 10 171 Stages 1, 2 and 3
6 cf. Figure 10 1299 Stages 1, 2 and 3
7 cf. Figure 10 2749 Stages 1, 2 and 3
8 cf. Figure 10 497 Stage 1
9 cf. Figure 10 497 Stages 1 and 2
10 cf. Figure 10 497 Nearest-Neighbour-Heuristic
Figure 11 shows the deviation of the total costs in scenarios 1 to 10 compared to the reference
case for 10% heat supply steps. For reasons of clarity, continuous deviations of less than 1.5%
have been removed from Figure 11. Therefore, the curves for scenarios 6 and 9 are not shown
at all. In the following sections the figure is explained in more detail.
Figure 11: Deviations in the total costs for scenarios 1 to 10 in relation to the reference scenario.
-10%
0%
10%
20%
30%
40%
50%
60%
70%
80%
90%
10 20 30 40 50 60 70 80 90 100
De
via
tio
n o
f in
ve
stm
en
t
% of heat supply
1 2 3 4 5 7 8 10

23
4.3.1. Heat demand and heat density
On the left side of Figure 12 the reference case with 70% heat coverage is shown. The five
settlements 5, 6, 9, 11 and 12 with the highest heat demand are connected to the DH plant in
this case. To examine the sensitivity in scenario 1, the heat density is now reduced from 5.1
to 0.5 GWh/km² in the settlement 5 with the highest heat demand. Settlement 5 must be
partially supplied in order to cover 70% of the heat demand in the municipality, as it accounts
for more than 30% of the total heat demand (cf. table in Figure 10). All other settlements,
except settlement 4, are now connected to the DHN to ensure that as few households as
possible are connected in settlement 5 (cf. right part of Figure 12). Settlement 4 also has a
very low heat density and heat demand, therefore the pipeline to this settlement is not
worthwhile.
In the 60% case, settlement 5 is not connected to the DHN at all. In comparison to the reference
scenario, the costs increase strongly in scenario 1 if settlement 5 is included in the solution.
Thus the total costs increase in the 70% case only by 17%, while in the 100% case the costs
increase by over 80%, since settlement 5 is completely supplied with heat (cf. Figure 11).
Figure 12: Location of the DH plant and DHN with a heat supply of 70% of the heat demand in Groß Kreutz in the
reference case (left part) and for scenario 1 (right part).
4.3.2. Number of locations
As already described in Section 3, when determining the possible locations of the DH plant,
the number of locations between the minimum and maximum coordinates of the municipality
is specified. 1, 5, 10, 20, 55 and 80 locations are defined for the scenarios 2 to 7 respectively.
The potential locations for the scenarios are illustrated in Figure 13, with the resulting number
of locations shown in parentheses under the scenario names. In cases with a lower percentage
of heat supply, the number of locations has the greatest impact on the total costs, as the costs
for the pipelines outside the settlements account for a larger share. Thus the costs in the 10%
1
2
46
10
87
5
3
9
11 12

24
case in scenario 2 are 32% higher than in the reference case with 497 locations (cf. Figure
11). With a rising number of potential locations from scenario 2 to scenario 5, however, the
costs increasingly match with the costs in the reference scenario. In scenario 6 there are only
very small deviations, so the curve is not shown in Figure 11. A further increase in the number
of locations in scenario 7 also reduces the costs only marginally.
Figure 13: Possible locations for the DH plant in scenarios 2 to 7. The resulting number of locations is shown in parentheses under the scenario names.
As shown, the costs in the scenarios change due to the varying distance of the DH plant to the
settlements. Therefore the costs are calculated again for the reference scenario and scenarios
2 to 7, however, this time with costs for the pipelines outside the settlements of 500 €/m instead
of 200 €/m. As a result of this adjustment, deviations also occur in the cases with higher heat
supply proportions and the other deviations increase strongly. For example, the deviations in
scenario 2 increase from 32% to 68% in the 10% case. The cost of pipelines outside
settlements now accounts for up to 35% of total costs in scenarios 2 to 7 instead of up to 20%
in the case with pipeline costs of 200 €/m. Even with 500 €/m the costs decrease only slightly
compared to the reference scenario in scenarios 6 and 7. With rising number of locations, the
time for solving the heuristic increases linearly. Thus the selection of the 497 locations for the
municipality Groß Kreutz can be evaluated as reasonable. Therefore, a number of 5 locations
per km² can be recommended for the study of other municipalities considering the size of Groß
Kreutz.
4.3.3. Number of stages
Section 3 and Figure 3 have already indicated that an appropriate DHN is not achieved by
performing only stage 1 of the heuristic. Since the settlements are iteratively connected to the
Scenario 2
(1)
Scenario 3
(9)
Scenario 4
(46)
Scenario 5
(171)
Scenario 6
(1299)
Scenario 7
(2749)

25
DHN, the optimal connections rarely arise. This is reflected in the costs of scenario 8, which
are at least 5% and on average 12% above the costs of the reference scenario for each case
(cf. Figure 11). Considering the reference scenario and scenario 8 with pipeline costs of
500 €/m instead of 200 €/m, the costs in scenario 8 increase on average by 30%. The omission
of step 3 in scenario 9 results in a slight cost increase of no more than 1.3%, so that the curve
is not illustrated in Figure 11. However, the third stage leads to slight improvements and should
be executed as it has negligible influence on the solution time.
In scenario 10, a standard algorithm is used to demonstrate the performance of the heuristic
developed in this study. Thereby, the heuristic of this study is applied with a modified target
criterion: the Nearest-Neighbour-Heuristic connects the nearest settlement to the DHN in each
iteration. The DHN in the reference case on the left side in Figure 12 could therefore never
result with this heuristic. Instead of settlement 12, which is the furthest away from all other
settlements, the Nearest-Neighbour-Heuristic connects settlements 3 and 10 in the 70% case
(cf. Figure 14). In the next step, settlement 8 would be connected, which is 1.76 km away from
settlement 6. The Nearest-Neighbour-Heuristic would be considered if only stage 1 of the
heuristic developed in this study would be executed with the target criterion of stage 2.
Figure 14: Location of the DH plant and DHN in the 70% case resulting from the Nearest-Neighbour-Heuristic.
As shown in Figure 11, the Nearest-Neighbour-Heuristic results in significantly higher costs
than the reference scenario. The deviations reach values of up to 78%. Obviously, the more
heat demand is covered in the municipality, the lower the deviations will be until the costs
match in the 100% case. The calculation of the nine cases up to the 90% case requires
between 50% and 250% more time compared to the reference scenario, as more settlements
2,33 km
1,97 km
2,35 km
2,27 km
1,95 km
2,65 km
1
2
4
6
10
87
5
3
9
11
12

26
are connected. The results of this section indicate again that the application of the heuristic in
three steps is reasonable.
4.4. Critical appraisal
The sensitivity analyses in Section 4.3 revealed that the heuristic developed in this study yields
better results than simpler heuristics, especially in the case of low heat coverage in the
municipalities. The current distribution in Germany indicates that these rather low heat
coverages in municipalities through DH are of importance as in municipalities that already have
DH systems, the average proportion of DH systems in all heating technologies is just 3.5%
(Statistisches Bundesamt 2014). This share is lower than the share of district heating in the
total German heat supply of 13.8% (cf. Section 1), as all municipalities are equally weighted in
the calculation. For high heat coverages, e.g. the 100% case, simpler heuristics such as the
Nearest-Neighbour-Heuristic are also suitable. However, since this takes more time than our
heuristic, it is not recommended to use it.
The heuristic can be used in this form or slightly modified for DH plants different to GTPs. This
would only require a change in the possible locations of the DH plant. For other plant types,
the location could even be within a settlement.
In this study, the developed heuristic was applied to individual municipalities. However, the
applicability of the heuristic is not limited to this administrative level. The heuristic can also be
used for other regions with little effort. Figure 15, for example, shows the simultaneous
application to four municipalities. This is an important aspect, since energy system analyses
should not be limited to individual municipalities, but should determine the optimal aggregation
level for the energy system. In small municipalities, the construction of a GTP would probably
not be worthwhile as the fixed costs of these plants are very high. However, if several
municipalities are involved in the analysis, the construction of such a plant could become
economically viable.
Figure 15: Result of the heuristic if applied to several small municipalities in northern Germany.
1 km

27
In addition, the heuristic can be easily applied to other countries. In this case, the heat demand
as well as the population and building density for each settlement have to be determined as in
Weinand et al. (2018a). The Corine land use areas were determined for 38 other European
countries besides Germany and can be used as a basis (EEA 2018).
For the study presented here, improvements can be made in a couple of areas. First of all, the
optimisations in this study do not always yield the realistic optimum. This is due to the fact that,
in reality, the pipelines cannot always run straight ahead and no local topological conditions
are taken into account. It is further neglected that a pipeline could be divided into two or more
pipelines in order to connect several settlements with a pipeline starting from one settlement.
In order to overcome this problem, many points could be introduced as possible branches in
further work, such as the points of the GTPs in Figure 3, at which pipelines can divide.
However, the investment would probably not be significantly reduced. In addition, since the
centroids of the settlements are used as connection points and not the border of a settlement,
the costs for pipelines outside the settlements are slightly overestimated.
Furthermore, the feasibility of GTPs depends strongly on the local geological conditions. This
means that the GTP location determined by the heuristic may not be technically feasible at all.
In this case, the location could be excluded and the heuristic could be executed again. On the
other hand, a location could also be specified beforehand and the heuristic could be used to
only determine the connections of the pipelines. In addition, some locations for the GTP could
be manually excluded in advance, as it is visible that these are not optimal due to far distance
to the settlements (cf. Figure 3). However, due to the short time required by the heuristic, this
is not necessary.
The use of a constant heat loss via an efficiency and thus the neglect of heat losses per
kilometre also means that the optimal location of the GTP and the optimal DHN are not
necessarily determined. If the specific heat losses were taken into account, the GTP in Figure
3 would probably be closer to the largest settlement on the left-hand side of the figure. This is
due to the fact that a large amount of heat could then be supplied without a large heat loss
occurring before. However, a different location of the GTP than in the optimal case would not
increase the costs significantly. Nevertheless, the heuristic should be improved in further work
with regard to heat losses. Related to this, pressure losses should also be taken into account
in future work. These make further district heat pumps necessary at certain points in the DHN.
In the case of an optimisation model, non-linear equations would have to be integrated into the
model, to take the properties mentioned in this paragraph into account (Bordin et al. 2016).
It has been described above that the DH share in German municipalities is on average 3.5%,
but there are also municipalities with a high DH share of over 90%. In future studies, it is
therefore necessary to extend the heuristic in such a way that existing networks can be

28
recognised as well as used to integrate the heat and thus reduce the investment for pipelines.
As already explained, the share of existing DH is only deducted from the heat demand in this
study. One possibility would be to apply the methodology of Blanco et al. (2017) which has
been mentioned in Section 2.3. Uncertainty about the location of heat consumers could take
into account the fact that it is not known where district heating connections already exist and
where the greatest heat demand within a settlement exists.
Additionally, the results of the heuristic and optimisation could only be compared for
municipalities with less than eight settlements in Section 4.1. The analysis gives no reason to
believe so, however, the results of the heuristic and the optimisation may differ more strongly
for municipalities with more than seven settlements. Even if this would be the case, in most
instances the heuristic could be used sensibly, since about 80% of the German municipalities
contain less than eight settlements.
Finally, this study assumes that the GTP can be operated during the whole year. This would
rarely be the case in reality due to e.g. maintenance intervals. However, this fact is irrelevant
for the design of the DHNs. The outage times could be avoided by different technical
measures, like a modular construction of the plant, in which the plant parts exist multiply and
broken parts can be replaced temporarily or by using heat storages.
5. Conclusions
Against the background of a trend towards decentralised and community-owned energy
systems, this paper develops a method to set up a minimum-cost geothermal-based municipal
district heating (DH) system. To this end, two approaches based on combinatorial optimisation
were presented, in order to support local planners in the design of geothermal DH systems.
The first approach involves a combinatorial optimisation of the DH network layout, including
geothermal plant location and network topology, which is applicable to municipalities with less
than eight discrete settlement areas. The second approach is a three-stage heuristic, which
serves the same purpose but can be applied to a much higher number of municipalities with
many more settlement areas.
One of the innovations of the developed optimisation model and the developed three-stage
heuristic compared to previous work is the fact that not only the DH network, but also the
location of the DH plant, is optimised. Furthermore, the nodes / settlements to be connected
are not fixed in advance and do not have to be supplied completely with heat. The two
approaches presented in this work can easily be applied to every municipality in Germany and
the methodology could be easily extended to 38 other European countries.
A comparison of optimisation and heuristic for three exemplary municipalities demonstrates
the efficiency of the developed heuristic. For municipalities with three, five and seven

29
settlements respectively, the optimisation takes between 500% and 10,000,000% more time
than the heuristic. The resulting deviations in the calculated total investment for the DH from
the results of the optimisation are in all cases below 5% and in 80% of cases below 0.3%. The
efficiency of the heuristic is demonstrated by the comparison with simpler heuristics like the
Nearest-Neighbour-Heuristic. The latter is not only less efficient, it substantially overestimates
the total costs by up to 80% in all cases with less than 100% DH heat coverage. In addition,
the calculated investments in the investigated municipalities ranged from 500 €/kW to
1,900 €/kW, values which could be validated with investments for existing geothermal DH
networks in Germany.
The developed heuristic consistently yields results within acceptable margins of error of its
equivalent combinatorial optimisation problem, is efficient and scales well to other regions or
contexts. The developed methodology would benefit from some further improvements, for
example some of the technical aspects such as heat and pressure losses within the DH
network could be modelled more precisely in the heuristic. This would be particularly important
in order to plan the DH network within the municipality, which is considered beyond the scope
of this contribution. Furthermore, additional geological and topological conditions in the
municipalities should be taken into account in order to better identify the optimal location of the
geothermal plant and the type of network. Finally, the heuristic should be extended in such a
way that the DH pipelines can also branch off in order to reach several endpoints from one
starting point. All of these aspects remain areas for future work and will be the subject of a
forthcoming contribution, alongside a more holistic energy system analysis (as shown in the
appendix/supplementary material).
Notwithstanding these shortcomings, the developed method, comprising combinatorial
optimisation and heuristic, provides a sound basis for decision support for municipal-scale
geothermal DH systems. The heuristic for cost-optimised placement of the geothermal plant
provided as supplementary material can be easily extended and should offer useful insights
for local planners and authorities when considering the heat source options at their disposal.
Acknowledgement
The authors gratefully acknowledge the financial support of the PhD College “Energy and
Resource Efficiency” (ENRES), from the Federal State of Baden-Wuerttemberg, for funding
the first author’s PhD studentship. The contribution of the second author was supported by the
Helmholtz Association under the Joint initiative “Energy Systems Integration” (funding
reference: ZT-0002).
Publication bibliography
Agemar, Thorsten; Weber, Josef; Schulz, Rüdiger (2014): Deep Geothermal Energy Production in Germany. In Energies 7 (7), pp. 4397–4416. DOI: 10.3390/en7074397.
30
Agemar, T.; Weber, J.; Moeck, I. (2018): Assessment and Public Reporting of Geothermal Resources in Germany. Review and Outlook. In Energies 11 (2), p. 332. DOI: 10.3390/en11020332.
AGFW (2017): Hauptbericht 2016 (Annual Report 2016). Available online at https://www.agfw.de/fileadmin/user_upload/Zahlen_und_Statistiken/Version_1_HB2016.pdf, checked on 9/27/2018.
AGFW; AGEB; BMWi (2018): Verwendung von Fernwärme in Deutschland (Use of district heating in Germany). Available online at https://www.bmwi.de/Redaktion/DE/Infografiken/Energie/Energiedaten/Energietraeger/energiedaten-energietraeger-32.html, checked on 9/27/2018.
Blanco, Víctor; Fernández, Elena; Puerto, Justo (2017): Minimum Spanning Trees with neighborhoods. Mathematical programming formulations and solution methods. In European Journal of Operational Research 262 (3), pp. 863–878. DOI: 10.1016/j.ejor.2017.04.023.
BMJV (2018): Gesetz für die Erhaltung, die Modernisierung und den Ausbau der Kraft-Wärme-Kopplung (Kraft-Wärme-Kopplungsgesetz - KWKG) (Law for the maintenance, modernisation and expansion of cogeneration). Edited by Bundesministerium der Justiz und für Verbraucherschutz. Available online at https://www.destatis.de/DE/Methoden/Rechtsgrundlagen/Statistikbereiche/Inhalte/1058_KWKG.pdf?__blob=publicationFile, checked on 3/2/2018.
BMWi (2017): Erneuerbare Energien in Zahlen. Nationale und internationale Entwicklung im Jahr 2016 (Renewable energies in figures. National and international development in 2016.). Available online at https://www.bmwi.de/Redaktion/DE/Publikationen/Energie/erneuerbare-energien-in-zahlen-2016.pdf?__blob=publicationFile&v=8, checked on 5/9/2018.
Bordin, Chiara; Gordini, Angelo; Vigo, Daniele (2016): An optimization approach for district heating strategic network design. In European Journal of Operational Research 252 (1), pp. 296–307. DOI: 10.1016/j.ejor.2015.12.049.
Bratoev, I.; Bonnet, C.; Chokhachian, A.; Schubert, G.; Petzold, F.; Auer, T. (2017): Designing and Evaluating District Heating Networks with Simulation Based Urban Planning. In : URBANCEQ-2017. International Conference on Urban Comfort and Environmental Quality. Genova, Italy, 28-29 September 2017.
C.A.R.M.E.N. e.V (2012): Nahwärmenetze und Bioenergieanlagen. Ein Beitrag zur effizienten Wärmenutzung und zum Klimaschutz (Local heating networks and bioenergy plants. A contribution to efficient heat utilisation and climate protection.). Available online at https://www.carmen-ev.de/files/festbrennstoffe/merkblatt_Nahwaermenetz_carmen_ev.pdf, checked on 2/16/2018.
Casisi, M.; Pinamonti, P.; Reini, M. (2009): Optimal lay-out and operation of combined heat & power (CHP) distributed generation systems. In Energy 34 (12), pp. 2175–2183. DOI: 10.1016/j.energy.2008.10.019.
Cerrone, C.; Cerulli, R.; Raiconi, A. (2014): Relations, models and a memetic approach for three degree-dependent spanning tree problems. In European Journal of Operational Research 232 (3), pp. 442–453. DOI: 10.1016/j.ejor.2013.07.029.
Connolly, D.; Lund, H.; Mathiesen, B. V.; Werner, S.; Möller, B.; Persson, U. (2014): Heat Roadmap Europe. Combining district heating with heat savings to decarbonise the EU energy system. In Energy Policy 65, pp. 475–489. DOI: 10.1016/j.enpol.2013.10.035.
Damiana, C. (2008): Optimal size and layout planning for district heating and cooling networks with distributed generation options. In Int J of Energy Sector Man 2 (3), pp. 385–419. DOI: 10.1108/17506220810892946.
Danish Energy Agency (2017): Technology Data for Energy Transport. Edited by Danish Energy Agency. Available online at https://ens.dk/sites/ens.dk/files/Analyser/technology_data_for_energy_transport_dec_2017_1.pdf, checked on 10/1/2018.
Delangle, Axelle; Lambert, Romain S.C.; Shah, Nilay; Acha, Salvador; Markides, Christos N. (2017): Modelling and optimising the marginal expansion of an existing district heating network. In Energy 140, pp. 209–223. DOI: 10.1016/j.energy.2017.08.066.
Dobersek, D.; Goricanec, D. (2009): Optimisation of tree path pipe network with nonlinear optimisation method. In Applied Thermal Engineering 29 (8-9), pp. 1584–1591. DOI: 10.1016/j.applthermaleng.2008.07.017.
EEA (2016): Corine Land Cover 2012 seamless vector data. Edited by European Environment Agency. Available online at https://www.eea.europa.eu/downloads/5c537b70226944b8bfe7bdc9470100ff/1488296244/clc-2012-vector.pdf, checked on 11/28/2017.
EEA (2018): Land cover country fact sheets 2012. Edited by European Environment Agency. Available online at https://www.eea.europa.eu/themes/landuse/land-cover-country-fact-sheets?b_start:int=0, checked on 10/18/2018.

31
Enerchange (2009): Sauberes Jubiläum: 15 Jahre Geothermie in Neustadt-Glewe (Clean anniversary: 15 years of geothermal energy in Neustadt-Glewe.). Available online at http://www.tiefegeothermie.de/top-themen/sauberes-jubilaeum-15-jahre-geothermie-in-neustadt-glewe, checked on 3/20/2018.
Enerchange (2018): Projekte Tiefe Geothermie (Deep Geothermal Projects..) Available online at http://www.tiefegeothermie.de/projekte, checked on 3/20/2018.
Erdwärme Grünwald GmbH (2013): Erdwärme Grünwald: „Hinter dem Mehr an Kosten steckt ein Mehr an Leistung.“ (Geothermal energy Grünwald: "Behind the increase in costs is an increase in performance".). Available online at http://www.erdwaerme-gruenwald.de/_URL/E1086.htm, checked on 3/20/2018.
Euroheat & Power (2017): District Energy in Germany. Available online at https://www.euroheat.org/knowledge-centre/district-energy-germany/, checked on 9/27/2018.
Fazlollahi, Samira; Girardin, Luc; Maréchal, François (2014): Clustering Urban Areas for Optimizing the Design and the Operation of District Energy Systems. In: 24th European Symposium on Computer Aided Process Engineering, vol. 33: Elsevier (Computer Aided Chemical Engineering), pp. 1291–1296.
Fernández, Elena; Pozo, Miguel A.; Puerto, Justo; Scozzari, Andrea (2017): Ordered Weighted Average optimization in Multiobjective Spanning Tree Problem. In European Journal of Operational Research 260 (3), pp. 886–903. DOI: 10.1016/j.ejor.2016.10.016.
Gao, Xin; Jia, Lifen (2017): Degree-constrained minimum spanning tree problem with uncertain edge weights. In Applied Soft Computing 56, pp. 580–588. DOI: 10.1016/j.asoc.2016.07.054.
Geothermie Unterhaching (2017): Datenblatt: Geothermie Unterhaching (Data sheet: Geothermie Unterhaching.). Available online at https://www.geothermie-unterhaching.de/cms/geothermie/web.nsf/gfx/0189A5952BAEB5E8C1258183003FA71A/$file/Datenblatt%20Geothermie%20Unterhaching%202017.pdf, checked on 3/20/2018.
Gouveia, L.; Moura, P.; Ruthmair, M.; Sousa, A. (2014): Spanning trees with variable degree bounds. In European Journal of Operational Research 239 (3), pp. 830–841. DOI: 10.1016/j.ejor.2014.05.034.
Gouveia, Luis; Simonetti, Luidi (2017): Spanning trees with a constraint on the number of leaves. A new formulation. In Computers & Operations Research 81, pp. 257–268. DOI: 10.1016/j.cor.2016.12.005.
GTN (2012): Geothermisches Heizwerk Neustadt-Glewe (Geothermal heating plant Neustadt-Glewe.). Edited by Geothermie Neubrandenburg GmbH. Available online at http://www.gtn-online.de/media/PDF/GTN_Tiefe_Geothermie_Geothermisches_Heizwerk_Neustadt_Glewe_052012.pdf, checked on 3/20/2018.
Hechler, H.; Bredel-Schürmann, Stefan (2011): Tiefe Geothermie (Deep geothermal energy). Edited by ASUE Arbeitsgemeinschaft für sparsamen und umweltfreundlichen Energieverbrauch e.V. Berlin. Available online at http://asue.de/sites/default/files/asue/themen/umwelt_klimaschutz/2011/broschueren/07_05_11_asue-tiefe-geothermie.pdf, checked on 10/2/2018.
HLUG (2011): Leitfaden Tiefengeothermie. Planung und Durchführung von Projekten (Guide to deep geothermal energy. Planning and implementation of projects.). Edited by Regierungspräsidium Darmstadt, Hessisches Landesamt für Umwelt und Geologie. Available online at https://www.energieland.hessen.de/pdf/Leitfaden_Tiefengeothermie_-_Bergrechtlicher_Teil.pdf, checked on 3/15/2018.
Kazemilari, Mansooreh; Mardani, Abbas; Streimikiene, Dalia; Zavadskas, Edmundas Kazimieras (2017): An overview of renewable energy companies in stock exchange. Evidence from minimal spanning tree approach. In Renewable Energy 102, pp. 107–117. DOI: 10.1016/j.renene.2016.10.029.
Le Truong, Nguyen; Dodoo, Ambrose; Gustavsson, Leif (2015): Renewable-based heat supply of multi-apartment buildings with varied heat demands. In Energy 93, pp. 1053–1062. DOI: 10.1016/j.energy.2015.09.087.
Lenk, M.; Boumann, J.; Sippel, T. (2017): CORINE Land Cover 10 ha. Available online at http://www.geodatenzentrum.de/geodaten/gdz_rahmen.gdz_div?gdz_spr=deu&gdz_akt_zeile=5&gdz_anz_zeile=1&gdz_unt_zeile=22&gdz_user_id=0, checked on 11/28/2017.
Marín, Alfredo (2015): Exact and heuristic solutions for the Minimum Number of Branch Vertices Spanning Tree Problem. In European Journal of Operational Research 245 (3), pp. 680–689. DOI: 10.1016/j.ejor.2015.04.011.
Marty, Fabien; Serra, Sylvain; Sochard, Sabine; Reneaume, Jean-Michel (2018): Simultaneous optimization of the District Heating Network topology and the Organic Rankine Cycle sizing of a geothermal plant. In Energy. DOI: 10.1016/j.energy.2018.05.110.
McKenna, R. (2018): The double-edged sword of decentralized energy autonomy. In Energy Policy 113, pp. 747–750. DOI: 10.1016/j.enpol.2017.11.033.

32
Möller, Bernd; Lund, Henrik (2010): Conversion of individual natural gas to district heating. Geographical studies of supply costs and consequences for the Danish energy system. In Applied Energy 87 (6), pp. 1846–1857. DOI: 10.1016/j.apenergy.2009.12.001.
Nielsen, Steffen (2014): A geographic method for high resolution spatial heat planning. In Energy 67, pp. 351–362. DOI: 10.1016/j.energy.2013.12.011.
OpenStreetMap contributors (2018): OpenStreetMap. Available online at https://www.openstreetmap.org/#map=5/51.330/10.453, checked on 1/29/2018.
Østergaard, Poul Alberg; Lund, Henrik (2011): A renewable energy system in Frederikshavn using low-temperature geothermal energy for district heating. In Applied Energy 88 (2), pp. 479–487. DOI: 10.1016/j.apenergy.2010.03.018.
Østergaard, Poul Alberg; Mathiesen, Brian Vad; Möller, Bernd; Lund, Henrik (2010): A renewable energy scenario for Aalborg Municipality based on low-temperature geothermal heat, wind power and biomass. In Energy 35 (12), pp. 4892–4901. DOI: 10.1016/j.energy.2010.08.041.
Persson, Urban; Werner, Sven (2011): Heat distribution and the future competitiveness of district heating. In Applied Energy 88 (3), pp. 568–576. DOI: 10.1016/j.apenergy.2010.09.020.
Pfnür, A.; Winiewska, B.; Mailch, B.; Qschatz, B. (2016): Dezentrale vs. zentrale Wärmeversorgung im deutschen Wärmemarkt. Vergleichende Studie aus energetischer und ökonomischer Sicht (Decentralised vs. central heat supply in the German heat market. Comparative study from an energy and economic point of view.). Darmstadt. Available online at http://www.bdh-koeln.de/fileadmin/user_upload/pressemitteilungen_pdf/studie_dezentrale_vs_zentrale_waermeversorgung.pdf, checked on 2/16/2018.
Salgueiro, Rui; Almeida, Ana de; Oliveira, Orlando (2017): New genetic algorithm approach for the min-degree constrained minimum spanning tree. In European Journal of Operational Research 258 (3), pp. 877–886. DOI: 10.1016/j.ejor.2016.11.007.
Smith, David K.; Walters, Godfrey A. (2000): An evolutionary approach for finding optimal trees in undirected networks. In European Journal of Operational Research 120 (3), pp. 593–602. DOI: 10.1016/S0377-2217(98)00385-3.
Statistisches Bundesamt (2014): Gebäude und Wohnungen (Buildings and apartments). Edited by Statistische Ämter des Bundes und der Länder. Wiesbaden. Available online at https://www.regionalstatistik.de/genesis/online/data;jsessionid=62C84E17497FA378AD49A9004D9A6DF6.reg2?operation=statistikenVerzeichnisNextStep&levelindex=0&levelid=1504786087209&index=3&structurelevel=3, checked on 9/7/2017.
Statistisches Bundesamt (2017): Bruttostromerzeugung in Deutschland für 2015 bis 2017 (Gross electricity generation in Germany for 2015 to 2017.). Available online at https://www.destatis.de/DE/ZahlenFakten/Wirtschaftsbereiche/Energie/Erzeugung/Tabellen/Bruttostromerzeugung.htm, checked on 5/9/2018.
Sveinbjörnsson, Dadi; Ben Amer-Allam, Sara; Hansen, Anders Bavnhøj; Algren, Loui; Pedersen, Allan Schrøder (2017): Energy supply modelling of a low-CO 2 emitting energy system. Case study of a Danish municipality. In Applied Energy 195, pp. 922–941. DOI: 10.1016/j.apenergy.2017.03.086.
trend:research (2017): Eigentümerstruktur: Erneuerbare Energien. Entwicklung der Akteursvielfalt, Rolle der Energieversorger, Ausblick bis 2020 (Ownership structure: Renewable energies. Development of the diversity of actors, role of energy suppliers, outlook until 2020.). Available online at https://www.trendresearch.de/studie.php?s=672, checked on 5/9/2018.
UBA (2018): Erneuerbare Energien in Deutschland. Daten zur Entwicklung im Jahr 2017 (Renewable energies in Germany. Data on the development in 2017.). Edited by Umweltbundesamt. Available online at https://www.umweltbundesamt.de/sites/default/files/medien/376/publikationen/180315_uba_hg_eeinzahlen_2018_bf.pdf, checked on 6/28/2018.
Unternährer, Jérémy; Moret, Stefano; Joost, Stéphane; Maréchal, François (2017): Spatial clustering for district heating integration in urban energy systems. Application to geothermal energy. In Applied Energy 190, pp. 749–763. DOI: 10.1016/j.apenergy.2016.12.136.
Weber, J.; Ganz, B.; Sanner, B.; Moeck, I. (2016): Geothermal Energy Use, Country Update for Germany. Strasbourg, France (European Geothermal Congress 2016). Available online at https://www.geothermal-energy.org/pdf/IGAstandard/EGC/2016/GERMANY%20country%20update%20EGC%202016.pdf, checked on 6/28/2018.

33
Weinand, Jann; McKenna, Russell; Karner, Katharina; Braun, Lorenz; Herbes, Carsten (2018a): Assessing the potential contribution of excess heat from biogas plants towards decarbonising German residential heating. In Working Paper Series in Production and Energy (31). DOI: 10.5445/IR/1000086374.
Weinand, Jann; McKenna, Russell; Fichtner, Wolf (2018b): Developing a municipality typology for modelling decentralised energy systems. In Working Paper Series in Production and Energy (26). DOI: 10.5445/IR/1000079805.
Wirth, H. (2018): Aktuelle Fakten zur Photovoltaik in Deutschland (Recent Facts about Photovoltaics in Germany.). Edited by Fraunhofer ISE. Available online at https://www.ise.fraunhofer.de/content/dam/ise/de/documents/publications/studies/aktuelle-fakten-zur-photovoltaik-in-deutschland.pdf, checked on 10/26/2018.

34
Appendix
A.1. Nomenclature
Variable /
Parameter Description Unit
bDH,S Binary variable for deciding which proportion of the head demand in the municipality
should be covered by district heating -
bGL Binary variable for deciding whether a geothermal plant should be built at a specific
location -
bGS Binary variable for deciding whether a settlement can be reached by a certain path -
cp Specific costs for pipelines outside the settlements €/m
Cpipe,in Investment for district heating pipelines inside a settlement €
Cpipe,out Investment for district heating pipelines outside a settlement €
cs Investment for one district heating substation €
Csub Investment for all district heating substations €
Ctotal Investment for the entire district heating network €
Dheat Heat demand of the municipality kWh
HDC Specific heat distribution costs €/kWh
lG Distance between a district heating plant and a settlement m
lS Distance between two settlements m
M Represents a big number -
NS Number of district heating substations -
p Specifies which proportion of the heat demand in a settlement is covered by district
heating -
Q̇ Heat supply to a settlement kWh
Q̇G Heat generation of a geothermal plant kWh
xG Binary variable for deciding whether a district heating pipeline between a district heating
plant and a settlement should be built -
xS Binary variable for deciding whether a district heating pipeline between two settlements
should be built -
A.2. Application in an energy system optimisation
In energy system analyses, it is very important that different technologies are weighed against
each other and are dimensioned at this stage and not beforehand. Due to the complex
interconnections in such analyses, the choice of appropriate technologies and the
dimensioning is difficult. Other heat generation technologies and measures such as the
insulation of buildings need to be compared with DH in these assessments. The easily

35
transferable approach presented in this section shows a way to dimension the geothermal
DHN that can be integrated into energy system analyses.
Therefore, the results of the optimisation from Section 3.2 or the heuristic from Section 3.3
could be used. In order to take into account the energy flows between the settlements, the
municipality should not be optimised as a whole but divided into districts. This ensures that DH
is only supplied to households connected to the DHN. Voronoi clustering by means of the
settlement centroids could be implemented to divide the municipality into districts (cf. Figure
16). This division is also necessary to assign other potentials such as electricity generation
from photovoltaics or wind plants to the settlements.
Figure 16: Voronoi Cluster with the help of settlement centroids in the municipality Groß Kreutz.
With the help of the resulting districts, the optimisation model can specify from where to which
district the DH can be distributed. The costs for the DH system could then be calculated in
several percentage steps. In the following a segmentation into 10 steps is done, i.e. with supply
of 10%, 20%, 30% etc. up to 100% of the heat demand. The pipeline connections then depend
on the choice of the binary variable bDH,S,i (cf. Eq. 12).
∑ 𝒃𝑫𝑯,𝑺,𝒊
10
𝑖=1
≤ 1 12
For example, if the DHN from the lower part of Figure 3 should be built, i.e. all settlement areas
could be supplied with DH, then bDH,S,10 has to be set to 1. By selecting the binary variables,
the nominal output Q̇G of the DH plant can also be limited by a proportion of the heat demand
of the municipality Dheat (cf. Eq. 13).
�̇�𝑮(𝒕) ≤ ∑ (𝒃𝑫𝑯,𝑺,𝒊 ⋅ 10% ⋅ 𝑖 ⋅ 𝐷ℎ𝑒𝑎𝑡(𝑡))
9
𝑖=1
+ (𝒃𝑫𝑯,𝑺,𝟏𝟎 ⋅ 𝑀) 13
1
2
4
6
108 7
53
9
1112

36
The case with 100% is not included in the sum so that more DH can be generated than
required. Therefore, the binary variable is multiplied by a large number M. In addition the
investment for and CO2 abatement of the DH system are selected with the binary variable.
In the heuristic, the heat losses are taken into account via a constant efficiency, which therefore
has no influence on the choice of the network. In energy system optimisation, heat losses
should therefore also be taken into account, depending on the length of the network. Heat
losses of 0.5%-3% per km, depending on the capacity of the pipeline, have to be taken into
account for the pipelines (Danish Energy Agency 2017). This is also important for the
dimensioning of the GTP.
Another issue is the designing of the DHN before the global optimisation. Would the designing
of the DHN be integrated in the global optimisation, other connecting pipelines could result
than calculated before with the heuristic. In the heuristic, for example, a connection to
settlement 5 could be worthwhile in the case of a 50% heat supply. In the global optimisation,
on the other hand, settlement 5 could ideally be supplied by other heating technologies than
district heating. Then this settlement would have to be excluded in the heuristic and another
solution would result in the case of a 50% heat supply. This problem could be mitigated by an
iterative approach, where the heuristic is executed again after the global optimisation and the
global optimisation is then executed again with the new solution. However, this would require
a lot of computing time. On the other hand, these discrete options are usual in global energy
system optimisations. Even without the above-mentioned iterations, there would still be added
value compared to the studies mentioned in Section 2.1 as the DHN could now be dimensioned
in the global optimisation.

The responsibility for the contents of the working papers rests with the author, not the institute.
Since working papers are of preliminary nature, it may be useful to contact the author of a
particular working paper about results or caveats before referring to, or quoting, a paper. Any
comments on working papers should be sent directly to the author.
Working Paper Series in Production and Energy
recent issues
No. 1 Alexandra-Gwyn Paetz, Lisa Landzettel, Patrick Jochem, Wolf Fichtner:
Eine netnografische Analyse der Nutzererfahrungen mit E-Rollern
No. 2 Felix Teufel, Michael Miller, Massimo Genoese, Wolf Fichtner:
Review of System Dynamics models for electricity market simulations
No. 3 Patrick Jochem, Thomas Kaschub, Wolf Fichtner:
How to integrate electric vehicles in the future energy system?
No. 4 Sven Killinger, Kai Mainzer, Russell McKenna, Niklas Kreifels, Wolf
Fichtner:
A regional simulation and optimization of renewable energy supply from
wind and photovoltaics with respect to three key energy-political
objectives
No. 5 Kathrin Dudenhöffer, Rahul Arora, Alizée Diverrez, Axel Ensslen, Patrick
Jochem, Jasmin Tücking:
Potentials for Electric Vehicles in France, Germany, and India
No. 6 Russell McKenna, Carsten Herbes, Wolf Fichtner:
Energieautarkie: Definitionen, Für- bzw. Gegenargumente, und
entstehende Forschungsbedarfe
No. 7 Tobias Jäger, Russell McKenna, Wolf Fichtner:
Onshore wind energy in Baden-Württemberg: a bottom-up economic
assessment of the socio-technical potential
No. 8 Axel Ensslen, Alexandra-Gwyn Paetz, Sonja Babrowski, Patrick Jochem,
Wolf Fichtner:
On the road to an electric mobility mass market - How can early adopters
be characterized?
No. 9 Kai Mainzer, Russell McKenna, Wolf Fichtner:
Charakterisierung der verwendeten Modellansätze im Wettbewerb
Energieeffiziente Stadt
No. 10 Hannes Schwarz, Valentin Bertsch, Wolf Fichtner:
Two-stage stochastic, large-scale optimization of a decentralized energy
system – a residential quarter as case study
No. 11 Leon Hofmann, Russell McKenna, Wolf Fichtner:
Development of a multi-energy residential service demand model for
evaluation of prosumers‘ effects on current and future residential load
profiles for heat and electricity
No. 12 Russell McKenna, Erik Merkel, Wolf Fichtner:
Energy autonomy in residential buildings: a techno-economic model-
based analysis of the scale effects
No. 13 Johannes Schäuble, Silvia Balaban, Peter Krasselt, Patrick Jochem,
Mahmut Özkan, Friederike Schnellhas-Mende, Wolf Fichtner, Thomas
Leibfried, Oliver Raabe:
Vergleichsstudie von Systemansätzen für das Schnelladen von
Elektrofahrzeugen

The responsibility for the contents of the working papers rests with the author, not the institute.
Since working papers are of preliminary nature, it may be useful to contact the author of a
particular working paper about results or caveats before referring to, or quoting, a paper. Any
comments on working papers should be sent directly to the author.
Working Paper Series in Production and Energy
recent issues
No. 14 Marian Hayn, Valentin Bertsch, Anne Zander, Stefan Nickel, Wolf
Fichtner:
The impact of electricity tariffs on residential demand side flexibility
No. 15 Erik Merkel, Robert Kunze, Russel McKenna, Wolf Fichtner:
Modellgestützte Bewertung des Kraft-Wärme-Kopplungsgesetzes 2016
anhand ausgewählter Anwendungsfälle in Wohngebäuden
No. 16 Russell McKenna, Valentin Bertsch, Kai Mainzer, Wolf Fichtner:
Combining local preferences with multi-criteria decision analysis and
linear optimisation to develop feasible energy concepts in small
communities
No. 17 Tilman Apitzsch, Christian Klöffer, Patrick Jochem, Martin Doppelbauer,
Wolf Fichtner:
Metaheuristics for online drive train efficiency optimization in electric
vehicles
No. 18 Felix Hübner, Georg von Grone, Frank Schultmann:
Technologien zur Zerlegung und zur Dekontamination von
kerntechnischen Anlagen
No. 19 Felix Hübner, Jennifer Jana Jung, Frank Schultmann:
Gefahren ionisierender Strahlung für Mensch und Umwelt in Bezug auf
kerntechnische Anlagen
No. 20 Juri Lüth, Tobias Jäger, Russell McKenna, Wolf Fichtner:
Photovoltaik auf Gebäuden: eine GIS-gestützte Ermittlung des Potenzials
in Baden-Württemberg
No. 21 Felix Hübner, Jennifer Jana Jung, Frank Schultmann:
Auswirkungen nuklearer Unfälle auf den Menschen und die Umwelt
No. 22 Felix Hübner, Ulli Schellenbaum, Christian Stürck; Patrick Gerhards,
Frank Schultmann:
Evaluation von Schedulingproblemen für die Projektplanung von
Großprojekten am Beispiel des kerntechnischen Rückbaus
No. 23 Martin Hain, Hans Schermeyer, Marliese Uhrig-Homburg, Wolf Fichtner:
An Electricity Price Modeling Framework for Renewable-Dominant
Markets
No. 24 Hannes Schwarz, Lars Kotthoff, Holger Hoos, Wolf Fichtner and Valentin
Bertsch:
Using automated algorithm configuration to improve the optimization of
decentralized energy systems modeled as large-scale, two-stage
stochastic programs
No. 25 Felix Hübner, Tobias Hünlich, Florian Frost, Rebekka Volk, Frank
Schultmann
Analyse des internationalen Marktes für den Rückbau kerntechnischer
Anlagen: Stand und Ausblick

The responsibility for the contents of the working papers rests with the author, not the institute.
Since working papers are of preliminary nature, it may be useful to contact the author of a
particular working paper about results or caveats before referring to, or quoting, a paper. Any
comments on working papers should be sent directly to the author.
Working Paper Series in Production and Energy
recent issues
No. 26 Jann Weinand, Russell McKenna, Wolf Fichtner
Developing a municipality typology for modelling decentralised energy
systems
No. 27 Andreas Bublitz, Dogan Keles, Florian Zimmermann, Christoph
Fraunholz, Wolf Fichtner
A survey on electricity market design: Insights from
theory and real-world implementations of capacity
remuneration mechanisms
No. 28 Felix Hübner, Sven Möller, Frank Schultmann
Entwicklung eines Expertensystems für die Planung kerntechnischer
Rückbauprojekte
No. 29 Alexander Harbrecht, Russell McKenna, David Fischer, Wolf Fichtner
Behavior-oriented Modeling of Electric Vehicle Load Profiles: A Stochastic
Simulation Model Considering Different Household Characteristics,
Charging Decisions and Locations
No. 30 Daniel Heinz
Erstellung und Auswertung repräsentativer Mobilitäts- und Ladeprofile für
Elektrofahrzeuge in Deutschland
No. 31 Jann Weinand, Russell McKenna, Katharina Karner, Lorenz Braun,
Carsten Herbes
Assessing the potential contribution of excess heat from biogas plants
towards decarbonising German residential heating
No. 32 Daniel Fehrenbach
Modellgestützte Optimierung des energetischen Eigenverbrauchs von
Wohngebäuden bei sektor-gekoppelter Wärmeversorgung –Vorstellung
des POPART-Modells

www.iip.kit.edu
Impressum
Karlsruher Institut für Technologie
Institut für Industriebetriebslehre und Industrielle Produktion (IIP)
Deutsch-Französisches Institut für Umweltforschung (DFIU)
Hertzstr. 16
D-76187 Karlsruhe
KIT – Universität des Landes Baden-Württemberg und
nationales Forschungszentrum in der Helmholtz-Gemeinschaft
Working Paper Series in Production and Energy
No. 33, January 2019
ISSN 2196-7296


![A Two-stage Genetic Programming Hyper-heuristic Approach ...€¦ · A hyper-heuristic [3, 5] is a heuristic search method that seeks to select or generate heuristics to efficiently](https://img.pdfslide.net/doc/110x75/602d6c2aca027a7e2009671c/a-two-stage-genetic-programming-hyper-heuristic-approach-a-hyper-heuristic-3.jpg)


![Informed [Heuristic] Search - University of Delawaredecker/courses/681s07/pdfs/04-Heuristic...Informed [Heuristic] Search Heuristic: “A rule of thumb, simplification, or educated](https://img.pdfslide.net/doc/110x75/5aa1e13c7f8b9a84398c48b6/informed-heuristic-search-university-of-delaware-deckercourses681s07pdfs04-heuristicinformed.jpg)