Embed Size (px)
Citation preview
DEVELOPING BASELINE DATA FOR MONITORING AND EVALUATION
OF LAND REGISTRATION IMPLEMENTATION IN RWANDA
A CASE STUDY OF GASABO DISTRICT
by
RURANGWA Eugène
Submitted in partial fulfilment
of the academic requirements for the degree of
Master of Environment and Development,
Land Information Management Stream,
in the Centre for Environment, Agriculture and Development,
School of Applied Environmental Sciences,
Faculty of Science and Agriculture,
University of KwaZulu-Natal
Pietermaritzburg
December 2007
Supervisor: Dr. Denis RUGEGE

iii
ABSTRACT
Various literature suggest that securing access to land and guaranteeing land tenure se-
curity is essential for diverse land-based livelihoods and remains a prerequisite for sus-
tainable agriculture, economic growth and poverty reduction. Secure land tenure is
recognized as a key element to meeting the MDG target 11 to achieve significant im-
provement in the lives of 100 million slums dwellers by 2020.
In the case of Rwanda, land tenure reform involves changes in land tenure systems from
traditional and customary arrangements to more simple, modern and streamlined land
tenure mechanisms guided by a core land registration system which is affordable, efficient
and participatory. This development towards change in land registration patterns requires
strong instruments for monitoring and evaluation and impact assessment of land registra-
tion implementation. The main purpose of this research is to develop key indicators to be
used as baseline monitoring and evaluation instruments for land registration implementa-
tion in Rwanda, the shortage of time having limited the case study to one, but important
District of Rwanda: Gasabo. The conceptual argument follows the logic of thinking that,
when land tenure, symbolized by different values is supported by formal or legal land reg-
istration procedures, it gives it a dimension of power, insurance, guarantee and security
that can be symbolized by different indicators measurable as variables. Seven key indica-
tors were identified. To test the defined baseline indicators for validity, data was obtained
from a sample of 150 respondents using a cluster sampling technique and structured in-
terviews.
The findings demonstrate the defined indicators could be measured and the quality of
measurement (validity) established from statistical behavior of the variables. The results
have shown that none of sampled households has a land title, this effect being recognized
as a major hindrance to tenure security and to fruitful investment in land. Only those few
who had other kinds of documents confirming rights to land, although of lesser weight,
were eligible to a loan from a bank. The results have shown that the beneficiaries of bank
loans have improved their income by being involved in land transactions and by acquiring
a new land as well as buying domestic animals. The results also show that these interac-
tions have brought a significant improvement in land productivity and consequently, raised
income. Although household date showed low rate of land disputes, secondary data at
district level showed significantly higher rates of occurrence and very low rates of dispute
resolution. It is generally observed that land disputes could be avoided or solved if suffi-

iv
cient operational, legal and institutional instruments for disputes resolution and land regis-
tration are in place.
v
PREFACE
The work described in this dissertation has been undertaken in the Centre for Environment,
Agriculture and Development, University of KwaZulu-Natal, Pietermaritzburg Campus,
from April 2007 to November 2007, under the supervision of Dr. Denis RUGEGE
and the co-supervision of M. Dorman CHIMHAMHIWA.
These studies represent the original work by the author and have not been submitted in any
form, in part or in whole to any other University. Where use of others’ work has been
made,
it has been duly acknowledged in the text.
Signed: …………………………… Eugène RURANGWA (Candidate)
Signed: …………………………… Dr. Denis RUGEGE (Supervisor)
Signed: …………………………… M. Dorman CHIMHAMHIWA (Co-Supervisor)

vii
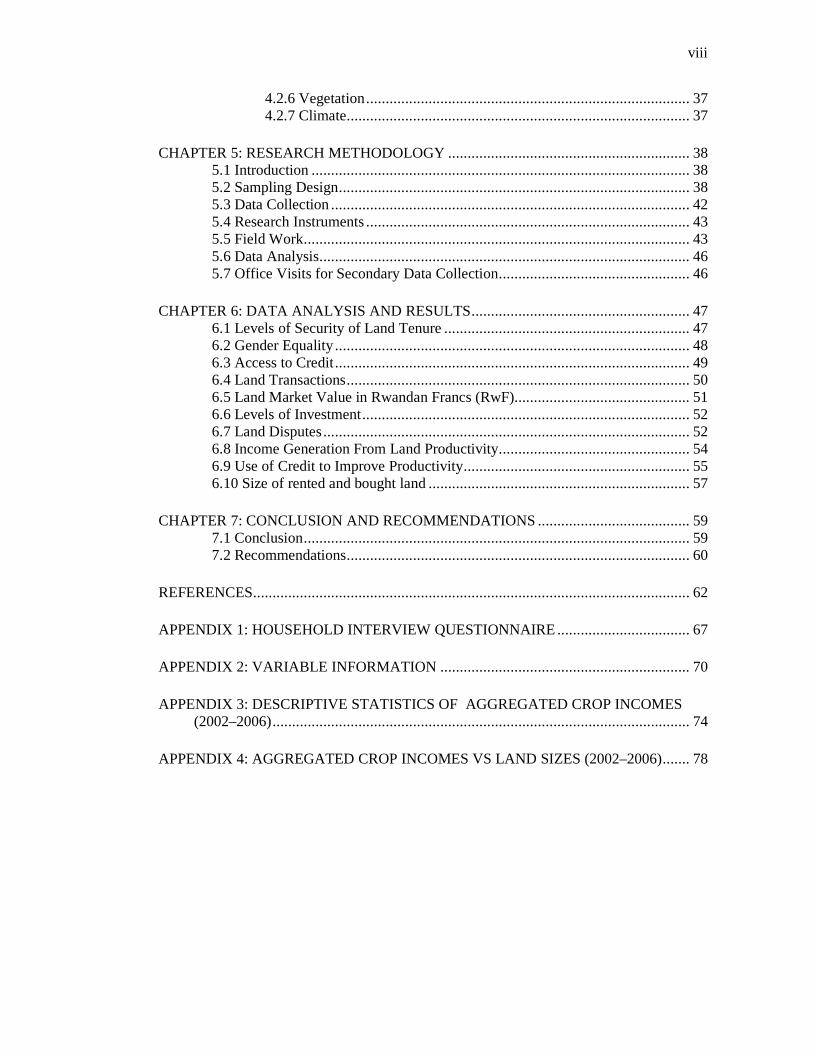
TABLE OF CONTENTS
LIST OF FIGURES.......................................................................................................... ix
LIST OF TABLES ............................................................................................................ x ABREVIATIONS AND ACRONYMS……………………………………………………xi
ACKNOWLEDGEMENTS............................................................................................. xii
CHAPTER 1: GENERAL OVERVIEW............................................................................ 1 1.1 Background and Context................................................................................ 1 1.2 Problem Statement......................................................................................... 4 1.3 Main Objective .............................................................................................. 6 1.4 Specific Objectives ........................................................................................ 6 1.5 Research Questions........................................................................................ 7
CHAPTER 2: CONCEPTUAL FRAMEWORK................................................................ 8
CHAPTER 3: LITERATURE REVIEW..........................................................................15 3.1 Land and its Social and Economic Importance ............................................. 15 3.2 Land Tenure................................................................................................. 17
3.2.1 General Overview ....................................................................... 17 3.2.2 Land Tenure and Land Policy...................................................... 18 3.2.3 Land Tenure and Poverty Reduction............................................ 19
3.3 Land Registration and Land Administration Paradigm ................................. 20 3.3.1 The Importance of Land Registration and Titling......................... 20 3.3.2 The Land Registration and Land Administration Paradigm.......... 22
3.4 Historical Background to Land Tenure in Rwanda ....................................... 23 3.5 The National Land Tenure Reform Program in Rwanda............................... 26
3.5.1 Introduction................................................................................. 26 3.5.2 Objectives of the National Land Tenure Reform Program
(NLTRP)..................................................................................... 26 3.5.3 Implementation of the National Land Tenure Reform Program.... 26 3.5.4 Baseline Data for the Implementation of National Land Tenure
Reform Program ......................................................................... 30
CHAPTER 4: DESCRIPTION OF THE STUDY AREA................................................. 32 4.1 Introduction ................................................................................................. 32 4.2 Gasabo District ............................................................................................ 32
4.2.1 General Overview ....................................................................... 32 4.2.2 Location ...................................................................................... 33 4.2.3 Population ................................................................................... 33 4.2.4 Topography................................................................................. 34 4.2.5 Soils ............................................................................................ 35
4.2.5.1 Soils derived from sedimentary and metamorphic rocks .............35 4.2.5.2 Soils derived from magma and igneous rocks..............................35 4.2.5.3 Soils derived from alluvial and colluvial deposits .......................35
viii
4.2.6 Vegetation................................................................................... 37 4.2.7 Climate........................................................................................ 37
CHAPTER 5: RESEARCH METHODOLOGY .............................................................. 38 5.1 Introduction ................................................................................................. 38 5.2 Sampling Design.......................................................................................... 38 5.3 Data Collection ............................................................................................ 42 5.4 Research Instruments ................................................................................... 43 5.5 Field Work................................................................................................... 43 5.6 Data Analysis............................................................................................... 46 5.7 Office Visits for Secondary Data Collection................................................. 46
CHAPTER 6: DATA ANALYSIS AND RESULTS........................................................ 47 6.1 Levels of Security of Land Tenure ............................................................... 47 6.2 Gender Equality ........................................................................................... 48 6.3 Access to Credit........................................................................................... 49 6.4 Land Transactions........................................................................................ 50 6.5 Land Market Value in Rwandan Francs (RwF)............................................. 51 6.6 Levels of Investment.................................................................................... 52 6.7 Land Disputes.............................................................................................. 52 6.8 Income Generation From Land Productivity................................................. 54 6.9 Use of Credit to Improve Productivity.......................................................... 55 6.10 Size of rented and bought land ...................................................................57
CHAPTER 7: CONCLUSION AND RECOMMENDATIONS ....................................... 59 7.1 Conclusion................................................................................................... 59 7.2 Recommendations........................................................................................ 60
REFERENCES................................................................................................................ 62
APPENDIX 1: HOUSEHOLD INTERVIEW QUESTIONNAIRE.................................. 67
APPENDIX 2: VARIABLE INFORMATION ................................................................ 70
APPENDIX 3: DESCRIPTIVE STATISTICS OF AGGREGATED CROP INCOMES (2002–2006)........................................................................................................... 74
APPENDIX 4: AGGREGATED CROP INCOMES VS LAND SIZES (2002–2006)....... 78
ix
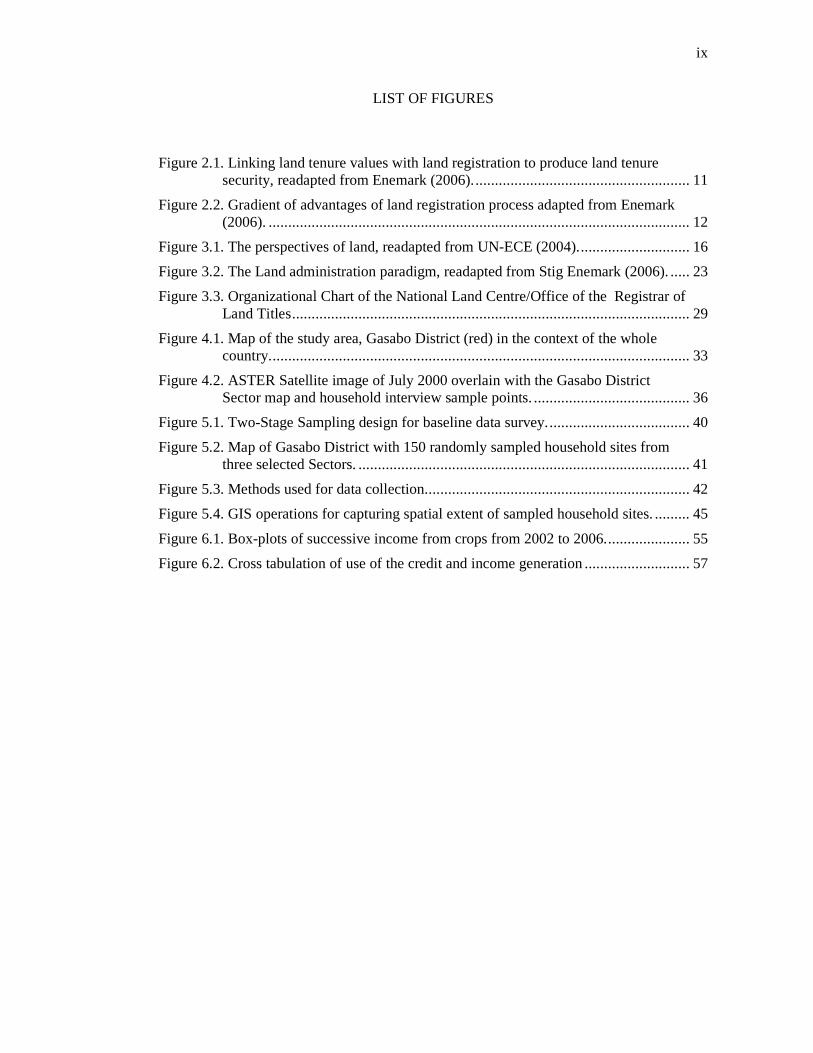
LIST OF FIGURES
Figure 2.1. Linking land tenure values with land registration to produce land tenure security, readapted from Enemark (2006)........................................................ 11
Figure 2.2. Gradient of advantages of land registration process adapted from Enemark (2006). ............................................................................................................ 12
Figure 3.1. The perspectives of land, readapted from UN-ECE (2004)............................. 16
Figure 3.2. The Land administration paradigm, readapted from Stig Enemark (2006). ..... 23
Figure 3.3. Organizational Chart of the National Land Centre/Office of the Registrar of Land Titles...................................................................................................... 29
Figure 4.1. Map of the study area, Gasabo District (red) in the context of the whole country............................................................................................................ 33
Figure 4.2. ASTER Satellite image of July 2000 overlain with the Gasabo District Sector map and household interview sample points. ........................................ 36
Figure 5.1. Two-Stage Sampling design for baseline data survey..................................... 40
Figure 5.2. Map of Gasabo District with 150 randomly sampled household sites from three selected Sectors. ..................................................................................... 41
Figure 5.3. Methods used for data collection.................................................................... 42
Figure 5.4. GIS operations for capturing spatial extent of sampled household sites. ......... 45
Figure 6.1. Box-plots of successive income from crops from 2002 to 2006...................... 55
Figure 6.2. Cross tabulation of use of the credit and income generation ........................... 57
x
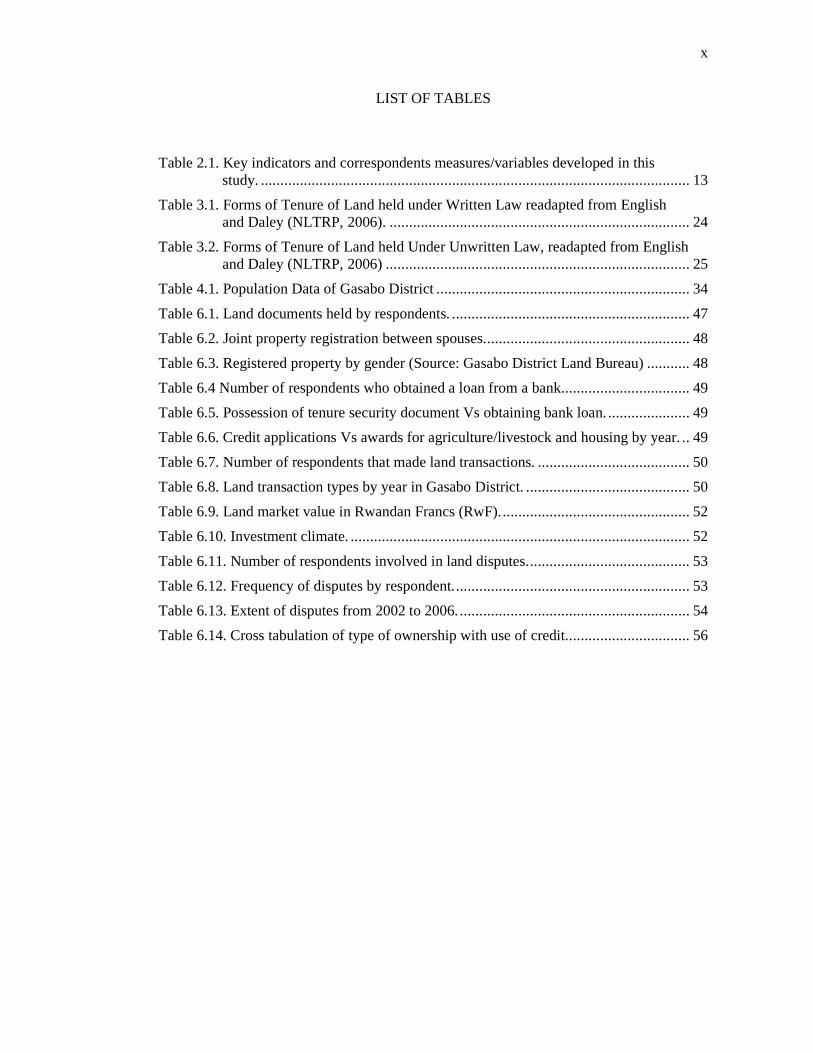
LIST OF TABLES
Table 2.1. Key indicators and correspondents measures/variables developed in this study. .............................................................................................................. 13
Table 3.1. Forms of Tenure of Land held under Written Law readapted from English and Daley (NLTRP, 2006). ............................................................................. 24
Table 3.2. Forms of Tenure of Land held Under Unwritten Law, readapted from English and Daley (NLTRP, 2006) .............................................................................. 25
Table 4.1. Population Data of Gasabo District ................................................................. 34
Table 6.1. Land documents held by respondents. ............................................................. 47
Table 6.2. Joint property registration between spouses..................................................... 48
Table 6.3. Registered property by gender (Source: Gasabo District Land Bureau) ........... 48
Table 6.4 Number of respondents who obtained a loan from a bank................................. 49
Table 6.5. Possession of tenure security document Vs obtaining bank loan...................... 49
Table 6.6. Credit applications Vs awards for agriculture/livestock and housing by year. .. 49
Table 6.7. Number of respondents that made land transactions. ....................................... 50
Table 6.8. Land transaction types by year in Gasabo District. .......................................... 50
Table 6.9. Land market value in Rwandan Francs (RwF)................................................. 52
Table 6.10. Investment climate. ....................................................................................... 52
Table 6.11. Number of respondents involved in land disputes.......................................... 53
Table 6.12. Frequency of disputes by respondent............................................................. 53
Table 6.13. Extent of disputes from 2002 to 2006............................................................ 54
Table 6.14. Cross tabulation of type of ownership with use of credit................................ 56

xii
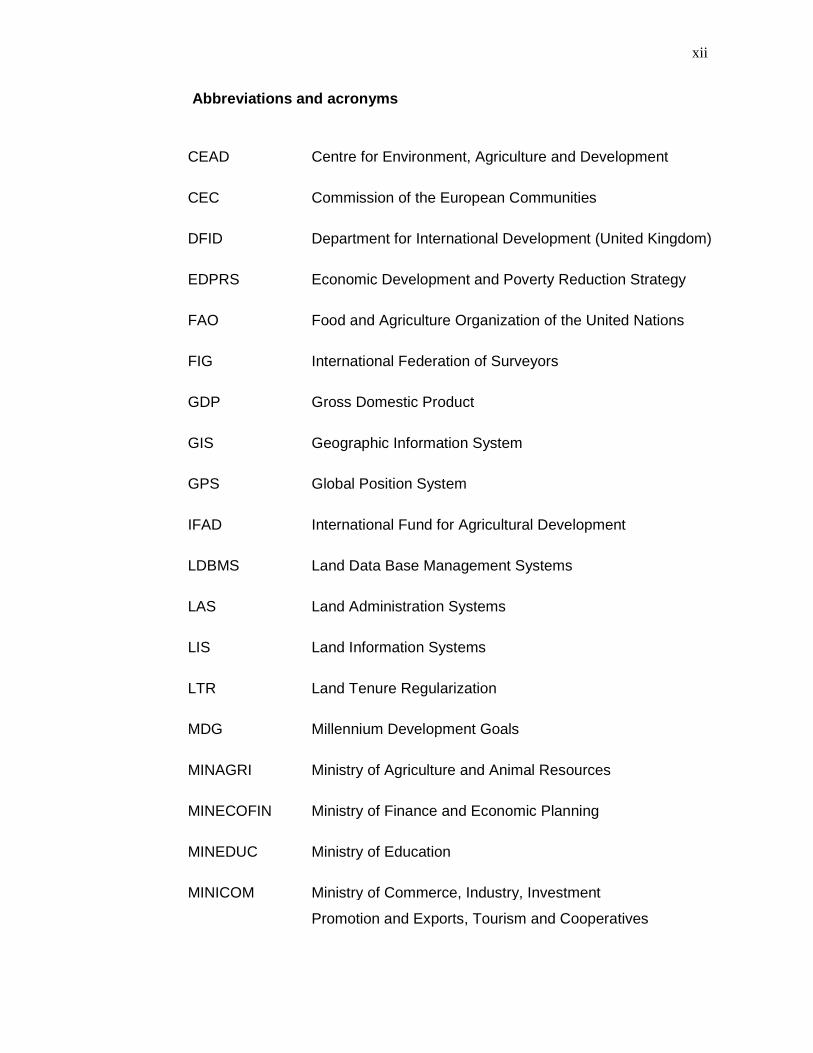
Abbreviations and acronyms
CEAD Centre for Environment, Agriculture and Development
CEC Commission of the European Communities
DFID Department for International Development (United Kingdom)
EDPRS Economic Development and Poverty Reduction Strategy
FAO Food and Agriculture Organization of the United Nations
FIG International Federation of Surveyors
GDP Gross Domestic Product
GIS Geographic Information System
GPS Global Position System
IFAD International Fund for Agricultural Development
LDBMS Land Data Base Management Systems
LAS Land Administration Systems
LIS Land Information Systems
LTR Land Tenure Regularization
MDG Millennium Development Goals
MINAGRI Ministry of Agriculture and Animal Resources
MINECOFIN Ministry of Finance and Economic Planning
MINEDUC Ministry of Education
MINICOM
Ministry of Commerce, Industry, Investment
Promotion and Exports, Tourism and Cooperatives
xiii
MININFRA Ministry of Infrastructure
MINITERE Ministry of Land, Environment, Forestry, Water and Mines
NISR National Institute of Statistics of Rwanda
NLC National Land Centre
NLTRP National Land Tenure Reform Program
NUR National University of Rwanda
ORLT Office of the Registrar of Land Titles
PRSP Poverty Reduction Strategic Paper
RDI Rural Development Institute
RITA Rwanda Information Technology Authority
RwF Rwandan Franc
SPSS Statistical Package for the Social Sciences
UNCED United Nations Conference on Environment and Develop-
ment
UN-ECA United Nations Economic Commission for Africa
UN-ECE United Nations Economic Commission for Europe
UN-ESCA United Nations Economic and Social Commission for Asia
xiv
As the candidate’s supervisor, I have approved this mini-dissertation for submission.
Supervisor: Dr. Denis Rugege…………………………………………………….
Signed:……………………………………………………………………………….
Date: …………………………………………………………………………………
xv
ACKNOWLEDGEMENTS
I am grateful to Dr. Denis RUGEGE, my Supervisor. His scientific guidance and advise
have left me feel that his concern was beyond the wish to see this work merely taking a
good and scientific shape.
I am also indebted to Mr. Dorman CHIMHAMHIWA, my co-supervisor, for his enthusi-
asm in helping me to compile important documentation for this thesis.
It is with great honour and pride that I take this opportunity to express my sincere and
deepest gratitude to the Government of Rwanda for its bright vision and laudable policy of
investing in human resources, the most valuable resource the Country has for its sustain-
able development. I am proud to be one of the fruits of this vision.
I am deeply grateful to the United Kingdom’s Department for International Development
(DFID) for having graciously founded my participation to this Programme. I address my
special thanks to Mr. Jimmy Mc Credie and Mr. Rodney Dyer from DFID and Mr. Clive
English from NLTRP for their kind support.
I have appreciated the spontaneous and enthusiastic contributions of the Leadership of
Gasabo District, especially the Mayor, Mrs. Claudine NYINAWAGAGA and the District’s
Executive Secretary, Mr. Felix KABANDANA.
To my wife Jeannette and Children Lyse, Joël, Sonia, Pamela, Daniel and David-Aristote:
your unwavering support and understanding kept me going ahead even when situation and
working conditions were very tough to support.
As in Rwandan tradition where the good wine is offered last to the most respected person, I
have set aside my best and heartfelt thankfulness to Honourable Minister Patricia
HAJABAKIGA for her greatness and her assistance. For me and my family, she is an awe-
inspiring person.
1
CHAPTER 1 : GENERAL OVERVIEW
1.2 BACKGROUND AND CONTEXT
During the pre-colonial period, land tenure in Rwanda was characterized by collective
ownership of land and was based on the complementary links between agriculture and
livestock. This system facilitated social stability, economic production, stability and har-
mony in production. However, colonial times transformed land tenure into a dual system of
written/statutory and customary arrangements.
The recent Rwandan Land Policy adopted in February 2004 by the Government of Rwanda
put great emphasis on an appropriate land administration system as a key to land tenure
security the through possibility of registering and transferring land. The Land Policy states
that ‘clarification of land rights is required through the development of appropriate land
administration systems, which can guarantee the security of land tenure and promote in-
vestments in land’ (National Land Policy, 2004.p.21). Improved security of rights to land
will reduce opportunities for conflict of interest. In the same line, the Organic Law N°
08/2005 of 14/07/2005 Determining the Use and Management of Land in Rwanda, effec-
tive as of 15th September 2005 specifically calls for registration of land in its article 30.
The goal of the National Land Tenure Reform Programme (NLTRP) put in place to im-
plement the Land Policy and the Organic Law, specifies a land reform process that secures
the rights of all citizens including the poor and vulnerable, whilst also supporting national
economic development and promoting environmental sustainability (NLTRP, 2005). This
goes in line with the long-term national strategic plan (vision 2020) and the five-year na-
tional strategic plan, the Economic Development and Poverty Reduction Strategy
(EDPRS).
The role of land in the economy of each nation is of great significance. Without secure
land rights there can be no sustainable development, for there will be little willingness to
make long-term investments. The United Nations Economic Commission for Europe (UN-
ECE) (2004) recognizes that there is a need to manage the wealth of every nation, at least
20% of whose gross domestic product (GDP) can come from land, property and construc-
tion. UN-ECE (2004) also argues that all countries need to determine the ownership and
2
value of land and property, and to monitor and manage their use so that the value of these
assets may be enhanced.
In the case of Rwanda, land reform involves changes in land tenure that abolish complex
dual system of statutory and traditional/customary rights with the intention to introduce
more simple and streamlined mechanisms of land related transactions or transfers. More
recently (May, 2007, the terms ‘Land Reform’ previously used have been replaced ‘Land
Tenure Reform’ to reflect more precisely the reform envisaged with regard to land tenure
arrangements.
As stated by UN-ECE (1996), land registration system is an important component of land
administration, this being the process of recording and disseminating information about the
ownership, value and use of land and all related assets like real property or real estate. UN-
ECE (1996) also argues that the process of land registration is one of many public services
that when implemented with trust and confidence, contributes to land tenure security and
sustainable and rational use of land.
Some category of authors and experts in land rights matters (Cousin, 2002; Adams, M and
Turner, 2005) argue that land registration is not a prerequisite for tenure security and eco-
nomic development. However, there is another category of who argue that land registration
is an ideal pathway for securing land tenure and promoting investment in land for eco-
nomic growth and poverty alleviation with regard to developing countries in general and
African countries in particular (Dale and McLaughlin, 1998; Deininger and Feder, 1999;
De Soto, 2000; Törhönen, 2003). The example of de Soto (2000) among others is of para-
mount significance in this regard when focusing his insight on the idea of ‘dead’ capital
and poverty alleviation in his book The Mystery of Capital. Why capitalism triumphs in the
West and fails everywhere else. From a block-to-block and farm-by-farm survey, de Soto
has shown that most of the poor in Asia, Africa, the Middle East and the Latin America
already possess the assets they need for capital development. The findings of this survey
revealed some of these extraordinary facts: For instance, in Egypt, the wealth that the poor
have accumulated is worth 55 times as much as the sum of all direct foreign investment
ever recorded in the country. In Haiti, the poorest nation in Latin America, the total assets
of the poor are more than 150 times greater than all the foreign investment received since
the country’s independence from France in 1804. If the United States were to hike its for-
eign – aid budget to the level recommended by the United Nations – 0.7% of national in-
3
come – it would take the richest country on earth more than 150 years to transfer to the
world’s poor resources equal to those that they already possess. De Soto (2000) argued that
these wealth are not able to improve the quality of life of people in these countries because
they are held in non-functional modes: houses built on land whose ownership rights are not
adequately recorded, unincorporated businesses with undefined liability, industries located
where financiers and investors cannot see them.
Because the rights of these possessions are not adequately documented or recorded, these
assets cannot readily be turned into capital, cannot be traded outside the narrow local cir-
cles where people know and trust each other, cannot be used as a collateral for a loan, and
cannot be used as a share against an investment (de Soto, 2000). He concluded by saying
that if property ownership rights are properly recorded, transparent and available for use at
the time of need, these dead capitals would be resuscitated and turnaround to improve the
financial capability of the citizens and bring unprecedented social and economic improve-
ments.
I am on the side of the second category of authors. I am convinced that in Rwanda, land
registration is a key element for securing land tenure and promoting investment in land for
economic growth and poverty alleviation. My argument of assertion is that Rwanda is dif-
ferent, when it comes to analyze the broad context of customary land tenure generally
common in many African countries. In so far as land is concerned, the history of Rwanda
followed a different way compared to other African countries with regard to land tenure
system and land administration as a whole. In other African countries in general, custom-
ary land tenure is perceived as guided by customary practices, traditionally linked to com-
mon traditional rules administered by a hierarchy of chiefs or traditional leaders. In
Rwanda, those practices have existed before during colonial era but disappeared from
1959. Since then, land administration has followed rules setup by colonialists with regard
to written law and the only unwritten customary arrangement still in place is the practice of
father to son inheritance practiced by almost 90% of population mainly in rural area. This
however, does not represent an appropriate and secure land tenure arrangement in an ap-
propriate land administration environment. A secure tenure arrangement is supported by an
appropriate land administration, itself supported by appropriate legal and institutional ar-
rangements.
4
However, the Rwandan society has for years been practicing a virtual and informally indi-
vidualized land tenure system that makes easier to regularize into a written and formal land
tenure system guaranteed by land registration procedures.
1.3 PROBLEM STATEMENT
In Rwanda, the land resource is an important livelihood asset where the economy is based
mainly on Agriculture. The majority of rural Rwandans hold their plots under customary
arrangements from which they depend for subsistence and food security. In practice, for-
mal land registration has been undertaken on only a small proportion of the country, with
the focus on urban land and some land in rural areas under commercial agriculture or
owned by churches.
Limited land registration is carried out on a centralized manual system and service is deliv-
ered on a demand basis with the purpose of providing land users with legal documents of
land holding as evidence of property rights to facilitate all kinds of land transactions.
The new Land Policy requires that land be governed by one legal framework and bring to
an end the dual legal system based on written law and customary arrangements. The Policy
insists that land be properly managed and developed, ultimately for the overall benefit of
the country and its citizens.
Land resource management is identified as a priority in all major strategic plans of the
Government of Rwanda: Vision 2020, Poverty Reduction Strategic Programme, National
Investment Programme, Seven-year Programme of the New Government of August 2003
and the new Rwandan five-year strategic plan, the ‘Economic Development and Poverty
Reduction Strategy’ (EDPRS).
As far as tenure security is concerned, more than 90% of land which constitutes the portion
of unregistered land both in rural and in urban areas leads to many kinds of uncertainty in
term of mismanagement, misuse, countless land disputes and lack of investment for im-
proving land productivity and combating hunger and poverty. This suggests that formal
registration of land should reduce land disputes, increase tenure security and provide a
good foundation for economic growth.
5
The majority of farmers may not seek formal land titles. However they do require security
of rights to use land that are adequate for them to invest in long-term and sustained im-
provements, whether for subsistence or commercial purposes. Those living in urban areas
and others managing large commercial farms also require registration of their holdings.
A survey conducted recently by a team from NLTRP (2006) has observed and concluded
that the rural population in general and vulnerable groups in particular now see the State as
the best guarantor of tenure security through appropriate legal and institutional arrange-
ments as well as transparent, efficient and equitable land administration. It is also observed
that people are increasingly reliant on informal written proof of land ownership which still
constitutes a barrier to access to credit for any investment in their land and in this case the
formal registration is an appropriate option.
The recent history of the country, the continuing increase of land scarcity and population
pressure on land is encouraging the growth of the land market and best way to ensure land
transaction is through an appropriate land registration settlement.
Some African countries, like South Africa experienced the procedures of land registration
as a way of securing land tenure and found it as a huge task and a highly challenging one.
This is also the case for Rwanda. In this regard the establishment of baseline indicators to
monitor and evaluate its implementation seem to be a good approach particularly in an Af-
rican context. As stated by Daley (2006), custom is an unhelpful concept. It is never static
but flexible, adaptable and always changing. Customary tenure practices are continuing to
evolve and will continue to do so, especially in Rwanda where customary practices were
fundamentally affected by successive waves of violence from 1959 and by the 1994 geno-
cide. Land registration therefore has to be tackled with a high level of equity and profes-
sionalism.
As observed by English (2007), despite the recent emergence of interest in international
harmonization and/or standardization, land sector indicators as well as monitoring and
evaluation initiatives with regard to land administration have been relatively poorly devel-
oped to date. Two major international institutions, The World Bank/IFC and IFAD have so
far developed appropriate key indicators related to land management.
The World Bank (2007) annual international Doing Business survey includes a Registering
Property component which measures the time taken and legal financial costs incurred in
6
the registration of a land transaction of a commercial property in a capital city by a me-
dium-sized commercial entity. Results are presented for three indicators – the number of
procedures involved, the time taken in days, and the cost as a percentage of the property
values. The results of this survey could be readapted to reflect changes in the Rwanda con-
text following the implementation of the new land registration system over time, and so
should be included in all future assessments.
The International Fund for Agricultural Development (2004) introduced a Performance
Based Assessment System (PBAS) which operates on three levels involving five key areas
of which one is improving equitable access to productive natural resources and technol-
ogy. This key area is sub-divided into three indicators, of which one is Access to Land. Al-
though access to land indicator is relevant to the Rwanda land tenure context, the
methodology is more appropriate to its use within IFAD.
There is a need to organize a common and understandable system of land administration,
supported by land registration, which could embark people in real and sustainable devel-
opment and poverty alleviation. There is also a need to develop appropriate indicators to
monitor and measure the impact of land registration over the years to come.
1.4 MAIN OBJECTIVE
The main objective of this research is to develop key baseline indicators for monitoring
and evaluation of the implementation of land registration system in Rwanda.
1.5 SPECIFIC OBJECTIVES
• To define indicators and measures for evaluating impacts of land registration on:
o tenure security
access to credit
land productivity
investment climate and land transactions/transfers mechanisms
land value
land disputes mitigations or reductions
gender equity
• To test the defined indicators for validity/feasibility/practicability for use as baseline
data
7
1.6 RESEARCH QUESTIONS
The following questions were formulated in order to establish indicators and their respec-
tive measures (variables) that could be used in monitoring and evaluation of the impact of
land registration in the study area:
• How can change in tenure security be measured?
• How can change in access to credit be measured?
• How can change in land productivity be measured?
• How can change in dispute mitigation and management be measured?
• How can change in gender equity with respect to the benefits of land registration?
• How can change in the efficiency and functioning of the land market and other land
transactions be measured?
• How can change in the investment climate be measured?
8
CHAPTER 2: CONCEPTUAL FRAMEWORK
The poverty observed mainly in rural areas of Rwanda is essentially based on poor invest-
ment in land to boost agricultural productivity. Financial institutions are reluctant to give
credit in an informal land tenure system arrangement which also lead to several land dis-
putes and gender inequity. By regularizing the tenure system through formal and legal land
registration regularization, the door will be open to stimulate a better socio-economic envi-
ronment.
There is a broad agreement in the literature which suggests that secure land tenure and
formal recognition of land rights will increase incentives to boost productivity in land and
enhance land-related investments. Economic analysts like Deininger and Feder (1999)
support the view that the contribution of land to economic growth depends upon the secu-
rity, duration and enforceability of property rights, since these provide incentive for agri-
cultural investment and help to develop markets to rent and sell land. With land
administration being the core institutional framework, land registration is a key and well
defined instrumental arrangement to improve tenure security and to facilitate greater effi-
ciency of land and credit markets. Evidence from various studies and authors (Barrows and
Roth, 1990; Brasselle et al.2001; Lin 1992; Deininger, 2003; Feder et al. 1988; Deininger
and Jin, 2002) argue that land registration and titling leads to better access to formal credit,
higher investment in land, higher income and output and higher land values.
Land tenure security refers to secure access of land rights for people who wish to use and
occupy land for diverse purposes. It may be defined as the terms and conditions on which
land is held, used and transacted (Adams et al., 2005). In the Rwandan National Land Pol-
icy (2004), land tenure is defined as methods and procedures that lead to land acquisition
and appropriation. It is, in other words, a combination of regulations that determine modes
of access, exploitation, and control of land and its renewable natural resources. It is there-
fore a relationship between humans or social groups, and land or its underlying resources.
In simple way, land tenure means how land is accessed and held/owned by different users
with the strong support of relevant laws and regulations
9
As stated by Enemark (2006) and Experts from the Un-ECE (2004), in a market economy,
land tenure has many values other than its value for agriculture. For example, it often:
• has value as collateral, such that holding it may benefit non-agricultural;
• has enterprises owned by the same person or organization;
• contributes to social welfare and political stability;
• has value as a speculative asset, particularly in peri-urban areas, where future use for
property development (low-income rentals) raises its value well above that derived
from its agricultural usage;
• provides a better shield against inflation than financial assets;
• has socio-cultural values, is bound up with identity in a particular community and an-
cestral and/or spiritual roots and
• fulfils a security, welfare or insurance role, for example where other livelihood options
are foreclosed.
It can be seen from the above definitions that economic growth and poverty reduction de-
pends on land tenure security in direct and indirect ways:
• Those contributing to household income through their own food production need arable
land tenure security.
• Those contributing to household income through other economic activity usually need
security of tenure of the land on which that activity takes place, either for themselves or
for those controlling the activity on which their livelihoods depend.
The dependence on tenure security includes the requirement for efficient, transparent and
equitable land administration which is the driving force of the whole process of land regis-
tration and land tenure security.
It is argued that land registration and titling system is an institutional arrangement designed
to improve tenure security and to facilitate greater efficiency of land and credit markets
(Gershon and Akihiko, 1998).
It is predictable that since land is one of the best collateral assets available, clearer property
rights and greater ease of their exchange are likely to affect the emergence and efficiency
of financial markets. This implies that land markets have an essential role in the broader
process of economic development as recognized by Deininger and Gershon (1998).
10
Administering land efficiently through an appropriate and innovative registration system
may play a crucial role in socio-economic development of a country because land is recog-
nized as a primary source of wealth and the most important asset to sustain livelihoods
(Quan, 2000). Land yields crops and minerals and supports almost all major economic ac-
tivities and infrastructures. But most importantly, as quoted by Marcus (1991, p.12): ‘land
is a fundamental component of property relations in every society since it is one of the
natural resources essential for social existence. Its distribution is of a vital concern to
every citizen as it affects their basic human rights. Whoever owns the land, controls access
to it, determines the use to which it is put, decides the economic, social and political bene-
ficiaries of production on it, and how the wealth below it is to be exploited. Land property
is a root and symbol of security of life and the identity of human being in a community as a
whole and without it life becomes hopeless’. These statements justify why ensuring secu-
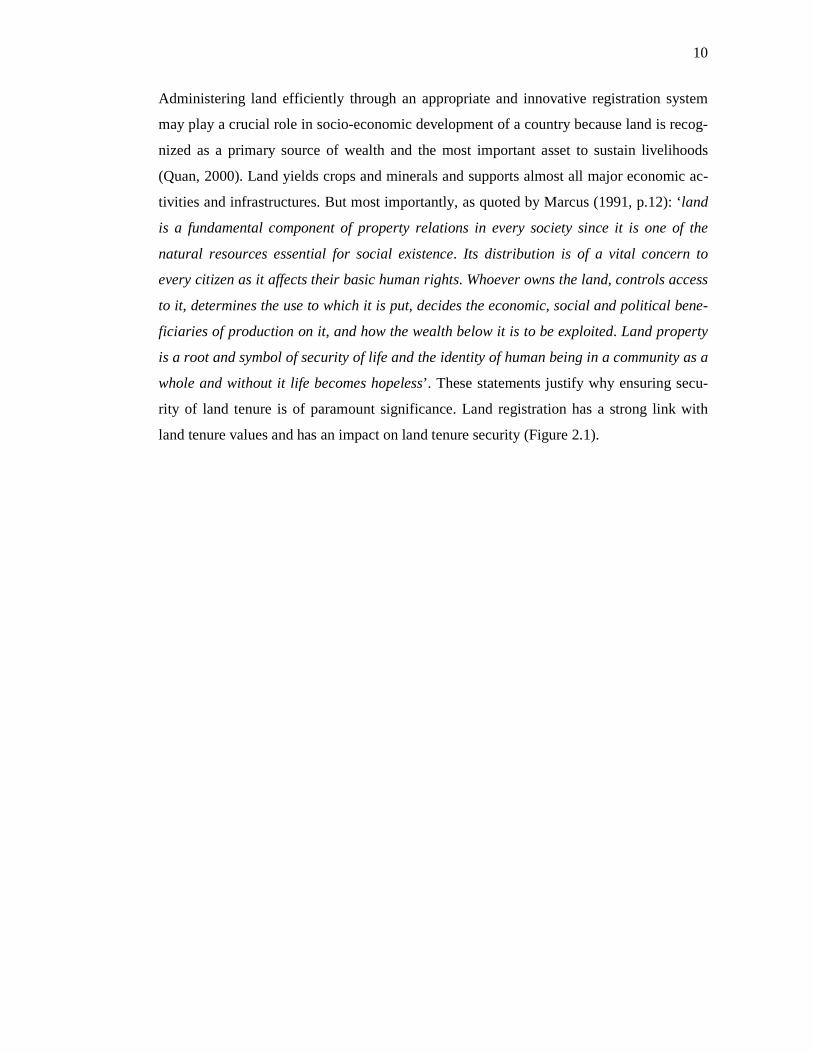
rity of land tenure is of paramount significance. Land registration has a strong link with
land tenure values and has an impact on land tenure security (Figure 2.1).
11
Figure 2.1. Linking land tenure values with land re gistration to produce land tenure security, adapted from Enemark (2006).
Land Registration: -Recording and guaranteeing land rights legally -Gives strength to land titles/land own-ership
Land Tenure Values: - Secures bank loans us-ing land rights as collat-eral, - Raises household in-come through food pro-duction or other alternative means of production - Contributes to social prestige and welfare - Raises land value - Provides a better shield against inflation than fi-nancial assets - Is a mark of identity with ancestral and spiritual roots - Fulfils a security, an in-surance role where other livelihood options are fore-closed - Is an eviction proof - Raises compensation when eviction occurs - Promotes greater gender equity/equality - Reduces land disputes
Security of Tenure : - Land rights protected - Improved access to credit / loans - Improvement of agriculture production - Improvement of land transactions (improved ability to sell, exchange, bequeath, lease, rent land/real property/real estate) - Improved prospects for privatization (safer investment climate) - Better land manage-ment - Enhanced value of land/real property/ real estate - Enhanced value of user rights Reduced land disputes
12
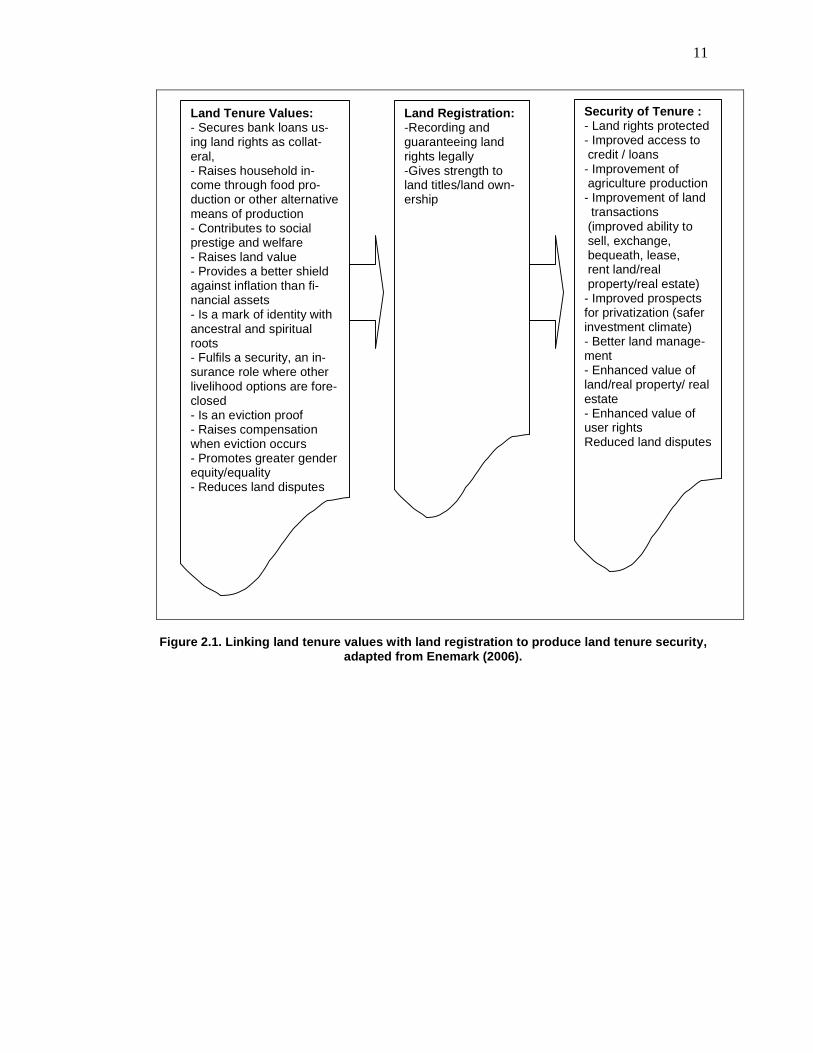
The land registration process shall take a gradient of advantages aimed at ensuring eco-
nomic growth and poverty reduction (Figure 2.2)
Figure 2.2. Gradient of advantages of land registra tion process adapted from Enemark (2006).
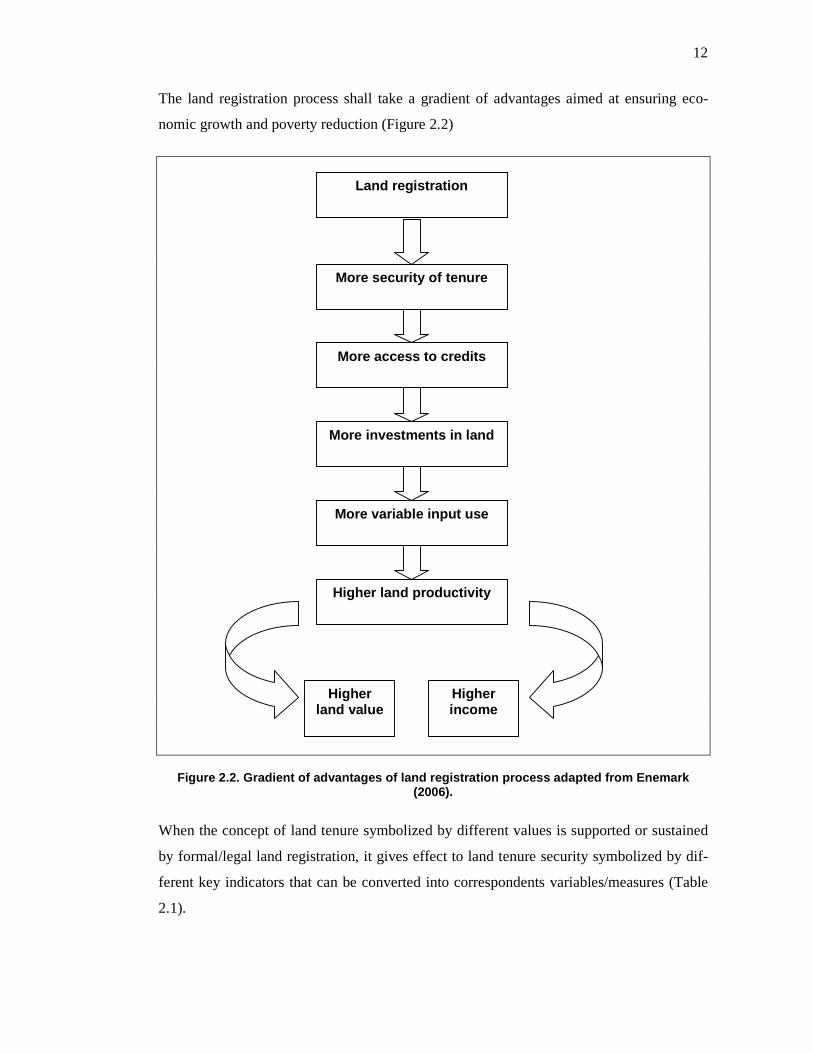
When the concept of land tenure symbolized by different values is supported or sustained
by formal/legal land registration, it gives effect to land tenure security symbolized by dif-
ferent key indicators that can be converted into correspondents variables/measures (Table
2.1).
Land registration
More security of tenure
More access to credits
More investments in land
More variable input use
Higher land productivity
Higher land value
Higher income
13
Table 2.1. Key indicators and correspondents measur es/variables developed in this study.
Indicators Variables Sources of information
Security of land tenure Current registered properties (land ownership held, type of ownership)
Key informants interviews
Household samples
Land Bureaus Archives
Gender equity in security of land ten-ure
Current number of registered co-ownership and trend
Number of female real property registered and trend
Household sample survey
Key informant interview
Land Bureaus Archives
Access to credit Loans applied for and obtained from Banks, use made of bor-rowed funds
Key informants interviews,
Household samples
Banks archives
Land use for productivity Yield, income generation from crop production, livestock
Key informants interviews
Household samples
Land market functionality (transfers/transactions)
Number of properties sold, bought, rented, exchanged
Size of land sold and or bought
Key informants interviews
Household samples
Land value (monetary) Current market value and trend
Current compensation value and trend
Value of farming and grazing land for sale, for rent
Household samples
Key informant interviews
Land bureaus Archives
Land disputes mitigations/ reductions Current land related disputes,
Types of land disputes
Extent of land disputes
Current number solved
Household sample
Key informant interviews
Land bureaus Archives
For the purpose of this study, key indicators described in Table 2.1 will be tested for valid-
ity and practicability, thereafter recommended as baseline instruments for monitoring and
evaluation of impacts of land registration process at national level five year after imple-
mentation. The five-year period has been considered in accordance with the logframe of
EDPRS, which is the major medium term national and multi-sectoral strategic plan to be
implemented in the country over a five-year period (2008-2012). The five-year period has
been considered in reference to literature which demonstrate that in almost all countries,
national census of population and housing are taken every five or ten years and in many
cases, land tenure and housing indicators are derived from census data (Haldrup, 2003). It
is even argued that the two types of functions, census and cadastres (land surveying and
14
land registration) have common interests and could potentially benefit each other (Haldrup,
2003).
By doing so, a certain number of questions can be asked to assess the efficiency of land
registration against the baseline indicators tested:
• Are there any improvements in tenure security as a result of land registration?
• Are land disputes reducing in extent, severity and number?
• Are land disputes become easy and able to be resolved as a result of land registration?
• Is land registration adequately supporting and protecting the land rights of poor and
vulnerable groups?
• How and to what extent is land registration making a contribution to gender equity and
women’s empowerment?
• How and to what extent is land registration making a contribution to improvement of
land value, land productivity and environmental sustainability?
• Is the efficiency and functioning of the land market improving as a result of land regis-
tration?
• Is land registration guaranteeing transfer rights in land and increasing people’s freedom
to transfer?
15
CHAPTER 3: LITERATURE REVIEW
3.1 LAND AND ITS SOCIAL AND ECONOMIC IMPORTANCE
In considering the need for an effective system of land registration in the country, it is nec-
essary to consider first the wider significance of land as the basis of social stability and
economic well- being. It is true that many African countries still rely on land for their
economy. In Rwanda for example, 90% of population rely on agriculture for subsistence
which contributes to 43.5% of GDP and 80% of exports (MINECOFIN, 2002).
It is now universally appreciated that land as a resource is unique. The experts from Rural
Development Institute (2004) argue that farming land is a way of life for nearly half of the
world’s people and for most African peoples. It is a primary source of income, security and
status. Land is the platform for almost all human activities. It is the means of life without
which human beings could not exist. Land is also a part of nature, fixed in location, im-
movable and incapable of expansion in supply, (except very marginally through the proc-
ess of reclamation). The necessity for efficient and effective management of this unique
resource cannot therefore be overstressed (Toulmin and Quan, 2000)
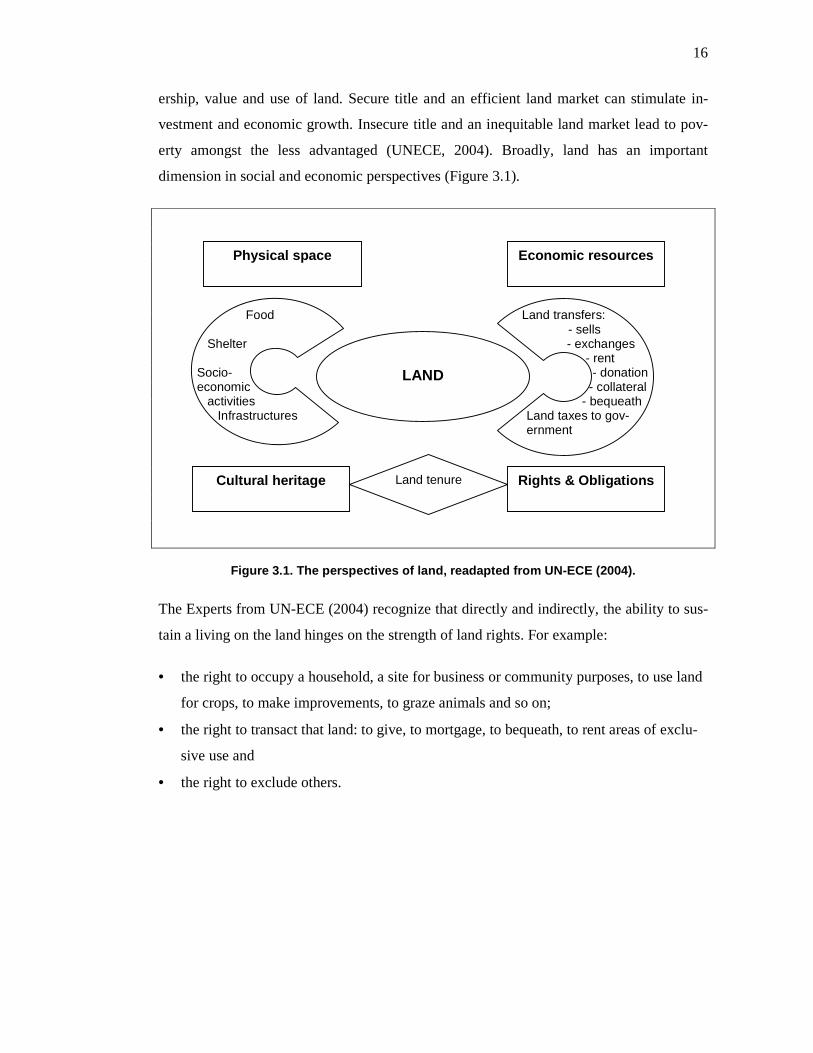
The importance of land can be viewed from different perspectives. The ordinary citizen
and the physical planner may see land as a physical reality, the actual space in which peo-
ple live and work and from which they obtain essential material needs. If it is taken to in-
clude areas that are covered by water which encompass the broad aspect of land, then all
living creatures are dependent upon the land for food, shelter and social interaction. The
lawyer may think of it as a set of real property rights, while the economist may see it as an
economic commodity, a basis for economic production and development and the creation
of wealth. It can be traded through land markets and can also be taxed to produce revenues
that support good governance. Being immovable and indestructible, land also has a cultural
dimension that lies at the heart of any nation and is therefore seen as part of nationhood
and their cultural heritage. But from whatever perspective, land is the foundation of all
human activity and its proper management is a key to the creation and sustenance of civi-
lized societies (Dale and McLaughlin, 1999). The information infrastructure that supports
this management is known as land administration, which in particular focuses on the own-
16
ership, value and use of land. Secure title and an efficient land market can stimulate in-
vestment and economic growth. Insecure title and an inequitable land market lead to pov-
erty amongst the less advantaged (UNECE, 2004). Broadly, land has an important
dimension in social and economic perspectives (Figure 3.1).
Figure 3.1. The perspectives of land, readapted fro m UN-ECE (2004).
The Experts from UN-ECE (2004) recognize that directly and indirectly, the ability to sus-
tain a living on the land hinges on the strength of land rights. For example:
• the right to occupy a household, a site for business or community purposes, to use land
for crops, to make improvements, to graze animals and so on;
• the right to transact that land: to give, to mortgage, to bequeath, to rent areas of exclu-
sive use and
• the right to exclude others.
LAND
Physical space Economic resources
Cultural heritage Rights & Obligations
Food Shelter Socio- economic activities Infrastructures
Land transfers: - sells - exchanges - rent - donation - collateral - bequeath Land taxes to gov-ernment
Land tenure
17
3.2 LAND TENURE
3.2.1 General Overview
Secure access to land remains essential for diverse land-based livelihoods and is a precon-
dition for sustainable agriculture, economic growth and poverty reduction. Secure tenure is
recognized as a key issue in meeting the MDG target 11, to achieve significant improve-
ment in the lives of 100 million slum dwellers by 2020. Along goal 3 of the MDG which
focuses on promoting gender equality and the empowerment of women in order to combat
poverty and stimulate sustainable development, achieving gender equality in access to land
and secure tenure is a key priority as it plays a large part in determining women’s access to
basic infrastructure, services, employment opportunities and their ability to contribute to-
wards sustainable development. Securing access to land is also essential to meet the objec-
tives of Agenda 211, especially in its Section II related to Conservation and Management
of Resources for Development and specifically in its chapter 10 related to Integrated Ap-
proach to the Planning and Management of Land Resources.
The role of land in the economy of each nation is of great significance. Without secure
land rights there can be no sustainable development, for there will be little willingness to
make long-term investments (UN-ECE, 2004). There is a need to manage the wealth of
every nation, at least 20% of whose gross domestic product (GDP) can come from land,
property and construction (UN-ECE, 2004). All countries need to determine the ownership
and value of land and property, and to monitor and manage their use so that the value of
these assets may be enhanced.
In the case of Rwanda, land reform involves changes in land tenure, which is the manner in
which rights are held, thus abolishing complex traditional and customary rights and intro-
ducing more simple and streamlined mechanisms of land related transactions or transfers.
Land tenure may be considered as methods and procedures of land acquisition and appro-
priation. It is, in other words, a combination of regulations that determine modes of access,
exploitation, and control of land and its renewable natural resources. It is therefore a rela-
tionship between humans or social groups, and land or its underlying resources (National
Land Policy, 2004). 1 A comprehensive blueprint of action to be taken globally, nationally and locally by Organizations of UN systems, related to sustainable development and agreed upon at the 1992 earth summit (UNCED) in Rio de Janeiro.
18
In short, land tenure means the way or the mode by which rights to land are held. It is the
manner in which land is acquired and held by individuals (corporeal or incorporeal), com-
munities, the State and Institutions.
3.2.2 Land Tenure and Land Policy
Land tenure defines the relationship between people and land and other natural resources.
It determines who has access to land and who can be excluded from it; the terms and con-
ditions of that access; the rights and obligations that such access gives rise to; how land can
be used and controlled; and the means and circumstances by which the rights and obliga-
tions can be transferred to others. A land tenure System means that a number of interests
can exist simultaneously in the same parcel of land. For example, a right to graze animals
or to forage may exist alongside cultivation rights, or the right to use the land at present
can coexist with a right to take possession of the land at some point in the future.
The ability of a land tenure System to allow for the creation of a number of different and
intersecting rights over land makes it likely that there will be a number of people who have
interests in the same parcel of land. Land tenure is concerned with regulating these differ-
ent interests and overcoming potential conflicts among them.
Land tenure is essentially a social phenomenon, comprising rules invented by society to
regulate behavior (FAO, 2002). Property ‘is not a thing but a power relationship – a rela-
tionship of social and legal legitimacy existing between a person and a valued resource’
(FAO, 2002). It legitimizes access to land and natural resources by individuals and groups
and provides the validation by society of claims to land and land rights. The legitimization
of access to land is likely to reflect power structures and may not be equitable. As stated by
Experts from the Commission of the European Communities (2004), land tenure structures
mirror the distribution of power within society. While access to land is not recognized as a
human right as such, it may be considered as a means to achieve fundamental human rights
as defined by international conventions (Commission of the European Communities,
2004).
The social legitimization of land rights means that tenure systems reflect the social struc-
tures of their societies, together with their norms, values and belief Systems, and the shared
experiences of the society. Land tenure arrangements therefore vary not only in the rights
19
themselves, but also in terms of the means by which they are defined, recorded and en-
forced.
Understanding land tenure is central to strategies to achieve food security, alleviate pov-
erty, provide for peaceful closure to conflicts and promote environmental sustainability.
Experts from the Commission of the European Communities (2004) have observed that in
countries coming out of conflict, fair and just handling of land tenure questions will often
be central to reconstruction, both to maintain peace and provide conditions under which
sustainable economic growth can be re-established.
Security of tenure encourages investment and the development of sustainable means of us-
ing land and natural resources. Flexibility in land tenure allows households to adjust their
holdings and production to meet changing circumstances. The variability of land tenure
among societies, communities and even within countries adds to the complexity of re-
cording and analyzing land tenure data in a consistent manner.
The initial case studies prepared by FAO projects showed that there were some important
relationships between land tenure and, for example, the financial strength of farming busi-
nesses, the age of farmers, farm sizes and production choices (FAO, 2002). It is likely that
there are other important relationships with land tenure – for example, farming methods
and their impact on the environment. Data on specific aspects of land tenure can allow pol-
icy-makers to track the dynamics of land tenure, to identify and quantify emerging issues,
to formulate effective development policies, to plan actions for the mitigation of adverse
trends and to monitor and evaluate current policies.
Land tenure data for policy-making differs from land tenure data used operationally, for
example in land registration and cadastre Systems, which provide information on specific
land rights and responsibilities and are used to provide security of tenure or to collect reve-
nues. The data collected for operational purposes may still provide base data for the policy-
makers but are rarely useful without an additional analysis and comparison to other data
sets.
3.2.3 Land Tenure and Poverty Reduction
Since land is a primary means of both subsistence and income generation in rural econo-
mies, access to land, and security of land rights, is of primary concern to the reduction of
20
poverty. Quan (2000) observed that in rural areas of developing countries, land is a basic
livelihood asset, the principal form of natural capital from which people produce food and
earn a living. He argued that access to land enables family labor to be put to productive use
in farming, generates a source of food, and provides a supplementary source of livelihoods
for rural workers and the urban poor.
The downside of land with secure rights it may be argued is that it can be loaned rented or
sold in times of hardship, and thereby providing some short-term financial relief but long
term disposition and lack of a livelihood source. As a heritable asset, land is the basis for
the wealth and livelihood security of future rural generations
3.3 LAND REGISTRATION AND LAND ADMINISTRATION PARADIGM
3.3.1 The Importance of Land Registration and Titling
Land titling and land registration do not form a separate entity but are interlinked as they
all aimed at ensuring security of tenure through recognition of land rights to the land own-
ers. As stated by Experts from UN-Habitat (2000), when land titling is the process of em-
phasizing the evidence of a person’s rights to land, land registration is the process of
recording those rights . The benefits of land registration and titling and adjudication being
the cornerstone of the whole process, as stated by Williamson (1997), include among oth-
ers:
(a) Certainty of ownership: the formal identification and recognition of the ownership of
the land (adjudication), lead to security of tenure, to greater social cohesion, as well as
to increased productivity, especially in rural areas where farmers have an incentive to
take greater care of the land and to invest their capital and resources in it.
(b) Reduction in land disputes: knowing very well the owners of the lands, knowing
boundaries of the individual or community land through registration, titling and adjudi-
cation not only lead to greater productivity from the land but also reduce the money
wasted on litigation and going to court.
(c) Stimulation of the land market: The introduction of a cheap, secure and effective sys-
tem for recording and transferring interests in land should improve the operation and
efficiency of the land market.
21
(d) Security for credit: The land title can be used as security against any loan. To raise
long-term credit can give rise to substantial increase in productivity from the land.
(e) Facilitation of land reform: Land redistribution and land consolidation can be expedited
through the ready availability of information on who currently owns what rights in
what land.
(f) Facilitation of land management: The development of a cadastral system and in par-
ticular, the creation of cadastral maps in a systematic manner will benefit the State in
the administration of its own land, often giving rise to improved revenue collection
from the land which it leases. In addition, knowing land owners will facilitate land
transaction, taxation and the public acquisition of land through compulsory purchase
prior to redevelopment...
(g) Improvements in physical planning. The cadastral system may be used to support
physical planning in both the urban and rural sectors. Better land administration should
lead to greater efficiency in local government. Many development programmes have
failed or been unnecessarily expensive through a lack of knowledge of existing land
rights.
(h) Supporting environmental management: Cadastral records, in their multipurpose form,
can be used as a tool in assessing the impact of development, in helping in the prepara-
tion of environmental impact assessments and in monitoring environmental change.
Moreover, UN-Habitat experts stipulate that the need to record details of land parcels
within appropriate cadastral systems is after all the ultimate resource from which almost all
wealth comes. Improvements in the management of land are essential for the betterment of
both the rural and the urban poor. Without knowledge of who owns the land, development
cannot peacefully take place. There is broad agreement that secure tenure is a ‘good thing’
for economic, environmental and equity goals (Tulmin, 2006).
Land registration system is an important piece of land administration, this being the proc-
ess of recording and disseminating information about the ownership, value and use of land
and all related assets like real property or real estate.
22
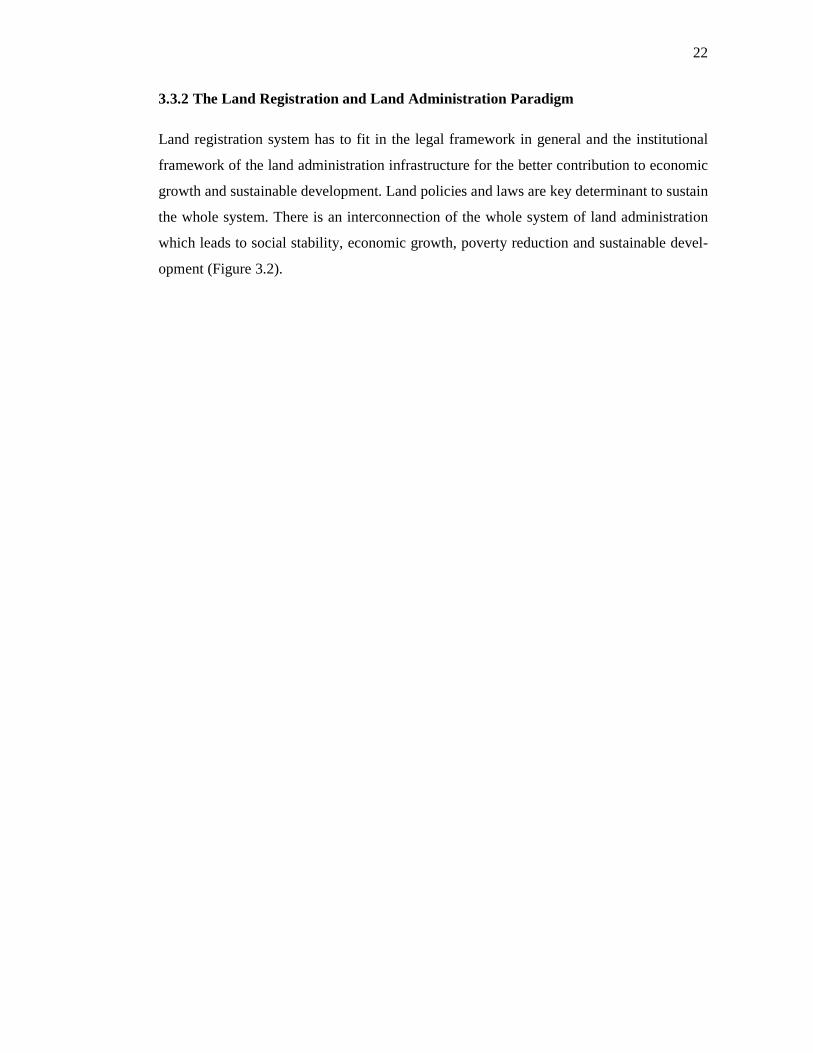
3.3.2 The Land Registration and Land Administration Paradigm
Land registration system has to fit in the legal framework in general and the institutional
framework of the land administration infrastructure for the better contribution to economic
growth and sustainable development. Land policies and laws are key determinant to sustain
the whole system. There is an interconnection of the whole system of land administration
which leads to social stability, economic growth, poverty reduction and sustainable devel-
opment (Figure 3.2).
23
Figure 3.2. The Land administration paradigm, adapt ed from Stig Enemark (2006).
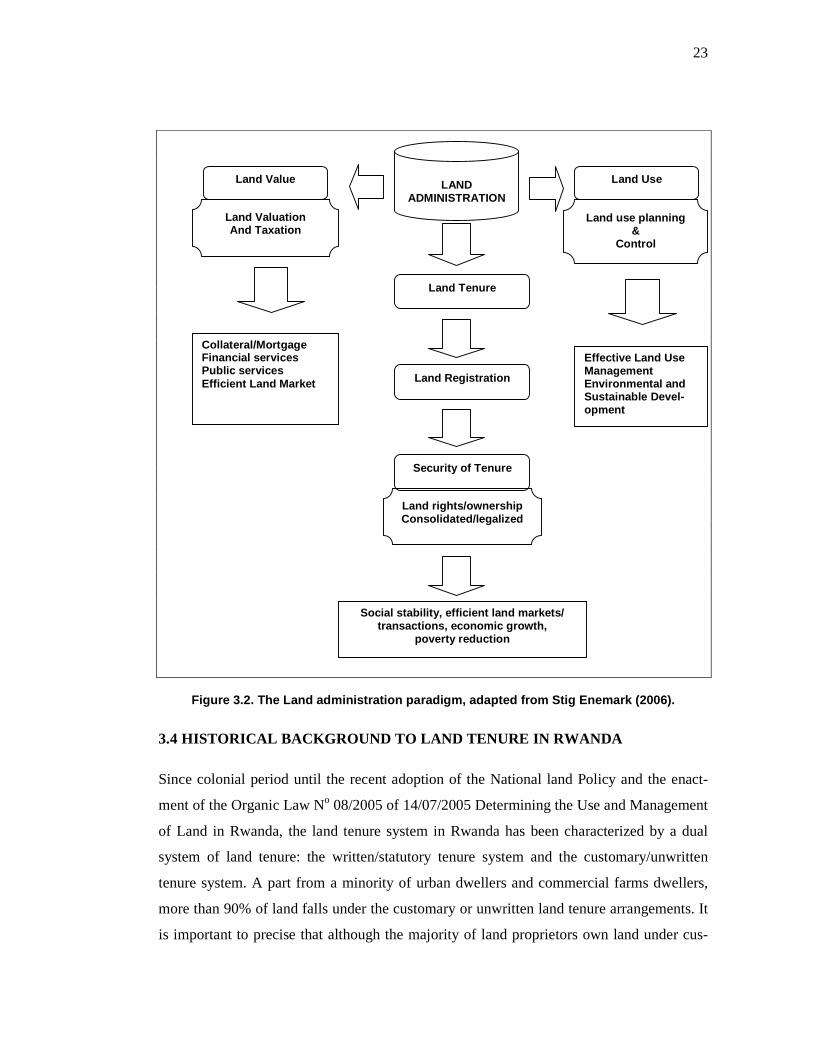
3.4 HISTORICAL BACKGROUND TO LAND TENURE IN RWANDA
Since colonial period until the recent adoption of the National land Policy and the enact-
ment of the Organic Law No 08/2005 of 14/07/2005 Determining the Use and Management
of Land in Rwanda, the land tenure system in Rwanda has been characterized by a dual
system of land tenure: the written/statutory tenure system and the customary/unwritten
tenure system. A part from a minority of urban dwellers and commercial farms dwellers,
more than 90% of land falls under the customary or unwritten land tenure arrangements. It
is important to precise that although the majority of land proprietors own land under cus-
LAND
ADMINISTRATION
Land Tenure
Land Registration
Security of Tenure
Land rights/ownership Consolidated/legalized
Social stability, efficient land markets/ transactions, economic growth,
poverty reduction
Land Value Land Use
Land Valuation And Taxation
Land use planning &
Control Land develoLand develoLand develoLand developpppmentmentmentment
Collateral/Mortgage Financial services Public services Efficient Land Market
Effective Land Use Management Environmental and Sustainable Devel-opment
24
tomary or unwritten land tenure system, the general observation is that the system is char-
acterized by an individualized land tenure system opposed to community or communal
land tenure system observable elsewhere in African Countries which rules under an hierar-
chy of traditional leaders.
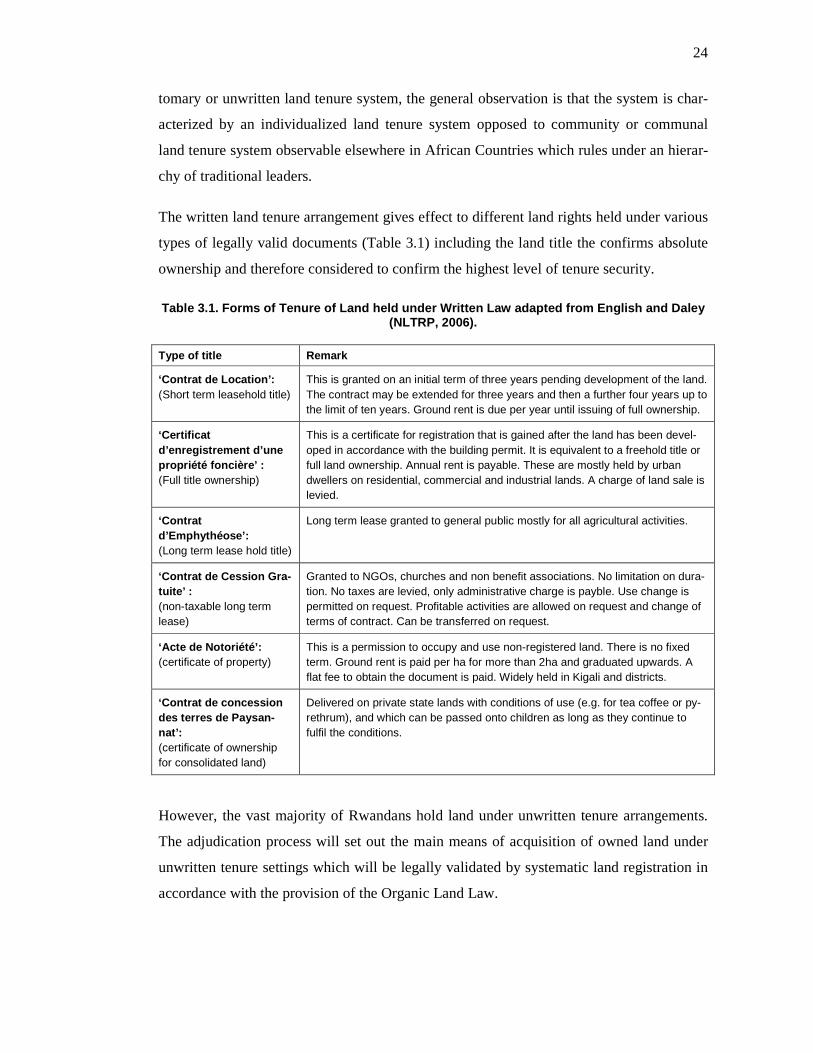
The written land tenure arrangement gives effect to different land rights held under various
types of legally valid documents (Table 3.1) including the land title the confirms absolute
ownership and therefore considered to confirm the highest level of tenure security.
Table 3.1. Forms of Tenure of Land held under Writt en Law adapted from English and Daley (NLTRP, 2006).
Type of title Remark
‘Contrat de Location’: (Short term leasehold title)
This is granted on an initial term of three years pending development of the land. The contract may be extended for three years and then a further four years up to the limit of ten years. Ground rent is due per year until issuing of full ownership.
‘Certificat d’enregistrement d’une propriété foncière’ : (Full title ownership)
This is a certificate for registration that is gained after the land has been devel-oped in accordance with the building permit. It is equivalent to a freehold title or full land ownership. Annual rent is payable. These are mostly held by urban dwellers on residential, commercial and industrial lands. A charge of land sale is levied.
‘Contrat d’Emphythéose’: (Long term lease hold title)
Long term lease granted to general public mostly for all agricultural activities.
‘Contrat de Cession Gra-tuite’ : (non-taxable long term lease)
Granted to NGOs, churches and non benefit associations. No limitation on dura-tion. No taxes are levied, only administrative charge is payble. Use change is permitted on request. Profitable activities are allowed on request and change of terms of contract. Can be transferred on request.
‘Acte de Notoriété’: (certificate of property)
This is a permission to occupy and use non-registered land. There is no fixed term. Ground rent is paid per ha for more than 2ha and graduated upwards. A flat fee to obtain the document is paid. Widely held in Kigali and districts.
‘Contrat de concession des terres de Paysan-nat’: (certificate of ownership for consolidated land)
Delivered on private state lands with conditions of use (e.g. for tea coffee or py-rethrum), and which can be passed onto children as long as they continue to fulfil the conditions.
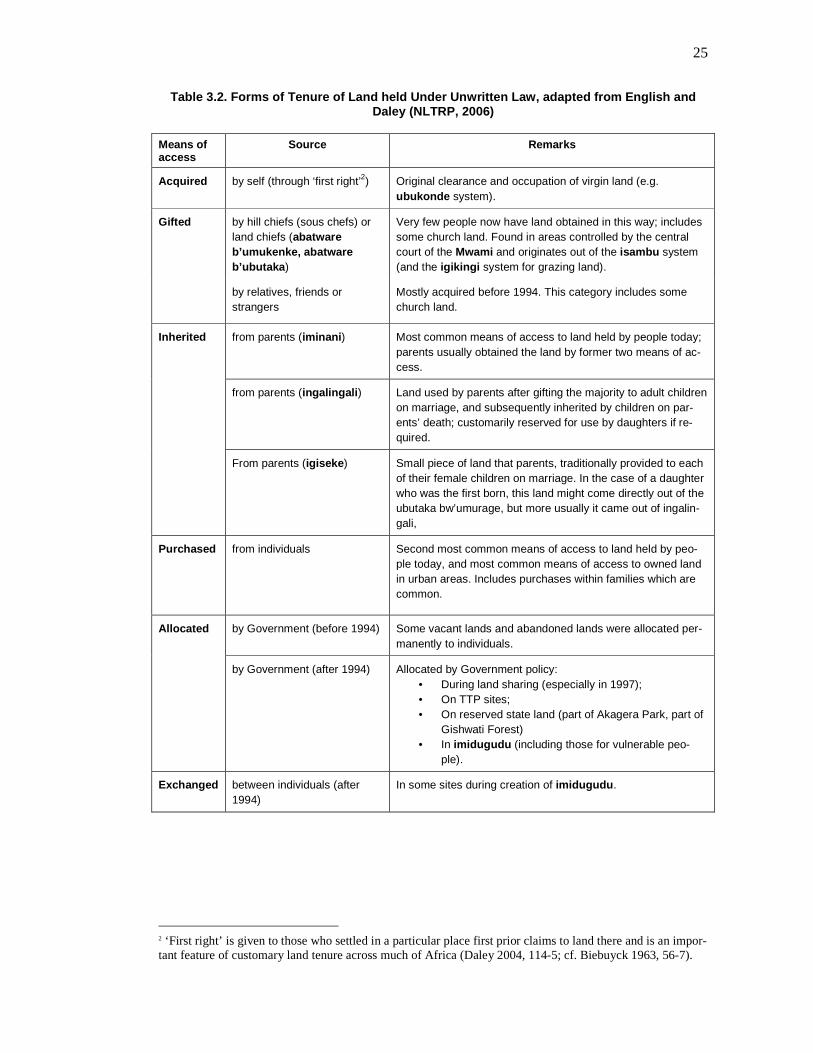
However, the vast majority of Rwandans hold land under unwritten tenure arrangements.
The adjudication process will set out the main means of acquisition of owned land under
unwritten tenure settings which will be legally validated by systematic land registration in
accordance with the provision of the Organic Land Law.
25
Table 3.2. Forms of Tenure of Land held Under Unwri tten Law, adapted from English and Daley (NLTRP, 2006)
Means of access
Source Remarks
Acquired by self (through ‘first right’2) Original clearance and occupation of virgin land (e.g. ubukonde system).
Gifted
by hill chiefs (sous chefs) or land chiefs (abatware b’umukenke, abatware b’ubutaka)
Very few people now have land obtained in this way; includes some church land. Found in areas controlled by the central court of the Mwami and originates out of the isambu system (and the igikingi system for grazing land).
by relatives, friends or strangers
Mostly acquired before 1994. This category includes some church land.
Inherited from parents (iminani) Most common means of access to land held by people today; parents usually obtained the land by former two means of ac-cess.
from parents (ingalingali) Land used by parents after gifting the majority to adult children
on marriage, and subsequently inherited by children on par-ents’ death; customarily reserved for use by daughters if re-quired.
From parents (igiseke) Small piece of land that parents, traditionally provided to each
of their female children on marriage. In the case of a daughter who was the first born, this land might come directly out of the ubutaka bw’umurage, but more usually it came out of ingalin-gali,
Purchased from individuals
Second most common means of access to land held by peo-ple today, and most common means of access to owned land in urban areas. Includes purchases within families which are common.
Allocated by Government (before 1994) Some vacant lands and abandoned lands were allocated per-manently to individuals.
by Government (after 1994) Allocated by Government policy: • During land sharing (especially in 1997); • On TTP sites; • On reserved state land (part of Akagera Park, part of
Gishwati Forest) • In imidugudu (including those for vulnerable peo-
ple).
Exchanged between individuals (after 1994)
In some sites during creation of imidugudu.
2 ‘First right’ is given to those who settled in a particular place first prior claims to land there and is an impor-tant feature of customary land tenure across much of Africa (Daley 2004, 114-5; cf. Biebuyck 1963, 56-7).
26
3.5 THE NATIONAL LAND TENURE REFORM PROGRAM IN RWANDA
3.5.1 Introduction
The National Land Tenure Reform Program (MINITERE, 2007) is a country-led strategic
program in which Government of Rwanda is engaged with various national and interna-
tional stakeholders to ensure the implementation of the National Land Policy and the Or-
ganic Land Law in a transparent and efficient way.
The National Land Tenure Reform Program’s approach is integral to other national long
term strategic plan like vision 2020 and PRSP1. It is also strongly rooted in the objectives
of the new five-year strategic ‘Economic Development and Poverty Reduction Strategy’
(EDPRS), linked or related to economic development, growth and poverty reduction in the
Country.
3.5.2 Objectives of the National Land Tenure Reform Program
Five major objectives are assigned to the National Land Tenure Reform Program
(MINITERE, 2007):
• To improve land tenure security through an efficient, transparent and equitable system
of land administration nationwide;
• To contribute to good governance by implementing the already existing program of
Decentralization through the decentralized land institutions;
• To contribute to food security, rural development, poverty alleviation and sustainable
land management through improvements in land tenure security;
• To encourage multi-sectoral growth through proving land tenure security for invest-
ment in the productive sectors, trade, infrastructure and agriculture;
• To contribute to economic and social development in increasing substantially revenues
and in providing income for local administrations through land rates and taxes and
Central Government through transfer of duties and registration fees.
3.5.3 Implementation of the National Land Tenure Reform Program
To make all these objectives to come into effect, there is a need to develop legal and insti-
tutional platforms for a better coordination of land administration and an appropriate land
27
management as an ideal channel to guarantee security of tenure, to promote investment in
land and to enhance sustainable use and productivity of land resources for economic
growth and poverty alleviation. In this regard, a set of laws and orders have been enacted
and a National Land Centre and an Office of the Registrar of Land Titles have to be estab-
lished to ensure the overall coordination, administration and management of land. The Of-
fice of the Registrar has already been established and a Registrar and five Deputy
Registrars have also been appointed since December 2007 through Presidential Orders.
The law establishing the National Land Centre is in Parliament for consideration and
promulgation.
The key central institutional innovation will be the National Land Commission, as pro-
vided in the land policy. Their members will be appointed by a Presidential Order. This
will broaden the constituency of responsibility for guiding the implementation of the Land
Policy not only across Government, but also by incorporating the perspective and experi-
ence of other national stakeholders within the private sector, civil society and the academic
community.
The National Land Centre and the Office of the Registrar of Land Titles will support the
technical and administrative delivery of Land Policy objectives and will provide technical
and administrative support to the established 30 District Land Offices. They will maintain
the National Land Database Management System. They will coordinate the land informa-
tion network for both national and local land registration systems. This information will
provide the basis for a national overview of land tenure regularization. They will monitor
land registration activities throughout the Country, evaluate information on trends and
safeguard against undesirable appropriations. The National Land Commission, acting as a
Board, will receive regular updates on the status of the National Land Register and deter-
mine appropriate actions if necessary.
The National Land Centre will ensure the national co-ordination of spatial planning infor-
mation. The Centre will be responsible for the identification and collection of spatial in-
formation from all sectors programs. These will concern programs and projects for land
and natural resource development and management, and in particular those that involve
irreversible changes in land use. Procedures will be developed to make this information
available to key actors in order to inform a process of coordinated spatial development
planning. Although not itself a planning agency, the National Land Centre will have a key
28
role of enabling nationwide land use master planning, which is a coordinated spatial devel-
opment planning at national and provincial levels. It will also facilitate land use planning at
district level and below.
The National Land Centre will re-establish and maintain the national geodetic control sys-
tem. It will provide an essential basis for accurate mapping of land parcels; will play the
role of Archiving the national map and aerial photography collection. The National Land
Centre will maintain a national reference collection and catalogue of land information.
This will include copies or electronic access to maps, digital data and air photograph flight
diagrams, negatives and digital copies, as appropriate. These will include information cur-
rently held by National University of Rwanda, the Ministry of Infrastructure, the Ministry
of Agriculture and Animal Resources, the Ministry of Lands as well as Districts and Mu-
nicipalities. The National Land Centre will be responsible for specifying and commission-
ing aerial photography, its rectification and the production of photomap and ortho-
photomaps products. The Centre will be providing a customer point for maps, land survey
plans and digital data purchase, survey, topographical and photographical (aerial and satel-
lite) services.
The National Land Centre will actively market products and services to the private and
public sectors. The National Land Centre will promote information sharing and use of
compatible data exchange formats wherever possible. This is particularly relevant as dif-
ferent sectors increasingly invest in spatial data management. Over the transition period,
the National Land Centre and the Office of the Registrar of Land Titles will be responsible
for training and providing support to decentralized activities such as district level land reg-
istration. It will also be responsible for the training and support of the decentralized par-
ticipatory planning teams.
The National Land Centre will be responsible for designing systems for the timely, secure
collection, transfer, storage and management of spatial data. Support will be provided by
the National Land Centre in demarcating, maintaining and protecting international border
control survey beacons around the country.
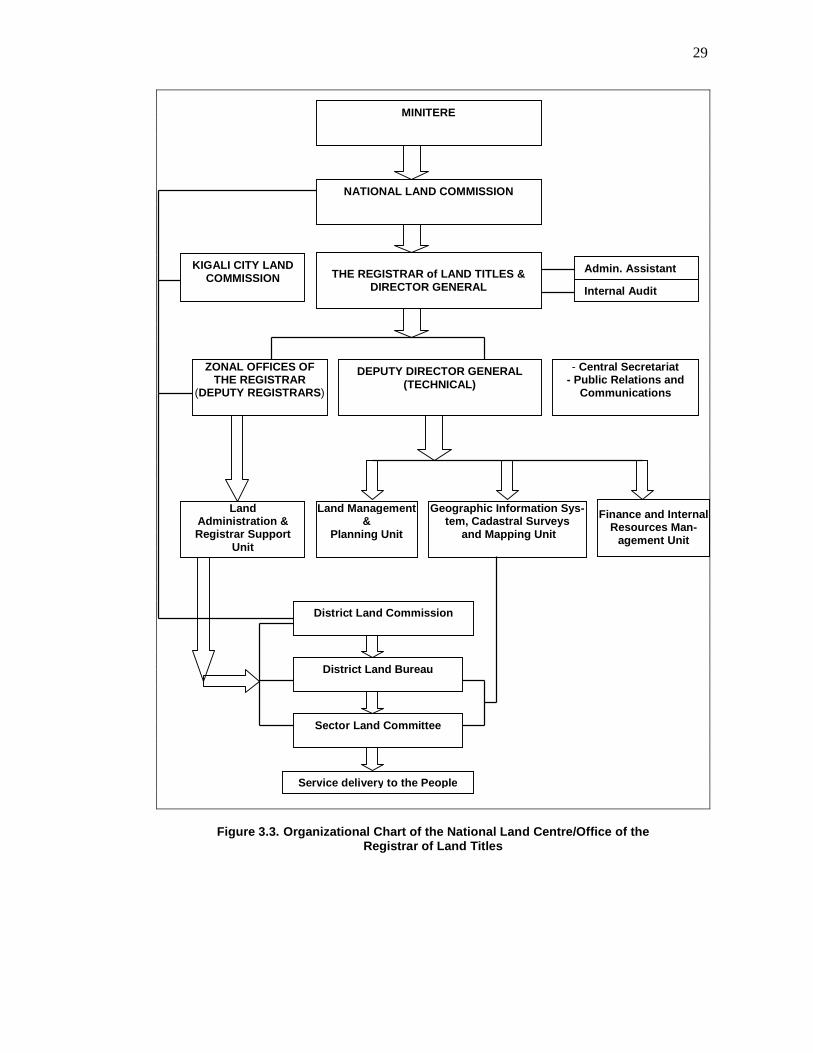
Here after, the organizational chart of the National Land Centre/Office of the Registrar of
Land Titles and the linkage with decentralized entities (Figure 3.3).
29
Figure 3.3. Organizational Chart of the National Land Centre/Of fice of the Registrar of Land Titles
Geographic Information Sys-tem, Cadastral Surveys
and Mapping Unit
Finance and Internal Resources Man-
agement Unit
Land Management &
Planning Unit
THE REGISTRAR of LAND TITLES &
DIRECTOR GENERAL
Land Administration & Registrar Support
Unit
ZONAL OFFICES OF THE REGISTRAR
(DEPUTY REGISTRARS)
- Central Secretariat - Public Relations and
Communications
MINITERE
NATIONAL LAND COMMISSION
DEPUTY DIRECTOR GENERAL (TECHNICAL)
Admin. Assistant
Internal Audit
District Land Commission
District Land Bureau
Service delivery to the People
Sector Land Committee
KIGALI CITY LAND COMMISSION
30
3.5.4 Baseline Data for the Implementation of National Land Tenure Reform Pro
gram
The concrete actions on the ground have been carried out in what has been called ‘trials
interventions for Land Tenure Regularization’ (LTR), in preparation of the Strategic Road
Map for the implementation of National Land Tenure Reform Program.
Four trial zones have been chosen, in Gasabo, Karongi, Kirehe and Musanze Districts re-
spectively. Land tenure regularization has been done using general boundary surveying
approach for land demarcation with quick bird satellite imagery and GPS as tools for
measurement and land adjudication approach prior to first registration and titling.
The following key areas of analysis have already been identified as central to assessing the
impact of the trials work (English, 2006):
• market and non-market land transfers (sales, rentals, borrowing and inheritance);
• land disputes, especially with regard to the nature and numbers;
• landholding sizes and parcel numbers;
• livelihoods and poverty reduction;
• the inclusiveness of the trials work, particularly with regard to vulnerable groups;
• the impact of and public response to the trial interventions with regard to the demarca-
tion, adjudication and registration procedures;
• the impact of and public response to local information campaigns and
• the overall impact of the implementation of the land tenure reforms on local land tenure
practices and tenure security.
Key goals to measure impact against land tenure regularization have also been identified in
line with the National Land Policy and the Organic Land Law and the broader policy ob-
jectives of the Government of Rwanda (Vision 2020, 2002; EDPRS, 2007). Those goals
are:
• An efficient and equitable land administration system;
• Improvements in tenure security;
• Reduced land disputes;
• A contribution to poverty reduction;
• An efficient and well-functioning land market;
31
• An increase in land consolidation and more efficient land use;
• A contribution to supporting the rights of vulnerable groups;
• A contribution to women’s empowerment;
• A contribution to environmental sustainability.
From those goals, key indicators have been developed for assessment of land tenure regu-
larization through first registration mainly. For the purpose of international harmonization,
Quan (2006) has proposed to organize indicators into the sub-categories of land tenure se-
curity indicators (1), access to land indicators (2), and market indicators (3). To adapt this
concept to the Rwandan context and in light of the key goals identified, the following indi-
cators model has been proposed for the post land tenure regularization impact and out-
comes assessment in Rwanda (English, 2006):
• Tenure Security Indicators with the following variables :
o improvements in tenure security,
o guaranteeing a minimum standard of secure land rights for all, especially for
vulnerable groups,
o reducing land disputes in extent, severity and number,
o extent in making a contribution to poverty reduction, extent in making a con-
tribution to women’s empowerment through improvements in land rights;
o extent in making a contribution to environmental sustainability.
• Access to Land Indicators with efficient and improved land administration system
through reducing cost of registration and time for registration of land titles and land
transfers as key variables;
• Land market indicator with the following key variables:
o guaranteeing transfer rights in land and increasing people’s freedom to transfer
serving to better support equity and efficiency in sales and rental markets,
o contributing to an increase in land consolidation and more efficient land use
through improved efficiency and functioning of the land market.
It is anticipated that baseline data will be designed and surveys conducted prior, during and
after trials exercises in each trials zones. The results will be incorporated in the Strategic
Road Map for National Land Tenure Reform Program and will be considered as instru-
ments for the impact assessment of the implementation of the National Land Tenure Re-
form Program.
32
CHAPTER 4: DESCRIPTION OF THE STUDY AREA
4.1 INTRODUCTION
This chapter aims at giving a holistic description of the study area. For the purpose of this
study, the District of Gasabo in the Republic of Rwanda has been chosen as case study
(Figure 4.1). In this chapter, the exact location of the Gasabo District and its surroundings
will be given. It then goes on to describe the administrative entities, the population distri-
bution, the bio-physical patterns, more specifically the topography, the soils characteristics,
the vegetation and the climate.
4.2 GASABO DISTRICT
4.2.1 General Overview
The Gasabo District is one of the 30 Districts of the Republic of Rwanda and one of the
three Districts of Kigali, the Capital City of Rwanda, as referred to the new administrative
reform of February 2006. With a surface area of 429.266 km2 and a population of 410,485
inhabitants, Gasabo District is the biggest District of Kigali Province and is the most
densely populated. The administrative entities of Gasabo District comprise of 15 Sectors,
73 Cells and 501 Villages (Imidugudu3).
The Gasabo District has particular characteristics that guided its choice as a case study for
the Researcher. It has characteristics of urban and rural interface. Only six of its sectors are
completely urban and they are the smallest, although they are the most densely populated.
The remaining nine and the biggest, still have rural characteristics although they are
planned to be urbanized and to become ‘The New Kigali’, as Kigali City is growing to-
wards that direction. The value of land in those parts of the District is increasing consid-
erably and the land tenure patterns are to be taken with care and consideration. The District
has also been chosen by the Land Tenure Reform Programme as a trial District for land
tenure regularization in urban areas.
3 The smallest administrative entity in the new structure of local administration in Rwanda.
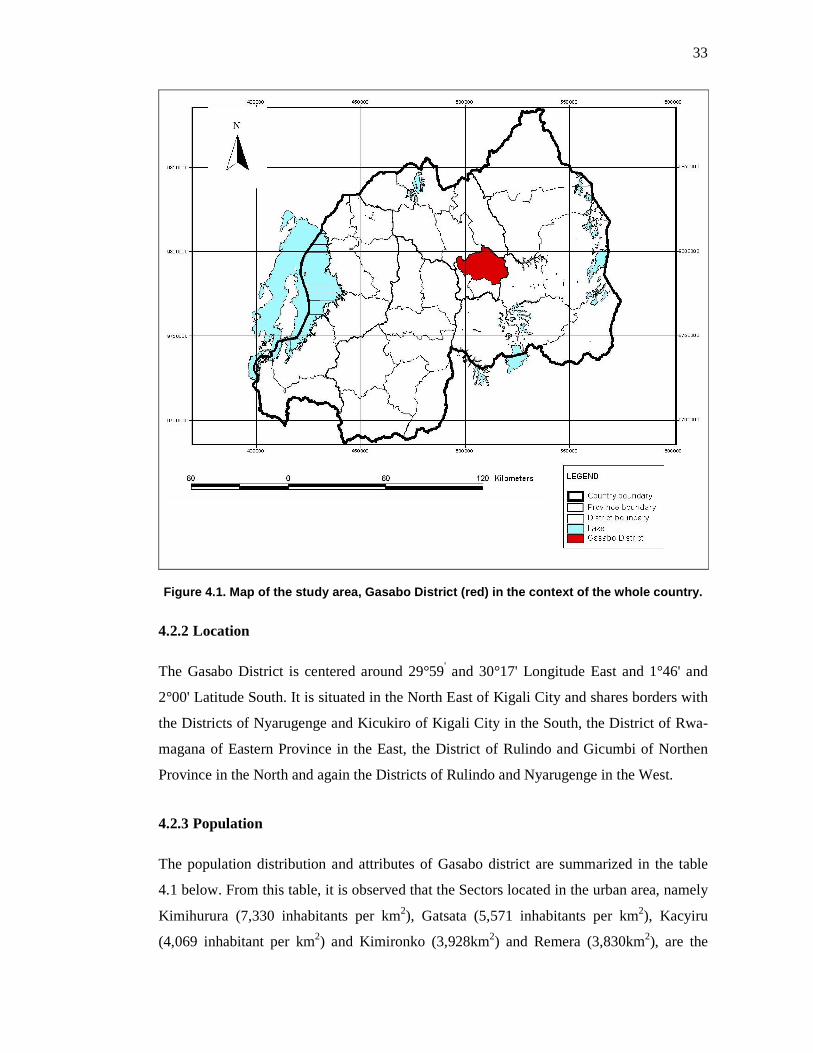
33
Figure 4.1. Map of the study area, Gasabo District (red) in the context of the whole country.
4.2.2 Location
The Gasabo District is centered around 29°59' and 30°17' Longitude East and 1°46' and
2°00' Latitude South. It is situated in the North East of Kigali City and shares borders with
the Districts of Nyarugenge and Kicukiro of Kigali City in the South, the District of Rwa-
magana of Eastern Province in the East, the District of Rulindo and Gicumbi of Northen
Province in the North and again the Districts of Rulindo and Nyarugenge in the West.
4.2.3 Population
The population distribution and attributes of Gasabo district are summarized in the table
4.1 below. From this table, it is observed that the Sectors located in the urban area, namely
Kimihurura (7,330 inhabitants per km2), Gatsata (5,571 inhabitants per km2), Kacyiru
(4,069 inhabitant per km2) and Kimironko (3,928km2) and Remera (3,830km2), are the
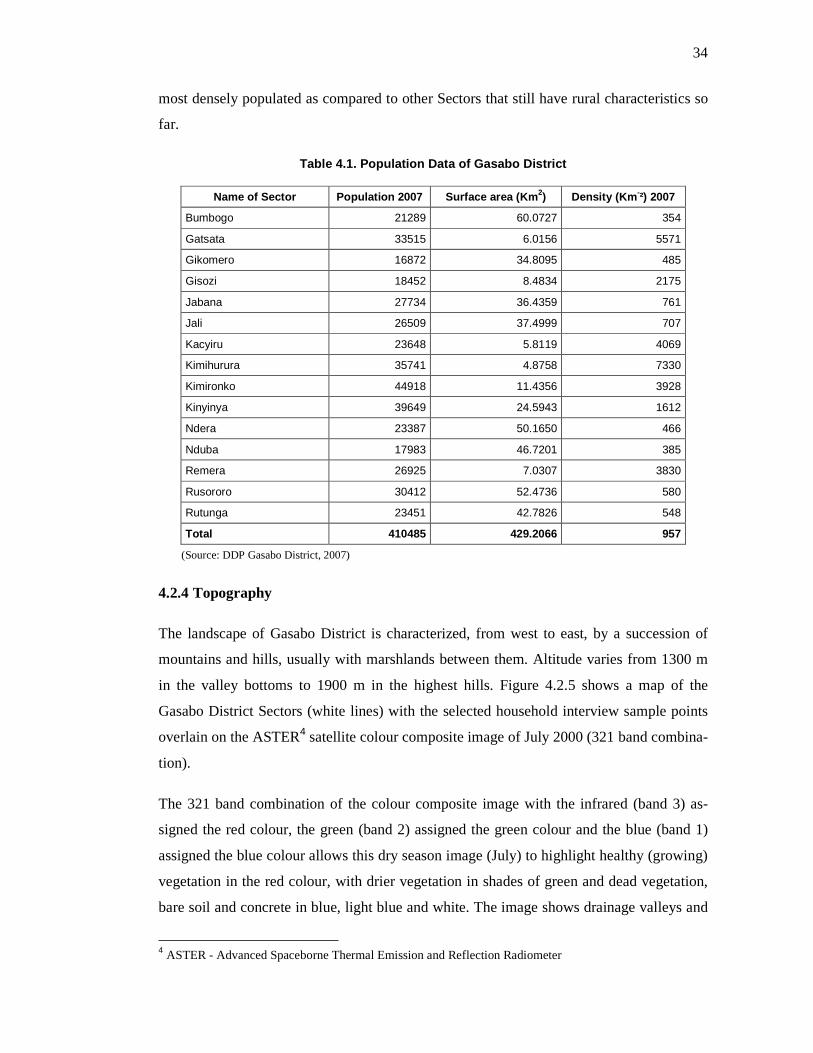
34
most densely populated as compared to other Sectors that still have rural characteristics so
far.
Table 4.1. Population Data of Gasabo District
Name of Sector Population 2007 Surface area (Km 2) Density (Km -²) 2007
Bumbogo 21289 60.0727 354
Gatsata 33515 6.0156 5571
Gikomero 16872 34.8095 485
Gisozi 18452 8.4834 2175
Jabana 27734 36.4359 761
Jali 26509 37.4999 707
Kacyiru 23648 5.8119 4069
Kimihurura 35741 4.8758 7330
Kimironko 44918 11.4356 3928
Kinyinya 39649 24.5943 1612
Ndera 23387 50.1650 466
Nduba 17983 46.7201 385
Remera 26925 7.0307 3830
Rusororo 30412 52.4736 580
Rutunga 23451 42.7826 548
Total 410485 429.2066 957
(Source: DDP Gasabo District, 2007)
4.2.4 Topography
The landscape of Gasabo District is characterized, from west to east, by a succession of
mountains and hills, usually with marshlands between them. Altitude varies from 1300 m
in the valley bottoms to 1900 m in the highest hills. Figure 4.2.5 shows a map of the
Gasabo District Sectors (white lines) with the selected household interview sample points
overlain on the ASTER4 satellite colour composite image of July 2000 (321 band combina-
tion).
The 321 band combination of the colour composite image with the infrared (band 3) as-
signed the red colour, the green (band 2) assigned the green colour and the blue (band 1)
assigned the blue colour allows this dry season image (July) to highlight healthy (growing)
vegetation in the red colour, with drier vegetation in shades of green and dead vegetation,
bare soil and concrete in blue, light blue and white. The image shows drainage valleys and
4 ASTER - Advanced Spaceborne Thermal Emission and Reflection Radiometer
35
wetlands in red as vegetation still have water and therefore healthy in the dry season.
Shades of green in the image show tree and grass vegetation under dry season stress. The
mainly bare soil and concrete Kigali city can be identified on the image as light blue to
white in the south west of the image. The image contrasting colours also allow visibility of
the rugged topography with very steep slopes and v-shaped valleys characteristic of most
of the country.
4.2.5 Soils
According to the soil classification taxonomy of the soil map of Rwanda, three dominant
units of soils characterize the landscape of Gasabo District following their pedogenesis. In
general, the District of Gasabo has good soils which are well drained and deep enough to
support various crops suitable for the zone, except tops of hills of Jali and Bumbogo Sec-
tors where 70% of soils have rocks and saprolites limitation at 50 cm, making them inap-
propriate for agriculture.
4.2.5.1 Soils derived from sedimentary and metamorphic rocks
These soils are characterized by the presence of schists, mica schists and quartzites. They
are the most represented and dominant in the area. They cover almost the whole Sectors of
Bumbogo, Gatsata, Gikomero, Jali, Ndera, Rutunga and Rusororo. They also cover a large
part of Kacyiru, Kimihurura, Kimironko and Remera Sectors.
4.2.5.2 Soils derived from magma and igneous rocks
These soils are characterized by the presence of granite and gneiss. They are found mostly
in Kinyinya and Gisozi Sectors and in a small part of Kacyiru, Kimironko and Remera
Sectors where they form a kind of node.
4.2.5.3 Soils derived from alluvial and colluvial deposits
They are characterized by the presence of alluviums and colluviums soils and are mostly
found in all valleys and marshlands of the area.
For agriculture purposes, except for alluviums and colluviums soils found in valleys and
marshlands belonging to the private state lands, the characteristics of soils of study area,
especially the sampled Sectors, have no significant difference in production potentials.
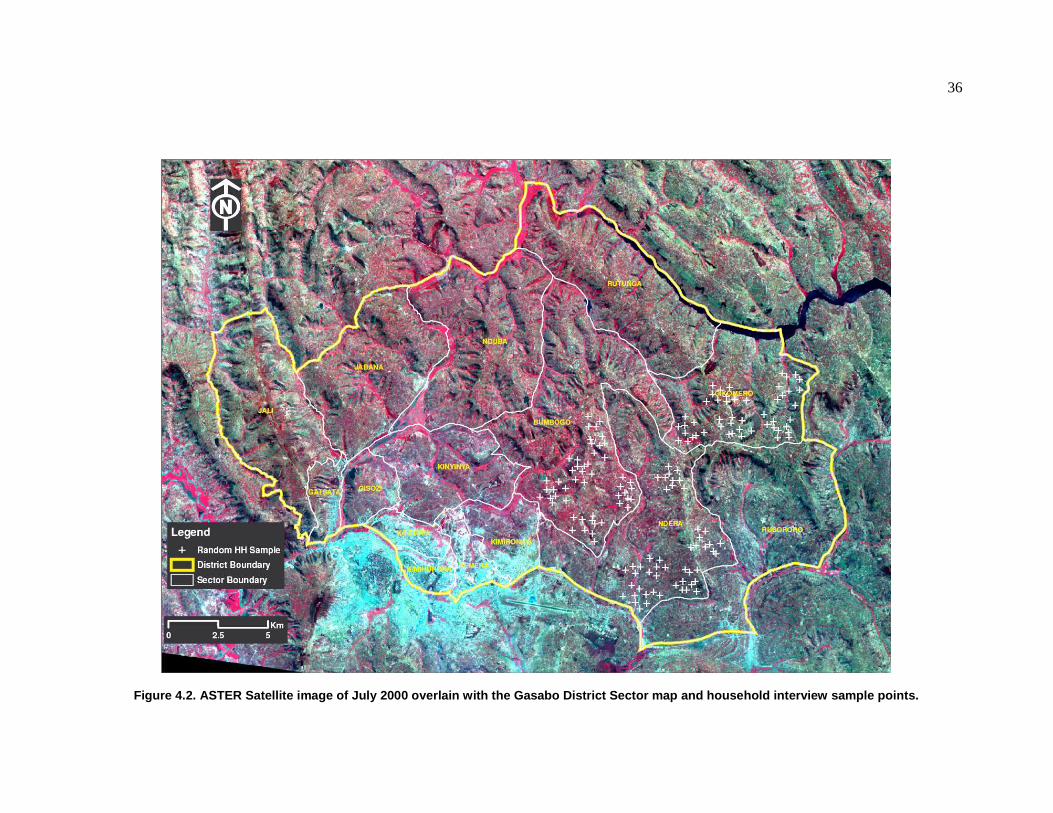
36
Figure 4.2. ASTER Satellite image of July 2000 over lain with the Gasabo District Sector map and househ old interview sample points.
37
4.2.6 Vegetation
In Gasabo District, typical natural vegetation is almost no-existent. It has progressively
been replaced by farming and grazing vegetation and tree plantation, predominantly planta-
tion of Eucalyptus species.
However, swamps and marshlands still maintain their natural vegetation encompassing
species that characterize this kind of ecosystem. There are especially papyrus (Urufunzo)
Typha latiforia (Umuberanya) and Cyperus latiforialius (urukangaga). Stagnant water or
slow-flowing waters are occupied by Phragmites (imiseke) and Nymphea maculata
(amarebe).
Some hilltops also still have natural vegetation like Hyparrhenia spp. (umukenke) and Er-
agrostis (inshinge) and various savana shrubs, the most predominant being Albizia gum-
mifera (umusebeya) and Acacia abyssinica (umunyinya).
4.2.7 Climate
The Gasabo District experiences four seasons: two rainy seasons and two dry seasons
which alternate as follow:
• A long rainy season: from mid September to mid January
• A short dry season: from mid January to mid March
• A short rainy season: from mid March to mid May
• A long dry season: from mid may to mid September
In general, these four seasons are characteristic of the climate of the whole Country. As a
consequence of climate change phenomenon, these seasons have become irregular. The
average annual temperature is about 22°C and the average annual minimum and maximum
rainfall is 900 mm and 1500 mm, respectively.
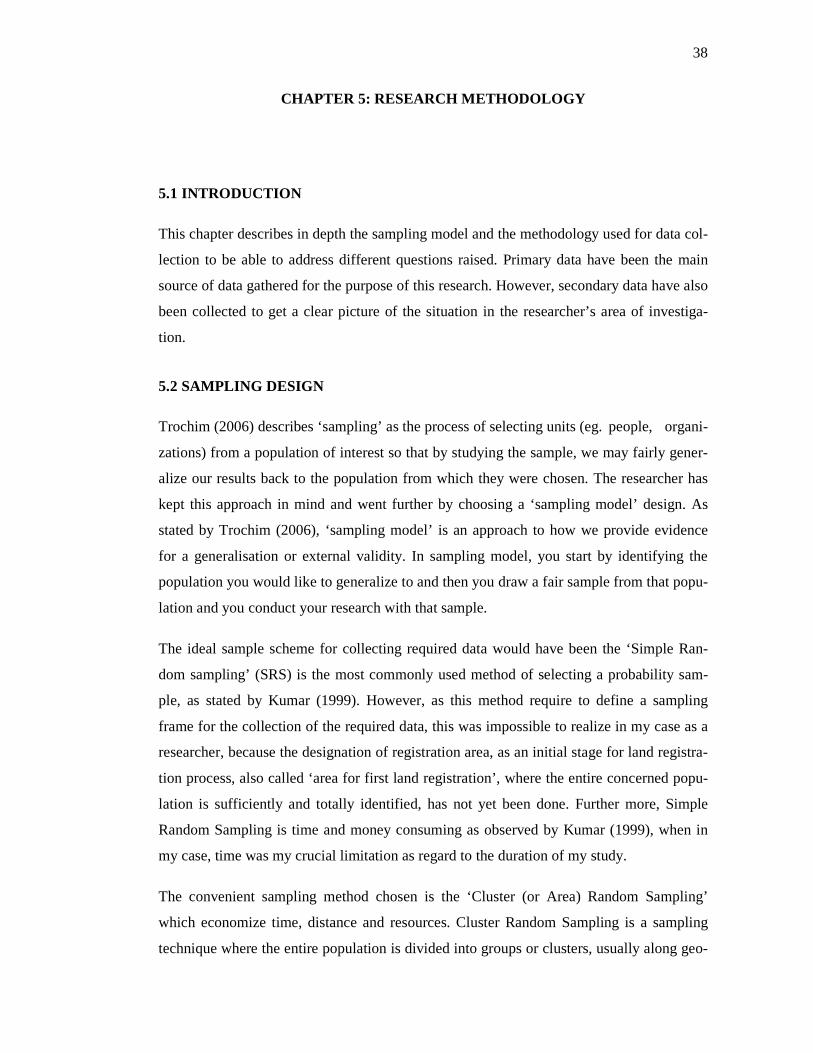
38
CHAPTER 5: RESEARCH METHODOLOGY
5.1 INTRODUCTION
This chapter describes in depth the sampling model and the methodology used for data col-
lection to be able to address different questions raised. Primary data have been the main
source of data gathered for the purpose of this research. However, secondary data have also
been collected to get a clear picture of the situation in the researcher’s area of investiga-
tion.
5.2 SAMPLING DESIGN
Trochim (2006) describes ‘sampling’ as the process of selecting units (eg. people, organi-
zations) from a population of interest so that by studying the sample, we may fairly gener-
alize our results back to the population from which they were chosen. The researcher has
kept this approach in mind and went further by choosing a ‘sampling model’ design. As
stated by Trochim (2006), ‘sampling model’ is an approach to how we provide evidence
for a generalisation or external validity. In sampling model, you start by identifying the
population you would like to generalize to and then you draw a fair sample from that popu-
lation and you conduct your research with that sample.
The ideal sample scheme for collecting required data would have been the ‘Simple Ran-
dom sampling’ (SRS) is the most commonly used method of selecting a probability sam-
ple, as stated by Kumar (1999). However, as this method require to define a sampling
frame for the collection of the required data, this was impossible to realize in my case as a
researcher, because the designation of registration area, as an initial stage for land registra-
tion process, also called ‘area for first land registration’, where the entire concerned popu-
lation is sufficiently and totally identified, has not yet been done. Further more, Simple
Random Sampling is time and money consuming as observed by Kumar (1999), when in
my case, time was my crucial limitation as regard to the duration of my study.
The convenient sampling method chosen is the ‘Cluster (or Area) Random Sampling’
which economize time, distance and resources. Cluster Random Sampling is a sampling
technique where the entire population is divided into groups or clusters, usually along geo-
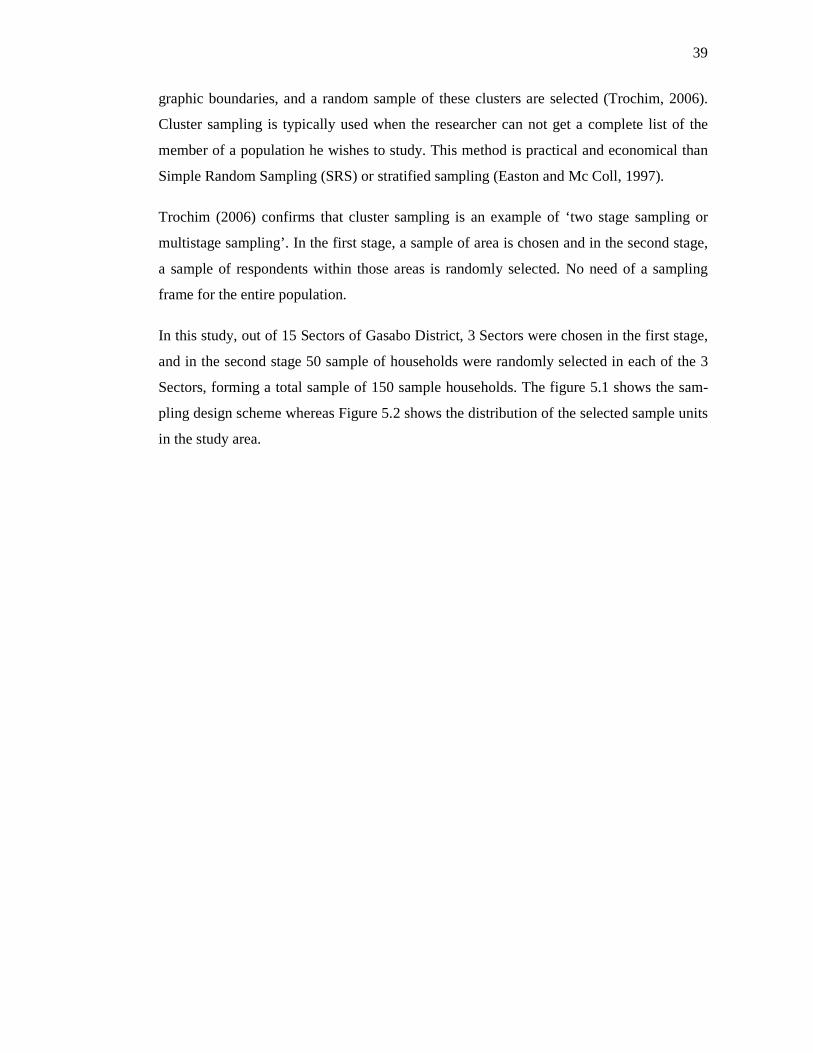
39
graphic boundaries, and a random sample of these clusters are selected (Trochim, 2006).
Cluster sampling is typically used when the researcher can not get a complete list of the
member of a population he wishes to study. This method is practical and economical than
Simple Random Sampling (SRS) or stratified sampling (Easton and Mc Coll, 1997).
Trochim (2006) confirms that cluster sampling is an example of ‘two stage sampling or
multistage sampling’. In the first stage, a sample of area is chosen and in the second stage,
a sample of respondents within those areas is randomly selected. No need of a sampling
frame for the entire population.
In this study, out of 15 Sectors of Gasabo District, 3 Sectors were chosen in the first stage,
and in the second stage 50 sample of households were randomly selected in each of the 3
Sectors, forming a total sample of 150 sample households. The figure 5.1 shows the sam-
pling design scheme whereas Figure 5.2 shows the distribution of the selected sample units
in the study area.
40
Figure 5.1. Two-Stage Sampling design for baseline data survey.
Gasabo District Map + Sectors
15 Sectors
Stage I Sampling Cluster Sampling No of Sectors
Gasabo District Map + Sectors
* 3 Sectors
Stage Ii Sampling SRS Sampling * 50 Homestead Respondents x 3
Homestead Sample Map 150 Homestead Respondents
41
Figure 5.2. Map of Gasabo District with 150 randoml y sampled household sites from three selected Secto rs.
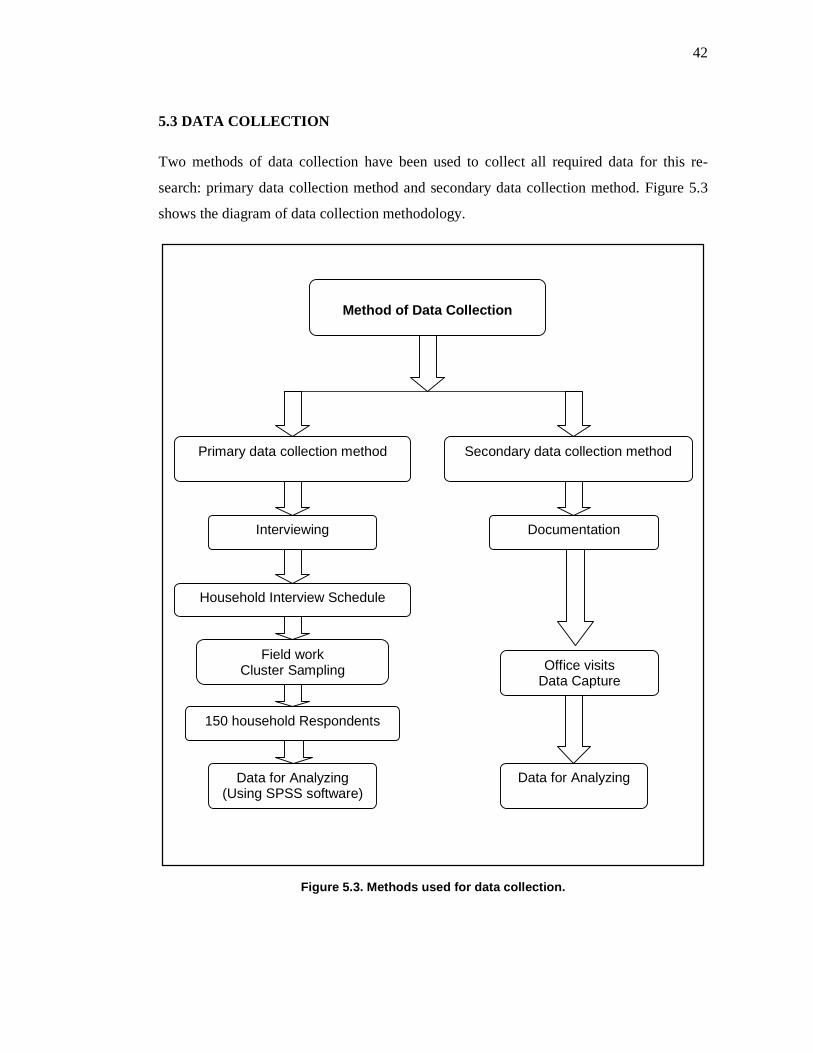
42
5.3 DATA COLLECTION
Two methods of data collection have been used to collect all required data for this re-
search: primary data collection method and secondary data collection method. Figure 5.3
shows the diagram of data collection methodology.
Figure 5.3. Methods used for data collection.
Method of Data Collection
Primary data collection method Secondary data collection method
Interviewing Documentation
Household Interview Schedule
Field work Cluster Sampling
150 household Respondents
Data for Analyzing (Using SPSS software)
Office visits Data Capture
Data for Analyzing
43
The main method used for data collection is the interviewing, which is a commonly used
method of collecting information from people, as stated by Kumar (1999). It is also a
method of data collection using primary sources. For this purpose, a set of structured inter-
view has been used. As stated by Kumar (1999), a structured interview prevails where the
investigator asks pre-determined questions as specified in the interview schedule and has
an advantage of providing uniform information which assures the comparability of data.
5.4 RESEARCH INSTRUMENTS
In order to be able to collect primary data, an interview schedule has been designed. As a
matter of fact, a structured interview schedule, using closed-ended questions, has been pre-
pared for this research.
Even if the interview method is recognized as time consuming and costly (Kumar, 1999), a
structured interview using closed-ended questions reduces considerably, in my view, time
and cost. Also, it doesn’t require any particular skills, especially for the respondents who
can answer easily even if they are illiterates.
The interview schedule encompasses two parts: the first part represents general informa-
tion that include the identification of the area, the names of local authorities, the date of
interviewing, the locations of sampled households and the names of respondents. The sec-
ond part represents series of 12 closed-ended questions related to the key indicators chosen
for the study, the aim being to convert them into measurable variables. A sample of the
structured interview schedule is shown in Appendix 1.
5.5 FIELD WORK
Primary data collection, consisting of household interviews, has been carried out in three
sampled Sectors of Gasabo District, namely Bumbogo, Gikomero and Ndera during a pe-
riod of two weeks, from 28th August 2007 to 13th September 2007. Secondary data have
been collected from the archives of Gasabo District’s Land Bureau and at the Rwandese
Bank of Development ‘BRD’, the main bank in the Country specialized I financing urban
and rural development projects.
The fieldwork work survey has been facilitated by top leaders of Gasabo District, espe-
cially the District’s Executive Secretary, who, on my request, convened an important meet-
44
ing with all members of the Council of District and Sectors, all Sector Executive Secretar-
ies, senior staff of District Land Bureau and all technicians in charge of agriculture, live-
stock, forestry and environment. I explained to them the aim of my research and its impact
on land registration implementation and my wish to be facilitated in conducting interviews
to randomly sampled household respondents, preferably the heads of households or their
spouses. When the survey started, the population was already informed and aware. The av-
erage time taken to conduct interviews was 30 minutes per respondent. The procedure was
to read each question and associated responses and to ask the respondent to respond ac-
cordingly; this allowed me to tick the response chosen by the respondent.
Field data capture has also been done by developing some GIS operations for capturing
spatial extent of household sites. This has bee done in three successive operations (Fig-
ure 5.4).
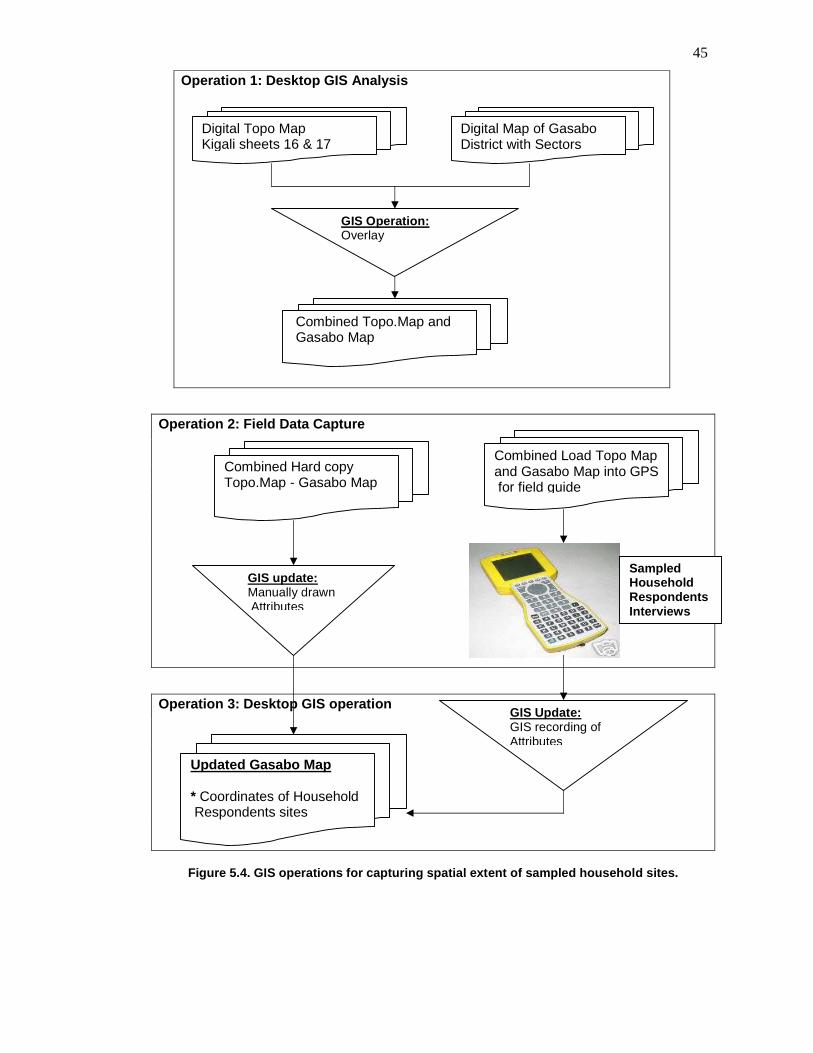
45
Operation 1: Desktop GIS Analysis
Operation 2: Field Data Capture
Operation 3: Desktop GIS operation
Figure 5.4. GIS operations for capturing spatial ex tent of sampled household sites.
Digital Topo Map Kigali sheets 16 & 17
Digital Map of Gasabo District with Sectors
GIS Operation: Overlay
Combined Topo.Map and Gasabo Map
Combined Hard copy Topo.Map - Gasabo Map
Combined Load Topo Map and Gasabo Map into GPS for field guide
Sampled Household Respondents Interviews
GIS Update: GIS recording of Attributes
Updated Gasabo Map * Coordinates of Household Respondents sites
GIS update: Manually drawn Attributes
46
5.6 DATA ANALYSIS
To analyze data gathered from interviews, interview responses were captured using SPSS
15.0 statistical software. Data code book was then designed to convert interview responses
into group variables for analysis. One hundred and two variables were then obtained allow-
ing the capture of all data from 150 samples. A variable definition codebook generated in
SPSS and exported to word processing document format is provided in Appendix 2, de-
scribing variable definition characteristics of the captured household interview data includ-
ing measurement levels and variable values (dummy variables).
5.7 OFFICE VISITS FOR SECONDARY DATA COLLECTION
Secondary data collection, consisting of gathering data on registered real estate properties,
land transactions, land disputes and investment climate, was undertaken in land registry
archives of Gasabo District Land Bureau. Data on credit facility and mortgages has been
gathered from BRD.
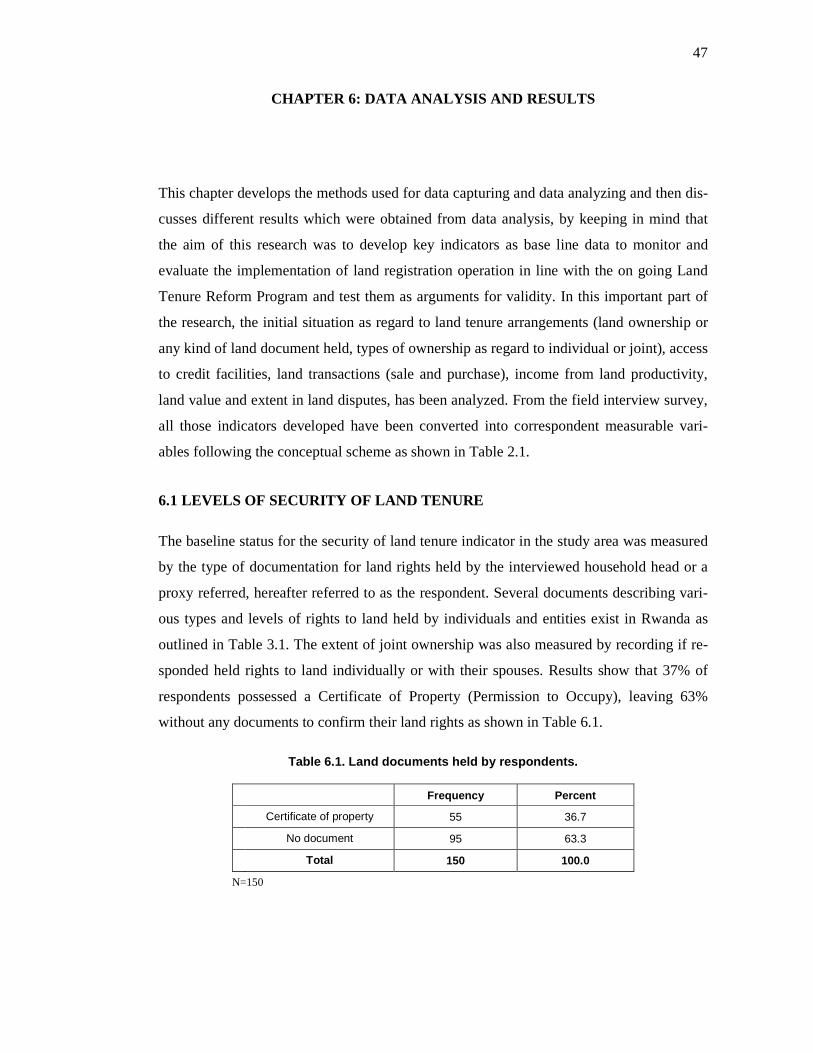
47
CHAPTER 6: DATA ANALYSIS AND RESULTS
This chapter develops the methods used for data capturing and data analyzing and then dis-
cusses different results which were obtained from data analysis, by keeping in mind that
the aim of this research was to develop key indicators as base line data to monitor and
evaluate the implementation of land registration operation in line with the on going Land
Tenure Reform Program and test them as arguments for validity. In this important part of
the research, the initial situation as regard to land tenure arrangements (land ownership or
any kind of land document held, types of ownership as regard to individual or joint), access
to credit facilities, land transactions (sale and purchase), income from land productivity,
land value and extent in land disputes, has been analyzed. From the field interview survey,
all those indicators developed have been converted into correspondent measurable vari-
ables following the conceptual scheme as shown in Table 2.1.
6.1 LEVELS OF SECURITY OF LAND TENURE
The baseline status for the security of land tenure indicator in the study area was measured
by the type of documentation for land rights held by the interviewed household head or a
proxy referred, hereafter referred to as the respondent. Several documents describing vari-
ous types and levels of rights to land held by individuals and entities exist in Rwanda as
outlined in Table 3.1. The extent of joint ownership was also measured by recording if re-
sponded held rights to land individually or with their spouses. Results show that 37% of
respondents possessed a Certificate of Property (Permission to Occupy), leaving 63%
without any documents to confirm their land rights as shown in Table 6.1.
Table 6.1. Land documents held by respondents.
Frequency Percent
Certificate of property 55 36.7
No document 95 63.3
Total 150 100.0
N=150
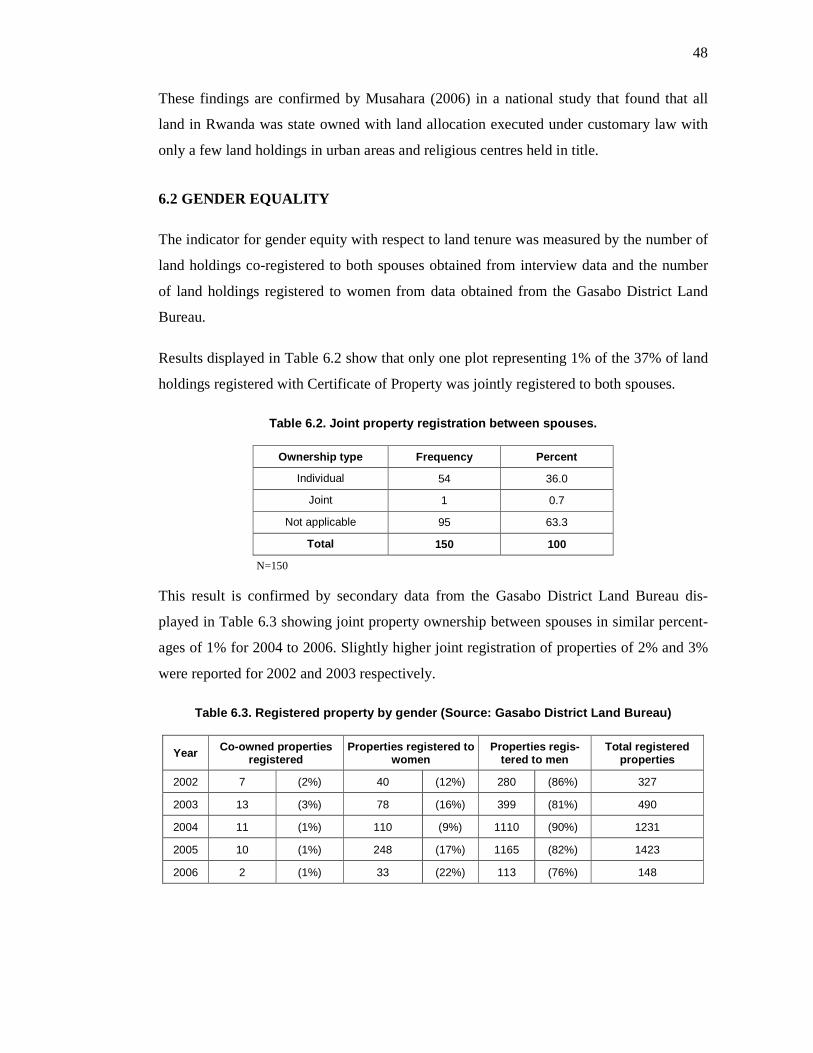
48
These findings are confirmed by Musahara (2006) in a national study that found that all
land in Rwanda was state owned with land allocation executed under customary law with
only a few land holdings in urban areas and religious centres held in title.
6.2 GENDER EQUALITY
The indicator for gender equity with respect to land tenure was measured by the number of
land holdings co-registered to both spouses obtained from interview data and the number
of land holdings registered to women from data obtained from the Gasabo District Land
Bureau.
Results displayed in Table 6.2 show that only one plot representing 1% of the 37% of land
holdings registered with Certificate of Property was jointly registered to both spouses.
Table 6.2. Joint property registration between spou ses.
Ownership type Frequency Percent
Individual 54 36.0
Joint 1 0.7
Not applicable 95 63.3
Total 150 100
N=150
This result is confirmed by secondary data from the Gasabo District Land Bureau dis-
played in Table 6.3 showing joint property ownership between spouses in similar percent-
ages of 1% for 2004 to 2006. Slightly higher joint registration of properties of 2% and 3%
were reported for 2002 and 2003 respectively.
Table 6.3. Registered property by gender (Source: G asabo District Land Bureau)
Year Co-owned properties registered
Properties registered to women
Properties regis-tered to men
Total registered properties
2002 7 (2%) 40 (12%) 280 (86%) 327
2003 13 (3%) 78 (16%) 399 (81%) 490
2004 11 (1%) 110 (9%) 1110 (90%) 1231
2005 10 (1%) 248 (17%) 1165 (82%) 1423
2006 2 (1%) 33 (22%) 113 (76%) 148
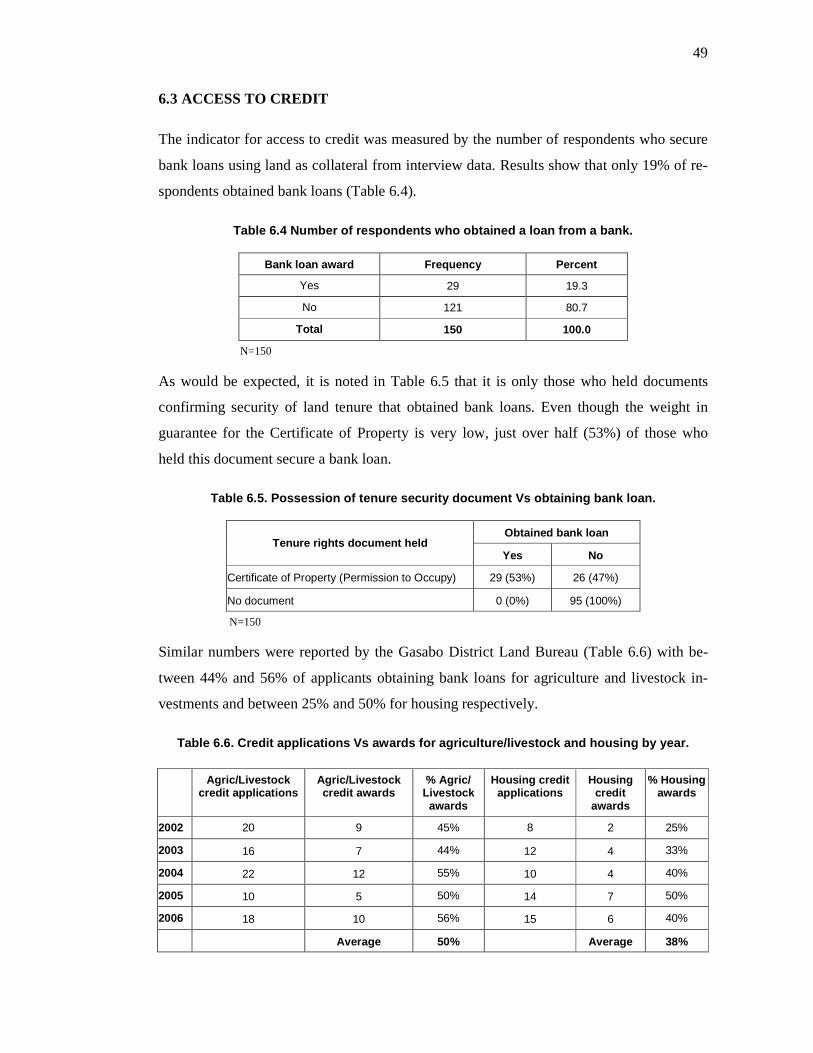
49
6.3 ACCESS TO CREDIT
The indicator for access to credit was measured by the number of respondents who secure
bank loans using land as collateral from interview data. Results show that only 19% of re-
spondents obtained bank loans (Table 6.4).
Table 6.4 Number of respondents who obtained a loan from a bank.
Bank loan award Frequency Percent
Yes 29 19.3
No 121 80.7
Total 150 100.0
N=150
As would be expected, it is noted in Table 6.5 that it is only those who held documents
confirming security of land tenure that obtained bank loans. Even though the weight in
guarantee for the Certificate of Property is very low, just over half (53%) of those who
held this document secure a bank loan.
Table 6.5. Possession of tenure security document V s obtaining bank loan.
Obtained bank loan Tenure rights document held
Yes No
Certificate of Property (Permission to Occupy) 29 (53%) 26 (47%)
No document 0 (0%) 95 (100%)
N=150
Similar numbers were reported by the Gasabo District Land Bureau (Table 6.6) with be-
tween 44% and 56% of applicants obtaining bank loans for agriculture and livestock in-
vestments and between 25% and 50% for housing respectively.
Table 6.6. Credit applications Vs awards for agricu lture/livestock and housing by year.
Agric/Livestock credit applications
Agric/Livestock credit awards
% Agric/ Livestock
awards
Housing credit applications
Housing credit
awards
% Housing awards
2002 20 9 45% 8 2 25%
2003 16 7 44% 12 4 33%
2004 22 12 55% 10 4 40%
2005 10 5 50% 14 7 50%
2006 18 10 56% 15 6 40%
Average 50% Average 38%
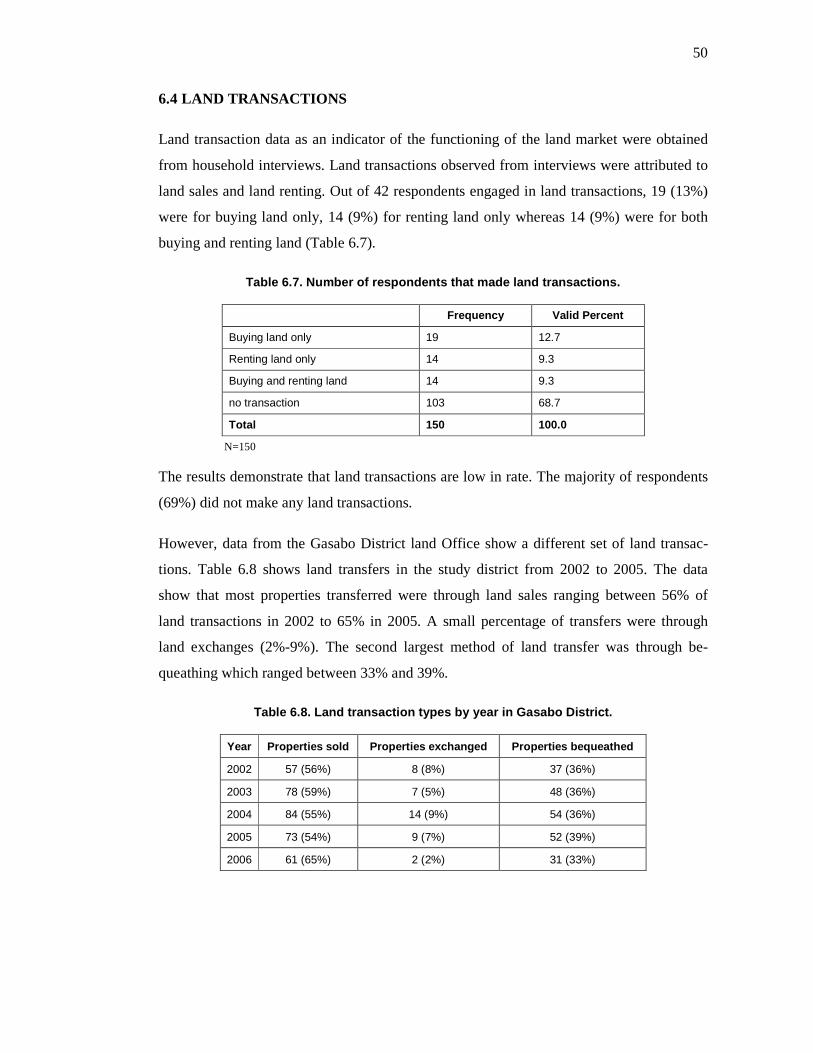
50
6.4 LAND TRANSACTIONS
Land transaction data as an indicator of the functioning of the land market were obtained
from household interviews. Land transactions observed from interviews were attributed to
land sales and land renting. Out of 42 respondents engaged in land transactions, 19 (13%)
were for buying land only, 14 (9%) for renting land only whereas 14 (9%) were for both
buying and renting land (Table 6.7).
Table 6.7. Number of respondents that made land tra nsactions.
Frequency Valid Percent
Buying land only 19 12.7
Renting land only 14 9.3
Buying and renting land 14 9.3
no transaction 103 68.7
Total 150 100.0
N=150
The results demonstrate that land transactions are low in rate. The majority of respondents
(69%) did not make any land transactions.
However, data from the Gasabo District land Office show a different set of land transac-
tions. Table 6.8 shows land transfers in the study district from 2002 to 2005. The data
show that most properties transferred were through land sales ranging between 56% of
land transactions in 2002 to 65% in 2005. A small percentage of transfers were through
land exchanges (2%-9%). The second largest method of land transfer was through be-
queathing which ranged between 33% and 39%.
Table 6.8. Land transaction types by year in Gasabo District.
Year Properties sold Properties exchanged Propertie s bequeathed
2002 57 (56%) 8 (8%) 37 (36%)
2003 78 (59%) 7 (5%) 48 (36%)
2004 84 (55%) 14 (9%) 54 (36%)
2005 73 (54%) 9 (7%) 52 (39%)
2006 61 (65%) 2 (2%) 31 (33%)
51
6.5 LAND MARKET VALUE IN RWANDAN FRANCS (RWF)
Data on land value in the study area were obtained from the household interviews in terms
of amounts paid for the land and from the records kept in the Gasabo District Land Office.
Interview data showed that 103 respondents (69%) representing the majority of the sample
did not pay for their land most of which would have been in the family for generations.
The remaining 48 (31%) of the sample indicated land purchases between RwF60, 000 and
RwF3, 620,000 with a median value at RwF2, 000,000.
Data from the Gasabo District Land Office indicating more recent purchases suggested that
the cost of farming and grazing lands is gradually increasing, even though those lands are
still unregistered (Table 6.9). The fact that land owners know that there is a new land law
that protects their rights to land as mentioned earlier in this thesis gives them confidence to
feel that their properties have a real value.
However, the costs of residential, commercial and industrial lands remain low. The reason
may be attributed to the fact that those lands are in the category of private state lands for
which the tariff is based on the Ministerial Decree of 2003 regulating the tariffs of private
state lands. This decree is in the process to be amended to comply with the new develop-
ment in land registration patterns.
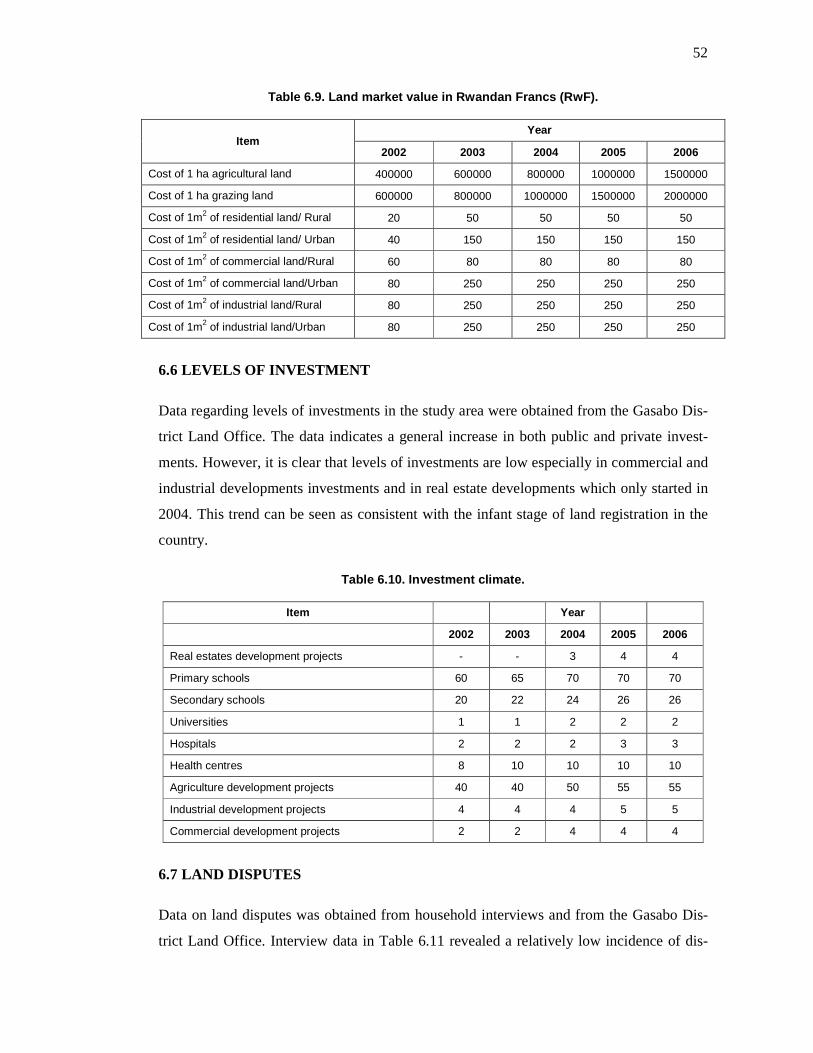
52
Table 6.9. Land market value in Rwandan Francs (RwF ).
Year Item
2002 2003 2004 2005 2006
Cost of 1 ha agricultural land 400000 600000 800000 1000000 1500000
Cost of 1 ha grazing land 600000 800000 1000000 1500000 2000000
Cost of 1m2 of residential land/ Rural 20 50 50 50 50
Cost of 1m2 of residential land/ Urban 40 150 150 150 150
Cost of 1m2 of commercial land/Rural 60 80 80 80 80
Cost of 1m2 of commercial land/Urban 80 250 250 250 250
Cost of 1m2 of industrial land/Rural 80 250 250 250 250
Cost of 1m2 of industrial land/Urban 80 250 250 250 250
6.6 LEVELS OF INVESTMENT
Data regarding levels of investments in the study area were obtained from the Gasabo Dis-
trict Land Office. The data indicates a general increase in both public and private invest-
ments. However, it is clear that levels of investments are low especially in commercial and
industrial developments investments and in real estate developments which only started in
2004. This trend can be seen as consistent with the infant stage of land registration in the
country.
Table 6.10. Investment climate.
Item Year
2002 2003 2004 2005 2006
Real estates development projects - - 3 4 4
Primary schools 60 65 70 70 70
Secondary schools 20 22 24 26 26
Universities 1 1 2 2 2
Hospitals 2 2 2 3 3
Health centres 8 10 10 10 10
Agriculture development projects 40 40 50 55 55
Industrial development projects 4 4 4 5 5
Commercial development projects 2 2 4 4 4
6.7 LAND DISPUTES
Data on land disputes was obtained from household interviews and from the Gasabo Dis-
trict Land Office. Interview data in Table 6.11 revealed a relatively low incidence of dis-
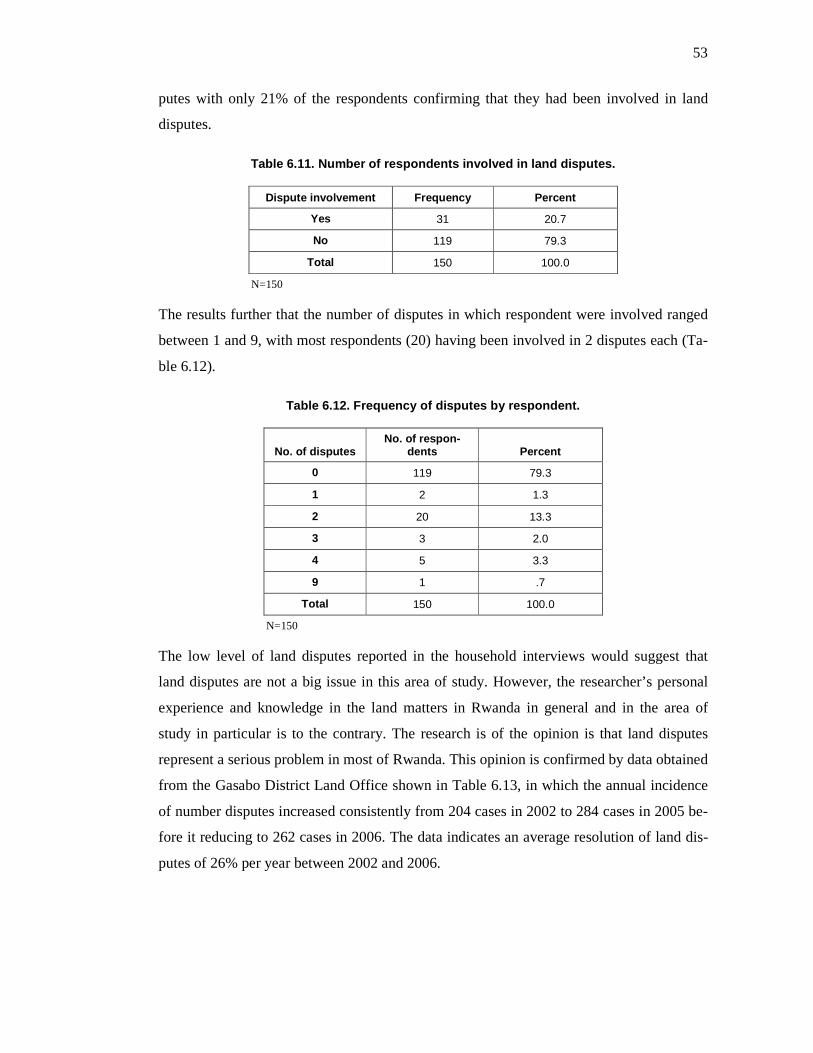
53
putes with only 21% of the respondents confirming that they had been involved in land
disputes.
Table 6.11. Number of respondents involved in land disputes.
Dispute involvement Frequency Percent
Yes 31 20.7
No 119 79.3
Total 150 100.0
N=150
The results further that the number of disputes in which respondent were involved ranged
between 1 and 9, with most respondents (20) having been involved in 2 disputes each (Ta-
ble 6.12).
Table 6.12. Frequency of disputes by respondent.
No. of disputes No. of respon-
dents Percent
0 119 79.3
1 2 1.3
2 20 13.3
3 3 2.0
4 5 3.3
9 1 .7
Total 150 100.0
N=150
The low level of land disputes reported in the household interviews would suggest that
land disputes are not a big issue in this area of study. However, the researcher’s personal
experience and knowledge in the land matters in Rwanda in general and in the area of
study in particular is to the contrary. The research is of the opinion is that land disputes
represent a serious problem in most of Rwanda. This opinion is confirmed by data obtained
from the Gasabo District Land Office shown in Table 6.13, in which the annual incidence
of number disputes increased consistently from 204 cases in 2002 to 284 cases in 2005 be-
fore it reducing to 262 cases in 2006. The data indicates an average resolution of land dis-
putes of 26% per year between 2002 and 2006.
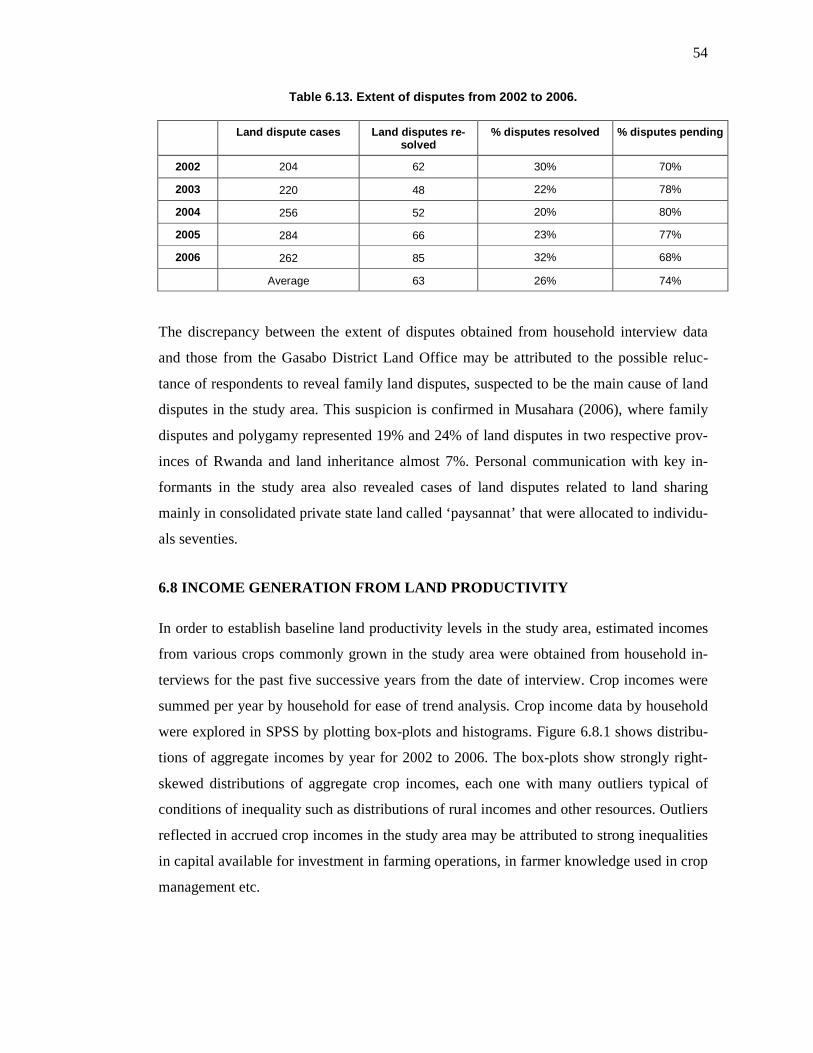
54
Table 6.13. Extent of disputes from 2002 to 2006.
The discrepancy between the extent of disputes obtained from household interview data
and those from the Gasabo District Land Office may be attributed to the possible reluc-
tance of respondents to reveal family land disputes, suspected to be the main cause of land
disputes in the study area. This suspicion is confirmed in Musahara (2006), where family
disputes and polygamy represented 19% and 24% of land disputes in two respective prov-
inces of Rwanda and land inheritance almost 7%. Personal communication with key in-
formants in the study area also revealed cases of land disputes related to land sharing
mainly in consolidated private state land called ‘paysannat’ that were allocated to individu-
als seventies.
6.8 INCOME GENERATION FROM LAND PRODUCTIVITY
In order to establish baseline land productivity levels in the study area, estimated incomes
from various crops commonly grown in the study area were obtained from household in-
terviews for the past five successive years from the date of interview. Crop incomes were
summed per year by household for ease of trend analysis. Crop income data by household
were explored in SPSS by plotting box-plots and histograms. Figure 6.8.1 shows distribu-
tions of aggregate incomes by year for 2002 to 2006. The box-plots show strongly right-
skewed distributions of aggregate crop incomes, each one with many outliers typical of
conditions of inequality such as distributions of rural incomes and other resources. Outliers
reflected in accrued crop incomes in the study area may be attributed to strong inequalities
in capital available for investment in farming operations, in farmer knowledge used in crop
management etc.
Land dispute cases Land disputes re-solved
% disputes resolved % disputes pending
2002 204 62 30% 70%
2003 220 48 22% 78%
2004 256 52 20% 80%
2005 284 66 23% 77%
2006 262 85 32% 68%
Average 63 26% 74%
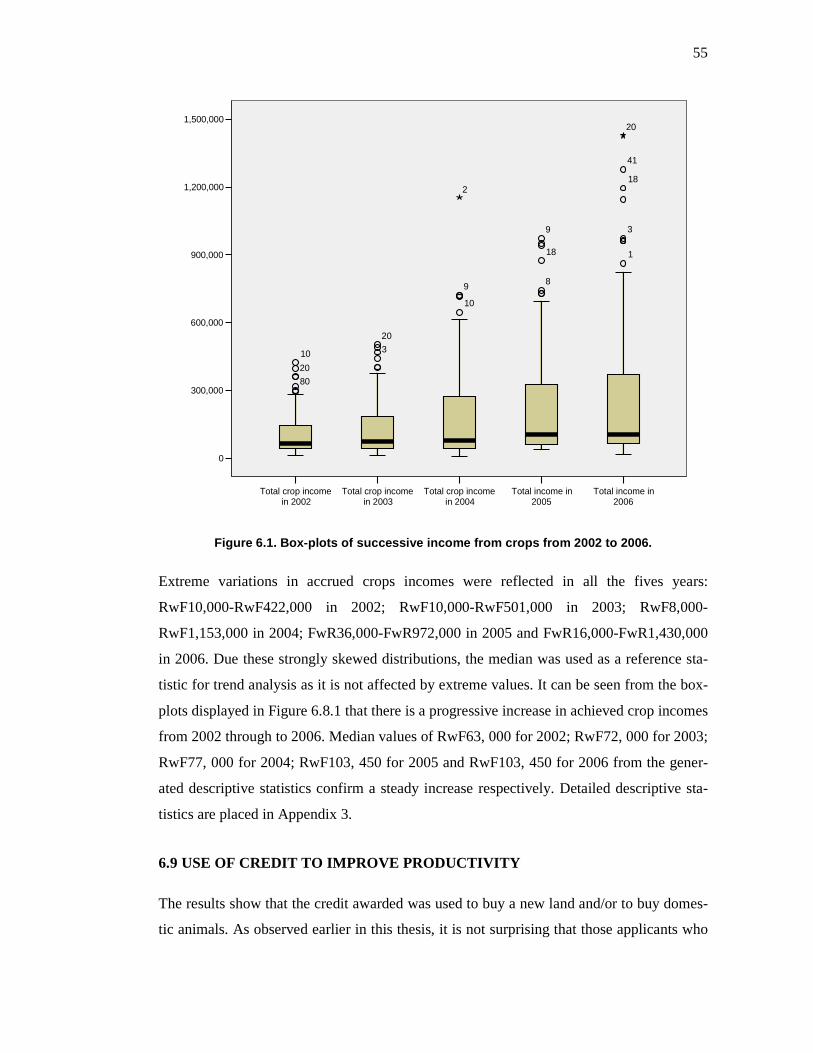
55
Total income in2006
Total income in2005
Total crop incomein 2004
Total crop incomein 2003
Total crop incomein 2002
1,500,000
1,200,000
900,000
600,000
300,000
0
41
18
3
1
9
18
89
10
20
310
20
80
20
2
Figure 6.1. Box-plots of successive income from cro ps from 2002 to 2006.
Extreme variations in accrued crops incomes were reflected in all the fives years:
RwF10,000-RwF422,000 in 2002; RwF10,000-RwF501,000 in 2003; RwF8,000-
RwF1,153,000 in 2004; FwR36,000-FwR972,000 in 2005 and FwR16,000-FwR1,430,000
in 2006. Due these strongly skewed distributions, the median was used as a reference sta-
tistic for trend analysis as it is not affected by extreme values. It can be seen from the box-
plots displayed in Figure 6.8.1 that there is a progressive increase in achieved crop incomes
from 2002 through to 2006. Median values of RwF63, 000 for 2002; RwF72, 000 for 2003;
RwF77, 000 for 2004; RwF103, 450 for 2005 and RwF103, 450 for 2006 from the gener-
ated descriptive statistics confirm a steady increase respectively. Detailed descriptive sta-
tistics are placed in Appendix 3.
6.9 USE OF CREDIT TO IMPROVE PRODUCTIVITY
The results show that the credit awarded was used to buy a new land and/or to buy domes-
tic animals. As observed earlier in this thesis, it is not surprising that those applicants who
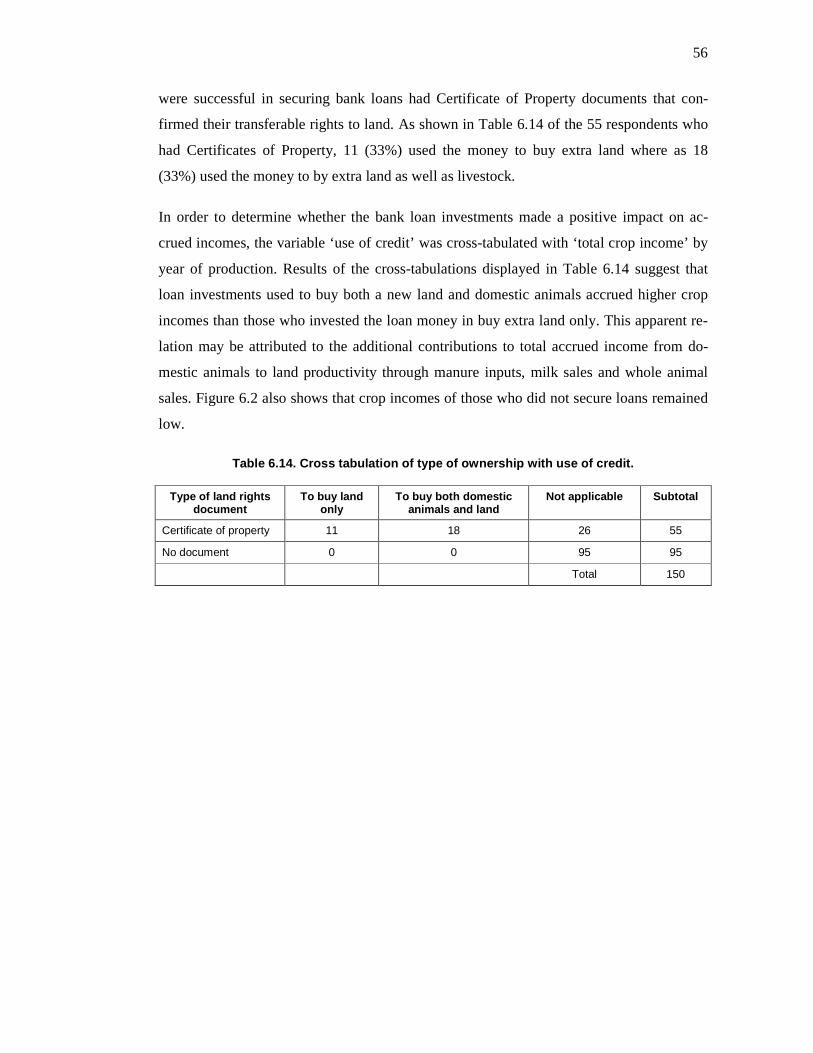
56
were successful in securing bank loans had Certificate of Property documents that con-
firmed their transferable rights to land. As shown in Table 6.14 of the 55 respondents who
had Certificates of Property, 11 (33%) used the money to buy extra land where as 18
(33%) used the money to by extra land as well as livestock.
In order to determine whether the bank loan investments made a positive impact on ac-
crued incomes, the variable ‘use of credit’ was cross-tabulated with ‘total crop income’ by
year of production. Results of the cross-tabulations displayed in Table 6.14 suggest that
loan investments used to buy both a new land and domestic animals accrued higher crop
incomes than those who invested the loan money in buy extra land only. This apparent re-
lation may be attributed to the additional contributions to total accrued income from do-
mestic animals to land productivity through manure inputs, milk sales and whole animal
sales. Figure 6.2 also shows that crop incomes of those who did not secure loans remained
low.
Table 6.14. Cross tabulation of type of ownership w ith use of credit.
Type of land rights document
To buy land only
To buy both domestic animals and land
Not applicable Subtotal
Certificate of property 11 18 26 55
No document 0 0 95 95
Total 150
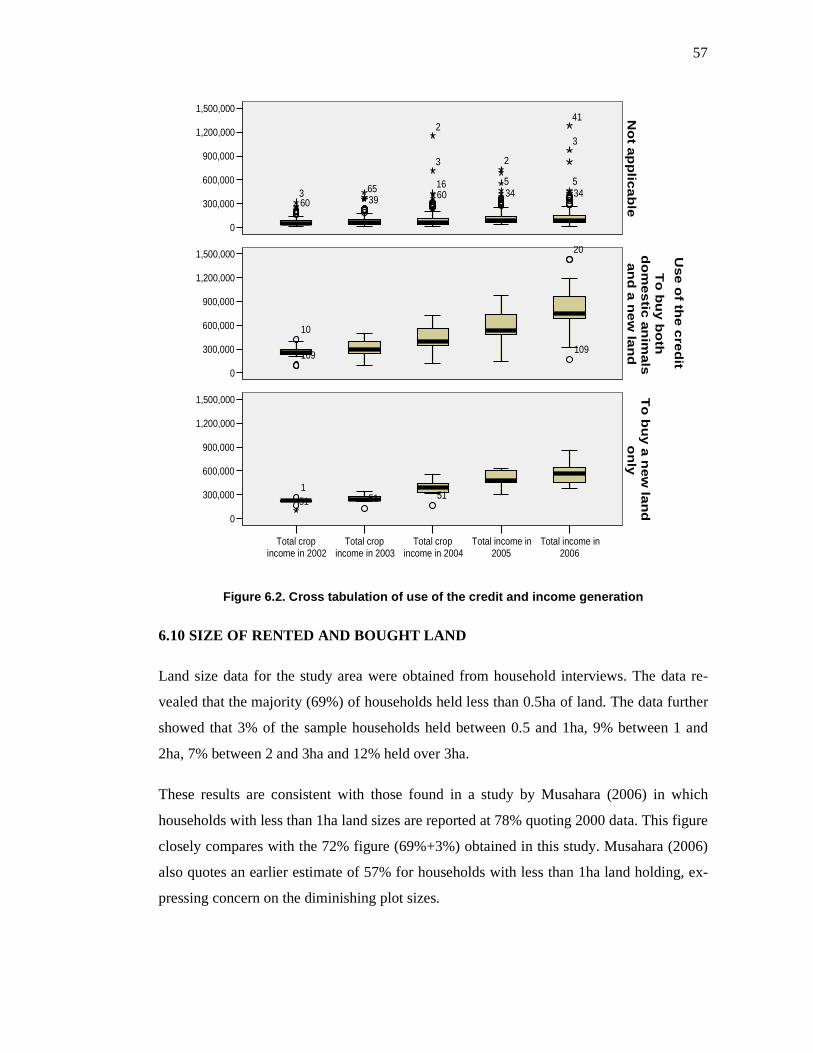
57
No
t ap
plica
ble
To b
uy b
oth
dom
estic a
nim
als
an
d a
ne
w la
nd
To
buy a
new
land
only
Use
of th
e cre
dit
Total income in2006
Total income in2005
Total cropincome in 2004
Total cropincome in 2003
Total cropincome in 2002
1,500,000
1,200,000
900,000
600,000
300,000
0
1,500,000
1,200,000
900,000
600,000
300,000
0
1,500,000
1,200,000
900,000
600,000
300,000
0
3434603960
20
109
10
109
51511
41
3
5
2
5
2
3
16653
51
Figure 6.2. Cross tabulation of use of the credit a nd income generation
6.10 SIZE OF RENTED AND BOUGHT LAND
Land size data for the study area were obtained from household interviews. The data re-
vealed that the majority (69%) of households held less than 0.5ha of land. The data further
showed that 3% of the sample households held between 0.5 and 1ha, 9% between 1 and
2ha, 7% between 2 and 3ha and 12% held over 3ha.
These results are consistent with those found in a study by Musahara (2006) in which
households with less than 1ha land sizes are reported at 78% quoting 2000 data. This figure
closely compares with the 72% figure (69%+3%) obtained in this study. Musahara (2006)
also quotes an earlier estimate of 57% for households with less than 1ha land holding, ex-
pressing concern on the diminishing plot sizes.
58
Diminishing plot sizes have a negative effect on agricultural production. Correlating ag-
gregated crop incomes with land sizes using interview data revealed strong relationships.
Using scatter plots in SPSS, relatively high cubic correlation coefficients (R sq.) revealed
that land size explained 65% of the variability in aggregated crop income for 2002, 61% in
2003, 55% in 2004, 66% in 2005 and 63% in 2006. Appendix 4 features scatter plots of
aggregated crop incomes vs. land sizes from 2002 to 2006.
59
CHAPTER 7: CONCLUSION AND RECOMMENDATIONS
7.1 CONCLUSION
Accessed literature during this study suggests that, despite tens of billions of dollars having
been invested in land property reform projects focused on land administration in general
and land registration in particular; there is no successfully completed impact evaluation
study of a land reform intervention using a rigorous study design, comprehensive meas-
urement and appropriate statistical methods. The few studies that have tried to measure the
impact of past property rights reforms have usually been carried out after the implementa-
tion, using retrospective data or, in the best of cases, using surveys tacked on half-way
through project implementation (Conning and Deb, 2006).
The purpose of this research was to develop key indicators as baseline for monitoring and
impact evaluation of land registration implementation. Having developed key indicators, it
was then important to test them for validity, feasibility and practicability for adoption as
baseline for performance and implementation of land registration for a period of five-year
based on Rwanda’s five year logical framework for the Economic Development and Pov-
erty Reduction Strategy of which land registration constitutes a key component.
Validity of the tested indicators was confirmed by statistical distributions of the variables
and correlation with existing data. Results have shown that none of sampled households
held a land title, this effect being a major hindrance to tenure security and to investment in
the land at various levels. As would be expected, both primary and secondary data showed
that only the few that held some kind of land rights confirmation document, in this case the
“Certificate of Property” were eligible to a loan from a bank. The results have shown that
the beneficiaries of bank loans have improved their income generation by being involved
in land transactions such as buying new plots of land as well as buying domestic animals,
bringing a significant improvement on land productivity. Gender inequality in terms of
land tenure security remains an issue which has to be addressed.
Land disputes have been found at a low level among the sampled households. However,
secondary data showed higher rates of reported land disputes and notably low level of land
conflict resolution. It can be deduced that land conflict resolution can be significantly in-
60
creased if sufficient operational legal and institutional instruments for dispute resolution
together with land registration are in place.
These findings corroborate numerous assertions in literature such as Dale and Mc Laughlin
(1988), to the effect that that land registration systems should provide security of owner-
ship and tenure rights, more efficient land transactions and access to credit. Literature also
suggests that providing security of tenure is often seen as a prerequisite for intensifying
agriculture production and is increasingly stressed as a precondition for better natural re-
source management and sustainable development. Increased security of tenure in produc-
tive resources leads to enhanced and sustainable agriculture.
Tenure security has a marked effect on expectations of a return on an investment of both
labour and capital, this being true in rural settings as it is in the urban settings (Roth and
Haase, 19998). With secure tenure, farmers are likely to make medium to long-term land
improvements because they will be more likely to benefit from investment. There would be
fewer disputes and they would be able to use resources that might otherwise have been
used for litigation (Roth and Haase, 1998). Since land is a primary means of both subsis-
tence and income generation in rural economies, access to land security of land rights are
of primary concern to the reduction of poverty. In rural areas of developing countries, land
is a basic livelihood asset, the principal form of natural capital from which people produce
food and earn a living (Quan,2000).
7.2 RECOMMENDATIONS
Although this study has been able to develop valid land registration baseline indicators
based on a small geographical area, operationalization can only be possible if baseline data
could be collected nationally in order to consider factors of regional variation. Further-
more, due to academic programme time limitations, indicators tested were not exhaustive.
Extending the baseline indicator study countrywide could ensure the incorporation of omit-
ted indicators but which have already been identified in Rwanda’s National Land Tenure
Reform Programme and the Economic Development and Poverty Reduction Strategy.
These are among others would contribute to livelihood improvement and poverty reduc-
tion, to an increase in land consolidation and to more efficient land use and environmental
sustainability. It is imperative to continue the exercise at the inception stage, during land
61
registration operations and at the end of the targeted horizon in accordance with the five-
year log frame of the Economic Development and Poverty Reduction Strategy.
More studies are also needed, aimed at incorporating other analytical approaches in impact
evaluation such as the “Average Treatment Effect” developed by Conning and Deb (2006)
that compares the efficiency of the methods for rigorous monitoring and evaluation design.
Further research is also needed to look on appropriate time required to detect changes and
magnitude of changes as a result of land registration process. At institutional level, it may
be recommended to secure a collaborative strategy between all institutions dealing with
land matters, especially the Rwandan ministries of MINITERE, MINAGRI, MININFRA,
MINICOM, RITA, NISR and NUR-CGIS in setting up broader baseline indicators at na-
tional level.
A linkage with different experts and International Organizations such as the World Bank
and IFAD that have already developed similar indicators is of paramount importance for
comparison, harmonization, standardization and adoption in ad hoc context.
Overall, the study results confirm the attainability of the study’s main objective of estab-
lishing key baseline indicators for monitoring and evaluating the implementation of the
land registration process in Rwanda. Accomplishment of the above recommended extra
studies will go a long way in ensuring that land registration contributes to the reduction of
poverty through increased willingness and facilitation in investments on land, the promo-
tion of gender equity and land disputes management.
62
REFERENCES
Adamchak, S., Bond, K., MacLaren, L., Magnami, R., Nelson, K. and Seltzer, J. (2000) A Guide to Monitoring and Evaluating Adolescent Reproductive Health Programs. Tool Series 5. FOCUS on Young Adults, Washington, DC.
Adams, M. and Turner, S. (2005) ‘Legal Dualism and Land Policy in Eastern and Southern Africa’. In: UNDP-ILC-CAPRI Workshop Proceedings (eds), Land Rights for Afri-can Development: From Knowledge to Action. http://www.undp.org/drylands. Ac-cessed on 14 February 2007.
Augustinus, C. and Deininger, K ( 2005) ‘Innovations in Land Tenure, Reform and Ad-ministration in Africa’. In: UNDP-International Land Coalition Workshop (eds), Land Rights for African Development: From Knowledge to Action. http://www.undp.org/drylands. Accessed on 14 February 2007.
Barrows, R. and Roth, M (1990) ‘Land Tenure and Investment in African Agriculture: Theory and Evidence’. Journal of Modern African Studies 28 (2): 265–297.
Brasselle, A-S., Gaspart, F. and Platteau J-P. (2001) Land Tenure Security and Investment Incentives: Puzzling Evidence From Burkina-Faso. CRED, University of Namur, Namur.
Bruce, J. and Migot-Adhola, S.E. (1994) Searching for Land Tenure Security in Africa. Kendall/Hunt Publishing Company, Iowa.
Conning, J. and Deb, P. (2006) Impact Evaluation for Land Property Rights Reforms. De-partment of Economics. City University of New York. New York.
Cousins, B., Cousins, T., Hornby, D., Kingwill, R., Royston, L, and Smit, W. (2005) ‘Will Formalizing Property Rights Reduce Poverty in South Africa’s “Second Econ-omy”?’. In: UNDP-ILC-CAPRI Workshop Proceedings (eds), Land Rights for Af-rican Development: From Knowledge to Action. http://www.undp.org/drylands. Accessed on 14 February 2007.
Dale, F.P and McLaughlin, D.J. (1999) Land Administration. New York: Oxford Univer-sity Press.
De Soto, H. (2000) The Mystery of Capital. Why Capitalism triumphs in the West and fails Everywhere Else. Black Swan, Clays Limited, London.
Deininger, K and Jin, S (2002) The Impact of Property Rights on Households’Investment, Risk Coping, and Policy Preferences: Evidence from China. World Bank Policy Research Working Paper No 2014, Washington DC.
Deininger, K. (2003) Tenure Security and Land-Related Investment: Evidence from Ethio-pia. World Bank Policy Research Working Paper No 2991, Washington DC.
Durand-Lasserve, A. and Ryston, L. (2002) ‘International Trends and Country Contexts: from regularization to tenure security’. In: Durand-Lasserve, A. and Royston, L. (eds), Holding their Ground. Earthscan Publications LTD, London.
Easton, V.J and McColl, J.H. (1997) Statistics Glossary. Steps. http://www.stats.glo.ac.uk/steps/glossaryindex.html. Accessed on 18 July 2007.
63
Enemark, S. ( 2006) ‘The Land Management Perspective. Building the Capacity’. In: Ses-sions ITC Conference (eds), Land Administration. The path towards Tenure Secu-rity, Poverty Alleviation and Sustainable Development. ITC, Enschede.
English, C. (2007) Land Tenure Reform Program in Rwanda: Monitoring and Evaluation. Indicators and Methodology. Kigali.
English, C. (2007) Land Tenure Reform Program in Rwanda: Projected Land related transactions and revenues. Kigali
English, C. and Daley, E. (2006) Land Tenure Regularisation. Fields Consultations. NLTRP, Kigali.
English, C. and Daley, E. (2006) Rwanda Land Tenure Regularisation Manual. NLTRP, Kigali.
English, C. and Daley, E. (2007) Land Tenure Reform Program in Rwanda: Trials As-sessments – Issues and Indicators. Kigali
FAO (2003) Multilingual thesaurus on Land Tenure. FAO, Rome
Feder, G. (1987) ‘Registration and Titling. From an Economist’s Perspective: A Case Study in Rural Thailand’. Survey Review 29: 226.
Feder, G., Nishio, A. and Deininger K. (1998) ‘The Benefits of Land Registration and Ti-tling: economic and Social Perspectives’. Land Use Policy 15 (1): 25–43.
Fernandes, E. (2002) ‘The Influence of de Soto’s The Mystery of Capital’. Land Lines 14 (1).
FIG Commission 7 (1995) The FIG Statement on the Cadastre. FIG Publication Series 11. The Surveyors House, Copenhagen.
FIG Commission 7 (2005) Cadastral Model Standardization in the Cadastral Domain. Proceedings. Workshop – Bamberg. FIG, Frederiksberg.
FIG Commission 7 (2005) Secure Land Tenure: New Legal Frameworks and Tools. Pro-ceedings, Expert Group Meeting – Nairobi. FIG, Frederiksberg.
FIG. Commission 7 (2004) Land Administration in Post Conflict Areas. Proceedings. Symposium – Geneva. FIG, Frederiksberg.
Fourie, C. (1999) ‘Best Practices Analysis on Access to Land and Security of tenure’. Re-search Study, United Nations Centre for Human Settlement (Habitat), UNCHS pub-lication.
GTZ, GmbH (1998) Land Tenure in Development Cooperation. Guiding Principles. Uni-versum Verlagsanstalt, Wiesbaden.
Haldrup, K. (2003) From Elitist Standards to Basic Needs – Diversified Strategies to Land Registration Serving Poverty Alleviation Objectives. 2nd FIG Regional Conference, Marrakech.
IFAD (2004) Guidelines for the Incorporation of Land Tenure Issues into IFAD-Supported Operations in Eastern and Southern Africa. IFAD Publications, Rome.
Jackson, C. (2003) ‘Gender Analysis of Land: Beyond Land Rights for Women?’ Journal of Agrarian Change 3 (4): 453–480.
Kagwanja, J. (2005) ‘Land Tenure, Land Reform, and the Management of Land and Natu-ral Resources in Africa’. In UNDP-ILC-CAPRI Workshop Proceedings (eds), Land
64
Rights for African Development: From Knowledge to Action. http://www.undp.org/drylands. Accessed on 14 February 2007.
Kumar, R. (1999) Research Methodology. A step-by-step guide for beginners. SAGE Pub-lications Ltd, London.
Larsson, G. (1991) Land Registration and Cadastral Systems. Longman Scientific and Technical, New York.
Makweya, P. (2004). ‘Impact of land tenure Reform on the local economic development of Nadal Areas. A case study of Sekhukhune District’. University of KwaZulu-Natal, unpublished report.
McAuslan, P. (2005) ‘Legal Pluralism as a Policy Option: Is it Desirable? Is it Doable?’, in UNDP-ILC-CAPRI Workshop Proceedings (eds), Land Rights for African Devel-opment: From Knowledge to Action. http://www.undp.org/drylands. Accessed on 14 February 2007.
Ministry of Finance and Economic Planning (2002) General Census 2002 in brief. Kigali.
Ministry of Finance and Economic Planning (2002) Rwanda Vision 2020. Kigali.
Ministry of Finance and Economic Planning (2007) Economic Development and Poverty Reduction Strategy. Draft document. Kigali.
Ministry of Lands, Environment, Forestry, Water and Mines (2004) National Land Policy. Kigali.
Ministry of Lands, Environment, Forestry, Water and Mines (2005) Organic Law deter-mining the use and management of land in Rwanda. Kigali.
Ministry of Lands, Environment, Forestry, Water and Mines (2007) Draft Law Establish-ing, Determining, the Functioning Powers and Organisation of the National Land Centre. Kigali.
Ministry of Lands, Environment, Forestry, Water and Mines (2007) Strategic Road Map for Land Tenure Reform Program. Kigali
Mitchell, D. (2007) ‘Monitoring and Evaluation of Land Administration Projects – Lessons from South-East Asia’. In: Experiences in Land Administration Projects. FIG Working Week, Hong Kong SAR.
Musahara, H. (2006) Improving Tenure Security for the Rural Poor. Rwanda – Country Case Study. Food and Agriculture Organization of the United Nations (FAO), Le-gal Empowerment of the Poor – LEP Working Paper #7.
Nontokozo Zwane, Y.T. (2004) ‘Land Reform and Sustainable Rural Livelihhoods: The case study of Draaikraal, Mpumalanga Province. South Africa’. University of KwaZulu-Natal, unpublished thesis.
Oput, R. (2005) ‘Piloting of Systematic Adjudication, Demarcation and Registration for Delivery of Land Administration Services in Uganda’. In: International Federation of Surveyors (eds), Proceedings. Secure Land Tenure: New Legal Frameworks and Tools. Totdrukwerk bv Apeldoorn.
Ouedraogo, H.M.G. (2005) ‘Decentralization: An Enabling Policy for Local Land Man-agement’. In: UNDP-ILC-CAPRI Workshop Proceedings (eds), Land Rights for African Development: From Knowledge to Action. http://www.undp.org/drylands. Accessed on 14 February 2007.
65
Payne, G. (1999) Making Common Ground: Public-Private Partnerships in Land for Housing. Intermediate Technology Publications, London
Payne, G. (2002) Land, Rights and Innovation. ITDG Publishing, London.
Polomar, J. (2001) Land Tenure Security as a Market Stimulator in China. http://www.law.duke.edu/journals. Accessed on 16 February 2007.
Quan, J. (2003) Better Livelihoods for Poor People: The role of Land Policy. Issues paper. Department for International Development (DFID)
Royston, L. (2004) ‘Barking Dogs and Building Bridges: the Applicability of Hernando de Soto’s Ideas in our Context’. In: The Perpetuating Challenge of Informal Settle-ments. Conference, Wits University, November 2004.
Rurangwa, E. (2004) ‘Land Administration in Post Conflict Situation. Rwanda Case’. In: International Federation of Surveyors (eds), Proceedings, Land Administration in Post Conflict Areas. Hellodruk bv Apeldoorn.
Rurangwa, E. (2005) ‘Land Administration Developments in Rwanda’. In: International Federation of Surveyors (eds), Proceedings. Secure Land Tenure: ‘New Legal Frameworks and Tools’. Totdrukwerk bv Apeldoorn.
Rural Development Institute (2004) Assessment of Land Reform in Rwanda, Kigali.
SMERU Research Team (2002) An Impact Evaluation of Systematic Land Titling under the Land Administration Project (LAP), Research Report. http://www.smeru.or.id. Accessed on 4 June 2007.
Tessa, M. (1991) ‘National, Class and Gender issues in Land Reform’. In: M. de Klerk (ed.), A Harvest of Discontent. The Land Question in South Africa. Idasa, Cape Town.
Törhönen, M-P. (2003) Sustainable Land Tenure and Land Registration in Developing Countries, Including a Historical Comparison with an Industrialized Country. Third Special Edition. Elsevier Science Ltd.
Toulmin, C. and Quan, J. (2000) Evolving Land Rights, Policy and Tenure in Africa. DFID/IIED/NRI, London.
Trochim, W.M.K. (2006) Research Methods. Knowledge Base. http://www.socialresearchmethods.net/kb/index.php. Accessed on 18 July 2007.
UN-ECA ( 2004) Land Tenure Systems and their Impact on Food Security and Sustainable Development in Africa. ECA Printshop, Addis Ababa.
UN-ECA (2003) Land Tenure Systems and Sustainable Development in Southern Africa. ECA/SA/EGM.Land. Southern Africa Office.
UN-ECE (1996) Guidelines on Real Property Units and Identifiers and their importance in supporting effective national land administration and land management. United Nations, New York and Geneva.
UN-ECE (1996) Land Administration Guidelines; With Special Reference to Countries in Transition. United Nations, New York and Geneva
UN-ECE (2004) Guidelines on Real Property Units and Identifiers and their importance in supporting effective national land administration and land management. United Nations, New York and Geneva.
66
UN-ESCAP (2005) Municipal Land Management in Asia: A Comparative Study. United Nations, New York.
UN-Habitat (2005) Handbook on Best Practices, Security of Tenure and Access to Land. Implementation of the Habitat Agenda. UN-Habitat Publication, Nairobi
Van der Molen, P and Lemmen C. (2004) ‘Land Administration in Post Conflict Areas’. In: International Federation of Surveyors (eds), Proceedings, Land Administration in Post Conflict Areas. Hellodruk bv Apeldoorn.
Wilkinson, D. (2000) The Researcher’s Toolkit. The Complete Guide to Practitioner Re-search. RoutledgeFalmer, London.
World Bank (2007) Doing Business 2007. How to reform. World Bank Publications. Washington DC
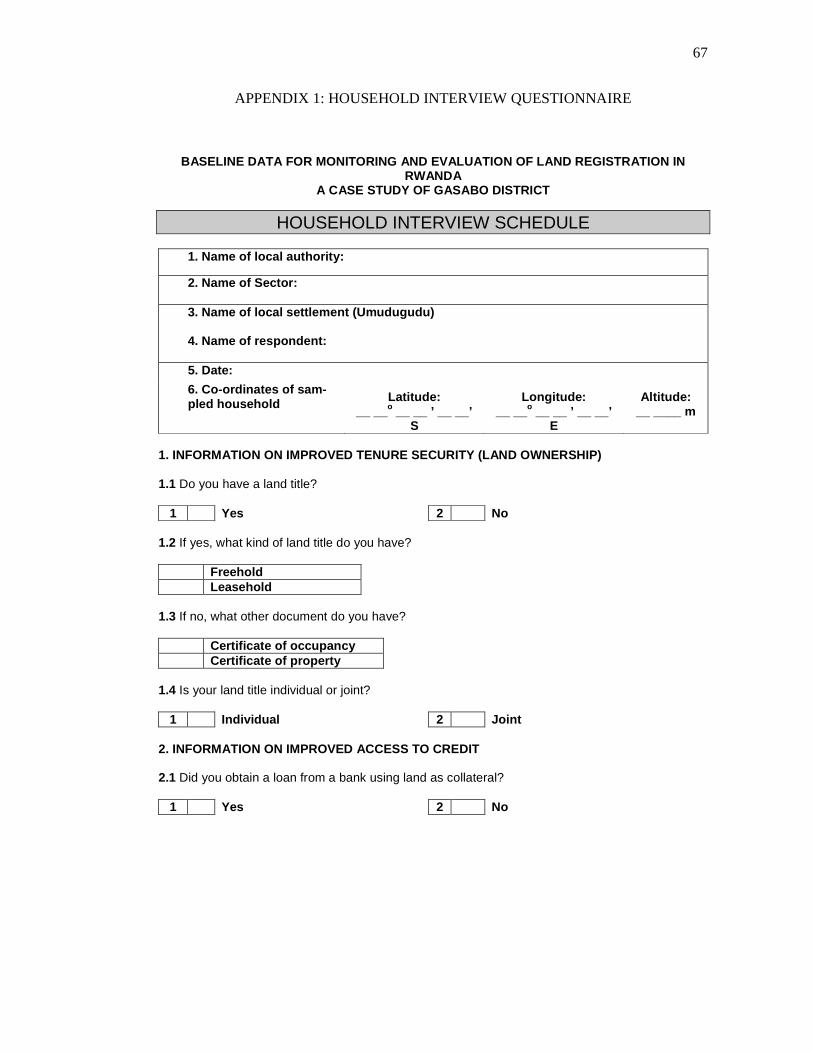
67
APPENDIX 1: HOUSEHOLD INTERVIEW QUESTIONNAIRE
BASELINE DATA FOR MONITORING AND EVALUATION OF LAND REGISTRATION IN RWANDA
A CASE STUDY OF GASABO DISTRICT
HOUSEHOLD INTERVIEW SCHEDULE
1. Name of local authority:
2. Name of Sector: 3. Name of local settlement (Umudugudu) 4. Name of respondent: 5. Date:
6. Co-ordinates of sam-pled household
Latitude: __ __o __ __ ’ __ __’
S
Longitude: __ __o __ __ ’ __ __’
E
Altitude: __ ____ m
1. INFORMATION ON IMPROVED TENURE SECURITY (LAND OW NERSHIP) 1.1 Do you have a land title?
1 Yes 2 No 1.2 If yes, what kind of land title do you have? Freehold Leasehold
1.3 If no, what other document do you have? Certificate of occupancy Certificate of property
1.4 Is your land title individual or joint?
1 Individual 2 Joint 2. INFORMATION ON IMPROVED ACCESS TO CREDIT 2.1 Did you obtain a loan from a bank using land as collateral?
1 Yes 2 No
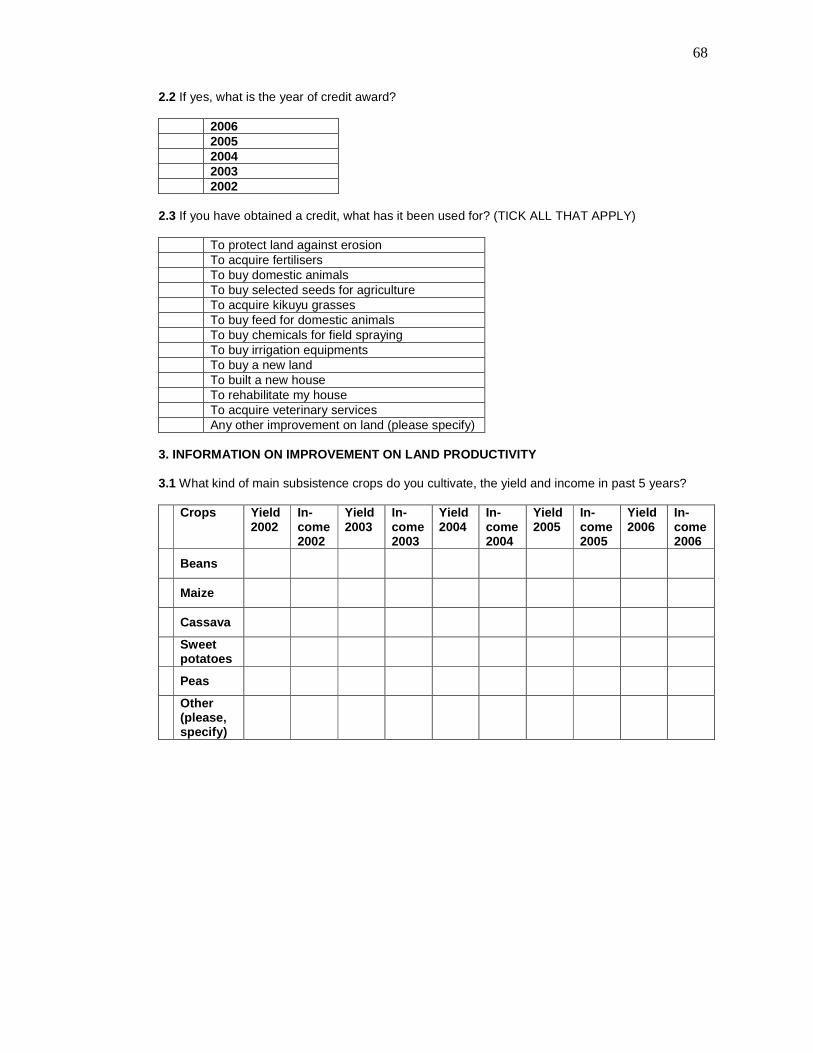
68
2.2 If yes, what is the year of credit award? 2006 2005 2004 2003 2002
2.3 If you have obtained a credit, what has it been used for? (TICK ALL THAT APPLY) To protect land against erosion To acquire fertilisers To buy domestic animals To buy selected seeds for agriculture To acquire kikuyu grasses To buy feed for domestic animals To buy chemicals for field spraying To buy irrigation equipments To buy a new land To built a new house To rehabilitate my house To acquire veterinary services Any other improvement on land (please specify)
3. INFORMATION ON IMPROVEMENT ON LAND PRODUCTIVITY 3.1 What kind of main subsistence crops do you cultivate, the yield and income in past 5 years? Crops Yield
2002 In-come 2002
Yield 2003
In-come 2003
Yield 2004
In-come 2004
Yield 2005
In-come 2005
Yield 2006
In-come 2006
Beans
Maize
Cassava
Sweet potatoes
Peas
Other (please, specify)
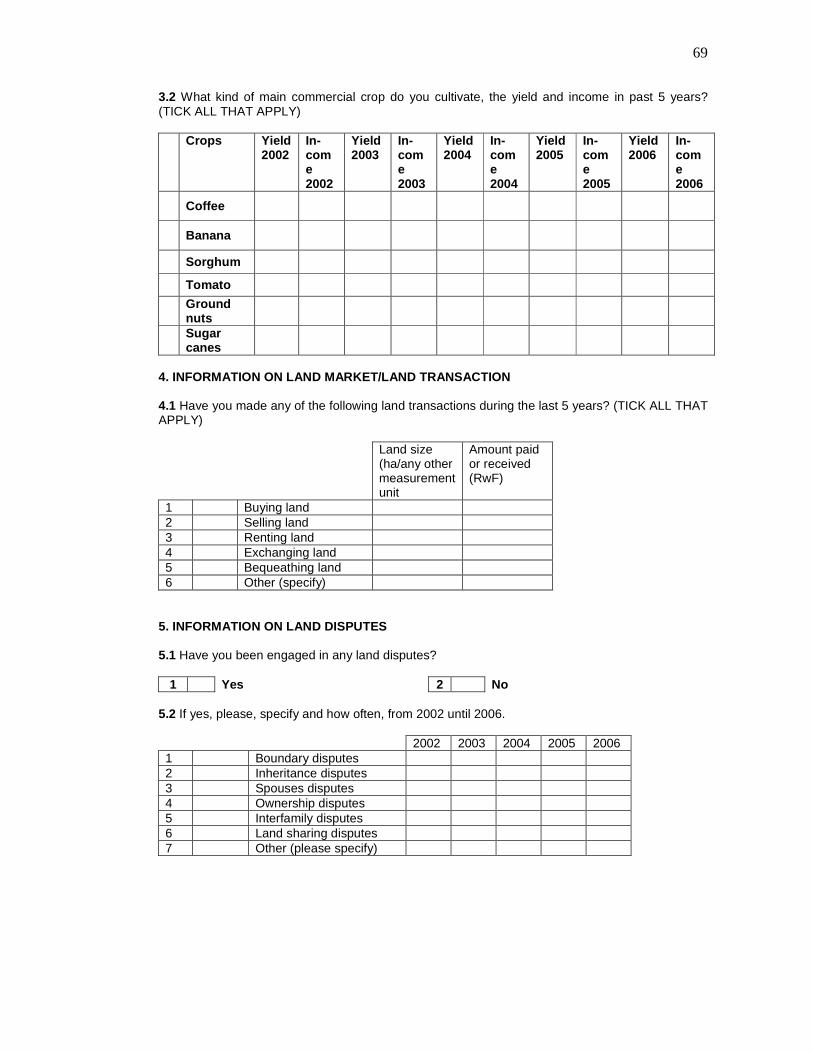
69
3.2 What kind of main commercial crop do you cultivate, the yield and income in past 5 years? (TICK ALL THAT APPLY) Crops Yield
2002 In-come 2002
Yield 2003
In-come 2003
Yield 2004
In-come 2004
Yield 2005
In-come 2005
Yield 2006
In-come 2006
Coffee
Banana
Sorghum
Tomato
Ground nuts
Sugar canes
4. INFORMATION ON LAND MARKET/LAND TRANSACTION 4.1 Have you made any of the following land transactions during the last 5 years? (TICK ALL THAT APPLY) Land size
(ha/any other measurement unit
Amount paid or received (RwF)
1 Buying land 2 Selling land 3 Renting land 4 Exchanging land 5 Bequeathing land 6 Other (specify)
5. INFORMATION ON LAND DISPUTES 5.1 Have you been engaged in any land disputes?
1 Yes 2 No 5.2 If yes, please, specify and how often, from 2002 until 2006. 2002 2003 2004 2005 2006 1 Boundary disputes 2 Inheritance disputes 3 Spouses disputes 4 Ownership disputes 5 Interfamily disputes 6 Land sharing disputes 7 Other (please specify)
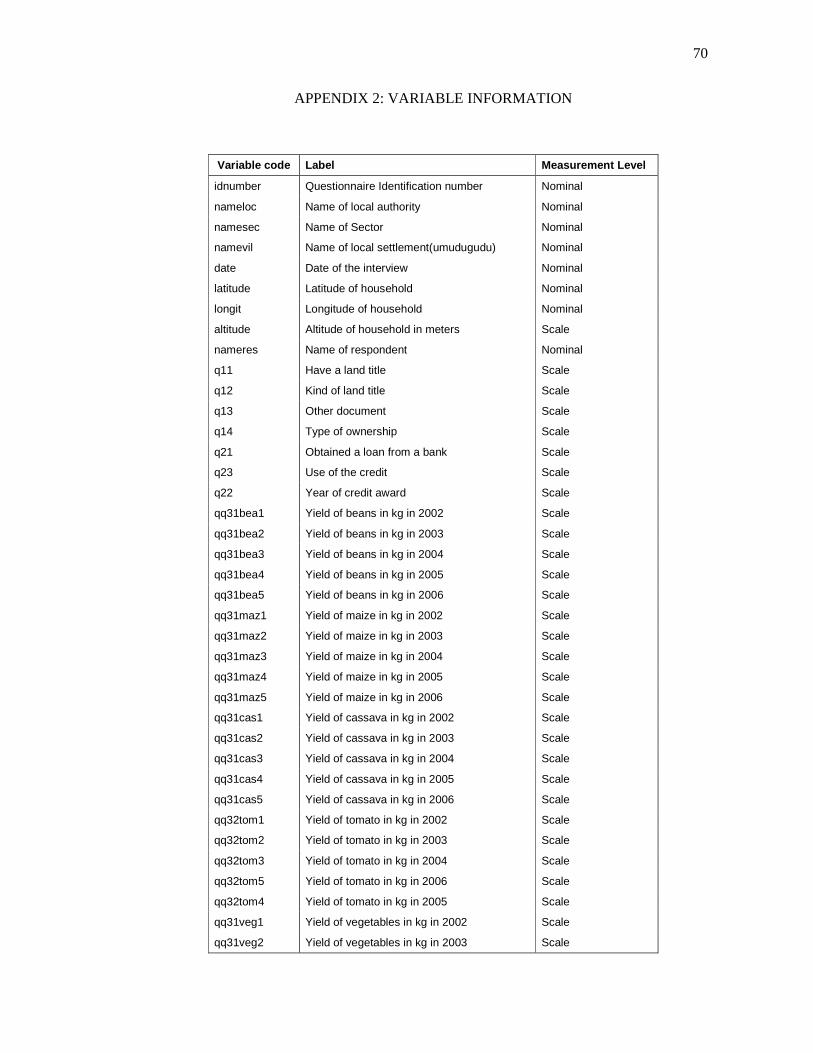
70
APPENDIX 2: VARIABLE INFORMATION
Variable code Label Measurement Level
idnumber Questionnaire Identification number Nominal
nameloc Name of local authority Nominal
namesec Name of Sector Nominal
namevil Name of local settlement(umudugudu) Nominal
date Date of the interview Nominal
latitude Latitude of household Nominal
longit Longitude of household Nominal
altitude Altitude of household in meters Scale
nameres Name of respondent Nominal
q11 Have a land title Scale
q12 Kind of land title Scale
q13 Other document Scale
q14 Type of ownership Scale
q21 Obtained a loan from a bank Scale
q23 Use of the credit Scale
q22 Year of credit award Scale
qq31bea1 Yield of beans in kg in 2002 Scale
qq31bea2 Yield of beans in kg in 2003 Scale
qq31bea3 Yield of beans in kg in 2004 Scale
qq31bea4 Yield of beans in kg in 2005 Scale
qq31bea5 Yield of beans in kg in 2006 Scale
qq31maz1 Yield of maize in kg in 2002 Scale
qq31maz2 Yield of maize in kg in 2003 Scale
qq31maz3 Yield of maize in kg in 2004 Scale
qq31maz4 Yield of maize in kg in 2005 Scale
qq31maz5 Yield of maize in kg in 2006 Scale
qq31cas1 Yield of cassava in kg in 2002 Scale
qq31cas2 Yield of cassava in kg in 2003 Scale
qq31cas3 Yield of cassava in kg in 2004 Scale
qq31cas4 Yield of cassava in kg in 2005 Scale
qq31cas5 Yield of cassava in kg in 2006 Scale
qq32tom1 Yield of tomato in kg in 2002 Scale
qq32tom2 Yield of tomato in kg in 2003 Scale
qq32tom3 Yield of tomato in kg in 2004 Scale
qq32tom5 Yield of tomato in kg in 2006 Scale
qq32tom4 Yield of tomato in kg in 2005 Scale
qq31veg1 Yield of vegetables in kg in 2002 Scale
qq31veg2 Yield of vegetables in kg in 2003 Scale
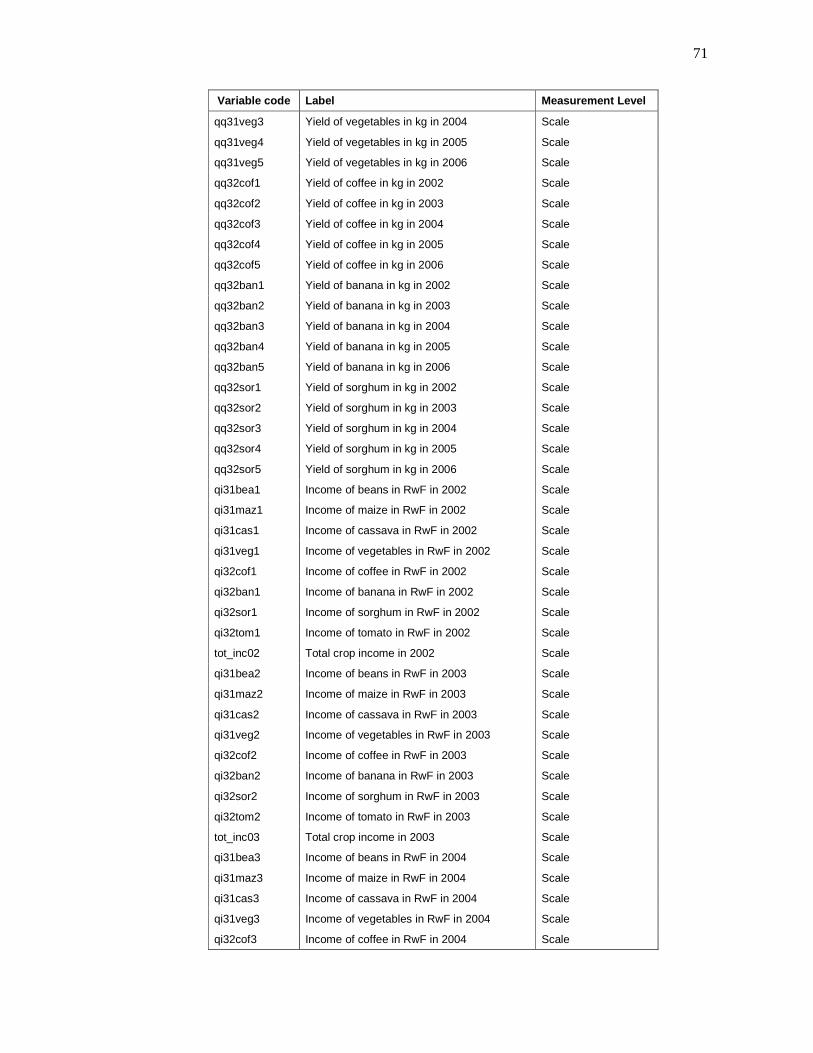
71
Variable code Label Measurement Level
qq31veg3 Yield of vegetables in kg in 2004 Scale
qq31veg4 Yield of vegetables in kg in 2005 Scale
qq31veg5 Yield of vegetables in kg in 2006 Scale
qq32cof1 Yield of coffee in kg in 2002 Scale
qq32cof2 Yield of coffee in kg in 2003 Scale
qq32cof3 Yield of coffee in kg in 2004 Scale
qq32cof4 Yield of coffee in kg in 2005 Scale
qq32cof5 Yield of coffee in kg in 2006 Scale
qq32ban1 Yield of banana in kg in 2002 Scale
qq32ban2 Yield of banana in kg in 2003 Scale
qq32ban3 Yield of banana in kg in 2004 Scale
qq32ban4 Yield of banana in kg in 2005 Scale
qq32ban5 Yield of banana in kg in 2006 Scale
qq32sor1 Yield of sorghum in kg in 2002 Scale
qq32sor2 Yield of sorghum in kg in 2003 Scale
qq32sor3 Yield of sorghum in kg in 2004 Scale
qq32sor4 Yield of sorghum in kg in 2005 Scale
qq32sor5 Yield of sorghum in kg in 2006 Scale
qi31bea1 Income of beans in RwF in 2002 Scale
qi31maz1 Income of maize in RwF in 2002 Scale
qi31cas1 Income of cassava in RwF in 2002 Scale
qi31veg1 Income of vegetables in RwF in 2002 Scale
qi32cof1 Income of coffee in RwF in 2002 Scale
qi32ban1 Income of banana in RwF in 2002 Scale
qi32sor1 Income of sorghum in RwF in 2002 Scale
qi32tom1 Income of tomato in RwF in 2002 Scale
tot_inc02 Total crop income in 2002 Scale
qi31bea2 Income of beans in RwF in 2003 Scale
qi31maz2 Income of maize in RwF in 2003 Scale
qi31cas2 Income of cassava in RwF in 2003 Scale
qi31veg2 Income of vegetables in RwF in 2003 Scale
qi32cof2 Income of coffee in RwF in 2003 Scale
qi32ban2 Income of banana in RwF in 2003 Scale
qi32sor2 Income of sorghum in RwF in 2003 Scale
qi32tom2 Income of tomato in RwF in 2003 Scale
tot_inc03 Total crop income in 2003 Scale
qi31bea3 Income of beans in RwF in 2004 Scale
qi31maz3 Income of maize in RwF in 2004 Scale
qi31cas3 Income of cassava in RwF in 2004 Scale
qi31veg3 Income of vegetables in RwF in 2004 Scale
qi32cof3 Income of coffee in RwF in 2004 Scale
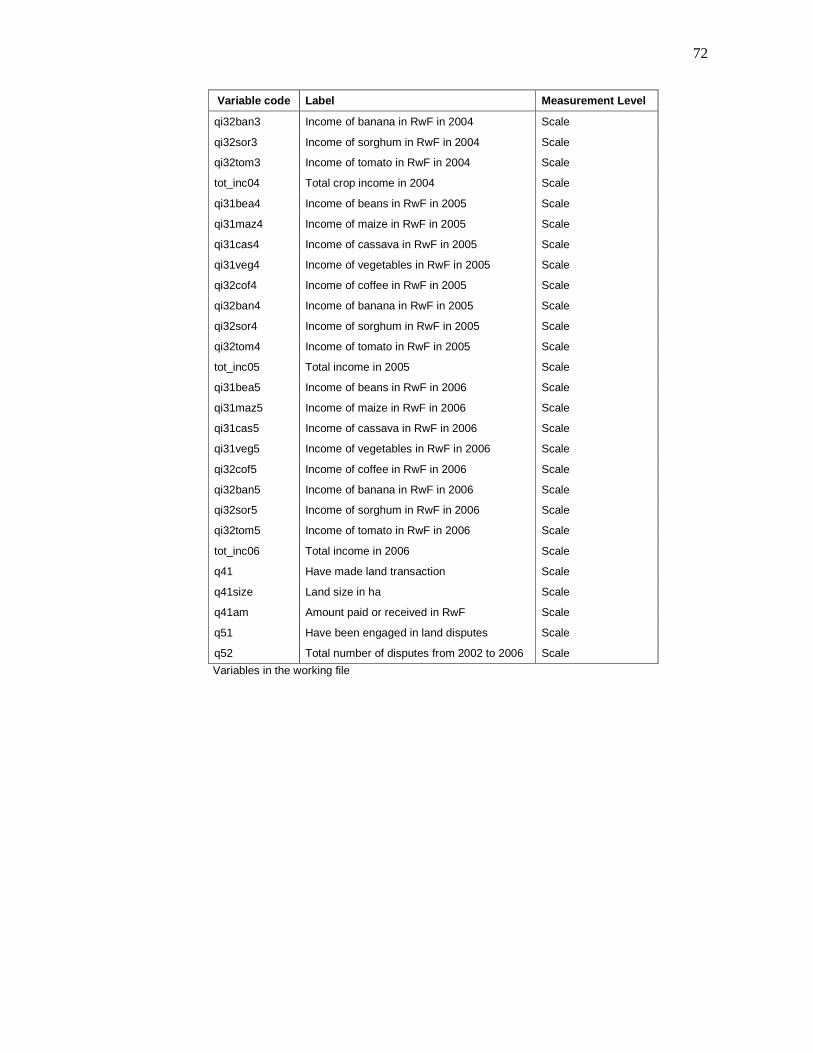
72
Variable code Label Measurement Level
qi32ban3 Income of banana in RwF in 2004 Scale
qi32sor3 Income of sorghum in RwF in 2004 Scale
qi32tom3 Income of tomato in RwF in 2004 Scale
tot_inc04 Total crop income in 2004 Scale
qi31bea4 Income of beans in RwF in 2005 Scale
qi31maz4 Income of maize in RwF in 2005 Scale
qi31cas4 Income of cassava in RwF in 2005 Scale
qi31veg4 Income of vegetables in RwF in 2005 Scale
qi32cof4 Income of coffee in RwF in 2005 Scale
qi32ban4 Income of banana in RwF in 2005 Scale
qi32sor4 Income of sorghum in RwF in 2005 Scale
qi32tom4 Income of tomato in RwF in 2005 Scale
tot_inc05 Total income in 2005 Scale
qi31bea5 Income of beans in RwF in 2006 Scale
qi31maz5 Income of maize in RwF in 2006 Scale
qi31cas5 Income of cassava in RwF in 2006 Scale
qi31veg5 Income of vegetables in RwF in 2006 Scale
qi32cof5 Income of coffee in RwF in 2006 Scale
qi32ban5 Income of banana in RwF in 2006 Scale
qi32sor5 Income of sorghum in RwF in 2006 Scale
qi32tom5 Income of tomato in RwF in 2006 Scale
tot_inc06 Total income in 2006 Scale
q41 Have made land transaction Scale
q41size Land size in ha Scale
q41am Amount paid or received in RwF Scale
q51 Have been engaged in land disputes Scale
q52 Total number of disputes from 2002 to 2006 Scale
Variables in the working file
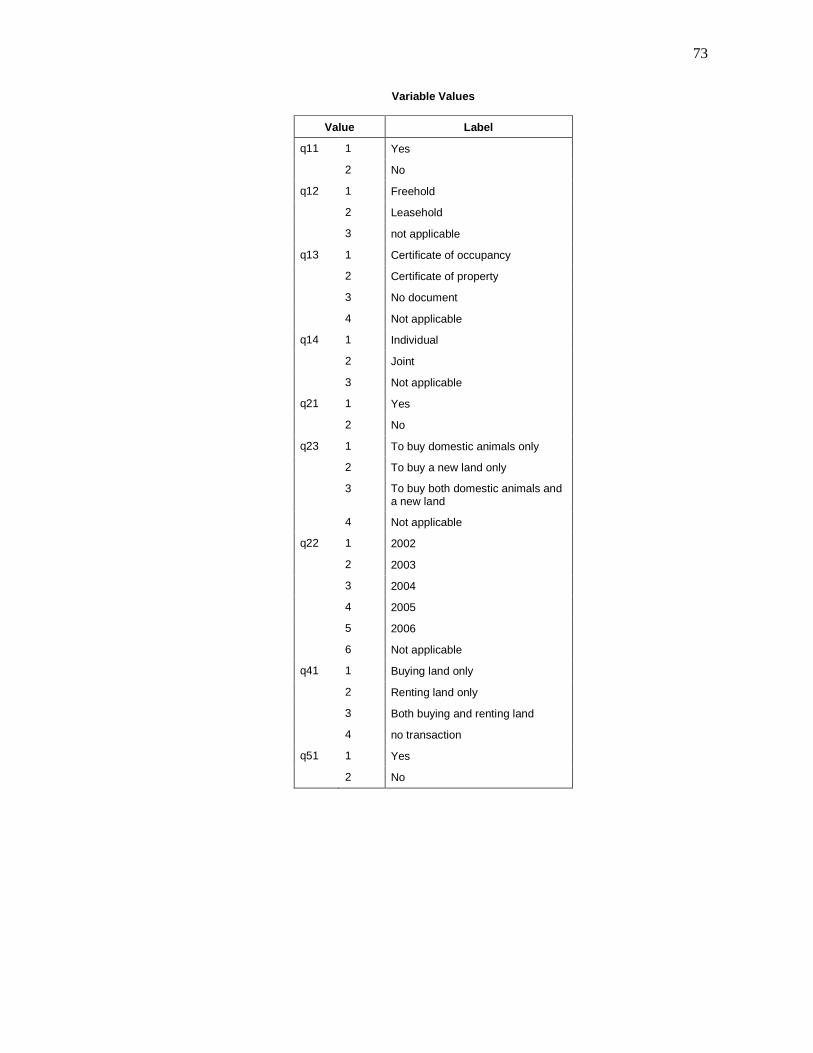
73
Variable Values
Value Label
q11 1 Yes
2 No
q12 1 Freehold
2 Leasehold
3 not applicable
q13 1 Certificate of occupancy
2 Certificate of property
3 No document
4 Not applicable
q14 1 Individual
2 Joint
3 Not applicable
q21 1 Yes
2 No
q23 1 To buy domestic animals only
2 To buy a new land only
3 To buy both domestic animals and a new land
4 Not applicable
q22 1 2002
2 2003
3 2004
4 2005
5 2006
6 Not applicable
q41 1 Buying land only
2 Renting land only
3 Both buying and renting land
4 no transaction
q51 1 Yes
2 No
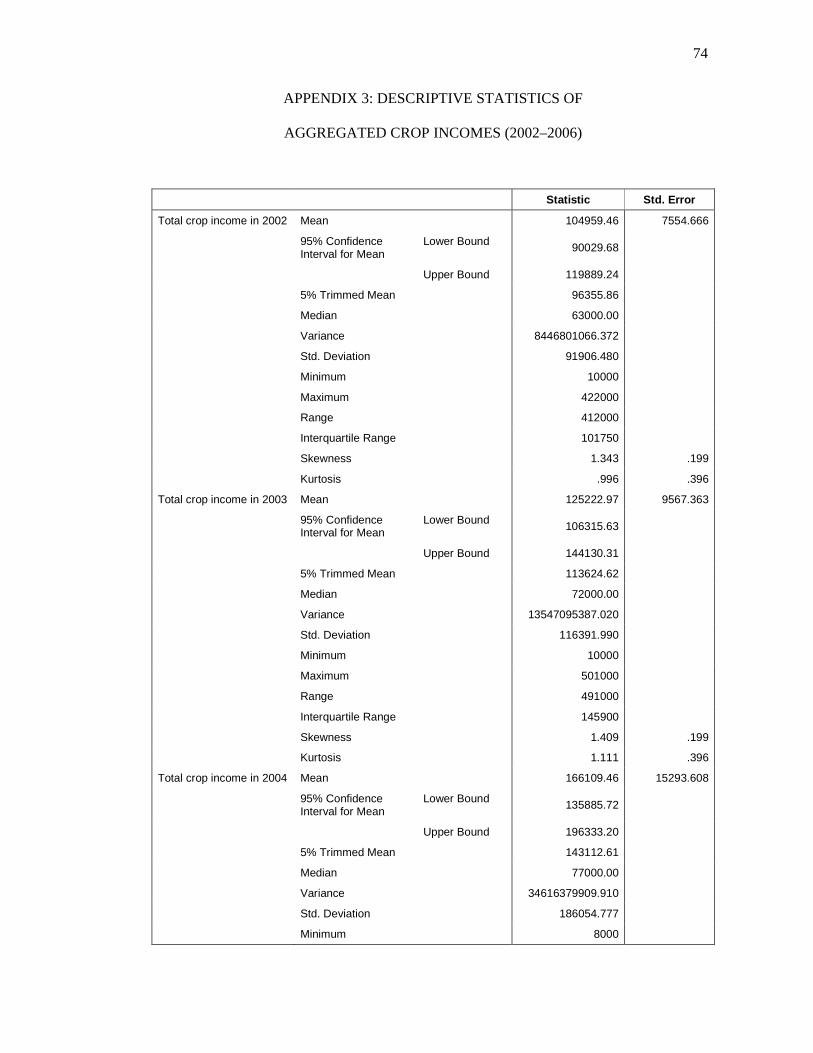
74
APPENDIX 3: DESCRIPTIVE STATISTICS OF
AGGREGATED CROP INCOMES (2002–2006)
Statistic Std. Error
Total crop income in 2002 Mean 104959.46 7554.666
95% Confidence Interval for Mean
Lower Bound 90029.68
Upper Bound 119889.24
5% Trimmed Mean 96355.86
Median 63000.00
Variance 8446801066.372
Std. Deviation 91906.480
Minimum 10000
Maximum 422000
Range 412000
Interquartile Range 101750
Skewness 1.343 .199
Kurtosis .996 .396
Total crop income in 2003 Mean 125222.97 9567.363
95% Confidence Interval for Mean
Lower Bound 106315.63
Upper Bound 144130.31
5% Trimmed Mean 113624.62
Median 72000.00
Variance 13547095387.020
Std. Deviation 116391.990
Minimum 10000
Maximum 501000
Range 491000
Interquartile Range 145900
Skewness 1.409 .199
Kurtosis 1.111 .396
Total crop income in 2004 Mean 166109.46 15293.608
95% Confidence Interval for Mean
Lower Bound 135885.72
Upper Bound 196333.20
5% Trimmed Mean 143112.61
Median 77000.00
Variance 34616379909.910
Std. Deviation 186054.777
Minimum 8000
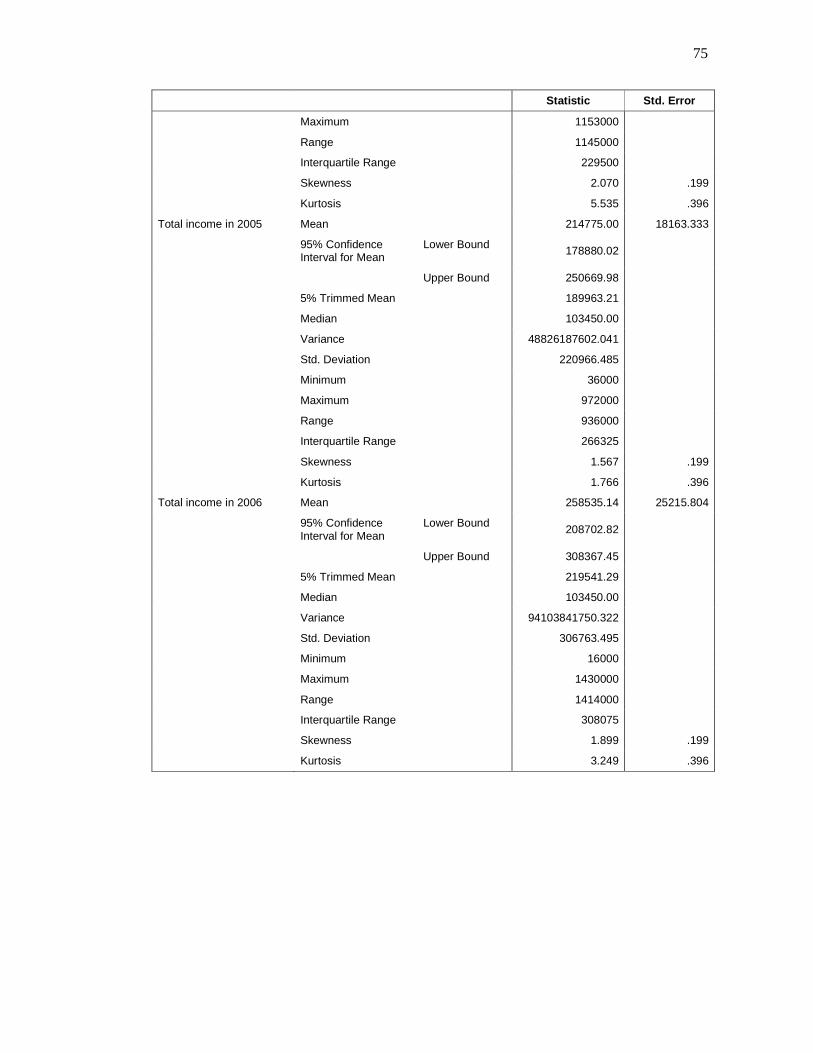
75
Statistic Std. Error
Maximum 1153000
Range 1145000
Interquartile Range 229500
Skewness 2.070 .199
Kurtosis 5.535 .396
Total income in 2005 Mean 214775.00 18163.333
95% Confidence Interval for Mean
Lower Bound 178880.02
Upper Bound 250669.98
5% Trimmed Mean 189963.21
Median 103450.00
Variance 48826187602.041
Std. Deviation 220966.485
Minimum 36000
Maximum 972000
Range 936000
Interquartile Range 266325
Skewness 1.567 .199
Kurtosis 1.766 .396
Total income in 2006 Mean 258535.14 25215.804
95% Confidence Interval for Mean
Lower Bound 208702.82
Upper Bound 308367.45
5% Trimmed Mean 219541.29
Median 103450.00
Variance 94103841750.322
Std. Deviation 306763.495
Minimum 16000
Maximum 1430000
Range 1414000
Interquartile Range 308075
Skewness 1.899 .199
Kurtosis 3.249 .396
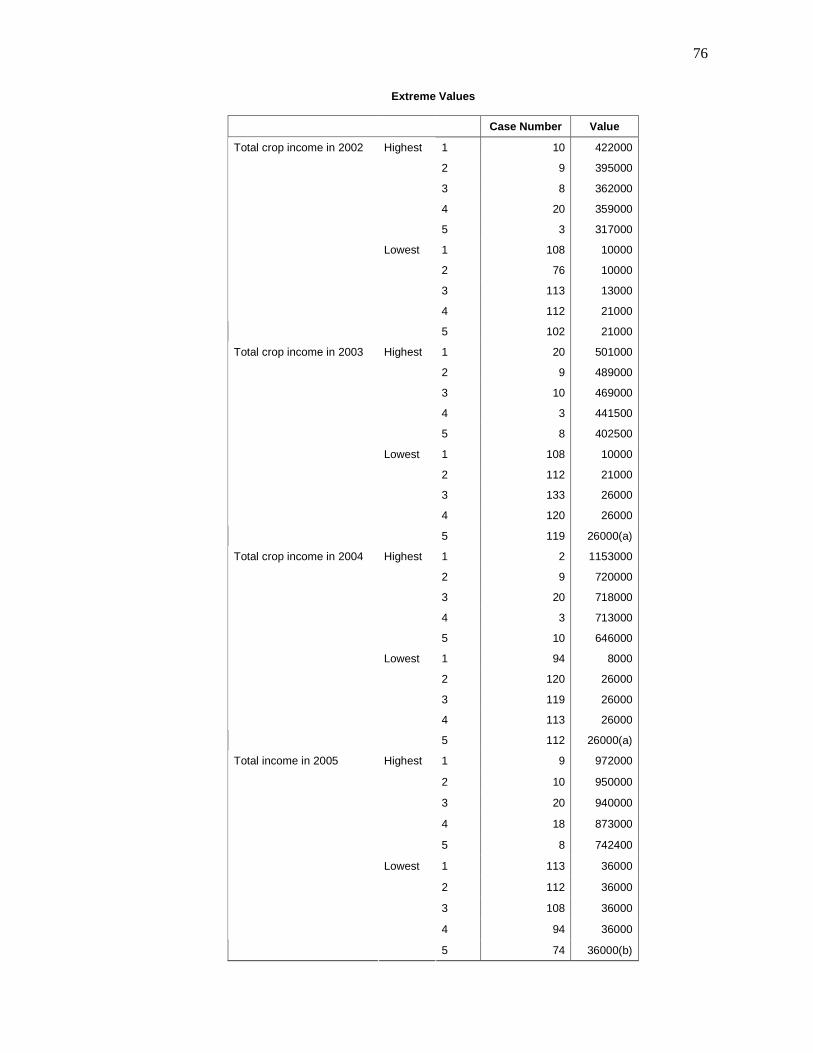
76
Extreme Values
Case Number Value
1 10 422000
2 9 395000
3 8 362000
4 20 359000
Highest
5 3 317000
1 108 10000
2 76 10000
3 113 13000
4 112 21000
Total crop income in 2002
Lowest
5 102 21000
1 20 501000
2 9 489000
3 10 469000
4 3 441500
Highest
5 8 402500
1 108 10000
2 112 21000
3 133 26000
4 120 26000
Total crop income in 2003
Lowest
5 119 26000(a)
1 2 1153000
2 9 720000
3 20 718000
4 3 713000
Highest
5 10 646000
1 94 8000
2 120 26000
3 119 26000
4 113 26000
Total crop income in 2004
Lowest
5 112 26000(a)
1 9 972000
2 10 950000
3 20 940000
4 18 873000
Highest
5 8 742400
1 113 36000
2 112 36000
3 108 36000
4 94 36000
Total income in 2005
Lowest
5 74 36000(b)
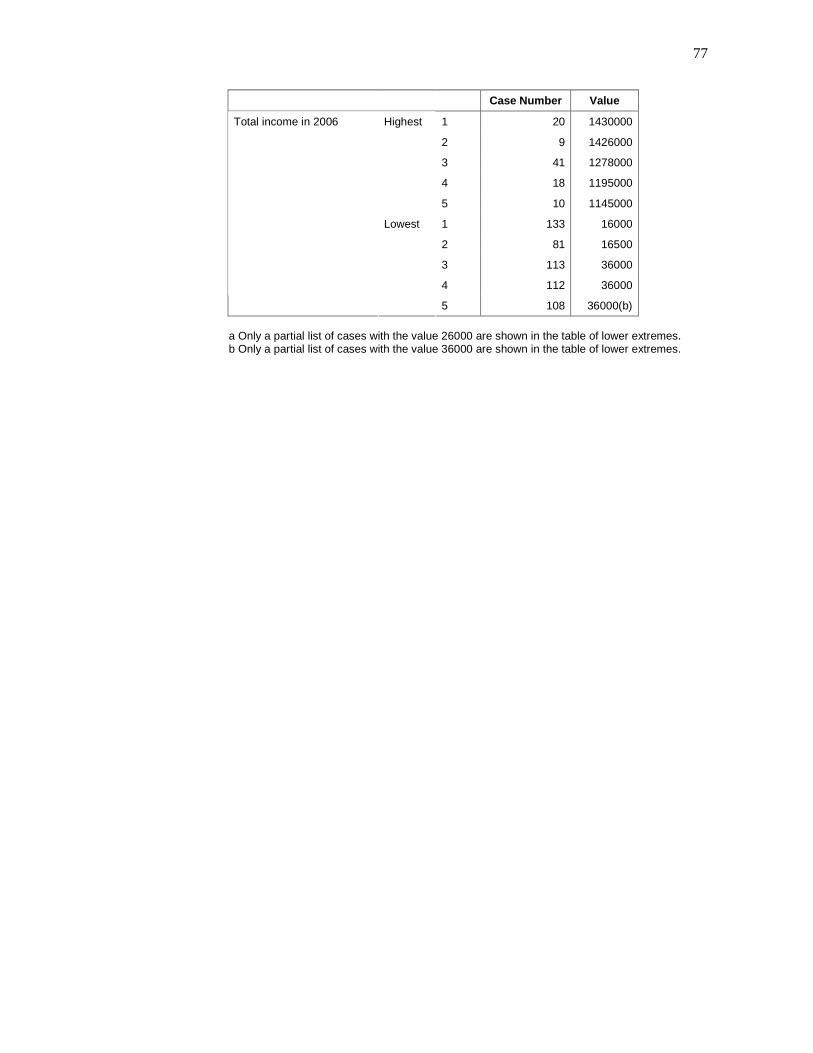
77
Case Number Value
1 20 1430000
2 9 1426000
3 41 1278000
4 18 1195000
Highest
5 10 1145000
1 133 16000
2 81 16500
3 113 36000
4 112 36000
Total income in 2006
Lowest
5 108 36000(b)
a Only a partial list of cases with the value 26000 are shown in the table of lower extremes. b Only a partial list of cases with the value 36000 are shown in the table of lower extremes.
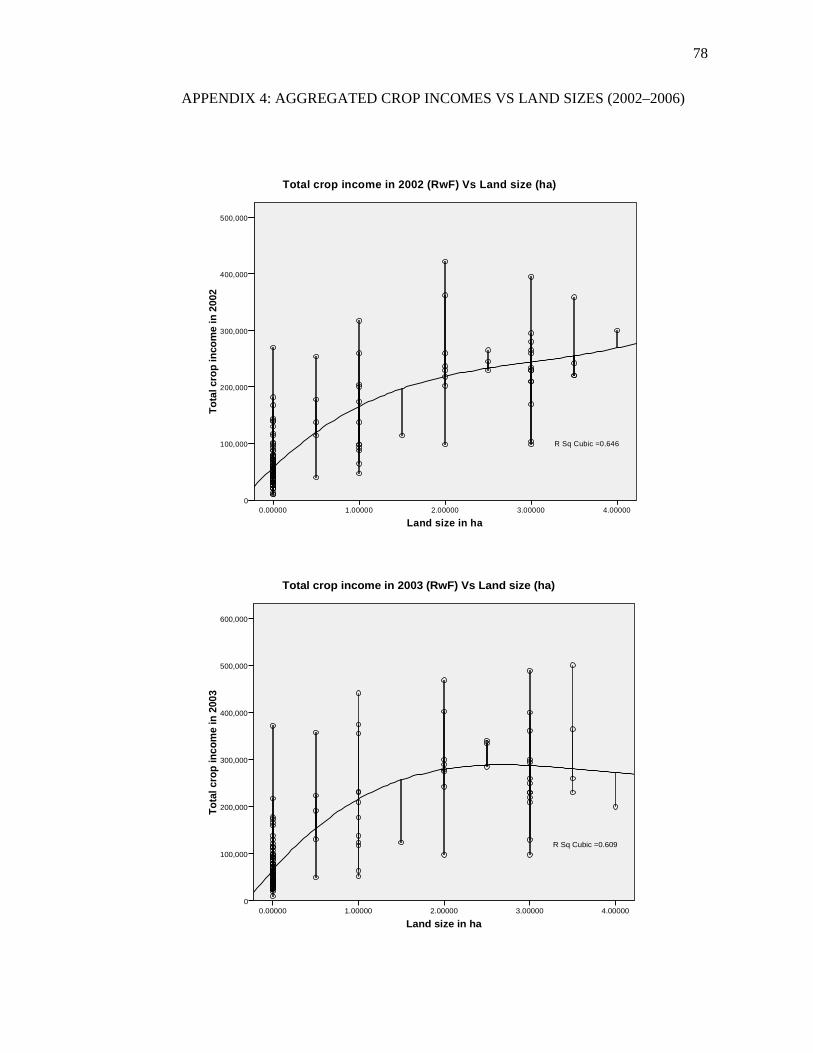
78
APPENDIX 4: AGGREGATED CROP INCOMES VS LAND SIZES (2002–2006)
Land size in ha4.000003.000002.000001.000000.00000
Tot
al c
rop
inco
me
in 2
002
500,000
400,000
300,000
200,000
100,000
0
R Sq Cubic =0.646
Total crop income in 2002 (RwF) Vs Land size (ha)
Land size in ha4.000003.000002.000001.000000.00000
Tota
l cro
p in
com
e in
200
3
600,000
500,000
400,000
300,000
200,000
100,000
0
R Sq Cubic =0.609
Total crop income in 2003 (RwF) Vs Land size (ha)
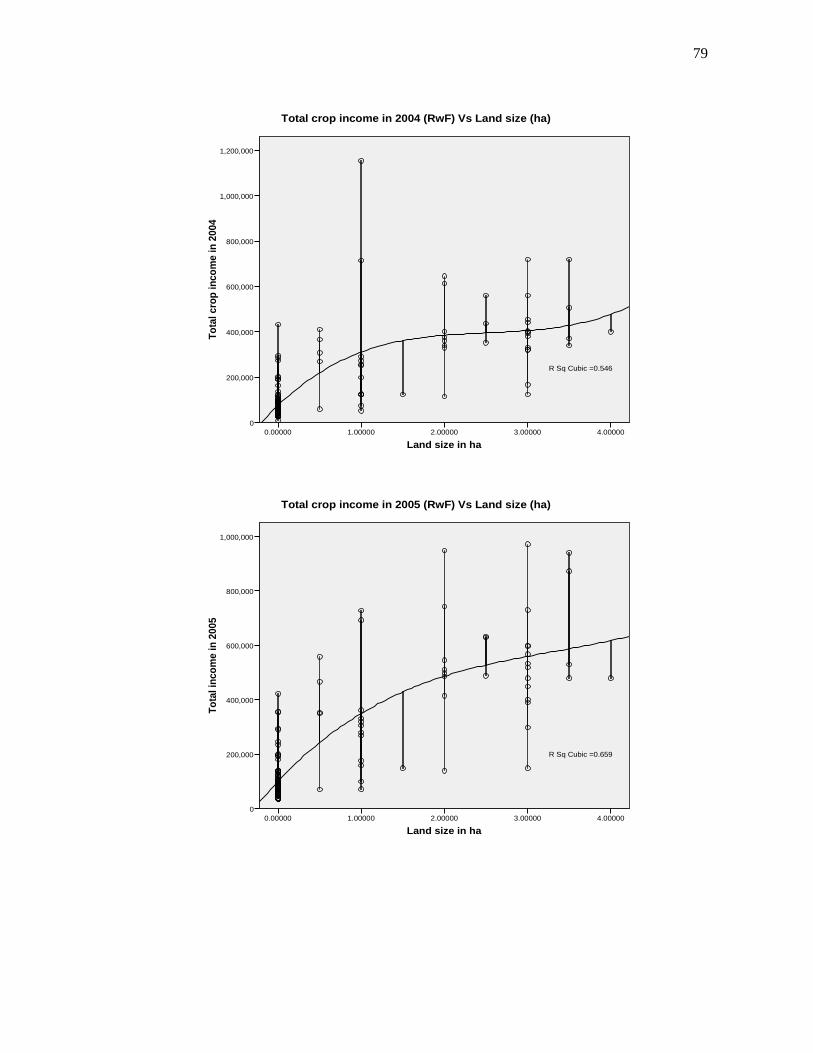
79
Land size in ha4.000003.000002.000001.000000.00000
Tota
l cro
p in
com
e in
200
4
1,200,000
1,000,000
800,000
600,000
400,000
200,000
0
R Sq Cubic =0.546
Total crop income in 2004 (RwF) Vs Land size (ha)
Land size in ha4.000003.000002.000001.000000.00000
Tota
l inc
ome
in 2
005
1,000,000
800,000
600,000
400,000
200,000
0
R Sq Cubic =0.659
Total crop income in 2005 (RwF) Vs Land size (ha)
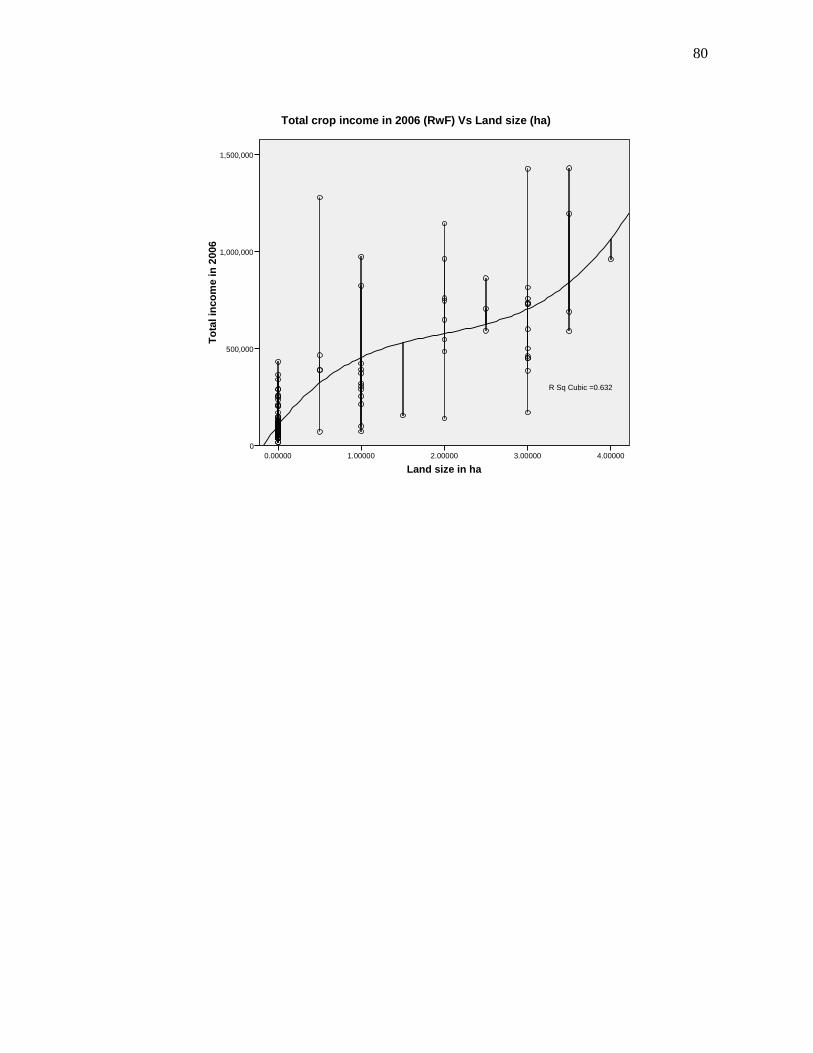
80
Land size in ha4.000003.000002.000001.000000.00000
Tot
al in
com
e in
200
6
1,500,000
1,000,000
500,000
0
R Sq Cubic =0.632
Total crop income in 2006 (RwF) Vs Land size (ha)