Embed Size (px)
Citation preview
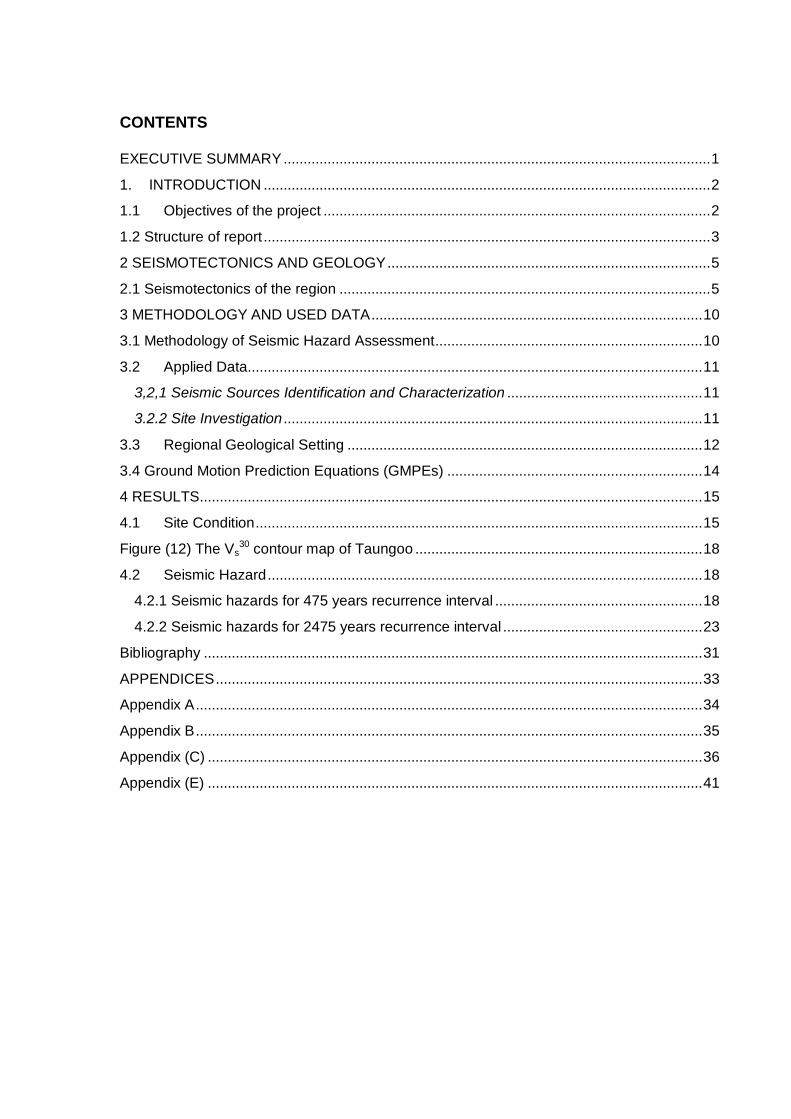
DEVELOPING PROBABILISTIC SEISMIC HAZARD MAPS OF TAUNGOO, BAGO
REGION, MYANMAR
December 2015
CONTENTS EXECUTIVE SUMMARY ........................................................................................................... 1
1. INTRODUCTION ................................................................................................................ 2
1.1 Objectives of the project ................................................................................................. 2
1.2 Structure of report ................................................................................................................ 3
2 SEISMOTECTONICS AND GEOLOGY ................................................................................. 5
2.1 Seismotectonics of the region ............................................................................................. 5
3 METHODOLOGY AND USED DATA ................................................................................... 10
3.1 Methodology of Seismic Hazard Assessment ................................................................... 10
3.2 Applied Data.................................................................................................................. 11
3,2,1 Seismic Sources Identification and Characterization ................................................. 11
3.2.2 Site Investigation ......................................................................................................... 11
3.3 Regional Geological Setting ......................................................................................... 12
3.4 Ground Motion Prediction Equations (GMPEs) ................................................................ 14
4 RESULTS.............................................................................................................................. 15
4.1 Site Condition ................................................................................................................ 15
Figure (12) The Vs30 contour map of Taungoo ........................................................................ 18
4.2 Seismic Hazard ............................................................................................................. 18
4.2.1 Seismic hazards for 475 years recurrence interval .................................................... 18
4.2.2 Seismic hazards for 2475 years recurrence interval .................................................. 23
Bibliography ............................................................................................................................. 31
APPENDICES .......................................................................................................................... 33
Appendix A ............................................................................................................................... 34
Appendix B ............................................................................................................................... 35
Appendix (C) ............................................................................................................................ 36
Appendix (E) ............................................................................................................................ 41
1
EXECUTIVE SUMMARY
Taungoo is one of the towns located near the Sagaing Fault which is the most active fault.
The Sagaing Fault, right-lateral strike-slip fault, runs in the west of the town at about 10 km.
Taungoo has experienced the large earthquake, well known magnitude 7.0 Swa earthquake
struck on August 8, 1929. Even though records of injuries and casualties are not found, the
damages can be said considerable high. Damages include twisting and bending of the track,
snapping of fishplates and bolts, some landslide, turning upside down of the loaded truck
and shaking to pieces of collie hurts, etc.
However, Bago region where Taungoo town is located has effected by several large
earthquakes such as May 5, 1930 Bago earthquake, and December 4, 1930 Phyu
earthquake. Both of these events are of the magnitude 7.3. 1930 Phyu caused severe
damages and killed 30 persons in Phyu. All of these three events are generated from
Sagaing Fault.
With the aid of the United Nations Human Settlements Programme (UN-HABITAT), Myanmar Geosciences Society (MGS), Myanmar Engineering Society (MES) and Myanmar
Earthquake Committee (MEC) conducted the seismic risk assessment for three cities;
Sagaing City (Sagaing Region); and Taungoo and Bago Cities (Bago Region) in 2013.
Since the project includes two parts: the seismic hazard assessment (SHA) and seismic risk
assessment (SRA), MGS and MEC conducted SHA, while MES performed SRA. This report
is for SHA for one of these three cities, Taungoo, Bago Region.
To develop the seismic hazard and seismic risk maps of Taungoo. In developing the
seismic hazard maps, probabilistic seismic hazard assessment (PSHA) method is used. We
developed the seismic hazard maps for 10% probability of exceedance in 50 years (475
years return period) and 2 % probability in 50 years (2475 years return period). The seisic
hazard maps of each return period will be represented in terms of peak ground acceleration
(PGA), spectral acceleration (SA) at the preiods of 0.2 s, 0.3 s and 1.0 s, and peak ground
velocity (PGV). To mitigate the effects of the earthquakes, these seismic hazard maps play
the important roles, and can be used in designinng for the seismic safety for the current and
future constuction of varioius sorts of buildings, planning of the retrifiting of the existing
building, land-use planning of the city, and all of the preparedness schemes for Taungoo.
2
1. INTRODUCTION
Taungoo is a city of Bago Region, Myanmar, about 200 km from Yangon, to the northeastern
end of the region. The area of the city is about above 1700 sq.km. and the population above
120000 (in estimate). With regards to the previous earthquakes, the events happened in the
nearest distance to Taugoo is Swa earthquake struck on August 8, 1929. This earthquake
did not cause the severe damages and casualties in Taungoo and surrounding areas. The
epicenter of the event is at about 38 km in the northwest of Taungoo. This event is one the
sequence of the events of 1929 – 1931; 1929 Swa Earthquake, 1930 Bago Earthquake,
1930 Phyu Earthquake and 1931 Htawgaw earthquake. The 1931 event happened in the
northernmost part of Myanmar, Kachin region, although the other threes occurred in the
southernmost part of the country, Bago Region. The most damaging and deadliest event in
this sequence is 1930 Bago earthquake and that killed 500 peoples in Bago and 50 in
Yangon, causing severe damages in both. Next to this event, 1930 Phyu earthquake caused
30 deaths in Phyu and most of the masonry buildings were wrecked and even timber
buildings were damaged. Moreover, some landslides and liquefaction also happened due to
this event. Table (1) shows the previous earthquakes happened in Bago Region.
From the point of view of active faults, the city is located among the Gwegyo Thrust,
Pyay Thrust, West Bago Yoma Thrust in the west rather than Sagaing Fault, and Papun –
Wanchao Fault in eastwest of city. To the further east, Kyaukkyan Fault and Nam Pon Fault
are the other major active faults that can generate the large event in the future. Therefore,
the city can face the effects of the large earthquake in any time.
On the other hand, in Myanmar most of the cities along Sagaing Fault are expanding
in every direction. Moreover, new projects of infrastructures construction are continuing.
Taungoo is one the cities among them. Therefore MEC, MGS and MES implemented to
develop the seismic hazard maps and risk maps of Taungoo, with the aids of the United
Nations Development Programs (UNDP).
1.1 Objectives of the project
The main goal of the project is to construct the seismic hazard maps and seismic risk maps
of Taungoo, Bago Region. The objectives of the project of seismic hazard assessment of
Taungoo include the following:
1. To develop the probabilistic seismic maps of the city, the seismic hazard maps will
show the hazard parameters of peak ground acceleration (PGA); spectral
3
acceleration (SA) at the periods of 0.2 s, 0.3 s and 1.0 s; and peak ground velocity
(PGV). These seismic hazard maps will correspond to 10% probability of exceedance
in 50 years (475 years return period) and 2% probability in 50 years (2475 years
return period).
2. To contribute these seismic hazard assessment results to the corresponding
organizations that will include the civil societies, the ministries and departments that
will have to use for seismic safety designs development, retrofitting for the seismic
unsafe buildings and land-use planning, etc.
3. To provide the results to the respective departments and organizations (probably
publics) for earthquake disaster education and preparedness purposes.
By seeing the above mentioned objects, the mitigation of earthquake effects on the
peoples of Taungoo, and build-in environment is the major purpose of this project.
1.2 Structure of report
The report is composed of five chapters and the chapter 1 introduces the situation of the
seismicity and tectonics situation with respect to the current situation of the city, Taungoo,
together with objectives of the project. The chapter 2 discusses the seismicity of the city and
its region, correlating with the regional tectonics, and the geology of the area, since the
surface geology is one of the important parameters that strongly influence on the earthquake
damage properties. The methodology and research procedure applied in this project work
comprise of the chapter 3. The data applied in the seismic hazard assessment works are
discussed in this chapter to understand the advantages of the usage and its limitation.
Chapter 5 presents the results of seismic hazard assessment, and the seismic hazard maps
of Taungoo for 10% and 2% probabilities of exceedance in 50 years (475 years and 2475
years return periods). The PGA maps, SA (0.2 s, 0.3 s and 1.0 s) maps, and PGV maps are
the main outputs of the project and the average shear wave velocity to the upper 30 m
(Vs30) contour map is also included. As a final chapter of the report, the discussion on the
results of the project and the recommendation for the earthquake disaster mitigation for
Taungoo are presented in chapter 5.
4
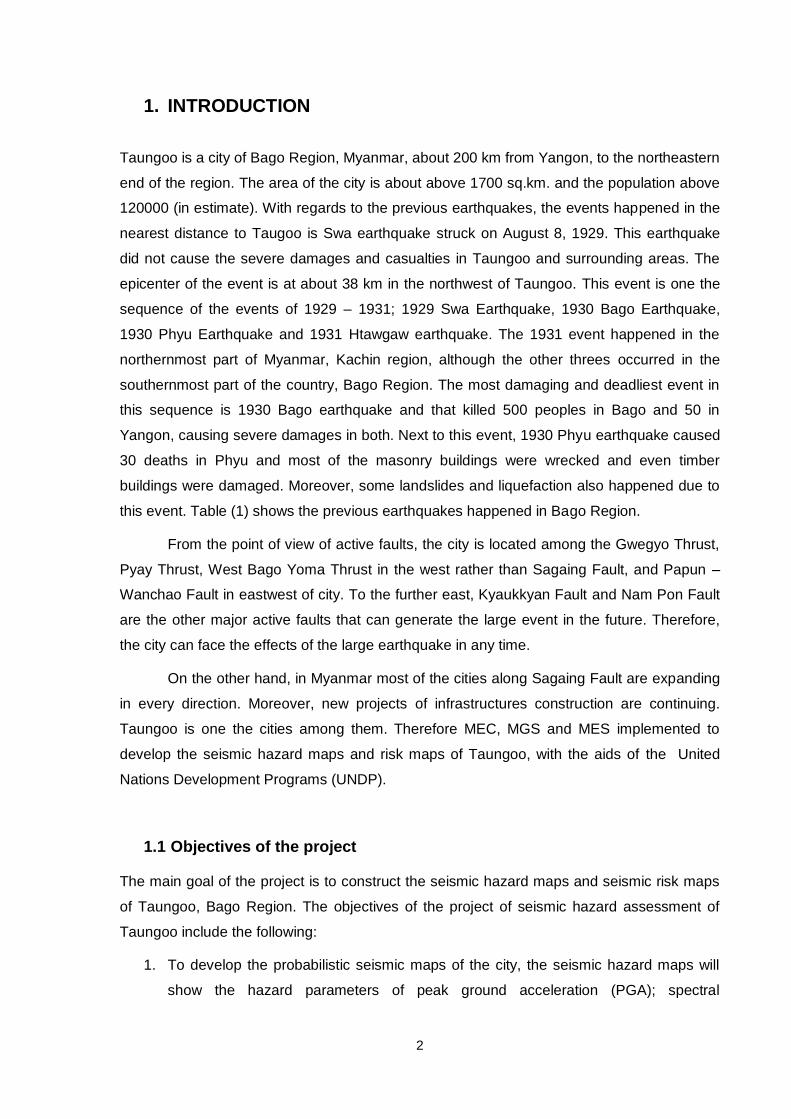
Figure (1) Map of the project city, Taungoo
5
2 SEISMOTECTONICS AND GEOLOGY
2.1 Seismotectonics of the region
When the seismicity of Myanmar is observed as the whole country, most of the crustal faults
such as the major right-lateral strike-slip faults of Sagaing Fault, Kyaukkyan Fault (KK F.)
and Nampon Fault (NP F.); the left-lateral strike-slip faults in Shan-Tanintharyi Block such as
Moemeik Fault, Shweli Fault, Papun – Wan Chao Fault, and Three Pagodas Fault (TP F.);
and thrust systems of West Bago Yoma Fault, Gwegyo Fault, and Pyay Fault generate the
shallow focus earthquakes (≥ 40 km in focal depth).
Among them, the Sagaing Fault is the major active fault, running through or near the
major cities such as Yangon, Bago, Taungoo, Naypyitaw, Pyinmana, Meikhtila, Sagaing,
Mandalay, Wuntho and Myitkyina. The length of the fault is above 1200 km as the total, and
the slip rate is from 18 – 22 mm/yr (Wang Yu et al., 2013). The major events (M > 7.3)
generated by this fault are the well-known 1839 Ava (Innwa) earthquake, 1929 Swa
earthquake, 1930 Bago earthquake, 1930 Phyu earthquake, 1931 Htawgaw earthquake,
1946 two continuous Tagaung earthquakes, and 1956 Sagaing earthquake. The slip rate of
West Bago Yoma Fault is 5 mm/yr, as the largest rate, while that of other faults is around 1
mm/yr (Soe Thura Tun et al., 2011).
Rather than the seismicity related to the crustal faults, the other seismogenic sources are the
subduction zone of Indian Plate beneath Burma Plate in the west of Myanmar and the
collision zone of Indian Plate with Eurasia Plate in the northwest. While the rate of collision is
about 50 mm/yr, the subducted rate is 36 mm/yr (Socquet et al., 2006). Other tectonically
seismogenic source Adaman spreading region. The spreading rate is about 37 mm/yr and
the seismicity happened in this region mostly comprises the shallow focus events. 1762
Arakan earthquake is probably the subduction related event and the magnitude is around
7.5M. From the collision zone of Indian and Eurasia Plates, the largest event is the
magnitude 8.6, August 8, 1950 earthquake.
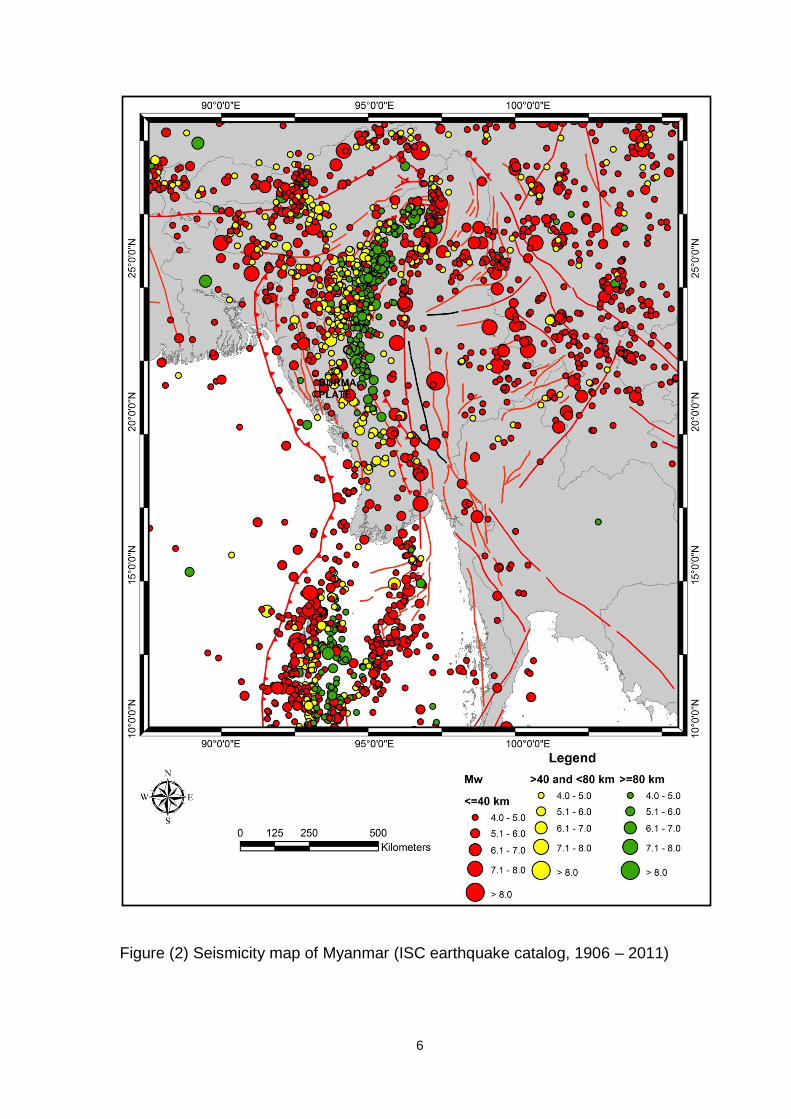
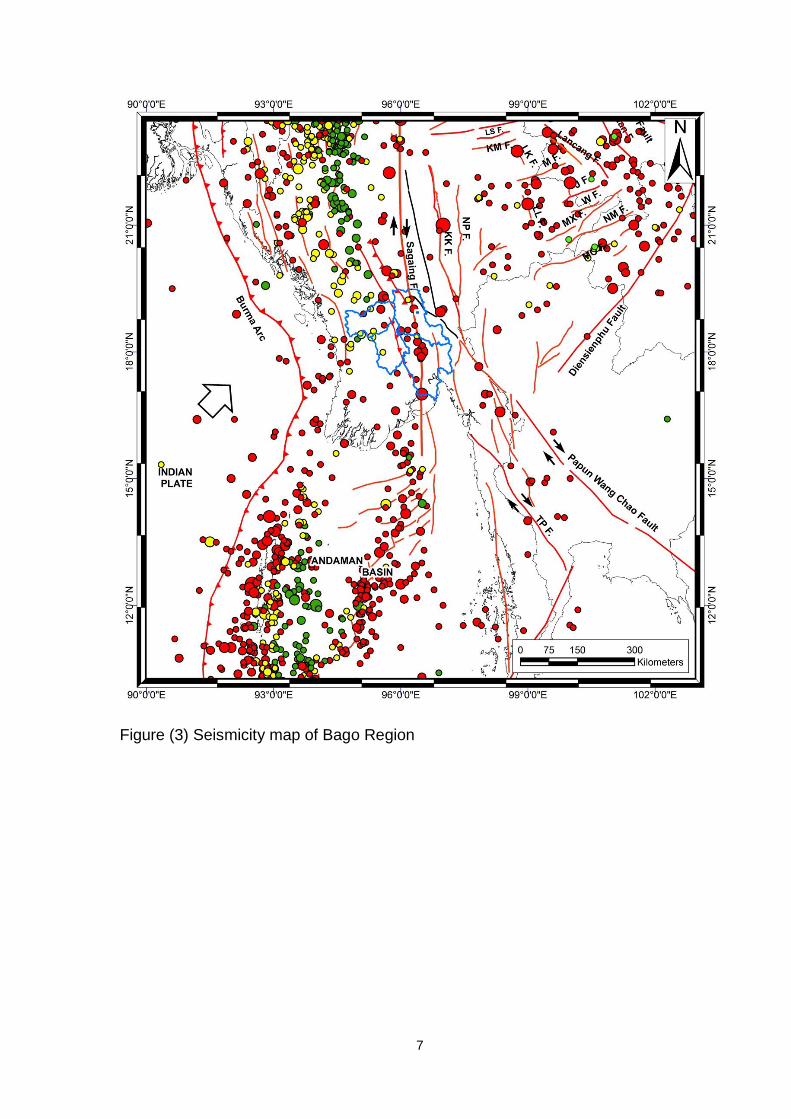
The seismicity of Myanmar is depicted in Figure (2) and Figure (3) illustrates the seismicity
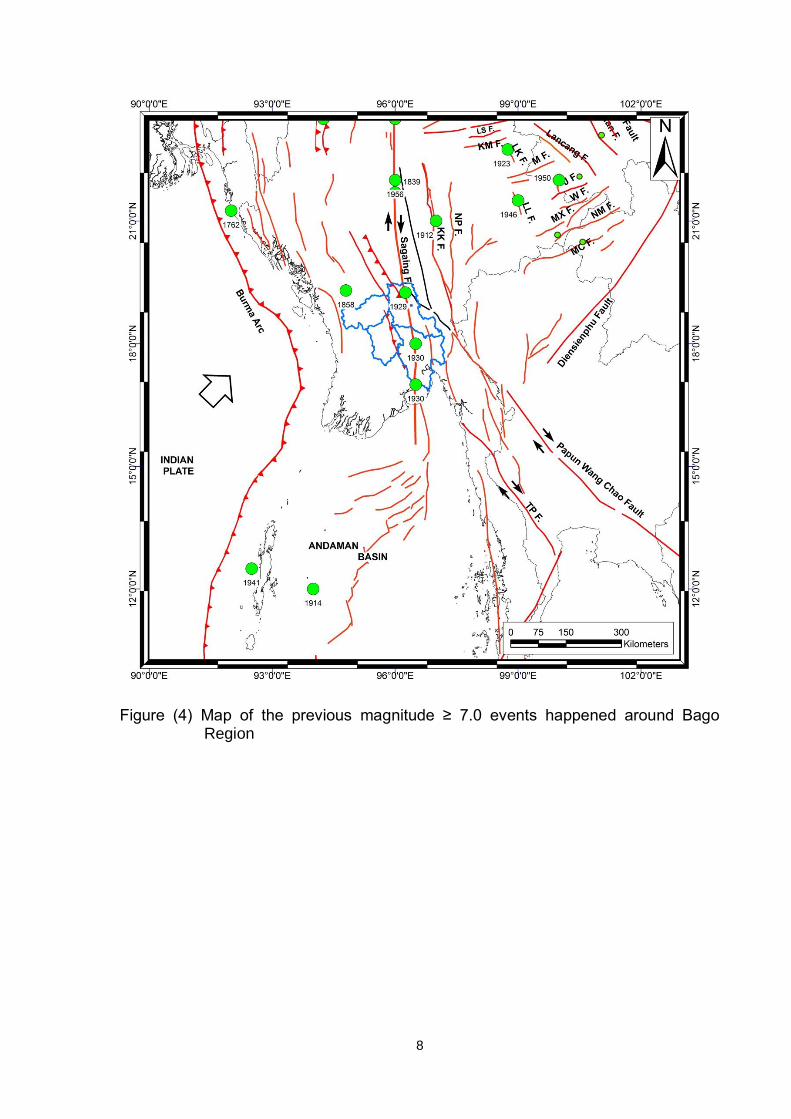
of Bago Region, Taungoo city belongs to. Figure (4) present the magnitude > 7.0
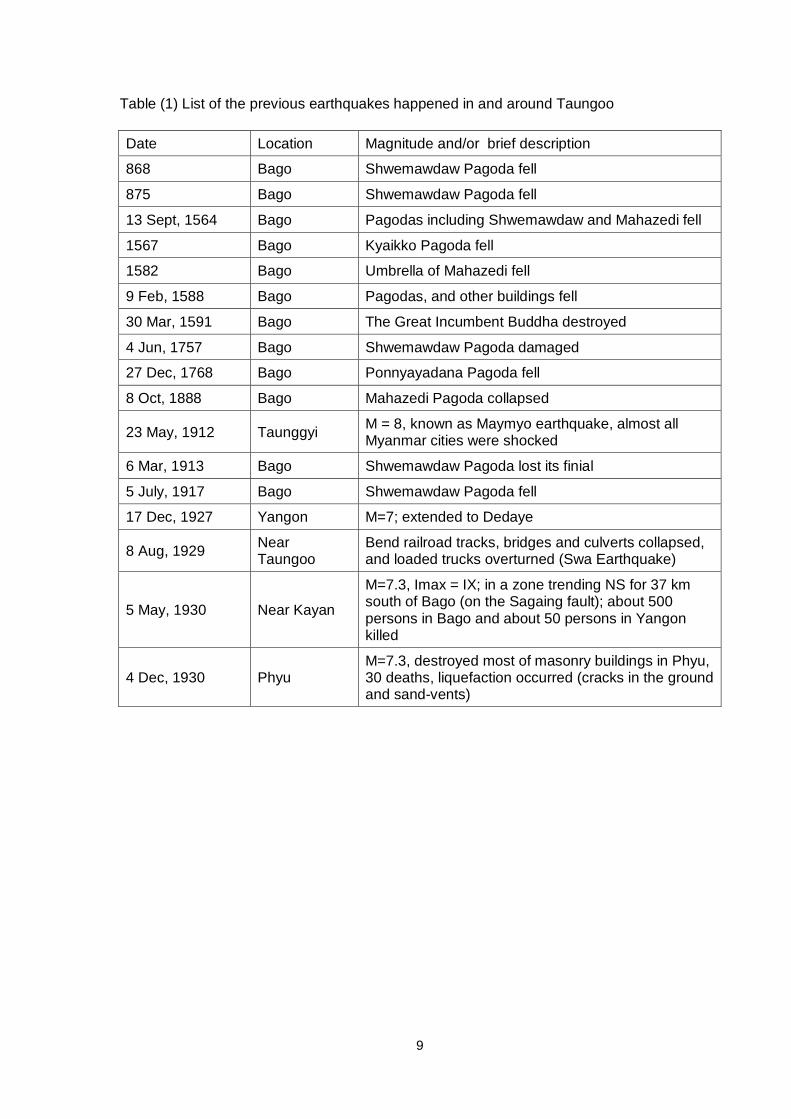
earthquakes happened in and around Bago Region. Table (1) lists the previous historical
and instrumental recorded significant events, describing the respected properties of
damages and casualties.
6
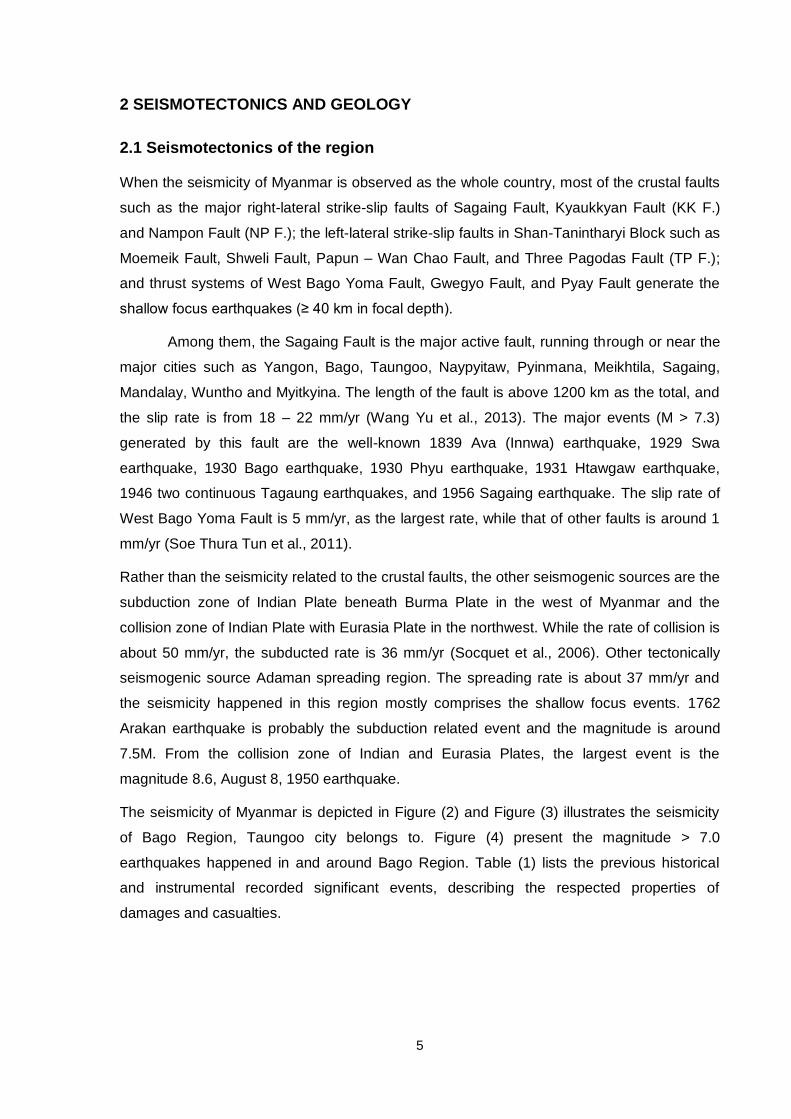
Figure (2) Seismicity map of Myanmar (ISC earthquake catalog, 1906 – 2011)
7
Figure (3) Seismicity map of Bago Region
8
Figure (4) Map of the previous magnitude ≥ 7.0 events happened around Bago
Region
9
Table (1) List of the previous earthquakes happened in and around Taungoo
Date Location Magnitude and/or brief description
868 Bago Shwemawdaw Pagoda fell
875 Bago Shwemawdaw Pagoda fell
13 Sept, 1564 Bago Pagodas including Shwemawdaw and Mahazedi fell
1567 Bago Kyaikko Pagoda fell
1582 Bago Umbrella of Mahazedi fell
9 Feb, 1588 Bago Pagodas, and other buildings fell
30 Mar, 1591 Bago The Great Incumbent Buddha destroyed
4 Jun, 1757 Bago Shwemawdaw Pagoda damaged
27 Dec, 1768 Bago Ponnyayadana Pagoda fell
8 Oct, 1888 Bago Mahazedi Pagoda collapsed
23 May, 1912 Taunggyi M = 8, known as Maymyo earthquake, almost all Myanmar cities were shocked
6 Mar, 1913 Bago Shwemawdaw Pagoda lost its finial
5 July, 1917 Bago Shwemawdaw Pagoda fell
17 Dec, 1927 Yangon M=7; extended to Dedaye
8 Aug, 1929 Near Taungoo
Bend railroad tracks, bridges and culverts collapsed, and loaded trucks overturned (Swa Earthquake)
5 May, 1930 Near Kayan
M=7.3, Imax = IX; in a zone trending NS for 37 km south of Bago (on the Sagaing fault); about 500 persons in Bago and about 50 persons in Yangon killed
4 Dec, 1930 Phyu M=7.3, destroyed most of masonry buildings in Phyu, 30 deaths, liquefaction occurred (cracks in the ground and sand-vents)
10
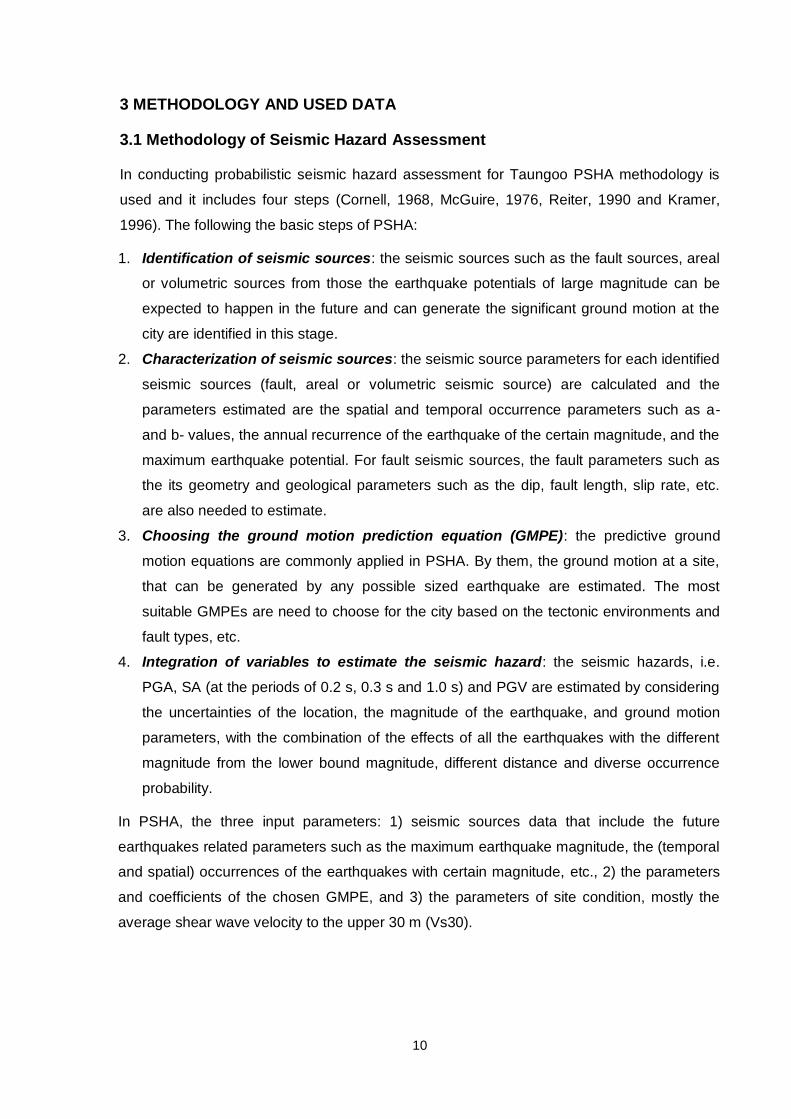
3 METHODOLOGY AND USED DATA
3.1 Methodology of Seismic Hazard Assessment
In conducting probabilistic seismic hazard assessment for Taungoo PSHA methodology is
used and it includes four steps (Cornell, 1968, McGuire, 1976, Reiter, 1990 and Kramer,
1996). The following the basic steps of PSHA:
1. Identification of seismic sources: the seismic sources such as the fault sources, areal
or volumetric sources from those the earthquake potentials of large magnitude can be
expected to happen in the future and can generate the significant ground motion at the
city are identified in this stage.
2. Characterization of seismic sources: the seismic source parameters for each identified
seismic sources (fault, areal or volumetric seismic source) are calculated and the
parameters estimated are the spatial and temporal occurrence parameters such as a-
and b- values, the annual recurrence of the earthquake of the certain magnitude, and the
maximum earthquake potential. For fault seismic sources, the fault parameters such as
the its geometry and geological parameters such as the dip, fault length, slip rate, etc.
are also needed to estimate.
3. Choosing the ground motion prediction equation (GMPE): the predictive ground
motion equations are commonly applied in PSHA. By them, the ground motion at a site,
that can be generated by any possible sized earthquake are estimated. The most
suitable GMPEs are need to choose for the city based on the tectonic environments and
fault types, etc.
4. Integration of variables to estimate the seismic hazard: the seismic hazards, i.e.
PGA, SA (at the periods of 0.2 s, 0.3 s and 1.0 s) and PGV are estimated by considering
the uncertainties of the location, the magnitude of the earthquake, and ground motion
parameters, with the combination of the effects of all the earthquakes with the different
magnitude from the lower bound magnitude, different distance and diverse occurrence
probability.
In PSHA, the three input parameters: 1) seismic sources data that include the future
earthquakes related parameters such as the maximum earthquake magnitude, the (temporal
and spatial) occurrences of the earthquakes with certain magnitude, etc., 2) the parameters
and coefficients of the chosen GMPE, and 3) the parameters of site condition, mostly the
average shear wave velocity to the upper 30 m (Vs30).
11
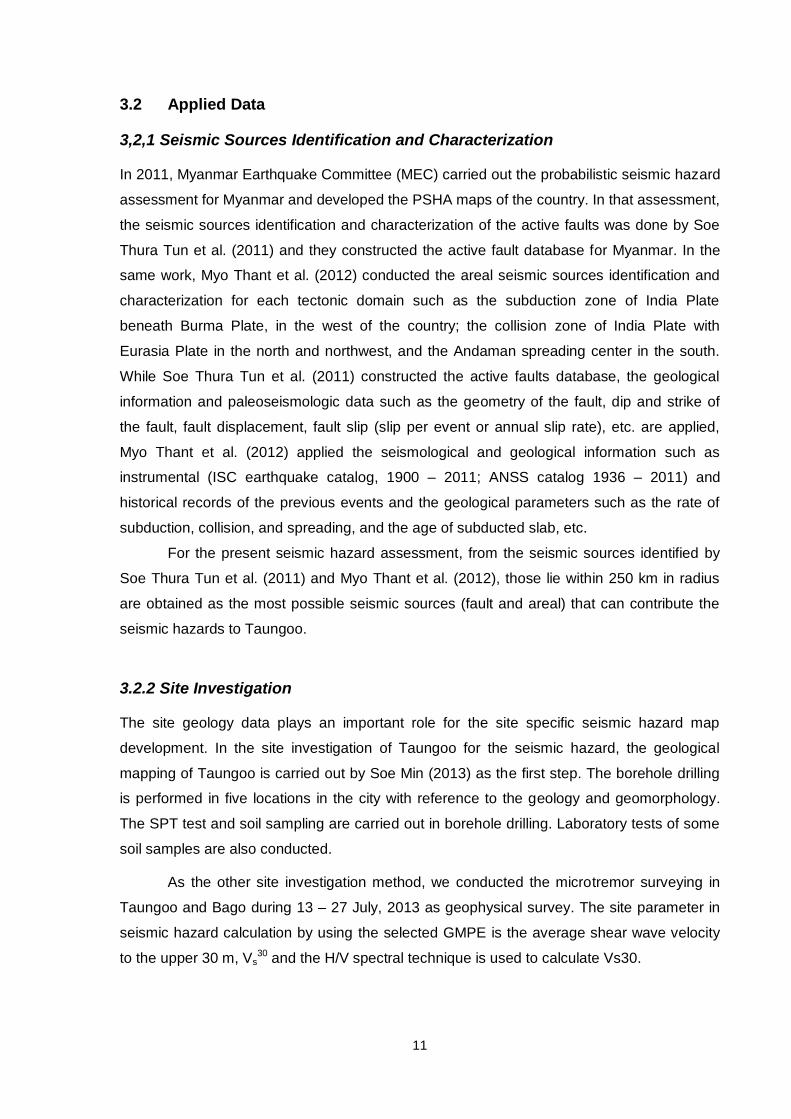
3.2 Applied Data
3,2,1 Seismic Sources Identification and Characterization
In 2011, Myanmar Earthquake Committee (MEC) carried out the probabilistic seismic hazard
assessment for Myanmar and developed the PSHA maps of the country. In that assessment,
the seismic sources identification and characterization of the active faults was done by Soe
Thura Tun et al. (2011) and they constructed the active fault database for Myanmar. In the
same work, Myo Thant et al. (2012) conducted the areal seismic sources identification and
characterization for each tectonic domain such as the subduction zone of India Plate
beneath Burma Plate, in the west of the country; the collision zone of India Plate with
Eurasia Plate in the north and northwest, and the Andaman spreading center in the south.
While Soe Thura Tun et al. (2011) constructed the active faults database, the geological
information and paleoseismologic data such as the geometry of the fault, dip and strike of
the fault, fault displacement, fault slip (slip per event or annual slip rate), etc. are applied,
Myo Thant et al. (2012) applied the seismological and geological information such as
instrumental (ISC earthquake catalog, 1900 – 2011; ANSS catalog 1936 – 2011) and
historical records of the previous events and the geological parameters such as the rate of
subduction, collision, and spreading, and the age of subducted slab, etc.
For the present seismic hazard assessment, from the seismic sources identified by
Soe Thura Tun et al. (2011) and Myo Thant et al. (2012), those lie within 250 km in radius
are obtained as the most possible seismic sources (fault and areal) that can contribute the
seismic hazards to Taungoo.
3.2.2 Site Investigation
The site geology data plays an important role for the site specific seismic hazard map
development. In the site investigation of Taungoo for the seismic hazard, the geological
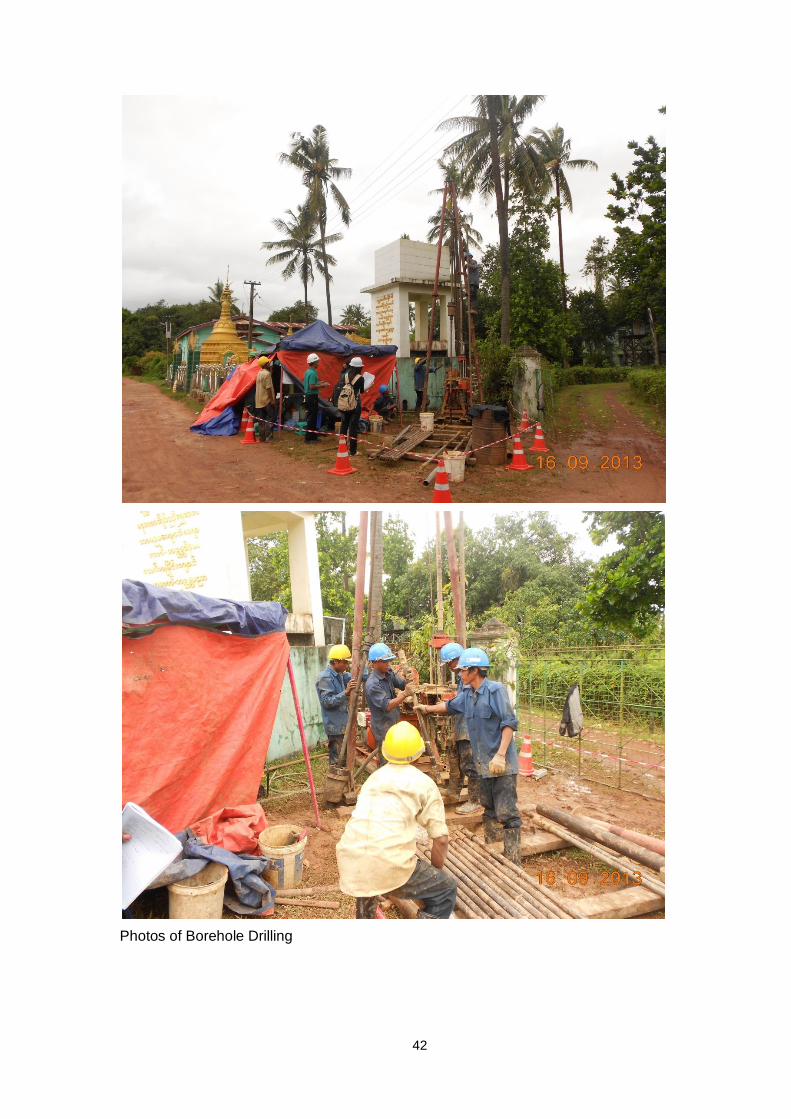
mapping of Taungoo is carried out by Soe Min (2013) as the first step. The borehole drilling
is performed in five locations in the city with reference to the geology and geomorphology.
The SPT test and soil sampling are carried out in borehole drilling. Laboratory tests of some
soil samples are also conducted.
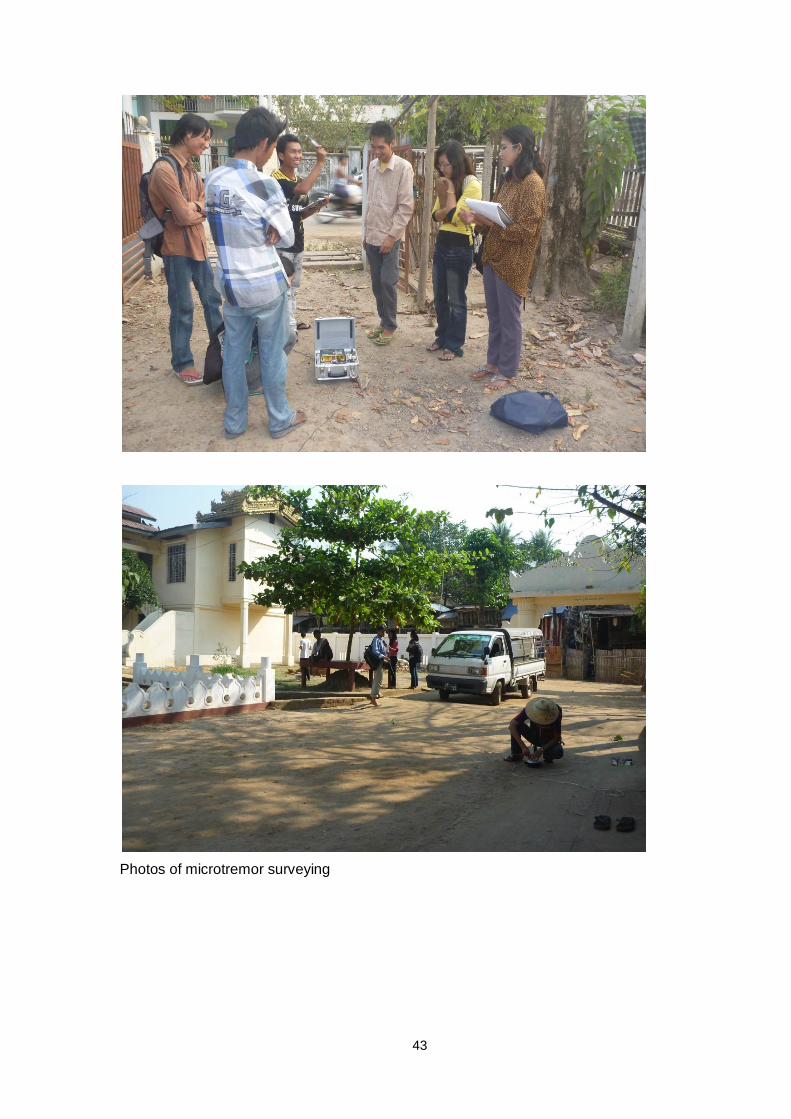
As the other site investigation method, we conducted the microtremor surveying in
Taungoo and Bago during 13 – 27 July, 2013 as geophysical survey. The site parameter in
seismic hazard calculation by using the selected GMPE is the average shear wave velocity
to the upper 30 m, Vs30 and the H/V spectral technique is used to calculate Vs30.
12
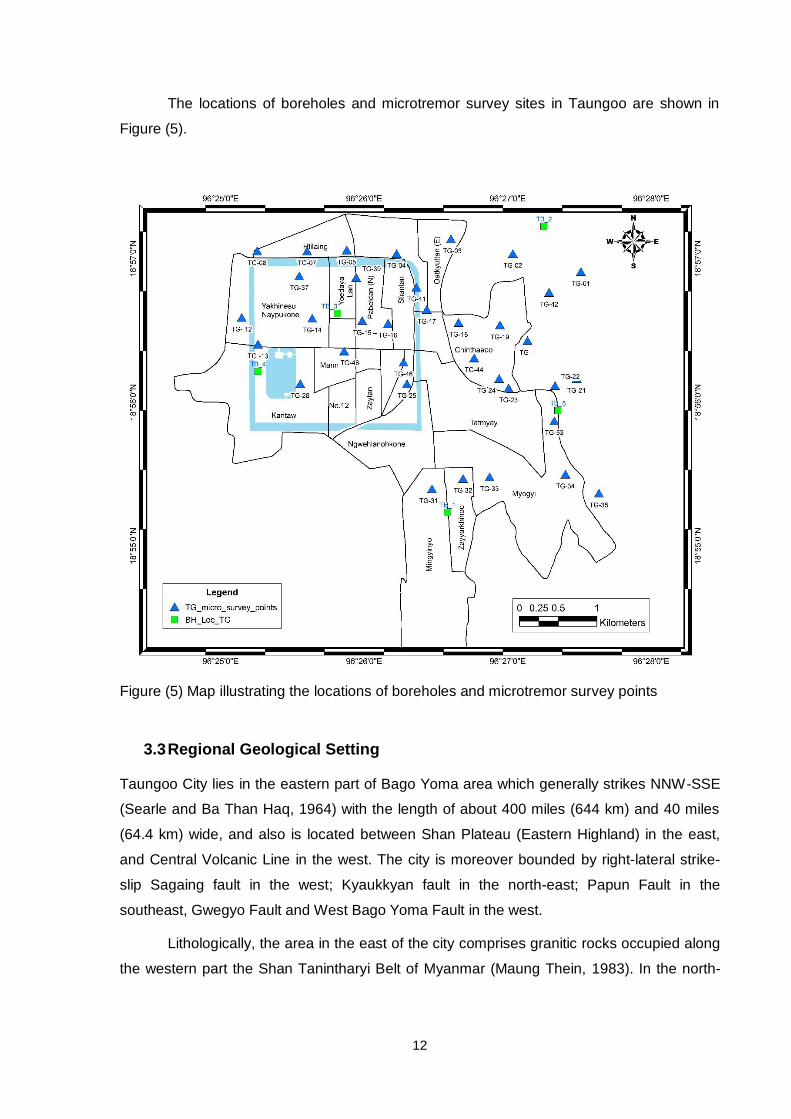
The locations of boreholes and microtremor survey sites in Taungoo are shown in
Figure (5).
Figure (5) Map illustrating the locations of boreholes and microtremor survey points
3.3 Regional Geological Setting
Taungoo City lies in the eastern part of Bago Yoma area which generally strikes NNW-SSE
(Searle and Ba Than Haq, 1964) with the length of about 400 miles (644 km) and 40 miles
(64.4 km) wide, and also is located between Shan Plateau (Eastern Highland) in the east,
and Central Volcanic Line in the west. The city is moreover bounded by right-lateral strike-
slip Sagaing fault in the west; Kyaukkyan fault in the north-east; Papun Fault in the
southeast, Gwegyo Fault and West Bago Yoma Fault in the west.
Lithologically, the area in the east of the city comprises granitic rocks occupied along
the western part the Shan Tanintharyi Belt of Myanmar (Maung Thein, 1983). In the north-
13
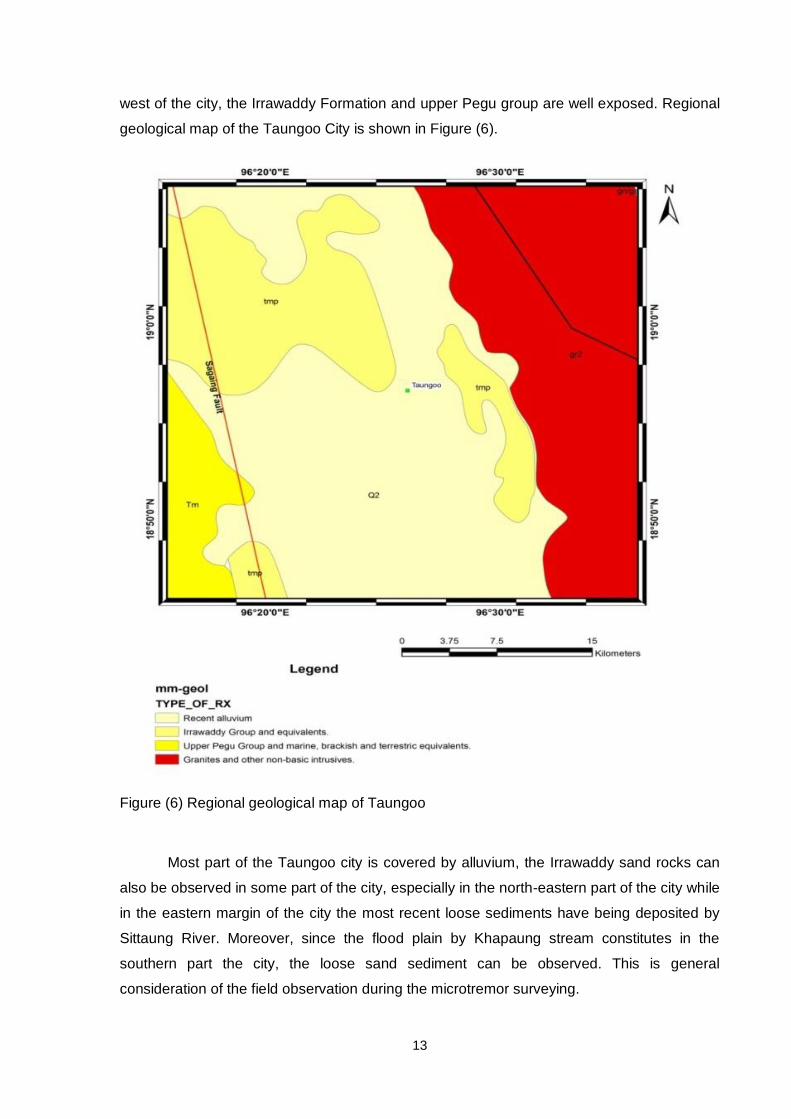
west of the city, the Irrawaddy Formation and upper Pegu group are well exposed. Regional
geological map of the Taungoo City is shown in Figure (6).
Figure (6) Regional geological map of Taungoo
Most part of the Taungoo city is covered by alluvium, the Irrawaddy sand rocks can
also be observed in some part of the city, especially in the north-eastern part of the city while
in the eastern margin of the city the most recent loose sediments have being deposited by
Sittaung River. Moreover, since the flood plain by Khapaung stream constitutes in the
southern part the city, the loose sand sediment can be observed. This is general
consideration of the field observation during the microtremor surveying.
14
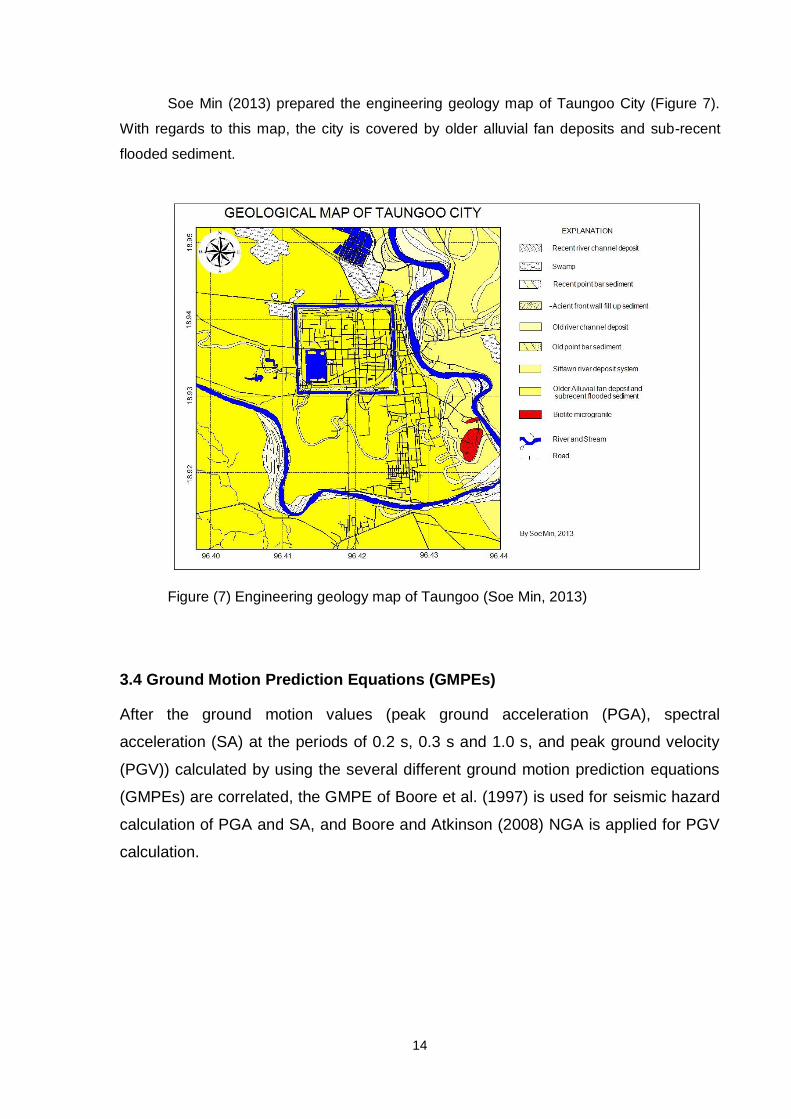
Soe Min (2013) prepared the engineering geology map of Taungoo City (Figure 7).
With regards to this map, the city is covered by older alluvial fan deposits and sub-recent
flooded sediment.
Figure (7) Engineering geology map of Taungoo (Soe Min, 2013)
3.4 Ground Motion Prediction Equations (GMPEs)
After the ground motion values (peak ground acceleration (PGA), spectral
acceleration (SA) at the periods of 0.2 s, 0.3 s and 1.0 s, and peak ground velocity
(PGV)) calculated by using the several different ground motion prediction equations
(GMPEs) are correlated, the GMPE of Boore et al. (1997) is used for seismic hazard
calculation of PGA and SA, and Boore and Atkinson (2008) NGA is applied for PGV
calculation.
15
4 RESULTS
4.1 Site Condition
From borehole drilling, SPT and Laboratory analysis, the N-values and density of each soil
layer are obtained. These parameters are the basic parameters for H/V spectral ratio
analysis for mircrotremor data. As in all the geophysical methods, the actual geological
condition can be applied as the model for microtremor data analysis. The shear wave
velocity structure of each survey site is constructed based on this model and finally we
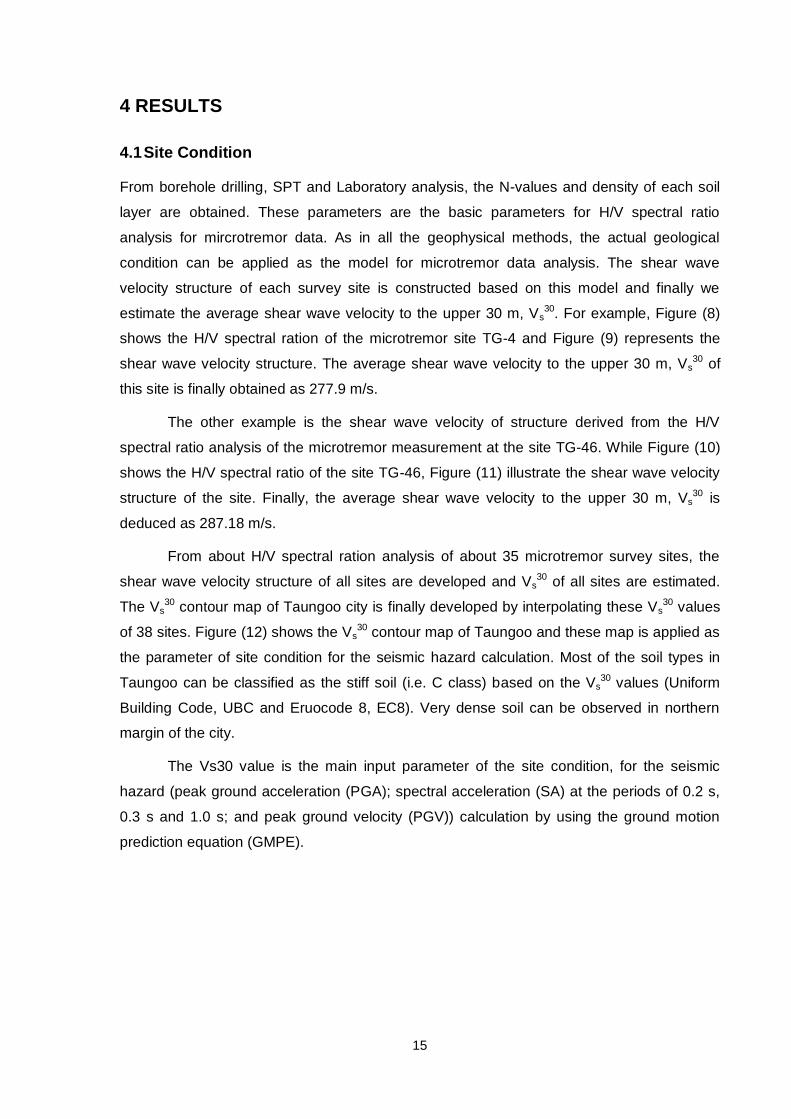
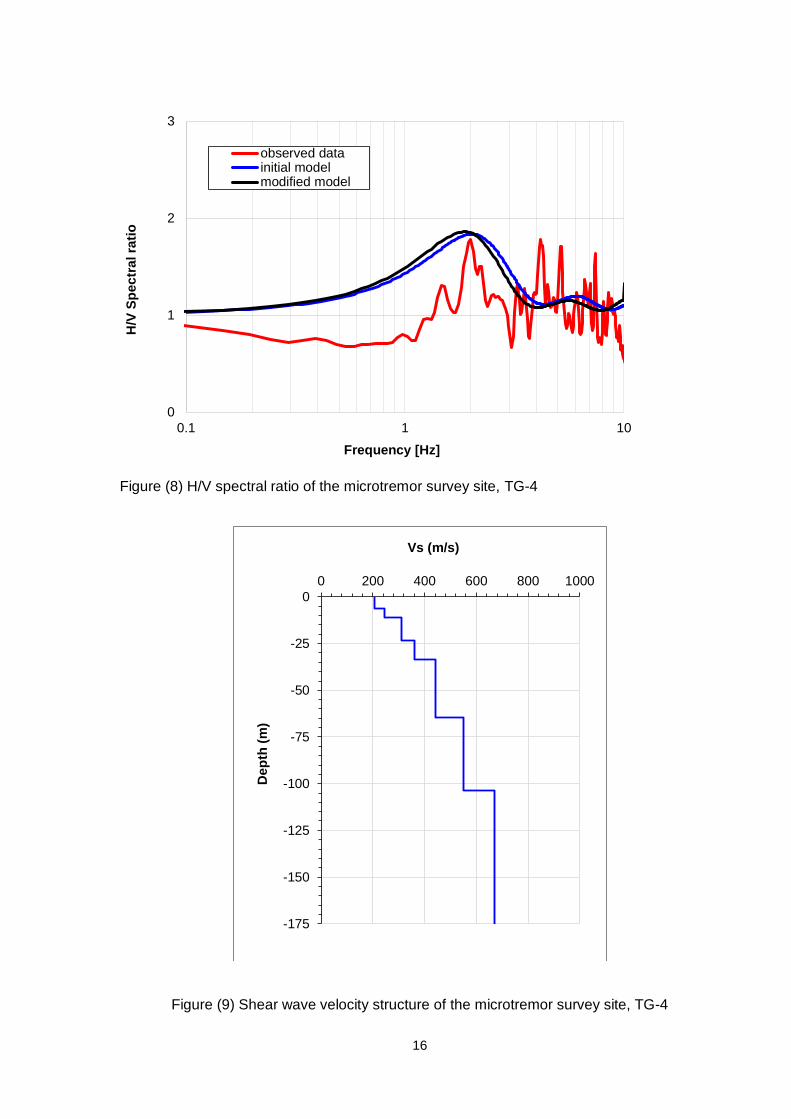
estimate the average shear wave velocity to the upper 30 m, Vs30. For example, Figure (8)
shows the H/V spectral ration of the microtremor site TG-4 and Figure (9) represents the
shear wave velocity structure. The average shear wave velocity to the upper 30 m, Vs30 of
this site is finally obtained as 277.9 m/s.
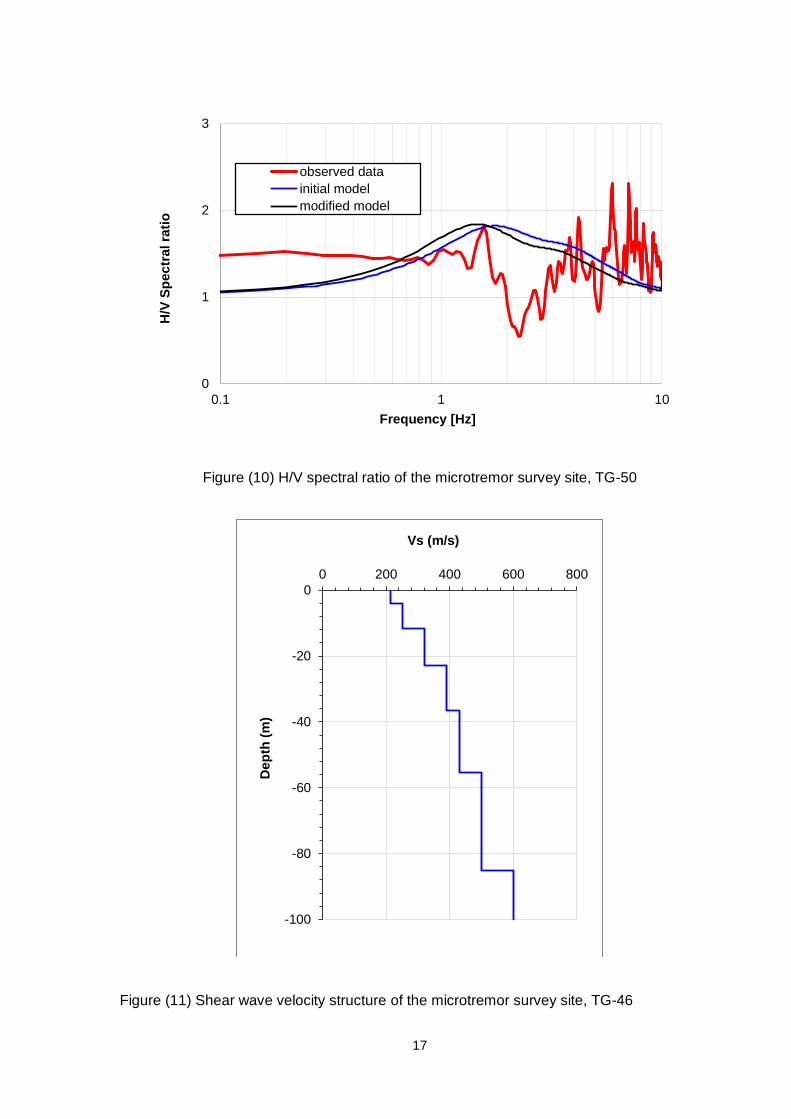
The other example is the shear wave velocity of structure derived from the H/V
spectral ratio analysis of the microtremor measurement at the site TG-46. While Figure (10)
shows the H/V spectral ratio of the site TG-46, Figure (11) illustrate the shear wave velocity
structure of the site. Finally, the average shear wave velocity to the upper 30 m, Vs30 is
deduced as 287.18 m/s.
From about H/V spectral ration analysis of about 35 microtremor survey sites, the
shear wave velocity structure of all sites are developed and Vs30 of all sites are estimated.
The Vs30 contour map of Taungoo city is finally developed by interpolating these Vs
30 values
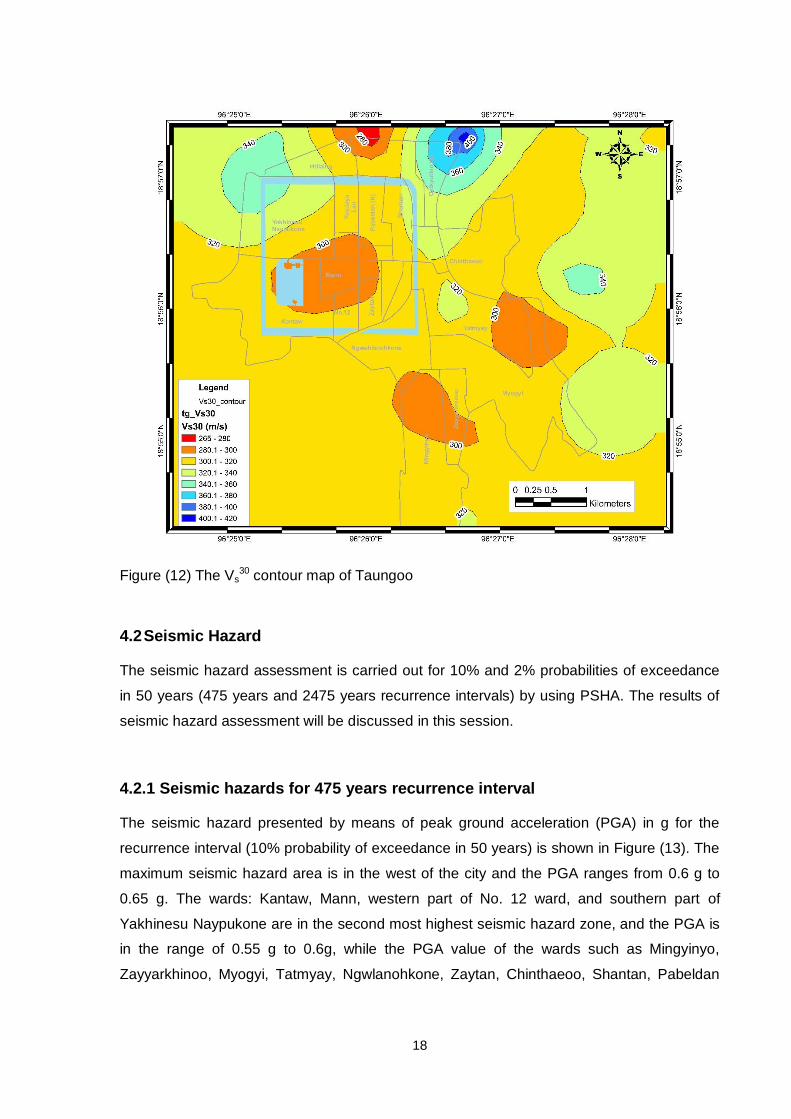
of 38 sites. Figure (12) shows the Vs30 contour map of Taungoo and these map is applied as
the parameter of site condition for the seismic hazard calculation. Most of the soil types in
Taungoo can be classified as the stiff soil (i.e. C class) based on the Vs30 values (Uniform
Building Code, UBC and Eruocode 8, EC8). Very dense soil can be observed in northern
margin of the city.
The Vs30 value is the main input parameter of the site condition, for the seismic
hazard (peak ground acceleration (PGA); spectral acceleration (SA) at the periods of 0.2 s,
0.3 s and 1.0 s; and peak ground velocity (PGV)) calculation by using the ground motion
prediction equation (GMPE).
16
Figure (8) H/V spectral ratio of the microtremor survey site, TG-4
Figure (9) Shear wave velocity structure of the microtremor survey site, TG-4
0
1
2
3
0.1 1 10
H/V
Sp
ec
tra
l ra
tio
Frequency [Hz]
observed datainitial modelmodified model
-175
-150
-125
-100
-75
-50
-25
0
0 200 400 600 800 1000
Dep
th (
m)
Vs (m/s)
17
Figure (10) H/V spectral ratio of the microtremor survey site, TG-50
Figure (11) Shear wave velocity structure of the microtremor survey site, TG-46
0
1
2
3
0.1 1 10
H/V
Sp
ec
tral ra
tio
Frequency [Hz]
observed data
initial model
modified model
-100
-80
-60
-40
-20
0
0 200 400 600 800
Dep
th (
m)
Vs (m/s)
18
Figure (12) The Vs30 contour map of Taungoo
4.2 Seismic Hazard
The seismic hazard assessment is carried out for 10% and 2% probabilities of exceedance
in 50 years (475 years and 2475 years recurrence intervals) by using PSHA. The results of
seismic hazard assessment will be discussed in this session.
4.2.1 Seismic hazards for 475 years recurrence interval
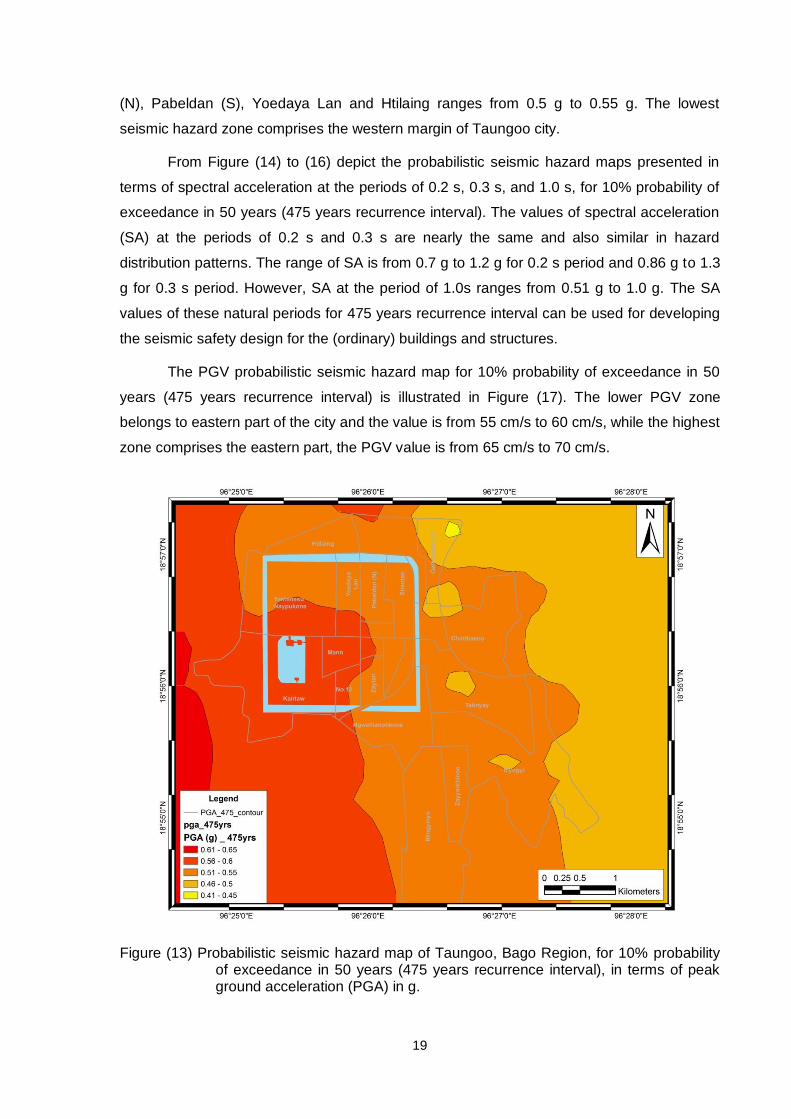
The seismic hazard presented by means of peak ground acceleration (PGA) in g for the
recurrence interval (10% probability of exceedance in 50 years) is shown in Figure (13). The
maximum seismic hazard area is in the west of the city and the PGA ranges from 0.6 g to
0.65 g. The wards: Kantaw, Mann, western part of No. 12 ward, and southern part of
Yakhinesu Naypukone are in the second most highest seismic hazard zone, and the PGA is
in the range of 0.55 g to 0.6g, while the PGA value of the wards such as Mingyinyo,
Zayyarkhinoo, Myogyi, Tatmyay, Ngwlanohkone, Zaytan, Chinthaeoo, Shantan, Pabeldan
19
(N), Pabeldan (S), Yoedaya Lan and Htilaing ranges from 0.5 g to 0.55 g. The lowest
seismic hazard zone comprises the western margin of Taungoo city.
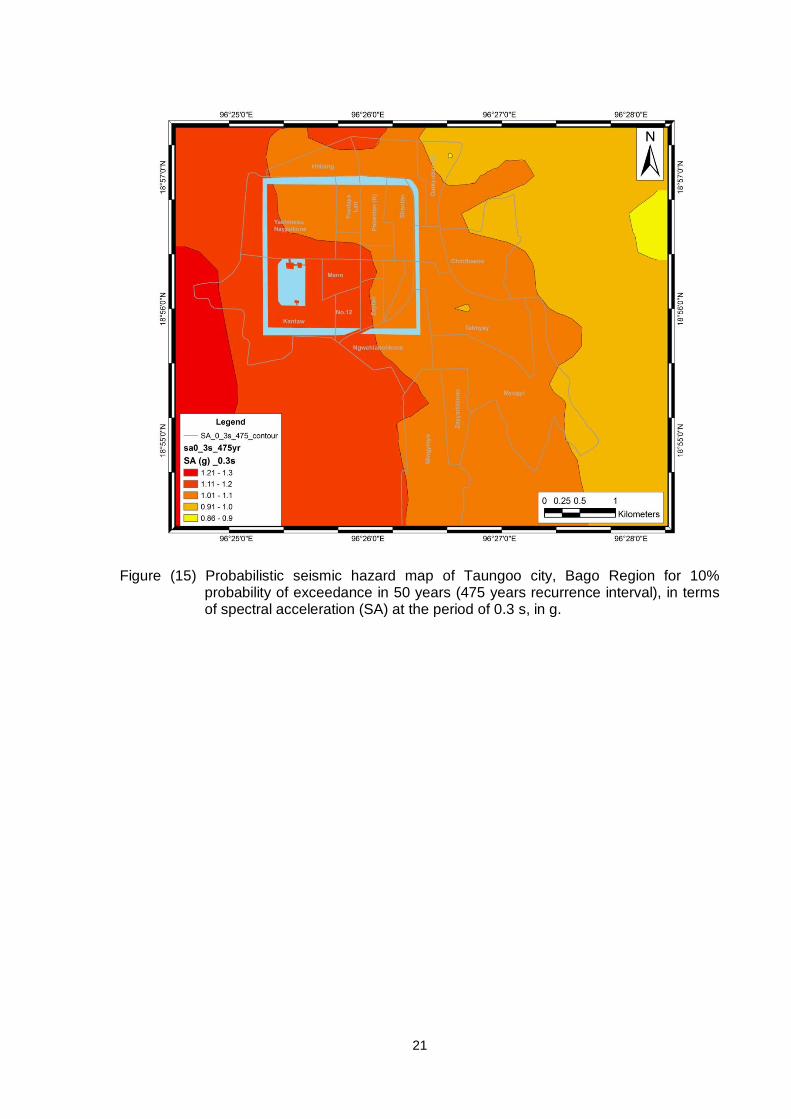
From Figure (14) to (16) depict the probabilistic seismic hazard maps presented in
terms of spectral acceleration at the periods of 0.2 s, 0.3 s, and 1.0 s, for 10% probability of
exceedance in 50 years (475 years recurrence interval). The values of spectral acceleration
(SA) at the periods of 0.2 s and 0.3 s are nearly the same and also similar in hazard
distribution patterns. The range of SA is from 0.7 g to 1.2 g for 0.2 s period and 0.86 g to 1.3
g for 0.3 s period. However, SA at the period of 1.0s ranges from 0.51 g to 1.0 g. The SA
values of these natural periods for 475 years recurrence interval can be used for developing
the seismic safety design for the (ordinary) buildings and structures.
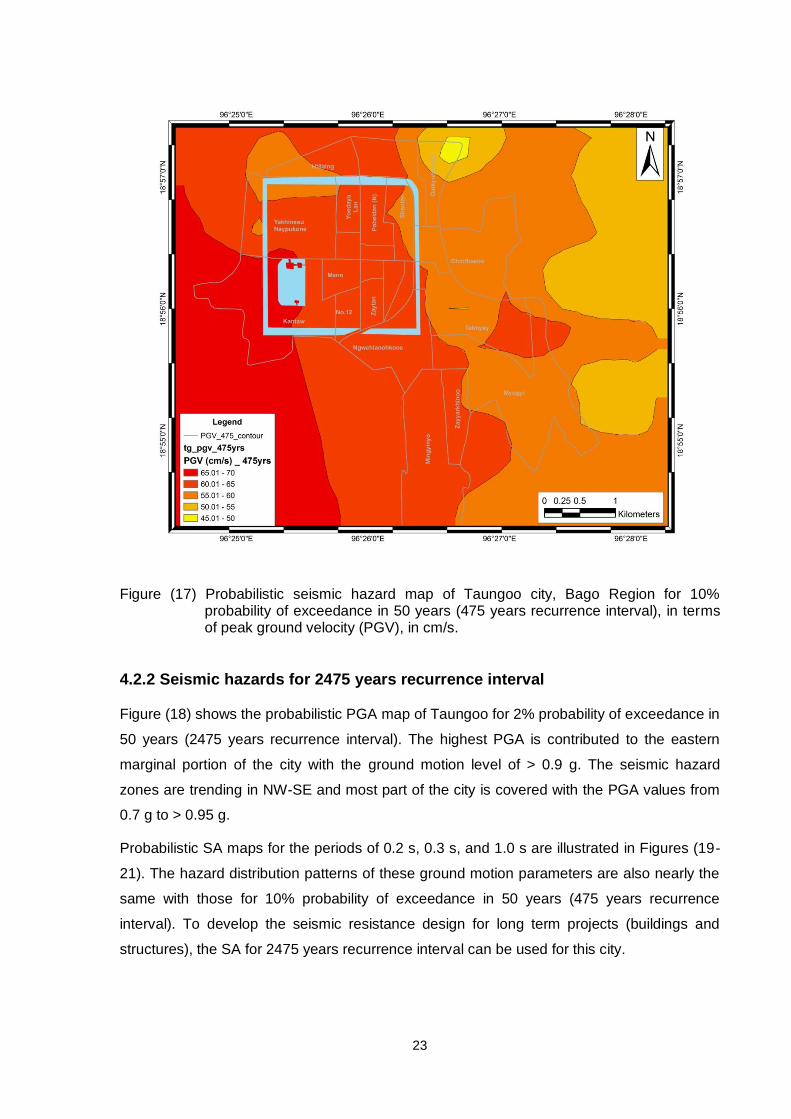
The PGV probabilistic seismic hazard map for 10% probability of exceedance in 50
years (475 years recurrence interval) is illustrated in Figure (17). The lower PGV zone
belongs to eastern part of the city and the value is from 55 cm/s to 60 cm/s, while the highest
zone comprises the eastern part, the PGV value is from 65 cm/s to 70 cm/s.
Figure (13) Probabilistic seismic hazard map of Taungoo, Bago Region, for 10% probability of exceedance in 50 years (475 years recurrence interval), in terms of peak ground acceleration (PGA) in g.

20
Figure (14) Probabilistic seismic hazard map of Taungoo city, Bago Region for 10% probability of exceedance in 50 years (475 years recurrence interval), in terms of spectral acceleration (SA) at the period of 0.2 s, in g.
21
Figure (15) Probabilistic seismic hazard map of Taungoo city, Bago Region for 10% probability of exceedance in 50 years (475 years recurrence interval), in terms of spectral acceleration (SA) at the period of 0.3 s, in g.

22
Figure (16) Probabilistic seismic hazard map of Taungoo city, Bago Region for 10% probability of exceedance in 50 years (475 years recurrence interval), in terms of spectral acceleration (SA) at the period of 1.0 s, in g.
23
Figure (17) Probabilistic seismic hazard map of Taungoo city, Bago Region for 10% probability of exceedance in 50 years (475 years recurrence interval), in terms of peak ground velocity (PGV), in cm/s.
4.2.2 Seismic hazards for 2475 years recurrence interval
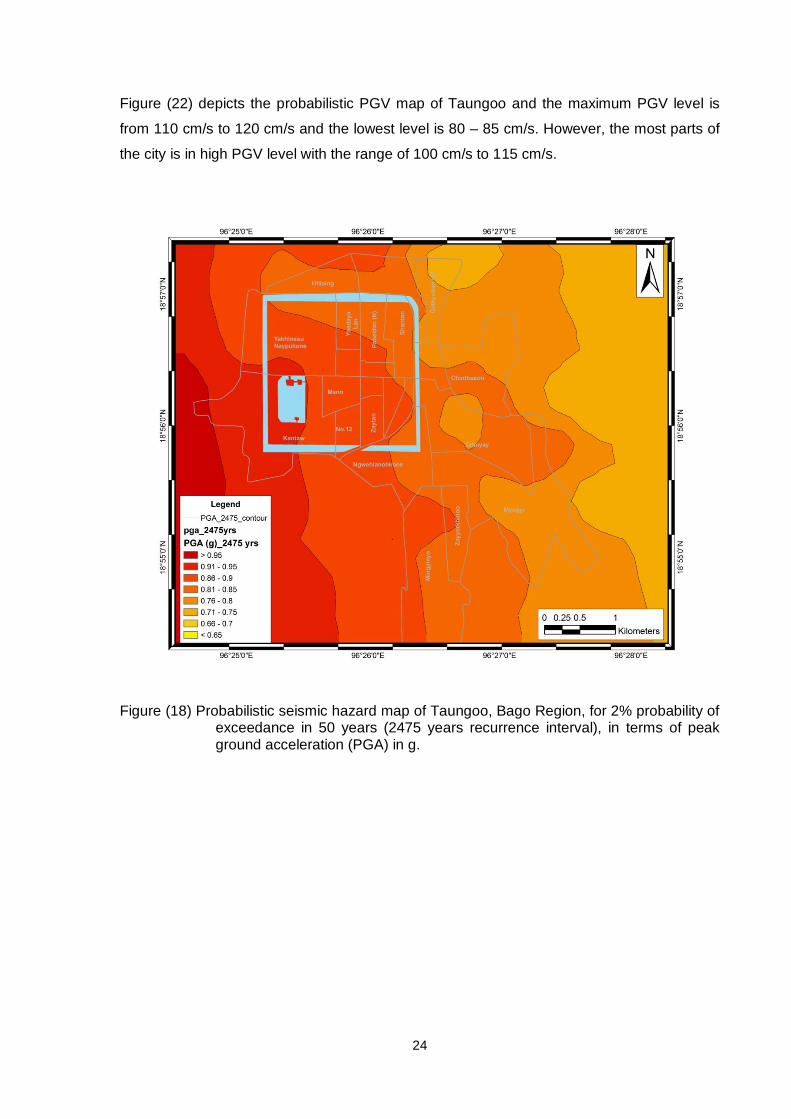
Figure (18) shows the probabilistic PGA map of Taungoo for 2% probability of exceedance in
50 years (2475 years recurrence interval). The highest PGA is contributed to the eastern
marginal portion of the city with the ground motion level of > 0.9 g. The seismic hazard
zones are trending in NW-SE and most part of the city is covered with the PGA values from
0.7 g to > 0.95 g.
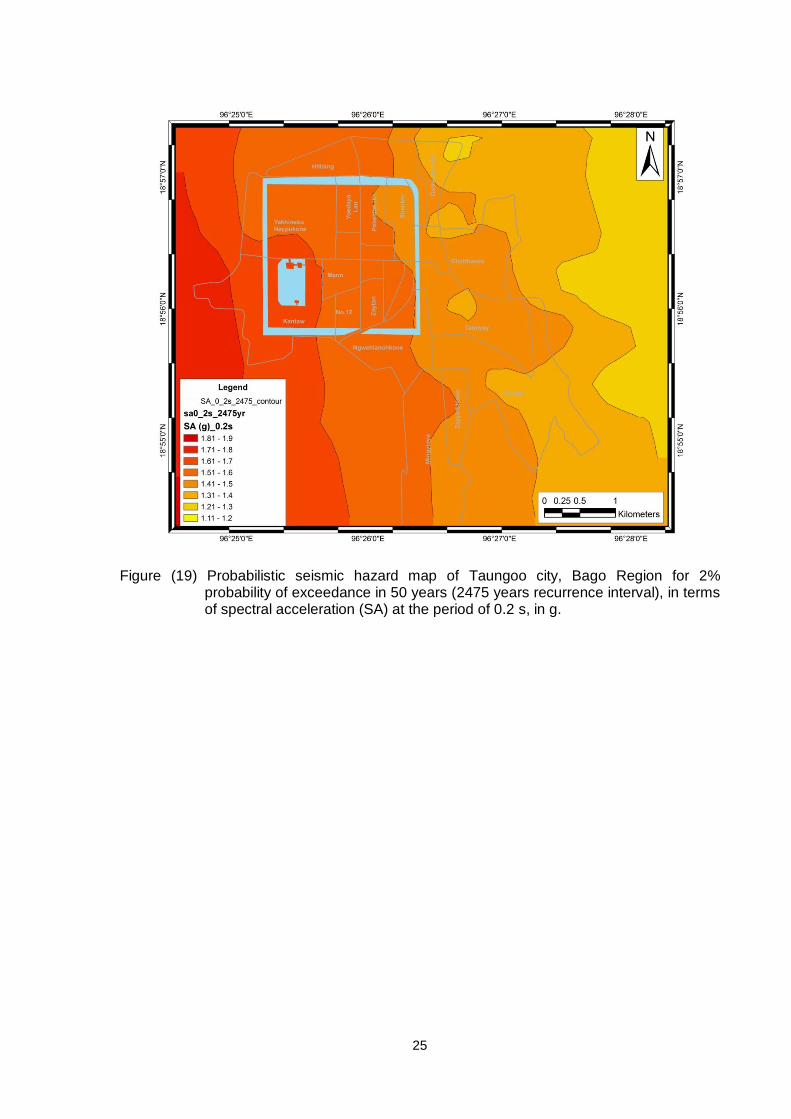
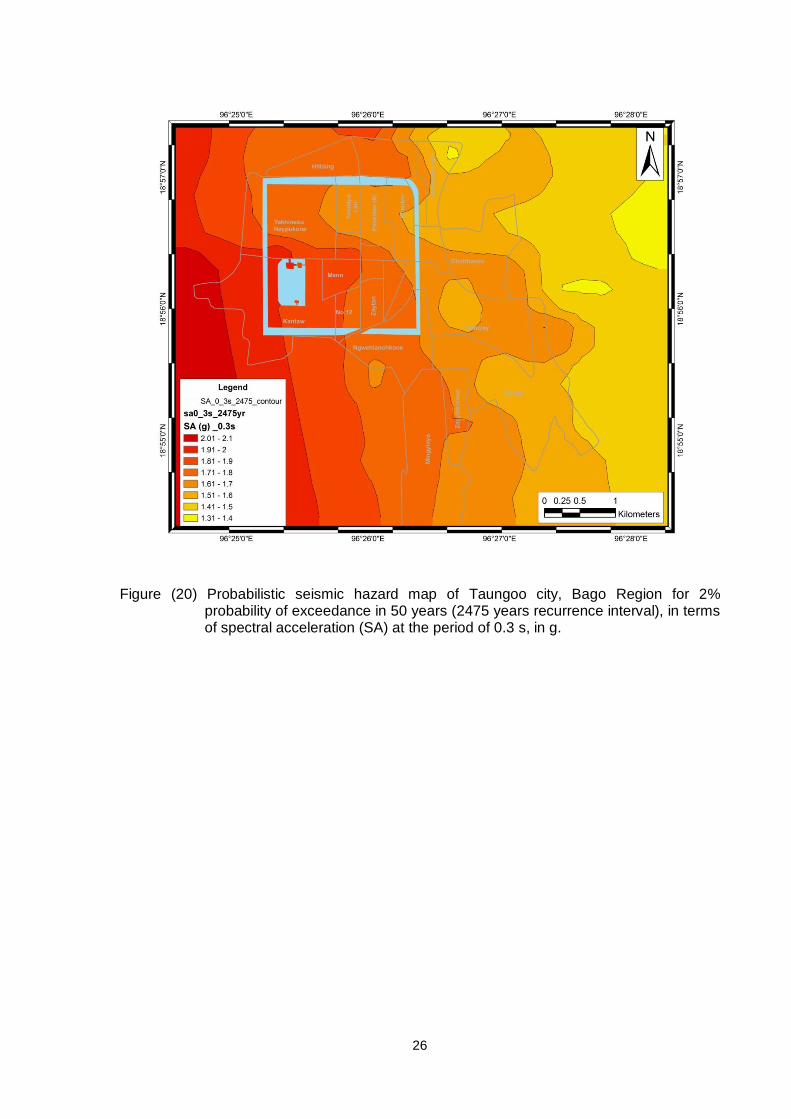
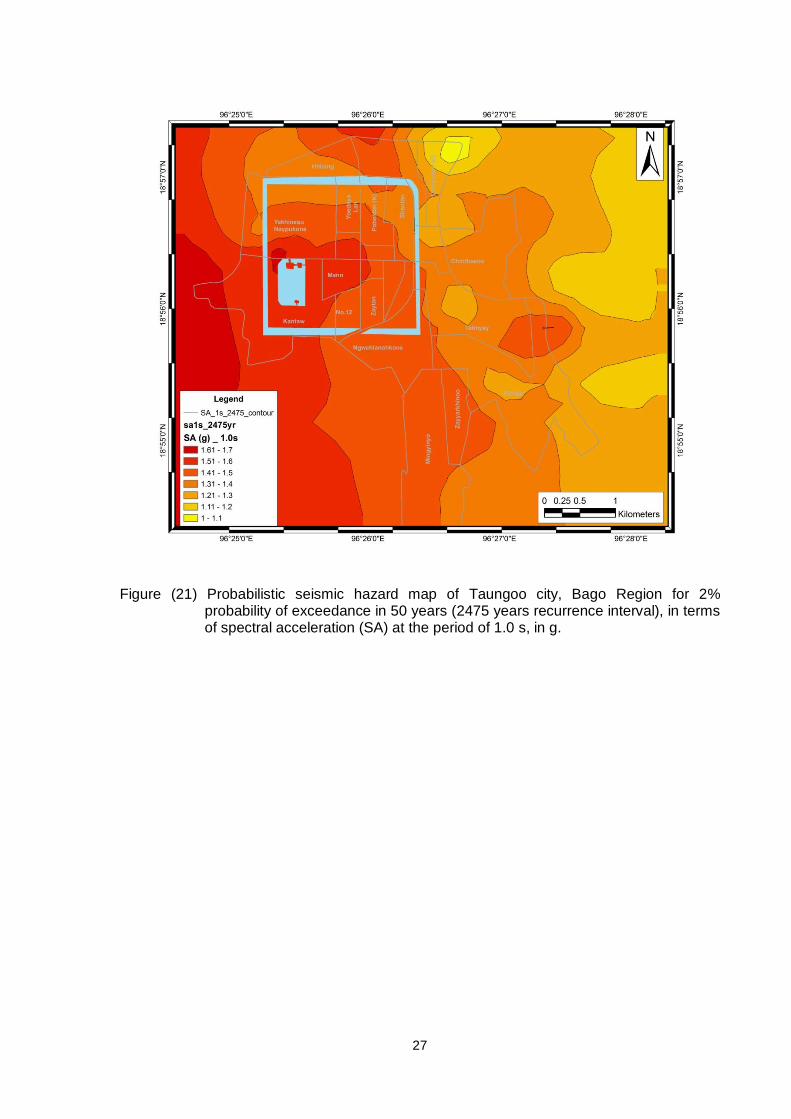
Probabilistic SA maps for the periods of 0.2 s, 0.3 s, and 1.0 s are illustrated in Figures (19-
21). The hazard distribution patterns of these ground motion parameters are also nearly the
same with those for 10% probability of exceedance in 50 years (475 years recurrence
interval). To develop the seismic resistance design for long term projects (buildings and
structures), the SA for 2475 years recurrence interval can be used for this city.
24
Figure (22) depicts the probabilistic PGV map of Taungoo and the maximum PGV level is
from 110 cm/s to 120 cm/s and the lowest level is 80 – 85 cm/s. However, the most parts of
the city is in high PGV level with the range of 100 cm/s to 115 cm/s.
Figure (18) Probabilistic seismic hazard map of Taungoo, Bago Region, for 2% probability of exceedance in 50 years (2475 years recurrence interval), in terms of peak ground acceleration (PGA) in g.
25
Figure (19) Probabilistic seismic hazard map of Taungoo city, Bago Region for 2% probability of exceedance in 50 years (2475 years recurrence interval), in terms of spectral acceleration (SA) at the period of 0.2 s, in g.
26
Figure (20) Probabilistic seismic hazard map of Taungoo city, Bago Region for 2% probability of exceedance in 50 years (2475 years recurrence interval), in terms of spectral acceleration (SA) at the period of 0.3 s, in g.
27
Figure (21) Probabilistic seismic hazard map of Taungoo city, Bago Region for 2% probability of exceedance in 50 years (2475 years recurrence interval), in terms of spectral acceleration (SA) at the period of 1.0 s, in g.

28
Figure (22) Probabilistic seismic hazard map of Taungoo city, Bago Region for 10% probability of exceedance in 50 years (475 years recurrence interval), in terms of peak ground velocity (PGV), in cm/s.
29
5 DISCUSSION AND RECOMMENDATION
With the aids of UNHABITAT, Myanmar Earthquake Committee (MEC), Myanmar
Geosciences Society (MGS) and Myanmar Engineering Society (MES) carry out the seismic
hazard and risk assessment for three cities: Sagaing City (Sagaing Region), and Bago and
Taungoo Cities (Bago Region). This report is prepared for the probabilistic seismic hazard
maps of Taungoo. While MES develops the seismic risk maps of Taungoo, MEC and MGS
develop the seismic hazard maps of the city by using the probabilistic seismic hazard
assessment methodology (PSHA). We construct the seismic hazard maps of Taungoo for
475 years recurrence interval (10% probability of exceedance in 50 years) and 2475 years
recurrence interval (2% probability of exceedance in 50 years. The hazard maps include
probabilistic peak ground acceleration (PGA) map, spectral acceleration (SA) maps of 0.2 s,
0.3 s and 1.0 s, and peak ground velocity (PGV) maps. There are, therefore, five seismic
hazard maps for each recurrence interval level.
Instead of all seismic hazard maps, the discussion will mainly concern to PGA ground
motion level of the city, for both 475 years and 2475 years recurrence intervals. For 475
years recurrence interval, the PGA level of the city is in the range of 0.5 g to 0.6 g.
Therefore, it can be regarded as the city is in severe zone of perceived shaking, moderate to
heavy zone of potential damage, and instrumental intensity zone VIII. However, for 2475
years recurrence interval, the PGA level of most parts of the city is in the range of 0.8 g to
0.95 g. It means that the city comprises the violent zone of perceived shaking, heavy zone of
potential damage, and IX zone of instrumental intensity.
The seismogenic source that can mainly contribute the seismic hazard to Taungoo city is the
right-lateral, strike-slip Sagaing Fault located about 15 km in the west of the city. Therefore,
the seismic hazard level is increasing towards the western part of the city. This is the key
point to be considered for land-use planning or urban development.
We develop the seismic hazard maps of Taungoo city by using the current available data
such as the seismic sources data, and site data, etc. However, it is needed to update and
modify these maps based on the availability of more data, especially on the seismic sources
data such as the active fault data, paleoseismological data, etc. These maps can be used for
developing the seismic resistance designs of buildings, structures, infrastructures for certain
projects. But it should be noted that it is need to adjust what hazard maps, i.e. the different
recurrence interval level (either 475 years recurrence level or 2475 years recurrence level)
should be used based on the projects purposes. However, all maps can be used for
earthquake disaster preparedness purposes.

30
For special or major project, it might be needed to conduct the site specific seismic hazard
analysis for that site or location.

31
Bibliography
Aki, K. 1965. Maximum likelihood estimate of b in the formula log N = a-bm and its
confidence limits, Bull. Earthq. Res. Inst., Univ. Tokyo, 43, 237-239.
Ambraseys, N. N. 1988. Magnitude – Fault Length Relationships for Earthquakes in the
Middle East, In: Lee, W.H., Meyers, H. & Shimazaki, K. eds, Historical Seismograms
and Earthquakes of the World, Acad. Press Inc., 309-310.
Atkinson, G. M. 1984. Attenuation of Strong Ground Motion in Canada from a Random
Vibrations Approach, Bulletin of the Seismological Society of America, Vol. 74. No.
6, pp. 2629-2653
Bender, F., 1983, Geology of Burma. 225p.
Boore, D.M., Joyner, W.B., and Fumal, T.E. 1997. Equations for Estimating Horizontal
Response Spectra and Peak Acceleration from Western North American
Earthquakes: A Summary of recent Work, Seismological Research Letters, Vol. 68,
No. 1, 128-153. (http://iisee.kenken.go.jp/ eqflow/reference/ 1 12.htm
Cornell, C. A. 1968. Engineering Seismic Risk Analysis, Bulletin of the Seismological Society
of America, Vol. 58, 1583-1606.
Gutenberg, B., and Richter, C. F. 1944. Frequency of Earthquakes in California, Bulletin of
the Seismological Society of America, 34: pp. 185-188.
International Seismological Centre (ISC), 2011, On-line Bulletin, Internat. Seis. Cent.,
Thatcham, United Kingdom, http://www.isc.ac.uk/Bull.
Khin Thet Swe and Myo Thant, 2012. Probabilistic Seismic Hazard Maps of Bago Region,
Myanmar, 1st International Conference on Regional Geology, Stratigraphy and
Tectonics of Myanmar and Neighboring Countries and Economic Geology
(Petroleum and Mineral Resources) of Myanmar
Khin Thet Swe, 2012. Seismic Hazard Assessment of Bago Region by using Probabilistic
Seismic Hazard Analysis (PSHA). Department of Geology, Yangon University. 16-18
p.
Kijko, A. 2004. Estimation of the Maximum Earthquake Magnitude, mmax, Pure and Applied
Geophysics, Vol.161, No.8. pp. 1655-1681.
McGuire, R. K. 1976. Fortran computer program for seismic risk analysis, US. Geol. Surv.,
Open - File Rept 76-67, 90 pp.
32
Maung Thein and Tint Lwin Swe, 2005. The Seismic Zone Map of Myanmar, Myanmar
Earthquake Committee, Myanmar Engineer Society.
Myo Thant, 2010. Lecture Notes of Earthquake Engineering (Part-1). Department of
Engineering Geology, Yangon University. 32 p.
Myo Thant, Nwe Le′ Nge, Soe Thura Tun, Maung Thein,Win Swe and Than Myint, 2012.
Seismic Hazard Assessment Myanmar, Myanmar Earthquake Committee(MES),
Myanmar Geosciences Society(MGS).
Nwe Le′ Nge, 2010. Evaluation of Strong Ground Motion for the Central Portion of Yangon.
Department of Geology, Yangon University. 62 p.
Papazachos B. C., Scordilis E. M., Panagiotopoulos, D. G., Papazachos, C. B. and
Karakaisis G. F. 2004. Global Relations between Seismic Fault Parameters and
Moment Magnitude of Earthquakes, Proced. of 10th International Congress,
Thessaloniki, April, pp. 1482-1489. (in Appendix A)
Reiter, L 1990. Earthquake Hazard Analysis- Issues and Insights, Columbia University
Press, New York, 254pp.
San Shwe & Maung Thein, 2011. Seismic Microzones of Bago-Oakthar Myothit Area,
Journal of the Myanmar Geoscience Society, 66 p.
Steven L. Kramer, 1996. Geotechnical Earthquake Engineering, Civil Engineering and
Engineering Mechanics, University of Washington. 19-20, 45-50 p,595p.
United Nations, 1996. Geology and Mineral Resources of Myanmar. Economic and Social
Commission for Asia and the Pacific. 183 p.
Win Swe and Win Naing, 2008. Seismicity and Major Active Faults of Myanmar, Myanmar
Geoscience Society, Yangon, Myanmar.

33
APPENDICES

34
Appendix A
The maximum magnitude of earthquake potential expected to happen by fault specific
sources can be determined by using the following relationships of earthquake magnitude
and fault length.
Inoue et al., AIJ (1993); 0.5M = Log L + 1.9 (A-1)
Ambraseys’s equation (1988); Msc = 1.43 logL + 4.63 (A-2)
in which Msc is the expected surface wave magnitude and L is the fault length.
Mohammadioun & Serva (2001); Ms = 2 log L + 1.33 log ∆σ + 1.66 (A-3)
where, Ms is the surface wave magnitude, L is the fault rupture length (km) and ∆σ is the
stress drop released by the earthquake (in bars) that depends on the width of the faults and
type (kinematics) of the faults. Stress drop parameters for each fault are calculated by
applying the following relationships (Mohammadioun and Serva, 2001);
∆σN = 10.6 x W0.5 (A-4)
∆σSS = 8.9 x W0.8 (A-5)
∆σR = 4.8 x W1.6 (A-6)
in which ∆σN, ∆σSS and ∆σR are stress drop (in bars) for normal, strike-slip and reverse
faults and W is the fault width (km) which is also determined by utilizing the relation of fault
length and fault width; L = 2W (Bormann and Baumbach, 2000).
M = (LogL+6.4)/1.13 (Ambraseys and Zatopek, 1968) (A-7)
M = 2.0 log Lmax + 3.6 (Otsuka, 1964) (A-8)
M = 2.0 logLmax + 3.5 (Iida, 1965) (A-9)
M = 2.0 logLmax + 3.7 (Yonekura, 1972) (A-10)
in which L max is the maximum earthquake fault length,
M = 1.7 LogL + 4.8 (Matsuda, 1977) (A-11)
and, 0.5 M = Log L + 1.86 for oblique faults (A-12)
0.59 M = Log L + 2.3 for Strike slip faults (A-13)
(Papazachos et al., 2004)

35
Appendix B
The maximum magnitude of the earthquake potentials which can be originated from all areal
seismic sources are determined by using the relationship of Kijko (2004);
)exp()}]exp(/{)}()([{ min22211maxmax nmnnEnEmm obs (B-1)
where, E1(z) = {(z2 + a1z + a2)/ [z (z2 + b1z + b2)]} exp (-z) (B-2)
n1 = n / {1 - exp [-β (mmax - mmin)]} (B-3)
n2 = n1 exp [-β (mmax - mmin)] (B-4)
in which n is the number of earthquakes greater than or equal mmin, a1 = 2.334733,
a2 = 0.250621, b1 = 3.330657, and b2 = 1.681534.
It must be noted that Equation 2.23 does not constitute a direct estimator for mmax since
expressions n1 and n2, which appear on the right-hand side of the equation, also contain
mmax. Generally the assessment of mmax is obtained by the iterative solution of Equation (B-
1).
However, when mmax- mmin ≤ 2, and n ≥ 100, the parameter mmax in n1 and n2 can be
replaced by mmax(obs), providing mmax estimator which can be obtained without iterations
(Kijko, 2004).
36
Appendix (C)
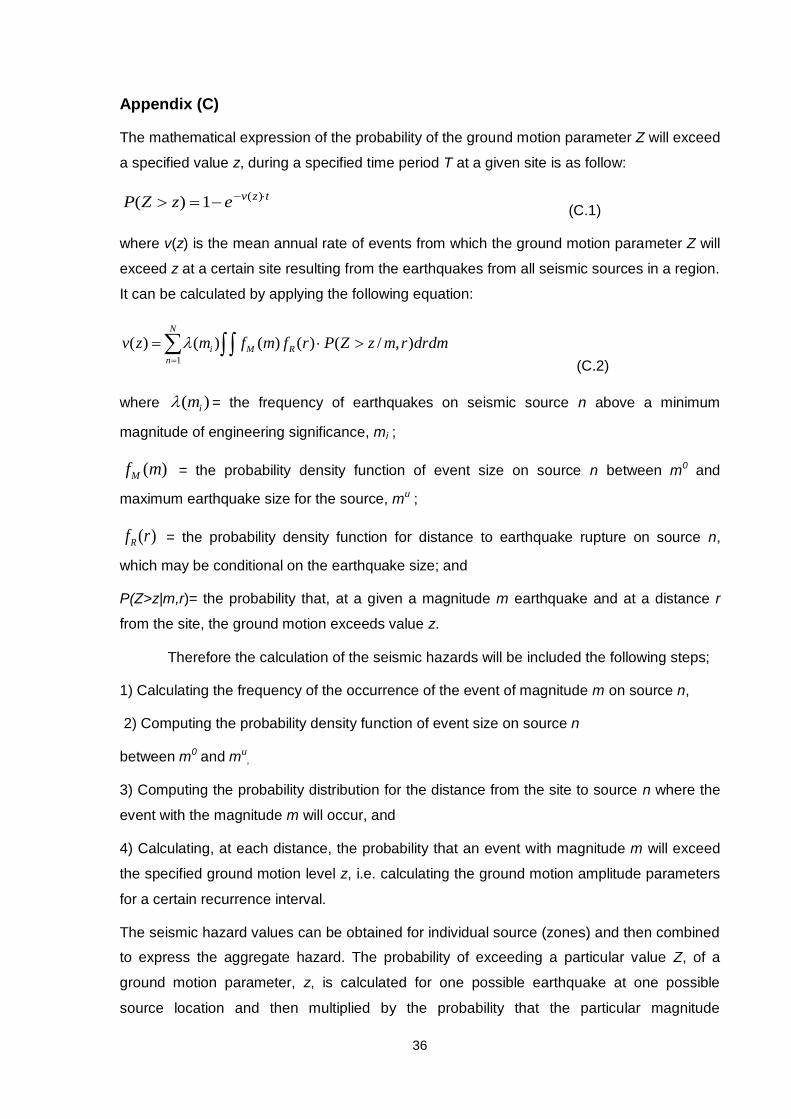
The mathematical expression of the probability of the ground motion parameter Z will exceed
a specified value z, during a specified time period T at a given site is as follow:
tzvezZP )(1)( (C.1)
where v(z) is the mean annual rate of events from which the ground motion parameter Z will
exceed z at a certain site resulting from the earthquakes from all seismic sources in a region.
It can be calculated by applying the following equation:
drdmrmzZPrfmfmzv RM
N
n
i ),/()()()()(1
(C.2)
where )( im = the frequency of earthquakes on seismic source n above a minimum
magnitude of engineering significance, mi ;
)(mfM = the probability density function of event size on source n between m0 and
maximum earthquake size for the source, mu ;
)(rfR = the probability density function for distance to earthquake rupture on source n,
which may be conditional on the earthquake size; and
P(Z>z|m,r)= the probability that, at a given a magnitude m earthquake and at a distance r
from the site, the ground motion exceeds value z.
Therefore the calculation of the seismic hazards will be included the following steps;
1) Calculating the frequency of the occurrence of the event of magnitude m on source n,
2) Computing the probability density function of event size on source n
between m0 and mu,
3) Computing the probability distribution for the distance from the site to source n where the
event with the magnitude m will occur, and
4) Calculating, at each distance, the probability that an event with magnitude m will exceed
the specified ground motion level z, i.e. calculating the ground motion amplitude parameters
for a certain recurrence interval.
The seismic hazard values can be obtained for individual source (zones) and then combined
to express the aggregate hazard. The probability of exceeding a particular value Z, of a
ground motion parameter, z, is calculated for one possible earthquake at one possible
source location and then multiplied by the probability that the particular magnitude
37
earthquake would occur at that particular location. The process is then repeated for all
possible magnitudes and locations, and then summed all of the probabilites on these
variables (Kramer, 1996).
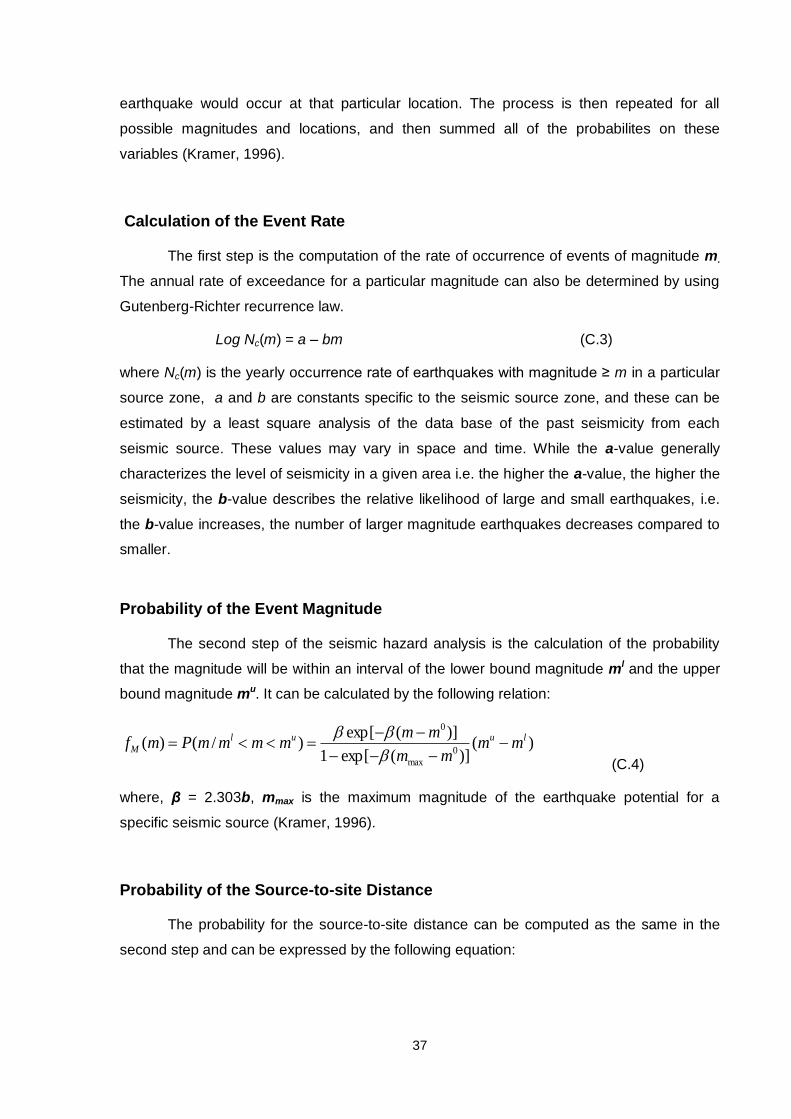
Calculation of the Event Rate
The first step is the computation of the rate of occurrence of events of magnitude m.
The annual rate of exceedance for a particular magnitude can also be determined by using
Gutenberg-Richter recurrence law.
Log Nc(m) = a – bm (C.3)
where Nc(m) is the yearly occurrence rate of earthquakes with magnitude ≥ m in a particular
source zone, a and b are constants specific to the seismic source zone, and these can be
estimated by a least square analysis of the data base of the past seismicity from each
seismic source. These values may vary in space and time. While the a-value generally
characterizes the level of seismicity in a given area i.e. the higher the a-value, the higher the
seismicity, the b-value describes the relative likelihood of large and small earthquakes, i.e.
the b-value increases, the number of larger magnitude earthquakes decreases compared to
smaller.
Probability of the Event Magnitude
The second step of the seismic hazard analysis is the calculation of the probability
that the magnitude will be within an interval of the lower bound magnitude ml and the upper
bound magnitude mu. It can be calculated by the following relation:
)()](exp[1
)](exp[)/()(
0
max
0luul
M mmmm
mmmmmmPmf
(C.4)
where, β = 2.303b, mmax is the maximum magnitude of the earthquake potential for a
specific seismic source (Kramer, 1996).
Probability of the Source-to-site Distance
The probability for the source-to-site distance can be computed as the same in the
second step and can be expressed by the following equation:
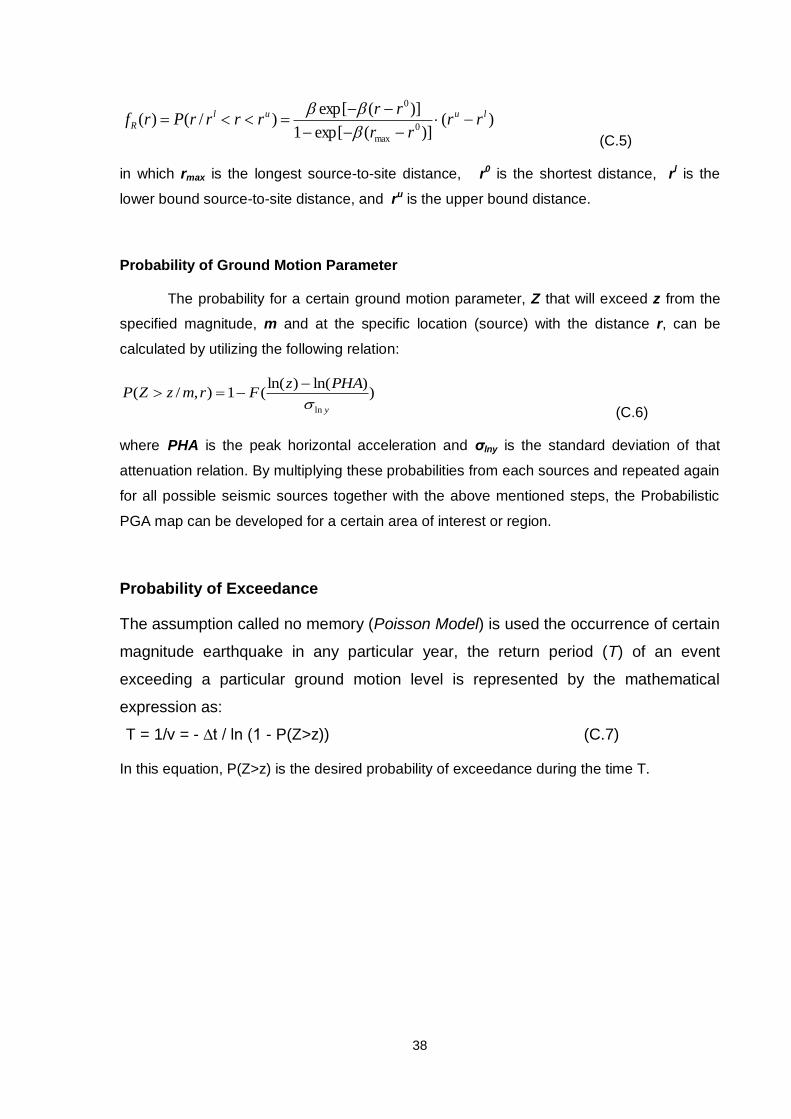
38
)()](exp[1
)](exp[)/()(
0
max
0luul
R rrrr
rrrrrrPrf
(C.5)
in which rmax is the longest source-to-site distance, r0 is the shortest distance, rl is the
lower bound source-to-site distance, and ru is the upper bound distance.
Probability of Ground Motion Parameter
The probability for a certain ground motion parameter, Z that will exceed z from the
specified magnitude, m and at the specific location (source) with the distance r, can be
calculated by utilizing the following relation:
))ln()ln(
(1),/(ln y
PHAzFrmzZP
(C.6)
where PHA is the peak horizontal acceleration and σlny is the standard deviation of that
attenuation relation. By multiplying these probabilities from each sources and repeated again
for all possible seismic sources together with the above mentioned steps, the Probabilistic
PGA map can be developed for a certain area of interest or region.
Probability of Exceedance
The assumption called no memory (Poisson Model) is used the occurrence of certain
magnitude earthquake in any particular year, the return period (T) of an event
exceeding a particular ground motion level is represented by the mathematical
expression as:
T = 1/v = - ∆t / ln (1 - P(Z>z)) (C.7)
In this equation, P(Z>z) is the desired probability of exceedance during the time T.
39
Appendix (D)
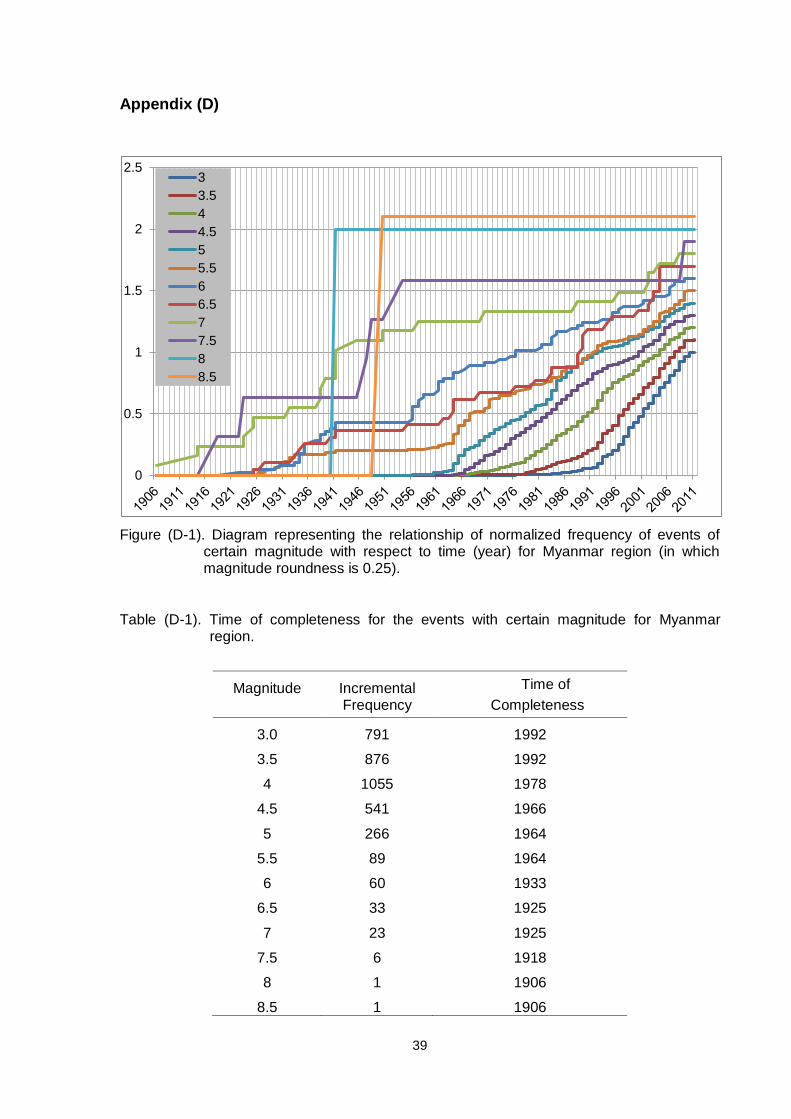
Figure (D-1). Diagram representing the relationship of normalized frequency of events of certain magnitude with respect to time (year) for Myanmar region (in which magnitude roundness is 0.25).
Table (D-1). Time of completeness for the events with certain magnitude for Myanmar region.
Magnitude Incremental Frequency
Time of
Completeness
3.0 791 1992
3.5 876 1992
4 1055 1978
4.5 541 1966
5 266 1964
5.5 89 1964
6 60 1933
6.5 33 1925
7 23 1925
7.5 6 1918
8 1 1906
8.5 1 1906
0
0.5
1
1.5
2
2.53
3.5
4
4.5
5
5.5
6
6.5
7
7.5
8
8.5
40
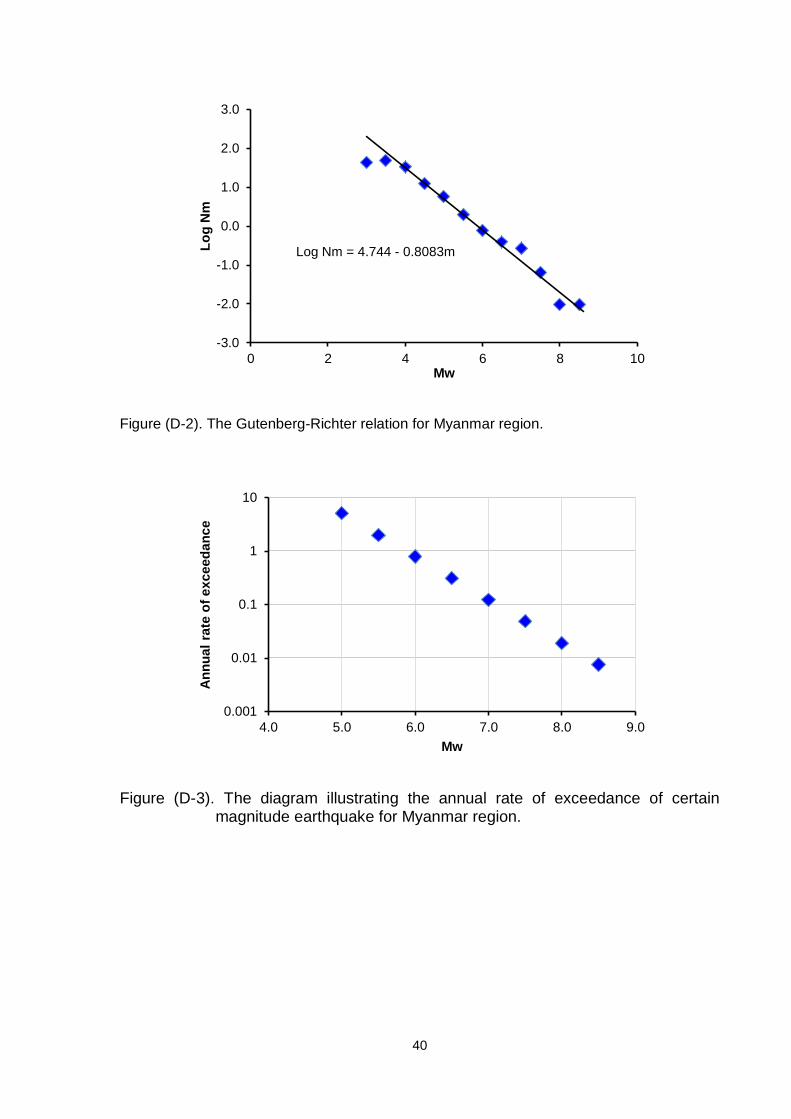
Figure (D-2). The Gutenberg-Richter relation for Myanmar region.
Figure (D-3). The diagram illustrating the annual rate of exceedance of certain magnitude earthquake for Myanmar region.
Log Nm = 4.744 - 0.8083m
-3.0
-2.0
-1.0
0.0
1.0
2.0
3.0
0 2 4 6 8 10
Lo
g N
m
Mw
0.001
0.01
0.1
1
10
4.0 5.0 6.0 7.0 8.0 9.0
An
nu
al
rate
of
ex
ce
ed
an
ce
Mw
41
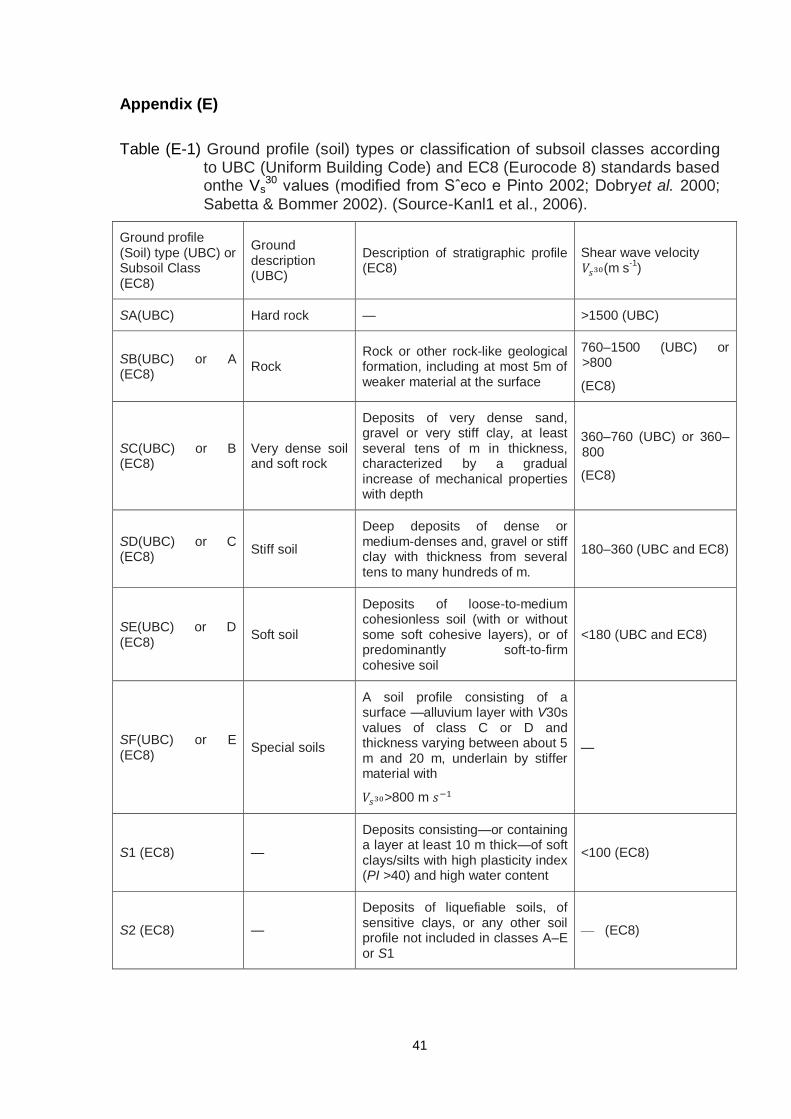
Appendix (E)
Table (E-1) Ground profile (soil) types or classification of subsoil classes according
to UBC (Uniform Building Code) and EC8 (Eurocode 8) standards based onthe Vs
30 values (modified from Sˆeco e Pinto 2002; Dobryet al. 2000; Sabetta & Bommer 2002). (Source-Kanl1 et al., 2006).
Ground profile (Soil) type (UBC) or Subsoil Class (EC8)
Ground description (UBC)
Description of stratigraphic profile (EC8)
Shear wave velocity (m s
-1)
SA(UBC) Hard rock — >1500 (UBC)
SB(UBC) or A (EC8)
Rock Rock or other rock-like geological formation, including at most 5m of weaker material at the surface
760–1500 (UBC) or >800
(EC8)
SC(UBC) or B (EC8)
Very dense soil and soft rock
Deposits of very dense sand, gravel or very stiff clay, at least several tens of m in thickness, characterized by a gradual increase of mechanical properties with depth
360–760 (UBC) or 360–800
(EC8)
SD(UBC) or C (EC8)
Stiff soil
Deep deposits of dense or medium-denses and, gravel or stiff clay with thickness from several tens to many hundreds of m.
180–360 (UBC and EC8)
SE(UBC) or D (EC8)
Soft soil
Deposits of loose-to-medium cohesionless soil (with or without some soft cohesive layers), or of predominantly soft-to-firm cohesive soil
<180 (UBC and EC8)
SF(UBC) or E (EC8)
Special soils
A soil profile consisting of a surface —alluvium layer with V30s values of class C or D and thickness varying between about 5 m and 20 m, underlain by stiffer material with
>800 m
—
S1 (EC8) —
Deposits consisting—or containing a layer at least 10 m thick—of soft clays/silts with high plasticity index (PI >40) and high water content
<100 (EC8)
S2 (EC8) —
Deposits of liquefiable soils, of sensitive clays, or any other soil profile not included in classes A–E or S1
— (EC8)
42
Photos of Borehole Drilling
43
Photos of microtremor surveying
44
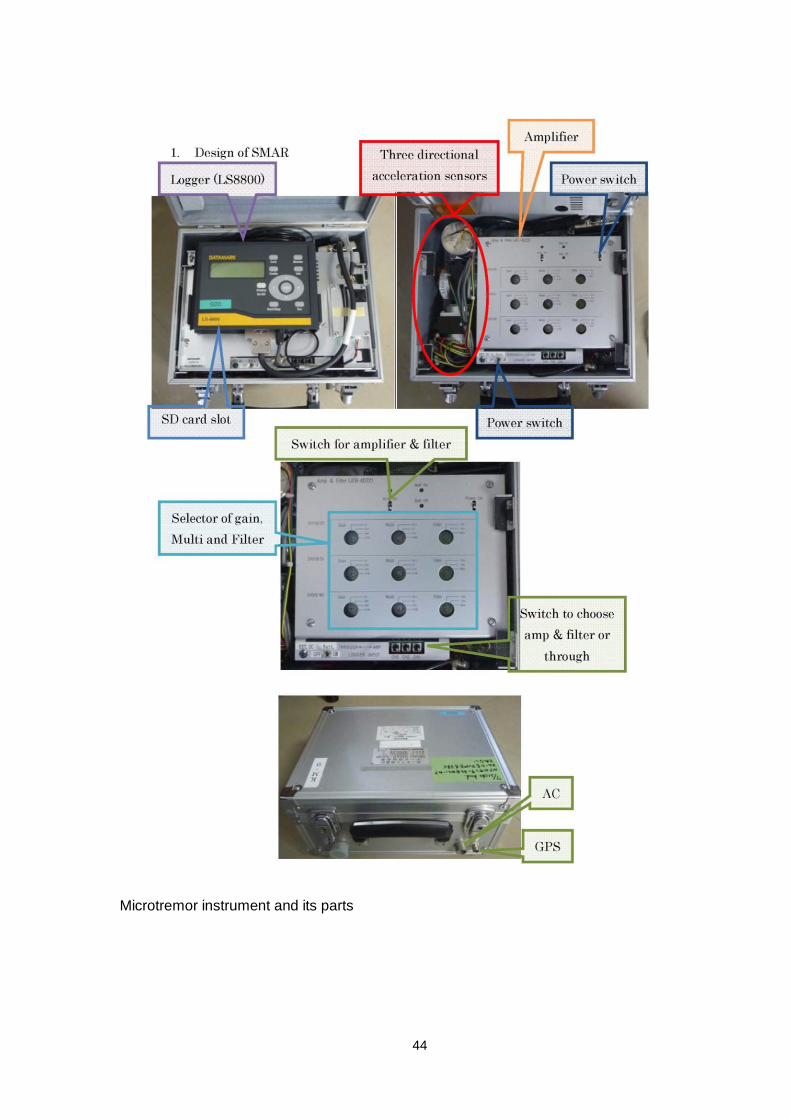
Microtremor instrument and its parts