Embed Size (px)
Citation preview

403
Developing Seller Experience at Online Marketplaces
Through Structured Data Driven Feedback Management
Systems.
Sudipto Dasgupta Specialist – Supply Chain Design
Flipkart Internet Pvt. Ltd. Bangalore, India
Sarvartha Kanchan Director – Supply Chain Design
Flipkart Internet Pvt. Ltd. Bangalore, India
sarvartha.kanchan@/flipkart.com
Abstract
While Ecommerce evolves in India at a disruptive speed, delivering a consistently good experience to sellers in an online marketplace platform is a big challenge. Policies such as leniency of returns and cash on delivery, environmental challenges such as technology costs, order cancellations and product damages, and cost of conducting business online add strategic complexity for the seller. In a competitive environment, measuring, managing and developing seller experience is critical for survival and growth of any ecommerce company. In this paper we discuss how experience for sellers in an online marketplace should be defined, measured and evolved through rigorous data driven feedback management systems. We explain I. structured approaches to collect and interpret voice of the seller, II. how to parametrize the inputs to create well defined metrics III. using ensemble machine learning methods, primarily decision forests to gain deeper insight into the mind of the seller, and IV. how to identify the vital few processes and parameters which when influenced, result in a positively differentiated seller experience.
Keywords: Logistics; E-commerce; machine learning; Survey

404
1. Introduction
1.1 Context India is the second most populous country in the world and home to 1.3 billion people. Amidst the diversity exists a
single common need for consumption despite lower per-capita purchasing power, and this makes India one of the most
attractive markets for ecommerce. According to a report by Forrester [1], India is set to become the fastest growing
market in the Asia-Pacific region. With the rapid penetration of mobile phones and evolving internet connectivity,
online sales in India has been predicted to grow by 500%, by 2020.
1.2 Business challenges faced by the seller Not everything is a bed of roses for online retailers in India, where a cash based culture poses a major hurdle to
business, along with unstructured logistics further weakened by challenging last mile connectivity. Internet
connectivity, though promising, is quite weak in most areas outside major cities. The frequent payment gateway
failures, coupled with a lack of trust in non-cash payment methods, put a lot of dependence on manual cash collection
which is error prone and does not scale well. Marketplace sellers are also affected as ecommerce firms gear up for the
long run with cuts in operational and warehousing cost while investing in and upgrading technology and merchandise.
1.3 Why we should listen to the seller Sellers frustrated with long standing unresolved issues have, in the past, reduced businesses with erstwhile partners,
some eventually leaving the platforms and migrating their businesses to other retailers. Given that one of the key
source of offerings for an ecommerce firm is the offerings of its suppliers, the firm suffers bigly if a strategic seller
moves over to a competitor, not only in terms of loss of revenues, but also in terms of loss of brand value as the news
spreads. In the past decade, there have been cases where thousands of veteran sellers have left a retailer within a short
time, and joined another ecommerce platform or opened their own platforms. Given that the cost of acquiring and
developing a seller is several times that of retaining an existing one, ecommerce companies take this very seriously.
1.4 The way forward The first step in developing seller experience is finding the right system to understand the mind of sellers. Once the
measurement system is in place, the online firms must launch programs to prioritize improvement of inside-out metrics
that have a direct impact on the drivers impacting seller experience. Our paper proposes a structured methodology utilizing multiple feedback collection and data mining techniques for a
parametric understanding and representation of seller experience at an online marketplace.
2. Hearing the voice of sellers There were several sources of information that were used to collect voice of sellers. The main source of
information was interactions directly with sellers. A slide from the high level project plan is given below:
Fig.2 High level plan for seller experience measurement and development project
2.1 Quota Sampling criteria

405
A seller sampling criteria [2][3] was developed using stratification factors such as
o load distribution,
o category of merchandise,
o location,
o asp (average sale price),
o dead weight distribution of shipments,
o volumetric weight distribution of shipments and
o distance of seller warehouse from hub.
2.2 Response collection modes The list of sellers was targeted for interviews through
o seller visits and telephone interviews(CATI) [3]. The questions were open ended, as we wanted sellers to
comment on their experience, whether positive or negative, freely. When the sellers had completed talking
about their experience, and if any major area such as seller service, policies, technical/platform related or
payments were missed, the interviewer would lightly ask the experience regard ing that area. The interviewers
were trained to be professional and not introduce confirmation bias by posing questions such as,” how
satisfied are you with….” Or “what problems are you facing with….”. o Another source of information was data collected via interactions with sellers, such as seller interacting with
the contact center for any issues, escalations or feedback.
o At one of our locations where seller density was high, we invited several sellers for a focus group discussion
[4] [5]. We had previously conducted an online Focus Group Discussion (FGD) with sellers, and the notes
of the discussion was an important source of information regarding seller experience for our research.
o We conducted a process FMEA to understand the failure modes in the process that can hamper seller
experience. This was from a Black Hat Thinking [10] perspective and ensured that we covered aspects which,
during a seller interview or FGD, normally may be overshadowed by other issues which are on the top of the
mind of seller(s).
o We also collected information from hub managers and logistics executives as these employees were directly
interacting with sellers on a daily basis.
o In some cases, we were not able to reach the seller for comments using any of these methods. In such
situations we sent emails and text messages to the registered email ID and phone number of the seller.
3. Measurement and Scaling As a start, we decided to use balanced scales for collecting responses, as that would provide more objectivity to
the data. If we would find that the distribution of responses is skewed in one direction, then we would skew the
scales accordingly in following surveys. Since we were interested in broad generalizations and group
comparisons, we kept 5 scale categories. If we were interested in individual responses and conducting correlation
analysis, we would have used a 7-point scale. Keeping the above factors in mind, and also the familiarity of the
sellers with surveys and the organization with conducting surveys, we decided to use th e following question types.
o The overall question, which would be the key business metric representing seller experience, would be
the NPS question [6][7]. We decided to place it at the beginning instead of the end as we wanted more
responses to this question than that of the others. A graphic from the site www. netpromotersystem.com
(Bain & Company) illustrates how a NPS (Net Promoter Score) is calculated from individual responses.
406
Fig.3. Calculating the NPS from responses
Also, we wanted the quantized top-of-the-mind perception rather than a well thought out score, which
would happen if the seller got more context by answering other questions [9].
o The body of the questionnaire would contain questions grouped by services, such as experience with
logistics, experience with payment systems and policies, experience with staff etc. The scale for these
questions would be 5-point Likert [6] [9] due to reasons discussed in the preceding paragraph.
o There would be additional questions which would be requirement based, which would have a
dichotomous scale in form of a check box depending on whether the seller used a particular service or
whether he/she faced a very specific issue.
o Classification questions such as location, category of business etc., would not be required as the email
ID on which the survey was to be sent is unique to a seller and this can be used as a key to extract
information from our internal databases. An open comment question would be placed at the end to
capture any additional feedback that does not fit into the format of the rest of the questionnaire.
4. Survey Questionnaire Design
4.1 Structure and purpose The questionnaire was mostly structured, except the last question, which had an open ended text comment. The
questions we asked ourselves before converting a feedback from seller to a question in the survey were:
o Does the question convey our intent?
o Is there a possibility of the ques tion being interpreted otherwise?
o Is there an undertone, or a connotation (positive or negative) [12]?
o Can the question be phrased in a simpler way without losing interpretability?
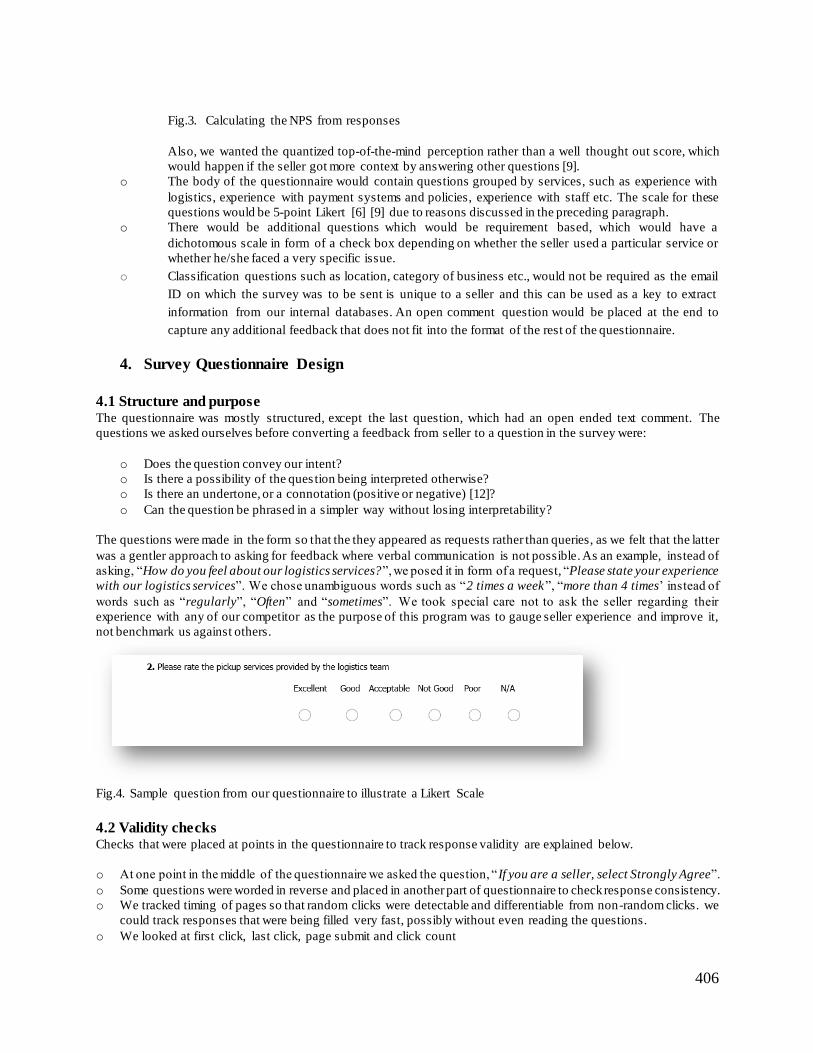
The questions were made in the form so that the they appeared as requests rather than queries, as we felt that the latter
was a gentler approach to asking for feedback where verbal communication is not possible. As an example, instead of
asking, “How do you feel about our logistics services?”, we posed it in form of a request, “Please state your experience
with our logistics services”. We chose unambiguous words such as “2 times a week”, “more than 4 times’ instead of
words such as “regularly”, “Often” and “sometimes”. We took special care not to ask the seller regarding their
experience with any of our competitor as the purpose of this program was to gauge seller experience and improve it,
not benchmark us against others.
Fig.4. Sample question from our questionnaire to illustrate a Likert Scale
4.2 Validity checks Checks that were placed at points in the questionnaire to track response validity are explained below.
o At one point in the middle of the questionnaire we asked the question, “If you are a seller, select Strongly Agree”.
o Some questions were worded in reverse and placed in another part of questionnaire to check response consistency.
o We tracked timing of pages so that random clicks were detectable and differentiable from non-random clicks. we
could track responses that were being filled very fast, possibly without even reading the questions.
o We looked at first click, last click, page submit and click count

407
We collected and analyzed global and local IP addresses of machines used to respond to the survey for duplicate
entries. This helped us keep a check on multiple responses from a single seller.
4.3 Logical structure of questionnaire We chose not to randomize response choices or question order so that the flow of the questionnaire was intact. The
questionnaire was structured as a decision tree, with overall experience being the root node.
The branches were the main categories of experience, the leaves of which were on Likert scale:
o pickups
o forward connect (post-pickup to delivery)
o platform (accounting, seller support, website/portal/phone apps)
o personnel
o policies
o reverse logistics (in case of returns)
A lot of growth is fueled by first time buyers, who have not yet made up their minds regarding what to expect from
ecommerce firms. Driven by hard selling ads, they suffer from buyer’s remorse and often return the go ods by the time
it is delivered. This adds expense in form of reverse logistics, coupled with the problem of high returns itself. This is
a major problem for sellers as they are caught between providing a competitive return policy and receiving unboxed
items, broken seals, damaged items and sometimes fake returns against valid products which they cannot sell anymore.
As this was a sensitive issue with almost all sellers, sections on return policies and experience with returns were
deliberately placed at the end of the survey.
There were other issues such as weight related escalations, damages, fraud and other miscellaneous items not covered
under the branches that were covered under a separate section with mostly dichotomous scales. At the end the open
comment question was placed to capture unstructured feedback.
5. Pre-test The questionnaire was sent via www.surveymonkey.com to a random sample of 2800 sellers that were chosen from
the seller population using the quota sampling [13] criteria defined during seller interviews. We visited some sellers
for a protocol analysis [11], which refers to understanding or thinking aloud while answering questions regarding past
events.
5.1 Validity and reliability analysis We noted the sellers’ emotional reactions to certain sections of the questionnaire , and later mapped it to the scores to
check consistency of responses and alignment with overall scores.
The responses obtained were carefully studied for capturing possibilit ies of misinterpretation caused by wording of
questions. We also studied the email open rate and response rate for gauging a reasonable response size from the final
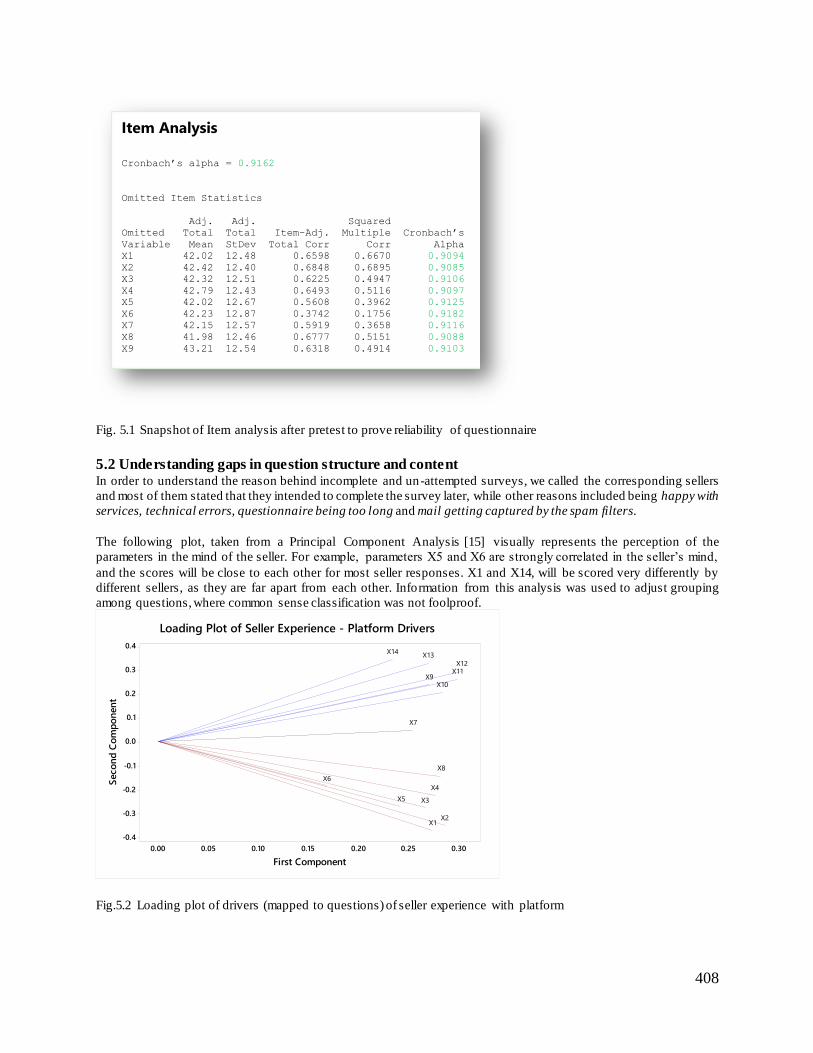
survey. An item analysis revealed Cronbach’s alpha [14] to be more than 0.7 for the current survey questions, thus
validating the consistency and inter-rater reliability hypothesis for the questionnaire structure.
408
Fig. 5.1 Snapshot of Item analysis after pretest to prove reliability of questionnaire
5.2 Understanding gaps in question structure and content In order to understand the reason behind incomplete and un-attempted surveys, we called the corresponding sellers
and most of them stated that they intended to complete the survey later, while other reasons included being happy with
services, technical errors, questionnaire being too long and mail getting captured by the spam filters.
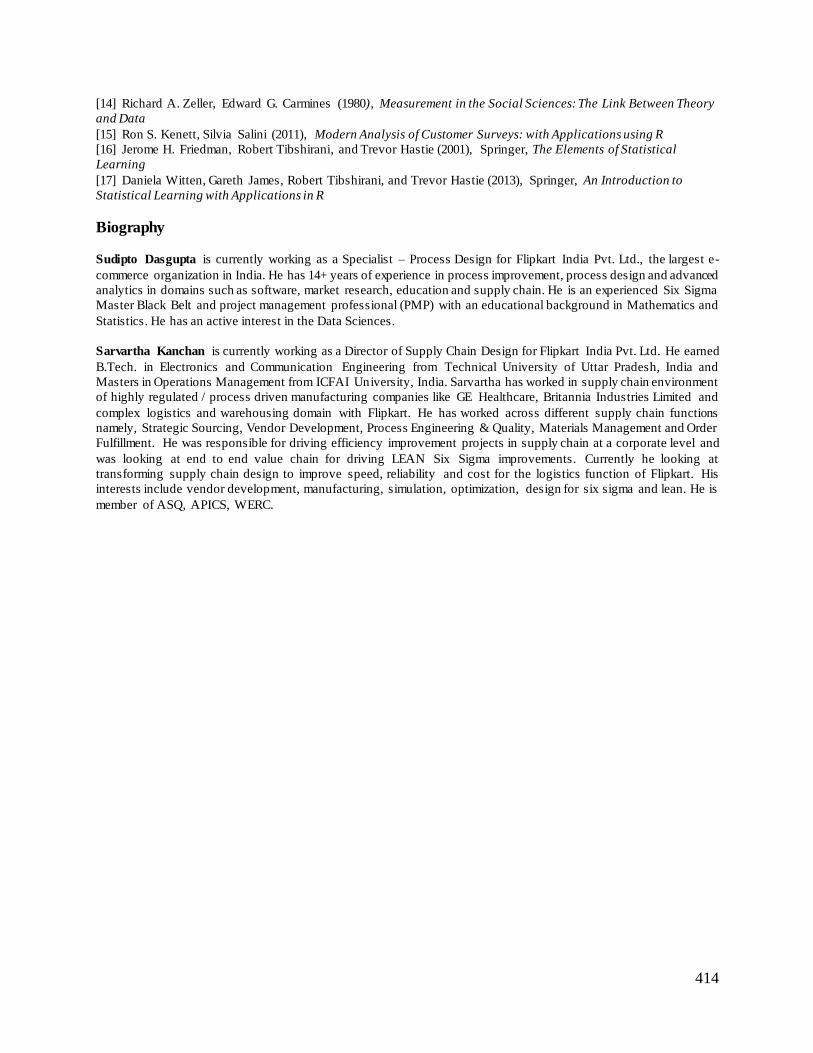
The following plot, taken from a Principal Component Analysis [15] visually represents the perception of the
parameters in the mind of the seller. For example, parameters X5 and X6 are strongly correlated in the seller’s mind,
and the scores will be close to each other for most seller responses. X1 and X14, will be scored very differently by
different sellers, as they are far apart from each other. Information from this analysis was used to adjust grouping
among questions, where common sense classification was not foolproof.
Fig.5.2 Loading plot of drivers (mapped to questions) of seller experience with platform
Item Analysis
Cronbach’s alpha = 0.9162
Omitted Item Statistics
Adj. Adj. Squared
Omitted Total Total Item-Adj. Multiple Cronbach’s
Variable Mean StDev Total Corr Corr Alpha
X1 42.02 12.48 0.6598 0.6670 0.9094
X2 42.42 12.40 0.6848 0.6895 0.9085
X3 42.32 12.51 0.6225 0.4947 0.9106
X4 42.79 12.43 0.6493 0.5116 0.9097
X5 42.02 12.67 0.5608 0.3962 0.9125
X6 42.23 12.87 0.3742 0.1756 0.9182
X7 42.15 12.57 0.5919 0.3658 0.9116
X8 41.98 12.46 0.6777 0.5151 0.9088
X9 43.21 12.54 0.6318 0.4914 0.9103
0.300.250.200.150.100.050.00
0.4
0.3
0.2
0.1
0.0
-0.1
-0.2
-0.3
-0.4
First Component
Seco
nd
Co
mp
on
en
t
X14X13
X12X11
X10X9
X8
X7
X6
X5
X4
X3
X2X1
Loading Plot of Seller Experience - Platform Drivers

409
5.3 Adjusting the questionnaire One important change we made from the earlier method is that we removed a ‘save for later’ option, stating on the
body of the email to be sent which would contain the link to the survey, that it took an average of 3 min utes to
complete the survey, and requested the seller to respond emphasizing that his/her feedback would be an important
factor in the decisions made regarding seller engagement policies. We realized that this would lead to some loss of
responses, but collecting complete responses would help us make better sense of the data. In any case, one of our
objectives from this survey was to understand parameter structure so that we could subsequently reduce the
questionnaire so as to ask only the most important 10-12 questions, down from the current size of 28 questions.
As the analysis revealed that the questionnaire was robust, we proceeded to the next step after minor changes to
some of the phrasing of the questions based on suggestions from certain sellers . We launched the survey on
September, 2015, via www.surveymonkey.com to sellers selected through quota sampling .
6. Analysis of Survey Responses
6.1 Initial reliability and validity checks The survey responses were subjected to a list of initial validity check as follows:
o Duplicate IP address check
o Duplicate seller ID, email ID or phone number from the respective fields
o Low fill time (anything less than 80s, based on study conducted during pre-test)
o Validity checks, as stated in section 4.2
We also subjected the valid responses, meaning those that passed the checks, to an item analysis, as we had done
before. The Cronbach’s alpha was again acceptable, meaning that the changes we made after pre -test were favorable
to the survey.
6.2 Cross-tabulations The response rate was slightly over 10%, considering valid responses only. Though the response distribution was
skewed considering the major classification factors, there was enough data in each homogeneous cluster to conduct
statistical analysis for deeper insights. Initial slice and dice provided scores for performance such as the one shown
below.
Fig. 6.2. Cross tabulation of zone wise overall satisfaction top box scores and response counts
6.3 Key Driver Analysis One of the most common and interpretable method of finding relative importance among predictors of the equation
𝑦 = 𝑓(𝑥1, 𝑥2, 𝑥3 … . . , 𝑥𝑛) is a technique commonly known in survey analysis as KDA (Key Driver Analysis) [9].
This technique primarily uses a General Linear Model to calculate coefficients of predictors in the equation stated
above. The response is the NPS and the predictors are scaled scores of responses to questions.

410
Fig.6.3 Logistic Regression [16] [17] to find significant variables, coefficients and ROC curve.
6.4 The IP Map The standardized values of the coefficients were used for weighing the importance of significant variables. Using
performance scores from the cross tabulation data and importance from the KDA, we constructed an Importance-
Performance map (also known as IP map) to visually represent priority of variables to invest development efforts
upon.
Fig. 6.4 Importance -Performance map to highlight priority actionable parameters
The priority was indicated by the color of the point representing the variable.
o Highest Priority (Red): These attributes have a low performance relative to their impact on overall
experience. Immediate improvements for these attributes should be made.
o Medium Priority (Yellow): These attributes have an appropriate performance level relative to their
impact on overall experience. In other words, if the impact is high, then the performance ratings are
also high, and vice versa. One should focus on these areas only if improvements can be made that are
easy and have very low costs.
o Lowest Priority (Green): These attributes have high performance ratings relative to their impact on
experience. It is also possible that more resources are being devoted to some of these attributes than is
necessary. It may be possible to shift some resources away from these attributes and toward the
highest priority attributes.
6.5 Modeling using Decision Tree method (CART)

411
As the previous analysis used a linear assumption regarding predictor-response relationships, we wanted to validate
the above hypothesis regarding the model using a non-linear multivariate analysis method. We used the Decision
Tree method commonly known as CART (Classification and Regression Trees) [16] [17]. We used a 70:30 training
to test split for cross validation of model.
An initial run using a classification tree with a Complexity Parameter of 0.01 and minbucket =5, yielded the
following plot. This further validated our findings from the KDA, in terms of importance, and in order. The
confusion matrix [16] [17] yielded a prediction accuracy of 73.67%.
Fig.6.5 Visualization of the Decision Tree and rules for evaluating a Confusion Matrix
6.6 Confirmation using a Random Forest method Though our model had been validated using linear and non-linear modeling methods, we wanted to test the
prediction accuracy using an extremely popular ensemble method, and a type of decision forest, commonly known
as Random Forest [16] [17], in Machine Learning parlance.
Using the same training/test ratios on the response data, we conducted a random forest analysis using 200 decision
trees with nodesize= 25. We found that the tree averaging, instead of a single decision tree as used in the earlier
method, gave a higher prediction accuracy of 77% as calculated from the confusion matrix. This was subjected to a
k-fold cross validation with k as 5, for ensuring stability of the model.
We concluded that the IP map, though assuming a Linear Model, was reasonably successful in generating an
actionable insight. All the modeling methods also gave us information regarding statistically significant and
important variables and those that were redundant, or correlated enough so that one of them could be removed.
6.7 Comment analysis Comments are an extremely important source of information, as due to its lack of structure, it can capture feedback
that is not possible to obtain from other methods. Here are some of the ways we utilized the comments:
o Created a word cloud to identify recurring keywords. The output generated, as shown below, agreed
with our findings from the modeling exercise. Some terms such as pickup time, returns, damages and
weight were expected as the most important issue was product returns and its associated problems such
as damages and return (delivery) times.
o For responses with NPS below 7 (detractors) we read every comment so as to have a deeper
understanding of the problem. We alerted the ground staff and other associated staff such as seller
support, claims department etc. to address this promptly and close the issue. o Some issues were regional in nature, which were caused by the business environment, natural causes,
and in certain cases, state or central government policies. We made a note of such cases, and initiated
separate, long term programs to either address these directly, or look for work-arounds. With new
policies, such as GST, some of these problems will be solved automatically.

412
Fig. 6.7 Word cloud of comments from survey responses
7. Conclusion
7.1 Next steps Now that we had a robust insight into the mind of the seller regarding how he/she perceived the relationship
parameters, we presented our findings to the senior management. Over a period of time, response teams were
created to handle strategic and tactical issues.
o For tactical issues, the ground staff and seller support were included , as they were the first point of
contact for the seller and were equipped to handled transactional issues.
o Key drivers were mapped to internal parameters, such as delivery time (seller perception) mapped to
logistics promise (Internal business metric). Such metrics were then prioritized by senior managers,
and included in key performance criteria for employees throughout the company. By linking the key
metrics to employee performance, the organization made employees at all levels responsible for seller
development.
o Strategic projects included change in process design, such as completely re-thinking the reverse leg of
logistics, having more tie ups with third party logistics services and investing in technology in these
areas.
o With the insight from the survey analysis, we prioritized questions from the survey. Some issues such
as those with seller support were discussed with the respective teams. They initiated their own
feedback and research programs, and went on to initiate strategic programs to improve seller
experience. The responses were skewed and the primary reason was selective participation of sellers.
The new systems being built have technology in place to enjoy better reach, as surveys are now
conducted on the hand held devices and seller portals where reminders and alerts help increase
participation.
We removed several questions which were not significant or of low importance, and reduced the questionnaire size
and incorporated skip and branch logic, as shown in the map below. This questionnaire was used to gauge seller
experience in the subsequent surveys.

413
Fig.7.1 The survey, redesigned with inputs from analysis of the previous survey
7.2 Business impact It has been more than a year since the seller experience development initiative was launched. Sellers have greatly
benefitted from this program and NPS has scaled heights no other ecommerce organization in India has ever
touched. Seller centricity is on its way to becoming an important part of the organizational culture. With better
processes in place, benefits have come in terms of increased business and understanding with the sellers.
References [1] www.forrester.com (March 2016). Asia Pacific Ecommerce Market to Reach Us$1.4 Trillion in 2020
[2] Floyd J. Fowler (2009) Section 3, Survey Research Methods. Sage, UK
[3] James M. Lepkowski1, Clyde Tucker, J. Michael Brick, Edith D. de Leeuw, Lilli Japec, Paul J. Lavrakas,
Michael W. Link and Roberta L. Sangster (March 2007), CATI Sample Management Systems
[4] Monique M. Hennink (Dec 2013), Focus Group Discussions
[5] Morgan, D.L. (1988) Focus Group as qualitative research . Sage, UK
[6] Duane R. Monette, Thomas J. Sullivan, Cornell R. (Mar 2010), Ch.13, Applied Social Research: A Tool for the
Human Services
[7] Frederick F. Reichheld (Harvard Business Review, Dec 2003), The One Number You Need to Grow
[8] Frederick F. Reichheld (Harvard Business School Press, 2006), The Ultimate Question: Driving Good Profits
and True Growth
[9] Derek R. Allen, Danica R. Allen, Tanniru R. Rao (Jan 2000), ASQ Quality Press, Analysis of Customer
Satisfaction Data: A Comprehensive Guide to Multivariate Statistical Analysis in Customer Satisfaction, Loyalty,
and Service Quality Research
[10] Edward De Bono (2010) Penguin, Six Thinking Hats
[11] Thomas B. Jabine (Jan 1984), Cognitive Aspects of Survey Methodology: Building a Bridge Between
Disciplines: Report of the Advanced Research Seminar on Cognitive Aspects of Survey Methodology
[12] Design, Evaluation, and Analysis of Questionnaires for Survey Research (Jul 2007), Wiley,
Willem E. Saris, Irmtraud N. Gallhofer
[13] Ken Black (2011), Business Statistics: For Contemporary Decision Making
1. NPS
2. Rate Pickup Sat
3. Rate Return Sat
Rating 8 or below
5. Open Ended Comments
Rating 9 or 10
Seller Experience Survey - September 2015
2.1. Pickup Slot Adherence
2.2. Scanning & Forward connect
2.3. Partial/Complete pickups
Rating 3 or below
3.1. Quality of Return Shipments
3.2 Other Issues Time to receive returns
Damages/Handling issues
Mis-shipments
Fake/Fraud
Rating 3 or below
4. Additional Issues Weight Related
Upcoming Tab
Inconvenient Pickup Slot
Start
Stop
414
[14] Richard A. Zeller, Edward G. Carmines (1980), Measurement in the Social Sciences: The Link Between Theory
and Data
[15] Ron S. Kenett, Silvia Salini (2011), Modern Analysis of Customer Surveys: with Applications using R
[16] Jerome H. Friedman, Robert Tibshirani, and Trevor Hastie (2001), Springer, The Elements of Statistical
Learning
[17] Daniela Witten, Gareth James, Robert Tibshirani, and Trevor Hastie (2013), Springer, An Introduction to
Statistical Learning with Applications in R
Biography
Sudipto Dasgupta is currently working as a Specialist – Process Design for Flipkart India Pvt. Ltd., the largest e-
commerce organization in India. He has 14+ years of experience in process improvement, process design and advanced
analytics in domains such as software, market research, education and supply chain. He is an experienced Six Sigma
Master Black Belt and project management professional (PMP) with an educational background in Mathematics and
Statistics. He has an active interest in the Data Sciences.
Sarvartha Kanchan is currently working as a Director of Supply Chain Design for Flipkart India Pvt. Ltd. He earned
B.Tech. in Electronics and Communication Engineering from Technical University of Uttar Pradesh, India and
Masters in Operations Management from ICFAI University, India. Sarvartha has worked in supply chain environment
of highly regulated / process driven manufacturing companies like GE Healthcare, Britannia Industries Limited and
complex logistics and warehousing domain with Flipkart. He has worked across different supply chain functions
namely, Strategic Sourcing, Vendor Development, Process Engineering & Quality, Materials Management and Order
Fulfillment. He was responsible for driving efficiency improvement projects in supply chain at a corporate level and
was looking at end to end value chain for driving LEAN Six Sigma improvements. Currently he looking at
transforming supply chain design to improve speed, reliability and cost for the logistics function of Flipkart. His
interests include vendor development, manufacturing, simulation, optimization, design for six sigma and lean. He is
member of ASQ, APICS, WERC.