Embed Size (px)
Citation preview
DEVELOPMENT AND CHARACTERIZATION OF STABLE GLYCOENZYME
CONJUGATES
A Dissertation
by
DUSTIN WAYNE RITTER
Submitted to the Office of Graduate and Professional Studies of
Texas A&M University
in partial fulfillment of the requirements for the degree of
DOCTOR OF PHILOSOPHY
Chair of Committee, Michael J. McShane
Committee Members, Kenith E. Meissner
Melissa A. Grunlan
Christie M. Sayes
Head of Department, Gerard L. Coté
December 2014
Major Subject: Biomedical Engineering
Copyright 2014 Dustin Wayne Ritter
ii
ABSTRACT
Optical glucose biosensors are being developed for long-term monitoring in
diabetic individuals. These sensors rely upon the enzyme glucose oxidase, and loss of
enzymatic activity leads to a need for frequent recalibration and eventually sensor
replacement. Current enzyme stabilization strategies are effective, but generally result in
a large increase in size and exclusion from the solution-phase. This sacrifice of native
properties precludes the stabilized enzyme from incorporation into the aforementioned
sensing platform, which requires that the enzyme be homogenously distributed and
entrapped within a hydrogel. It is this incompatibility which provides the motivation for
the development of new non-traditional enzyme stabilization strategies.
Toward that end, this work focuses on the development and characterization of
three enzyme modification strategies, all of which are intended to stabilize enzyme
activity while permitting incorporation into an optical biosensing hydrogel. The first
approach involves glycosylation site-targeted covalent attachment of poly(ethylene
glycol) to glucose oxidase, which improves storage stability by 60%. The second
approach builds upon the first, but subsequent modification of the poly(ethylene glycol)-
modified glucose oxidase is performed to further stabilize the enzyme. This approach
improves long-term storage stability by an order of magnitude. The final approach
involves encasement of the glycoenzyme within a shell of albumin, wherein the inert
protein is attached at the glycosylation sites in an orthogonal manner. This technique
iii
result in highly thermostable enzyme, retaining greater than 25 times more activity than
native glucose oxidase following exposure to buffer at 60 °C.
In summary, enzyme deactivation is expected to be a major barrier in the
realization of long-term glucose sensing with fully implantable optical glucose
biosensors, and this work represents a step towards overcoming that hurdle. Each
enzyme modification strategy yields a stabilized enzyme under certain conditions,
whether it be long-term storage, elevated temperature, or exposure to various
solvents/additives. This work enables the stabilized enzymes to be incorporated into
hydrogels for evaluation under simulated in vivo conditions, followed by in vivo
evaluation. Finally, it is expected that these enzyme stabilization approaches will be
advantageous in other applications as well, including in vitro diagnostics, tissue
engineering, and therapeutic biologicals.

iv
DEDICATION
I would like to dedicate this work to my amazing wife, Sarah, for her patience,
love, and tireless support—especially through the tougher times of graduate school! I
feel so lucky to have had someone by my side who experienced everything in parallel
with me. I am sure that I would not be who I am today if she was not in my life. As this
chapter of our lives comes to a close, I look forward to the future that we will make
together.
v
ACKNOWLEDGEMENTS
I would like to thank my committee chair, Dr. Michael McShane, for fostering
my interest in biomedical research when I was an undergraduate student and for helping
me grow as an independent researcher. Dr. McShane also taught me what it means to be
driven toward a goal. I am grateful to my committee members, Dr. Kenith Meissner, Dr.
Melissa Grunlan, and Dr. Christie Sayes, for their guidance and support throughout the
course of this research. I would also like to thank Dr. Gerard Coté and Dr. Kristen
Maitland for their mentorship and their role in my starting down a path toward
improving global health; also, thanks to Dr. Coté for keeping Sarah and I company in
Rwanda for a month! Dr. Duncan Maitland and Dr. Saurabh Biswas are acknowledged
for their valuable advice and mentorship along the way. Finally, thanks to the rest of the
awesome faculty and staff of the Biomedical Engineering Department.
I’ve had the opportunity to work alongside so many great researchers, and for
that, I am so very grateful. As an undergraduate student, I worked in Dr. McShane’s lab
under the mentorship of Dr. Erich Stein; this early experience taught me a great deal
about research and heavily influenced my decision to pursue a doctoral degree. During
my first few years of graduate school, I continued to learn from the more senior students,
particularly Dr. Huiguang Zhu and Dr. Saurabh Singh. However, all of the members of
the McShane group—past and present—are acknowledged for enriching my experience
at Texas A&M University. In particular, I would like to thank Dr. Jason Roberts and
Jared Newton, both of whom have made significant contributions toward the completion
vi
of this work. Jason is acknowledged for his part in the concept generation of BSA-GOx,
as well as the planning and completion of some of the PEG-GOx and BSA-GOx work.
Jared has performed or assisted in the completion of a number of the experiments
included throughout this work.
Dr. Larry Dangott, Director of the Protein Chemistry Laboratory at Texas A&M
University, is gratefully acknowledged for providing technical expertise, comments, and
suggestions. I would also like to thank the team at Spectrum Labs, specifically Cassidy
Markee, for “going the extra mile” to provide the experimental apparatus which
permitted completion of the glucose exposure experiments.
I would like to extend my heartfelt gratitude to the National Science Foundation
for providing me with funding in the form of a Graduate Research Fellowship. I also
wish to acknowledge the Dwight Look College of Engineering at Texas A&M
University for support through the Barclay/Willson National Excellence Fellowship.
Finally, I could not have made it to this point without a strong support system of
family and friends. In particular, I would like to thank my mother and father for their
guidance, support, and encouragement in everything I have done. Early on, they made
my education a priority, which helped me to recognize its importance, and for that I am
very grateful.

vii
NOMENCLATURE
AG Albuminated glycoenzyme
BMPH N-(β-maleimidopropionic acid) hydrazide
BSA Bovine serum albumin
BSA-Cat Bovine serum albumin-modified catalase
BSA-GOx Bovine serum albumin-modified glucose oxidase
Cat Catalase
CLEA Crosslinked enzyme aggregate
CLEC Crosslinked enzyme crystal
DLS Dynamic light scattering
DMSO Dimethyl sulfoxide
EtOH Ethanol
FAD Flavin adenine dinucleotide
GA Glutaraldehyde
GFC Gel filtration chromatography
GOx Glucose oxidase
MALDI-TOF Matrix-assisted laser desorption/ionization time-of-flight
PBS Phosphate-buffered saline
PEG Poly(ethylene glycol)
PEG-GOx PEGylated glucose oxidase
PEG-Hz Hydrazide-functionalized poly(ethylene glycol)
viii
pHEMA Poly(2-hydroxyethyl methacrylate)
pHEMA-co-AAm Poly[(2-hydroxyethyl methacrylate)-co-acrylamide]
pHEMA-co-AEMA Poly[(2-hydroxyethyl methacrylate)-co-(2-aminoethyl
methacrylate)]
ix
TABLE OF CONTENTS
Page
ABSTRACT .......................................................................................................................ii
DEDICATION .................................................................................................................. iv
ACKNOWLEDGEMENTS ............................................................................................... v
NOMENCLATURE .........................................................................................................vii
TABLE OF CONTENTS .................................................................................................. ix
LIST OF FIGURES ..........................................................................................................xii
LIST OF TABLES .........................................................................................................xvii
1. INTRODUCTION .......................................................................................................... 1
2. BACKGROUND ............................................................................................................ 5
2.1. Current Enzyme Stabilization Strategies................................................................. 5
2.1.1. Immobilization ................................................................................................. 5 2.1.1.1. Carrier-Bound Techniques ........................................................................ 6
2.1.1.1.1. Covalent Attachment to Carrier ......................................................... 6
2.1.1.1.2. Electrostatic Attachment to Carrier .................................................... 7 2.1.1.1.3. Physical Adsorption to Carrier ........................................................... 7
2.1.1.2. Carrier-Free Techniques ............................................................................ 8 2.1.1.2.1. Crosslinked Enzyme Crystals............................................................. 9
2.1.1.2.2. Crosslinked Enzyme Aggregates ..................................................... 10 2.1.1.3. Physical Entrapment ................................................................................ 11 2.1.1.4. Gel Formation ......................................................................................... 11
2.1.2. PEGylation ..................................................................................................... 12 2.2. Enzymes Employed in Glucose Biosensors .......................................................... 13
2.2.1. Glucose Oxidase ............................................................................................. 13 2.2.2. Catalase .......................................................................................................... 14
2.2.3. Enzyme Inactivation ....................................................................................... 15
3. GLYCOSYLATION SITE-TARGETED PEGYLATION OF GLYCOENZYME .... 18
3.1. Introduction ........................................................................................................... 18
x
3.2. Experimental ......................................................................................................... 20 3.2.1. Materials ......................................................................................................... 20 3.2.2. Preparation of PEGylated GOx ...................................................................... 20 3.2.3. Physical Characterization ............................................................................... 23
3.2.3.1. Liquid Chromatography .......................................................................... 23 3.2.3.2. Gel Electrophoresis ................................................................................. 23 3.2.3.3. Mass Spectrometry .................................................................................. 24 3.2.3.4. Particle Sizing ......................................................................................... 24
3.2.4. Functional Characterization ........................................................................... 24
3.2.4.1. Enzymatic Activity Assays ..................................................................... 24 3.2.4.2. Long-Term Storage Stability ................................................................... 25 3.2.4.3. Operational Stability ............................................................................... 26
3.3. Results and Discussion .......................................................................................... 26 3.3.1. Physical Characterization ............................................................................... 26
3.3.1.1. Liquid Chromatography .......................................................................... 27
3.3.1.2. Gel Electrophoresis ................................................................................. 28 3.3.1.3. Mass Spectrometry .................................................................................. 31
3.3.1.4. Particle Sizing ......................................................................................... 33 3.3.2. Functional Characterization ........................................................................... 36
3.3.2.1. Long-Term Storage Stability ................................................................... 36
3.3.2.2. Operational Stability ............................................................................... 37 3.4. Conclusions ........................................................................................................... 38
4. CHEMICAL MODIFICATION OF PEGYLATED GLYCOENZYME ..................... 40
4.1. Introduction ........................................................................................................... 40
4.2. Experimental ......................................................................................................... 42 4.2.1. Materials ......................................................................................................... 42
4.2.2. Synthesis of Modified Glucose Oxidase and PEGylated Glucose Oxidase ... 42 4.2.3. Physical and Chemical Characterization ........................................................ 45
4.2.3.1. Particle Sizing ......................................................................................... 45
4.2.3.2. Primary Amine Content .......................................................................... 45 4.2.3.3. Temperature Ramp .................................................................................. 46
4.2.4. Functional Characterization ........................................................................... 46 4.2.4.1. Enzymatic Activity Assays ..................................................................... 46
4.2.4.2. Long-Term Storage Stability ................................................................... 47 4.2.4.3. Operational Stability ............................................................................... 47
4.2.4.4. Thermostability ....................................................................................... 49 4.2.4.5. Solvent/Additive Stability ....................................................................... 49
4.3. Results and Discussion .......................................................................................... 51 4.3.1. Physical and Chemical Characterization ........................................................ 51
4.3.1.1. Particle Sizing ......................................................................................... 51
4.3.1.2. Primary Amine Content .......................................................................... 52 4.3.1.3. Temperature Ramp .................................................................................. 53
xi
4.3.2. Functional Characterization ........................................................................... 56 4.3.2.1. Long-Term Storage Stability ................................................................... 56 4.3.2.2. Operational Stability ............................................................................... 59 4.3.2.3. Thermostability ....................................................................................... 60
4.3.2.4. Solvent/Additive Stability ....................................................................... 64 4.4. Conclusions ........................................................................................................... 66
5. ALBUMINATION OF GLYCOENZYME ................................................................. 67
5.1. Introduction ........................................................................................................... 67 5.2. Experimental ......................................................................................................... 69
5.2.1. Materials ......................................................................................................... 69
5.2.2. Preparation of Albuminated Glycoenzymes ................................................... 69
5.2.3. Physical Characterization ............................................................................... 71 5.2.3.1. Liquid Chromatography .......................................................................... 71 5.2.3.2. Particle Sizing ......................................................................................... 71 5.2.3.3. Temperature Ramp .................................................................................. 72
5.2.4. Functional Characterization ........................................................................... 72 5.2.4.1. Enzymatic Activity Assays ..................................................................... 72
5.2.4.2. Long-Term Storage Stability ................................................................... 73 5.2.4.3. Operational Stability ............................................................................... 73 5.2.4.4. Thermostability ....................................................................................... 74
5.2.4.5. Solvent/Additive Stability ....................................................................... 74 5.3. Results and Discussion .......................................................................................... 75
5.3.1. Physical Characterization ............................................................................... 75
5.3.1.1. Liquid Chromatography .......................................................................... 75
5.3.1.2. Particle Sizing ......................................................................................... 77 5.3.1.3. Temperature Ramp .................................................................................. 78
5.3.2. Functional Characterization ........................................................................... 82 5.3.2.1. Long-Term Storage Stability ................................................................... 82 5.3.2.2. Operational Stability ............................................................................... 83
5.3.2.3. Thermostability ....................................................................................... 84 5.3.2.4. Solvent/Additive Stability ....................................................................... 88
5.4. Conclusions ........................................................................................................... 90
6. CONCLUSIONS AND FUTURE WORK .................................................................. 92
REFERENCES ............................................................................................................... 104
xii
LIST OF FIGURES
Page
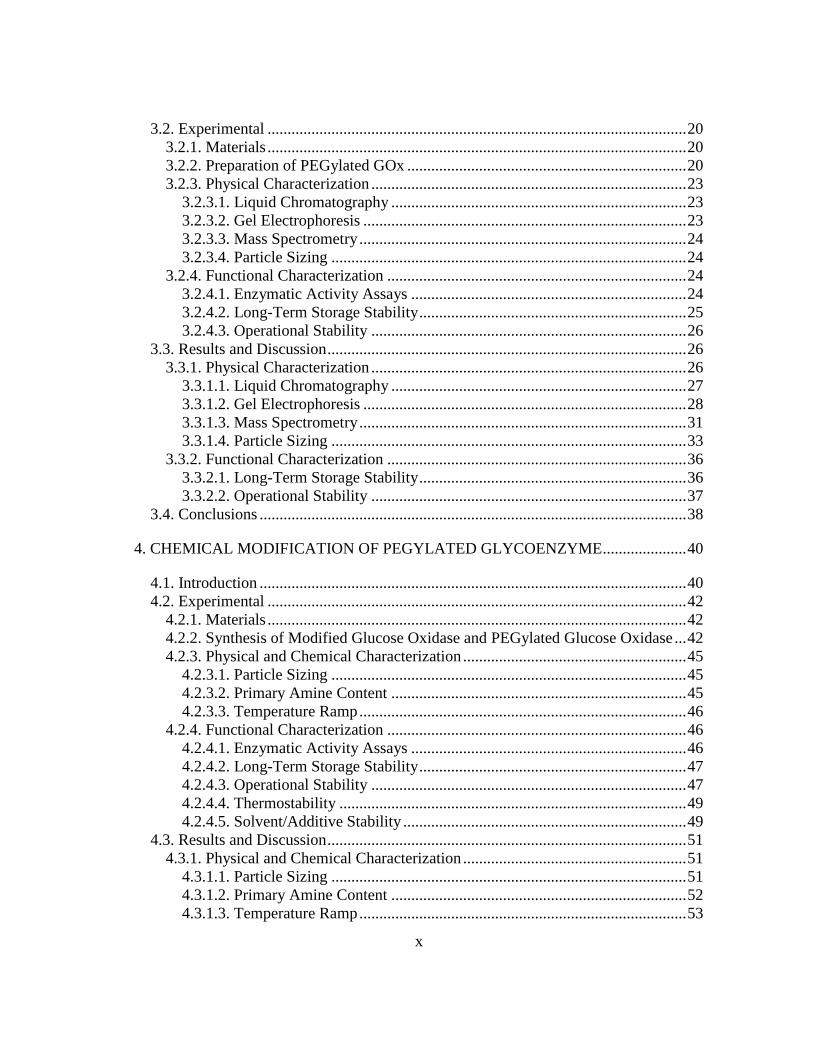
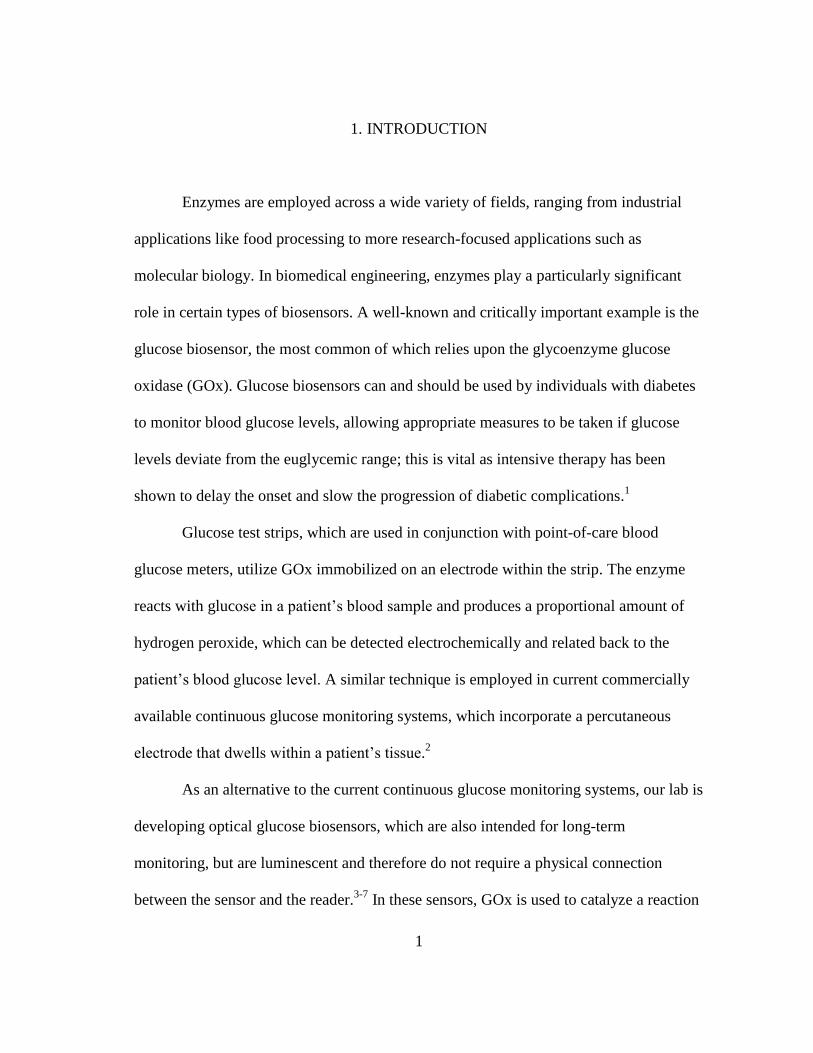
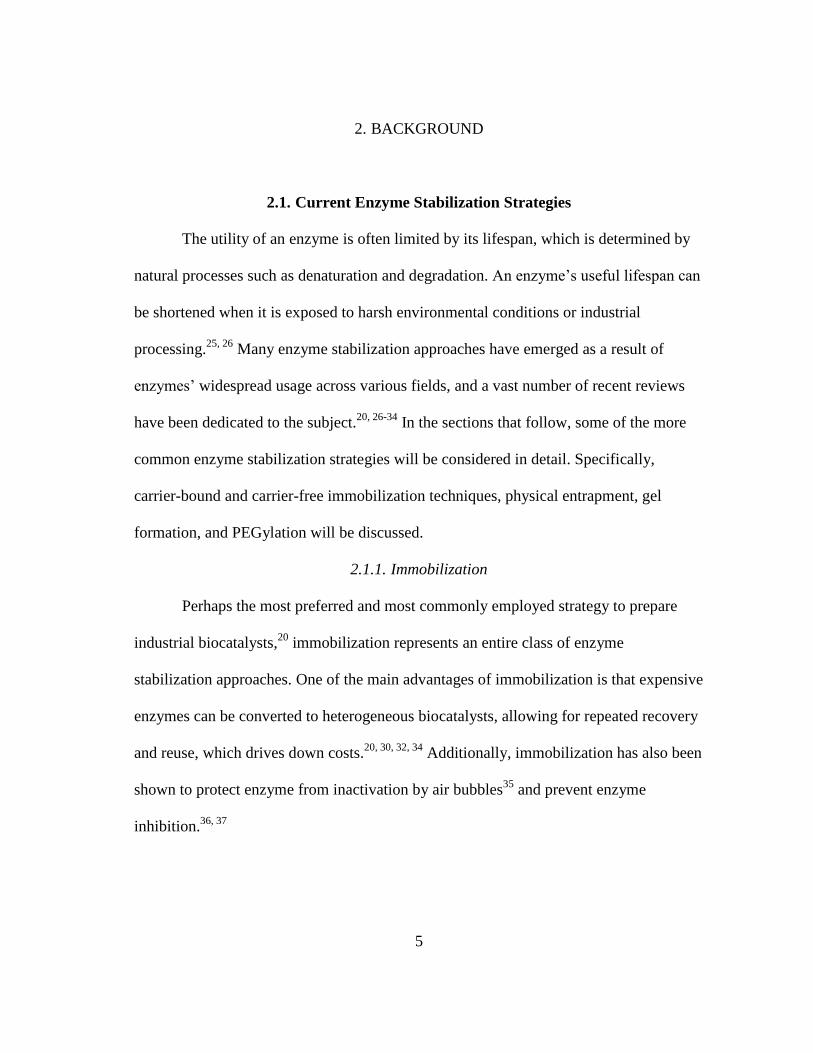
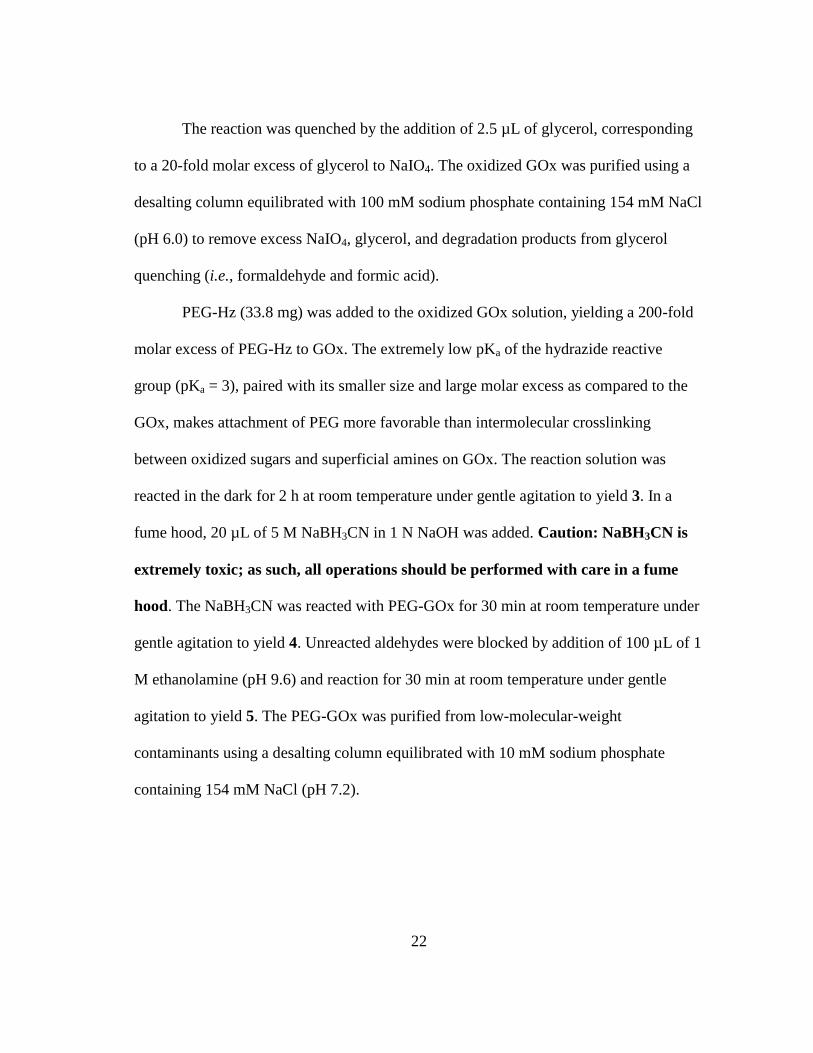
Fig. 3-1 Cartoon illustrating attachment of PEG to glycosylation sites of GOx (not
drawn to scale). ................................................................................................. 20
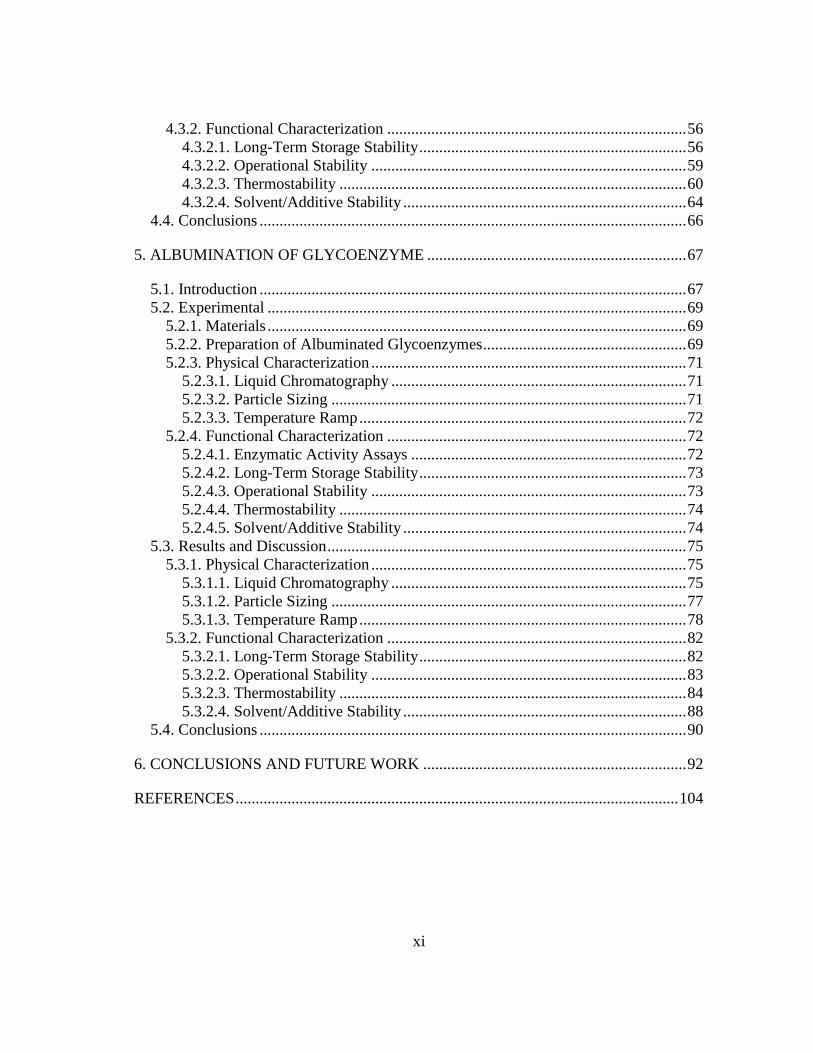
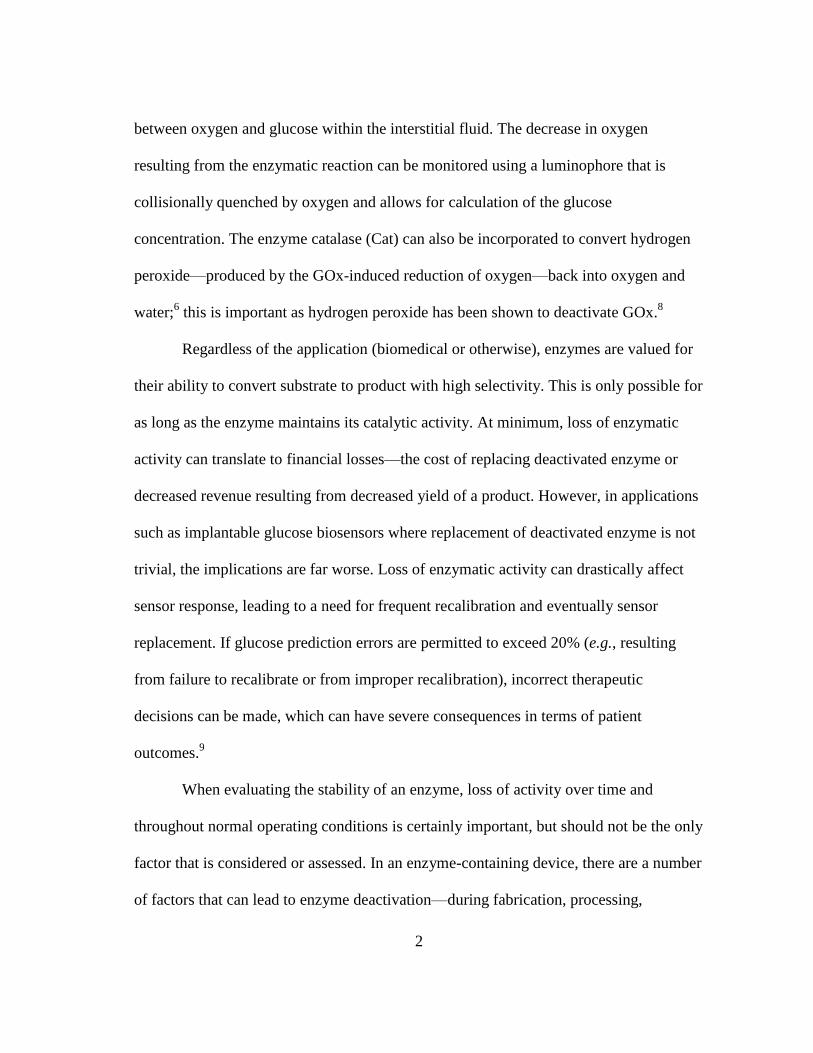
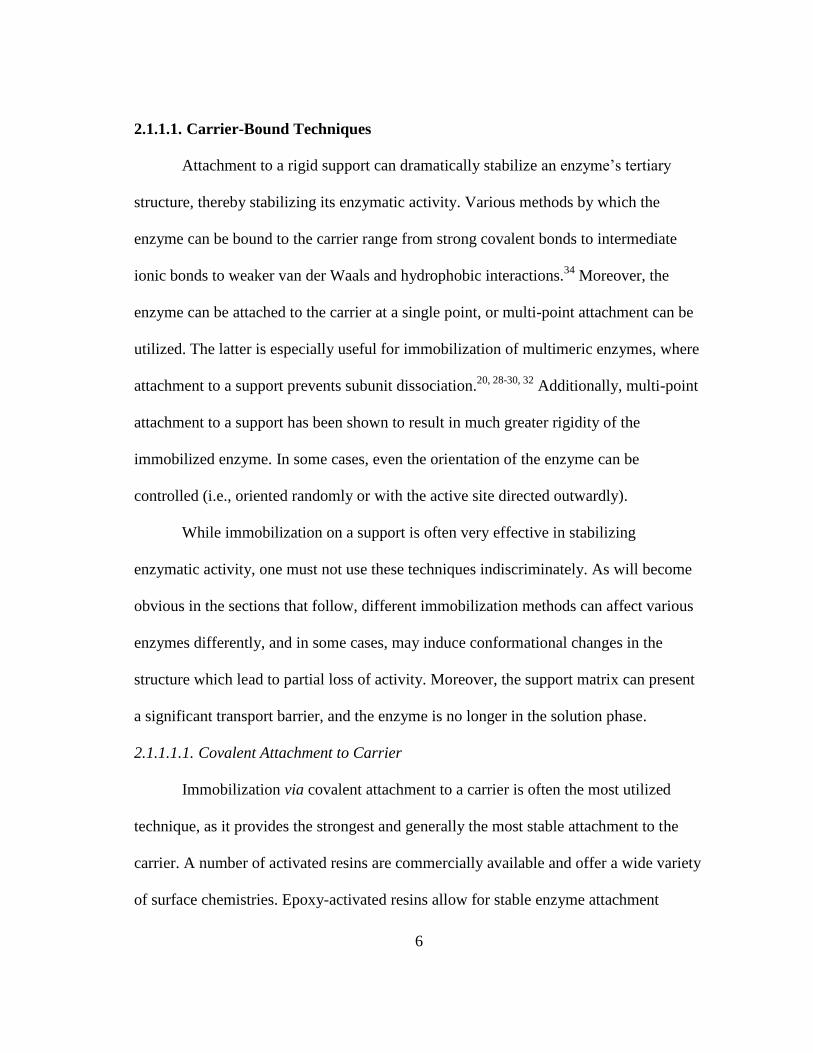
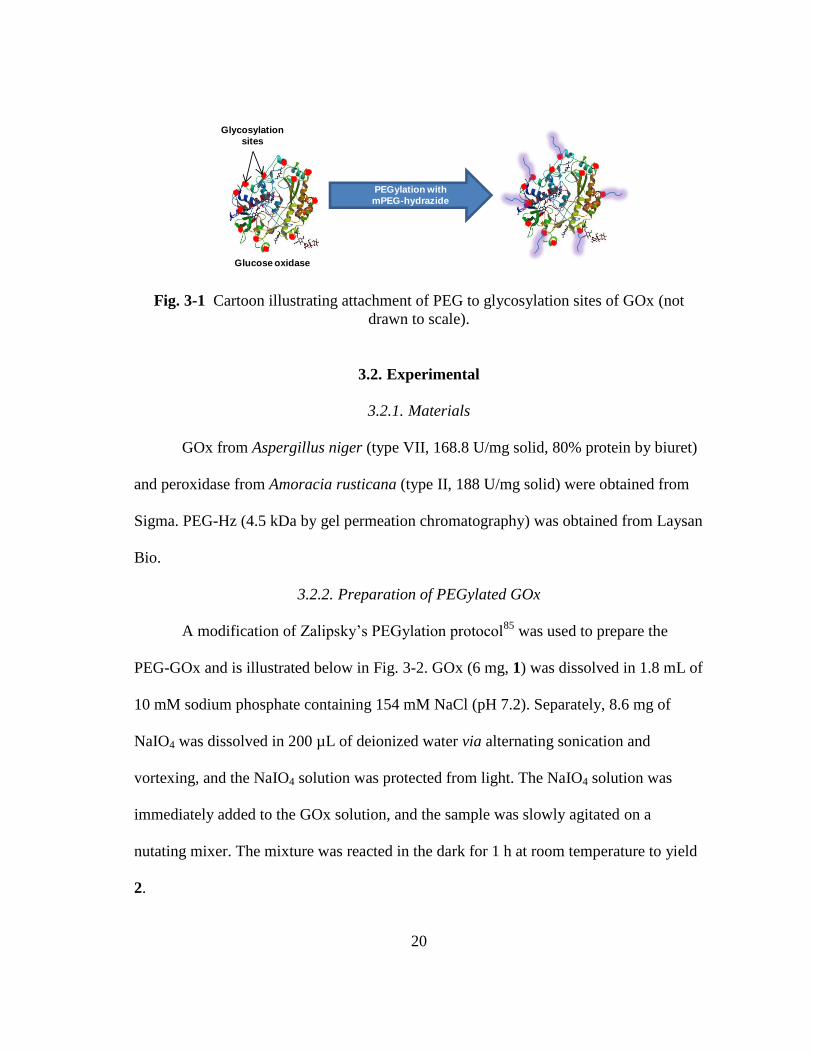
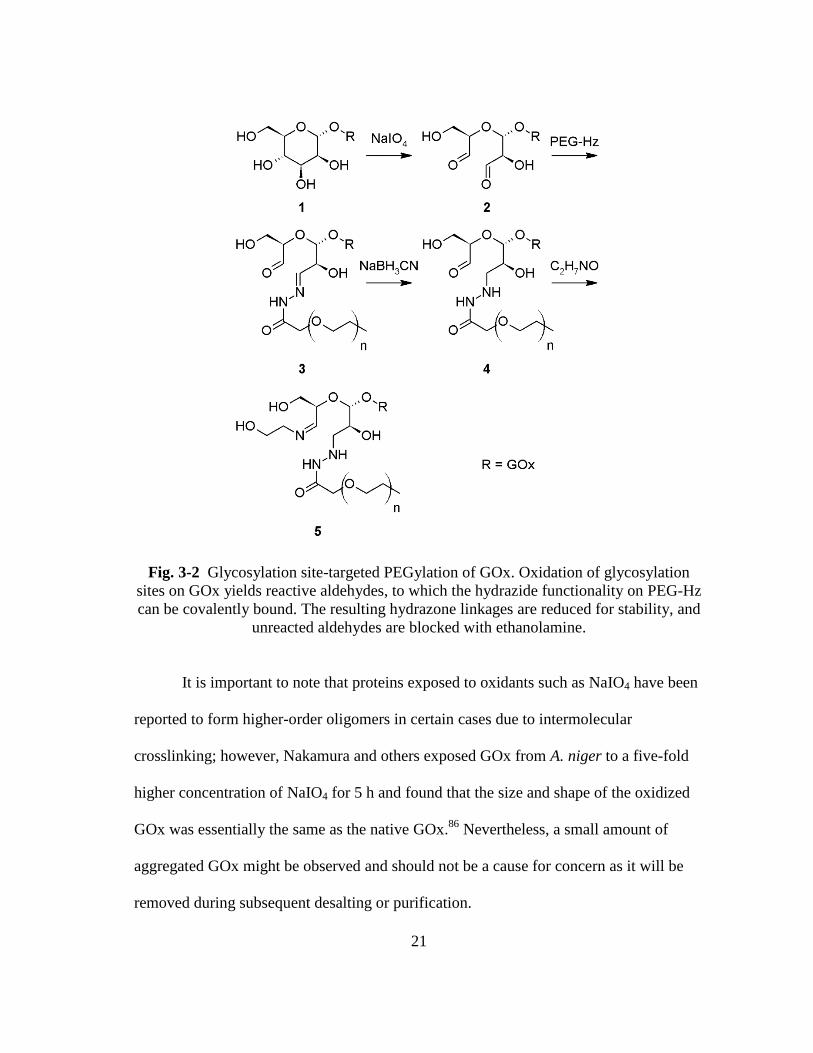
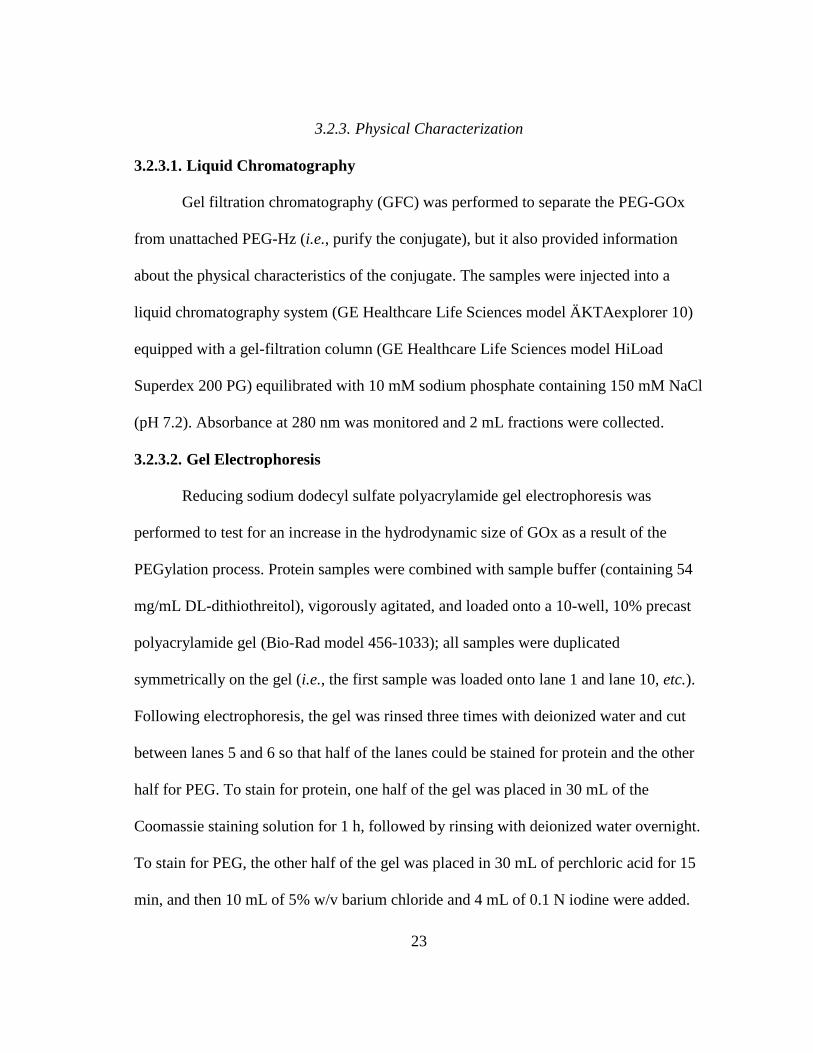
Fig. 3-2 Glycosylation site-targeted PEGylation of GOx. Oxidation of glycosylation
sites on GOx yields reactive aldehydes, to which the hydrazide functionality
on PEG-Hz can be covalently bound. The resulting hydrazone linkages are
reduced for stability, and unreacted aldehydes are blocked with
ethanolamine. .................................................................................................... 21
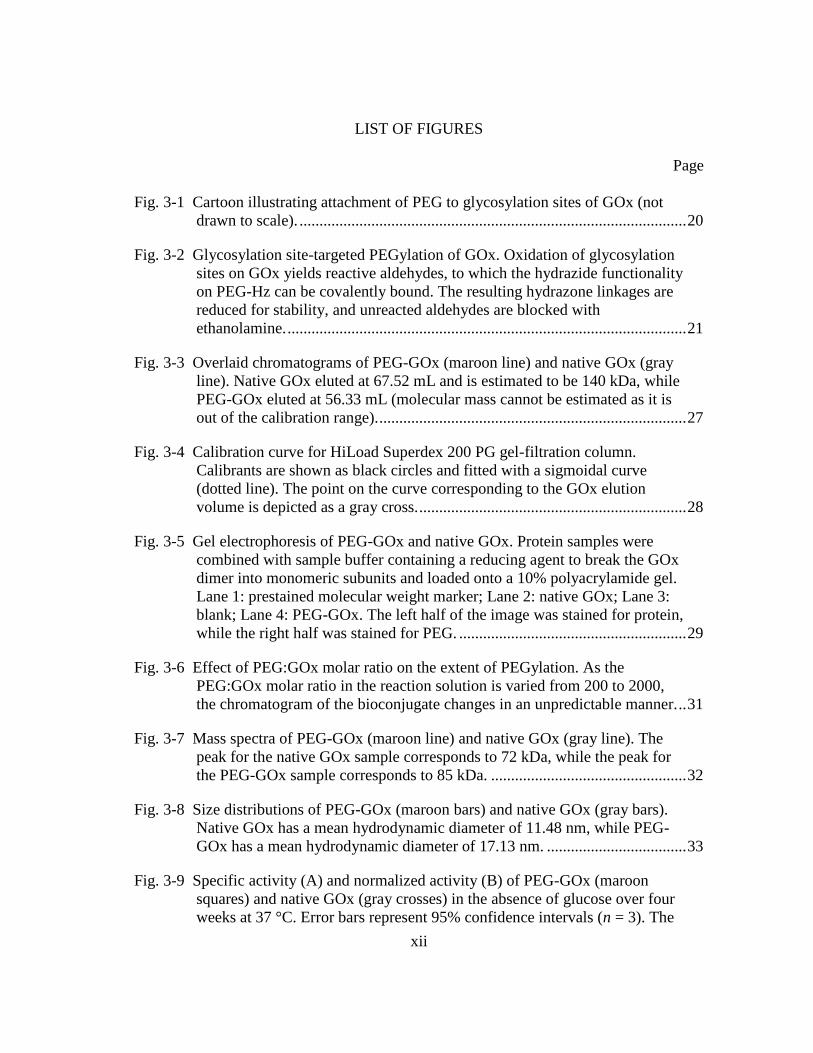
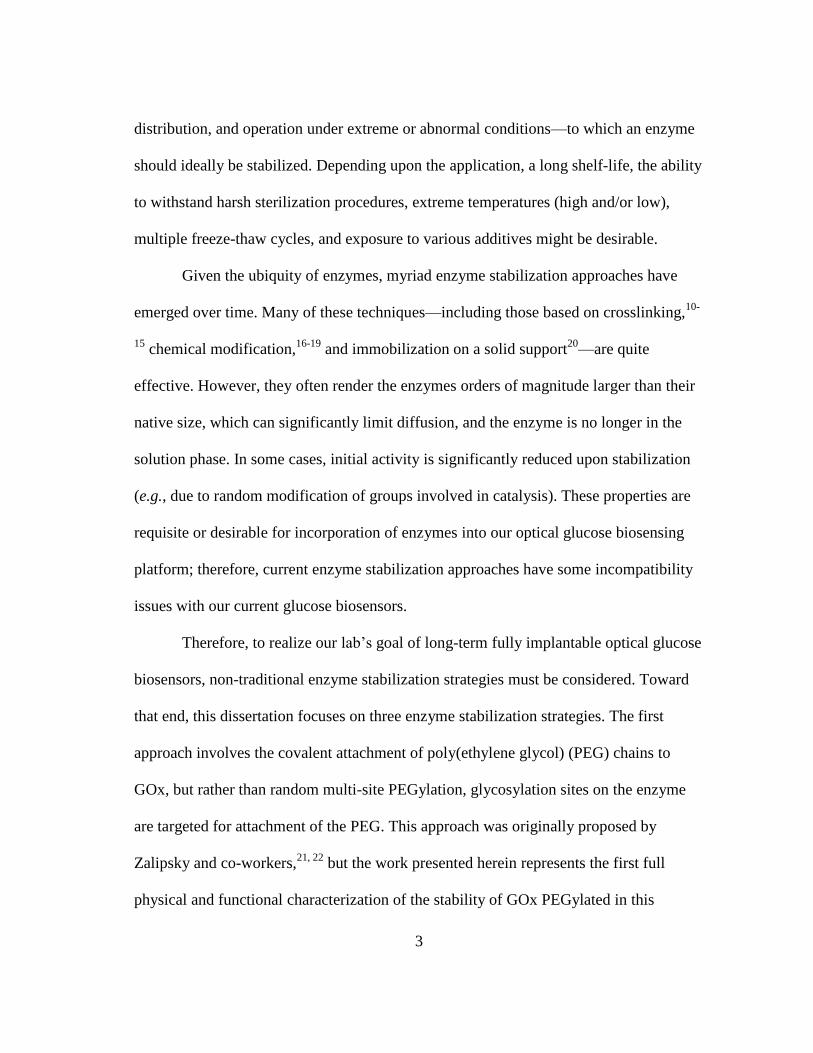
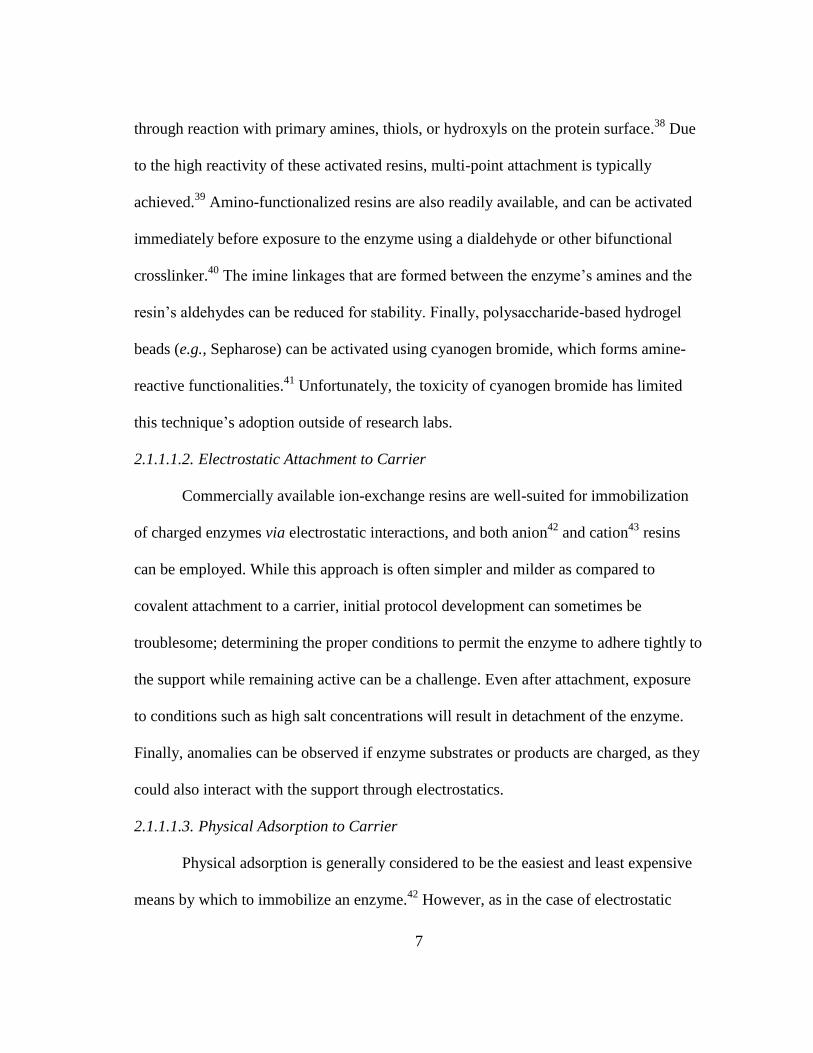
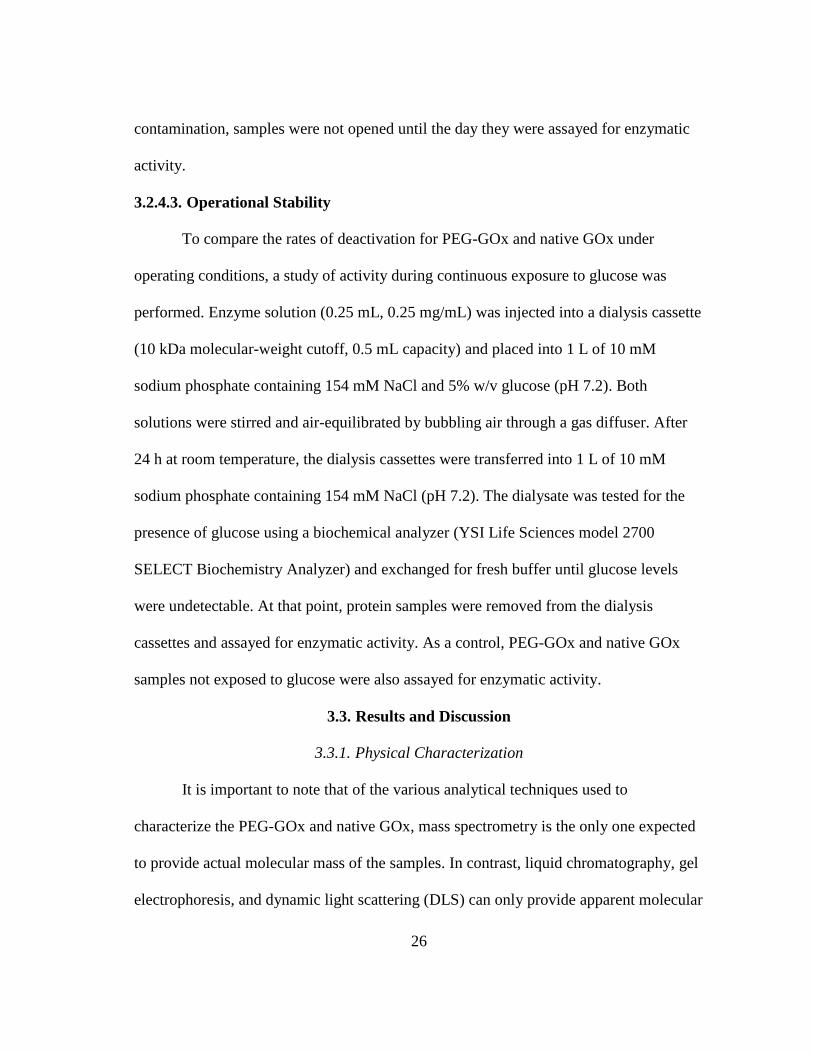
Fig. 3-3 Overlaid chromatograms of PEG-GOx (maroon line) and native GOx (gray
line). Native GOx eluted at 67.52 mL and is estimated to be 140 kDa, while
PEG-GOx eluted at 56.33 mL (molecular mass cannot be estimated as it is
out of the calibration range). ............................................................................. 27
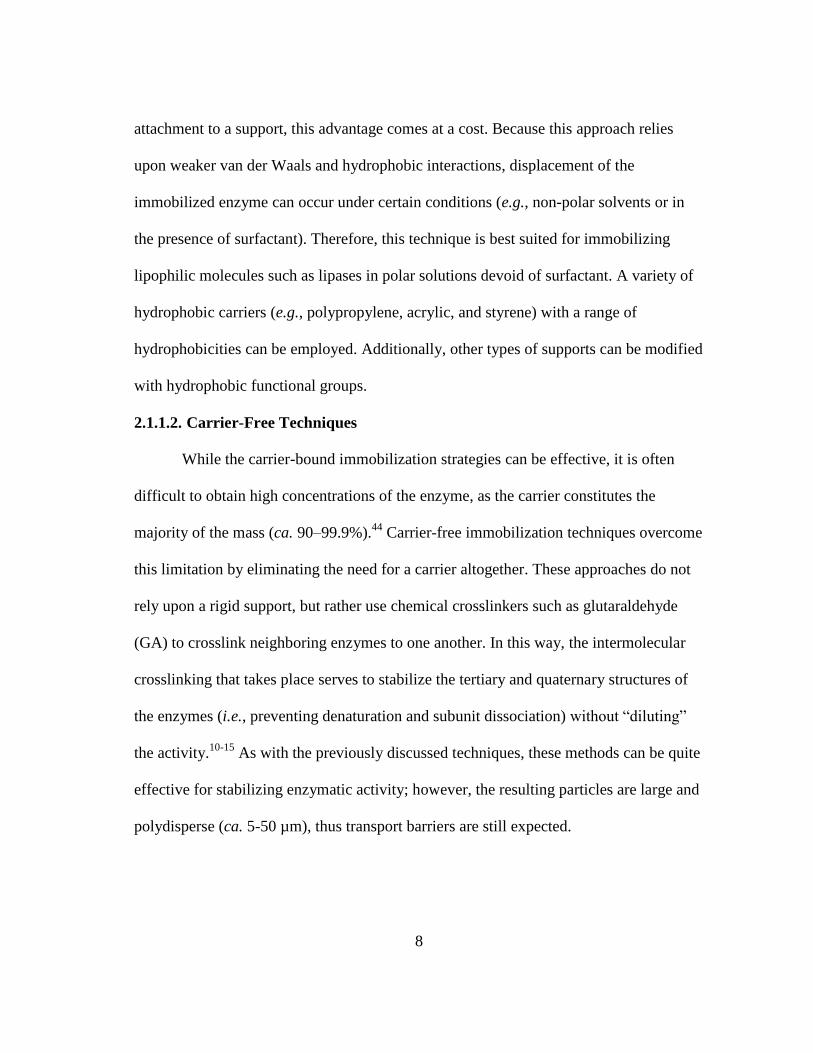
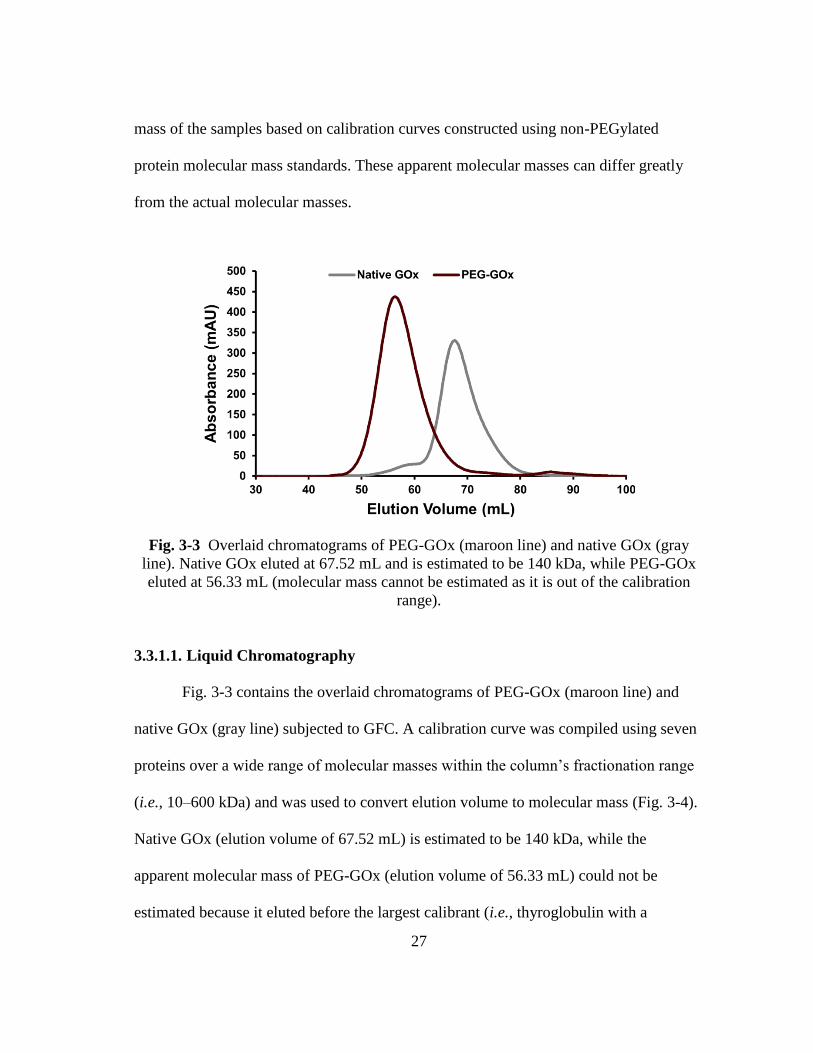
Fig. 3-4 Calibration curve for HiLoad Superdex 200 PG gel-filtration column.
Calibrants are shown as black circles and fitted with a sigmoidal curve
(dotted line). The point on the curve corresponding to the GOx elution
volume is depicted as a gray cross. ................................................................... 28
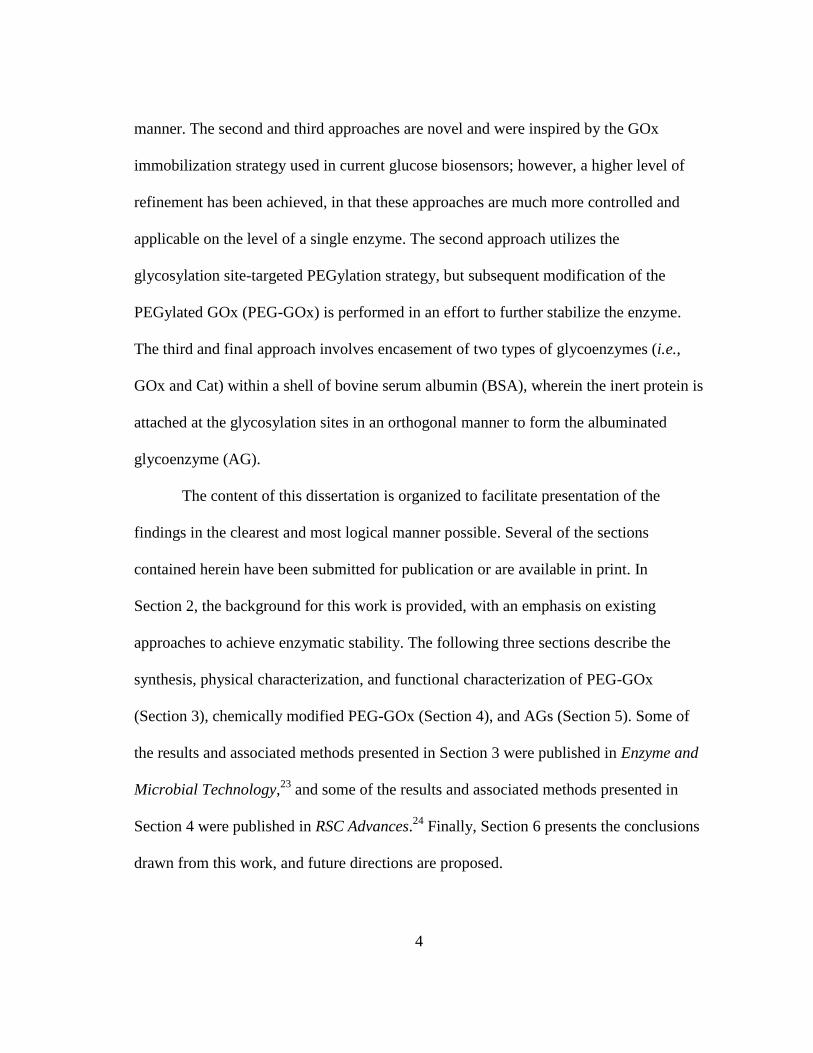
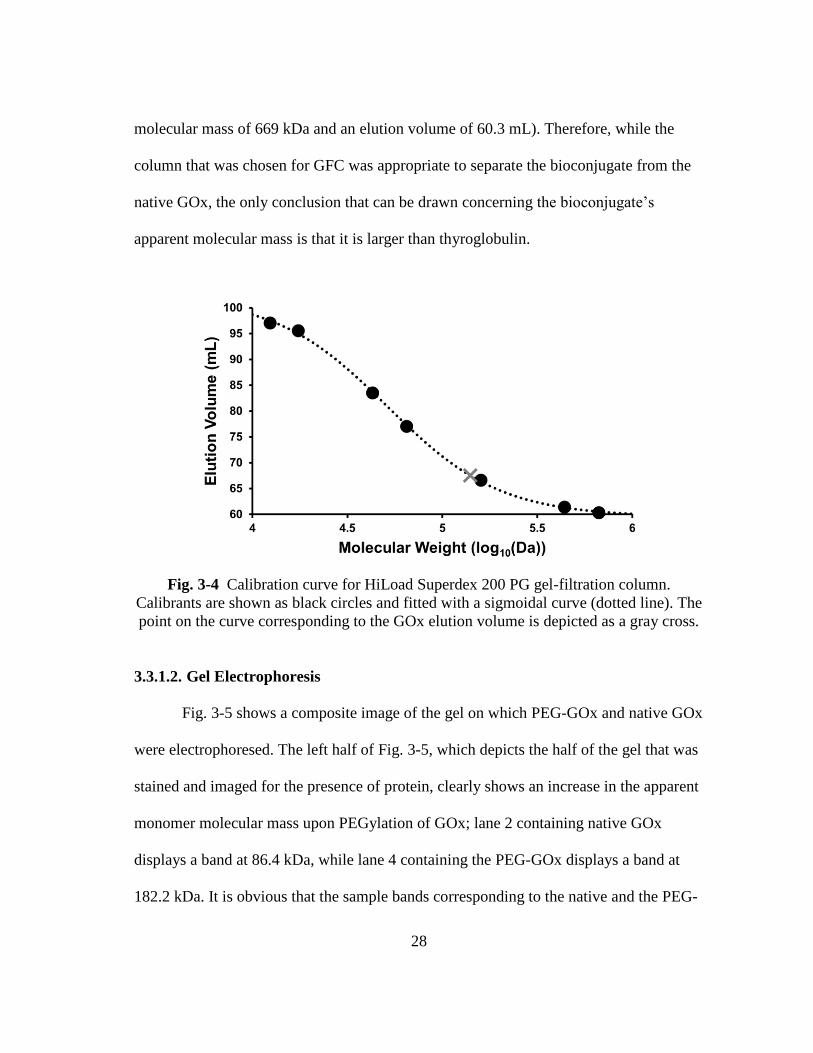
Fig. 3-5 Gel electrophoresis of PEG-GOx and native GOx. Protein samples were
combined with sample buffer containing a reducing agent to break the GOx
dimer into monomeric subunits and loaded onto a 10% polyacrylamide gel.
Lane 1: prestained molecular weight marker; Lane 2: native GOx; Lane 3:
blank; Lane 4: PEG-GOx. The left half of the image was stained for protein,
while the right half was stained for PEG. ......................................................... 29
Fig. 3-6 Effect of PEG:GOx molar ratio on the extent of PEGylation. As the
PEG:GOx molar ratio in the reaction solution is varied from 200 to 2000,
the chromatogram of the bioconjugate changes in an unpredictable manner. .. 31
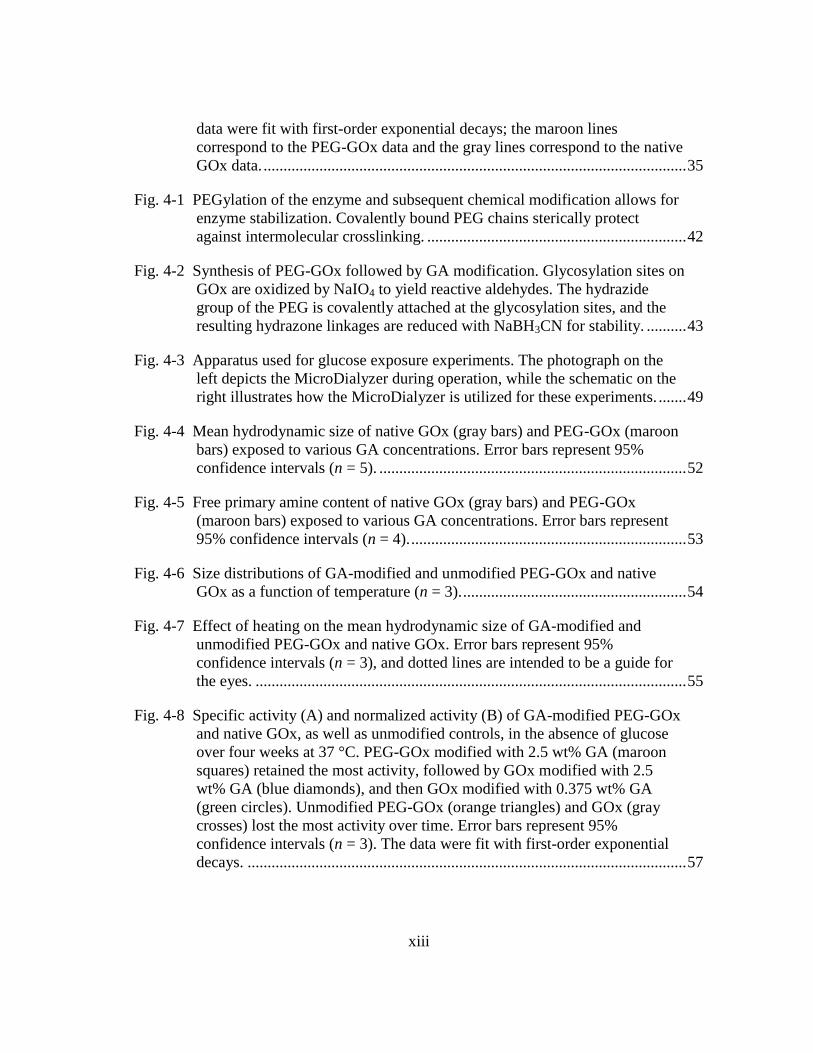
Fig. 3-7 Mass spectra of PEG-GOx (maroon line) and native GOx (gray line). The
peak for the native GOx sample corresponds to 72 kDa, while the peak for
the PEG-GOx sample corresponds to 85 kDa. ................................................. 32
Fig. 3-8 Size distributions of PEG-GOx (maroon bars) and native GOx (gray bars).
Native GOx has a mean hydrodynamic diameter of 11.48 nm, while PEG-
GOx has a mean hydrodynamic diameter of 17.13 nm. ................................... 33
Fig. 3-9 Specific activity (A) and normalized activity (B) of PEG-GOx (maroon
squares) and native GOx (gray crosses) in the absence of glucose over four
weeks at 37 °C. Error bars represent 95% confidence intervals (n = 3). The
xiii
data were fit with first-order exponential decays; the maroon lines
correspond to the PEG-GOx data and the gray lines correspond to the native
GOx data. .......................................................................................................... 35
Fig. 4-1 PEGylation of the enzyme and subsequent chemical modification allows for
enzyme stabilization. Covalently bound PEG chains sterically protect
against intermolecular crosslinking. ................................................................. 42
Fig. 4-2 Synthesis of PEG-GOx followed by GA modification. Glycosylation sites on
GOx are oxidized by NaIO4 to yield reactive aldehydes. The hydrazide
group of the PEG is covalently attached at the glycosylation sites, and the
resulting hydrazone linkages are reduced with NaBH3CN for stability. .......... 43
Fig. 4-3 Apparatus used for glucose exposure experiments. The photograph on the
left depicts the MicroDialyzer during operation, while the schematic on the
right illustrates how the MicroDialyzer is utilized for these experiments. ....... 49
Fig. 4-4 Mean hydrodynamic size of native GOx (gray bars) and PEG-GOx (maroon
bars) exposed to various GA concentrations. Error bars represent 95%
confidence intervals (n = 5). ............................................................................. 52
Fig. 4-5 Free primary amine content of native GOx (gray bars) and PEG-GOx
(maroon bars) exposed to various GA concentrations. Error bars represent
95% confidence intervals (n = 4). ..................................................................... 53
Fig. 4-6 Size distributions of GA-modified and unmodified PEG-GOx and native
GOx as a function of temperature (n = 3). ........................................................ 54
Fig. 4-7 Effect of heating on the mean hydrodynamic size of GA-modified and
unmodified PEG-GOx and native GOx. Error bars represent 95%
confidence intervals (n = 3), and dotted lines are intended to be a guide for
the eyes. ............................................................................................................ 55
Fig. 4-8 Specific activity (A) and normalized activity (B) of GA-modified PEG-GOx
and native GOx, as well as unmodified controls, in the absence of glucose
over four weeks at 37 °C. PEG-GOx modified with 2.5 wt% GA (maroon
squares) retained the most activity, followed by GOx modified with 2.5
wt% GA (blue diamonds), and then GOx modified with 0.375 wt% GA
(green circles). Unmodified PEG-GOx (orange triangles) and GOx (gray
crosses) lost the most activity over time. Error bars represent 95%
confidence intervals (n = 3). The data were fit with first-order exponential
decays. .............................................................................................................. 57
xiv
Fig. 4-9 Mean lifetime values calculated from long-term storage stability data fit with
first-order exponential decays for native GOx (gray bars) and PEG-GOx
(maroon bars) at various GA concentrations. ................................................... 58
Fig. 4-10 Normalized activity of GA-modified and unmodified PEG-GOx and native
GOx with exposure to glucose (PEG-GOx modified with 2.5 wt% GA,
maroon squares; GOx modified with 2.5 wt% GA, blue diamonds; GOx
modified with 0.375 wt% GA, green circles; PEG-GOx, orange triangles;
GOx, gray crosses). Error bars represent 95% confidence intervals (n = 3),
and dotted lines are intended to be a guide for the eyes. .................................. 60
Fig. 4-11 Normalized activity of GA-modified and unmodified PEG-GOx and native
GOx following heating of enzyme solutions to 60 °C. Error bars represent
95% confidence intervals (n = 3). The data for unmodified PEG-GOx
(orange triangles) and unmodified GOx (gray crosses) were fit with first-
order exponential decays (orange and gray solid lines, respectively);
however, the data for modified PEG-GOx (maroon squares) and modified
GOx (blue diamonds) were fit with both first-order (maroon and blue solid
lines, respectively) and second-order exponential decays (maroon and blue
dashed lines, respectively). ............................................................................... 61
Fig. 4-12 Normalized activity of GA-modified and unmodified PEG-GOx and native
GOx with exposure to various solvents and additives grouped by enzyme
type (A) or exposure type (B). In all cases, samples are normalized to
unexposed enzyme of the same type (e.g., exposed PEG-GOx samples
normalized to unexposed PEG-GOx); for grouping by exposure type (B),
unexposed enzyme is indicated by the dotted horizontal line at 100%. GOx
is depicted with gray bars, GA-modified GOx with blue bars, PEG-GOx
with orange bars, and GA-modified PEG-GOx with maroon bars. Error bars
represent 95% confidence intervals (n = 3). ..................................................... 63
Fig. 5-1 Cartoon illustrating the orthogonal attachment of multiple BSA
macromolecules to a native glycoenzyme to form an AG. ............................... 68
Fig. 5-2 Synthesis of BSA-modified glycoenzymes—AGs. Oxidation of multiple
glycosylation sites on the glycoenzyme yields aldehydes, which are then
reacted with hydrazide-functionalized BSA. The single hydrazide group of
each BSA is covalently attached at the oxidized glycosylation sites, and the
resulting hydrazone linkages are reduced with NaBH3CN for stability. .......... 70
Fig. 5-3 Chromatograms of BSA-GOx and native GOx (A), as well as BSA-Cat and
native Cat (B). Traces corresponding to AGs are shown in maroon, while
those corresponding to native enzymes are shown in gray. Absorbance at
280 nm is indicated by a dashed line, while absorbance at 450 nm (for GOx
and BSA-GOx) or 405 nm (for Cat and BSA-Cat) is indicated by a solid
xv
line. For visualization purposes, the 450 nm traces for native GOx and
BSA-GOx have been multiplied by a factor of ten. .......................................... 76
Fig. 5-4 Size distributions of BSA, native GOx, and BSA-GOx (A), as well as BSA,
native Cat, and BSA-Cat (B). BSA is shown as black bars, native enzymes
as gray bars, and AGs are shown as maroon bars. ............................................ 78
Fig. 5-5 Size distributions for native GOx and BSA-GOx, as well as native Cat and
BSA-Cat, as a function of temperature (n = 3). ................................................ 79
Fig. 5-6 Effect of heating on the size of BSA-GOx and native GOx (A) and BSA-Cat
and native Cat (B). BSA-GOx and native GOx are indicated by maroon
squares and gray crosses, respectively, while BSA-Cat and native Cat are
indicated by maroon diamonds and grey plus signs, respectively. Error bars
represent 95% confidence intervals (n = 3), and dotted lines are intended to
be a guide for the eyes. ..................................................................................... 80
Fig. 5-7 Specific activity (A) and normalized activity (B) of BSA-GOx (maroon
squares) and native GOx (gray crosses) in the absence of glucose over four
weeks at 37 °C. Error bars represent 95% confidence intervals (n = 3). The
data were fit with first-order exponential decays; the maroon lines
corresponds to the BSA-GOx data and the gray lines corresponds to the
native GOx data. ............................................................................................... 83
Fig. 5-8 Normalized activity of BSA-GOx (maroon squares) and native GOx (gray
crosses) exposed to glucose for 24 h at room temperature. Error bars
represent 95% confidence intervals (n = 3), and dotted lines are intended to
be a guide for the eyes. ..................................................................................... 84
Fig. 5-9 Normalized activity of BSA-GOx (maroon squares) and native GOx (gray
crosses) with exposure to extreme temperature (60 °C). Error bars represent
95% confidence intervals (n = 3). Native GOx data were fit with a first-
order exponential decay (gray line), while BSA-GOx data were fit with both
a first-order (maroon solid line) and second-order exponential decay
(maroon dashed line). ....................................................................................... 85
Fig. 5-10 Normalized activity of BSA-GOx (maroon bars) and native GOx (gray
bars) with exposure to various solvents and additives grouped by enzyme
type (A) or exposure type (B). All samples are normalized to unexposed
enzyme of the same type (e.g., BSA-GOx samples are normalized to
unexposed BSA-GOx), which is indicated by the horizontal dotted line at
100%. Error bars represent 95% confidence intervals (n = 3). ......................... 87
Fig. 6-1 Sensor response obtained by entrapping PEG-GOx and an oxygen-sensitive
phosphor in a pHEMA hydrogel. Data represent the average luminescence
xvi
lifetimes at each glucose concentration, and error bars represent 95%
confidence intervals (n = 4). ............................................................................. 99
Fig. 6-2 Sensor response of glucose-sensitive hydrogels containing BSA-GOx (red
line) and native GOx (blue line) during extended exposure to repeated
glucose flight plans. ........................................................................................ 100
xvii
LIST OF TABLES
Page
Table 3-1 Activity retention following glucose exposure for 24 h (95% confidence
intervals, n = 3) ................................................................................................. 37
Table 4-1 Composition of polymer precursor solutions .................................................. 50
Table 6-1 Comparison of the various glycoenzyme conjugates ..................................... 96
Table 6-2 Proposed strategies for glycoenzyme conjugate attachment to hydrogels.... 103
1
1. INTRODUCTION
Enzymes are employed across a wide variety of fields, ranging from industrial
applications like food processing to more research-focused applications such as
molecular biology. In biomedical engineering, enzymes play a particularly significant
role in certain types of biosensors. A well-known and critically important example is the
glucose biosensor, the most common of which relies upon the glycoenzyme glucose
oxidase (GOx). Glucose biosensors can and should be used by individuals with diabetes
to monitor blood glucose levels, allowing appropriate measures to be taken if glucose
levels deviate from the euglycemic range; this is vital as intensive therapy has been
shown to delay the onset and slow the progression of diabetic complications.1
Glucose test strips, which are used in conjunction with point-of-care blood
glucose meters, utilize GOx immobilized on an electrode within the strip. The enzyme
reacts with glucose in a patient’s blood sample and produces a proportional amount of
hydrogen peroxide, which can be detected electrochemically and related back to the
patient’s blood glucose level. A similar technique is employed in current commercially
available continuous glucose monitoring systems, which incorporate a percutaneous
electrode that dwells within a patient’s tissue.2
As an alternative to the current continuous glucose monitoring systems, our lab is
developing optical glucose biosensors, which are also intended for long-term
monitoring, but are luminescent and therefore do not require a physical connection
between the sensor and the reader.3-7
In these sensors, GOx is used to catalyze a reaction
2
between oxygen and glucose within the interstitial fluid. The decrease in oxygen
resulting from the enzymatic reaction can be monitored using a luminophore that is
collisionally quenched by oxygen and allows for calculation of the glucose
concentration. The enzyme catalase (Cat) can also be incorporated to convert hydrogen
peroxide—produced by the GOx-induced reduction of oxygen—back into oxygen and
water;6 this is important as hydrogen peroxide has been shown to deactivate GOx.
8
Regardless of the application (biomedical or otherwise), enzymes are valued for
their ability to convert substrate to product with high selectivity. This is only possible for
as long as the enzyme maintains its catalytic activity. At minimum, loss of enzymatic
activity can translate to financial losses—the cost of replacing deactivated enzyme or
decreased revenue resulting from decreased yield of a product. However, in applications
such as implantable glucose biosensors where replacement of deactivated enzyme is not
trivial, the implications are far worse. Loss of enzymatic activity can drastically affect
sensor response, leading to a need for frequent recalibration and eventually sensor
replacement. If glucose prediction errors are permitted to exceed 20% (e.g., resulting
from failure to recalibrate or from improper recalibration), incorrect therapeutic
decisions can be made, which can have severe consequences in terms of patient
outcomes.9
When evaluating the stability of an enzyme, loss of activity over time and
throughout normal operating conditions is certainly important, but should not be the only
factor that is considered or assessed. In an enzyme-containing device, there are a number
of factors that can lead to enzyme deactivation—during fabrication, processing,
3
distribution, and operation under extreme or abnormal conditions—to which an enzyme
should ideally be stabilized. Depending upon the application, a long shelf-life, the ability
to withstand harsh sterilization procedures, extreme temperatures (high and/or low),
multiple freeze-thaw cycles, and exposure to various additives might be desirable.
Given the ubiquity of enzymes, myriad enzyme stabilization approaches have
emerged over time. Many of these techniques—including those based on crosslinking,10-
15 chemical modification,
16-19 and immobilization on a solid support
20—are quite
effective. However, they often render the enzymes orders of magnitude larger than their
native size, which can significantly limit diffusion, and the enzyme is no longer in the
solution phase. In some cases, initial activity is significantly reduced upon stabilization
(e.g., due to random modification of groups involved in catalysis). These properties are
requisite or desirable for incorporation of enzymes into our optical glucose biosensing
platform; therefore, current enzyme stabilization approaches have some incompatibility
issues with our current glucose biosensors.
Therefore, to realize our lab’s goal of long-term fully implantable optical glucose
biosensors, non-traditional enzyme stabilization strategies must be considered. Toward
that end, this dissertation focuses on three enzyme stabilization strategies. The first
approach involves the covalent attachment of poly(ethylene glycol) (PEG) chains to
GOx, but rather than random multi-site PEGylation, glycosylation sites on the enzyme
are targeted for attachment of the PEG. This approach was originally proposed by
Zalipsky and co-workers,21, 22
but the work presented herein represents the first full
physical and functional characterization of the stability of GOx PEGylated in this
4
manner. The second and third approaches are novel and were inspired by the GOx
immobilization strategy used in current glucose biosensors; however, a higher level of
refinement has been achieved, in that these approaches are much more controlled and
applicable on the level of a single enzyme. The second approach utilizes the
glycosylation site-targeted PEGylation strategy, but subsequent modification of the
PEGylated GOx (PEG-GOx) is performed in an effort to further stabilize the enzyme.
The third and final approach involves encasement of two types of glycoenzymes (i.e.,
GOx and Cat) within a shell of bovine serum albumin (BSA), wherein the inert protein is
attached at the glycosylation sites in an orthogonal manner to form the albuminated
glycoenzyme (AG).
The content of this dissertation is organized to facilitate presentation of the
findings in the clearest and most logical manner possible. Several of the sections
contained herein have been submitted for publication or are available in print. In
Section 2, the background for this work is provided, with an emphasis on existing
approaches to achieve enzymatic stability. The following three sections describe the
synthesis, physical characterization, and functional characterization of PEG-GOx
(Section 3), chemically modified PEG-GOx (Section 4), and AGs (Section 5). Some of
the results and associated methods presented in Section 3 were published in Enzyme and
Microbial Technology,23
and some of the results and associated methods presented in
Section 4 were published in RSC Advances.24
Finally, Section 6 presents the conclusions
drawn from this work, and future directions are proposed.
5
2. BACKGROUND
2.1. Current Enzyme Stabilization Strategies
The utility of an enzyme is often limited by its lifespan, which is determined by
natural processes such as denaturation and degradation. An enzyme’s useful lifespan can
be shortened when it is exposed to harsh environmental conditions or industrial
processing.25, 26
Many enzyme stabilization approaches have emerged as a result of
enzymes’ widespread usage across various fields, and a vast number of recent reviews
have been dedicated to the subject.20, 26-34
In the sections that follow, some of the more
common enzyme stabilization strategies will be considered in detail. Specifically,
carrier-bound and carrier-free immobilization techniques, physical entrapment, gel
formation, and PEGylation will be discussed.
2.1.1. Immobilization
Perhaps the most preferred and most commonly employed strategy to prepare
industrial biocatalysts,20
immobilization represents an entire class of enzyme
stabilization approaches. One of the main advantages of immobilization is that expensive
enzymes can be converted to heterogeneous biocatalysts, allowing for repeated recovery
and reuse, which drives down costs.20, 30, 32, 34
Additionally, immobilization has also been
shown to protect enzyme from inactivation by air bubbles35
and prevent enzyme
inhibition.36, 37
6
2.1.1.1. Carrier-Bound Techniques
Attachment to a rigid support can dramatically stabilize an enzyme’s tertiary
structure, thereby stabilizing its enzymatic activity. Various methods by which the
enzyme can be bound to the carrier range from strong covalent bonds to intermediate
ionic bonds to weaker van der Waals and hydrophobic interactions.34
Moreover, the
enzyme can be attached to the carrier at a single point, or multi-point attachment can be
utilized. The latter is especially useful for immobilization of multimeric enzymes, where
attachment to a support prevents subunit dissociation.20, 28-30, 32
Additionally, multi-point
attachment to a support has been shown to result in much greater rigidity of the
immobilized enzyme. In some cases, even the orientation of the enzyme can be
controlled (i.e., oriented randomly or with the active site directed outwardly).
While immobilization on a support is often very effective in stabilizing
enzymatic activity, one must not use these techniques indiscriminately. As will become
obvious in the sections that follow, different immobilization methods can affect various
enzymes differently, and in some cases, may induce conformational changes in the
structure which lead to partial loss of activity. Moreover, the support matrix can present
a significant transport barrier, and the enzyme is no longer in the solution phase.
2.1.1.1.1. Covalent Attachment to Carrier
Immobilization via covalent attachment to a carrier is often the most utilized
technique, as it provides the strongest and generally the most stable attachment to the
carrier. A number of activated resins are commercially available and offer a wide variety
of surface chemistries. Epoxy-activated resins allow for stable enzyme attachment
7
through reaction with primary amines, thiols, or hydroxyls on the protein surface.38
Due
to the high reactivity of these activated resins, multi-point attachment is typically
achieved.39
Amino-functionalized resins are also readily available, and can be activated
immediately before exposure to the enzyme using a dialdehyde or other bifunctional
crosslinker.40
The imine linkages that are formed between the enzyme’s amines and the
resin’s aldehydes can be reduced for stability. Finally, polysaccharide-based hydrogel
beads (e.g., Sepharose) can be activated using cyanogen bromide, which forms amine-
reactive functionalities.41
Unfortunately, the toxicity of cyanogen bromide has limited
this technique’s adoption outside of research labs.
2.1.1.1.2. Electrostatic Attachment to Carrier
Commercially available ion-exchange resins are well-suited for immobilization
of charged enzymes via electrostatic interactions, and both anion42
and cation43
resins
can be employed. While this approach is often simpler and milder as compared to
covalent attachment to a carrier, initial protocol development can sometimes be
troublesome; determining the proper conditions to permit the enzyme to adhere tightly to
the support while remaining active can be a challenge. Even after attachment, exposure
to conditions such as high salt concentrations will result in detachment of the enzyme.
Finally, anomalies can be observed if enzyme substrates or products are charged, as they
could also interact with the support through electrostatics.
2.1.1.1.3. Physical Adsorption to Carrier
Physical adsorption is generally considered to be the easiest and least expensive
means by which to immobilize an enzyme.42
However, as in the case of electrostatic
8
attachment to a support, this advantage comes at a cost. Because this approach relies
upon weaker van der Waals and hydrophobic interactions, displacement of the
immobilized enzyme can occur under certain conditions (e.g., non-polar solvents or in
the presence of surfactant). Therefore, this technique is best suited for immobilizing
lipophilic molecules such as lipases in polar solutions devoid of surfactant. A variety of
hydrophobic carriers (e.g., polypropylene, acrylic, and styrene) with a range of
hydrophobicities can be employed. Additionally, other types of supports can be modified
with hydrophobic functional groups.
2.1.1.2. Carrier-Free Techniques
While the carrier-bound immobilization strategies can be effective, it is often
difficult to obtain high concentrations of the enzyme, as the carrier constitutes the
majority of the mass (ca. 90–99.9%).44
Carrier-free immobilization techniques overcome
this limitation by eliminating the need for a carrier altogether. These approaches do not
rely upon a rigid support, but rather use chemical crosslinkers such as glutaraldehyde
(GA) to crosslink neighboring enzymes to one another. In this way, the intermolecular
crosslinking that takes place serves to stabilize the tertiary and quaternary structures of
the enzymes (i.e., preventing denaturation and subunit dissociation) without “diluting”
the activity.10-15
As with the previously discussed techniques, these methods can be quite
effective for stabilizing enzymatic activity; however, the resulting particles are large and
polydisperse (ca. 5-50 µm), thus transport barriers are still expected.
9
2.1.1.2.1. Crosslinked Enzyme Crystals
As the name suggests, crosslinked enzyme crystals (CLECs) are prepared via
initial crystallization of an enzyme, followed by crosslinking of the enzyme crystal.10
Enzymes remain highly active following crystallization, so this technique seeks to
“lock” the enzyme in this active conformation. The resulting microparticles are
relatively polydisperse and have been shown to be more thermally stable, solvent
tolerant, and resistant to proteolytic attack.
Quiocho and others first demonstrated the formation of CLECs in 1964 using
crystallized carboxypeptidase A.10
In the following couple of decades, this technique
was only applied to a handful of other enzymes, mostly due to practical issues associated
with the formation of the CLECs.27
The main drawback of this approach is the
requirement to start with the enzyme in the crystalline state. Crystallization requires
highly purified enzyme and can often be a time-intensive process (on the order of
months), even for an expert in enzyme crystallography. Moreover, some enzymes have
eluded researchers’ attempts at crystallization altogether. It is primarily for this reason
that this strategy is not commonly employed to produce heterogeneous biocatalysts.
Another inherent disadvantage is that only one type of enzyme can be crystallized and
thus stabilized using this technique. While this might not be an issue in many cases,
there are examples where co-stabilization might be desirable (e.g., coupled reactions like
GOx and Cat).
10
2.1.1.2.2. Crosslinked Enzyme Aggregates
The mechanism of stabilization for crosslinked enzyme aggregates (CLEAs) is
very similar to that of CLECs. The major advantage of CLEAs is that their preparation
does not require that an enzyme crystallization protocol be developed initially. Rather,
the enzyme is initially exposed to conditions which cause it to precipitate (e.g., addition
of miscible organic solvents, non-ionic polymers such as PEG, or high concentrations of
salt such as ammonium sulfate); this leads to a decrease in the intermolecular spacing
(high effective concentration), which allows for efficient crosslinking upon addition of a
chemical crosslinker.
This technique has been demonstrated for a wide variety of enzymes, and
typically through screening of multiple aggregation media and crosslinkers, a protocol
can be developed that provides adequate stabilization without unacceptable loss in
enzymatic activity.11-15
Unlike CLECs, the initial enzyme solution need not be highly
purified—in fact, under appropriate conditions, contaminating proteins can be excluded
from the CLEAs during formation. So-called “combi-CLEAs” have also been
demonstrated, wherein CLEAs comprising two or more types of enzymes are formed to
drive multiple cascade45
or non-cascade46
reactions forward.
While the stabilized enzymes that are produced using this technique are usually
smaller than CLECs, they are at least an order of magnitude larger than the native
enzymes. Therefore, diffusional limitations are still expected for enzyme which is not
located near the surface of the particle. Furthermore, applications requiring solution-
phase enzyme of near-native size are incompatible with this approach.
11
2.1.1.3. Physical Entrapment
In this immobilization technique, enzyme is entrapped within a polymeric
network—typically organic polymers or a sol-gel.47
Some of the more commonly used
polymers for enzyme entrapment include polyacrylamide,48
alginate,49
and gelatin,50
although more complex multi-component matrices have been demonstrated as well.
Silica sol-gels are quite commonly employed for in situ entrapment of enzyme,51
but
other silicon-based sol-gels can be used as well.52
As with other immobilization strategies, stabilization of the tertiary structure by
the polymer matrix helps to confer stability. The main disadvantages of this approach are
mass transfer limitations, low enzyme loading,53
and the requirement that substrates and
products be capable of diffusing throughout the polymeric network while retaining
enzymes. Due to the relatively small difference in size between enzymes and their
substrates, this level of tunability is often difficult to achieve in practice. Therefore,
physical entrapment has found its niche in whole-cell immobilization,54-56
in which
much looser polymeric networks with larger mesh sizes can be employed.
2.1.1.4. Gel Formation
A hybrid immobilization technique that is routinely employed for amperometric
glucose biosensors involves the crosslinking of GOx directly on the surface of an
electrode. In some cases, an inert macromolecule such as BSA is mixed with the enzyme
to avoid excess crosslinking and to facilitate gel formation.57
This approach has the
advantage of extreme simplicity; however, limitations on diffusion are imposed, lack of
12
repeatability is common, and significant losses in initial activity can occur due to
random modification of groups involved in catalysis.
2.1.2. PEGylation
Protein PEGylation is often performed to increase a protein’s hydrodynamic
volume, and this technique has been widely employed to increase circulation time of
therapeutic biologicals.58, 59
A given mass of PEG has a much larger hydrodynamic size
than an equivalent mass of protein, so even attachment of a modest amount of PEG to a
protein can drastically alter the protein’s hydrodynamic size.60
PEGylation with higher-
molecular-weight PEGs has also been shown to discourage protein aggregation, as the
larger PEG molecules tend to repel one another.61, 62
In some cases, improvements in
thermostability have even been demonstrated.63
Given these desirable characteristics, enzyme PEGylation offers a means to
stabilize enzymes while preserving their near-native size and residence in the solution
phase. While some studies report that PEGylation of a protein does not affect its
secondary or tertiary structure, there have been other studies that report on activity loss
of an enzyme following PEGylation. In the latter case, the commonly employed random
multi-site PEGylation approaches can lead to activity loss due to blocking of the binding
site and/or disruption of the protein’s tertiary structure.16-19
Site-selective PEGylation—
targeting a protein’s N-terminus, thiol groups (cysteine), or disulfide bridges, to name a
few—can help to mitigate the issue of reduced activity due to blocking of the binding
site.
13
2.2. Enzymes Employed in Glucose Biosensors
2.2.1. Glucose Oxidase
GOx is an enzyme that is used widely in the food industry to produce gluconic
acid, act as a food preservative, and determine the glucose content in foodstuffs.64
Many
of the properties that make GOx ideal for use in the food industry—high selectivity for
glucose, high turnover rate without the need for a soluble cofactor, and relative stability
under certain conditions—also make it the most suitable choice for incorporation into
glucose biosensors for biomedical applications.65
GOx is a homodimeric oxidoreductase that catalyzes β-D-glucose oxidation by
diatomic oxygen to form δ-gluconolactone and hydrogen peroxide. The redox reaction
scheme (excluding the reverse rate constants and ) can be represented as
(2.1)
,
where is the oxidized enzyme, is glucose, is the reduced enzyme-substrate
complex, is the reduced enzyme, is the oxidized enzyme-substrate complex,
and , , , and are all rate constants.66
GOx can be purified from a variety of sources; however, GOx from Aspergillus
niger is the most commonly used and most highly characterized form.67
GOx from A.
niger has a molecular mass of approximately 160 kDa and is highly glycosylated, with a
total carbohydrate content of 18.8 ± 0.6% of its molecular mass (16.4 ± 0.3% neutral
sugar and 2.4 ± 0.5% amino sugar).68, 69
Each monomer has one active site and one
14
tightly bound flavin adenine dinucleotide (FAD) cofactor associated with it, which gives
GOx its yellow color (ε450 nm = 1.41 x 10⁴ M
-1 cm
-1).
70
Monomeric GOx is a compact spheroid approximately 6 nm x 5.2 nm x 3.7 nm in
size; the dimer measures approximately 6 nm x 5.2 nm x 7.7 nm.71
The quaternary
structure of GOx is quite stable, retaining its dimeric conformation under normal
conditions, when exposed to heat, and even at low concentrations of chemical
denaturants.72
It is due to this surprising stability that O’Malley and Weaver incorrectly
reported in 1972 that GOx comprises two polypeptide chains covalently linked by
disulfide bonds.73
Since that report, there have been multiple follow-up studies that have
shown that the dimer contains two disulfide bonds and two free thiols, but no evidence
of a covalent linkage between the two subunits.74
2.2.2. Catalase
Cat is a tetrameric enzyme which acts upon hydrogen peroxide, decomposing it
into water and oxygen. The reaction scheme is shown below:
(2.2)
,
where is the intermediate form of the enzyme and and are rate constants (distinct
from the rate constants given above for GOx).75
Each monomer of Cat has one active site and one protohematin group, giving it
both UV and strong visible absorbance (ε406 nm = 3.6 x 10⁵ M
-1 cm
-1).
76 Like GOx, Cat
can also be purified from a variety of sources; however, bovine liver Cat is the most
common. Though not as common, Cat from A. niger is commercially available, and
15
multiple groups have shown that this form of Cat exhibits greater stability to high
concentrations of peroxide compared to bovine liver Cat.75, 77
With a molecular mass of
approximately 385 kDa according to Kikuchi-Torii and others, Cat from A. niger is also
larger than other Cat macromolecules (e.g., bovine liver Cat is 250 kDa).76
Finally, while
Cat from bovine liver is not glycosylated, A. niger Cat is glycosylated, with a total
carbohydrate content of 10.2% of its molecular mass (8.3% neutral sugar and 1.9%
glucosamine).76
Not only is the glycosylation of A. niger Cat likely responsible for the
greater stability (compared to Cat from bovine liver), the glycosylation sites also permit
the same modification strategies that are employed for GOx to be applied to Cat.
2.2.3. Enzyme Inactivation
Both GOx and Cat are susceptible to enzyme inactivation during storage and
operation. As discussed in Section 1, this inactivation causes issues with the sensor
response, requiring recalibration and ultimately replacement. In their 1987 paper, Tse
and Gough described these processes in detail.8 Spontaneous inactivation resulting from
enzyme denaturation is governed by first-order kinetics, in which the enzyme
inactivation rate is directly proportional to the concentration of enzyme:
, (2.3)
where is the active enzyme concentration, is time, and is the spontaneous
inactivation rate constant. For immobilized GOx and Cat from A. niger, the spontaneous
inactivation rate constants were determined to be 9.2 x 10⁻⁸
s-1
and 1.5 x 10⁻⁷
s-1
,
respectively.
16
Conversely, hydrogen peroxide-mediated inactivation follows second-order
kinetics, and the enzyme inactivation rate can be approximated as
, (2.4)
where is the hydrogen peroxide-mediated inactivation rate constant and is the
concentration of hydrogen peroxide. For immobilized Cat, the hydrogen peroxide-
mediated inactivation rate constant was determined to be 1.5 x 10⁻²
M-1
/s. For GOx, both
hydrogen peroxide-mediated inactivation of the reduced enzyme (ki = 2.0 x 10⁻²
M-1
/s)
and the oxidized enzyme–hydrogen peroxide complex (ki = 7.6 x 10⁻¹
M-1
/s) were shown
to be significant. The oxidized enzyme–hydrogen peroxide complex was 38 times more
susceptible to inactivation than the reduced form of the enzyme; however, at low oxygen
concentrations, inactivation was mainly due to hydrogen peroxide interaction with the
latter form, and the total inactivation rate was reduced.8 This is significant for
implantable glucose sensors, as tissue oxygen levels are expected to be quite low.78
No
dependence of the GOx oxidation state on the spontaneous inactivation rate was
observed, and both Cat and its intermediate form appear to be equally susceptible to both
types of inactivation.8
For our sensors, which will continuously be exposed to physiological levels of
glucose, it is expected that hydrogen peroxide-mediated inactivation will dominate—at
least during operation. Nevertheless, spontaneous deactivation will also be an issue,
especially during processing and storage. Other deactivating factors such as elevated
temperature and exposure to non-ideal solvents can be targeted as well and present an
opportunity to even further stabilize the enzymes. However, the application of the

17
enzyme stabilization techniques discussed earlier in this section are either not adequate
to accomplish these goals or not compatible with our sensing system; thus, new
stabilization strategies have been developed and are presented herein.
18
3. GLYCOSYLATION SITE-TARGETED PEGYLATION OF GLYCOENZYME*
3.1. Introduction
Protein PEGylation—the covalent attachment of PEG to a protein or peptide—
has been widely employed for therapeutic purposes since its introduction in 1977 by
Abuchowski and others.79
A number of reviews outline the benefits that PEGylation can
impart upon therapeutic proteins, such as enhanced circulation half-life in vivo and
decreased immunogenicity.21, 80-82
Until recently, modification of the ε-amino group of
superficial lysine residues with an amine-reactive PEG has been most commonly
employed due to the large number of these reactive groups (lysine residues comprise
10% of a typical protein83
); however, conjugates prepared using this technique are
typically heterogeneous and often require purification to isolate the preferred isoform.80,
81, 84 Furthermore, in enzymes, activity loss can be an issue when random multi-site
PEGylation is applied, which has been partially attributed to lower substrate binding
affinity due to steric hindrance of the binding site and disruption of the protein tertiary
structure.16-19
To overcome this issue, Zalipsky and co-workers designed a methoxy-
PEG-hydrazide (PEG-Hz) derivative that could be used to target oligosaccharides on
glycoproteins, allowing for PEGylation without disruption of the primary structure of the
enzyme.21, 22
* Parts of this section are reprinted with permission from “Glycosylation site-targeted PEGylation of
glucose oxidase retains native enzymatic activity” by D. W. Ritter, J. R. Roberts and M. J. McShane,
Enzyme Microb. Technol., 2013, 52, 279-285. Copyright 2013 by Elsevier Inc.
19
As discussed previously, our group has developed optical glucose biosensors that
are based on GOx,3-5
and recent work has focused on extending the operating lifetime of
these biosensors.6 Effective and appropriate enzyme stabilization strategies are
absolutely critical in moving these implantable devices toward the ultimate goal of long-
term monitoring. Loss of enzymatic activity of GOx can result in undesirable changes in
sensor response characteristics, necessitating frequent recalibration and decreasing
operational lifetime.
Given that PEG has been shown to stabilize enzymes and does not drastically
alter size or residence in the solution phase, PEGylation of GOx was considered as a
strategy to stabilize enzyme activity. As GOx is highly glycosylated, with a total
carbohydrate content of 18.8 ± 0.6% of its molecular mass,68
attachment of PEG-Hz is
an attractive option to avoid blocking the binding site or affecting the protein
conformation. Therefore, I hypothesized that PEGylation of GOx with PEG-Hz would
provide stability against enzyme deactivation without a significant reduction in initial
activity. To test this hypothesis, GOx was modified with PEG-Hz to target glycosylation
sites (Fig. 3-1), followed by physical characterization of the resulting modified enzyme,
and finally a comparison of the functional properties (i.e., initial activity, storage
stability, and operational stability) of native GOx and PEG-GOx. This work represents
the first full characterization (i.e., physical and functional) of GOx modified with PEG-
Hz.
20
Fig. 3-1 Cartoon illustrating attachment of PEG to glycosylation sites of GOx (not
drawn to scale).
3.2. Experimental
3.2.1. Materials
GOx from Aspergillus niger (type VII, 168.8 U/mg solid, 80% protein by biuret)
and peroxidase from Amoracia rusticana (type II, 188 U/mg solid) were obtained from
Sigma. PEG-Hz (4.5 kDa by gel permeation chromatography) was obtained from Laysan
Bio.
3.2.2. Preparation of PEGylated GOx
A modification of Zalipsky’s PEGylation protocol85
was used to prepare the
PEG-GOx and is illustrated below in Fig. 3-2. GOx (6 mg, 1) was dissolved in 1.8 mL of
10 mM sodium phosphate containing 154 mM NaCl (pH 7.2). Separately, 8.6 mg of
NaIO4 was dissolved in 200 µL of deionized water via alternating sonication and
vortexing, and the NaIO4 solution was protected from light. The NaIO4 solution was
immediately added to the GOx solution, and the sample was slowly agitated on a
nutating mixer. The mixture was reacted in the dark for 1 h at room temperature to yield
2.
Glucose oxidase
Glycosylation
sites
PEGylation with
mPEG-hydrazide
21
Fig. 3-2 Glycosylation site-targeted PEGylation of GOx. Oxidation of glycosylation
sites on GOx yields reactive aldehydes, to which the hydrazide functionality on PEG-Hz
can be covalently bound. The resulting hydrazone linkages are reduced for stability, and
unreacted aldehydes are blocked with ethanolamine.
It is important to note that proteins exposed to oxidants such as NaIO4 have been
reported to form higher-order oligomers in certain cases due to intermolecular
crosslinking; however, Nakamura and others exposed GOx from A. niger to a five-fold
higher concentration of NaIO4 for 5 h and found that the size and shape of the oxidized
GOx was essentially the same as the native GOx.86
Nevertheless, a small amount of
aggregated GOx might be observed and should not be a cause for concern as it will be
removed during subsequent desalting or purification.
22
The reaction was quenched by the addition of 2.5 µL of glycerol, corresponding
to a 20-fold molar excess of glycerol to NaIO4. The oxidized GOx was purified using a
desalting column equilibrated with 100 mM sodium phosphate containing 154 mM NaCl
(pH 6.0) to remove excess NaIO4, glycerol, and degradation products from glycerol
quenching (i.e., formaldehyde and formic acid).
PEG-Hz (33.8 mg) was added to the oxidized GOx solution, yielding a 200-fold
molar excess of PEG-Hz to GOx. The extremely low pKa of the hydrazide reactive
group (pKa = 3), paired with its smaller size and large molar excess as compared to the
GOx, makes attachment of PEG more favorable than intermolecular crosslinking
between oxidized sugars and superficial amines on GOx. The reaction solution was
reacted in the dark for 2 h at room temperature under gentle agitation to yield 3. In a
fume hood, 20 µL of 5 M NaBH3CN in 1 N NaOH was added. Caution: NaBH3CN is
extremely toxic; as such, all operations should be performed with care in a fume
hood. The NaBH3CN was reacted with PEG-GOx for 30 min at room temperature under
gentle agitation to yield 4. Unreacted aldehydes were blocked by addition of 100 µL of 1
M ethanolamine (pH 9.6) and reaction for 30 min at room temperature under gentle
agitation to yield 5. The PEG-GOx was purified from low-molecular-weight
contaminants using a desalting column equilibrated with 10 mM sodium phosphate
containing 154 mM NaCl (pH 7.2).
23
3.2.3. Physical Characterization
3.2.3.1. Liquid Chromatography
Gel filtration chromatography (GFC) was performed to separate the PEG-GOx
from unattached PEG-Hz (i.e., purify the conjugate), but it also provided information
about the physical characteristics of the conjugate. The samples were injected into a
liquid chromatography system (GE Healthcare Life Sciences model ÄKTAexplorer 10)
equipped with a gel-filtration column (GE Healthcare Life Sciences model HiLoad
Superdex 200 PG) equilibrated with 10 mM sodium phosphate containing 150 mM NaCl
(pH 7.2). Absorbance at 280 nm was monitored and 2 mL fractions were collected.
3.2.3.2. Gel Electrophoresis
Reducing sodium dodecyl sulfate polyacrylamide gel electrophoresis was
performed to test for an increase in the hydrodynamic size of GOx as a result of the
PEGylation process. Protein samples were combined with sample buffer (containing 54
mg/mL DL-dithiothreitol), vigorously agitated, and loaded onto a 10-well, 10% precast
polyacrylamide gel (Bio-Rad model 456-1033); all samples were duplicated
symmetrically on the gel (i.e., the first sample was loaded onto lane 1 and lane 10, etc.).
Following electrophoresis, the gel was rinsed three times with deionized water and cut
between lanes 5 and 6 so that half of the lanes could be stained for protein and the other
half for PEG. To stain for protein, one half of the gel was placed in 30 mL of the
Coomassie staining solution for 1 h, followed by rinsing with deionized water overnight.
To stain for PEG, the other half of the gel was placed in 30 mL of perchloric acid for 15
min, and then 10 mL of 5% w/v barium chloride and 4 mL of 0.1 N iodine were added.
24
The gel was stained for 10 min, followed by extensive rinsing with deionized water.87
Both stained halves of the gel were imaged separately using a gel imaging system (Bio-
Rad model 170-8270).
3.2.3.3. Mass Spectrometry
Mass spectra were acquired with a matrix-assisted laser desorption/ionization
time-of-flight (MALDI-TOF) mass spectrometer (Shimadzu model Axima-CFR)
operating in linear mode to determine the extent of PEGylation (i.e., the number of PEG
chains attached per GOx). Protein samples (3 mg/ml) in 10 mM sodium phosphate
containing 154 mM NaCl (pH 7.2) were concentrated and desalted (Millipore model
ZipTipC4 Pipette Tips); the eluate was spotted directly onto a steel sample plate, where it
was combined with an equal volume of saturated sinapinic acid solution and air-dried.
3.2.3.4. Particle Sizing
A photon correlation spectrometer (Malvern model Zetasizer Nano ZS) was used
to acquire size distributions of the GOx and PEG-GOx samples. This was necessary to
determine the change in size after modification, as well as to gauge the extent of
oligomerization during oxidation or subsequent PEGylation. Disposable 3.5 mL cuvettes
were filled with enzyme (1 mL, 0.6 mg/mL) in 10 mM sodium phosphate containing 154
mM NaCl (pH 7.2).
3.2.4. Functional Characterization
3.2.4.1. Enzymatic Activity Assays
Enzymatic assays of PEG-GOx and native GOx were performed to determine
activity.88
The enzyme is added to a reaction cocktail comprising an excess of D-glucose
25
(to fix GOx at Vmax), horseradish peroxidase, and o-dianisidine dihydrochloride. The
consumption of glucose results in an equimolar production of H2O2, which is directly
proportional to the concentration of GOx in the solution. In the presence of H2O2,
peroxidase will oxidize o-dianisidine to form a product that absorbs at 500 nm (ε = 7.5
mM-1
cm-1
), and the rate of formation of this colored product is a measure of the
enzymatic activity of the solution. In all cases, enzymatic activity measurements were
performed in triplicate at pH 5.1 and 35 °C using a UV/Vis spectrophotometer
(PerkinElmer model LAMBDA 45); these conditions are utilized for activity
measurements primarily because it is standard to define GOx activity under these
conditions (i.e., 1.0 U of GOx will oxidize 1.0 µmol of β-D-glucose to D-gluconolactone
and H2O2 per minute at pH 5.1 and 35 °C). To calculate specific activity, the enzyme
concentration must be known. All enzyme concentrations were determined by UV/Vis
spectroscopy using a molar extinction coefficient of 2.672 x 10⁵ M
-1cm
-1 (λ = 280 nm).
3.2.4.2. Long-Term Storage Stability
To observe the effect that PEGylation has on the spontaneous denaturation of
GOx, PEG-GOx and native GOx were stored at 37 °C (elevated temperature to
accelerate deactivation and simulate physiological conditions) in the absence of glucose
and assayed over the course of 29 days. Sealed vials (one per sample per timepoint)
containing 0.3 mL of enzyme solution (50 µg/mL in 10 mM phosphate-buffered saline
[PBS] containing 0.02% NaN3 as a preservative) were stored in an incubator until the
appropriate time to test for enzymatic activity. To reduce the possibility for sample
26
contamination, samples were not opened until the day they were assayed for enzymatic
activity.
3.2.4.3. Operational Stability
To compare the rates of deactivation for PEG-GOx and native GOx under
operating conditions, a study of activity during continuous exposure to glucose was
performed. Enzyme solution (0.25 mL, 0.25 mg/mL) was injected into a dialysis cassette
(10 kDa molecular-weight cutoff, 0.5 mL capacity) and placed into 1 L of 10 mM
sodium phosphate containing 154 mM NaCl and 5% w/v glucose (pH 7.2). Both
solutions were stirred and air-equilibrated by bubbling air through a gas diffuser. After
24 h at room temperature, the dialysis cassettes were transferred into 1 L of 10 mM
sodium phosphate containing 154 mM NaCl (pH 7.2). The dialysate was tested for the
presence of glucose using a biochemical analyzer (YSI Life Sciences model 2700
SELECT Biochemistry Analyzer) and exchanged for fresh buffer until glucose levels
were undetectable. At that point, protein samples were removed from the dialysis
cassettes and assayed for enzymatic activity. As a control, PEG-GOx and native GOx
samples not exposed to glucose were also assayed for enzymatic activity.
3.3. Results and Discussion
3.3.1. Physical Characterization
It is important to note that of the various analytical techniques used to
characterize the PEG-GOx and native GOx, mass spectrometry is the only one expected
to provide actual molecular mass of the samples. In contrast, liquid chromatography, gel
electrophoresis, and dynamic light scattering (DLS) can only provide apparent molecular
27
mass of the samples based on calibration curves constructed using non-PEGylated
protein molecular mass standards. These apparent molecular masses can differ greatly
from the actual molecular masses.
Fig. 3-3 Overlaid chromatograms of PEG-GOx (maroon line) and native GOx (gray
line). Native GOx eluted at 67.52 mL and is estimated to be 140 kDa, while PEG-GOx
eluted at 56.33 mL (molecular mass cannot be estimated as it is out of the calibration
range).
3.3.1.1. Liquid Chromatography
Fig. 3-3 contains the overlaid chromatograms of PEG-GOx (maroon line) and
native GOx (gray line) subjected to GFC. A calibration curve was compiled using seven
proteins over a wide range of molecular masses within the column’s fractionation range
(i.e., 10–600 kDa) and was used to convert elution volume to molecular mass (Fig. 3-4).
Native GOx (elution volume of 67.52 mL) is estimated to be 140 kDa, while the
apparent molecular mass of PEG-GOx (elution volume of 56.33 mL) could not be
estimated because it eluted before the largest calibrant (i.e., thyroglobulin with a
28
molecular mass of 669 kDa and an elution volume of 60.3 mL). Therefore, while the
column that was chosen for GFC was appropriate to separate the bioconjugate from the
native GOx, the only conclusion that can be drawn concerning the bioconjugate’s
apparent molecular mass is that it is larger than thyroglobulin.
Fig. 3-4 Calibration curve for HiLoad Superdex 200 PG gel-filtration column.
Calibrants are shown as black circles and fitted with a sigmoidal curve (dotted line). The
point on the curve corresponding to the GOx elution volume is depicted as a gray cross.
3.3.1.2. Gel Electrophoresis
Fig. 3-5 shows a composite image of the gel on which PEG-GOx and native GOx
were electrophoresed. The left half of Fig. 3-5, which depicts the half of the gel that was
stained and imaged for the presence of protein, clearly shows an increase in the apparent
monomer molecular mass upon PEGylation of GOx; lane 2 containing native GOx
displays a band at 86.4 kDa, while lane 4 containing the PEG-GOx displays a band at
182.2 kDa. It is obvious that the sample bands corresponding to the native and the PEG-
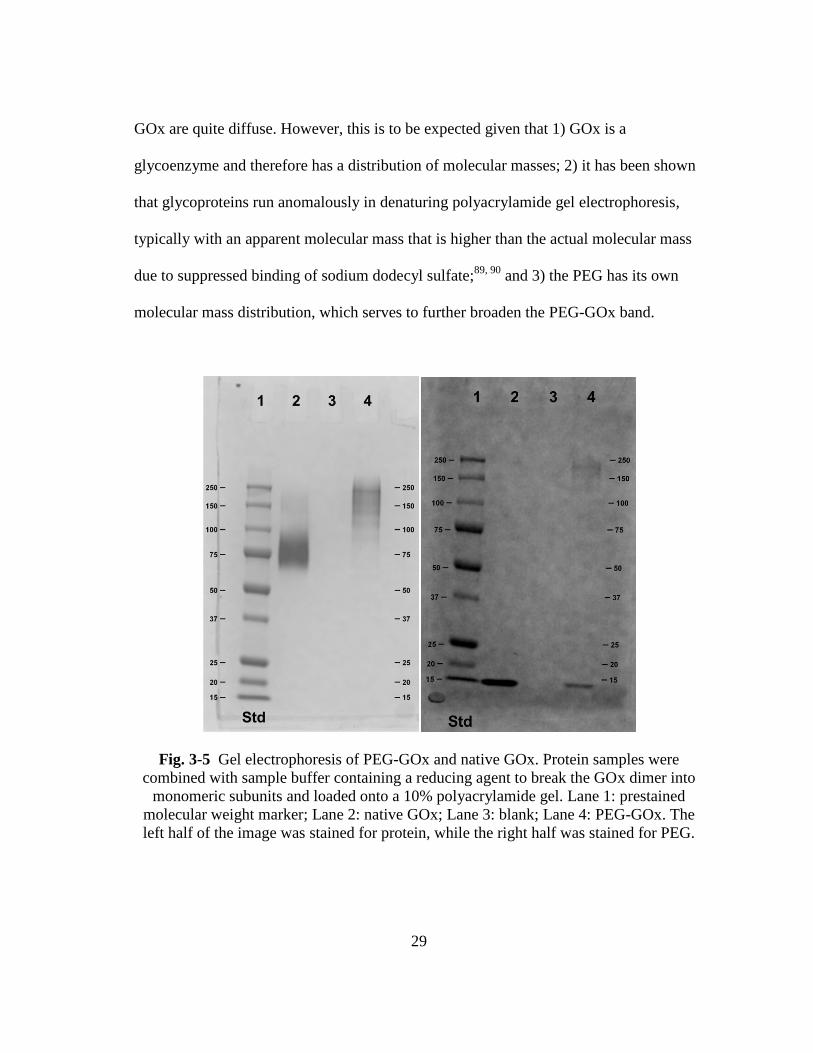
29
GOx are quite diffuse. However, this is to be expected given that 1) GOx is a
glycoenzyme and therefore has a distribution of molecular masses; 2) it has been shown
that glycoproteins run anomalously in denaturing polyacrylamide gel electrophoresis,
typically with an apparent molecular mass that is higher than the actual molecular mass
due to suppressed binding of sodium dodecyl sulfate;89, 90
and 3) the PEG has its own
molecular mass distribution, which serves to further broaden the PEG-GOx band.
Fig. 3-5 Gel electrophoresis of PEG-GOx and native GOx. Protein samples were
combined with sample buffer containing a reducing agent to break the GOx dimer into
monomeric subunits and loaded onto a 10% polyacrylamide gel. Lane 1: prestained
molecular weight marker; Lane 2: native GOx; Lane 3: blank; Lane 4: PEG-GOx. The
left half of the image was stained for protein, while the right half was stained for PEG.
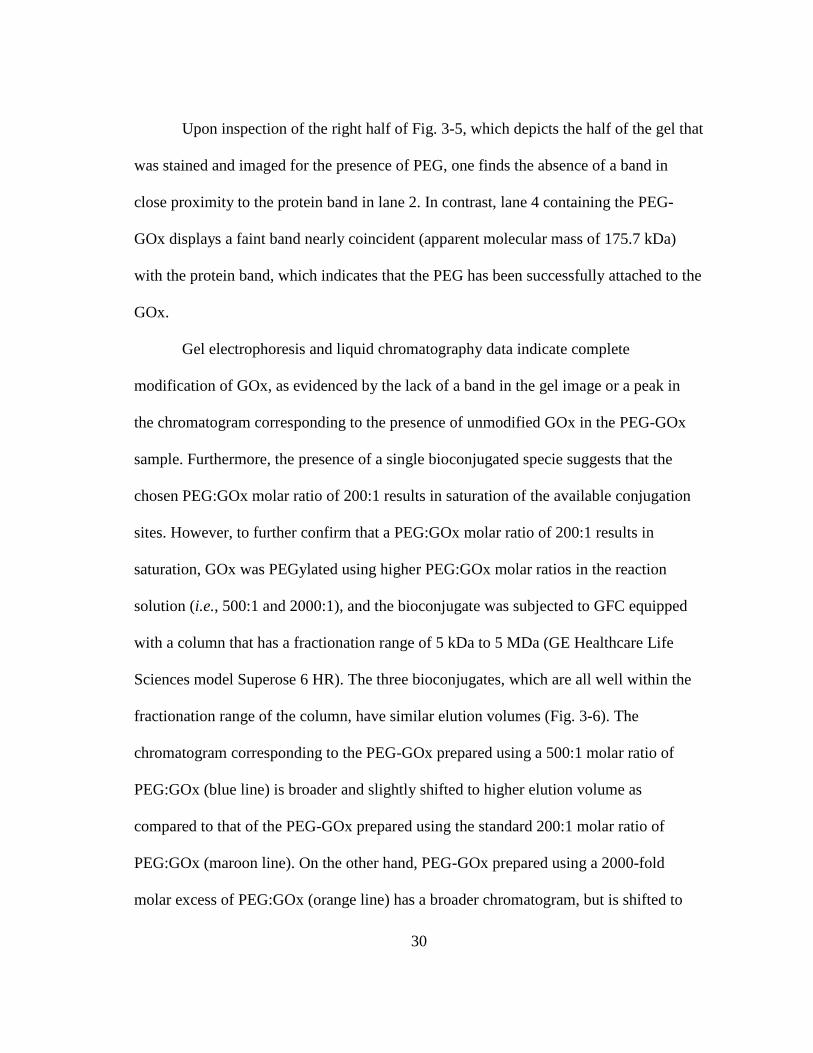
30
Upon inspection of the right half of Fig. 3-5, which depicts the half of the gel that
was stained and imaged for the presence of PEG, one finds the absence of a band in
close proximity to the protein band in lane 2. In contrast, lane 4 containing the PEG-
GOx displays a faint band nearly coincident (apparent molecular mass of 175.7 kDa)
with the protein band, which indicates that the PEG has been successfully attached to the
GOx.
Gel electrophoresis and liquid chromatography data indicate complete
modification of GOx, as evidenced by the lack of a band in the gel image or a peak in
the chromatogram corresponding to the presence of unmodified GOx in the PEG-GOx
sample. Furthermore, the presence of a single bioconjugated specie suggests that the
chosen PEG:GOx molar ratio of 200:1 results in saturation of the available conjugation
sites. However, to further confirm that a PEG:GOx molar ratio of 200:1 results in
saturation, GOx was PEGylated using higher PEG:GOx molar ratios in the reaction
solution (i.e., 500:1 and 2000:1), and the bioconjugate was subjected to GFC equipped
with a column that has a fractionation range of 5 kDa to 5 MDa (GE Healthcare Life
Sciences model Superose 6 HR). The three bioconjugates, which are all well within the
fractionation range of the column, have similar elution volumes (Fig. 3-6). The
chromatogram corresponding to the PEG-GOx prepared using a 500:1 molar ratio of
PEG:GOx (blue line) is broader and slightly shifted to higher elution volume as
compared to that of the PEG-GOx prepared using the standard 200:1 molar ratio of
PEG:GOx (maroon line). On the other hand, PEG-GOx prepared using a 2000-fold
molar excess of PEG:GOx (orange line) has a broader chromatogram, but is shifted to
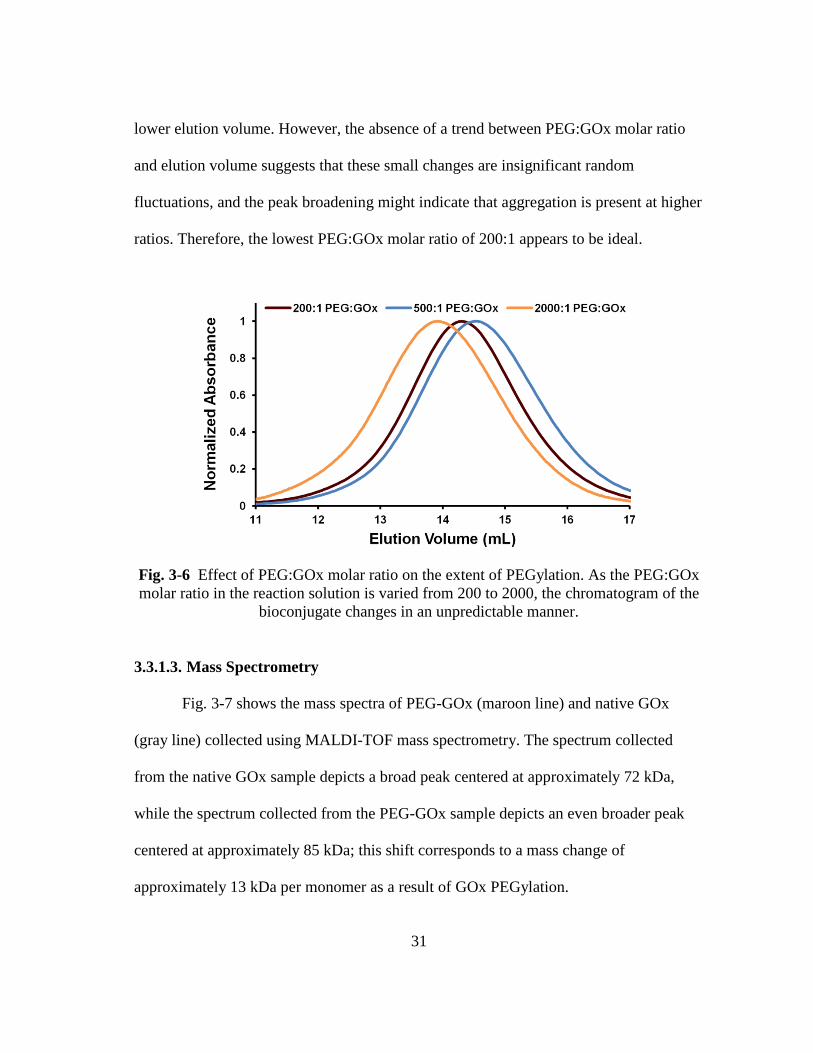
31
lower elution volume. However, the absence of a trend between PEG:GOx molar ratio
and elution volume suggests that these small changes are insignificant random
fluctuations, and the peak broadening might indicate that aggregation is present at higher
ratios. Therefore, the lowest PEG:GOx molar ratio of 200:1 appears to be ideal.
Fig. 3-6 Effect of PEG:GOx molar ratio on the extent of PEGylation. As the PEG:GOx
molar ratio in the reaction solution is varied from 200 to 2000, the chromatogram of the
bioconjugate changes in an unpredictable manner.
3.3.1.3. Mass Spectrometry
Fig. 3-7 shows the mass spectra of PEG-GOx (maroon line) and native GOx
(gray line) collected using MALDI-TOF mass spectrometry. The spectrum collected
from the native GOx sample depicts a broad peak centered at approximately 72 kDa,
while the spectrum collected from the PEG-GOx sample depicts an even broader peak
centered at approximately 85 kDa; this shift corresponds to a mass change of
approximately 13 kDa per monomer as a result of GOx PEGylation.
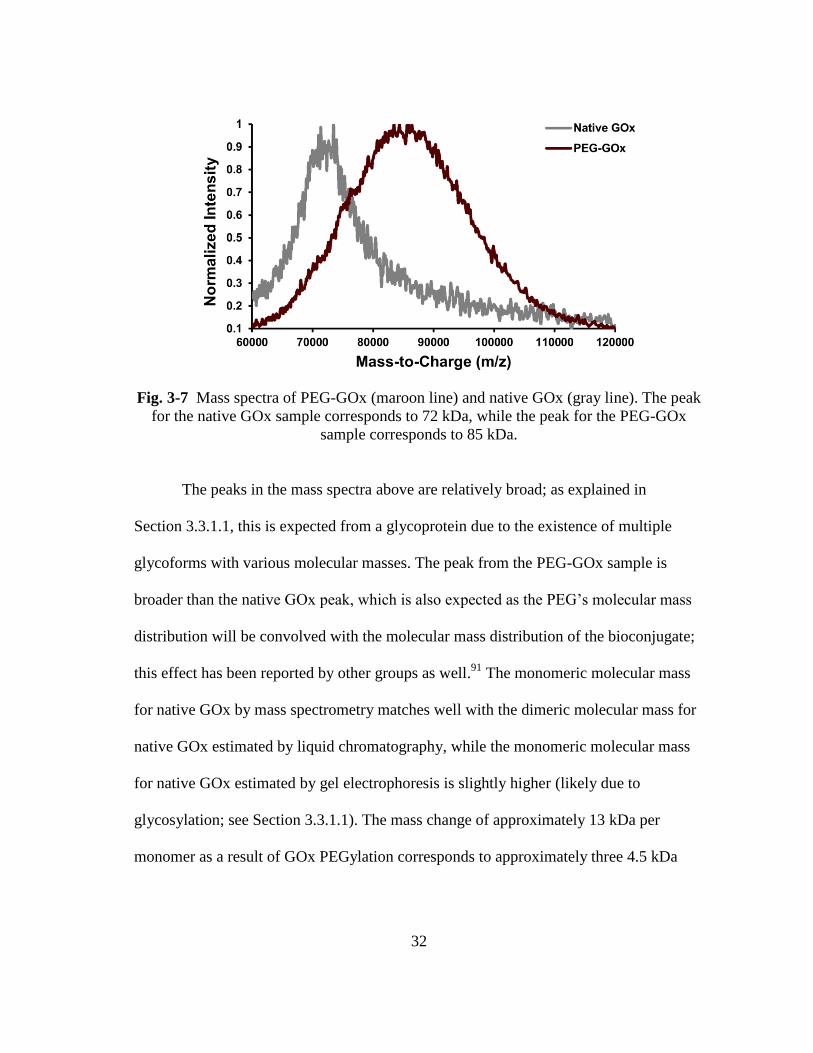
32
Fig. 3-7 Mass spectra of PEG-GOx (maroon line) and native GOx (gray line). The peak
for the native GOx sample corresponds to 72 kDa, while the peak for the PEG-GOx
sample corresponds to 85 kDa.
The peaks in the mass spectra above are relatively broad; as explained in
Section 3.3.1.1, this is expected from a glycoprotein due to the existence of multiple
glycoforms with various molecular masses. The peak from the PEG-GOx sample is
broader than the native GOx peak, which is also expected as the PEG’s molecular mass
distribution will be convolved with the molecular mass distribution of the bioconjugate;
this effect has been reported by other groups as well.91
The monomeric molecular mass
for native GOx by mass spectrometry matches well with the dimeric molecular mass for
native GOx estimated by liquid chromatography, while the monomeric molecular mass
for native GOx estimated by gel electrophoresis is slightly higher (likely due to
glycosylation; see Section 3.3.1.1). The mass change of approximately 13 kDa per
monomer as a result of GOx PEGylation corresponds to approximately three 4.5 kDa
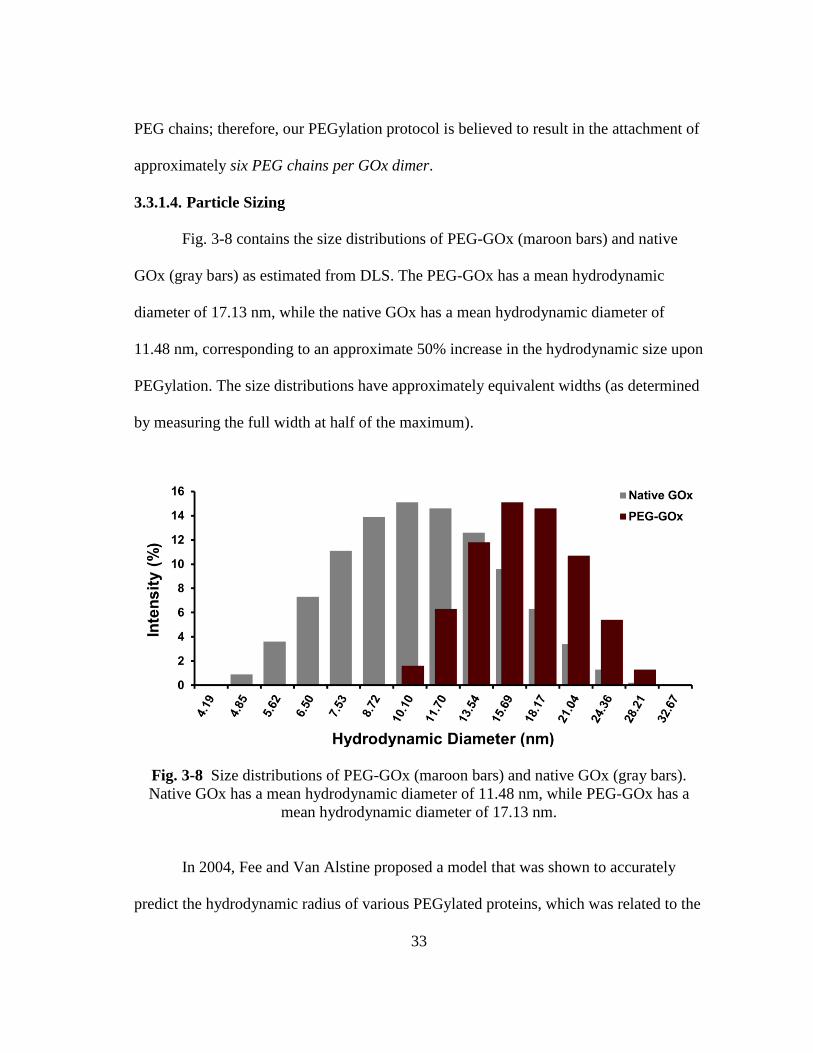
33
PEG chains; therefore, our PEGylation protocol is believed to result in the attachment of
approximately six PEG chains per GOx dimer.
3.3.1.4. Particle Sizing
Fig. 3-8 contains the size distributions of PEG-GOx (maroon bars) and native
GOx (gray bars) as estimated from DLS. The PEG-GOx has a mean hydrodynamic
diameter of 17.13 nm, while the native GOx has a mean hydrodynamic diameter of
11.48 nm, corresponding to an approximate 50% increase in the hydrodynamic size upon
PEGylation. The size distributions have approximately equivalent widths (as determined
by measuring the full width at half of the maximum).
Fig. 3-8 Size distributions of PEG-GOx (maroon bars) and native GOx (gray bars).
Native GOx has a mean hydrodynamic diameter of 11.48 nm, while PEG-GOx has a
mean hydrodynamic diameter of 17.13 nm.
In 2004, Fee and Van Alstine proposed a model that was shown to accurately
predict the hydrodynamic radius of various PEGylated proteins, which was related to the
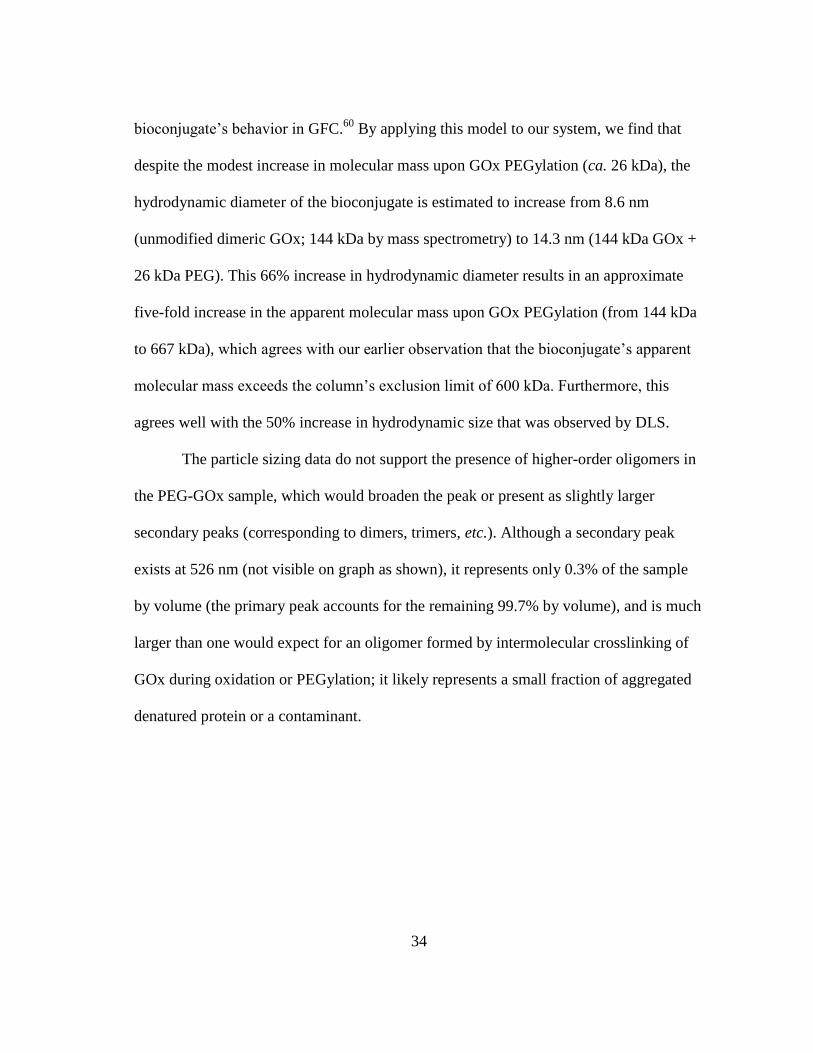
34
bioconjugate’s behavior in GFC.60
By applying this model to our system, we find that
despite the modest increase in molecular mass upon GOx PEGylation (ca. 26 kDa), the
hydrodynamic diameter of the bioconjugate is estimated to increase from 8.6 nm
(unmodified dimeric GOx; 144 kDa by mass spectrometry) to 14.3 nm (144 kDa GOx +
26 kDa PEG). This 66% increase in hydrodynamic diameter results in an approximate
five-fold increase in the apparent molecular mass upon GOx PEGylation (from 144 kDa
to 667 kDa), which agrees with our earlier observation that the bioconjugate’s apparent
molecular mass exceeds the column’s exclusion limit of 600 kDa. Furthermore, this
agrees well with the 50% increase in hydrodynamic size that was observed by DLS.
The particle sizing data do not support the presence of higher-order oligomers in
the PEG-GOx sample, which would broaden the peak or present as slightly larger
secondary peaks (corresponding to dimers, trimers, etc.). Although a secondary peak
exists at 526 nm (not visible on graph as shown), it represents only 0.3% of the sample
by volume (the primary peak accounts for the remaining 99.7% by volume), and is much
larger than one would expect for an oligomer formed by intermolecular crosslinking of
GOx during oxidation or PEGylation; it likely represents a small fraction of aggregated
denatured protein or a contaminant.
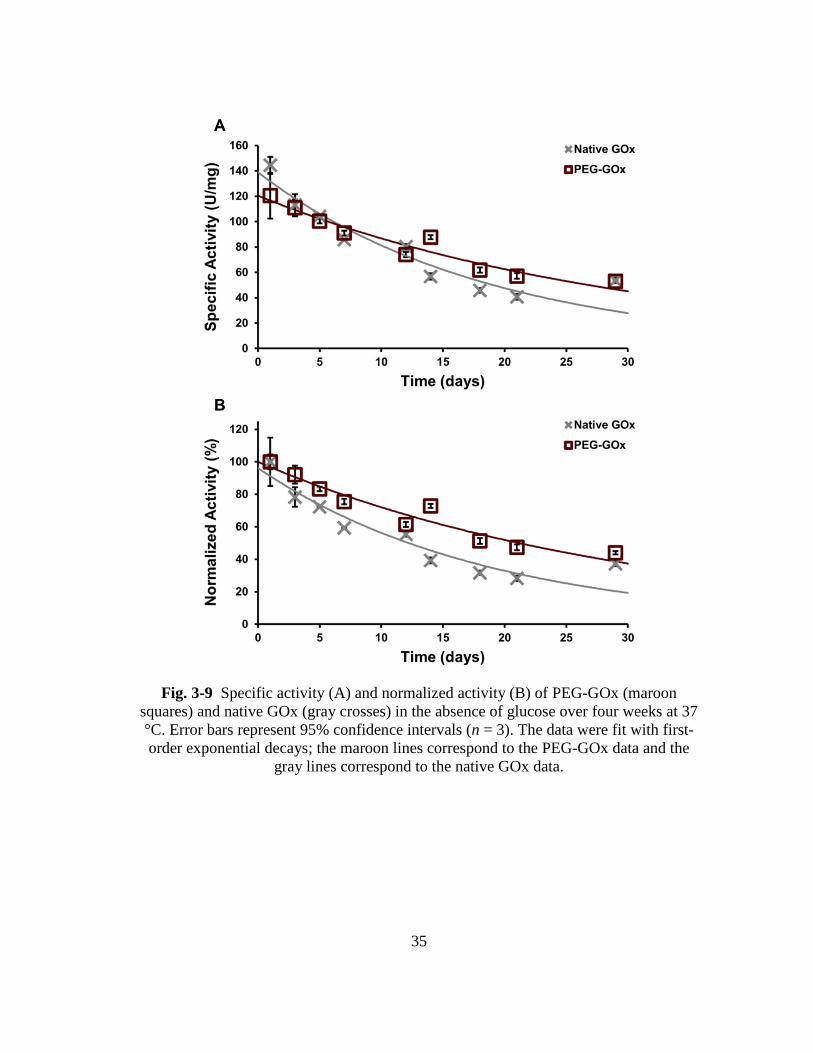
35
Fig. 3-9 Specific activity (A) and normalized activity (B) of PEG-GOx (maroon
squares) and native GOx (gray crosses) in the absence of glucose over four weeks at 37
°C. Error bars represent 95% confidence intervals (n = 3). The data were fit with first-
order exponential decays; the maroon lines correspond to the PEG-GOx data and the
gray lines correspond to the native GOx data.
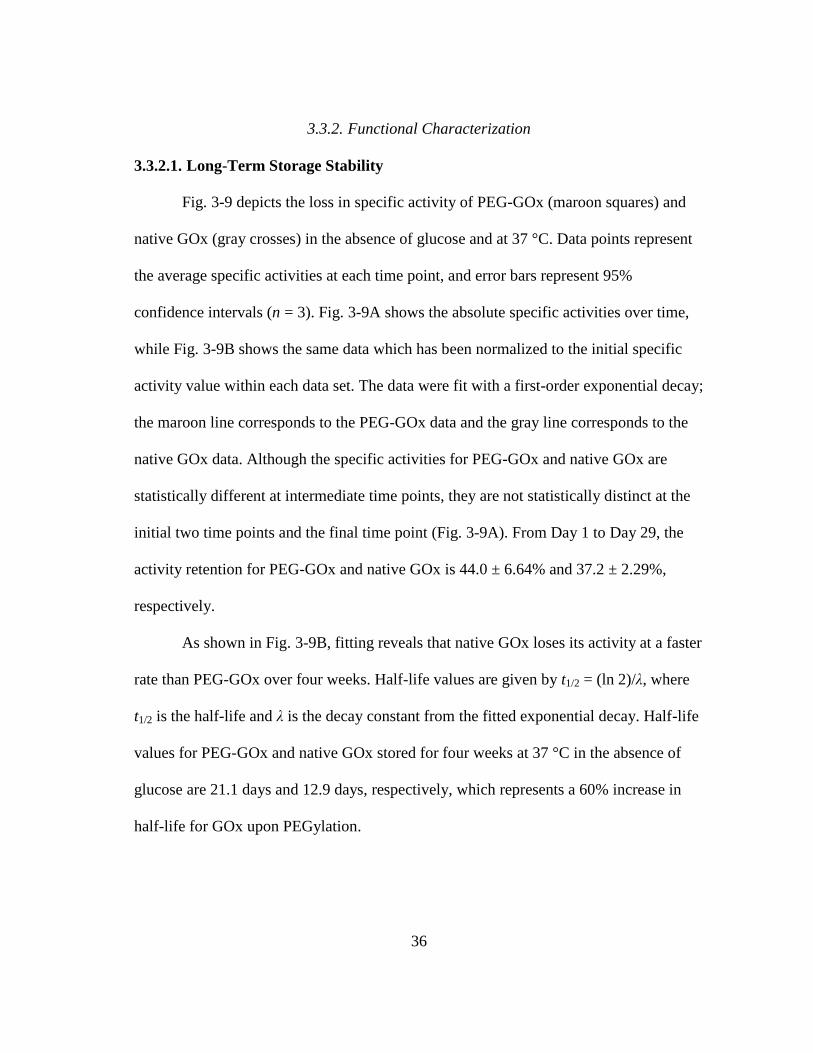
36
3.3.2. Functional Characterization
3.3.2.1. Long-Term Storage Stability
Fig. 3-9 depicts the loss in specific activity of PEG-GOx (maroon squares) and
native GOx (gray crosses) in the absence of glucose and at 37 °C. Data points represent
the average specific activities at each time point, and error bars represent 95%
confidence intervals (n = 3). Fig. 3-9A shows the absolute specific activities over time,
while Fig. 3-9B shows the same data which has been normalized to the initial specific
activity value within each data set. The data were fit with a first-order exponential decay;
the maroon line corresponds to the PEG-GOx data and the gray line corresponds to the
native GOx data. Although the specific activities for PEG-GOx and native GOx are
statistically different at intermediate time points, they are not statistically distinct at the
initial two time points and the final time point (Fig. 3-9A). From Day 1 to Day 29, the
activity retention for PEG-GOx and native GOx is 44.0 ± 6.64% and 37.2 ± 2.29%,
respectively.
As shown in Fig. 3-9B, fitting reveals that native GOx loses its activity at a faster
rate than PEG-GOx over four weeks. Half-life values are given by t1/2 = (ln 2)/λ, where
t1/2 is the half-life and λ is the decay constant from the fitted exponential decay. Half-life
values for PEG-GOx and native GOx stored for four weeks at 37 °C in the absence of
glucose are 21.1 days and 12.9 days, respectively, which represents a 60% increase in
half-life for GOx upon PEGylation.
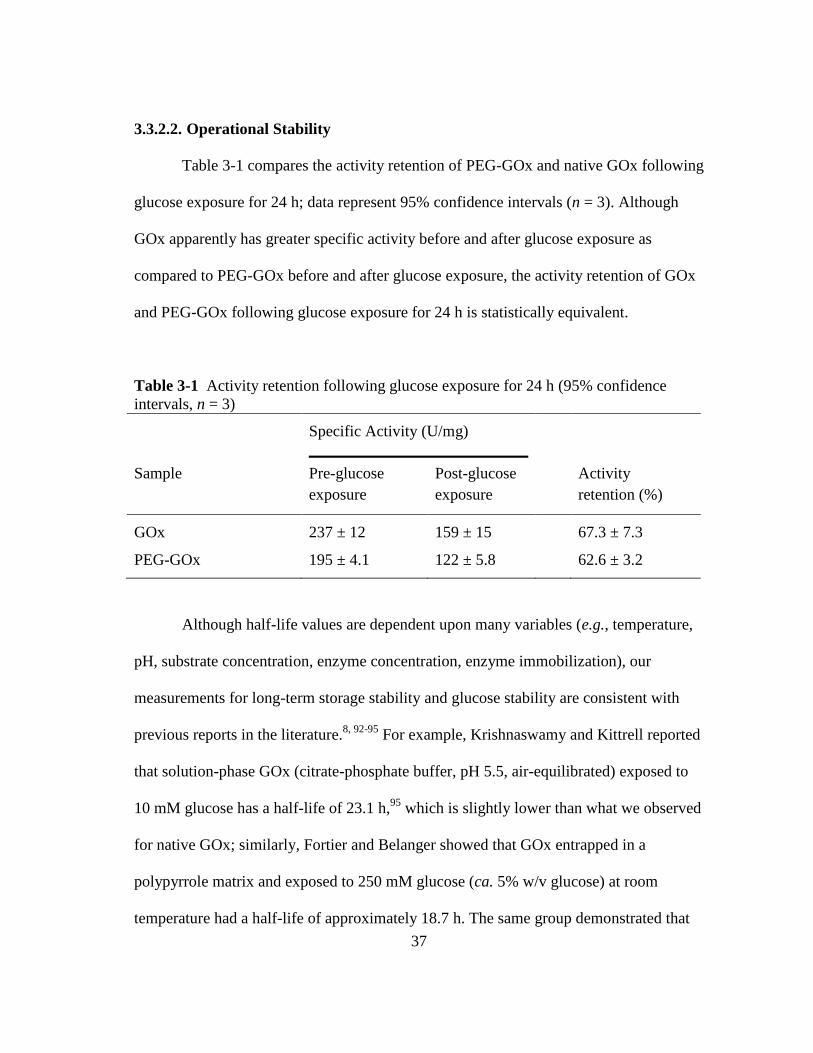
37
3.3.2.2. Operational Stability
Table 3-1 compares the activity retention of PEG-GOx and native GOx following
glucose exposure for 24 h; data represent 95% confidence intervals (n = 3). Although
GOx apparently has greater specific activity before and after glucose exposure as
compared to PEG-GOx before and after glucose exposure, the activity retention of GOx
and PEG-GOx following glucose exposure for 24 h is statistically equivalent.
Table 3-1 Activity retention following glucose exposure for 24 h (95% confidence
intervals, n = 3)
Specific Activity (U/mg)
Sample Pre-glucose
exposure
Post-glucose
exposure
Activity
retention (%)
GOx 237 ± 12 159 ± 15 67.3 ± 7.3
PEG-GOx 195 ± 4.1 122 ± 5.8 62.6 ± 3.2
Although half-life values are dependent upon many variables (e.g., temperature,
pH, substrate concentration, enzyme concentration, enzyme immobilization), our
measurements for long-term storage stability and glucose stability are consistent with
previous reports in the literature.8, 92-95
For example, Krishnaswamy and Kittrell reported
that solution-phase GOx (citrate-phosphate buffer, pH 5.5, air-equilibrated) exposed to
10 mM glucose has a half-life of 23.1 h,95
which is slightly lower than what we observed
for native GOx; similarly, Fortier and Belanger showed that GOx entrapped in a
polypyrrole matrix and exposed to 250 mM glucose (ca. 5% w/v glucose) at room
temperature had a half-life of approximately 18.7 h. The same group demonstrated that
38
solution-phase GOx has a half-life of 6 h at 50 °C in the absence of glucose,93
which is
significantly lower than what we observed at 37 °C. However, Tse and Gough reported a
much higher half-life (i.e., 87.2 days) for immobilized GOx stored in the absence of
glucose at 37 °C in 0.1 M phosphate buffer (pH 7.3).8
Our findings agree well with work reported by Unterweger and others91
on a
PEGylated S218C mutant of L-lactate oxidase. Wild-type L-lactate oxidase from
Aerococcus viridans is a homotetrameric enzyme with a molecular mass of 164 kDa and
a flavin mononucleotide prosthetic group.96
This group showed that site-specific
PEGylation of a mutated L-lactate oxidase with one or two maleimide-activated PEGs
caused a small decrease (ca. 30%) in specific activity and did not alter the enzymatic
stability of the mutant.91
Conversely, Slavica and others97
showed that orthogonal
maleimide-thiol coupling of D-amino acid oxidase from Trigonopsis variabilis (a non-
glycosylated homodimeric FAD-dependent oxidase of 76 kDa)98
with three maleimide-
activated PEGs resulted in a marked decrease in substrate catalytic efficiency for the
dioxygen-dependent reaction. Finally, there have been mixed reports concerning post-
PEGylation activity when amine-reactive PEGs are employed, with some studies
demonstrating complete retention of enzymatic activity99, 100
and others indicating partial
loss of enzymatic activity.16-19
3.4. Conclusions
PEG-Hz was covalently coupled to periodate-oxidized glycosylation sites of
GOx from A. niger. Liquid chromatography and gel electrophoresis data indicate that the
PEGylation protocol resulted in a drastic increase in the apparent molecular mass of
39
GOx, with complete conversion to the bioconjugate. Mass spectrometry data prove that
the extent of PEGylation was three PEG chains per GOx subunit (i.e., six PEG chains
per GOx dimer). Particle sizing data do not support the presence of higher-order
oligomers in the PEG-GOx sample. Enzymatic activity assays of PEG-GOx and native
GOx revealed that the bioconjugate’s performance was statistically equivalent to native
GOx in terms of activity retention over the 29 day time period and following the 24 h
glucose exposure, although a 60% increase in half-life was realized upon PEGylation.
However, coupling of other potentially stabilizing molecules (e.g., other synthetic or
natural polymers, proteins, etc.) to GOx via its glycosylation sites can now be explored
as it is likely that targeted attachment to these sites will not have a detrimental effect on
enzymatic activity.
40
4. CHEMICAL MODIFICATION OF PEGYLATED GLYCOENZYME*
4.1. Introduction
As discussed in Section 2, many enzyme stabilization approaches have been
demonstrated. Of these, carrier-free crosslinking-based techniques such as CLECs and
CLEAs stand out for their ability to effectively stabilize an enzyme’s tertiary and
quaternary structure (i.e., preventing denaturation and subunit dissociation) without
“diluting” the activity.10, 11, 15
However, the resulting particles are large and polydisperse
(ca. 5-50 µm), they no longer reside in the solution phase, and significant transport
barriers are expected. If these types of techniques could be reduced to the single-enzyme
level, stabilization might still be possible, and some of the undesirable properties
associated with CLECs and CLEAs could be avoided.
In this section, a novel approach to enzyme stabilization is demonstrated, which
offers marked advantages over previously reported techniques. In Section 3,
glycosylation site-targeted PEGylation of GOx was shown to have little effect on the
functional properties of the enzyme. However, the polymeric shell substantially
increased the radius of the conjugate (by ca. 50–66%), and PEGylation did not involve
reaction of the enzyme’s superficial amine groups; the technique presented herein
leverages these two properties of GOx PEGylated in this manner. I hypothesized that
this inert buffering layer deposited on the surface of each GOx molecule would permit
* Parts of this section are reprinted from D. W. Ritter, J. M. Newton and M. J. McShane, RSC Adv., 2014,
4, 28036-28040 – Reproduced by permission of The Royal Society of Chemistry. Available online at
http://pubs.rsc.org/en/Content/ArticleLanding/2014/RA/c4ra03809f.
41
subsequent chemical modification to be performed to stabilize the enzyme, while
preventing GOx molecules from reacting with one another. Such intermolecular
crosslinking results in irreversible, large-scale aggregate formation,25
which can lead to a
decrease in apparent enzyme activity resulting from substrate inaccessibility to its
binding site. Aggregate formation would also preclude the use of the stabilized enzyme
in applications which require the macromolecule to be in solution phase and/or near-
native size. Furthermore, preservation of the enzyme’s reactive primary amines via this
PEGylation route is key to permit effective modification by an amine-reactive
dialdehyde such as GA.25
This straightforward approach combines two well-established modification
strategies: 1) initial PEGylation of an enzyme to provide steric protection, followed by
2) chemical modification with GA in an effort to stabilize the enzyme’s tertiary and
quaternary structures (Fig. 4-1). The intention was to stabilize GOx in a way that permits
subsequent homogenous distribution and entrapment within an optical biosensing
hydrogel; however, this approach could in principle be applied to a myriad of other
proteins for different applications, which might include tissue engineering and
therapeutic biologicals. It is demonstrated that this technique results in dramatic
increases in long-term storage stability for GOx, while avoiding undesirable aggregate
formation.
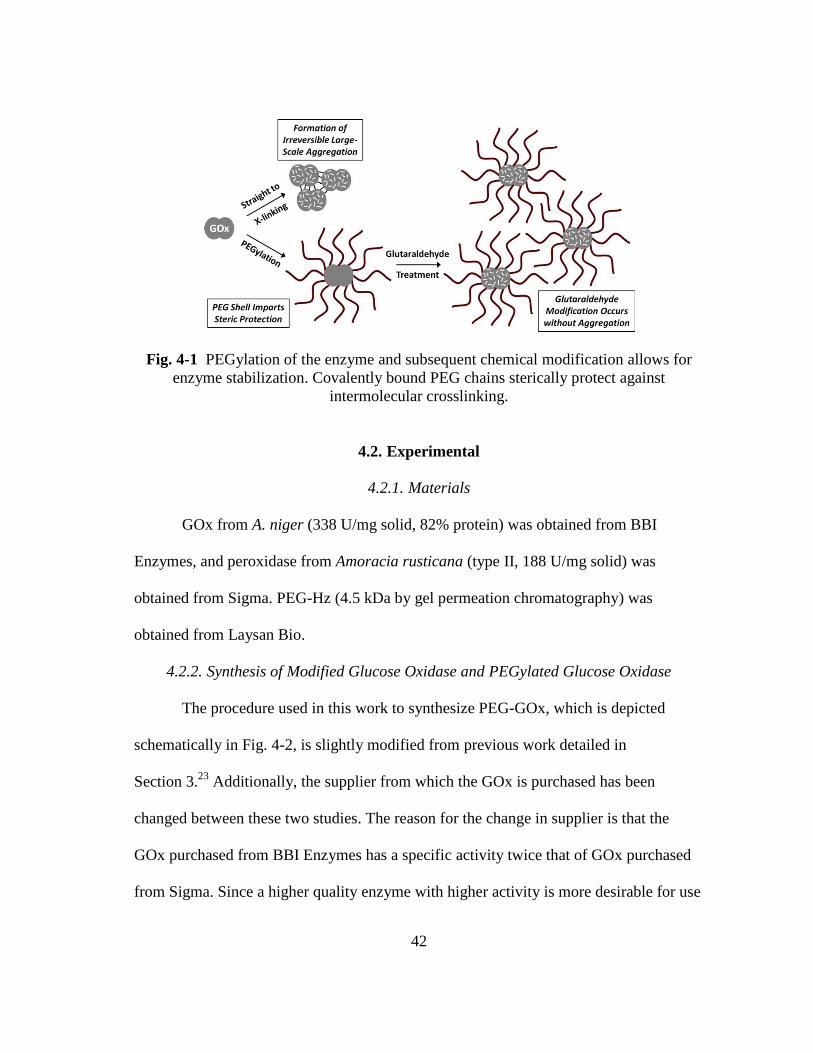
42
Fig. 4-1 PEGylation of the enzyme and subsequent chemical modification allows for
enzyme stabilization. Covalently bound PEG chains sterically protect against
intermolecular crosslinking.
4.2. Experimental
4.2.1. Materials
GOx from A. niger (338 U/mg solid, 82% protein) was obtained from BBI
Enzymes, and peroxidase from Amoracia rusticana (type II, 188 U/mg solid) was
obtained from Sigma. PEG-Hz (4.5 kDa by gel permeation chromatography) was
obtained from Laysan Bio.
4.2.2. Synthesis of Modified Glucose Oxidase and PEGylated Glucose Oxidase
The procedure used in this work to synthesize PEG-GOx, which is depicted
schematically in Fig. 4-2, is slightly modified from previous work detailed in
Section 3.23
Additionally, the supplier from which the GOx is purchased has been
changed between these two studies. The reason for the change in supplier is that the
GOx purchased from BBI Enzymes has a specific activity twice that of GOx purchased
from Sigma. Since a higher quality enzyme with higher activity is more desirable for use
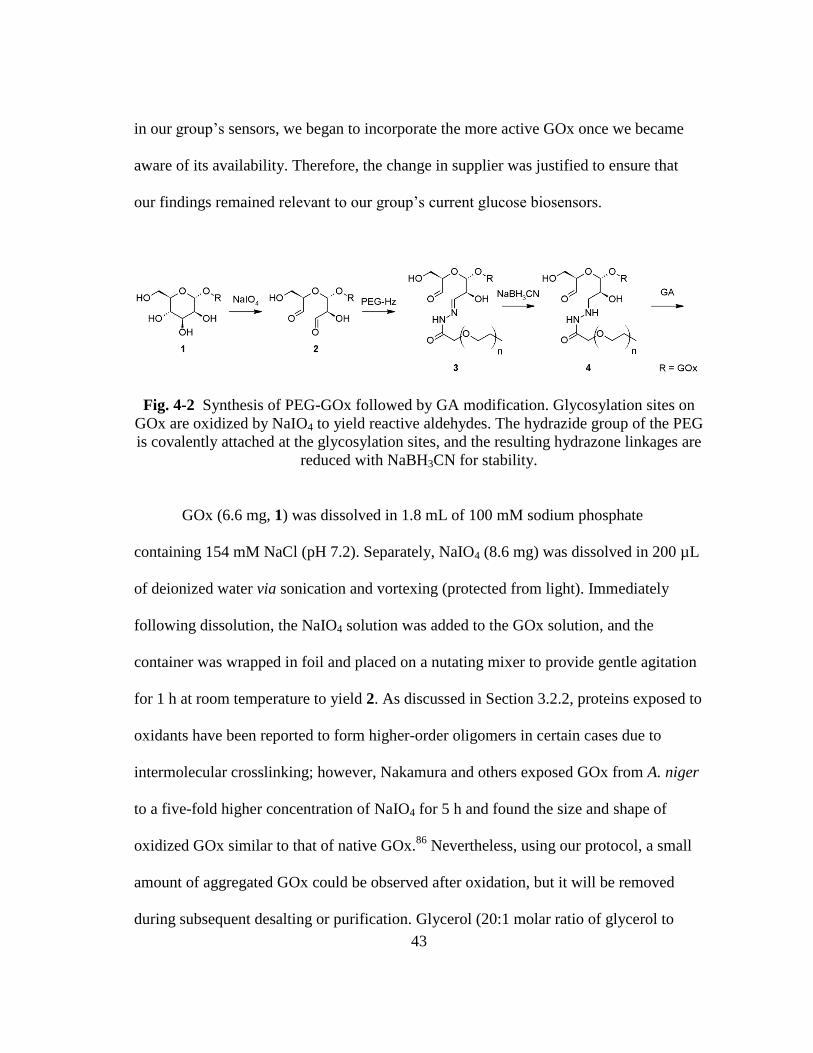
43
in our group’s sensors, we began to incorporate the more active GOx once we became
aware of its availability. Therefore, the change in supplier was justified to ensure that
our findings remained relevant to our group’s current glucose biosensors.
Fig. 4-2 Synthesis of PEG-GOx followed by GA modification. Glycosylation sites on
GOx are oxidized by NaIO4 to yield reactive aldehydes. The hydrazide group of the PEG
is covalently attached at the glycosylation sites, and the resulting hydrazone linkages are
reduced with NaBH3CN for stability.
GOx (6.6 mg, 1) was dissolved in 1.8 mL of 100 mM sodium phosphate
containing 154 mM NaCl (pH 7.2). Separately, NaIO4 (8.6 mg) was dissolved in 200 µL
of deionized water via sonication and vortexing (protected from light). Immediately
following dissolution, the NaIO4 solution was added to the GOx solution, and the
container was wrapped in foil and placed on a nutating mixer to provide gentle agitation
for 1 h at room temperature to yield 2. As discussed in Section 3.2.2, proteins exposed to
oxidants have been reported to form higher-order oligomers in certain cases due to
intermolecular crosslinking; however, Nakamura and others exposed GOx from A. niger
to a five-fold higher concentration of NaIO4 for 5 h and found the size and shape of
oxidized GOx similar to that of native GOx.86
Nevertheless, using our protocol, a small
amount of aggregated GOx could be observed after oxidation, but it will be removed
during subsequent desalting or purification. Glycerol (20:1 molar ratio of glycerol to
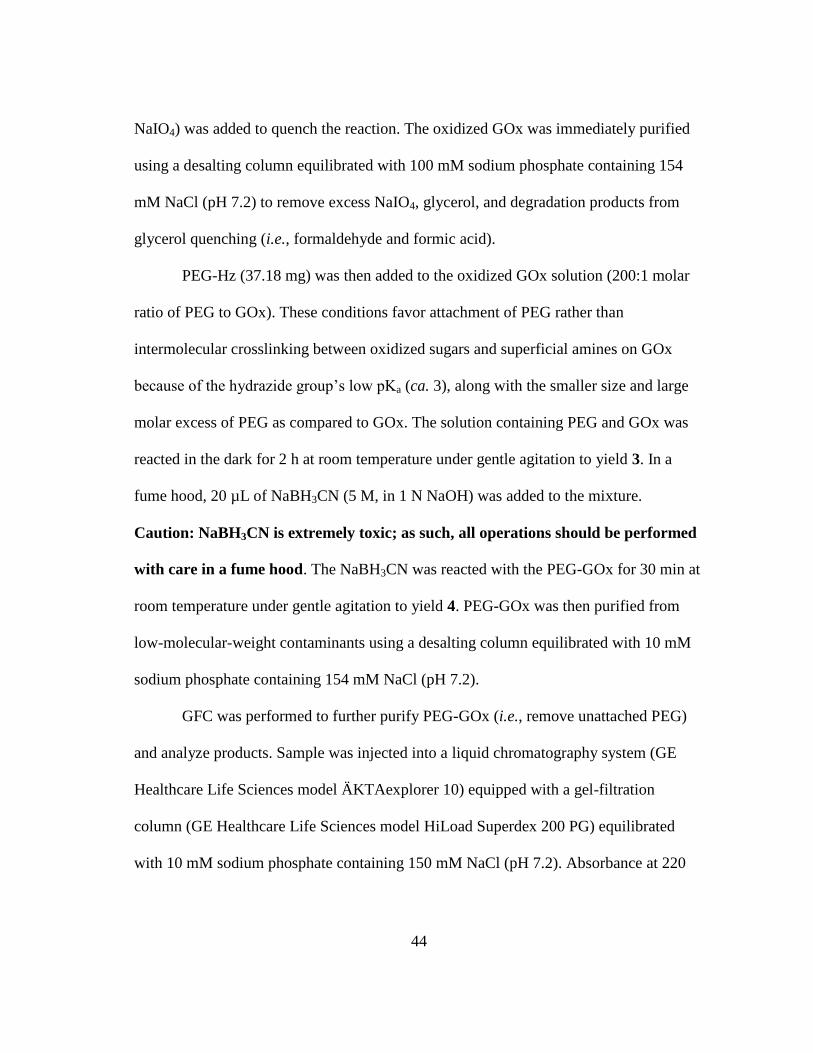
44
NaIO4) was added to quench the reaction. The oxidized GOx was immediately purified
using a desalting column equilibrated with 100 mM sodium phosphate containing 154
mM NaCl (pH 7.2) to remove excess NaIO4, glycerol, and degradation products from
glycerol quenching (i.e., formaldehyde and formic acid).
PEG-Hz (37.18 mg) was then added to the oxidized GOx solution (200:1 molar
ratio of PEG to GOx). These conditions favor attachment of PEG rather than
intermolecular crosslinking between oxidized sugars and superficial amines on GOx
because of the hydrazide group’s low pKa (ca. 3), along with the smaller size and large
molar excess of PEG as compared to GOx. The solution containing PEG and GOx was
reacted in the dark for 2 h at room temperature under gentle agitation to yield 3. In a
fume hood, 20 µL of NaBH3CN (5 M, in 1 N NaOH) was added to the mixture.
Caution: NaBH3CN is extremely toxic; as such, all operations should be performed
with care in a fume hood. The NaBH3CN was reacted with the PEG-GOx for 30 min at
room temperature under gentle agitation to yield 4. PEG-GOx was then purified from
low-molecular-weight contaminants using a desalting column equilibrated with 10 mM
sodium phosphate containing 154 mM NaCl (pH 7.2).
GFC was performed to further purify PEG-GOx (i.e., remove unattached PEG)
and analyze products. Sample was injected into a liquid chromatography system (GE
Healthcare Life Sciences model ÄKTAexplorer 10) equipped with a gel-filtration
column (GE Healthcare Life Sciences model HiLoad Superdex 200 PG) equilibrated
with 10 mM sodium phosphate containing 150 mM NaCl (pH 7.2). Absorbance at 220
45
nm, 280 nm, and 450 nm was monitored, 2 mL fractions were collected, and protein-
containing fractions were pooled and concentrated to 6 mg/mL (relative to GOx).
To initiate chemical modification, equal volumes of enzyme solution (GOx or
PEG-GOx, 6 mg/mL in 10 mM sodium phosphate containing 150 mM NaCl, pH 7.2)
and GA solution (ranging from 7.5e-4 wt% to 25 wt%) were combined and reacted for 1
h at room temperature. The final GA concentrations in the reaction solution ranged from
3.75e-4 wt% to 12.5 wt%, corresponding to a molar excess of GA (relative to GOx
monomer) ranging from 1 to 3.33e4, respectively. Excess GA was removed using a
centrifugal device (Pall model Nanosep 30K), and the modified enzyme was transferred
back into 10 mM sodium phosphate containing 154 mM NaCl (pH 7.2).
4.2.3. Physical and Chemical Characterization
4.2.3.1. Particle Sizing
A photon correlation spectrometer (Malvern model Zetasizer Nano ZS) was used
to acquire size distributions of the modified and unmodified PEG-GOx and native GOx
samples (n = 5). This was necessary to determine the change in size after GA
modification, as well as the extent of oligomerization during oxidation, subsequent
PEGylation, and GA exposure. Disposable 3.5 mL cuvettes were filled with enzyme (1
mL, 0.6 mg/mL) in 10 mM sodium phosphate containing 154 mM NaCl (pH 7.2).
4.2.3.2. Primary Amine Content
A fluorescamine assay was used to determine the presence of free primary
amines on GA-modified and unmodified PEG-GOx and native GOx samples as an
indication of the extent of modification (n = 4). In a 96-well solid black flat bottom
46
polystyrene microplate, enzyme (200 µL, 25 µg/mL) in 10 mM sodium phosphate
containing 154 mM NaCl (pH 7.2) was mixed with 1 mM fluorescamine (50 µL, 0.3
mg/mL) in acetone for 60 s. Fluorescence was excited from samples at 405 nm and
fluorescamine emission was collected at 485 nm using a multimode microplate reader
(Tecan model Infinite M200 PRO series).
4.2.3.3. Temperature Ramp
A photon correlation spectrometer (Malvern model Zetasizer Nano ZS) was used
to determine the effect of heating on the size of the modified and unmodified PEG-GOx
and native GOx samples (n = 3). Standard 3.5 mL glass cuvettes were filled with enzyme
(1 mL, ca. 0.735 mg/mL) in 10 mM sodium phosphate containing 154 mM NaCl (pH
7.2). The temperature of the cuvette holder was incrementally increased from 25 °C to
90 °C in steps of 5 °C, and the enzyme solution was allowed to equilibrate to each
temperature for 2 min prior to collection of sizing data. Due to the large amount of
sample required to test each enzyme type, only the most extreme GA concentrations (0
wt% and 2.5 wt% GA) were tested.
4.2.4. Functional Characterization
4.2.4.1. Enzymatic Activity Assays
Enzymatic assays of GA-modified and unmodified PEG-GOx and native GOx
samples were performed to determine activity following exposure to various
challenges.88
In all cases, enzymatic activity measurements were performed in triplicate
at pH 5.1 and 35°C using a UV/Vis spectrophotometer (Agilent model Cary 300)
equipped with a water-thermostatted multicell holder to maintain the appropriate
47
temperature. Absorbance data were collected at approximately 30 Hz for approximately
2.5 min. Data were fit via linear regression using the maximum number of points to
obtain a norm of residuals less than 0.025. This procedure was adopted to minimize the
effects of nonlinearities present at later time points in absorbance data collected for
samples of high catalytic activity.
4.2.4.2. Long-Term Storage Stability
To observe the effects of PEGylation and GA modification on the spontaneous
denaturation of GOx, enzymatic activity was assayed over a period of four weeks with
the enzyme samples stored at 37 °C (elevated temperature to accelerate deactivation and
simulate physiological conditions) in the absence of glucose. To limit sample
contamination, multiple samples were prepared for each enzyme type and each time
point to prevent the need for samples to be repeatedly opened; that is, samples were only
opened on the day they were assayed for enzymatic activity.
4.2.4.3. Operational Stability
To test for the effect of glucose on GA-modified and unmodified PEG-GOx and
native GOx, samples were continuously exposed to PBS containing glucose at room
temperature for up to 24 h. For these experiments, a dynamic dialysis system in a
microplate format (10-well MicroDialyzer) was obtained from Spectrum Labs (Note:
this product has been discontinued). The MicroDialyzer has ten wells, each of which can
be filled with up to 500 µL of sample that is in direct contact with a 12-14 kDa
regenerated cellulose dialysis membrane (Spectrum Labs model Spectra/Por 2). Beneath
the dialysis membrane, a stirred dialysate solution is pumped through the dialysis
48
chamber. For our purposes, enzyme solutions (250 µL, ca. 0.25 mg/mL) were added to
the wells (n = 3), and PBS containing glucose (100 mg/dL) was pumped through the
dialysis chamber at 4 mL/min using a peristaltic pump. Fig. 4-3 (left) shows the
assembled MicroDialyzer on top of a magnetic stir plate in the foreground with the
peristaltic pump shown in the background. Fig. 4-3 (right) illustrates the flow and
diffusion path for glucose to enter the enzyme-containing wells while product (i.e., H2O2
and gluconic acid) is also removed from the system.
After the appropriate glucose exposure time (6 h, 12 h, or 24 h), glucose-
containing PBS was removed from the dialysis chamber, and 1 L of fresh PBS (no
glucose) was pumped through the system at 4 mL/min (ca. 4 h) to remove excess
glucose and product from the sample wells. Because the samples may change volume
due to osmotic and hydrostatic forces—and because there is a possibility for the
membrane to be compromised during testing—the samples were transferred to a
standard microplate and analyzed for concentration using a multimode microplate reader
(Tecan model Infinite M200 PRO series). Finally, the samples were assayed for
enzymatic activity as described in Section 4.2.4.1.
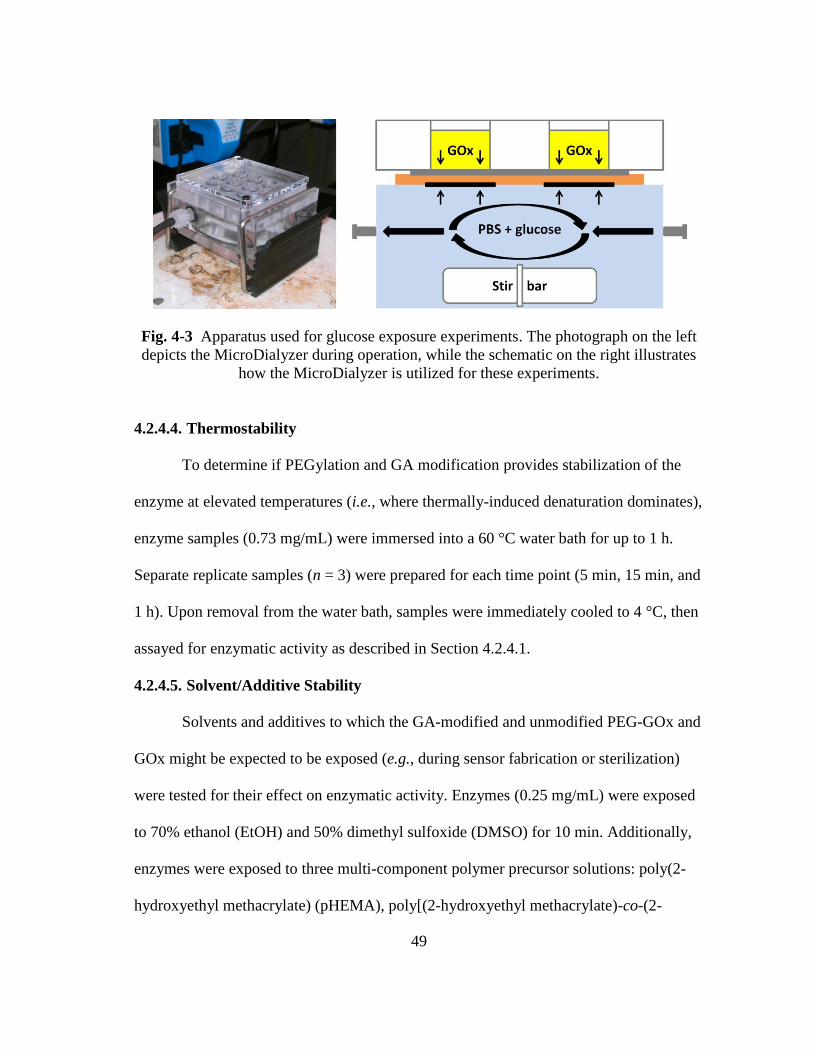
49
Fig. 4-3 Apparatus used for glucose exposure experiments. The photograph on the left
depicts the MicroDialyzer during operation, while the schematic on the right illustrates
how the MicroDialyzer is utilized for these experiments.
4.2.4.4. Thermostability
To determine if PEGylation and GA modification provides stabilization of the
enzyme at elevated temperatures (i.e., where thermally-induced denaturation dominates),
enzyme samples (0.73 mg/mL) were immersed into a 60 °C water bath for up to 1 h.
Separate replicate samples (n = 3) were prepared for each time point (5 min, 15 min, and
1 h). Upon removal from the water bath, samples were immediately cooled to 4 °C, then
assayed for enzymatic activity as described in Section 4.2.4.1.
4.2.4.5. Solvent/Additive Stability
Solvents and additives to which the GA-modified and unmodified PEG-GOx and
GOx might be expected to be exposed (e.g., during sensor fabrication or sterilization)
were tested for their effect on enzymatic activity. Enzymes (0.25 mg/mL) were exposed
to 70% ethanol (EtOH) and 50% dimethyl sulfoxide (DMSO) for 10 min. Additionally,
enzymes were exposed to three multi-component polymer precursor solutions: poly(2-
hydroxyethyl methacrylate) (pHEMA), poly[(2-hydroxyethyl methacrylate)-co-(2-
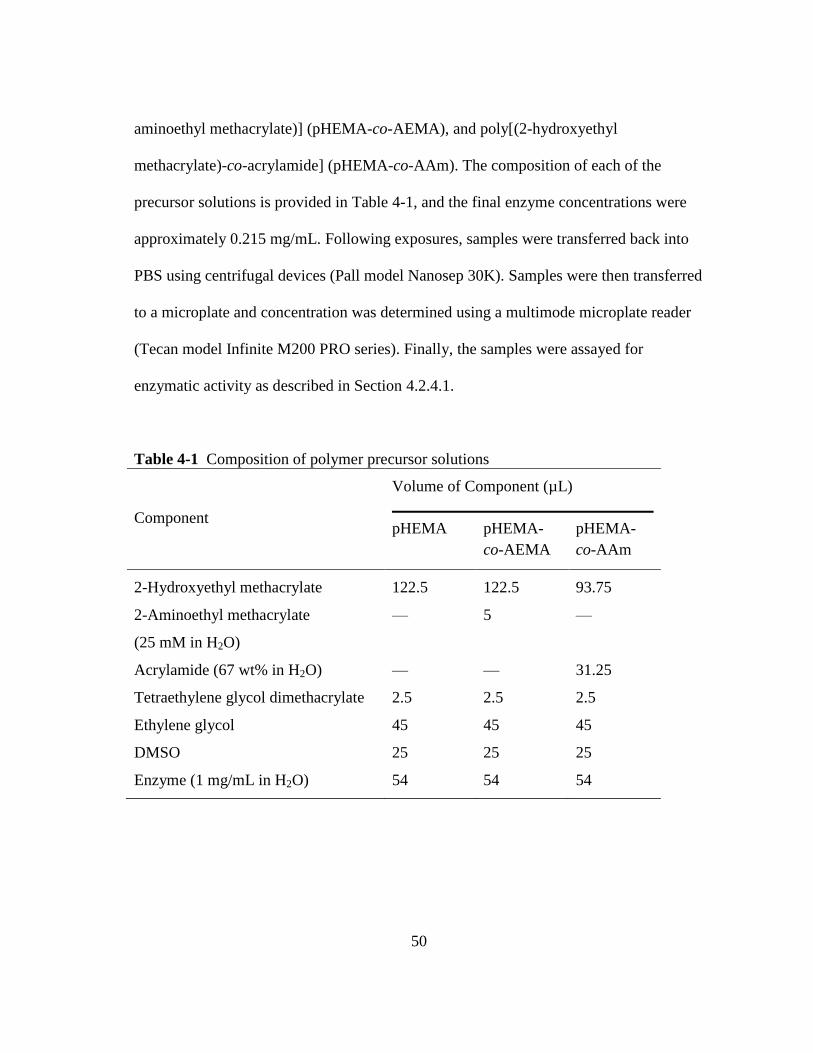
50
aminoethyl methacrylate)] (pHEMA-co-AEMA), and poly[(2-hydroxyethyl
methacrylate)-co-acrylamide] (pHEMA-co-AAm). The composition of each of the
precursor solutions is provided in Table 4-1, and the final enzyme concentrations were
approximately 0.215 mg/mL. Following exposures, samples were transferred back into
PBS using centrifugal devices (Pall model Nanosep 30K). Samples were then transferred
to a microplate and concentration was determined using a multimode microplate reader
(Tecan model Infinite M200 PRO series). Finally, the samples were assayed for
enzymatic activity as described in Section 4.2.4.1.
Table 4-1 Composition of polymer precursor solutions
Component
Volume of Component (µL)
pHEMA pHEMA-
co-AEMA
pHEMA-
co-AAm
2-Hydroxyethyl methacrylate 122.5 122.5 93.75
2-Aminoethyl methacrylate
(25 mM in H2O)
— 5 —
Acrylamide (67 wt% in H2O) — — 31.25
Tetraethylene glycol dimethacrylate 2.5 2.5 2.5
Ethylene glycol 45 45 45
DMSO 25 25 25
Enzyme (1 mg/mL in H2O) 54 54 54
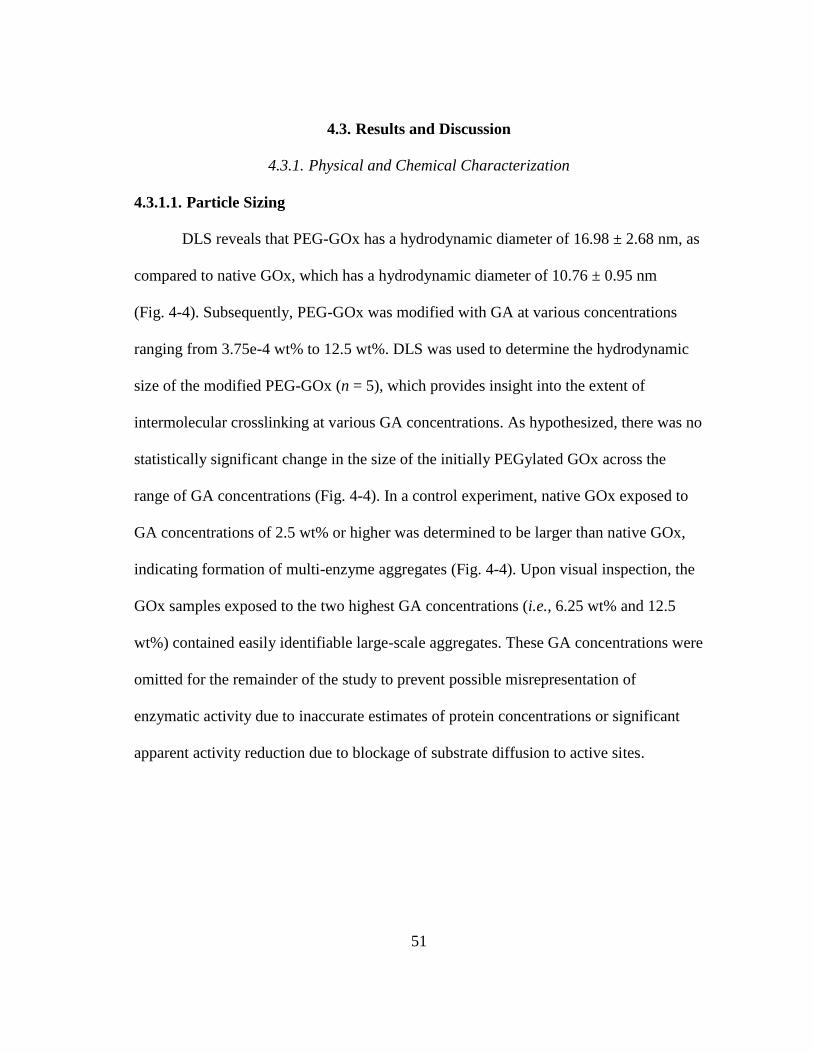
51
4.3. Results and Discussion
4.3.1. Physical and Chemical Characterization
4.3.1.1. Particle Sizing
DLS reveals that PEG-GOx has a hydrodynamic diameter of 16.98 ± 2.68 nm, as
compared to native GOx, which has a hydrodynamic diameter of 10.76 ± 0.95 nm
(Fig. 4-4). Subsequently, PEG-GOx was modified with GA at various concentrations
ranging from 3.75e-4 wt% to 12.5 wt%. DLS was used to determine the hydrodynamic
size of the modified PEG-GOx (n = 5), which provides insight into the extent of
intermolecular crosslinking at various GA concentrations. As hypothesized, there was no
statistically significant change in the size of the initially PEGylated GOx across the
range of GA concentrations (Fig. 4-4). In a control experiment, native GOx exposed to
GA concentrations of 2.5 wt% or higher was determined to be larger than native GOx,
indicating formation of multi-enzyme aggregates (Fig. 4-4). Upon visual inspection, the
GOx samples exposed to the two highest GA concentrations (i.e., 6.25 wt% and 12.5
wt%) contained easily identifiable large-scale aggregates. These GA concentrations were
omitted for the remainder of the study to prevent possible misrepresentation of
enzymatic activity due to inaccurate estimates of protein concentrations or significant
apparent activity reduction due to blockage of substrate diffusion to active sites.
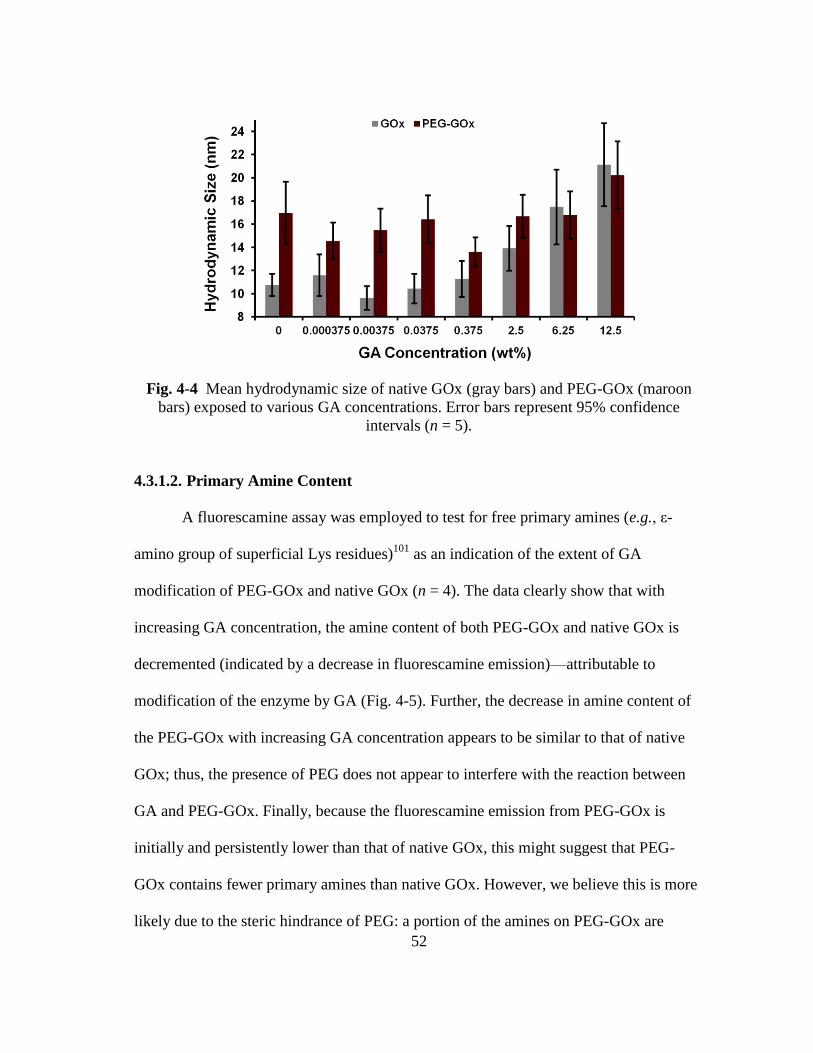
52
Fig. 4-4 Mean hydrodynamic size of native GOx (gray bars) and PEG-GOx (maroon
bars) exposed to various GA concentrations. Error bars represent 95% confidence
intervals (n = 5).
4.3.1.2. Primary Amine Content
A fluorescamine assay was employed to test for free primary amines (e.g., ε-
amino group of superficial Lys residues)101
as an indication of the extent of GA
modification of PEG-GOx and native GOx (n = 4). The data clearly show that with
increasing GA concentration, the amine content of both PEG-GOx and native GOx is
decremented (indicated by a decrease in fluorescamine emission)—attributable to
modification of the enzyme by GA (Fig. 4-5). Further, the decrease in amine content of
the PEG-GOx with increasing GA concentration appears to be similar to that of native
GOx; thus, the presence of PEG does not appear to interfere with the reaction between
GA and PEG-GOx. Finally, because the fluorescamine emission from PEG-GOx is
initially and persistently lower than that of native GOx, this might suggest that PEG-
GOx contains fewer primary amines than native GOx. However, we believe this is more
likely due to the steric hindrance of PEG: a portion of the amines on PEG-GOx are
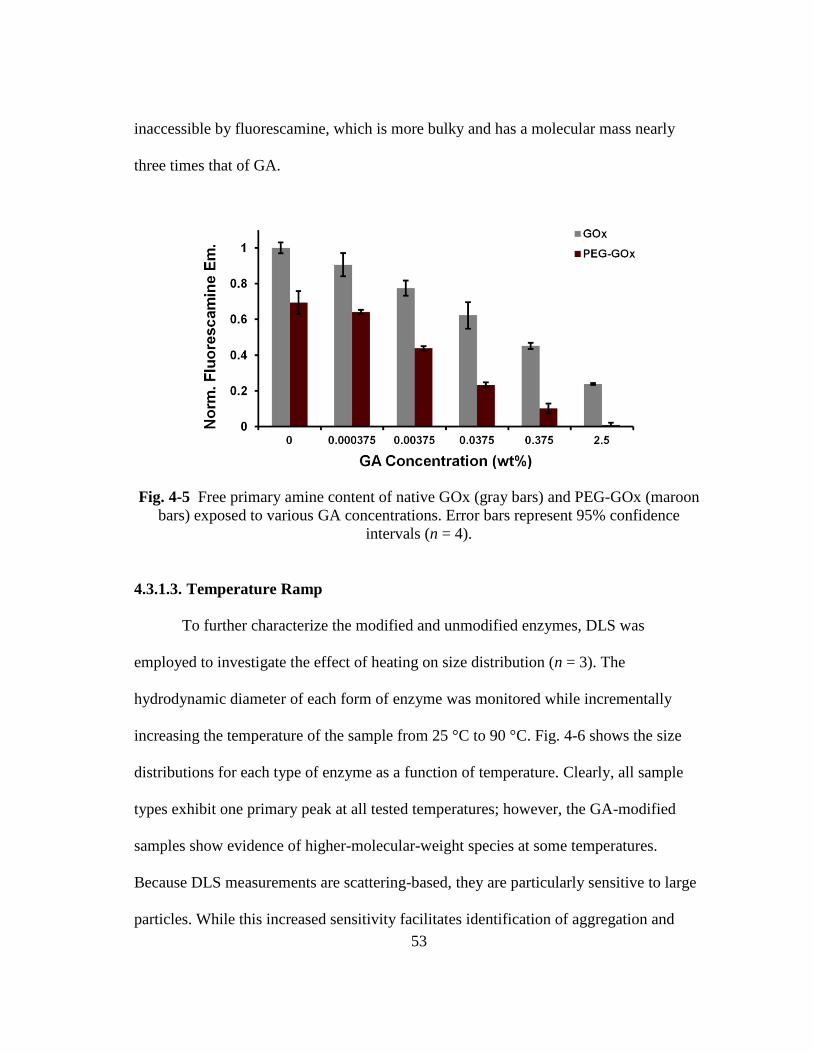
53
inaccessible by fluorescamine, which is more bulky and has a molecular mass nearly
three times that of GA.
Fig. 4-5 Free primary amine content of native GOx (gray bars) and PEG-GOx (maroon
bars) exposed to various GA concentrations. Error bars represent 95% confidence
intervals (n = 4).
4.3.1.3. Temperature Ramp
To further characterize the modified and unmodified enzymes, DLS was
employed to investigate the effect of heating on size distribution (n = 3). The
hydrodynamic diameter of each form of enzyme was monitored while incrementally
increasing the temperature of the sample from 25 °C to 90 °C. Fig. 4-6 shows the size
distributions for each type of enzyme as a function of temperature. Clearly, all sample
types exhibit one primary peak at all tested temperatures; however, the GA-modified
samples show evidence of higher-molecular-weight species at some temperatures.
Because DLS measurements are scattering-based, they are particularly sensitive to large
particles. While this increased sensitivity facilitates identification of aggregation and
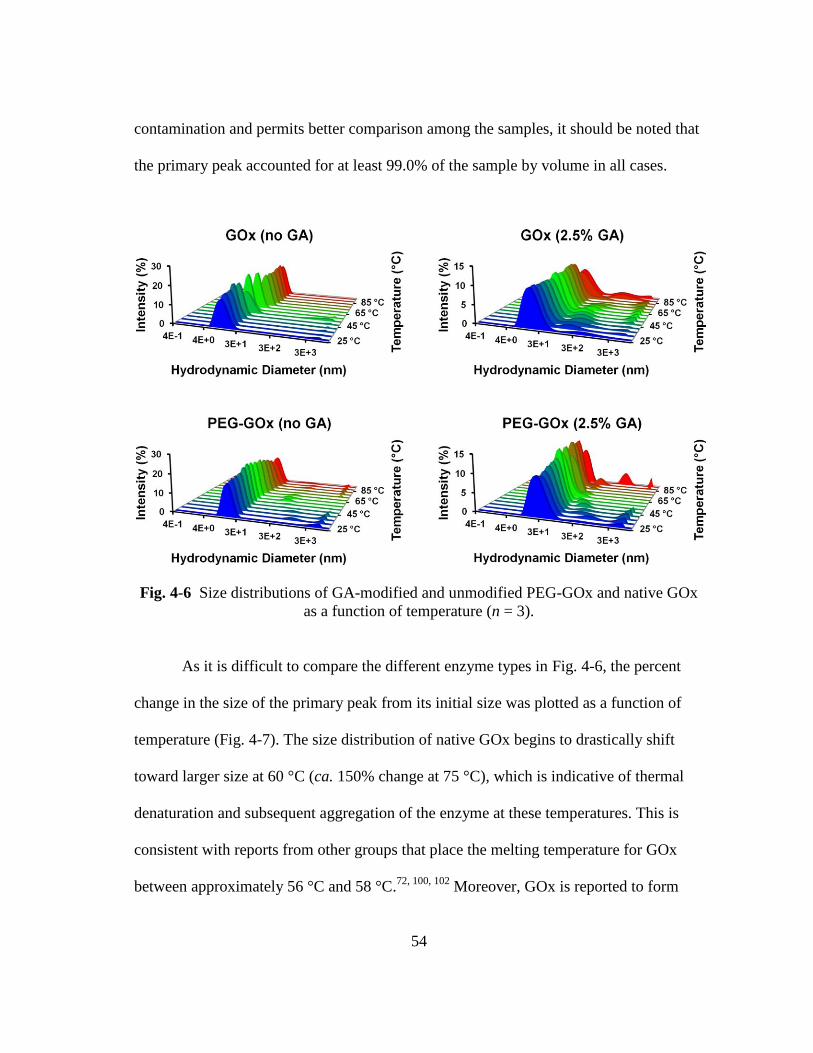
54
contamination and permits better comparison among the samples, it should be noted that
the primary peak accounted for at least 99.0% of the sample by volume in all cases.
Fig. 4-6 Size distributions of GA-modified and unmodified PEG-GOx and native GOx
as a function of temperature (n = 3).
As it is difficult to compare the different enzyme types in Fig. 4-6, the percent
change in the size of the primary peak from its initial size was plotted as a function of
temperature (Fig. 4-7). The size distribution of native GOx begins to drastically shift
toward larger size at 60 °C (ca. 150% change at 75 °C), which is indicative of thermal
denaturation and subsequent aggregation of the enzyme at these temperatures. This is
consistent with reports from other groups that place the melting temperature for GOx
between approximately 56 °C and 58 °C.72, 100, 102
Moreover, GOx is reported to form
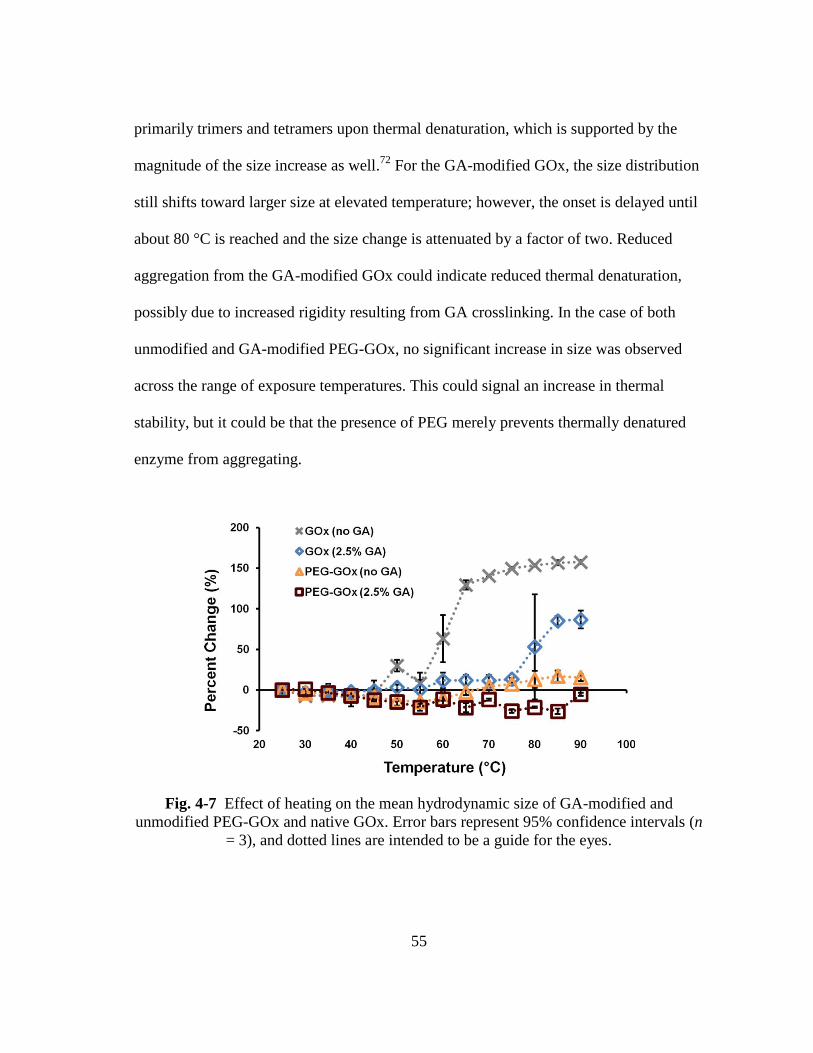
55
primarily trimers and tetramers upon thermal denaturation, which is supported by the
magnitude of the size increase as well.72
For the GA-modified GOx, the size distribution
still shifts toward larger size at elevated temperature; however, the onset is delayed until
about 80 °C is reached and the size change is attenuated by a factor of two. Reduced
aggregation from the GA-modified GOx could indicate reduced thermal denaturation,
possibly due to increased rigidity resulting from GA crosslinking. In the case of both
unmodified and GA-modified PEG-GOx, no significant increase in size was observed
across the range of exposure temperatures. This could signal an increase in thermal
stability, but it could be that the presence of PEG merely prevents thermally denatured
enzyme from aggregating.
Fig. 4-7 Effect of heating on the mean hydrodynamic size of GA-modified and
unmodified PEG-GOx and native GOx. Error bars represent 95% confidence intervals (n
= 3), and dotted lines are intended to be a guide for the eyes.
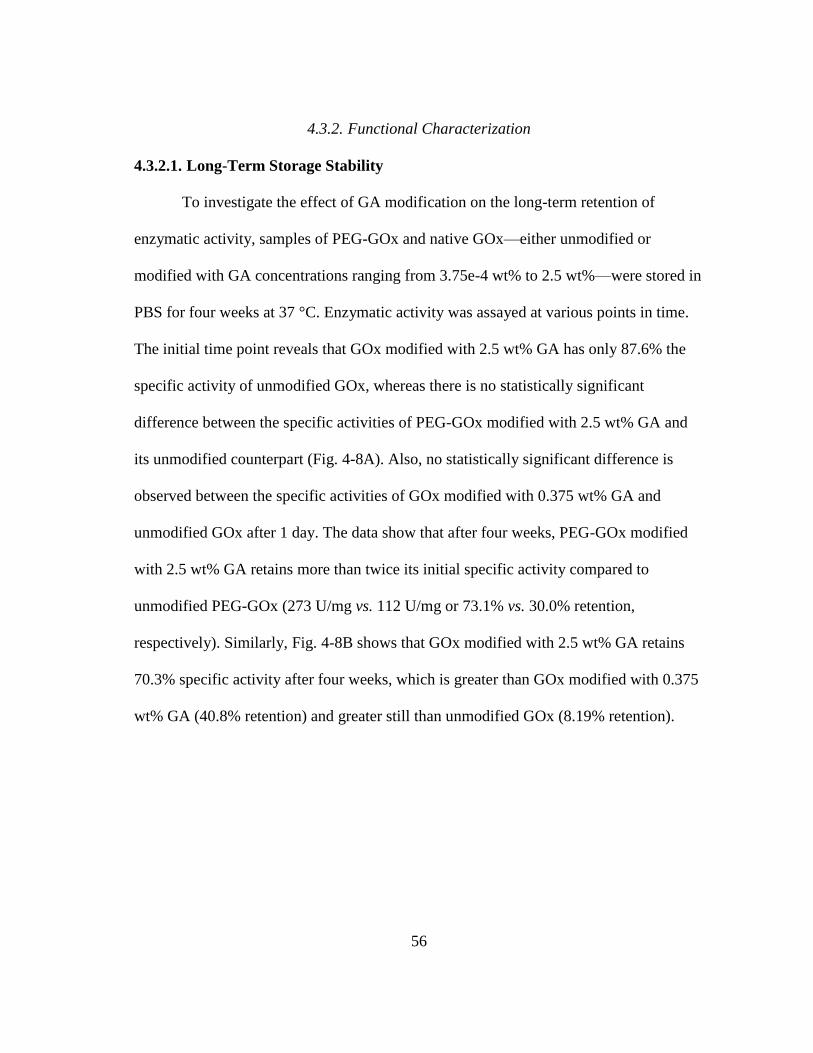
56
4.3.2. Functional Characterization
4.3.2.1. Long-Term Storage Stability
To investigate the effect of GA modification on the long-term retention of
enzymatic activity, samples of PEG-GOx and native GOx—either unmodified or
modified with GA concentrations ranging from 3.75e-4 wt% to 2.5 wt%—were stored in
PBS for four weeks at 37 °C. Enzymatic activity was assayed at various points in time.
The initial time point reveals that GOx modified with 2.5 wt% GA has only 87.6% the
specific activity of unmodified GOx, whereas there is no statistically significant
difference between the specific activities of PEG-GOx modified with 2.5 wt% GA and
its unmodified counterpart (Fig. 4-8A). Also, no statistically significant difference is
observed between the specific activities of GOx modified with 0.375 wt% GA and
unmodified GOx after 1 day. The data show that after four weeks, PEG-GOx modified
with 2.5 wt% GA retains more than twice its initial specific activity compared to
unmodified PEG-GOx (273 U/mg vs. 112 U/mg or 73.1% vs. 30.0% retention,
respectively). Similarly, Fig. 4-8B shows that GOx modified with 2.5 wt% GA retains
70.3% specific activity after four weeks, which is greater than GOx modified with 0.375
wt% GA (40.8% retention) and greater still than unmodified GOx (8.19% retention).
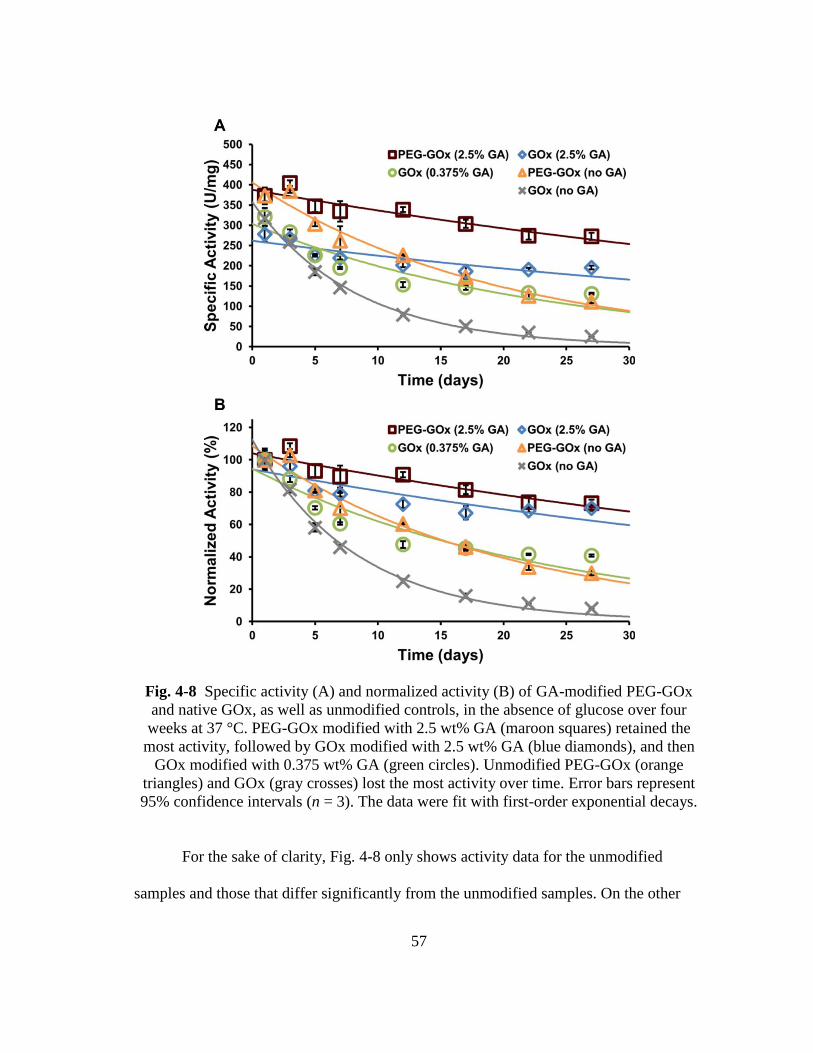
57
Fig. 4-8 Specific activity (A) and normalized activity (B) of GA-modified PEG-GOx
and native GOx, as well as unmodified controls, in the absence of glucose over four
weeks at 37 °C. PEG-GOx modified with 2.5 wt% GA (maroon squares) retained the
most activity, followed by GOx modified with 2.5 wt% GA (blue diamonds), and then
GOx modified with 0.375 wt% GA (green circles). Unmodified PEG-GOx (orange
triangles) and GOx (gray crosses) lost the most activity over time. Error bars represent
95% confidence intervals (n = 3). The data were fit with first-order exponential decays.
For the sake of clarity, Fig. 4-8 only shows activity data for the unmodified
samples and those that differ significantly from the unmodified samples. On the other
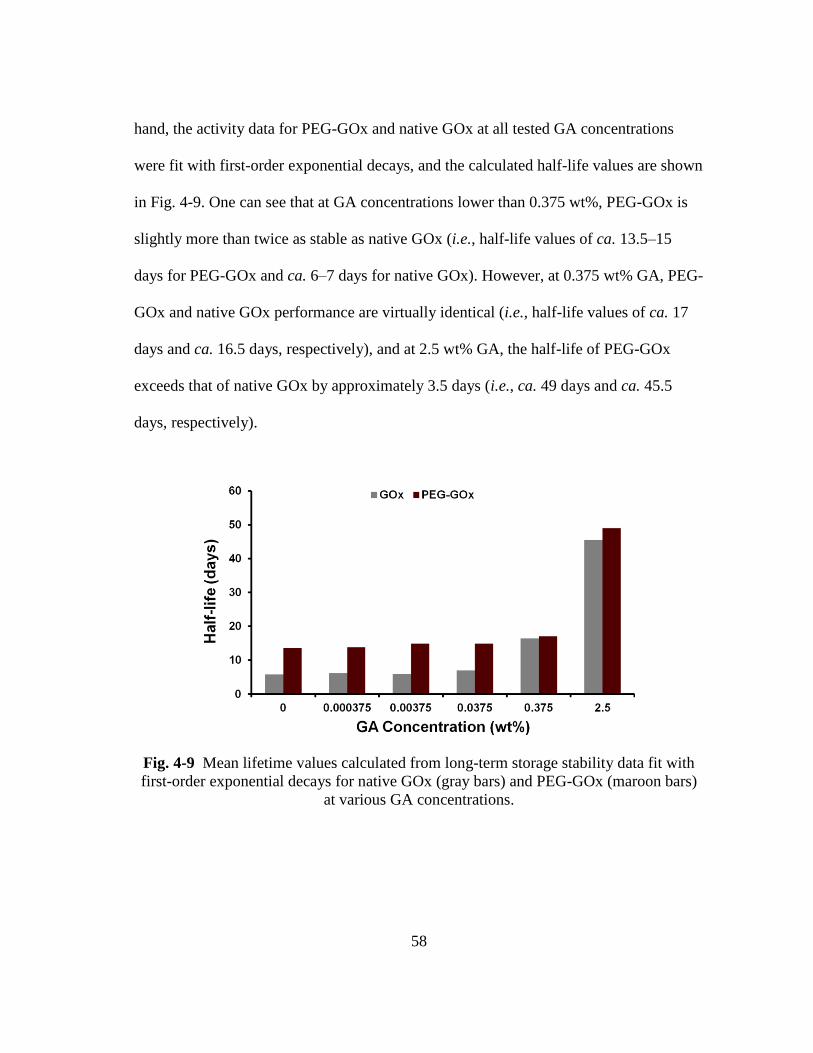
58
hand, the activity data for PEG-GOx and native GOx at all tested GA concentrations
were fit with first-order exponential decays, and the calculated half-life values are shown
in Fig. 4-9. One can see that at GA concentrations lower than 0.375 wt%, PEG-GOx is
slightly more than twice as stable as native GOx (i.e., half-life values of ca. 13.5–15
days for PEG-GOx and ca. 6–7 days for native GOx). However, at 0.375 wt% GA, PEG-
GOx and native GOx performance are virtually identical (i.e., half-life values of ca. 17
days and ca. 16.5 days, respectively), and at 2.5 wt% GA, the half-life of PEG-GOx
exceeds that of native GOx by approximately 3.5 days (i.e., ca. 49 days and ca. 45.5
days, respectively).
Fig. 4-9 Mean lifetime values calculated from long-term storage stability data fit with
first-order exponential decays for native GOx (gray bars) and PEG-GOx (maroon bars)
at various GA concentrations.
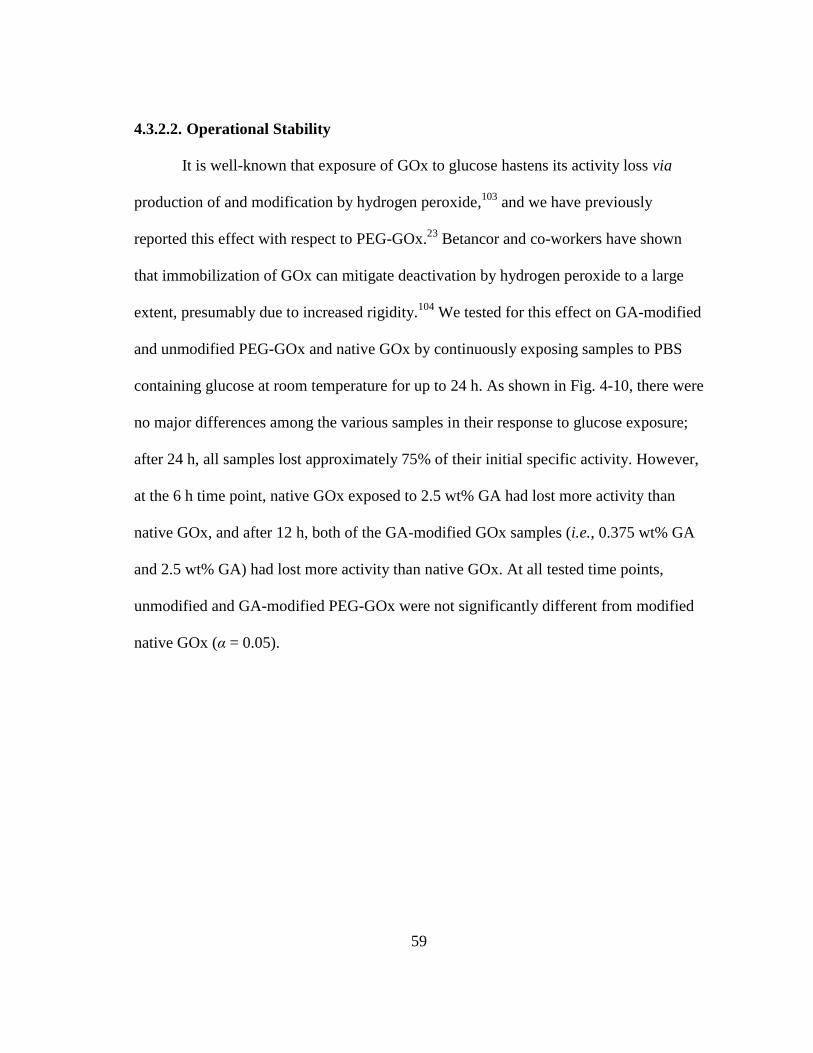
59
4.3.2.2. Operational Stability
It is well-known that exposure of GOx to glucose hastens its activity loss via
production of and modification by hydrogen peroxide,103
and we have previously
reported this effect with respect to PEG-GOx.23
Betancor and co-workers have shown
that immobilization of GOx can mitigate deactivation by hydrogen peroxide to a large
extent, presumably due to increased rigidity.104
We tested for this effect on GA-modified
and unmodified PEG-GOx and native GOx by continuously exposing samples to PBS
containing glucose at room temperature for up to 24 h. As shown in Fig. 4-10, there were
no major differences among the various samples in their response to glucose exposure;
after 24 h, all samples lost approximately 75% of their initial specific activity. However,
at the 6 h time point, native GOx exposed to 2.5 wt% GA had lost more activity than
native GOx, and after 12 h, both of the GA-modified GOx samples (i.e., 0.375 wt% GA
and 2.5 wt% GA) had lost more activity than native GOx. At all tested time points,
unmodified and GA-modified PEG-GOx were not significantly different from modified
native GOx (α = 0.05).
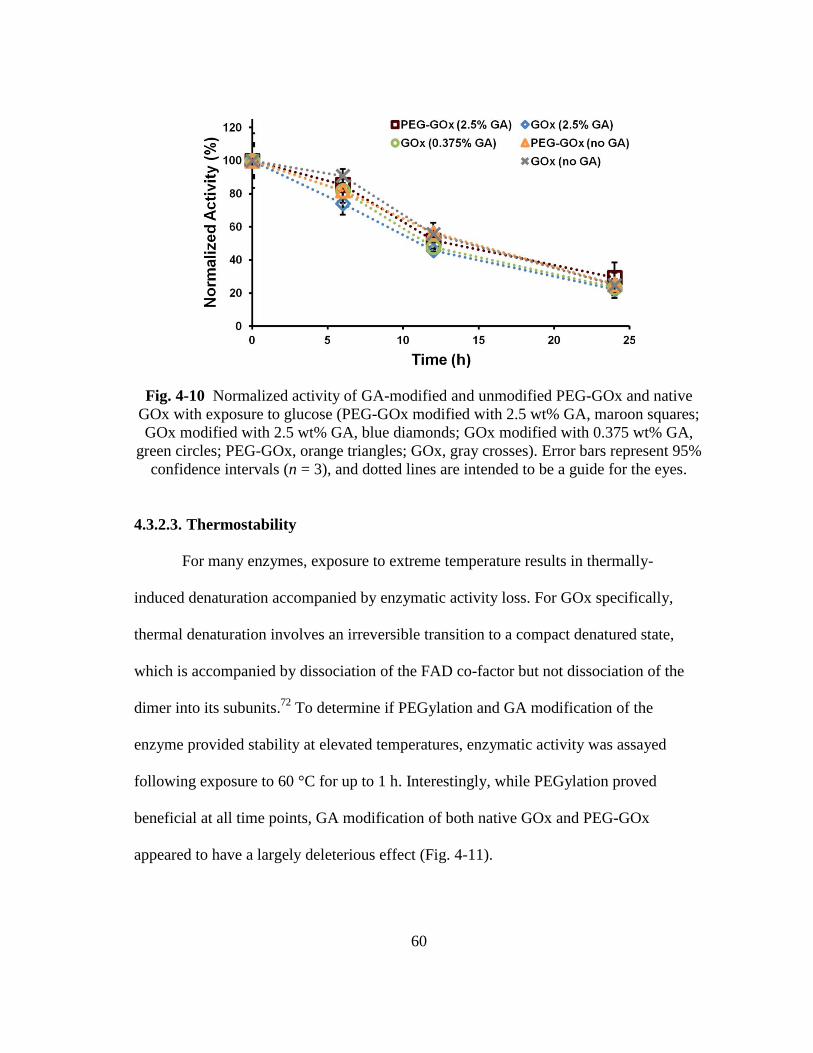
60
Fig. 4-10 Normalized activity of GA-modified and unmodified PEG-GOx and native
GOx with exposure to glucose (PEG-GOx modified with 2.5 wt% GA, maroon squares;
GOx modified with 2.5 wt% GA, blue diamonds; GOx modified with 0.375 wt% GA,
green circles; PEG-GOx, orange triangles; GOx, gray crosses). Error bars represent 95%
confidence intervals (n = 3), and dotted lines are intended to be a guide for the eyes.
4.3.2.3. Thermostability
For many enzymes, exposure to extreme temperature results in thermally-
induced denaturation accompanied by enzymatic activity loss. For GOx specifically,
thermal denaturation involves an irreversible transition to a compact denatured state,
which is accompanied by dissociation of the FAD co-factor but not dissociation of the
dimer into its subunits.72
To determine if PEGylation and GA modification of the
enzyme provided stability at elevated temperatures, enzymatic activity was assayed
following exposure to 60 °C for up to 1 h. Interestingly, while PEGylation proved
beneficial at all time points, GA modification of both native GOx and PEG-GOx
appeared to have a largely deleterious effect (Fig. 4-11).
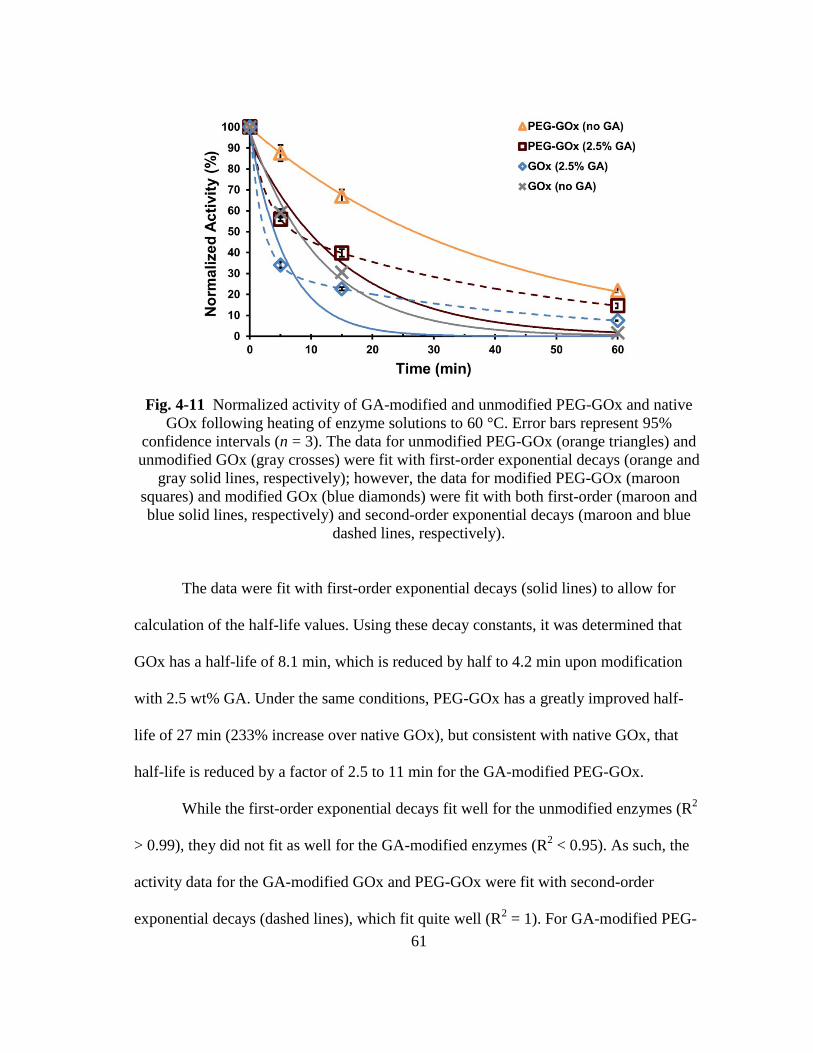
61
Fig. 4-11 Normalized activity of GA-modified and unmodified PEG-GOx and native
GOx following heating of enzyme solutions to 60 °C. Error bars represent 95%
confidence intervals (n = 3). The data for unmodified PEG-GOx (orange triangles) and
unmodified GOx (gray crosses) were fit with first-order exponential decays (orange and
gray solid lines, respectively); however, the data for modified PEG-GOx (maroon
squares) and modified GOx (blue diamonds) were fit with both first-order (maroon and
blue solid lines, respectively) and second-order exponential decays (maroon and blue
dashed lines, respectively).
The data were fit with first-order exponential decays (solid lines) to allow for
calculation of the half-life values. Using these decay constants, it was determined that
GOx has a half-life of 8.1 min, which is reduced by half to 4.2 min upon modification
with 2.5 wt% GA. Under the same conditions, PEG-GOx has a greatly improved half-
life of 27 min (233% increase over native GOx), but consistent with native GOx, that
half-life is reduced by a factor of 2.5 to 11 min for the GA-modified PEG-GOx.
While the first-order exponential decays fit well for the unmodified enzymes (R2
> 0.99), they did not fit as well for the GA-modified enzymes (R2 < 0.95). As such, the
activity data for the GA-modified GOx and PEG-GOx were fit with second-order
exponential decays (dashed lines), which fit quite well (R2 = 1). For GA-modified PEG-
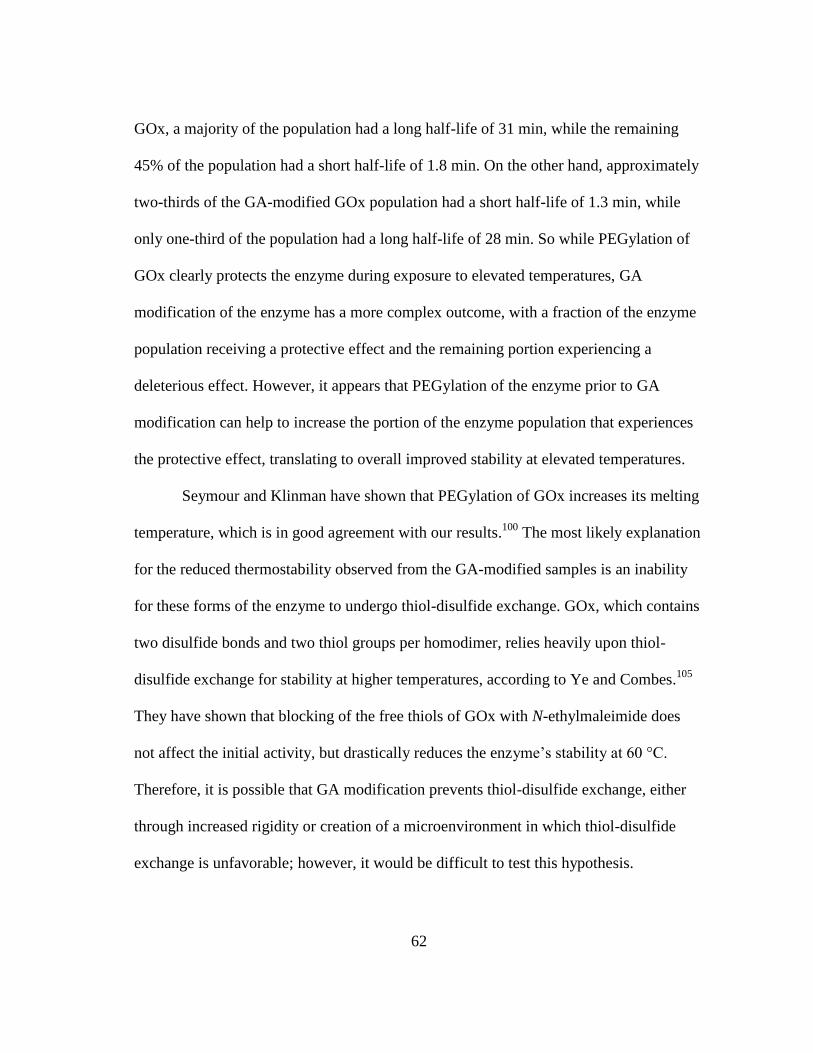
62
GOx, a majority of the population had a long half-life of 31 min, while the remaining
45% of the population had a short half-life of 1.8 min. On the other hand, approximately
two-thirds of the GA-modified GOx population had a short half-life of 1.3 min, while
only one-third of the population had a long half-life of 28 min. So while PEGylation of
GOx clearly protects the enzyme during exposure to elevated temperatures, GA
modification of the enzyme has a more complex outcome, with a fraction of the enzyme
population receiving a protective effect and the remaining portion experiencing a
deleterious effect. However, it appears that PEGylation of the enzyme prior to GA
modification can help to increase the portion of the enzyme population that experiences
the protective effect, translating to overall improved stability at elevated temperatures.
Seymour and Klinman have shown that PEGylation of GOx increases its melting
temperature, which is in good agreement with our results.100
The most likely explanation
for the reduced thermostability observed from the GA-modified samples is an inability
for these forms of the enzyme to undergo thiol-disulfide exchange. GOx, which contains
two disulfide bonds and two thiol groups per homodimer, relies heavily upon thiol-
disulfide exchange for stability at higher temperatures, according to Ye and Combes.105
They have shown that blocking of the free thiols of GOx with N-ethylmaleimide does
not affect the initial activity, but drastically reduces the enzyme’s stability at 60 °C.
Therefore, it is possible that GA modification prevents thiol-disulfide exchange, either
through increased rigidity or creation of a microenvironment in which thiol-disulfide
exchange is unfavorable; however, it would be difficult to test this hypothesis.
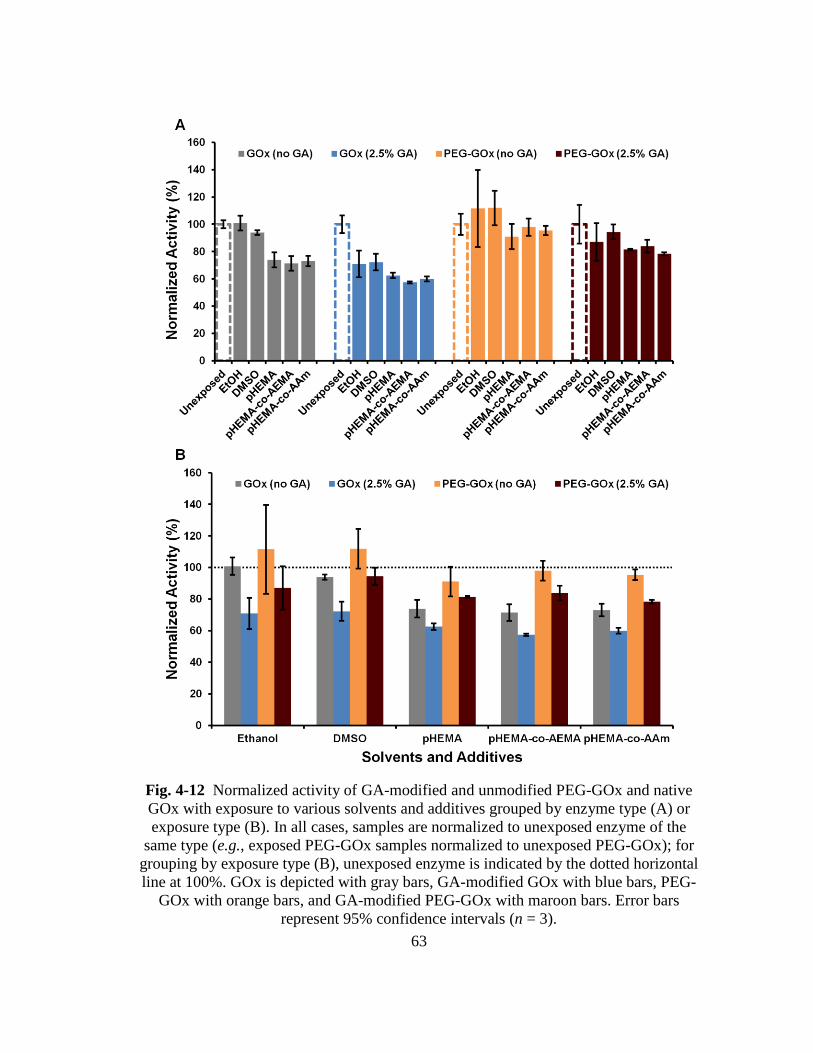
63
Fig. 4-12 Normalized activity of GA-modified and unmodified PEG-GOx and native
GOx with exposure to various solvents and additives grouped by enzyme type (A) or
exposure type (B). In all cases, samples are normalized to unexposed enzyme of the
same type (e.g., exposed PEG-GOx samples normalized to unexposed PEG-GOx); for
grouping by exposure type (B), unexposed enzyme is indicated by the dotted horizontal
line at 100%. GOx is depicted with gray bars, GA-modified GOx with blue bars, PEG-
GOx with orange bars, and GA-modified PEG-GOx with maroon bars. Error bars
represent 95% confidence intervals (n = 3).
64
4.3.2.4. Solvent/Additive Stability
Since it is expected that enzymes might come into contact with various solvents
and additives throughout normal use—some of which might be harmful—modified and
unmodified PEG-GOx and native GOx were exposed to a number of substances for a
limited period of time, then tested for changes in enzymatic activity. Fig. 4-12 shows the
specific activity of each type of enzyme after exposure to the solvents and additives,
which has been normalized to the specific activity of unexposed enzyme of the same
type (e.g., exposed PEG-GOx samples normalized to unexposed PEG-GOx). In
Fig. 4-12A, the bars are grouped by enzyme type to facilitate comparison of the effects
of each solvent or additive on each type of enzyme, as well as to provide a snapshot of
each enzyme type’s overall stability to various solvents and additives in general.
Fig. 4-12B shows the bars grouped by exposure type to permit evaluation of each
enzyme’s relative appropriateness in the presence of each solvent or additive.
For native GOx, exposure to 70% EtOH did not affect its specific activity,
although some limited protein aggregation was observed; a slight reduction in specific
activity resulted from exposure to 50% DMSO, and exposure to all of the tested polymer
precursor solutions resulted in an approximate 25% reduction in specific activity. At a
95% confidence level, the specific activity of PEG-GOx following exposure to each of
the tested solvents and additives was statistically equivalent to unexposed PEG-GOx.
Moreover, PEG-GOx retained more of its pre-exposure activity than native GOx in all
cases except the EtOH exposure, in which native GOx did not experience a statistically
significant reduction in activity. Conversely, GA-modified GOx lost more of its pre-
65
exposure activity than native GOx in every case, with an approximate 30% reduction in
the case of EtOH and DMSO and an approximate 40% reduction in the case of the
polymer precursor solutions. It is worth noting that moderate aggregation of the GA-
modified GOx was observed upon addition of the EtOH and led to loss of some protein
during purification in two of the three samples. Finally, with the exception of exposure
to the pHEMA and pHEMA-co-AAm polymer precursor solutions, the specific activity
of GA-modified PEG-GOx following exposure to each of the tested solvents and
additives was statistically equivalent to unexposed GA-modified PEG-GOx (α = 0.05).
Compared to native GOx, GA-modified PEG-GOx was statistically equivalent when
exposed to EtOH and DMSO, and it retained only slightly more activity than native GOx
when exposed to the polymer precursor solutions.
It should be clarified that a limitation of this work is that the enzyme is no longer
exposed to the solvent or additive when it is tested for enzymatic activity. In one way,
this is ideal because irreversible changes that occur during the enzyme’s exposure to the
solvent or additive are revealed (initial and final states are identical; i.e., aqueous
buffered solution devoid of solvent or additive). Furthermore, dissolution of the enzyme
in solutions with the same composition during activity testing permits direct comparison
among the various exposure types. However, one must consider the actual application in
which the enzyme will be employed. For our lab’s intended application (i.e.,
incorporation into pHEMA-based hydrogels), it is expected that the enzyme might be
exposed to 70% EtOH for a short period of time during sterilization. To some extent, this
is also the case for the polymer precursor solutions; however, it’s actually much more
66
complex because the solution components are transformed during hydrogel formation,
which completely changes the environment of the enzyme. As such, it is necessary to
perform in situ activity testing of the enzyme immobilized within the hydrogel. This is
beyond the scope of this dissertation, but will need to be considered in future work.
4.4. Conclusions
In summary, we have demonstrated the utility of PEGylation to function as a
steric stabilizer during chemical modification with GA. PEG chains do not appear to
inhibit GA modification, but seem to prevent intermolecular crosslinking, which leads to
irreversible aggregation. Likewise, the PEGylated enzyme appears to resist aggregation
during and following heat treatment. The utility of enzymes modified in this manner is
dependent upon the intended use. After one month at physiological temperature and in
the absence of glucose, PEG-GOx modified with 2.5 wt% GA retains nearly an order of
magnitude more of its initial activity compared to native GOx. Neither PEGylation nor
GA modification imparts any significant protective effect upon exposure to glucose.
Interestingly, PEGylation appears to help preserve enzymatic activity of GOx exposed to
extreme temperature, especially in the short-term, but modification with GA actually has
a detrimental effect. Finally, PEGylation seems to best stabilize the enzyme against the
solvents and additives to which the enzyme was exposed in this study, while GA-
modified native GOx was the worst; in general, PEG-GOx modified with 2.5 wt% GA
performed as well as native GOx. It would be interesting to apply this technique to other
glycoenzymes (or a modified version of the approach for non-glycosylated proteins),
especially in cases where subunit dissociation of multimeric proteins is expected.
67
5. ALBUMINATION OF GLYCOENZYME
5.1. Introduction
In the previous section, an approach to enzyme stabilization was demonstrated,
wherein GOx was PEGylated and subsequently modified with GA. As hypothesized, the
PEG shell provided steric protection, which prevented GOx molecules from reacting
with one another. Furthermore, significant stabilization was observed during storage of
the GA-modified PEG-GOx for one month at physiological temperature and in the
absence of glucose. However, using this combination of previous techniques, stability
toward solvents and additives was only marginally improved (PEG-GOx without GA
modification demonstrated superior performance overall), operational stability was not
improved, and thermostability was actually reduced upon GA modification for both
native GOx and PEG-GOx. Ideally, an approach would be developed that could stabilize
glycoenzymes under all or most of these different conditions; however, even an
approach that could provide stabilization under complimentary conditions would be
beneficial.
The novel approach presented in this section involves the orthogonal covalent
attachment of BSA macromolecules to the glycosylation sites of an enzyme, resulting in
encasement of the glycoenzyme within an albumin shell (Fig. 5-1). This approach was
inspired by a strategy commonly used in current glucose biosensors (described in
Section 1); however, the latter was refined by introducing the BSA in a controlled
manner and on the single-enzyme level. Beyond simple inspiration, the vast literature on
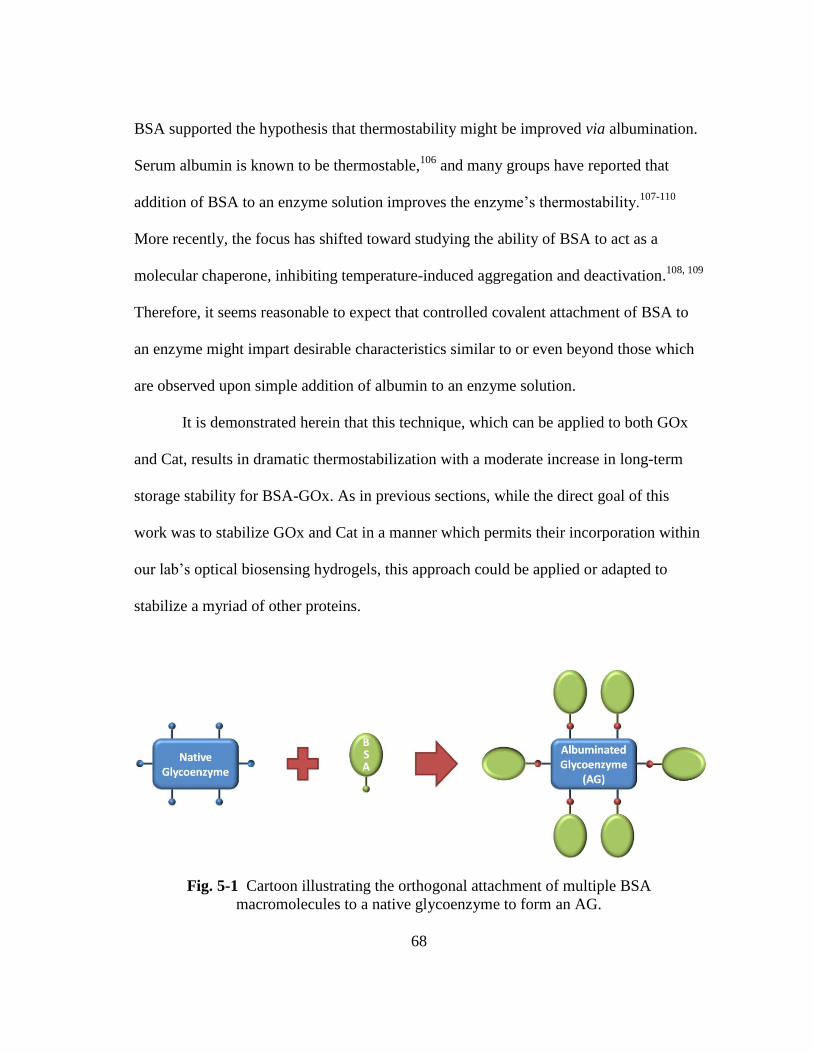
68
BSA supported the hypothesis that thermostability might be improved via albumination.
Serum albumin is known to be thermostable,106
and many groups have reported that
addition of BSA to an enzyme solution improves the enzyme’s thermostability.107-110
More recently, the focus has shifted toward studying the ability of BSA to act as a
molecular chaperone, inhibiting temperature-induced aggregation and deactivation.108, 109
Therefore, it seems reasonable to expect that controlled covalent attachment of BSA to
an enzyme might impart desirable characteristics similar to or even beyond those which
are observed upon simple addition of albumin to an enzyme solution.
It is demonstrated herein that this technique, which can be applied to both GOx
and Cat, results in dramatic thermostabilization with a moderate increase in long-term
storage stability for BSA-GOx. As in previous sections, while the direct goal of this
work was to stabilize GOx and Cat in a manner which permits their incorporation within
our lab’s optical biosensing hydrogels, this approach could be applied or adapted to
stabilize a myriad of other proteins.
Fig. 5-1 Cartoon illustrating the orthogonal attachment of multiple BSA
macromolecules to a native glycoenzyme to form an AG.
69
5.2. Experimental
5.2.1. Materials
GOx from A. niger was obtained from BBI Enzymes (GO3A, 270 U/mg solid,
75% protein by Lowry). Cat from A. niger was obtained from EMD Millipore (219261,
6450 U/mg solid, 37.6% protein by UV absorbance) and purified by GFC to remove
contaminants. BSA (A7906) and peroxidase from Amoracia rusticana (type II, 188
U/mg solid) were obtained from Sigma. N-(β-maleimidopropionic acid) hydrazide
(BMPH) was obtained from Thermo Scientific.
5.2.2. Preparation of Albuminated Glycoenzymes
The procedure used to synthesize the AGs is depicted schematically in Fig. 5-2.
BSA (74.25 mg, 1) was dissolved in 1.85 mL of 100 mM sodium phosphate containing
154 mM NaCl (pH 7.2). BMPH was dissolved in 150 µL of DMSO at a concentration of
50 mM and added to the BSA solution, yielding a 6.67 molar excess of BMPH to BSA.
The reaction solution was mixed for 2 h at room temperature, followed by removal of
excess BMPH using a desalting column equilibrated with 100 mM sodium phosphate
containing 154 mM NaCl (pH 7.2) to yield hydrazide-functionalized BSA (2).
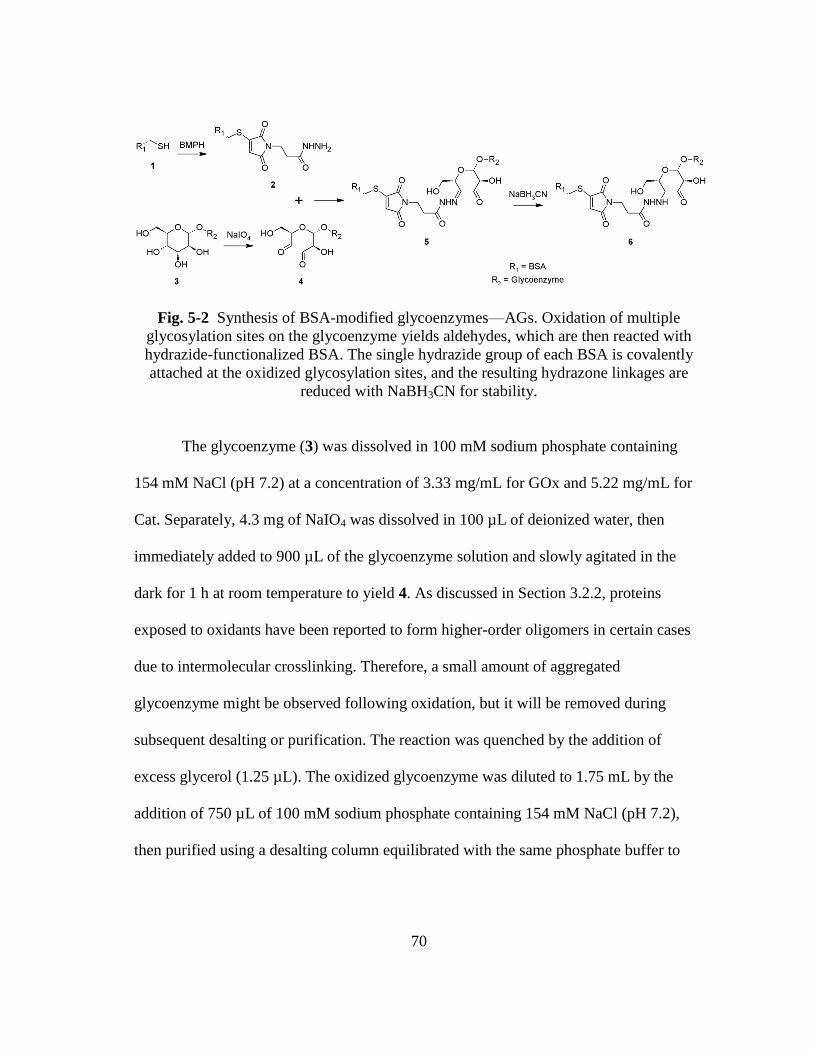
70
Fig. 5-2 Synthesis of BSA-modified glycoenzymes—AGs. Oxidation of multiple
glycosylation sites on the glycoenzyme yields aldehydes, which are then reacted with
hydrazide-functionalized BSA. The single hydrazide group of each BSA is covalently
attached at the oxidized glycosylation sites, and the resulting hydrazone linkages are
reduced with NaBH3CN for stability.
The glycoenzyme (3) was dissolved in 100 mM sodium phosphate containing
154 mM NaCl (pH 7.2) at a concentration of 3.33 mg/mL for GOx and 5.22 mg/mL for
Cat. Separately, 4.3 mg of NaIO4 was dissolved in 100 µL of deionized water, then
immediately added to 900 µL of the glycoenzyme solution and slowly agitated in the
dark for 1 h at room temperature to yield 4. As discussed in Section 3.2.2, proteins
exposed to oxidants have been reported to form higher-order oligomers in certain cases
due to intermolecular crosslinking. Therefore, a small amount of aggregated
glycoenzyme might be observed following oxidation, but it will be removed during
subsequent desalting or purification. The reaction was quenched by the addition of
excess glycerol (1.25 µL). The oxidized glycoenzyme was diluted to 1.75 mL by the
addition of 750 µL of 100 mM sodium phosphate containing 154 mM NaCl (pH 7.2),
then purified using a desalting column equilibrated with the same phosphate buffer to
71
remove excess NaIO4, glycerol, and degradation products from glycerol quenching (i.e.,
formaldehyde and formic acid).
The solutions of oxidized glycoenzyme and hydrazide-functionalized BSA were
combined, yielding a ca. 60-fold molar excess of BSA to glycoenzyme. The mixture was
reacted in the dark for 2 h at room temperature under gentle agitation to yield 5. In a
fume hood, 40 µL of 5 M NaBH3CN in 1 N NaOH was added. Caution: NaBH3CN is
extremely toxic; as such, all operations should be performed with care in a fume
hood. The NaBH3CN was reacted with the bioconjugate for 30 min at room temperature
under gentle agitation to yield the AG (6). Finally, the conjugate was purified from low-
molecular-weight contaminants by diafiltration and transferred into 10 mM sodium
phosphate containing 154 mM NaCl (pH 7.2).
5.2.3. Physical Characterization
5.2.3.1. Liquid Chromatography
GFC was performed to purify the AGs and approximate their size. The crude
sample was injected into a liquid chromatography system (GE Healthcare Life Sciences
model ÄKTAexplorer 10) equipped with a gel-filtration column (GE Healthcare Life
Sciences model HiLoad Superdex 200 PG) equilibrated with phosphate buffer (10 mM
sodium phosphate, 154 mM NaCl, pH 7.2). Absorbance was monitored at 280 nm and
450 nm (for GOx) or 405 nm (for Cat), and 1 mL fractions were collected.
5.2.3.2. Particle Sizing
A photon correlation spectrometer (Malvern model Zetasizer Nano ZS) was used
to acquire size distributions of the AGs, as well as the native glycoenzymes and BSA, to
72
determine the change in size following modification. Also, it is important to determine
whether oligomerization occurred during oxidation or subsequent conjugation.
Disposable 3.5 mL cuvettes were filled with 1 mL enzyme in 10 mM sodium phosphate
containing 154 mM NaCl (pH 7.2).
5.2.3.3. Temperature Ramp
A photon correlation spectrometer (Malvern model Zetasizer Nano ZS) was used
to determine the effect of heating on the size of AGs and native glycoenzymes (n = 3).
Standard 3.5 mL glass cuvettes were filled with enzyme (1 mL, ca. 0.735 mg/mL) in 10
mM sodium phosphate containing 154 mM NaCl (pH 7.2). The temperature of the
cuvette holder was incrementally increased from 25 °C to 90 °C in steps of 5 °C, and the
enzyme solution was allowed to equilibrate to each temperature for 2 min prior to
collection of sizing data.
5.2.4. Functional Characterization
5.2.4.1. Enzymatic Activity Assays
Enzymatic assays of BSA-GOx and native GOx samples were performed to
determine activity following exposure to various challenges.88
In all cases, enzymatic
activity measurements were performed in triplicate at pH 5.1 and 35 °C using a UV/Vis
spectrophotometer (Agilent model Cary 300) equipped with a water-thermostatted
multicell holder to maintain the appropriate temperature. Absorbance data were collected
at approximately 30 Hz for approximately 2.5 min. Data were fit via linear regression
using the maximum number of points to obtain a norm of residuals less than 0.025. This
73
procedure was adopted to minimize the effects of nonlinearities present at later time
points in absorbance data collected for samples of high catalytic activity.
5.2.4.2. Long-Term Storage Stability
To observe the effects of albumination on the spontaneous denaturation of GOx,
enzymatic activity was assayed over a period of four weeks with the enzyme samples
stored at 37 °C (elevated temperature to accelerate deactivation and simulate
physiological conditions) in the absence of glucose. To limit sample contamination,
multiple samples were prepared for each enzyme type and each time point to prevent the
need for samples to be repeatedly opened; that is, samples were only opened on the day
they were assayed for enzymatic activity.
5.2.4.3. Operational Stability
To test for the effect of glucose on native GOx and BSA-GOx enzymatic
activity, samples were continuously exposed to PBS containing glucose at room
temperature for up to 24 h. For these experiments, the dynamic dialysis system described
in Section 4.2.4.3 was employed. Enzyme solutions (250 µL, ca. 0.25 mg/mL) were
added to the wells (n = 3), and PBS containing glucose (100 mg/dL) was pumped
through the dialysis chamber at 4 mL/min using a peristaltic pump. After the appropriate
glucose exposure time (6 h, 12 h, or 24 h), glucose-containing PBS was removed from
the dialysis chamber, and 1 L of fresh PBS (no glucose) was pumped through the system
at 4 mL/min (ca. 4 h) to remove excess glucose and product from the sample wells.
Because the samples may change volume due to osmotic and hydrostatic forces—and
because there is a possibility for the membrane to be compromised during testing—the
74
samples were transferred to a standard microplate and concentration was determined
using a multimode microplate reader (Tecan model Infinite M200 PRO series). Finally,
the samples were assayed for enzymatic activity as described in Section 5.2.4.1.
5.2.4.4. Thermostability
To determine if attachment of BSA provided stabilization of the enzyme at
elevated temperatures (i.e., where thermally-induced denaturation dominates), enzyme
samples (0.73 mg/mL) were immersed into a 60 °C water bath for up to 1 h. Separate
replicate samples (n = 3) were prepared for each time point (5 min, 15 min, and 1 h).
Upon removal from the water bath, samples were immediately cooled to 4 °C, then
assayed for enzymatic activity as described in Section 5.2.4.1.
5.2.4.5. Solvent/Additive Stability
Solvents and additives to which BSA-GOx and native GOx might be expected to
be exposed (e.g., during sensor fabrication or sterilization) were tested for their effect on
enzymatic activity. Enzymes (0.25 mg/mL) were exposed to 70% EtOH and 50%
DMSO for 10 min. Additionally, enzymes were exposed to three multi-component
polymer precursor solutions: pHEMA, pHEMA-co-AEMA, and pHEMA-co-AAm. The
composition of each of the precursor solutions is provided in Table 4-1, and the final
enzyme concentrations were approximately 0.215 mg/mL. Following exposures, samples
were transferred back into PBS using centrifugal devices (Pall model Nanosep 30K).
Samples were then transferred to a microplate and concentration was determined using a
multimode microplate reader (Tecan model Infinite M200 PRO series). Finally, the
samples were assayed for enzymatic activity as described in Section 5.2.4.1.
75
5.3. Results and Discussion
5.3.1. Physical Characterization
5.3.1.1. Liquid Chromatography
Fig. 5-3 contains the overlaid chromatograms of the native glycoenzymes (gray
lines) and the AGs (maroon lines) for GOx (Fig. 5-3A) and Cat (Fig. 5-3B). In the case
of both native glycoenzymes, elution of only one primary peak is detected, which has
overlapping absorbance in both the UV (dashed lines) and the visible regions (solid
lines) as expected. In contrast, the UV chromatograms for the crude AG samples contain
three primary peaks, but only the one at the lowest elution volume overlaps with the
single peak detected at the visible wavelengths; this peak corresponds to the AG, and it
is sufficiently resolved from the other peaks such that purification from the other
components in the crude AG sample is possible. The component which eluted at
approximately 76 mL corresponds to BSA, and the peak at approximately 66 mL elution
volume is believed to be dimers of BSA.111
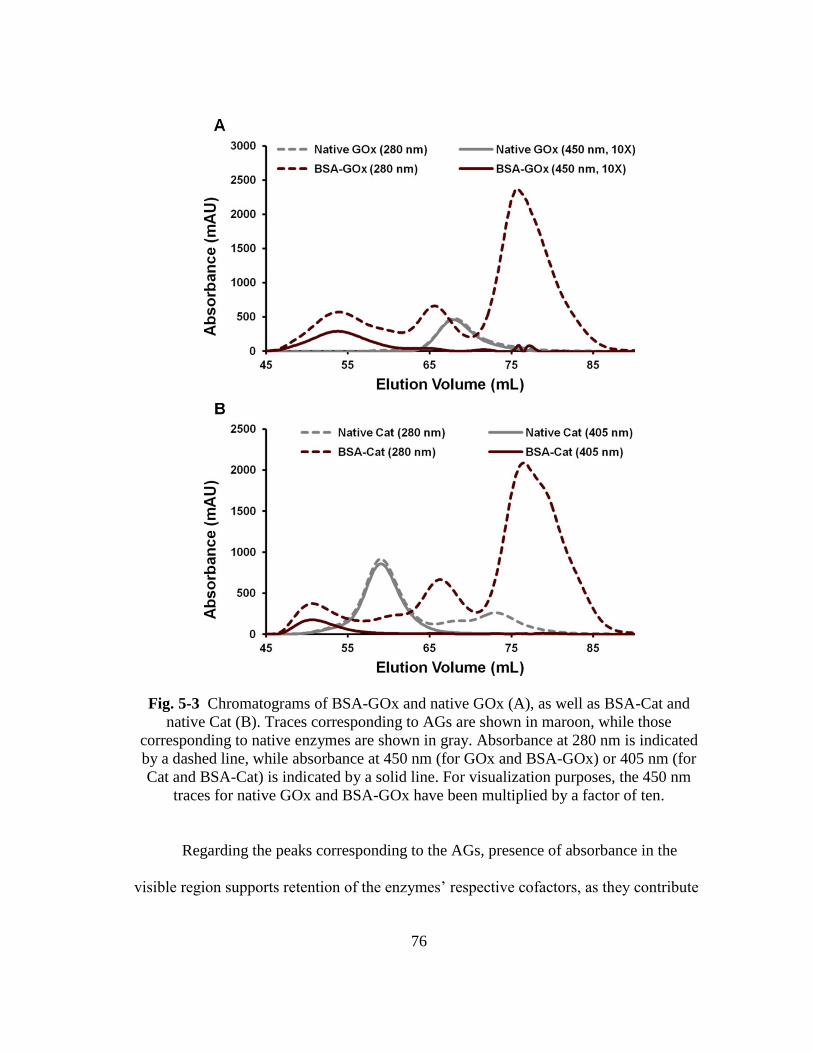
76
Fig. 5-3 Chromatograms of BSA-GOx and native GOx (A), as well as BSA-Cat and
native Cat (B). Traces corresponding to AGs are shown in maroon, while those
corresponding to native enzymes are shown in gray. Absorbance at 280 nm is indicated
by a dashed line, while absorbance at 450 nm (for GOx and BSA-GOx) or 405 nm (for
Cat and BSA-Cat) is indicated by a solid line. For visualization purposes, the 450 nm
traces for native GOx and BSA-GOx have been multiplied by a factor of ten.
Regarding the peaks corresponding to the AGs, presence of absorbance in the
visible region supports retention of the enzymes’ respective cofactors, as they contribute
77
the absorbance in this region. Conjugation of the BSA to the glycoenzymes is supported
by 1) the large shift in elution volume, which is indicative of a drastic increase in the
Stokes radius; and 2) the additional UV absorbance as compared to the native
glycoenzymes. Concerning the latter point, the UV:visible absorbance ratio doubled
upon albumination, increasing from 10:1 for GOx and 1:1 for Cat to 20:1 for BSA-
modified GOx (BSA-GOx) and 2:1 for BSA-modified Cat (BSA-Cat). As BSA absorbs
at 280 nm, but does not contribute any appreciable absorbance at 405 nm or 450 nm, this
increase in the UV:visible absorbance ratio supports co-elution of BSA and GOx.
5.3.1.2. Particle Sizing
DLS was used to determine the hydrodynamic sizes of BSA, the native
glycoenzymes, and the AGs. Particle sizing reveals that BSA has a hydrodynamic
diameter of 7.959 nm. DLS reveals that native GOx has a hydrodynamic diameter of
12.36 nm, which increases by 7.76 nm to 20.12 nm upon modification with BSA.
Likewise, the hydrodynamic diameter of native Cat increases by 9.27 nm following
albumination (from 15.38 nm to 24.65 nm). The relative increase (i.e., percent change)
in hydrodynamic size is similar for both AGs—62.8% increase for BSA-GOx and 60.3%
increase for BSA-Cat.
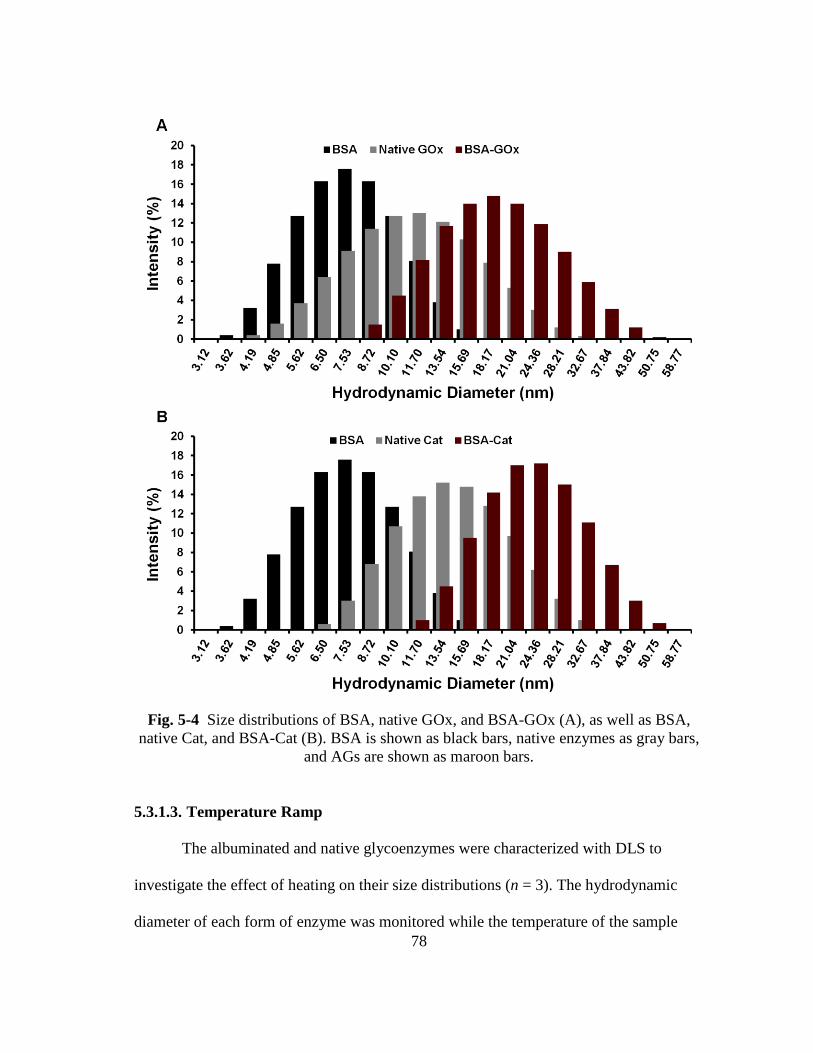
78
Fig. 5-4 Size distributions of BSA, native GOx, and BSA-GOx (A), as well as BSA,
native Cat, and BSA-Cat (B). BSA is shown as black bars, native enzymes as gray bars,
and AGs are shown as maroon bars.
5.3.1.3. Temperature Ramp
The albuminated and native glycoenzymes were characterized with DLS to
investigate the effect of heating on their size distributions (n = 3). The hydrodynamic
diameter of each form of enzyme was monitored while the temperature of the sample
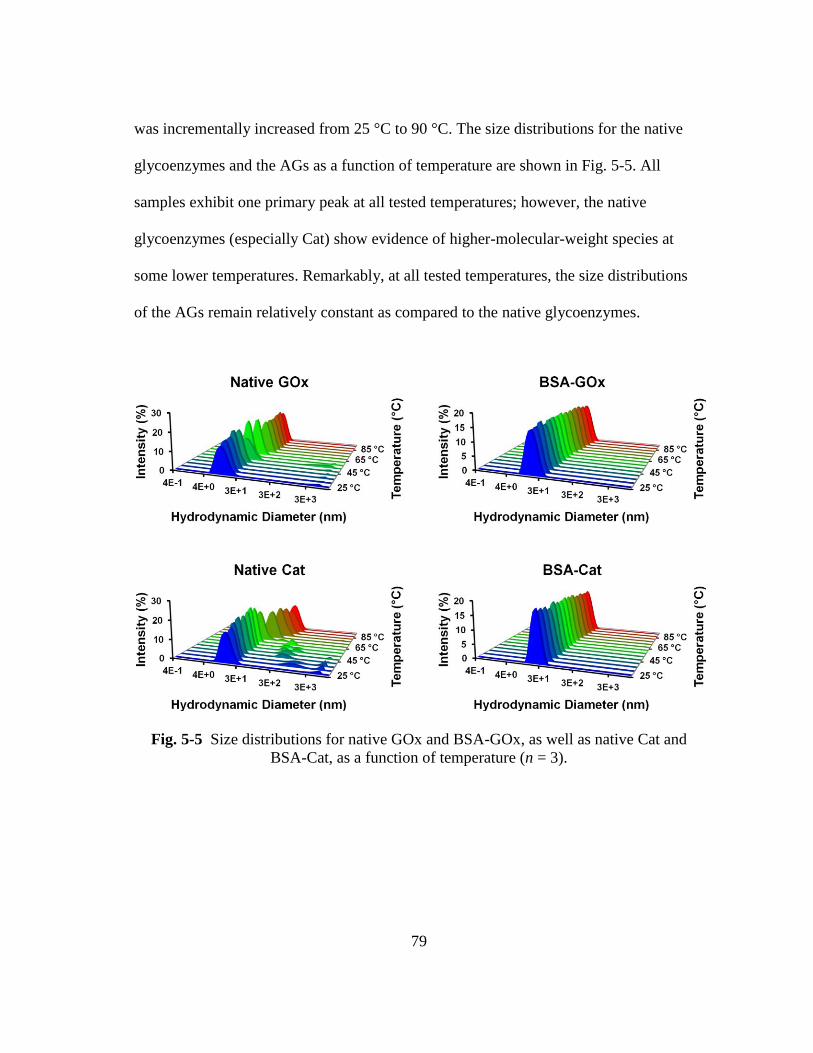
79
was incrementally increased from 25 °C to 90 °C. The size distributions for the native
glycoenzymes and the AGs as a function of temperature are shown in Fig. 5-5. All
samples exhibit one primary peak at all tested temperatures; however, the native
glycoenzymes (especially Cat) show evidence of higher-molecular-weight species at
some lower temperatures. Remarkably, at all tested temperatures, the size distributions
of the AGs remain relatively constant as compared to the native glycoenzymes.
Fig. 5-5 Size distributions for native GOx and BSA-GOx, as well as native Cat and
BSA-Cat, as a function of temperature (n = 3).
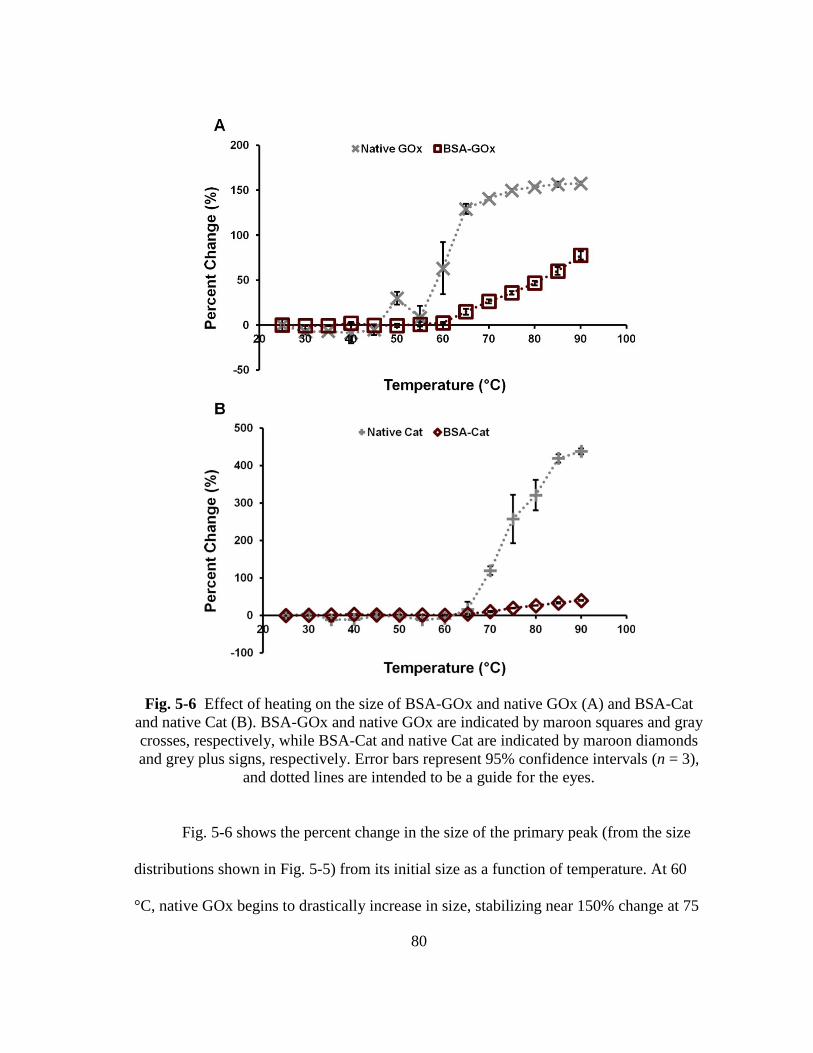
80
Fig. 5-6 Effect of heating on the size of BSA-GOx and native GOx (A) and BSA-Cat
and native Cat (B). BSA-GOx and native GOx are indicated by maroon squares and gray
crosses, respectively, while BSA-Cat and native Cat are indicated by maroon diamonds
and grey plus signs, respectively. Error bars represent 95% confidence intervals (n = 3),
and dotted lines are intended to be a guide for the eyes.
Fig. 5-6 shows the percent change in the size of the primary peak (from the size
distributions shown in Fig. 5-5) from its initial size as a function of temperature. At 60
°C, native GOx begins to drastically increase in size, stabilizing near 150% change at 75
81
°C. This shift of the enzyme’s size distribution toward larger size is indicative of thermal
denaturation and subsequent aggregation, which is consistent with the reported melting
temperature of GOx (ca. 56–58 °C)72, 100, 102
as well as reports that GOx forms trimers
and tetramers upon thermal denaturation.72
Like native GOx, the size distribution for
BSA-GOx begins to increase in size at approximately 60 °C; however, the rate of change
is approximately 5–6 times slower than that of native GOx, and the total percent change
after ramping to 90 °C is reduced by a factor of two. The results obtained for native Cat
and BSA-Cat are similar to those for native GOx and BSA-GOx, but even more
dramatic. Both native Cat and BSA-Cat begin to experience a shift in their size
distributions toward larger size at approximately 65 °C; however, after ramping to 90
°C, native Cat increases by 440% of its initial size, whereas BSA-Cat only increases by
40% (an 11-fold difference).
These findings are consistent with reports in the literature that indicate BSA has
molecular chaperone-like properties.108, 109
Marini and co-workers were the first to
recognize that BSA can act as a molecular chaperone, reporting that addition of BSA to
an enzyme solution significantly reduced thermally induced aggregation.108
Finn and
others also noted that BSA inhibits aggregation and even amyloid formation,109
consistent with the notion that BSA functions like a molecular chaperone. Therefore,
similar interactions between enzyme and BSA might be conserved in the AGs.
The inhibition of aggregation shown in Fig. 5-5 and Fig. 5-6 might be an
indicator that thermal denaturation (and thus, inactivation) is reduced upon
albumination; however, BSA encasement might just prevent the aggregation of
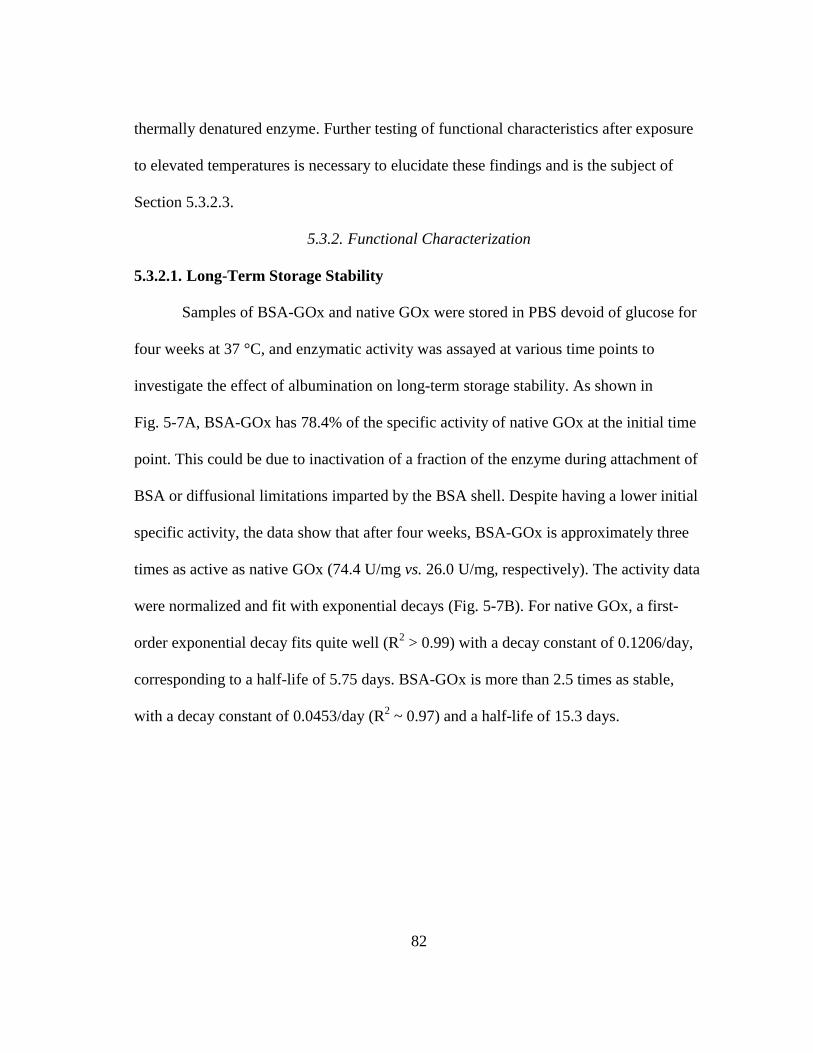
82
thermally denatured enzyme. Further testing of functional characteristics after exposure
to elevated temperatures is necessary to elucidate these findings and is the subject of
Section 5.3.2.3.
5.3.2. Functional Characterization
5.3.2.1. Long-Term Storage Stability
Samples of BSA-GOx and native GOx were stored in PBS devoid of glucose for
four weeks at 37 °C, and enzymatic activity was assayed at various time points to
investigate the effect of albumination on long-term storage stability. As shown in
Fig. 5-7A, BSA-GOx has 78.4% of the specific activity of native GOx at the initial time
point. This could be due to inactivation of a fraction of the enzyme during attachment of
BSA or diffusional limitations imparted by the BSA shell. Despite having a lower initial
specific activity, the data show that after four weeks, BSA-GOx is approximately three
times as active as native GOx (74.4 U/mg vs. 26.0 U/mg, respectively). The activity data
were normalized and fit with exponential decays (Fig. 5-7B). For native GOx, a first-
order exponential decay fits quite well (R2 > 0.99) with a decay constant of 0.1206/day,
corresponding to a half-life of 5.75 days. BSA-GOx is more than 2.5 times as stable,
with a decay constant of 0.0453/day (R2 ~ 0.97) and a half-life of 15.3 days.
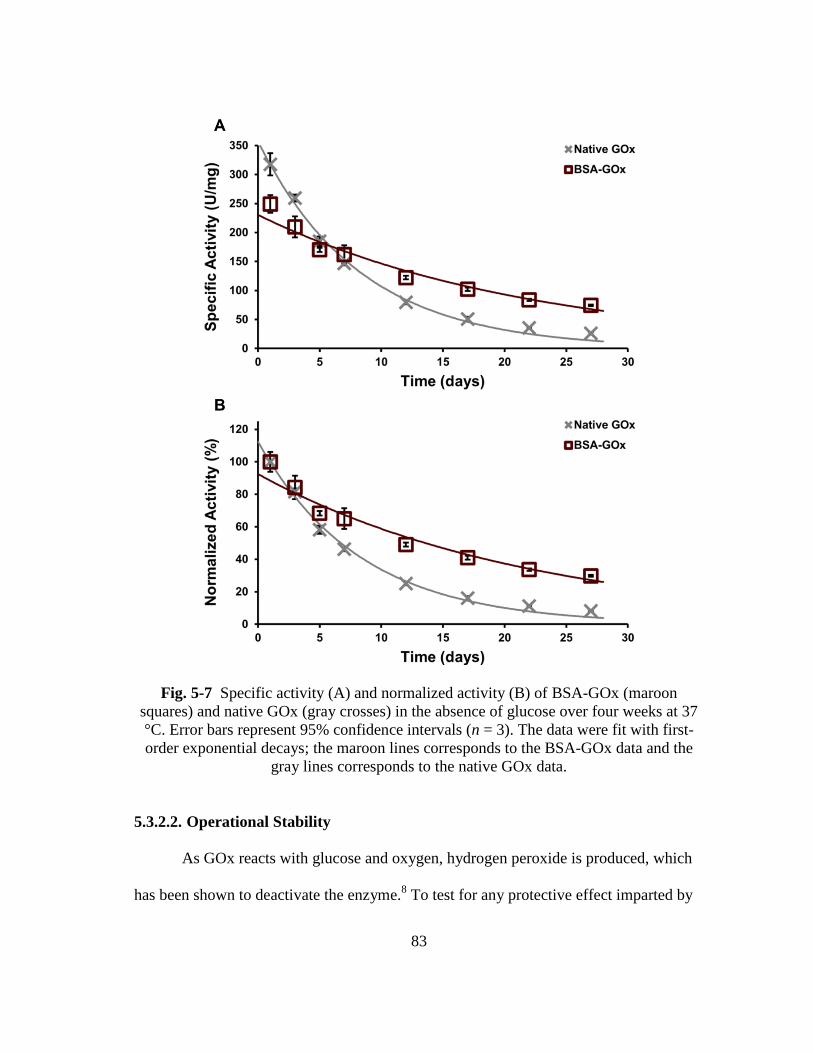
83
Fig. 5-7 Specific activity (A) and normalized activity (B) of BSA-GOx (maroon
squares) and native GOx (gray crosses) in the absence of glucose over four weeks at 37
°C. Error bars represent 95% confidence intervals (n = 3). The data were fit with first-
order exponential decays; the maroon lines corresponds to the BSA-GOx data and the
gray lines corresponds to the native GOx data.
5.3.2.2. Operational Stability
As GOx reacts with glucose and oxygen, hydrogen peroxide is produced, which
has been shown to deactivate the enzyme.8 To test for any protective effect imparted by
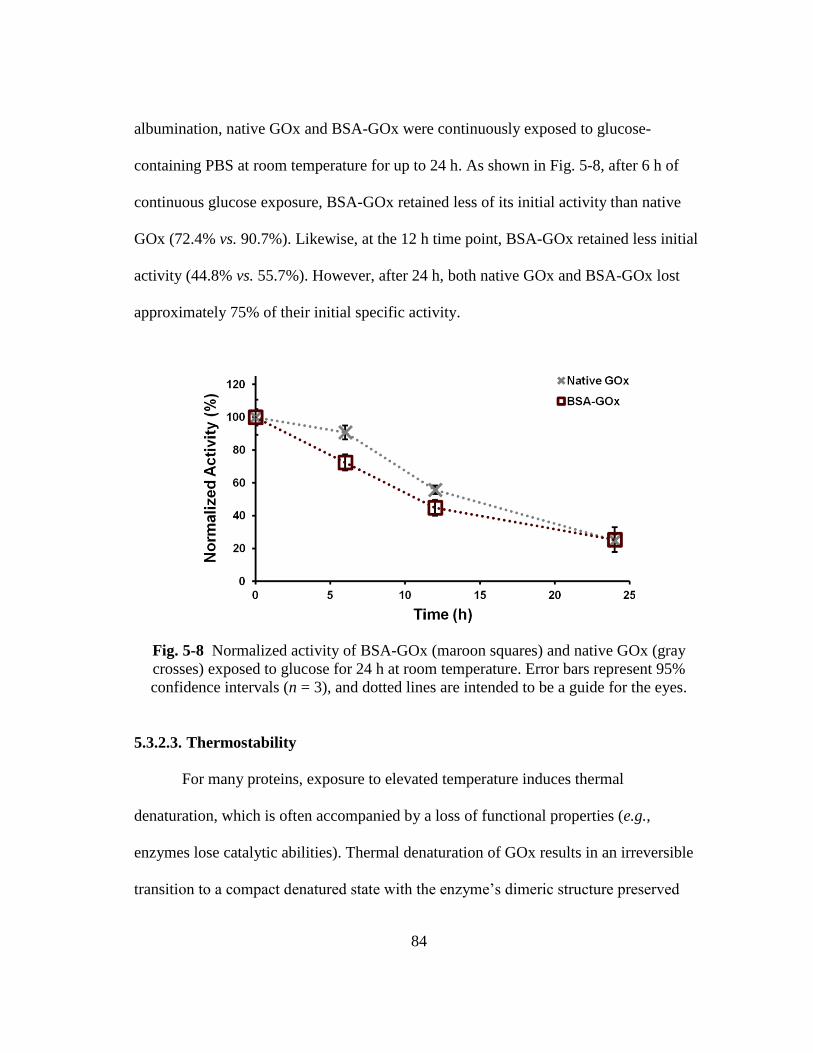
84
albumination, native GOx and BSA-GOx were continuously exposed to glucose-
containing PBS at room temperature for up to 24 h. As shown in Fig. 5-8, after 6 h of
continuous glucose exposure, BSA-GOx retained less of its initial activity than native
GOx (72.4% vs. 90.7%). Likewise, at the 12 h time point, BSA-GOx retained less initial
activity (44.8% vs. 55.7%). However, after 24 h, both native GOx and BSA-GOx lost
approximately 75% of their initial specific activity.
Fig. 5-8 Normalized activity of BSA-GOx (maroon squares) and native GOx (gray
crosses) exposed to glucose for 24 h at room temperature. Error bars represent 95%
confidence intervals (n = 3), and dotted lines are intended to be a guide for the eyes.
5.3.2.3. Thermostability
For many proteins, exposure to elevated temperature induces thermal
denaturation, which is often accompanied by a loss of functional properties (e.g.,
enzymes lose catalytic abilities). Thermal denaturation of GOx results in an irreversible
transition to a compact denatured state with the enzyme’s dimeric structure preserved
85
but dissociation of the FAD co-factor.72
To determine whether albumination imparts
stability at elevated temperatures, enzymatic activity was assayed following exposure to
60 °C for up to 1 h. Fig. 5-9 shows that BSA-GOx is remarkably more stable than native
GOx. After 1 h, native GOx only retains 1.42% of its initial activity, while BSA-GOx
retains 37.7% of its initial activity—a 26.5-fold improvement in stability.
Fig. 5-9 Normalized activity of BSA-GOx (maroon squares) and native GOx (gray
crosses) with exposure to extreme temperature (60 °C). Error bars represent 95%
confidence intervals (n = 3). Native GOx data were fit with a first-order exponential
decay (gray line), while BSA-GOx data were fit with both a first-order (maroon solid
line) and second-order exponential decay (maroon dashed line).
The data were fit with first-order exponential decays (solid lines). For native
GOx, a first-order exponential decay fit well (R2 > 0.99) with a decay constant of
0.1157/min, corresponding to a half-life of 5.99 min. The data for BSA-GOx were also
fit with a first-order exponential decay, which yielded a decay constant and half-life of
0.0144/min and 48.1 min, respectively; however, with a coefficient of determination of

86
approximately 0.91, it was determined that the behavior might be better described using
a multi-exponential decay. As such, the activity data for BSA-GOx were fit with a
second-order exponential decay (dashed line), which fit quite well as expected (R2 = 1).
Two-thirds of the population had a long half-life of 71.7 min, while the remaining one-
third of the population had a short half-life of 3.53 min. Therefore, it appears that
albumination imparts a protective effect upon a majority of the enzyme population,
translating to an overall increase in the thermostability of the AG compared to the native
GOx.
Serum albumin is quite thermostable,106
and enzyme thermostabilization by BSA
has been reported previously by many groups.107-110
Chang and Mahoney showed that
addition of BSA to a solution of β-galactosidase from Streptococcus thermophilus
resulted in a nine-fold thermostabilization. They also proposed that hydrophobic
interactions played a critical role in the stabilizing action imparted by BSA.107
Building
upon that work, Marini and co-workers recognized that BSA has molecular chaperone-
like properties; that is, when added to an enzyme solution, the enzyme experienced
greatly reduced thermal inactivation and aggregation. In some cases, BSA even
outperformed α-crystallin, a recognized intracellular molecular chaperone.108
Finally,
Myung and Zhang also observed enhanced enzyme stability with the addition of BSA,110
which they explained in the context of the macromolecular crowding effect.112
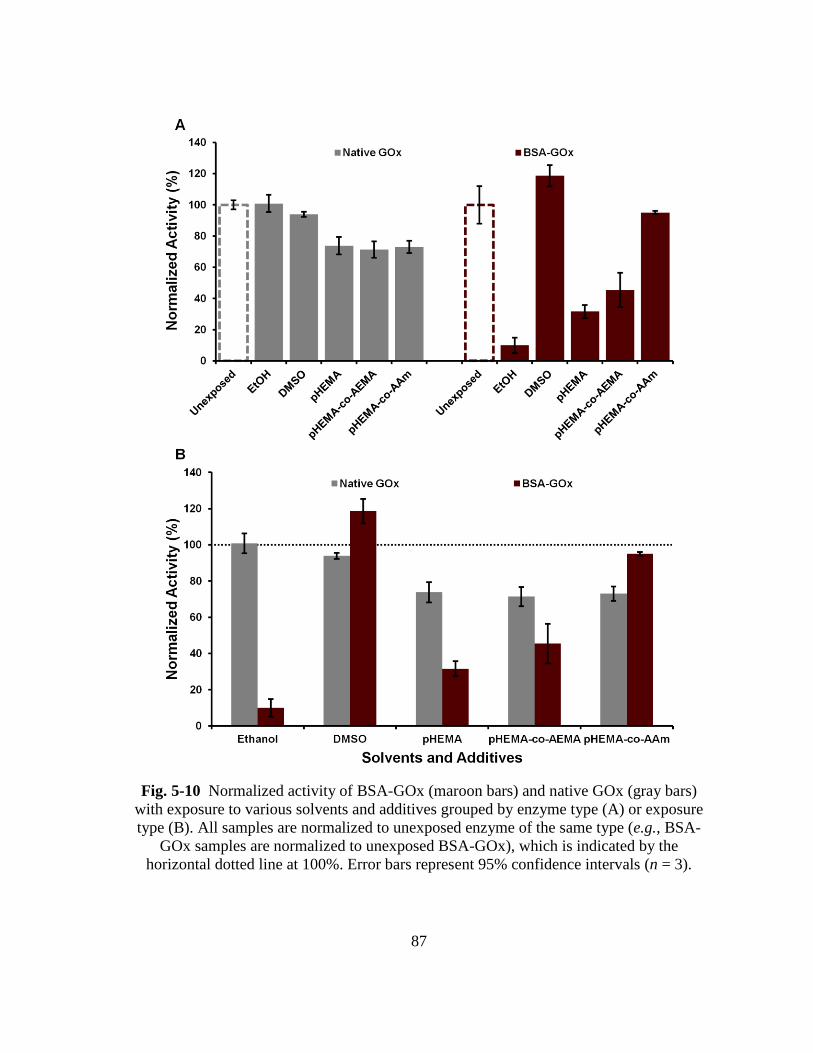
87
Fig. 5-10 Normalized activity of BSA-GOx (maroon bars) and native GOx (gray bars)
with exposure to various solvents and additives grouped by enzyme type (A) or exposure
type (B). All samples are normalized to unexposed enzyme of the same type (e.g., BSA-
GOx samples are normalized to unexposed BSA-GOx), which is indicated by the
horizontal dotted line at 100%. Error bars represent 95% confidence intervals (n = 3).
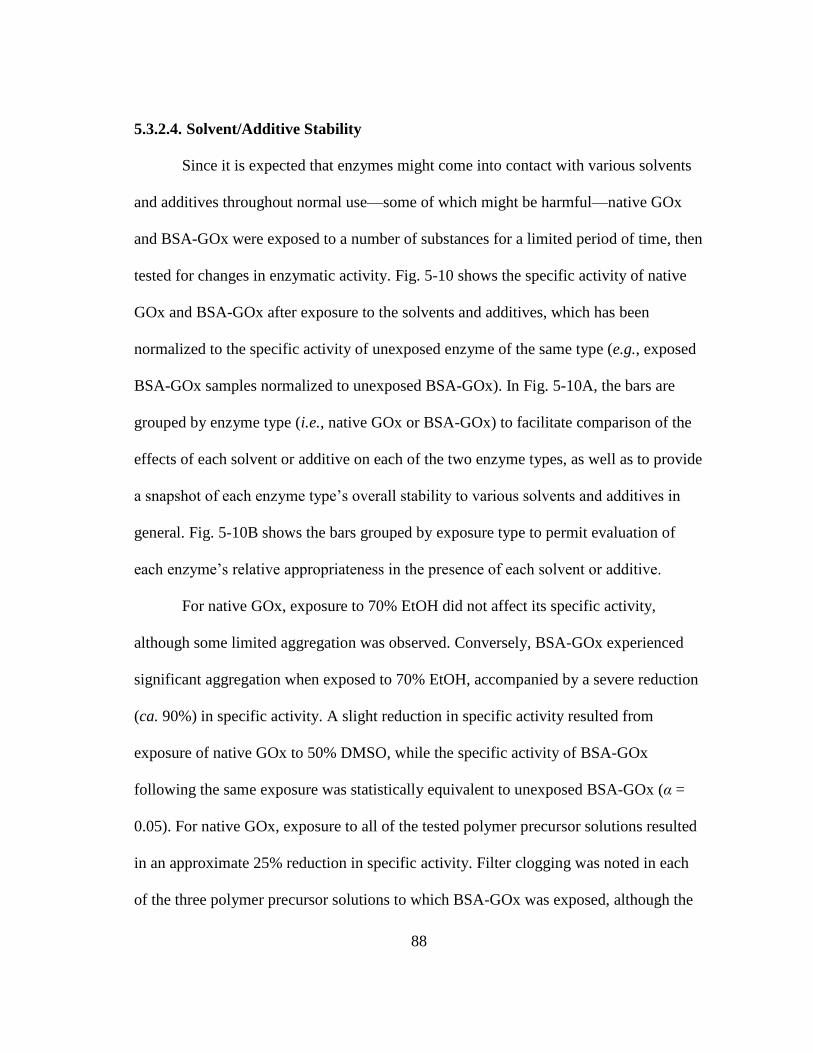
88
5.3.2.4. Solvent/Additive Stability
Since it is expected that enzymes might come into contact with various solvents
and additives throughout normal use—some of which might be harmful—native GOx
and BSA-GOx were exposed to a number of substances for a limited period of time, then
tested for changes in enzymatic activity. Fig. 5-10 shows the specific activity of native
GOx and BSA-GOx after exposure to the solvents and additives, which has been
normalized to the specific activity of unexposed enzyme of the same type (e.g., exposed
BSA-GOx samples normalized to unexposed BSA-GOx). In Fig. 5-10A, the bars are
grouped by enzyme type (i.e., native GOx or BSA-GOx) to facilitate comparison of the
effects of each solvent or additive on each of the two enzyme types, as well as to provide
a snapshot of each enzyme type’s overall stability to various solvents and additives in
general. Fig. 5-10B shows the bars grouped by exposure type to permit evaluation of
each enzyme’s relative appropriateness in the presence of each solvent or additive.
For native GOx, exposure to 70% EtOH did not affect its specific activity,
although some limited aggregation was observed. Conversely, BSA-GOx experienced
significant aggregation when exposed to 70% EtOH, accompanied by a severe reduction
(ca. 90%) in specific activity. A slight reduction in specific activity resulted from
exposure of native GOx to 50% DMSO, while the specific activity of BSA-GOx
following the same exposure was statistically equivalent to unexposed BSA-GOx (α =
0.05). For native GOx, exposure to all of the tested polymer precursor solutions resulted
in an approximate 25% reduction in specific activity. Filter clogging was noted in each
of the three polymer precursor solutions to which BSA-GOx was exposed, although the
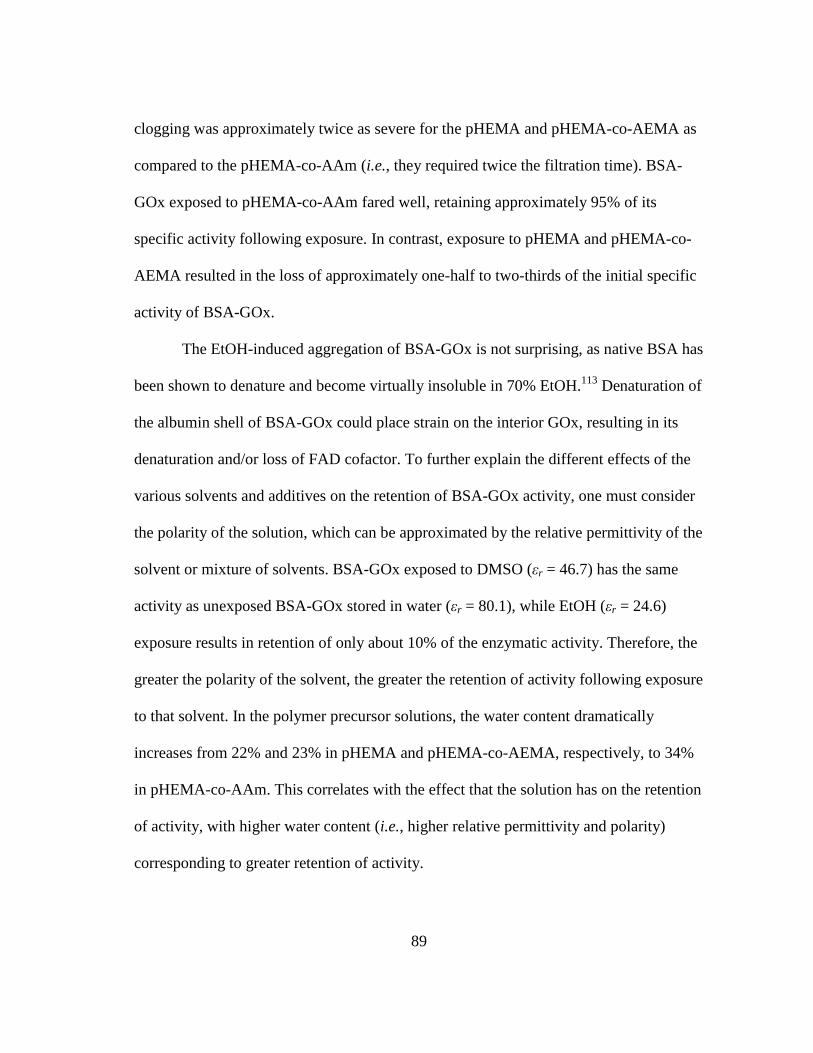
89
clogging was approximately twice as severe for the pHEMA and pHEMA-co-AEMA as
compared to the pHEMA-co-AAm (i.e., they required twice the filtration time). BSA-
GOx exposed to pHEMA-co-AAm fared well, retaining approximately 95% of its
specific activity following exposure. In contrast, exposure to pHEMA and pHEMA-co-
AEMA resulted in the loss of approximately one-half to two-thirds of the initial specific
activity of BSA-GOx.
The EtOH-induced aggregation of BSA-GOx is not surprising, as native BSA has
been shown to denature and become virtually insoluble in 70% EtOH.113
Denaturation of
the albumin shell of BSA-GOx could place strain on the interior GOx, resulting in its
denaturation and/or loss of FAD cofactor. To further explain the different effects of the
various solvents and additives on the retention of BSA-GOx activity, one must consider
the polarity of the solution, which can be approximated by the relative permittivity of the
solvent or mixture of solvents. BSA-GOx exposed to DMSO (εr = 46.7) has the same
activity as unexposed BSA-GOx stored in water (εr = 80.1), while EtOH (εr = 24.6)
exposure results in retention of only about 10% of the enzymatic activity. Therefore, the
greater the polarity of the solvent, the greater the retention of activity following exposure
to that solvent. In the polymer precursor solutions, the water content dramatically
increases from 22% and 23% in pHEMA and pHEMA-co-AEMA, respectively, to 34%
in pHEMA-co-AAm. This correlates with the effect that the solution has on the retention
of activity, with higher water content (i.e., higher relative permittivity and polarity)
corresponding to greater retention of activity.
90
As discussed in Section 4.3.2.4, it should be clarified that a limitation of this
work is that the enzymes are no longer exposed to the solvent or additive when tested for
enzymatic activity. In one way, this is ideal because irreversible changes that occur
during the enzyme’s exposure to the solvent or additive are revealed (initial and final
states are identical; i.e., aqueous buffered solution devoid of solvent or additive).
Furthermore, dissolution of the enzyme in solutions with the same composition during
activity testing permits direct comparison among the various exposure types. However,
one must consider the actual application in which the enzyme will be employed. For our
lab’s intended application (i.e., incorporation into pHEMA-based hydrogels), it is
expected that the enzyme might be exposed to 70% EtOH for a short period of time
during sterilization. To some extent, this is also the case for the polymer precursor
solutions; however, it’s actually much more complex because the solution components
are transformed during hydrogel formation, which completely changes the environment
of the enzyme. As such, it is necessary to perform in situ activity testing of the enzyme
immobilized within the hydrogel. This is beyond the scope of this dissertation, but will
need to be considered in future work.
5.4. Conclusions
In summary, we have demonstrated that two glycoenzymes, GOx and Cat, can be
bioconjugated with BSA to form AGs. Liquid chromatography reveals a large shift in
the elution volume accompanied by a doubling of the UV:visible absorbance ratio
following albumination, which supports conjugation of the enzyme with BSA. DLS
indicates that the AGs are approximately 60% larger than the respective native
91
glycoenzymes, which provides secondary confirmation that modification has occurred.
Both BSA-GOx and BSA-Cat appear to resist aggregation during heating to 90 °C, but
this effect is more profound in the latter AG. It is proposed that the previously reported
molecular chaperone-like properties of BSA might be conserved in the AGs.
The response of BSA-GOx to the tested conditions, in terms of its functional
characteristics, varied greatly. For instance, the thermostability of BSA-GOx is excellent
compared to the native glycoenzyme, and moderate stabilization is observed with
storage for one month at physiological temperature and in the absence of glucose.
However, BSA-GOx experienced significant reductions in activity following exposure to
solvents with relatively low relative permittivity and polymer precursor solutions with
relatively low water content. Operational stability of GOx appeared to be unaffected by
albumination. Therefore, careful consideration of the expected conditions is required
before BSA-GOx should be utilized in a particular application.
92
6. CONCLUSIONS AND FUTURE WORK*
Enzyme deactivation is expected to be a major barrier in the realization of long-
term glucose sensing with fully implantable optical glucose biosensors, and this work
represents a step toward overcoming that hurdle. This dissertation presents the
evaluation of three enzyme modification strategies, which have been tailored to suit the
constraints of our specific application. Each strategy yields a stabilized enzyme under
certain conditions, whether it be long-term storage, elevated temperature, or exposure to
various solvents/additives.
In the first approach, GOx was modified using a glycosylation site-targeted
PEGylation approach. Two different techniques—GFC and denaturing polyacrylamide
gel electrophoresis—were utilized to provide independent approximations of the
apparent molecular mass. Both techniques revealed that the PEGylated enzyme had a
significantly higher apparent molecular mass as compared to native GOx, which
supported successful modification of the enzyme. Moreover, both characterization
techniques indicated that only one form of the modified enzyme was present following
PEGylation, which simplified separation. The actual molecular mass increase was
measured using MALDI-TOF mass spectrometry, and from the 15 kDa increase in mass
per monomer, it was determined that six 5 kDa PEG chains were attached to each GOx
dimer. To complete the physical characterization of PEG-GOx, DLS was used to
* Parts of this section are reprinted with permission from “Glycosylation site-targeted PEGylation of
glucose oxidase retains native enzymatic activity” by D.W. Ritter, J. R. Roberts and M. J. McShane,
Enzyme Microb. Technol., 2013, 52, 279-285. Copyright 2013 by Elsevier Inc.
93
observe a change in hydrodynamic size following modification; this also allowed for
confirmation that oligomers were not present in the purified PEG-GOx sample.
Following extensive physical characterization of the PEG-GOx, its long-term
storage stability and operational stability were tested. After storage in buffer for 29 days
at 37 °C, PEG-GOx and native GOx had lost an equivalent amount of enzymatic
activity. However, due to differing activities at intermediate time points for the two
sample types, the half-life value calculated for PEG-GOx was 60% longer than native
GOx. No operational stabilization was realized upon PEGylation, as native GOx and
PEG-GOx had the same activity retention following glucose exposure for 24 h. Although
no major improvements in storage or operational stability were observed upon
PEGylation of GOx, this modified enzyme could still be employed in applications
requiring increased size and near-native enzymatic activity. An example where these
qualities might be desirable would be in the entrapment of GOx within a polymeric
matrix that has a mesh size slightly larger than GOx. In this case, an increase in the
hydrodynamic size—via PEGylation, for instance—would likely yield improved
entrapment (i.e., increased retention of the GOx over time). Therefore, while direct
stabilization of the enzyme is not achieved, better entrapment of the enzyme would
translate to improved apparent enzyme stability of the enzyme-containing system. Future
work could incorporate PEG chains of different molecular weight (i.e., other than 5 kDa)
and geometry (i.e., other than linear), which might better protect the GOx.
Building upon the previous approach, the second approach was intended to
stabilize GOx through modification of the initially PEGylated enzyme with GA. I
94
hypothesized that the glycosylation site-bound PEG chains would stabilize GOx
(through steric hindrance) against intermolecular crosslinking, while permitting GA
modification. As expected, the amine content of the PEG-GOx, as determined by a
fluorescamine assay, was reduced with increasing GA concentration; this effect was also
observed with native GOx, which indicates that the presence of PEG does not appear to
inhibit GA modification. Furthermore, exposure of native GOx to increasing
concentrations of GA resulted in aggregation of the enzyme (significant at higher
concentrations). Conversely, the hydrodynamic size of PEG-GOx was not altered across
the entire range of tested GA concentrations. These findings support the hypothesis that
initial deposition of PEG imparts steric stability to the enzyme during subsequent GA
modification, which prevents the occurrence of irreversible, large-scale aggregation, but
does not inhibit GA modification.
GA modification of PEG-GOx was shown to dramatically improve long-term
storage stability. Following four weeks of storage in buffer at 37 °C, PEG-GOx modified
with 2.5 wt% GA retained approximately an order of magnitude more initial activity
than native GOx. PEGylation of the enzyme (with or without GA modification) appears
to stabilize the enzyme against heat-induced aggregation. Interestingly, however,
enzyme modification with PEG appeared to impart greater resistance to thermal
deactivation as compared to modification with GA. Likewise, PEG-GOx appeared most
tolerant of the panel of solvents and additives to which it was exposed in this study—
even more than GA-modified PEG-GOx. Finally, neither PEGylation nor GA
modification, nor the combination thereof, produced an improvement in operational
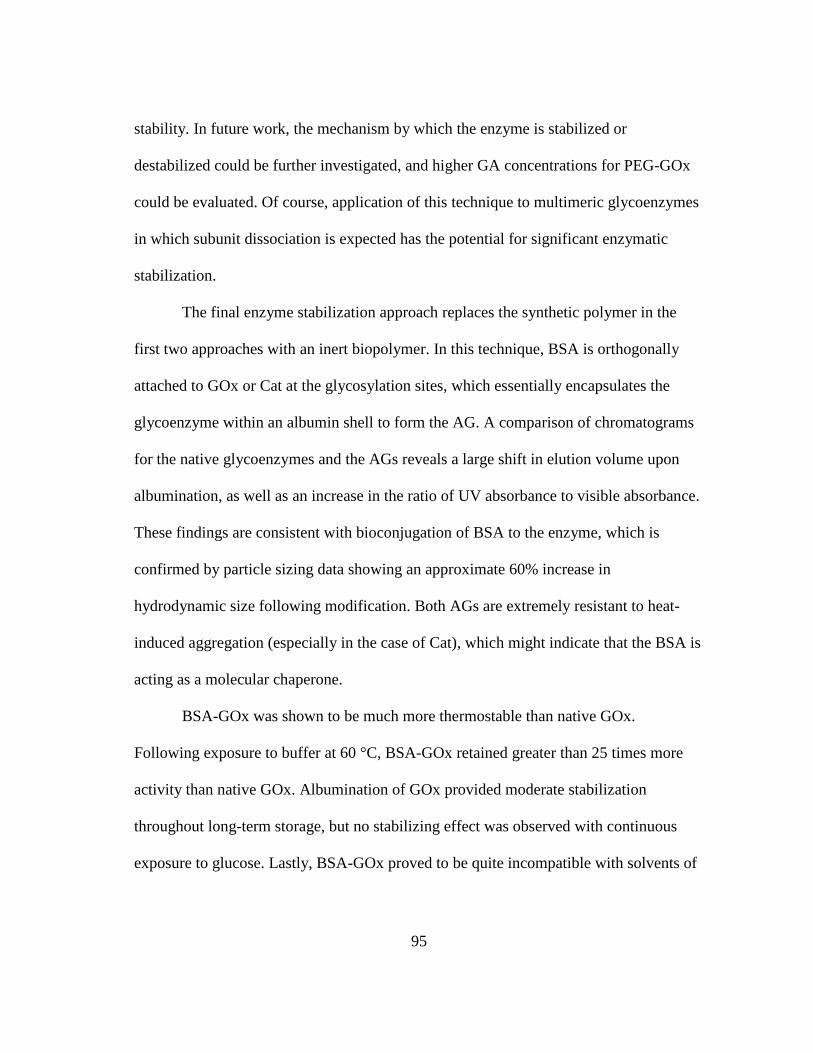
95
stability. In future work, the mechanism by which the enzyme is stabilized or
destabilized could be further investigated, and higher GA concentrations for PEG-GOx
could be evaluated. Of course, application of this technique to multimeric glycoenzymes
in which subunit dissociation is expected has the potential for significant enzymatic
stabilization.
The final enzyme stabilization approach replaces the synthetic polymer in the
first two approaches with an inert biopolymer. In this technique, BSA is orthogonally
attached to GOx or Cat at the glycosylation sites, which essentially encapsulates the
glycoenzyme within an albumin shell to form the AG. A comparison of chromatograms
for the native glycoenzymes and the AGs reveals a large shift in elution volume upon
albumination, as well as an increase in the ratio of UV absorbance to visible absorbance.
These findings are consistent with bioconjugation of BSA to the enzyme, which is
confirmed by particle sizing data showing an approximate 60% increase in
hydrodynamic size following modification. Both AGs are extremely resistant to heat-
induced aggregation (especially in the case of Cat), which might indicate that the BSA is
acting as a molecular chaperone.
BSA-GOx was shown to be much more thermostable than native GOx.
Following exposure to buffer at 60 °C, BSA-GOx retained greater than 25 times more
activity than native GOx. Albumination of GOx provided moderate stabilization
throughout long-term storage, but no stabilizing effect was observed with continuous
exposure to glucose. Lastly, BSA-GOx proved to be quite incompatible with solvents of
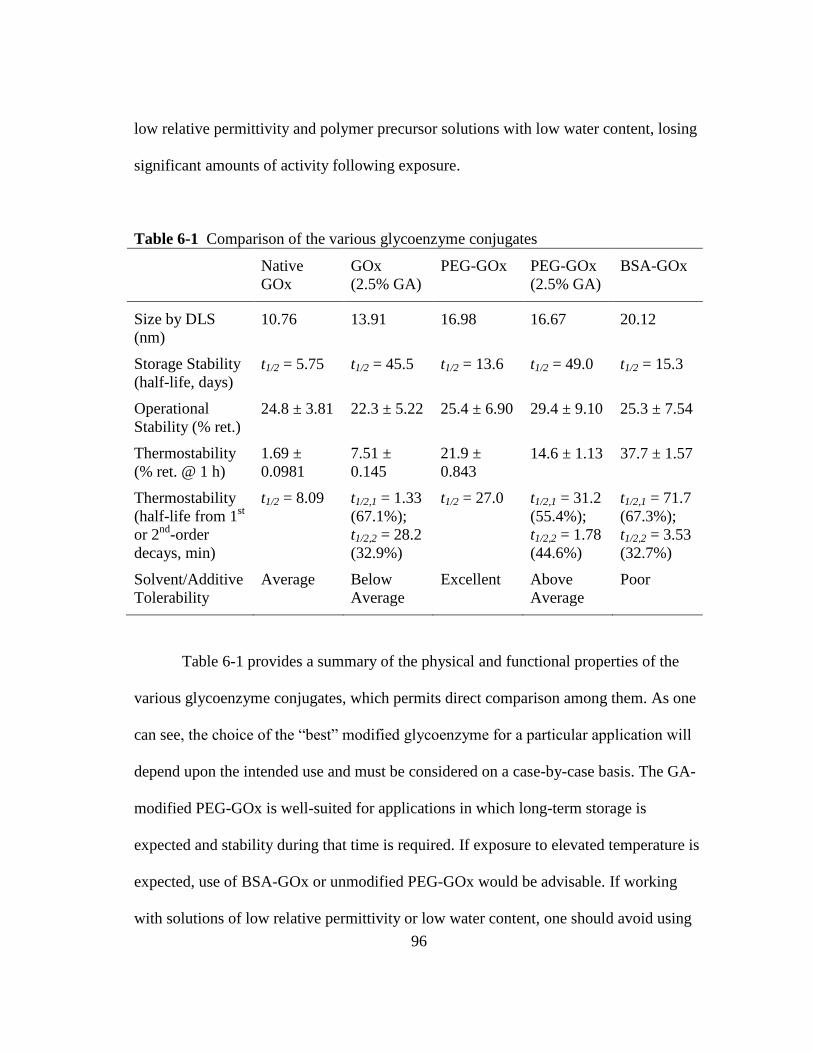
96
low relative permittivity and polymer precursor solutions with low water content, losing
significant amounts of activity following exposure.
Table 6-1 Comparison of the various glycoenzyme conjugates
Native
GOx
GOx
(2.5% GA)
PEG-GOx PEG-GOx
(2.5% GA)
BSA-GOx
Size by DLS
(nm)
10.76 13.91 16.98 16.67 20.12
Storage Stability
(half-life, days)
t1/2 = 5.75 t1/2 = 45.5 t1/2 = 13.6 t1/2 = 49.0 t1/2 = 15.3
Operational
Stability (% ret.)
24.8 ± 3.81 22.3 ± 5.22 25.4 ± 6.90 29.4 ± 9.10 25.3 ± 7.54
Thermostability
(% ret. @ 1 h)
1.69 ±
0.0981
7.51 ±
0.145
21.9 ±
0.843
14.6 ± 1.13 37.7 ± 1.57
Thermostability
(half-life from 1st
or 2nd
-order
decays, min)
t1/2 = 8.09 t1/2,1 = 1.33
(67.1%);
t1/2,2 = 28.2
(32.9%)
t1/2 = 27.0 t1/2,1 = 31.2
(55.4%);
t1/2,2 = 1.78
(44.6%)
t1/2,1 = 71.7
(67.3%);
t1/2,2 = 3.53
(32.7%)
Solvent/Additive
Tolerability
Average Below
Average
Excellent Above
Average
Poor
Table 6-1 provides a summary of the physical and functional properties of the
various glycoenzyme conjugates, which permits direct comparison among them. As one
can see, the choice of the “best” modified glycoenzyme for a particular application will
depend upon the intended use and must be considered on a case-by-case basis. The GA-
modified PEG-GOx is well-suited for applications in which long-term storage is
expected and stability during that time is required. If exposure to elevated temperature is
expected, use of BSA-GOx or unmodified PEG-GOx would be advisable. If working
with solutions of low relative permittivity or low water content, one should avoid using
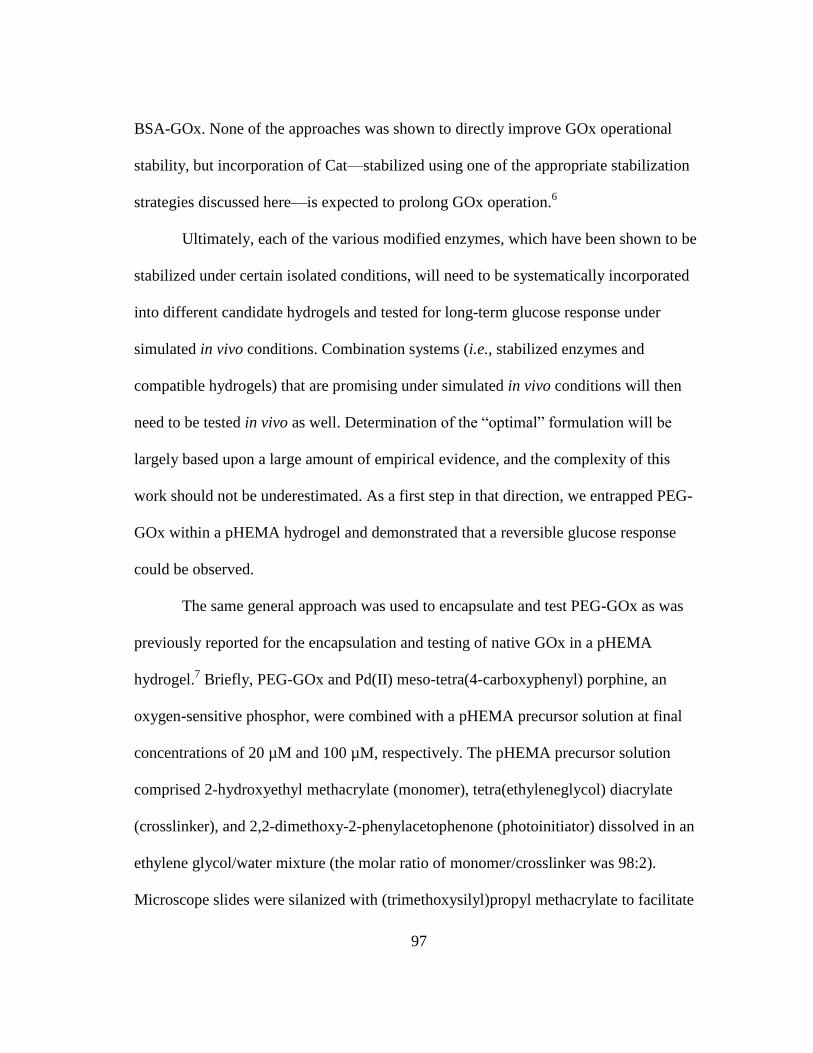
97
BSA-GOx. None of the approaches was shown to directly improve GOx operational
stability, but incorporation of Cat—stabilized using one of the appropriate stabilization
strategies discussed here—is expected to prolong GOx operation.6
Ultimately, each of the various modified enzymes, which have been shown to be
stabilized under certain isolated conditions, will need to be systematically incorporated
into different candidate hydrogels and tested for long-term glucose response under
simulated in vivo conditions. Combination systems (i.e., stabilized enzymes and
compatible hydrogels) that are promising under simulated in vivo conditions will then
need to be tested in vivo as well. Determination of the “optimal” formulation will be
largely based upon a large amount of empirical evidence, and the complexity of this
work should not be underestimated. As a first step in that direction, we entrapped PEG-
GOx within a pHEMA hydrogel and demonstrated that a reversible glucose response
could be observed.
The same general approach was used to encapsulate and test PEG-GOx as was
previously reported for the encapsulation and testing of native GOx in a pHEMA
hydrogel.7 Briefly, PEG-GOx and Pd(II) meso-tetra(4-carboxyphenyl) porphine, an
oxygen-sensitive phosphor, were combined with a pHEMA precursor solution at final
concentrations of 20 µM and 100 µM, respectively. The pHEMA precursor solution
comprised 2-hydroxyethyl methacrylate (monomer), tetra(ethyleneglycol) diacrylate
(crosslinker), and 2,2-dimethoxy-2-phenylacetophenone (photoinitiator) dissolved in an
ethylene glycol/water mixture (the molar ratio of monomer/crosslinker was 98:2).
Microscope slides were silanized with (trimethoxysilyl)propyl methacrylate to facilitate
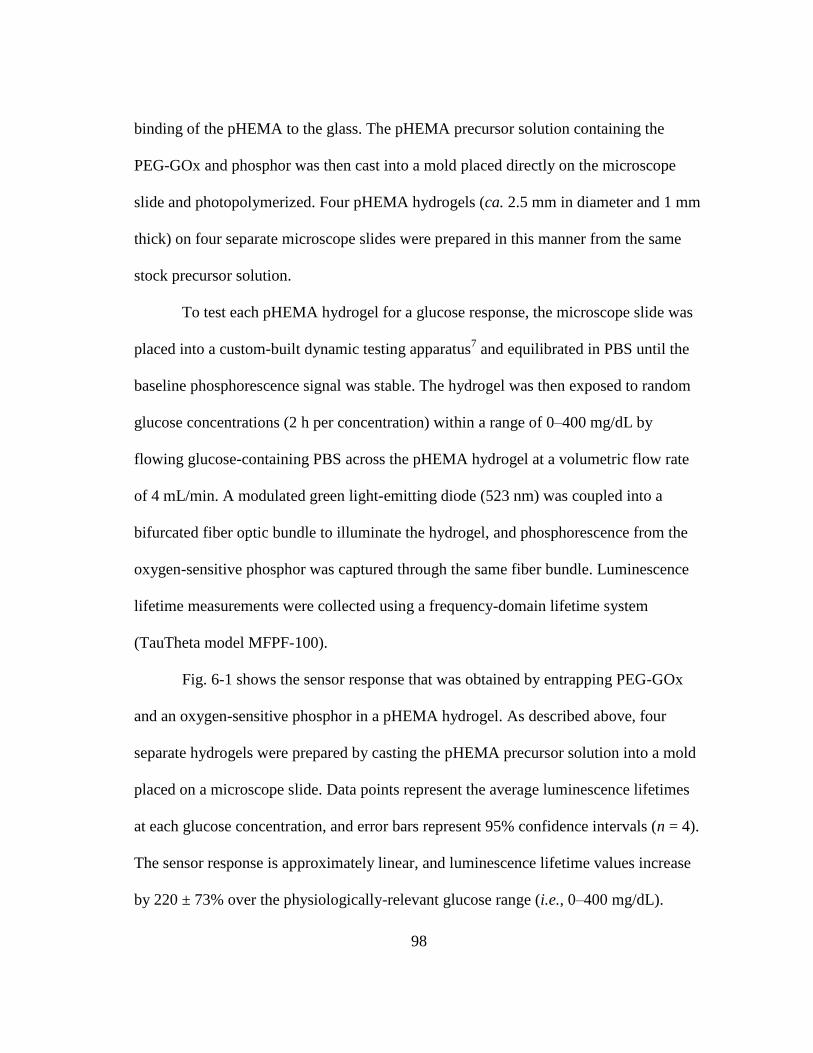
98
binding of the pHEMA to the glass. The pHEMA precursor solution containing the
PEG-GOx and phosphor was then cast into a mold placed directly on the microscope
slide and photopolymerized. Four pHEMA hydrogels (ca. 2.5 mm in diameter and 1 mm
thick) on four separate microscope slides were prepared in this manner from the same
stock precursor solution.
To test each pHEMA hydrogel for a glucose response, the microscope slide was
placed into a custom-built dynamic testing apparatus7 and equilibrated in PBS until the
baseline phosphorescence signal was stable. The hydrogel was then exposed to random
glucose concentrations (2 h per concentration) within a range of 0–400 mg/dL by
flowing glucose-containing PBS across the pHEMA hydrogel at a volumetric flow rate
of 4 mL/min. A modulated green light-emitting diode (523 nm) was coupled into a
bifurcated fiber optic bundle to illuminate the hydrogel, and phosphorescence from the
oxygen-sensitive phosphor was captured through the same fiber bundle. Luminescence
lifetime measurements were collected using a frequency-domain lifetime system
(TauTheta model MFPF-100).
Fig. 6-1 shows the sensor response that was obtained by entrapping PEG-GOx
and an oxygen-sensitive phosphor in a pHEMA hydrogel. As described above, four
separate hydrogels were prepared by casting the pHEMA precursor solution into a mold
placed on a microscope slide. Data points represent the average luminescence lifetimes
at each glucose concentration, and error bars represent 95% confidence intervals (n = 4).
The sensor response is approximately linear, and luminescence lifetime values increase
by 220 ± 73% over the physiologically-relevant glucose range (i.e., 0–400 mg/dL).
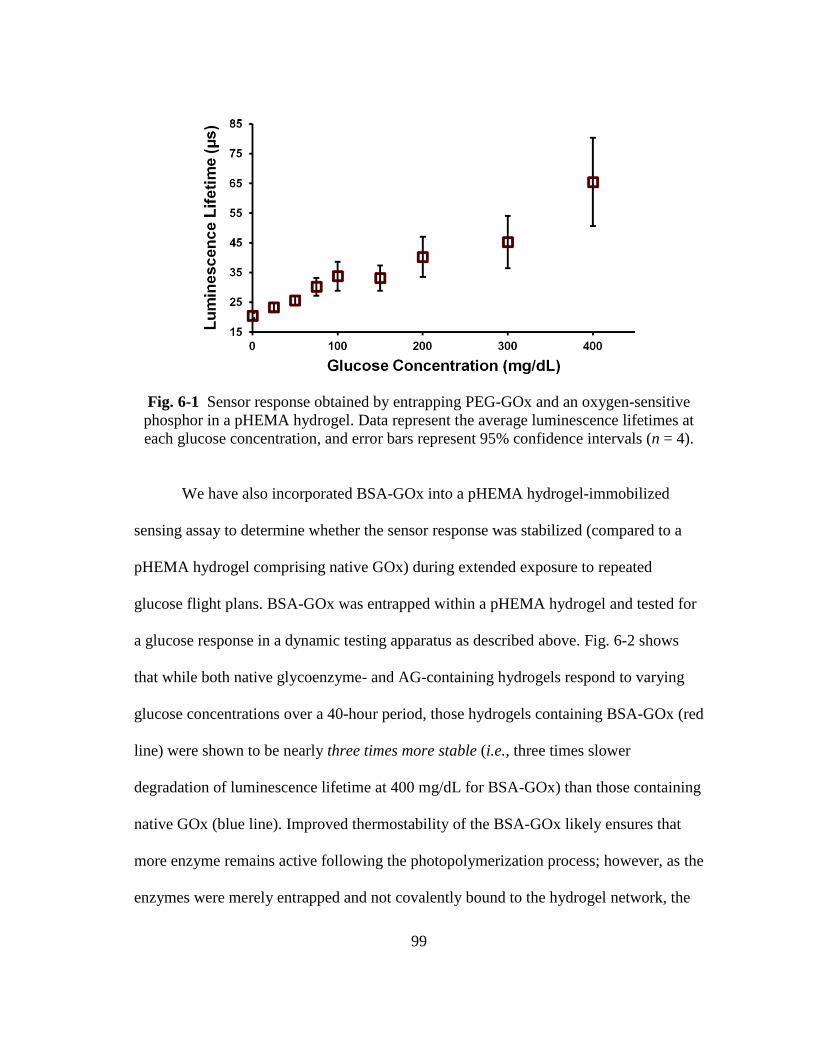
99
Fig. 6-1 Sensor response obtained by entrapping PEG-GOx and an oxygen-sensitive
phosphor in a pHEMA hydrogel. Data represent the average luminescence lifetimes at
each glucose concentration, and error bars represent 95% confidence intervals (n = 4).
We have also incorporated BSA-GOx into a pHEMA hydrogel-immobilized
sensing assay to determine whether the sensor response was stabilized (compared to a
pHEMA hydrogel comprising native GOx) during extended exposure to repeated
glucose flight plans. BSA-GOx was entrapped within a pHEMA hydrogel and tested for
a glucose response in a dynamic testing apparatus as described above. Fig. 6-2 shows
that while both native glycoenzyme- and AG-containing hydrogels respond to varying
glucose concentrations over a 40-hour period, those hydrogels containing BSA-GOx (red
line) were shown to be nearly three times more stable (i.e., three times slower
degradation of luminescence lifetime at 400 mg/dL for BSA-GOx) than those containing
native GOx (blue line). Improved thermostability of the BSA-GOx likely ensures that
more enzyme remains active following the photopolymerization process; however, as the
enzymes were merely entrapped and not covalently bound to the hydrogel network, the
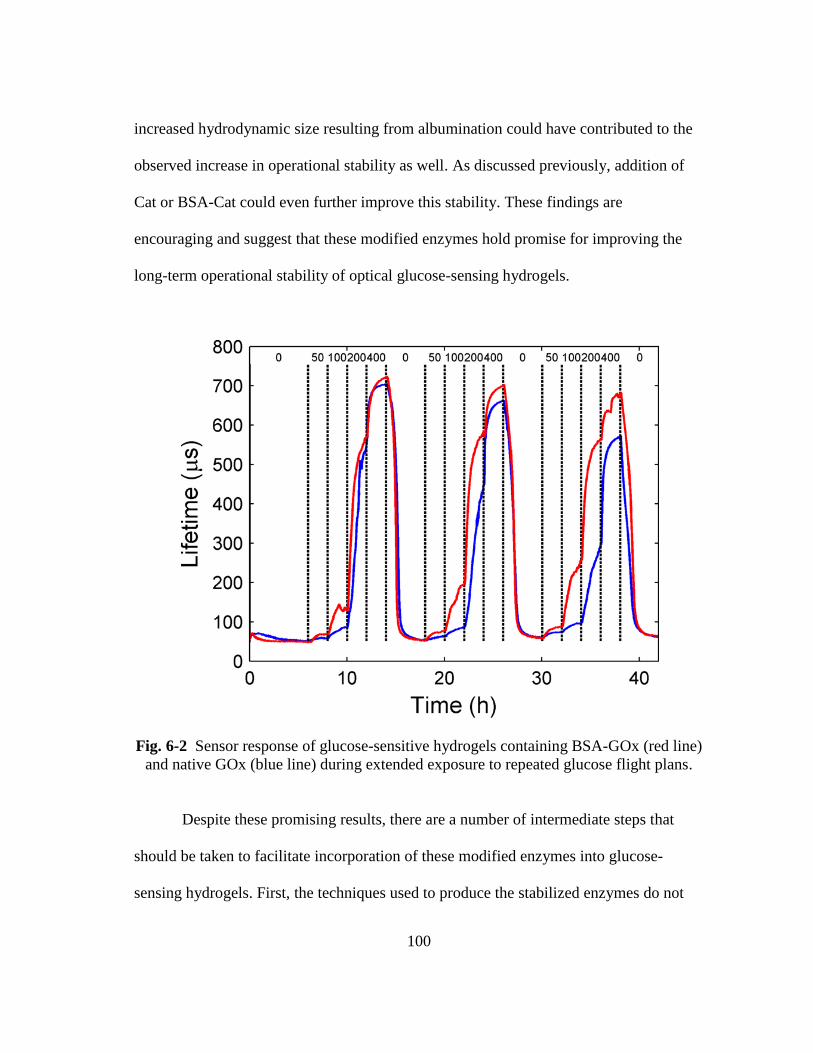
100
increased hydrodynamic size resulting from albumination could have contributed to the
observed increase in operational stability as well. As discussed previously, addition of
Cat or BSA-Cat could even further improve this stability. These findings are
encouraging and suggest that these modified enzymes hold promise for improving the
long-term operational stability of optical glucose-sensing hydrogels.
Fig. 6-2 Sensor response of glucose-sensitive hydrogels containing BSA-GOx (red line)
and native GOx (blue line) during extended exposure to repeated glucose flight plans.
Despite these promising results, there are a number of intermediate steps that
should be taken to facilitate incorporation of these modified enzymes into glucose-
sensing hydrogels. First, the techniques used to produce the stabilized enzymes do not
101
yield large quantities of product, which increases the cost and time intensiveness. This
also leads to secondary issues, such as loss of activity from lyophilized stock GOx due to
long-term storage and multiple freeze-thaw cycles. As such, these techniques will need
to be “scaled-up” such that incorporation into hydrogels and testing at the required scale
becomes feasible. Alternatively, the amount of enzyme required to be immobilized
within the hydrogels could be reduced, but this could have unintended consequences on
sensor response and/or sensor longevity.
Development of appropriate lyophilization strategies for the modified enzymes
would also be beneficial, as this would permit their storage for longer periods of time
with reduced activity loss (as compared to solution-phase storage). Moreover,
lyophilized (dry) product could be added to polymer precursor solutions to yield higher
final enzyme concentrations in the glucose-sensing hydrogels.
Finally, while physical entrapment of the modified enzymes within the hydrogels
may be sufficient for early simulated in vivo testing to show proof of concept, covalent
attachment of the modified enzymes to the hydrogel in which they are incorporated
would be ideal. Release of enzyme will lead to response degradation, leached enzyme
could elicit a host response that further degrades sensor response, and most importantly,
leached enzyme could have deleterious effects on the host.
Covalent attachment of BSA-GOx should be relatively straightforward, as the
BSA surface presents 30–35 solvent-accessible lysine ε-amino groups and even more
carboxylic acids (pI of BSA is 5.1). BSA-GOx could be directly attached to amine
groups on pHEMA-co-AEMA using carbodiimide chemistry or a dialdehyde.
102
Alternatively, the surface of BSA-GOx could be decorated with amine-reactive
heterobifunctional crosslinkers presenting acrylate groups on the distal end, which would
permit covalent incorporation of the BSA-GOx during photopolymerization.
Because PEG-GOx and GA-modified PEG-GOx were designed to have inert
surfaces, covalent attachment of these modified enzymes will be more challenging. The
most obvious approach would be to replace the methoxy-terminated PEG-Hz with
another heterobifunctional PEG-Hz. Unfortunately, there is not a diverse selection of
commercially available heterobifunctional PEG-Hz, which might require custom
synthesis of PEG derivatives. In this case, a photo-activatable distal group would be
ideal, in that one could easily incorporate the PEG-GOx or GA-modified PEG-GOx
during photopolymerization. Alternatively, an acid-terminated PEG-Hz could allow for
enzyme attachment to a pHEMA-co-AEMA hydrogel via carbodiimide chemistry
without the need for a protecting group. Lastly, the approach to prepare GA-modified
PEG-GOx could be altered to employ a detachable PEG chain that could prevent
aggregation during chemical modification, but allow for subsequent removal and return
of the enzyme to its native size. Standard approaches, which are currently utilized to
covalently bind native GOx to our current glucose-sensing hydrogels, could then be
employed. These various strategies are outlined below in Table 6-2.
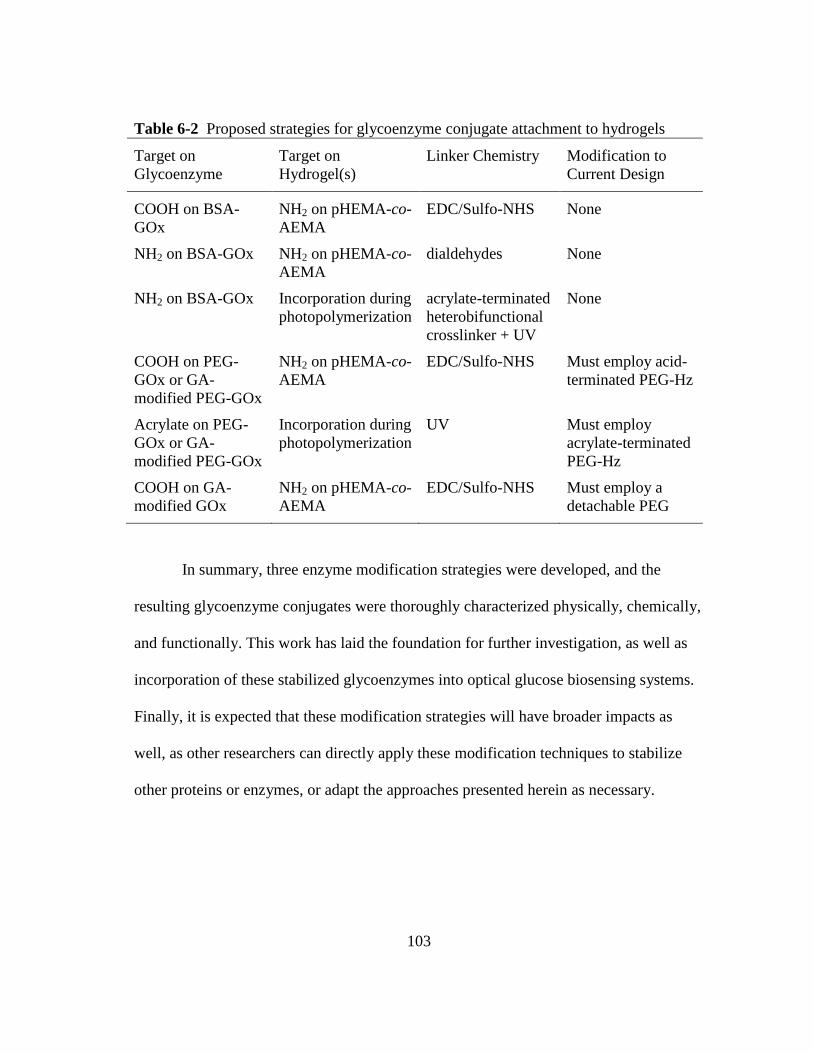
103
Table 6-2 Proposed strategies for glycoenzyme conjugate attachment to hydrogels
Target on
Glycoenzyme
Target on
Hydrogel(s)
Linker Chemistry Modification to
Current Design
COOH on BSA-
GOx
NH2 on pHEMA-co-
AEMA
EDC/Sulfo-NHS None
NH2 on BSA-GOx NH2 on pHEMA-co-
AEMA
dialdehydes None
NH2 on BSA-GOx Incorporation during
photopolymerization
acrylate-terminated
heterobifunctional
crosslinker + UV
None
COOH on PEG-
GOx or GA-
modified PEG-GOx
NH2 on pHEMA-co-
AEMA
EDC/Sulfo-NHS Must employ acid-
terminated PEG-Hz
Acrylate on PEG-
GOx or GA-
modified PEG-GOx
Incorporation during
photopolymerization
UV Must employ
acrylate-terminated
PEG-Hz
COOH on GA-
modified GOx
NH2 on pHEMA-co-
AEMA
EDC/Sulfo-NHS Must employ a
detachable PEG
In summary, three enzyme modification strategies were developed, and the
resulting glycoenzyme conjugates were thoroughly characterized physically, chemically,
and functionally. This work has laid the foundation for further investigation, as well as
incorporation of these stabilized glycoenzymes into optical glucose biosensing systems.
Finally, it is expected that these modification strategies will have broader impacts as
well, as other researchers can directly apply these modification techniques to stabilize
other proteins or enzymes, or adapt the approaches presented herein as necessary.
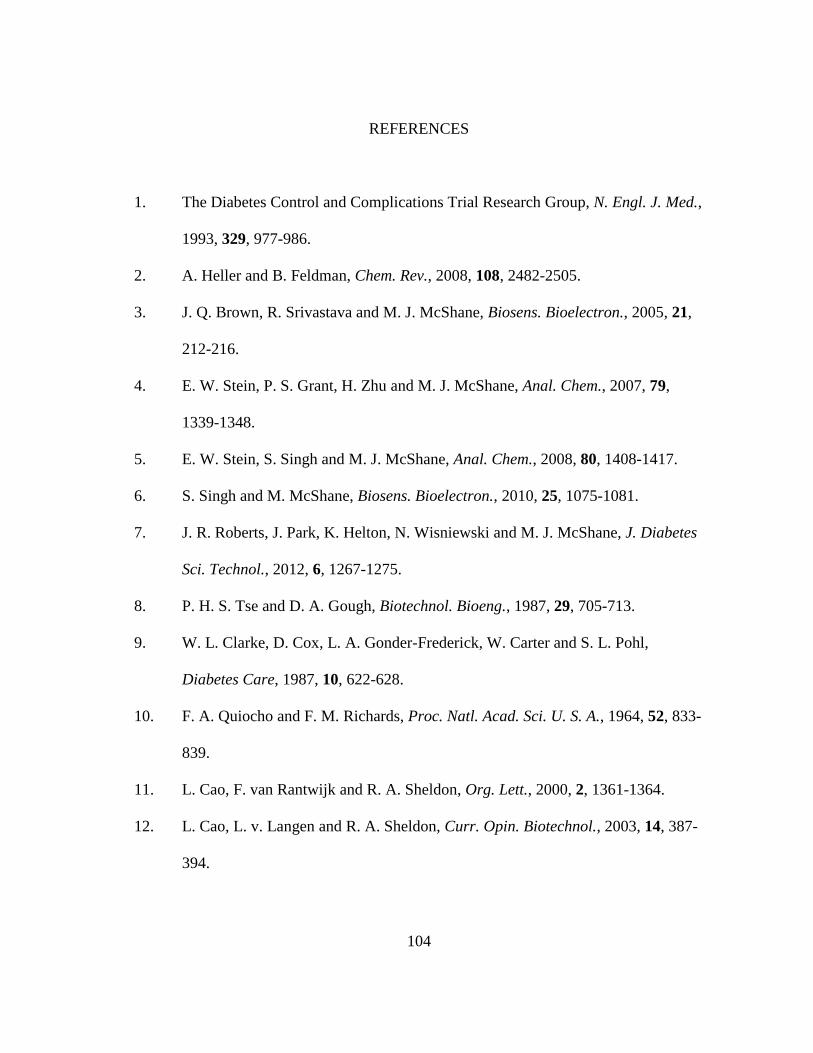
104
REFERENCES
1. The Diabetes Control and Complications Trial Research Group, N. Engl. J. Med.,
1993, 329, 977-986.
2. A. Heller and B. Feldman, Chem. Rev., 2008, 108, 2482-2505.
3. J. Q. Brown, R. Srivastava and M. J. McShane, Biosens. Bioelectron., 2005, 21,
212-216.
4. E. W. Stein, P. S. Grant, H. Zhu and M. J. McShane, Anal. Chem., 2007, 79,
1339-1348.
5. E. W. Stein, S. Singh and M. J. McShane, Anal. Chem., 2008, 80, 1408-1417.
6. S. Singh and M. McShane, Biosens. Bioelectron., 2010, 25, 1075-1081.
7. J. R. Roberts, J. Park, K. Helton, N. Wisniewski and M. J. McShane, J. Diabetes
Sci. Technol., 2012, 6, 1267-1275.
8. P. H. S. Tse and D. A. Gough, Biotechnol. Bioeng., 1987, 29, 705-713.
9. W. L. Clarke, D. Cox, L. A. Gonder-Frederick, W. Carter and S. L. Pohl,
Diabetes Care, 1987, 10, 622-628.
10. F. A. Quiocho and F. M. Richards, Proc. Natl. Acad. Sci. U. S. A., 1964, 52, 833-
839.
11. L. Cao, F. van Rantwijk and R. A. Sheldon, Org. Lett., 2000, 2, 1361-1364.
12. L. Cao, L. v. Langen and R. A. Sheldon, Curr. Opin. Biotechnol., 2003, 14, 387-
394.
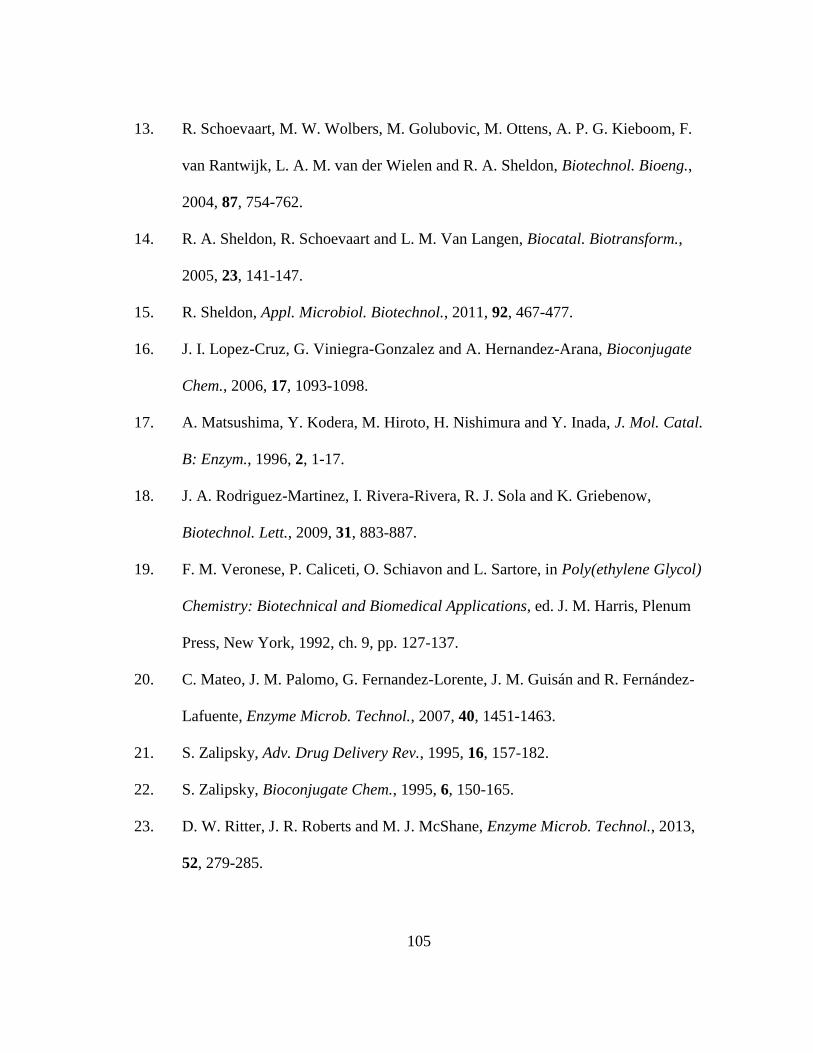
105
13. R. Schoevaart, M. W. Wolbers, M. Golubovic, M. Ottens, A. P. G. Kieboom, F.
van Rantwijk, L. A. M. van der Wielen and R. A. Sheldon, Biotechnol. Bioeng.,
2004, 87, 754-762.
14. R. A. Sheldon, R. Schoevaart and L. M. Van Langen, Biocatal. Biotransform.,
2005, 23, 141-147.
15. R. Sheldon, Appl. Microbiol. Biotechnol., 2011, 92, 467-477.
16. J. I. Lopez-Cruz, G. Viniegra-Gonzalez and A. Hernandez-Arana, Bioconjugate
Chem., 2006, 17, 1093-1098.
17. A. Matsushima, Y. Kodera, M. Hiroto, H. Nishimura and Y. Inada, J. Mol. Catal.
B: Enzym., 1996, 2, 1-17.
18. J. A. Rodriguez-Martinez, I. Rivera-Rivera, R. J. Sola and K. Griebenow,
Biotechnol. Lett., 2009, 31, 883-887.
19. F. M. Veronese, P. Caliceti, O. Schiavon and L. Sartore, in Poly(ethylene Glycol)
Chemistry: Biotechnical and Biomedical Applications, ed. J. M. Harris, Plenum
Press, New York, 1992, ch. 9, pp. 127-137.
20. C. Mateo, J. M. Palomo, G. Fernandez-Lorente, J. M. Guisán and R. Fernández-
Lafuente, Enzyme Microb. Technol., 2007, 40, 1451-1463.
21. S. Zalipsky, Adv. Drug Delivery Rev., 1995, 16, 157-182.
22. S. Zalipsky, Bioconjugate Chem., 1995, 6, 150-165.
23. D. W. Ritter, J. R. Roberts and M. J. McShane, Enzyme Microb. Technol., 2013,
52, 279-285.
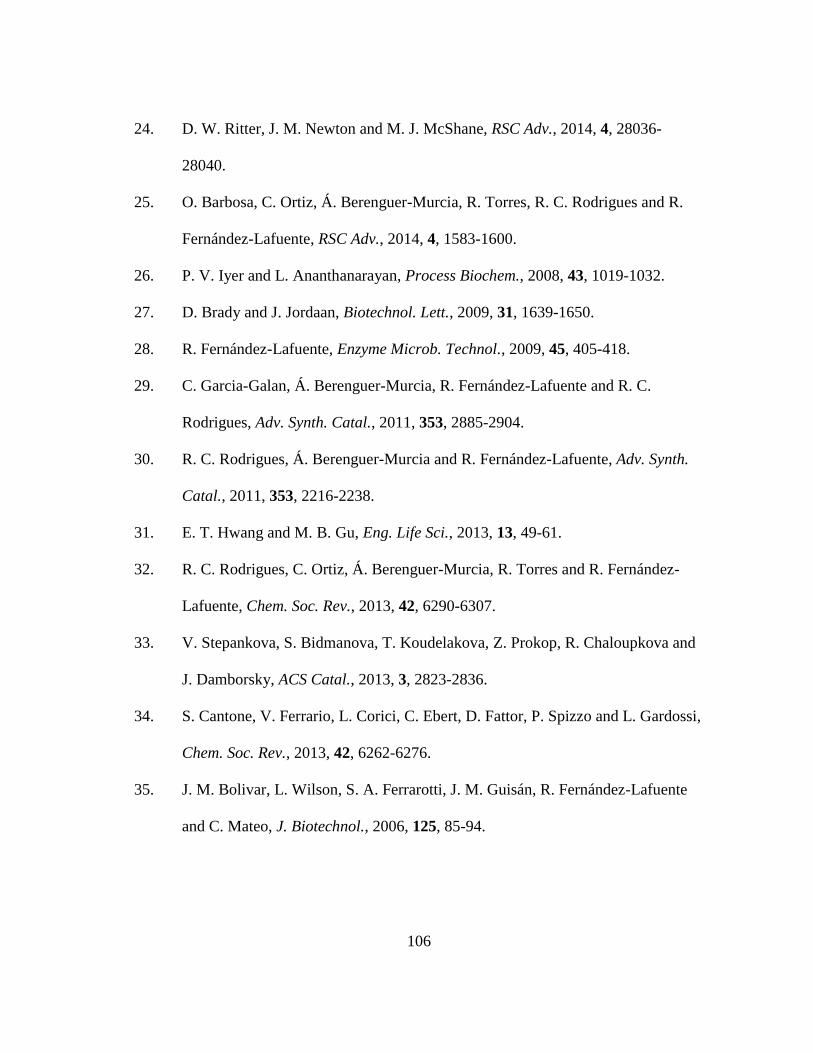
106
24. D. W. Ritter, J. M. Newton and M. J. McShane, RSC Adv., 2014, 4, 28036-
28040.
25. O. Barbosa, C. Ortiz, Á. Berenguer-Murcia, R. Torres, R. C. Rodrigues and R.
Fernández-Lafuente, RSC Adv., 2014, 4, 1583-1600.
26. P. V. Iyer and L. Ananthanarayan, Process Biochem., 2008, 43, 1019-1032.
27. D. Brady and J. Jordaan, Biotechnol. Lett., 2009, 31, 1639-1650.
28. R. Fernández-Lafuente, Enzyme Microb. Technol., 2009, 45, 405-418.
29. C. Garcia-Galan, Á. Berenguer-Murcia, R. Fernández-Lafuente and R. C.
Rodrigues, Adv. Synth. Catal., 2011, 353, 2885-2904.
30. R. C. Rodrigues, Á. Berenguer-Murcia and R. Fernández-Lafuente, Adv. Synth.
Catal., 2011, 353, 2216-2238.
31. E. T. Hwang and M. B. Gu, Eng. Life Sci., 2013, 13, 49-61.
32. R. C. Rodrigues, C. Ortiz, Á. Berenguer-Murcia, R. Torres and R. Fernández-
Lafuente, Chem. Soc. Rev., 2013, 42, 6290-6307.
33. V. Stepankova, S. Bidmanova, T. Koudelakova, Z. Prokop, R. Chaloupkova and
J. Damborsky, ACS Catal., 2013, 3, 2823-2836.
34. S. Cantone, V. Ferrario, L. Corici, C. Ebert, D. Fattor, P. Spizzo and L. Gardossi,
Chem. Soc. Rev., 2013, 42, 6262-6276.
35. J. M. Bolivar, L. Wilson, S. A. Ferrarotti, J. M. Guisán, R. Fernández-Lafuente
and C. Mateo, J. Biotechnol., 2006, 125, 85-94.
107
36. . C. C. Pessela, C. Mateo, M. Fuentes, A. ian, J. . Garc a, A. V. Carrascosa,
J. M. Guisán and R. Fernández-Lafuente, Enzyme Microb. Technol., 2003, 33,
199-205.
37. C. Mateo, R. Monti, B. C. C. Pessela, M. Fuentes, R. Torres, J. Manuel Guisán
and R. Fernández-Lafuente, Biotechnol. Progr., 2004, 20, 1259-1262.
38. C. Mateo, G. Fernández-Lorente, O. Abian, R. Fernández-Lafuente and J. M.
Guisán, Biomacromolecules, 2000, 1, 739-745.
39. C. Mateo, O. Abian, R. Fernandez–Lafuente and J. M. Guisan, Enzyme Microb.
Technol., 2000, 26, 509-515.
40. F. López-Gallego, L. Betancor, C. Mateo, A. Hidalgo, N. Alonso-Morales, G.
Dellamora-Ortiz, J. M. Guisán and R. Fernández-Lafuente, J. Biotechnol., 2005,
119, 70-75.
41. R. Axen, J. Porath and S. Ernback, Nature, 1967, 214, 1302-1304.
42. K. Sarιoğlu, N. Demir, J. Acar and M. Mutlu, J. Food Eng., 2001, 47, 271-274.
43. B. Solomon and Y. Levin, Biotechnol. Bioeng., 1974, 16, 1161-1177.
44. W. Tischer and K. Volker, Trends Biotechnol., 1999, 17, 326-335.
45. C. Mateo, A. Chmura, S. Rustler, F. van Rantwijk, A. Stolz and R. A. Sheldon,
Tetrahedron: Asymmetry, 2006, 17, 320-323.
46. S. Dalal, M. Kapoor and M. N. Gupta, J. Mol. Catal. B: Enzym., 2007, 44, 128-
132.
47. R. A. Sheldon, Adv. Synth. Catal., 2007, 349, 1289-1307.
48. J. M. González-Sáiz and C. Pizarro, Eur. Polym. J., 2001, 37, 435-444.
108
49. K. Won, S. Kim, K.-J. Kim, H. W. Park and S.-J. Moon, Process Biochem.,
2005, 40, 2149-2154.
50. N. Munjal and S. K. Sawhney, Enzyme Microb. Technol., 2002, 30, 613-619.
51. M. T. Reetz and K.-E. Jaeger, Chem. Phys. Lipids, 1998, 93, 3-14.
52. N. Bruns and J. C. Tiller, Nano Lett., 2004, 5, 45-48.
53. J. Lalonde and A. Margolin, in Enzyme Catalysis in Organic Synthesis, eds. K.
Drauz and H. Waldmann, Wiley-VCH, Germany, 2008, ch. 6, pp. 163-184.
54. S. Ohlson, P.-O. Larsson and K. Mosbach, Eur. J. Appl. Microbiol., 1979, 7,
103-110.
55. J. Vaija, Y.-Y. Linko and P. Linko, Appl. Biochem. Biotechnol., 1982, 7, 51-54.
56. J. M. Lee and J. Woodward, Biotechnol. Bioeng., 1983, 25, 2441-2451.
57. M. Koudelka-Hep, N. F. de Rooij and D. J. Strike, in Immobilization of Enzymes
and Cells, ed. G. F. Bickerstaff, Humana Press, New Jersey, 1997, DOI:
10.1385/0-89603-386-4:83, ch. 10, pp. 83-85.
58. S. M. Ryan, G. Mantovani, X. Wang, D. M. Haddleton and D. J. Brayden, Expert
Opin. Drug Delivery, 2008, 5, 371-383.
59. P. Bailon and C.-Y. Won, Expert Opin. Drug Delivery, 2009, 6, 1-16.
60. C. J. Fee and J. M. van Alstine, Bioconjugate Chem., 2004, 15, 1304-1313.
61. K. Hinds, J. J. Koh, . Joss, F. iu, M. audyš and S. W. Kim, Bioconjugate
Chem., 2000, 11, 195-201.
62. A. Basu, K. Yang, M. Wang, S. Liu, R. Chintala, T. Palm, H. Zhao, P. Peng, D.
Wu, Z. Zhang, J. Hua, M.-C. Hsieh, J. Zhou, G. Petti, X. Li, A. Janjua, M.
109
Mendez, J. Liu, C. Longley, Z. Zhang, M. Mehlig, V. Borowski, M. Viswanathan
and D. Filpula, Bioconjugate Chem., 2006, 17, 618-630.
63. C. Dhalluin, A. Ross, L.-A. Leuthold, S. Foser, B. Gsell, F. Müller and H. Senn,
Bioconjugate Chem., 2005, 16, 504-517.
64. A. Crueger and W. Crueger, in Microbial enzymes and biotechnology, eds. W.
M. Fogarty and C. T. Kelly, Elsevier Applied Science, London, 1990, ch. 5, pp.
177-226.
65. R. Wilson and A. P. F. Turner, Biosens. Bioelectron., 1992, 7, 165-185.
66. Q. H. Gibson, V. Massey and B. E. P. Swoboda, J. Biol. Chem., 1964, 239, 3927-
3934.
67. G. Wohlfahrt, S. Witt, J. Hendle, D. Schomburg, H. M. Kalisz and H.-J. Hecht,
Acta Crystallogr. D, 1999, 55, 969-977.
68. H. Tsuge, O. Natsuaki and K. Ohashi, J. Biochem., 1975, 78, 835-843.
69. J. H. Pazur, K. Kleppe and E. M. Ball, Arch. Biochem. Biophys., 1963, 103, 515-
516.
70. B. E. P. Swoboda and V. Massey, J. Biol. Chem., 1965, 240, 2209-2215.
71. H. J. Hecht, H. M. Kalisz, J. Hendle, R. D. Schmid and D. Schomburg, J. Mol.
Biol., 1993, 229, 153-172.
72. G. Zoldák, A. Zubrik, A. Musatov, M. Stupák and E. Sedlák, J. Biol. Chem.,
2004, 279, 47601-47609.
73. J. J. O'Malley and J. L. Weaver, Biochemistry, 1972, 11, 3527-3532.
74. H. Tsuge and H. Mitsuda, J. Biochem., 1974, 75, 399-406.
110
75. O. M. Lardinois, M. M. Mestdagh and P. G. Rouxhet, Biochim. Biophys. Acta,
Protein Struct. Mol. Enzymol., 1996, 1295, 222-238.
76. K. Kikuchi-Torii, S. Hayashi, H. Nakamoto and S. Nakamura, J. Biochem., 1982,
92, 1449-1456.
77. D. Scott and F. Hammer, Enzymologia, 1960, 22, 229-237.
78. L. S. Kumosa, T. L. Routh, J. T. Lin, J. Y. Lucisano and D. A. Gough,
Biomaterials, 2014, 35, 8287-8296.
79. A. Abuchowski, T. van Es, N. C. Palczuk and F. F. Davis, J. Biol. Chem., 1977,
252, 3578-3581.
80. S. Jevševar, M. Kunstelj and . G. Porekar, Biotechnol. J., 2010, 5, 113-128.
81. G. Pasut and F. M. Veronese, J. Controlled Release, 2012, 161, 461-472.
82. F. M. Veronese, Biomaterials, 2001, 22, 405-417.
83. C. J. Fee and J. M. van Alstine, Chem. Eng. Sci., 2006, 61, 924-939.
84. P. Bailon and W. Berthold, Pharm. Sci. Technol. Today, 1998, 1, 352-356.
85. S. Zalipsky and S. Menon-Rudolph, in Poly(ethylene glycol), eds. J. M. Harris
and S. Zalipsky, American Chemical Society, Washington, D.C., 1997, vol. 680,
ch. 21, pp. 318-341.
86. S. Nakamura, S. Hayashi and K. Koga, Biochim. Biophys. Acta, Enzymol., 1976,
445, 294-308.
87. B. Skoog, Vox Sang., 1979, 37, 345-349.
88. H. U. Bergmeyer, K. Gawehn and M. Grassl, Methods of enzymatic analysis,
Academic Press, New York, 2nd edn., 1974.
111
89. R. P. Hartshorne and W. A. Catterall, J. Biol. Chem., 1984, 259, 1667-1675.
90. C. J. Skerrow and A. G. Matoltsy, J. Cell Biol., 1974, 63, 524-530.
91. B. Unterweger, T. Stoisser, S. Leitgeb, R. Birner-Grünberger and B. Nidetzky,
Bioconjugate Chem., 2012, 23, 1406-1414.
92. Q. Chen, G. L. Kenausis and A. Heller, J. Am. Chem. Soc., 1998, 120, 4582-
4585.
93. G. Fortier and D. Belanger, Biotechnol. Bioeng., 1991, 37, 854-858.
94. M. D. Gouda, S. A. Singh, A. G. A. Rao, M. S. Thakur and N. G. Karanth, J.
Biol. Chem., 2003, 278, 24324-24333.
95. S. Krishnaswamy and J. R. Kittrell, Biotechnol. Bioeng., 1978, 20, 821-835.
96. S. J. Li, Y. Umena, K. Yorita, T. Matsuoka, A. Kita, K. Fukui and Y. Morimoto,
Biochem. Biophys. Res. Commun., 2007, 358, 1002-1007.
97. A. Slavica, I. Dib and B. Nidetzky, Biotechnol. Bioeng., 2007, 96, 9-17.
98. L. Pollegioni, S. Buto, W. Tischer, S. Ghisla and M. Pilone, Biochem. Mol. Biol.
Int., 1993, 31, 709-717.
99. K. B. Hadley and P. H. Sato, Enzyme, 1989, 42, 225-234.
100. S. L. Seymour and J. P. Klinman, Biochemistry, 2002, 41, 8747-8758.
101. S. J. Stocks, A. J. Jones, C. W. Ramey and D. E. Brooks, Anal. Biochem., 1986,
154, 232-234.
102. A. Haouz, J. M. Glandières and B. Alpert, FEBS Lett., 2001, 506, 216-220.
103. K. Hernandez, Á. Berenguer-Murcia, R. C. Rodrigues and R. Fernández-
Lafuente, Curr. Org. Chem., 2012, 16, 2652-2672.
112
104. L. Betancor, F. López-Gallego, A. Hidalgo, N. Alonso-Morales, G. Dellamora-
Ortiz, J. M. Guisán and R. Fernández-Lafuente, J. Biotechnol., 2006, 121, 284-
289.
105. W.-N. Ye and D. Combes, Biochim. Biophys. Acta, Protein Struct. Mol.
Enzymol., 1989, 999, 86-93.
106. R. Wetzel, M. Becker, J. Behlke, H. Billwitz, S. Böhm, B. Ebert, H. Hamann, J.
Krumbiegel and G. Lassmann, Eur. J. Biochem., 1980, 104, 469-478.
107. B. S. Chang and R. R. Mahoney, Biotechnol. Appl. Biochem., 1995, 22, 203-214.
108. I. Marini, R. Moschini, A. D. Corso and U. Mura, Cell. Mol. Life Sci., 2005, 62,
3092-3099.
109. T. E. Finn, A. C. Nunez, M. Sunde and S. B. Easterbrook-Smith, J. Biol. Chem.,
2012, 287, 21530-21540.
110. S. Myung, Y. H. P. Zhang and J. Sanchez Ruiz, PLoS ONE, 2013, 8, e61500.
111. P. G. Squire, P. Moser and C. T. O'Konski, Biochemistry, 1968, 7, 4261-4272.
112. S. B. Zimmerman and S. O. Trach, J. Mol. Biol., 1991, 222, 599-620.
113. H. Yoshikawa, A. Hirano, T. Arakawa and K. Shiraki, Int. J. Biol. Macromol.,
2012, 50, 1286-1291.