Embed Size (px)
Citation preview

white paper
ppdi.com | April 2013
Development and Qualification of Potency Assay Methods to Support
Early Phase Release and Stability Testing of a Biotherapeutic Product
Formulated with a Bioresorbable Carrier: A Case Study

Development anD Qualification of potency assay methoDs 2
EXECUTIVE SUMMARY
PPD’s cGMP cell-based assay laboratory was contracted to improve the
performance of a previously developed potency assay for a client’s
biological product. The two key issues were: (1) the assay was time
consuming; and (2) it was formatted using a limited assay range that
did not assess relative potency to the standard expected by regulatory
authorities. In addition, the biological product was formulated with a
bioresorbable carrier, and the required protein extraction processes were
slow and inefficient.
PPD optimized the assay, reducing test complexity and duration while
improving robustness and maintaining high-throughput testing. Extraction
of the active protein was also enhanced, and the format allowed for
parallel line analysis between standard and samples. This optimized
assay met pre-established qualification specifications for linearity, precision,
and specificity, and it has been used successfully to test the release and
stability of multiple product lots over an 18-month period.

Development anD Qualification of potency assay methoDs 3
complexity of the product’s activity; and what happens to the product after it is administered. These assays also are susceptible to typical assay development hurdles, including differences due to experimental material (animals or cells) and variability across instruments, lots of reagents, analysts, days, and laboratories.
This paper discusses the efforts of PPD’s cGMP cell-based assay laboratory to meet these challenges and create a robust and reproducible assay for a client’s biological product that improved the performance of the existing potency assay and conformed to regulatory expectations and current guidance.
PROJECT DESCRIPTION
The biological product, which was in early phase development, was a fairly uncomplicated recombinant human protein (rhuprotein) with three formulation strengths (DP-0.5, DP-1.0 and DP-2.0). The exist-ing potency assay measured the induction of alkaline phosphatase activity in responder cells. We were asked to address two issues: (1) the assay took nine days to perform (inclusive of cell culture), a long duration that can be a source of additional variation; and (2) it had a limited range that did not assess relative potency to the standard expected by regulatory authorities.
An additional − and ultimately more complicated − wrinkle came with the unusual product formulation. This rhuprotein was formulated with a bioresorbable carrier, and the protein had to be extracted from the carrier before the potency assay could proceed. The extraction process was inefficient, taking three days and recovering protein at concentrations too low to allow for the generation of a full sigmoidal dose/response curve (the limited range).
INTRODUCTION
Cell-based assays are bioassays designed to characterize the potency of biological drug substances and products. Biological products include cell-based therapies, genetic materials, proteins, peptides, and other biomolecules that occur in a variety of forms (either by themselves or as conjugates) and span a wide range of uniformity (from relatively homogeneous to widely heterologous mixtures).
Bioassays are one component of product and process characterization/validation and can be used to: select candidates; establish comparability; test process inter-mediates, formulations and stability/degradation; and support product changes. They are also a key part of establishing quality (ie, reproducibility and stability), which is critical to supporting the safety and efficacy profiles of biopharmaceuticals (USP 1032), and are necessary for regulatory submissions to support lot release (21CFR 600.2(s); 610.10; 610.1; 610 subpart B; ICHQ6B). A broad range of assay types can be used, including: ligand binding (multiple assay and signaling formats); cytotoxic assays (including apoptosis anti-body and complement-dependent cytotoxicity assays); cell migration/proliferation/inhibition and metabolic signaling assays; and, for molecular products, assays to establish transduction/transfection efficiency and potentiation/expression.
International regulatory bodies recognize that the varied nature of biological products causes significant challenges while developing assays. Potential issues are usually due to factors inherent to biologic products, including: variability of the starting materials; limited availability for testing; product instability; potential for multiple active ingredients; effects of synergy or interference within or between drug products; the

Development anD Qualification of potency assay methoDs 4
OPTIMIZING THE POTENCY ASSAY
The original assay method was: 1. Cells were thawed and cultured for 3 days individually (and for single use);2. 24-hour pre-incubation of the cells on the plates (to promote adherence);3. 3 days of incubating the protein in culture (to generate activity);4. After an overnight cell lysis, responses were generated by applying a freshly prepared signaling reagent;5. The quantifiable response range was limited to between 0.04 and 250 ng/mL.
The optimization process, which was fairly straightfor-ward, used standard evaluations of assay conditions, such as the need for pre-incubation time, the effect of cell numbers on the stimulation time and response range, and the required lysis time. A one-step commer-cial reagent was also tested to simplify signal generation.
Figure 1 shows the effect of incubation time on signal generation at a low seeding density (5000 cells/well). After 24 hours, the dose/response curve was nearly flat. After 48 hours, the classic sigmoidal shape had devel-oped, but 72 hours of incubation improved the range of responses and the goodness of fit of the four-parameter curves. Increasing the cell density to 7200 cells/well decreased the optimal incubation time to 48 hours (Figure 2), but we chose 5000 cells/well with a 72-hour incubation period because that combination yielded the most efficient throughput for the entire assay.
DEFINING POTENCY
Determination of the relative potency of a product
is made by comparing its biological response,
which is related to its mode of action, with a con-
trol preparation (USP, WHO, or in-house reference
standard). Assessment of relative potency most
often applies a determination of parallelism (ie,
the test and standard dose/response segments
are parallel), which is considered an indication
that the materials being compared have similar or
even identical activity (USP 1032).
The characteristic sigmoidal shape of a dose/
response curve is generated by fitting the data to
a four-parameter logistic model across a range of
drug concentrations. At low concentrations, there
isn’t enough drug to stimulate a measureable
biologic response, while at high concentrations,
either the cell receptors or signaling pathways
become saturated and no additional response
can be generated. In the middle, the dose/
response relationship becomes linear and, by
applying the appropriate curve-fitting algorithm,
the slope, half maximal effective concentration
(EC50), and correlation coefficient (goodness of
fit) can be calculated.
For a given model assay, the potency of two mol-
ecules can be compared by evaluating whether
or not the linear sections of the dose/response
curves are parallel.

Development anD Qualification of potency assay methoDs 5
Figure 1. Drug dose/response measured by alkaline phosphatase signal generation using 5000 cells/well and incubating for A) 24, B) 48, and C) 72 hours at 37oC, 5% CO2.
Note: There was insufficient precision and signal generation for the software to derive a curve from the response to the reference standard.

Development anD Qualification of potency assay methoDs 6
OPTIMIZING THE SAMPLE PREPARATION METHOD
The original method for recovering the biological drug substance from the bioresorbable carrier was dissolu-tion, which was performed by soaking and shaking the rhuprotein product in a large volume of cell culture medium containing 10% fetal bovine serum. This pro-cess was repeated four times during initial cell culture, and the recovered protein from each step was assayed individually and then totaled to determine the active protein recovered. This method resulted in recovery of 55-70% of the expected protein activity, but concen-trations were too dilute to provide sigmoidal dose/response curves.
Through the optimization process, the assay time was shortened by two days. As might be expected for a method using a 72-hour incubation, the 24-hour pre-incubation period could be eliminated, and 4-hour lysis step (instead of overnight) was shown to be adequate. In addition, the performance of the commercial signal-ing reagent was equivalent to a freshly prepared reagent. Ultimately, the method was shown to have sufficient robustness to allow for application of a 7-point con-centration curve (plating triplicate dilutions), permit-ting the evaluation of potency to be performed on 3 samples, relative to reference standards, on a single 96-well plate. Assay performance deteriorated after only a few passages, so the cells could not be used to test a single vial of drug substance over time.
Figure 2. Drug dose/response measured by alkaline phosphatase signal generation using 7200 cells/well and incubating for 48 hours at 37oC, 5% CO2.
Development anD Qualification of potency assay methoDs 7
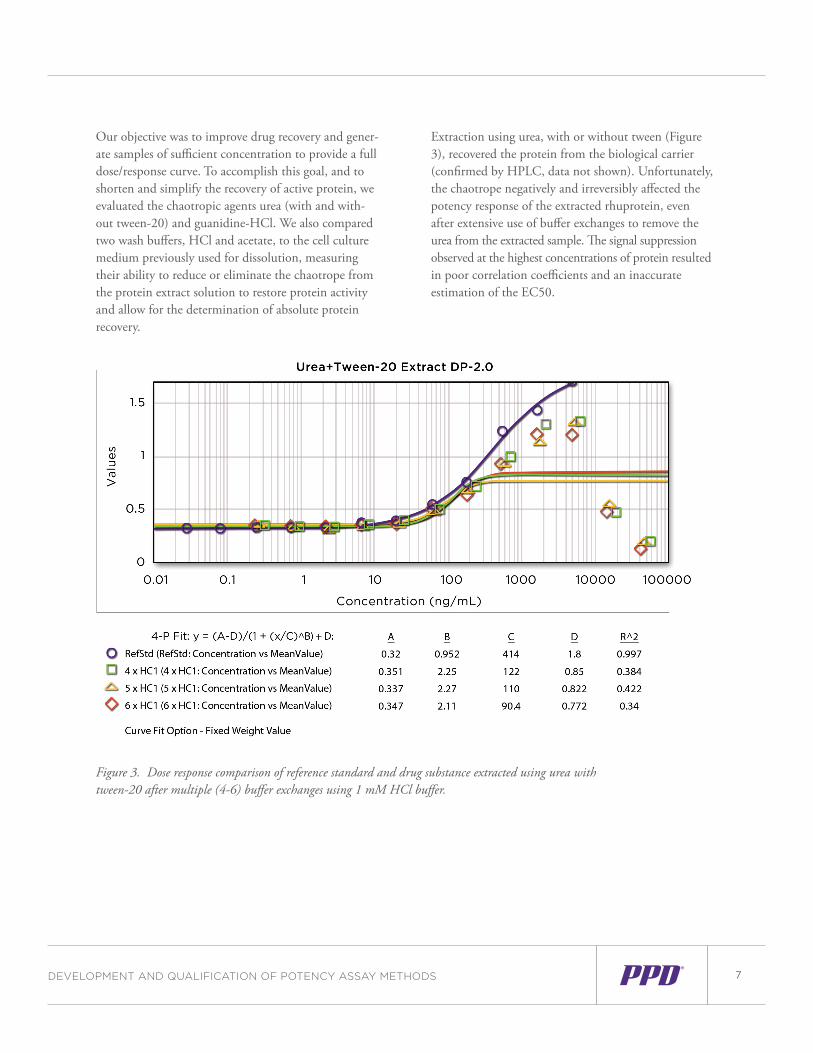
Our objective was to improve drug recovery and gener-ate samples of sufficient concentration to provide a full dose/response curve. To accomplish this goal, and to shorten and simplify the recovery of active protein, we evaluated the chaotropic agents urea (with and with-out tween-20) and guanidine-HCl. We also compared two wash buffers, HCl and acetate, to the cell culture medium previously used for dissolution, measuring their ability to reduce or eliminate the chaotrope from the protein extract solution to restore protein activity and allow for the determination of absolute protein recovery.
Extraction using urea, with or without tween (Figure 3), recovered the protein from the biological carrier (confirmed by HPLC, data not shown). Unfortunately, the chaotrope negatively and irreversibly affected the potency response of the extracted rhuprotein, even after extensive use of buffer exchanges to remove the urea from the extracted sample. The signal suppression observed at the highest concentrations of protein resulted in poor correlation coefficients and an inaccurate estimation of the EC50.
Figure 3. Dose response comparison of reference standard and drug substance extracted using urea with tween-20 after multiple (4-6) buffer exchanges using 1 mM HCl buffer.

Development anD Qualification of potency assay methoDs 8
Using guanidine-HCl instead of urea resulted in similar protein recovery (confirmed by HPLC, data not shown), and this chaotrope was effectively removed by a 1 or 10 mM HCl buffer as well as cell by culture medium (data not shown). Acetate buffer was not effective (data not shown). Eight buffer exchanges with either culture medium or 1 mM HCl appeared to completely restore protein activity relative to the stan-dard (data not shown). We chose to use HCl because it provided a response equal to culture medium while allowing for direct determination of protein concen-tration and, thus, for an estimate of the total protein recovery resulting from the extraction process.
Our final optimized sample preparation method used guanidine-HCl extraction followed by 8 HCl buffer exchanges (Figure 4) and was efficient in terms of time (the entire process could be completed in one day) and protein recovery (it yielded concentrations sufficient to generate a full dose/response curve). We assessed the reproducibility of the method by comparing recovered protein concentrations (measured by absorbance at a 280 nm wavelength) across triplicate extractions per-formed at three dosage levels by two analysts (Table 1). While the average total protein recovery of 86% (range 66-100%) was an improvement over the 55-70% recov-ery of the original method, extraction remained a significant source of variability.
Figure 4. Dose/response curve using the estimated concentrations of samples and standard prepared using guanidine-HCl extraction and 8 HCl buffer exchanges. DP-2.0 V1, DP-2.0 V2, and DP-2.0 V3 are different sample extractions.

Development anD Qualification of potency assay methoDs 9
Even with 8 buffer exchanges, signal suppression occa-sionally could be observed as an activity hook at the highest sample concentrations (Figure 5). We hypoth-esize that this issue was caused by incomplete removal of guanidine-HCl and the resulting negative effect on the response. Limitations in the assay development timeline made it impossible to investigate alternative extraction methods to eliminate this hook effect. We instead focused on finding a concentration range that generated adequate data to support parallelism between the standard and samples but did not include higher values where the hook was observable. Our final assay had a linear range of 0.4 to 10 ug/mL and could gener-ate a full sigmoidal dose/response curve with only 7 sample concentrations, maintaining the high through-put expected by the client.
Figure 5. Observed potency response interference in high-concentration extracted samples and mock-extracted standard after 8 buffer exchanges.
Table 1. Recovered protein concentrations determined by measuring absorbance (280 nM) on three independently guanidine-HCl-extracted, HCl-buffer-exchanged samples performed across drug dosages and analysts.
aNaLYSt SaMpLe/StaNDarDprOteiN reCOVerY
DP-1.0 V1 99 99 1.3
DP-1.0 V2 97
DP-1.0 V3 100
1
DP-2.0 V1 86 82 17.3
DP-2.0 V2 93
DP-2.0 V3 66
DP-2.0 V1 88 85 11.3
DP-2.0-V2 93
DP-2.0 V3 74
2
DP-0.5 V1 90 87 3.3
DP-0.5 V2 84
DP-0.5 V3 87
Average Across Concentrations 86 12.6and Analysts
(%) aVeraGe % CV
DP-0.5, DP-1.0 and DP-2.0 are different formulation strengths.
Development anD Qualification of potency assay methoDs 10
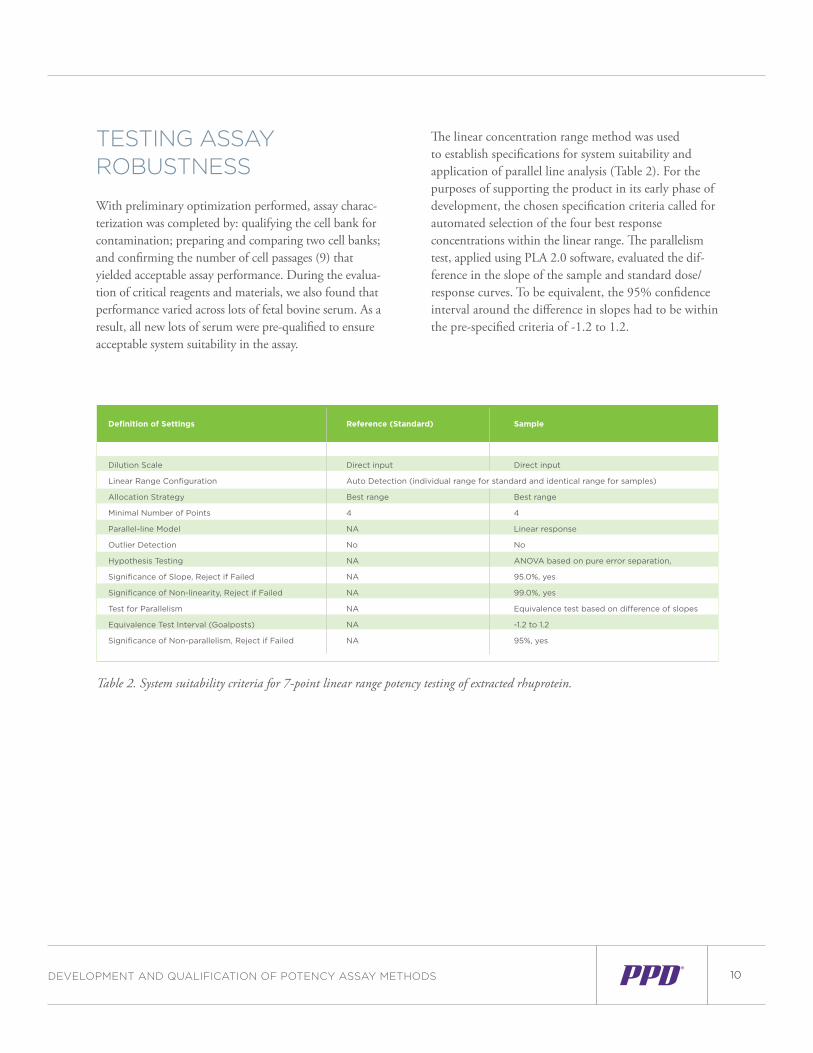
The linear concentration range method was used to establish specifications for system suitability and application of parallel line analysis (Table 2). For the purposes of supporting the product in its early phase of development, the chosen specification criteria called for automated selection of the four best response concentrations within the linear range. The parallelism test, applied using PLA 2.0 software, evaluated the dif-ference in the slope of the sample and standard dose/response curves. To be equivalent, the 95% confidence interval around the difference in slopes had to be within the pre-specified criteria of -1.2 to 1.2.
TESTING ASSAY ROBUSTNESS
With preliminary optimization performed, assay charac-terization was completed by: qualifying the cell bank for contamination; preparing and comparing two cell banks; and confirming the number of cell passages (9) that yielded acceptable assay performance. During the evalua-tion of critical reagents and materials, we also found that performance varied across lots of fetal bovine serum. As a result, all new lots of serum were pre-qualified to ensure acceptable system suitability in the assay.
Table 2. System suitability criteria for 7-point linear range potency testing of extracted rhuprotein.
Definition of Settings reference (Standard) Sample
Dilution Scale Direct input Direct input
Linear Range Configuration Auto Detection (individual range for standard and identical range for samples)
Allocation Strategy Best range Best range
Minimal Number of Points 4 4
Parallel-line Model NA Linear response
Outlier Detection No No
Hypothesis Testing NA ANOVA based on pure error separation,
Significance of Slope, Reject if Failed NA 95.0%, yes
Significance of Non-linearity, Reject if Failed NA 99.0%, yes
Test for Parallelism NA Equivalence test based on difference of slopes
Equivalence Test Interval (Goalposts) NA -1.2 to 1.2
Significance of Non-parallelism, Reject if Failed NA 95%, yes

Development anD Qualification of potency assay methoDs 11
the consistency of the response across dilutions of the extracted product was suitable for the method’s application to early phase release and stability testing.
The potency of extracted samples was affected by the compounded variability of the extraction process and the potency assay. With two analysts evaluating six preparations of each of three formulation strengths, the mean relative potency compared with mock-extracted standard ranged from 0.56 to 1.13 (Table 3). There was a trend towards lower recovered activity with increased drug concentration, and there appeared to be differences in precision and overall recovery between analysts. How-ever, the performance reproducibility and intermediate precision were within the pre-established limit (<40% CV) for qualification and were sufficient to support early phase testing requirements.
QUALIFICATION OF THE CELL-BASED POTENCY ASSAY
Given the early development phase of the product, we performed a limited qualification of the extraction and potency assays that included demonstration of specific-ity, accuracy, linearity and intermediate precision. The accuracy of sample potency relative to mock-extracted standard was tested across a 75-125% range of the nominal method concentration. The results showed a consistent 30% negative bias trend (double that observed from the total protein extracted), which was likely caused by the effect of residual guanidine-HCl on the activity of the protein in the bioassay. However, method linearity was demonstrated (Figure 6), so
Figure 6. Linearity of extracted sample responses in the rhuprotein potency assay.

Development anD Qualification of potency assay methoDs 12
Table 3. Intermediate precision determined across analysts using different instruments, cell culture and solution preparations.
aNaLYSt preparatiONMeaN reLatiVe pOteNCY
DP-0.5
(250 μg/vial)
DP-2.0
(1000 μg/vial)
DP-1.0
(500 μg/vial)
1 1 1.13 0.76 0.72
2 0.98 0.83 0.82
3 0.56 0.97 0.79
4 0.85 0.75 0.84
5 1.02 0.83 0.62
6 1.06 0.60 0.99
Mean 0.93 0.79 0.80 % CV 22 15 16
2 1 0.79 0.72 0.51
2 1.20 1.00 0.65
3 0.66 1.10 0.98
4 0.45 0.84 0.82
5 0.85 0.72 0.46
6 1.02 0.58 0.46
Mean 0.83 0.83 0.65 % CV 32 23 33
Total Mean 0.88 0.81 0.72 % CV 26 19 26
SUMMARY
In this case study, we described the methodology used to optimize and qualify a previously-developed cell-based potency assay for a biological product. During optimization, we successfully improved assay robustness (allowing for relatively high-throughput sample testing) and reduced assay complexity (shortening the assay duration by two days). Performance reproducibility was affected by variation between lots of fetal bovine serum, and this issue was managed by lot pre-qualification. We also improved extraction of the active protein from its bioresorbable carrier, but interference thought to result from residual guanidine-HCl at high drug concentrations prevented generation of a full sigmoidal dose/response curve. However, we were able to devise an assay format that allowed for parallel line analysis between standard and samples.
The results of method qualification confirmed the linearity and specificity of the assay and showed a reproducible negative bias trend for accuracy relative to mock-extracted standard. The observed imprecision of the extracted samples was affected by analyst and was more pronounced at higher drug concentrations, but the final results were within acceptable pre-specified limits for an early phase product. To date, this method has been used to success-fully test the release and stability of multiple product lots across an 18-month testing period.
In the future, the performance of this assay may be improved by increasing assay sensitivity to allow the testing of more dilute samples and/or increasing the number of buffer exchanges to further reduce or elimi-nate guanidine-HCl from the extracted samples. Either or both of these approaches are expected to restore the use of full potency dose/response curves, which will improve parallel line analysis for later-stage product development.

Development anD Qualification of potency assay methoDs 13
Authors:Maggie BachXiaoyan Gao, Ph.D.Manuela Grassi, Ph.D.Chris Lively, Ph.D.Robert Nerenz, Ph.D.Peter Wunderli, Ph.D.Yunhong Zao, Ph.D.
cGMP cell-based assay laboratoryMiddleton, Wisconsin

© 2013 Pharmaceutical Product Development, LLC. All rights reserved.
For more information, please visit us at www.ppdi.com or call us at +1 877 643 8773.