Embed Size (px)
Citation preview
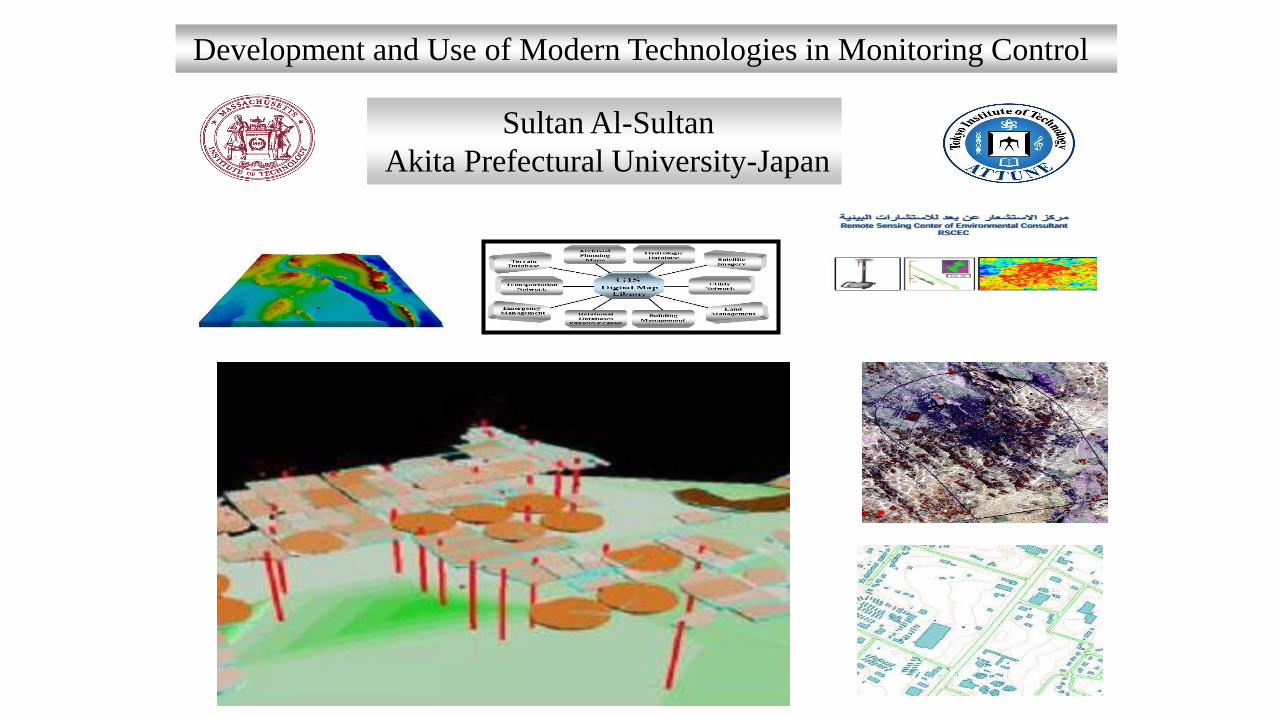
Development and Use of Modern Technologies in Monitoring Control
Sultan Al-Sultan
Akita Prefectural University-Japan
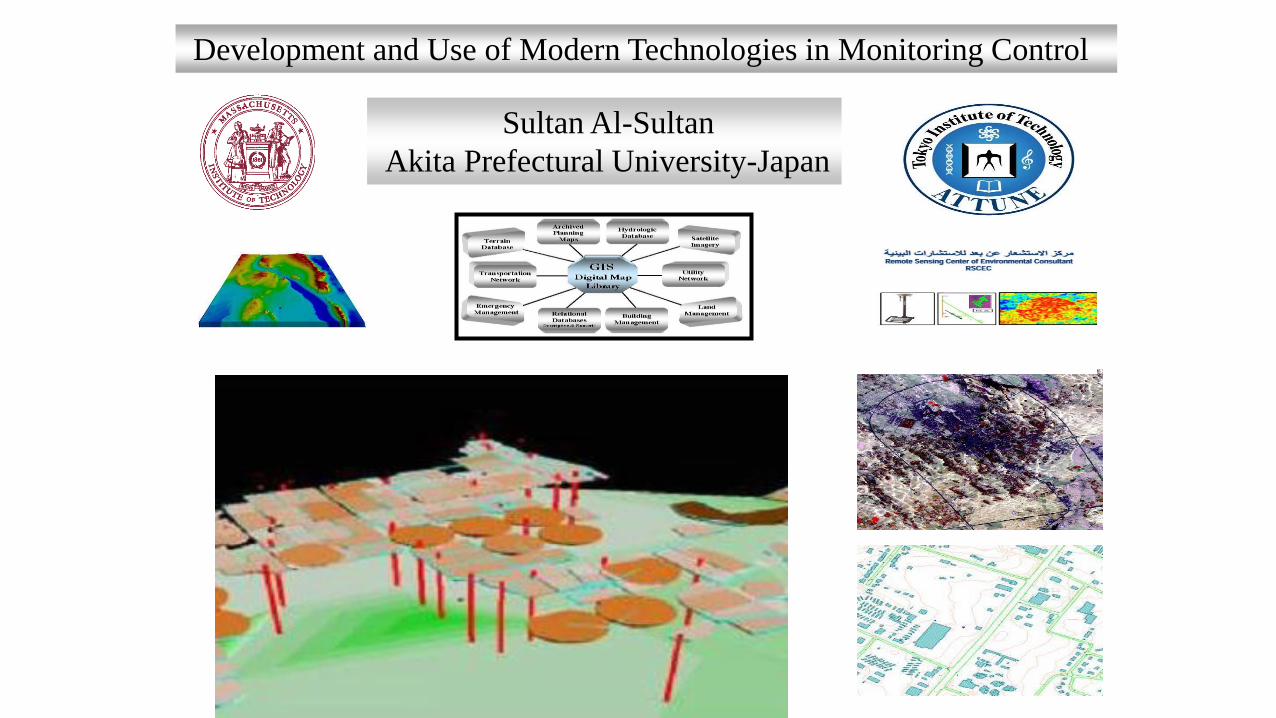
Outline
• Part I - Seninsing• Introduction and History• Stations and data• Users and uses• Data gaps
• Part II – Spatial • Data collection and processing• Spatial estimation• Hr/Daily maps
• Part III – Challenges and future plans
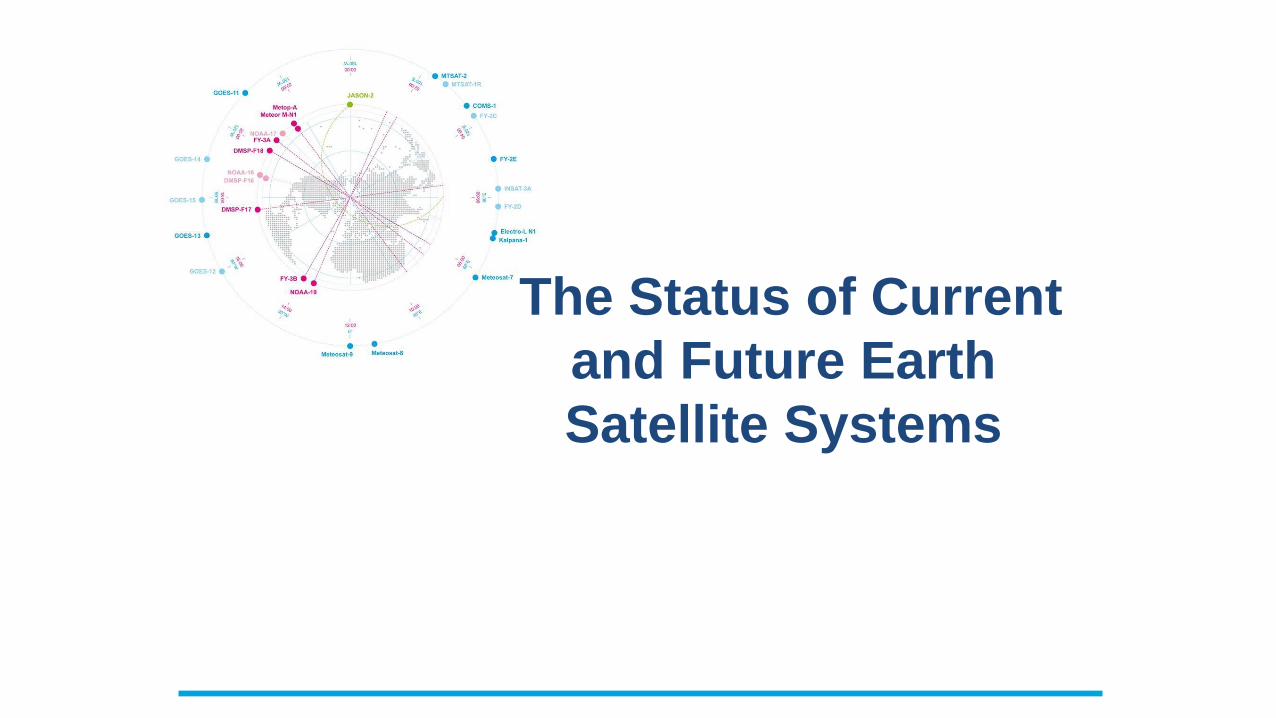
Coordination Group for Meteorological Satellites - CGMS
The Status of Current
and Future Earth
Satellite Systems
Landsat
9
PAC
E*
NISA
RSWO
TTEMPO
GRACE-FO (2)
CYGNSS (8)
ICESat-2
NISTAR*,EPIC*(DSCOVR /
NOAA)
QuikSC
ATLandsat7(USGS)Terr
a
Aqu
a
CloudS
at CALIPS
OAur
a
SMA
P
SuomiNPP(NOAA)
Landsat8(USGS)
GP
M
OCO-
2
OSTM/Jason 2(NOAA)
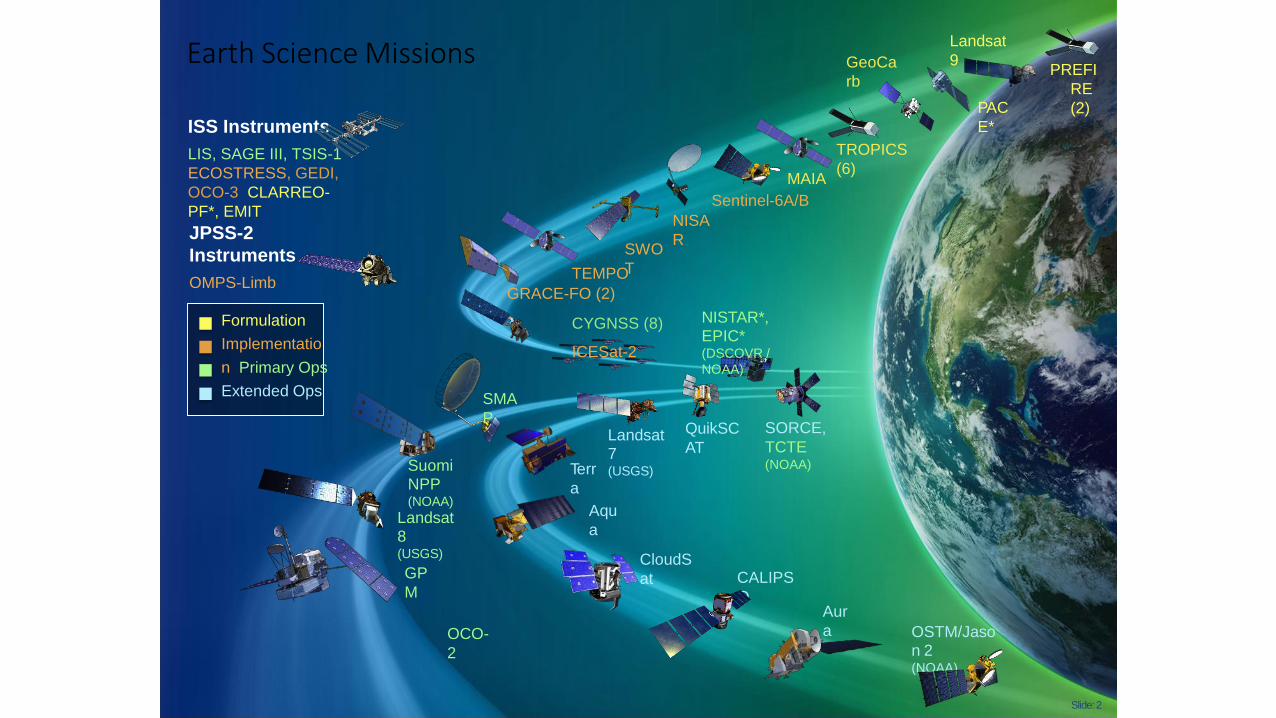
Formulation
Implementatio
n Primary Ops
Extended Ops
ISS Instruments
LIS, SAGE III, TSIS-1
ECOSTRESS, GEDI,
OCO-3 CLARREO-
PF*, EMIT
JPSS-2
Instruments
OMPS-Limb
Earth Science Missions
MAIA
Sentinel-6A/B
GeoCa
rb
TROPICS
(6)
SORCE,
TCTE(NOAA)
PREFI
RE
(2)
Slide:2
NASA, CGMS-46, 7 June2018
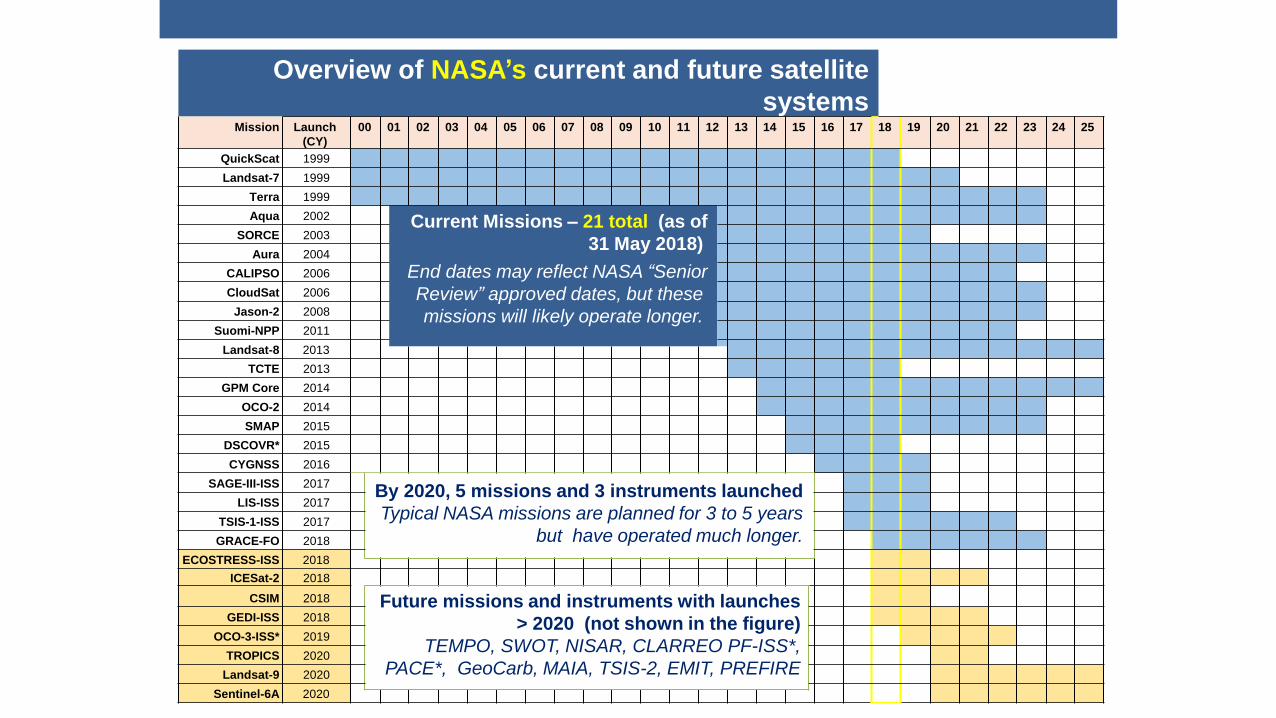
Overview of NASA’s current and future satellite
systemsMission Launch
(CY)
00 01 02 03 04 05 06 07 08 09 10 11 12 13 14 15 16 17 18 19 20 21 22 23 24 25
QuickScat 1999
Landsat-7 1999
Terra 1999
Aqua 2002 Current Missions – 21 total (as of
31 May 2018)
End dates may reflect NASA “Senior
Review” approved dates, but these
missions will likely operate longer.
SORCE 2003
Aura 2004
CALIPSO 2006
CloudSat 2006
Jason-2 2008
Suomi-NPP 2011
Landsat-8 2013
TCTE 2013
GPM Core 2014
OCO-2 2014
SMAP 2015
DSCOVR* 2015
CYGNSS 2016
SAGE-III-ISS 2017By 2020, 5 missions and 3 instruments launched
Typical NASA missions are planned for 3 to 5 years
but have operated much longer.
LIS-ISS 2017
TSIS-1-ISS 2017
GRACE-FO 2018
ECOSTRESS-ISS 2018
ICESat-2 2018
CSIM 2018 Future missions and instruments with launches
> 2020 (not shown in the figure)
TEMPO, SWOT, NISAR, CLARREO PF-ISS*,
PACE*, GeoCarb, MAIA, TSIS-2, EMIT, PREFIRE
GEDI-ISS 2018
OCO-3-ISS* 2019
TROPICS 2020
Landsat-9 2020
Sentinel-6A 2020
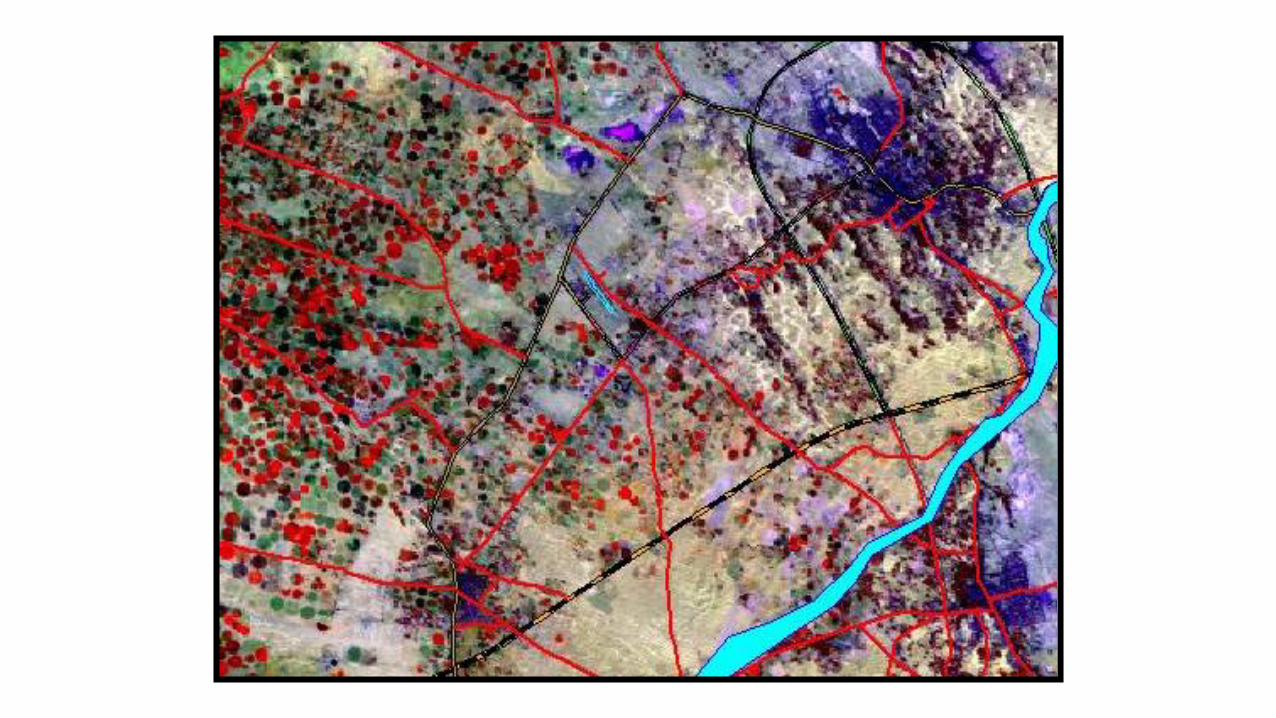
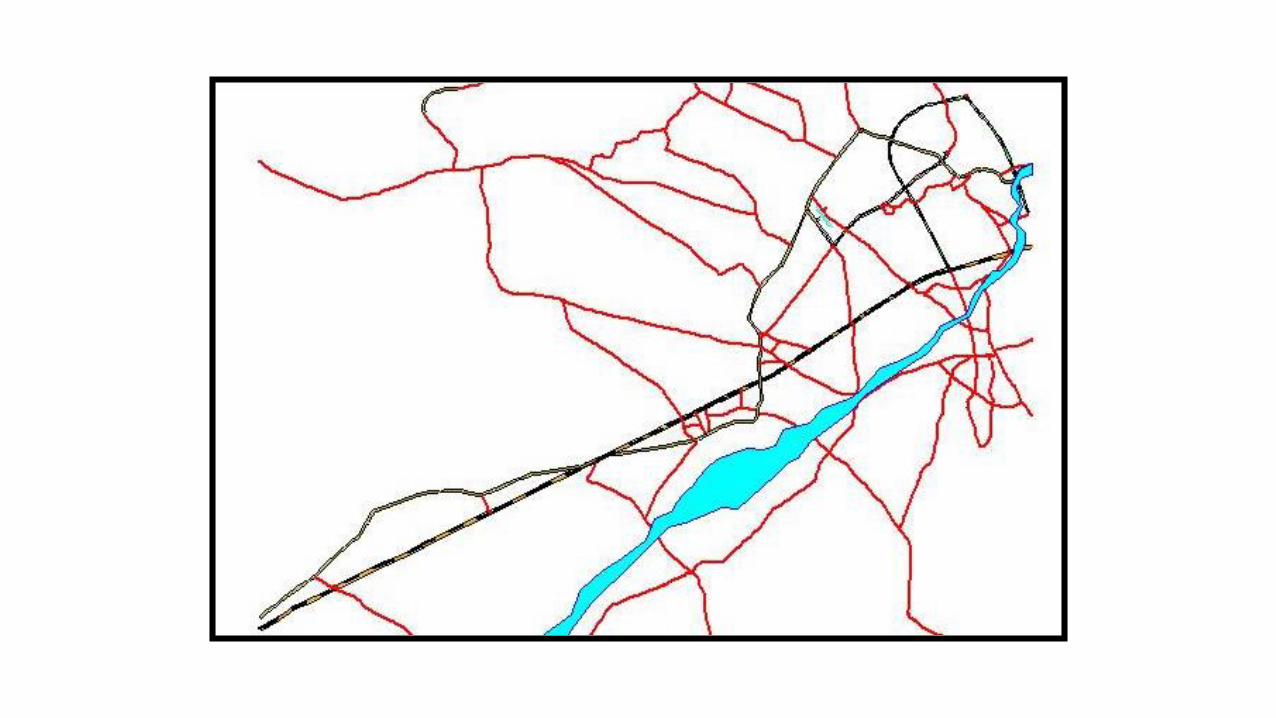
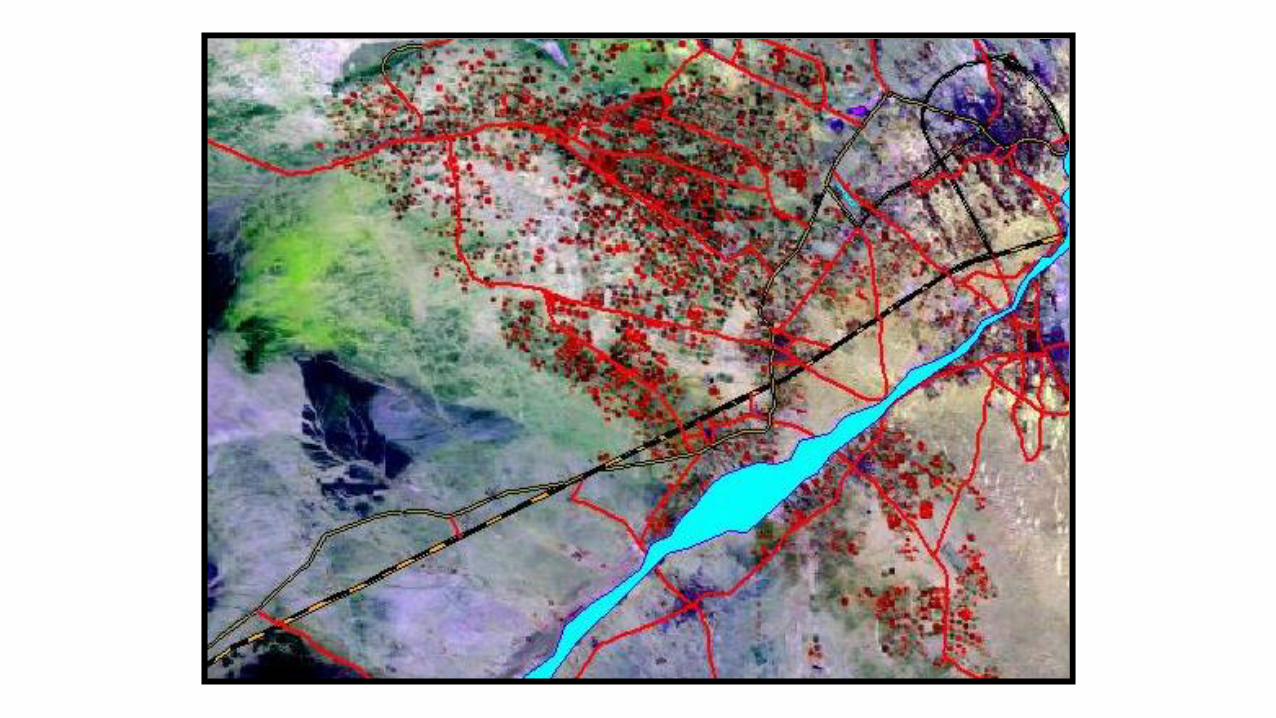
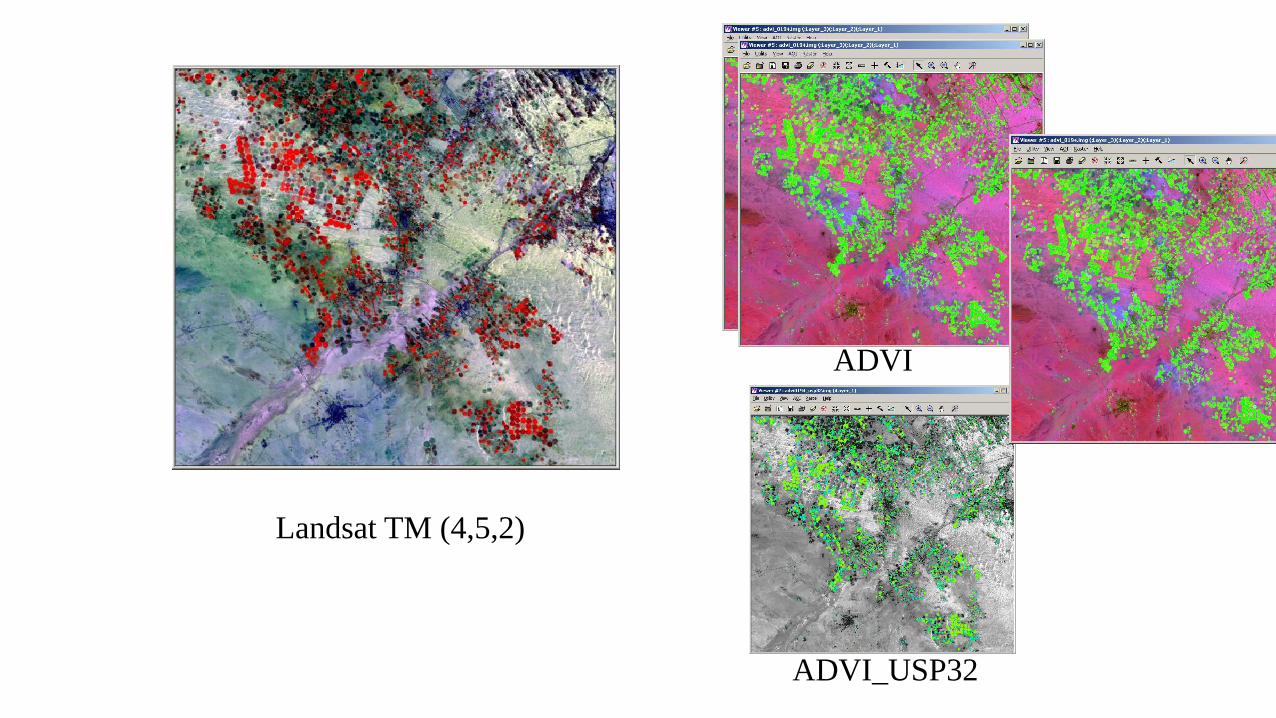
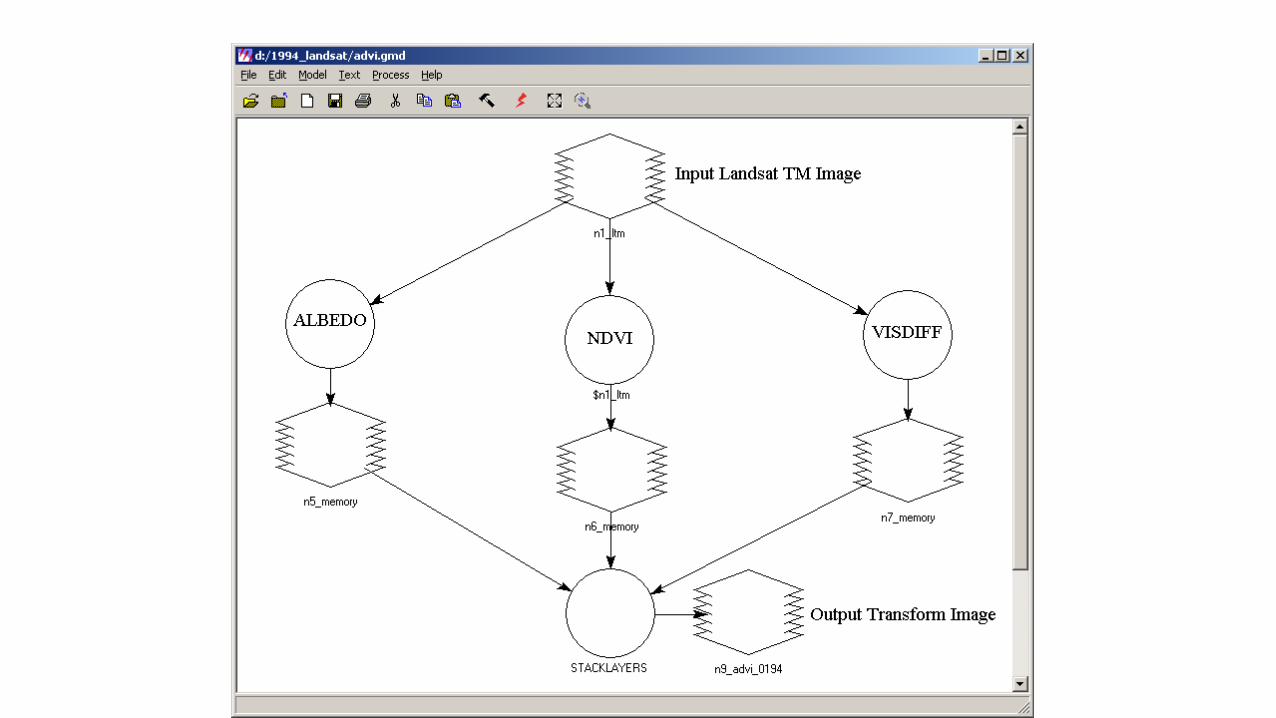
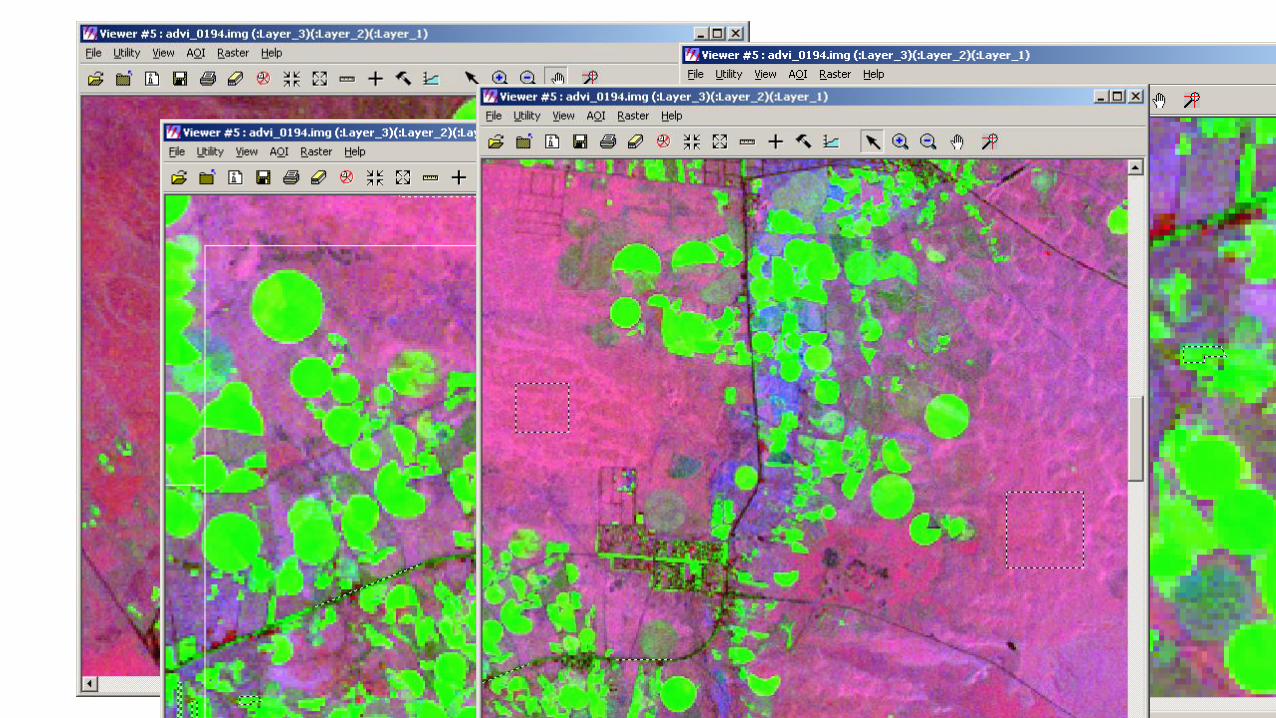
Landsat TM (4,5,2)
ADVI
ADVI_USP32
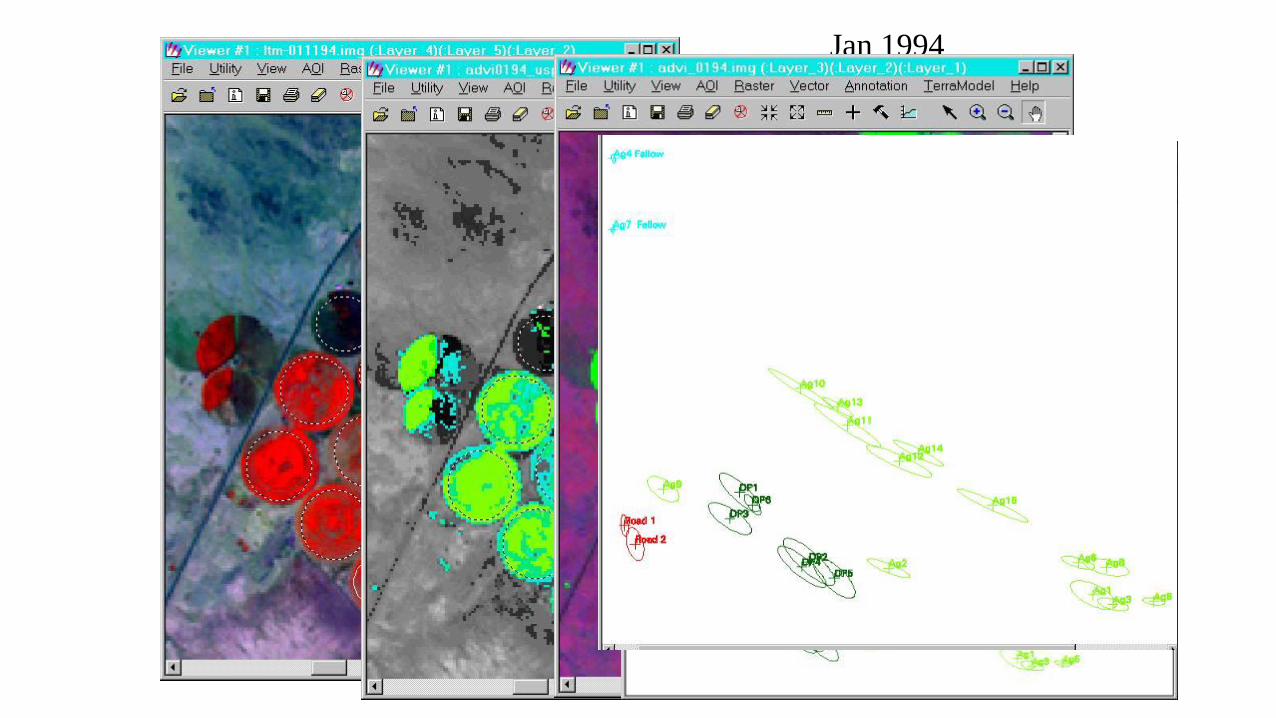
Jan 1994
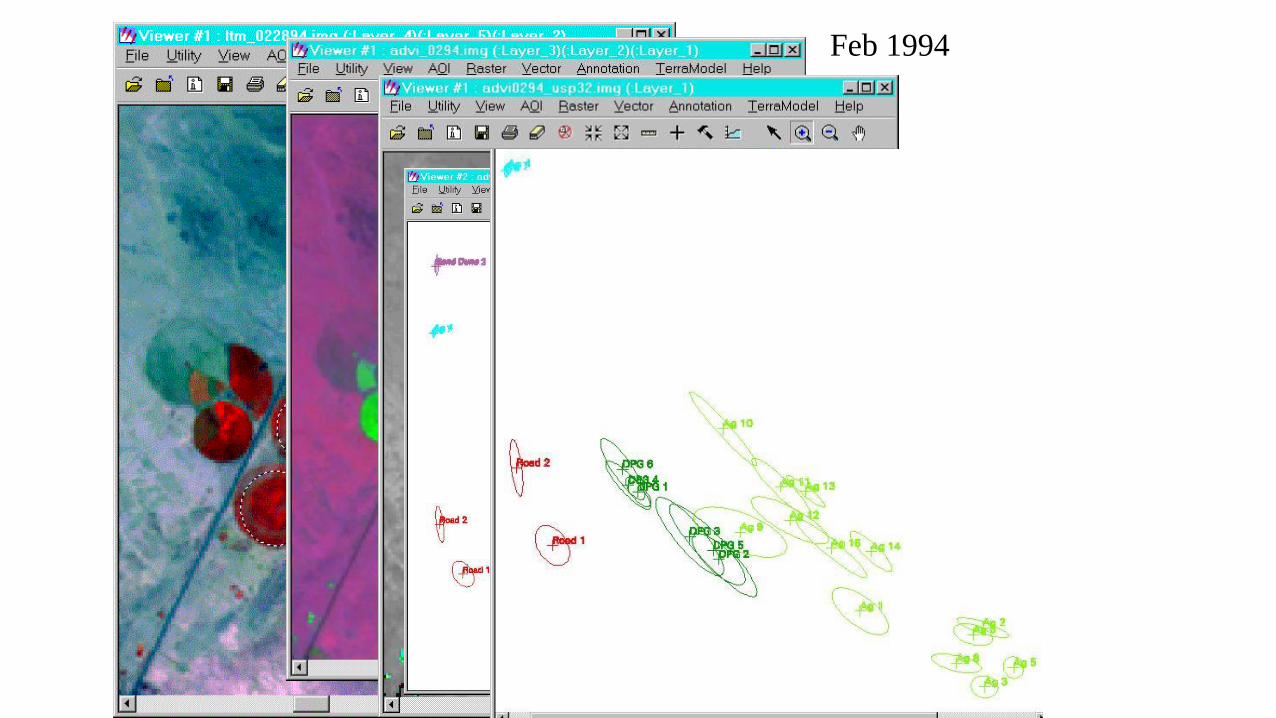
Feb 1994
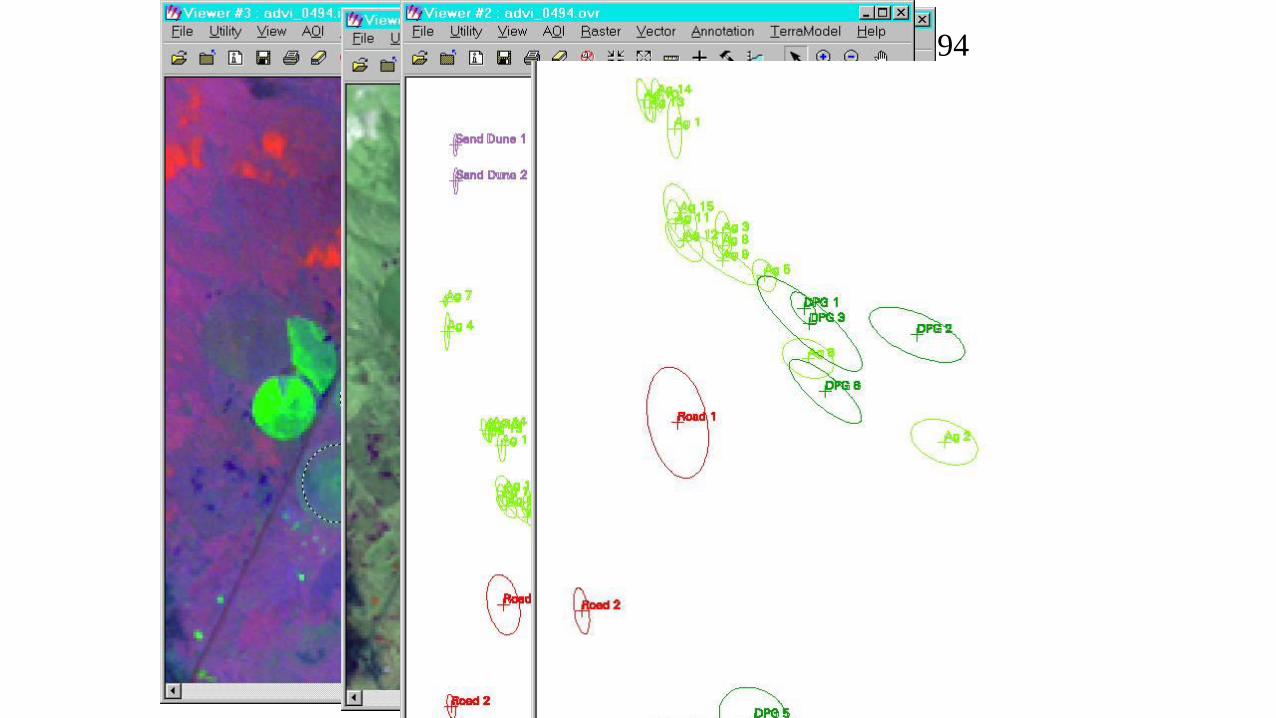
April 1994
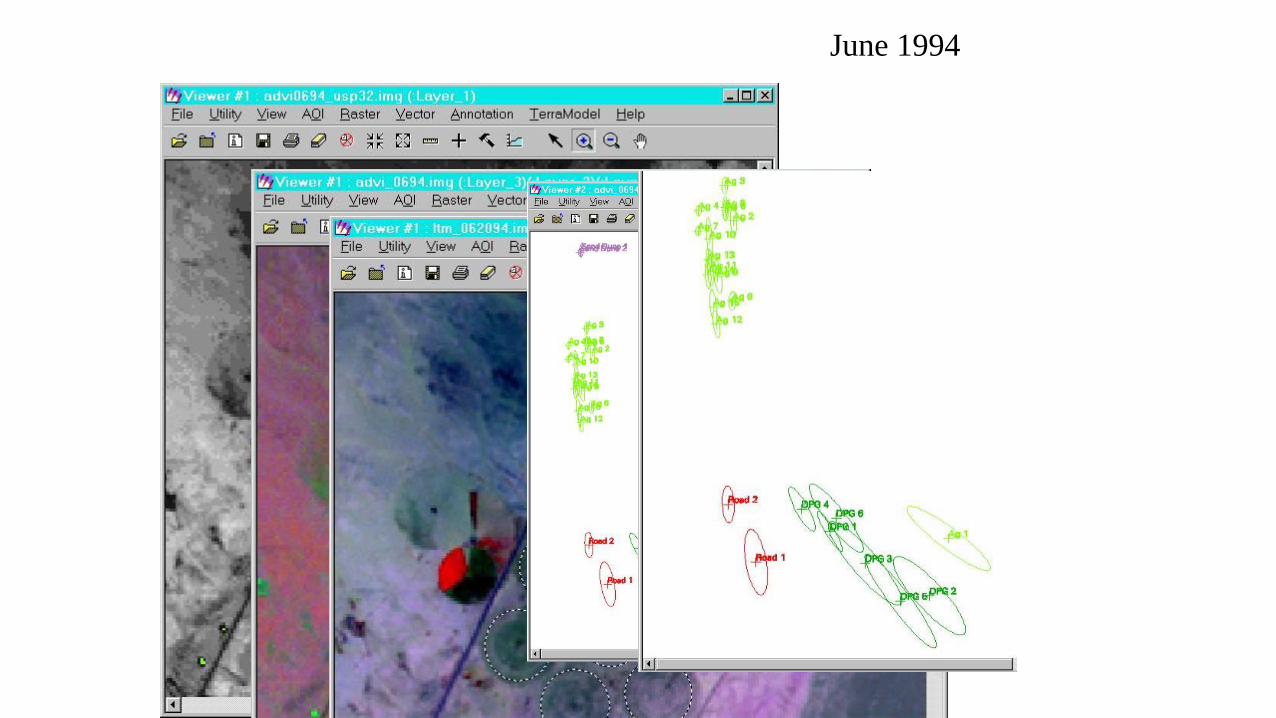
June 1994
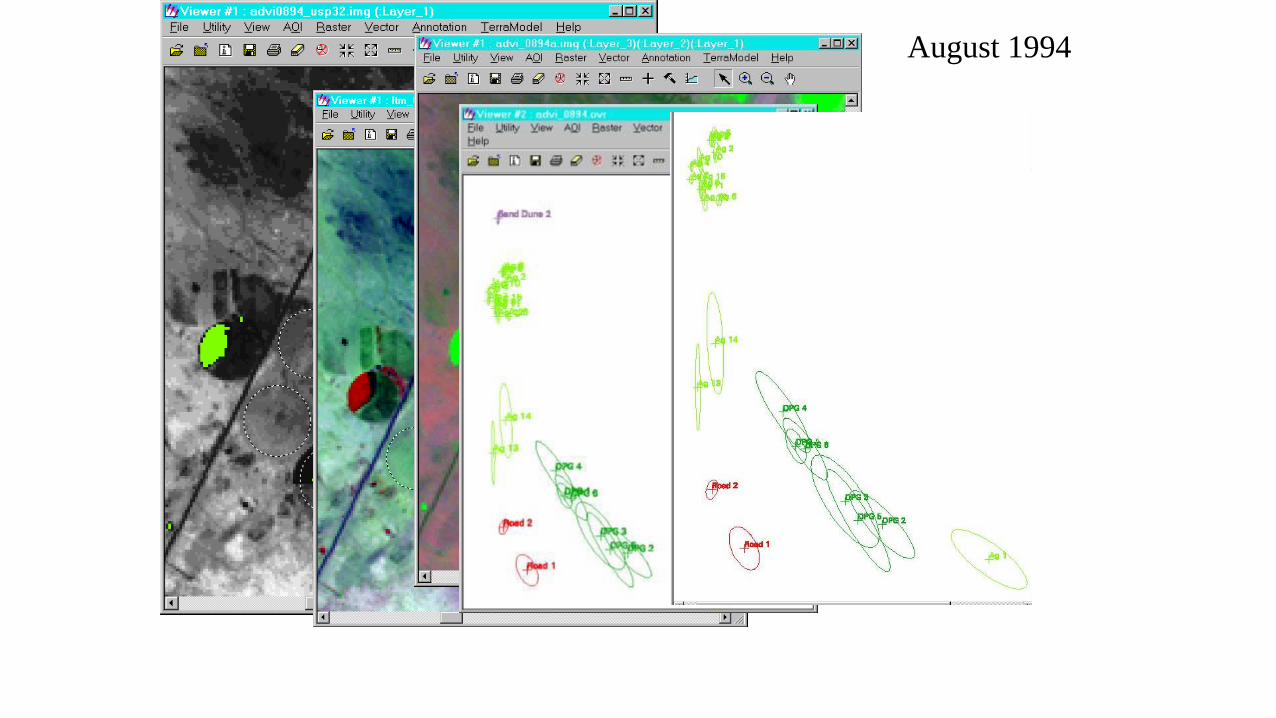
August 1994
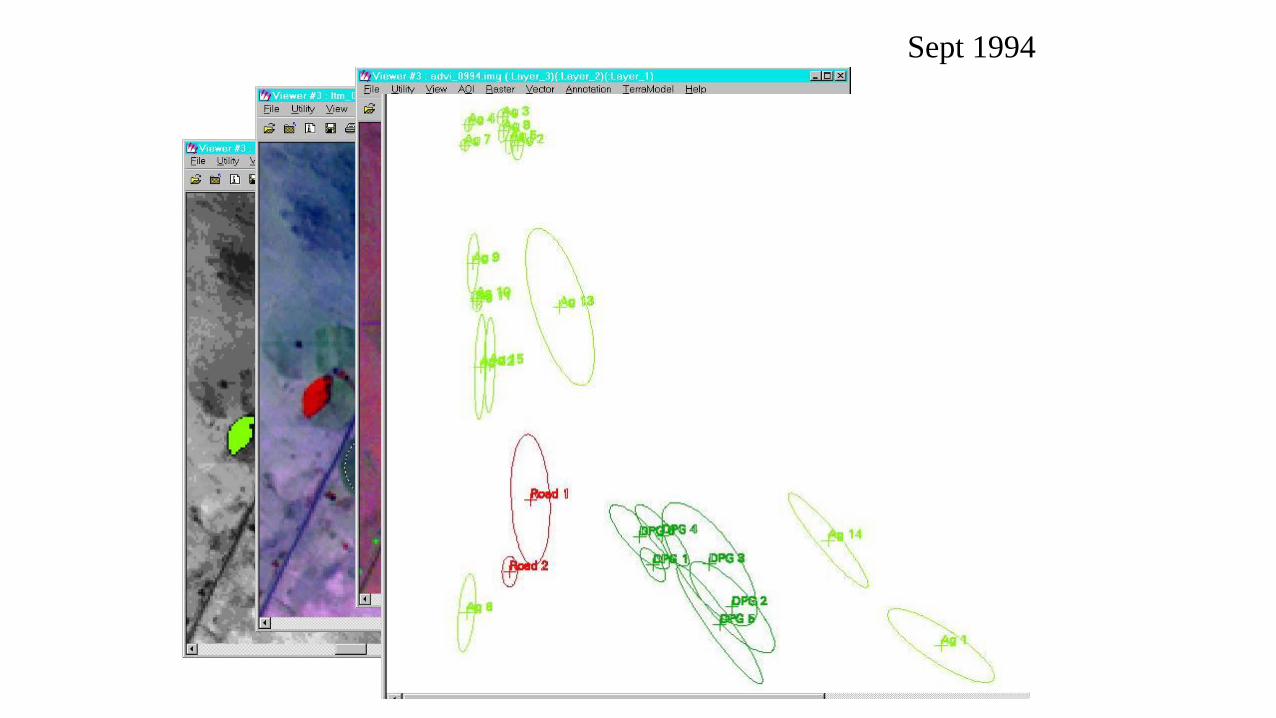
Sept 1994
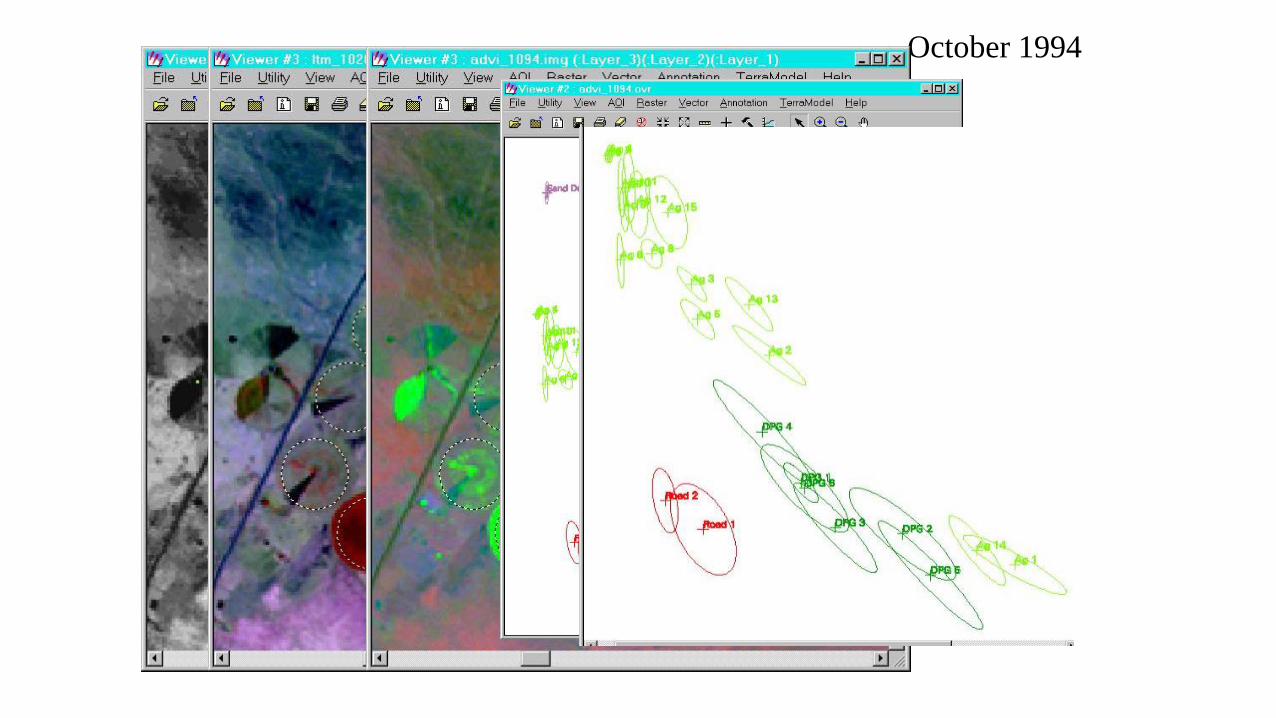
October 1994
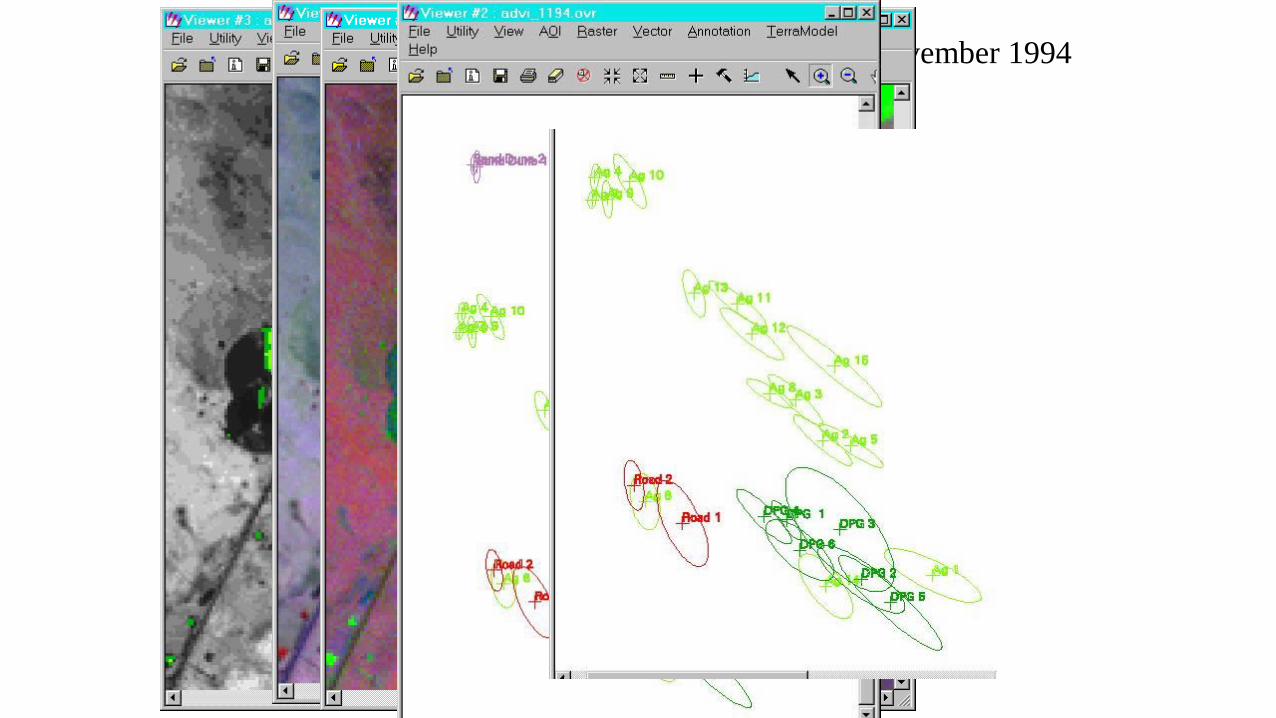
November 1994
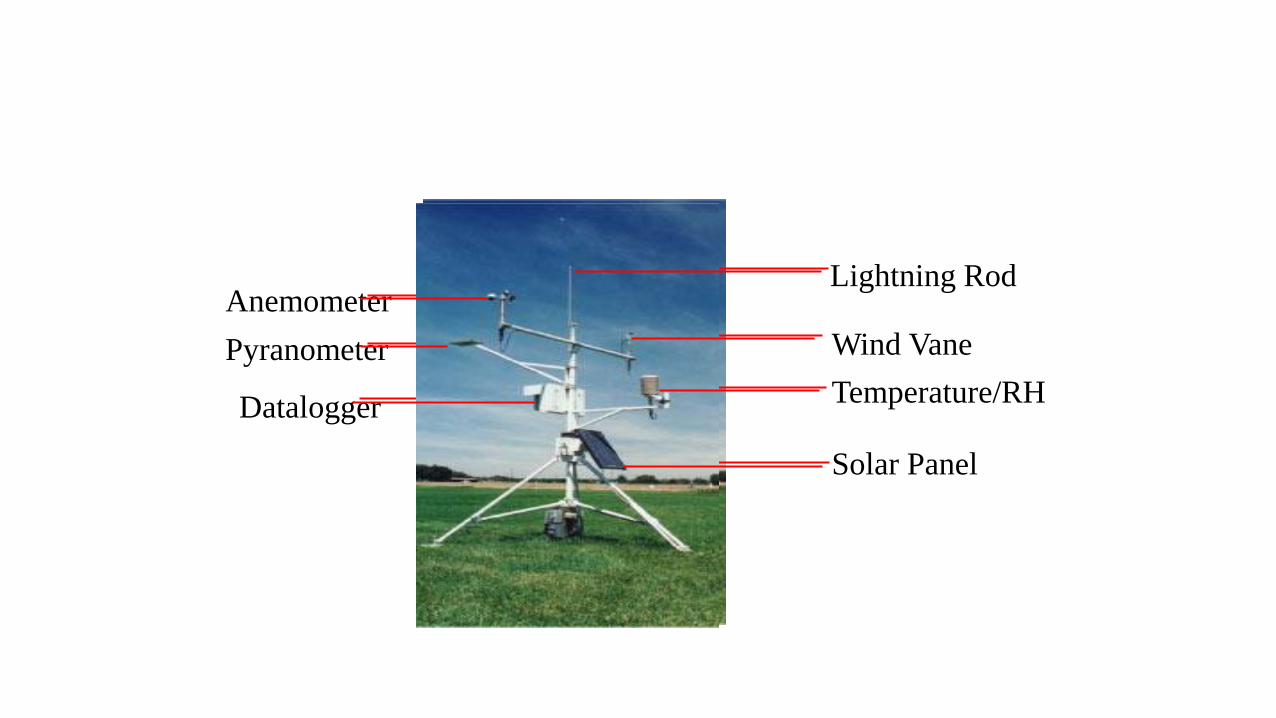
Lightning Rod
Wind Vane
Temperature/RH
Solar Panel
Datalogger
Pyranometer
Anemometer
Network of fully automated weather stations that collect weather data and provide weather data and estimates of reference evapotranspiration (ETo) to users.
Archived data is available
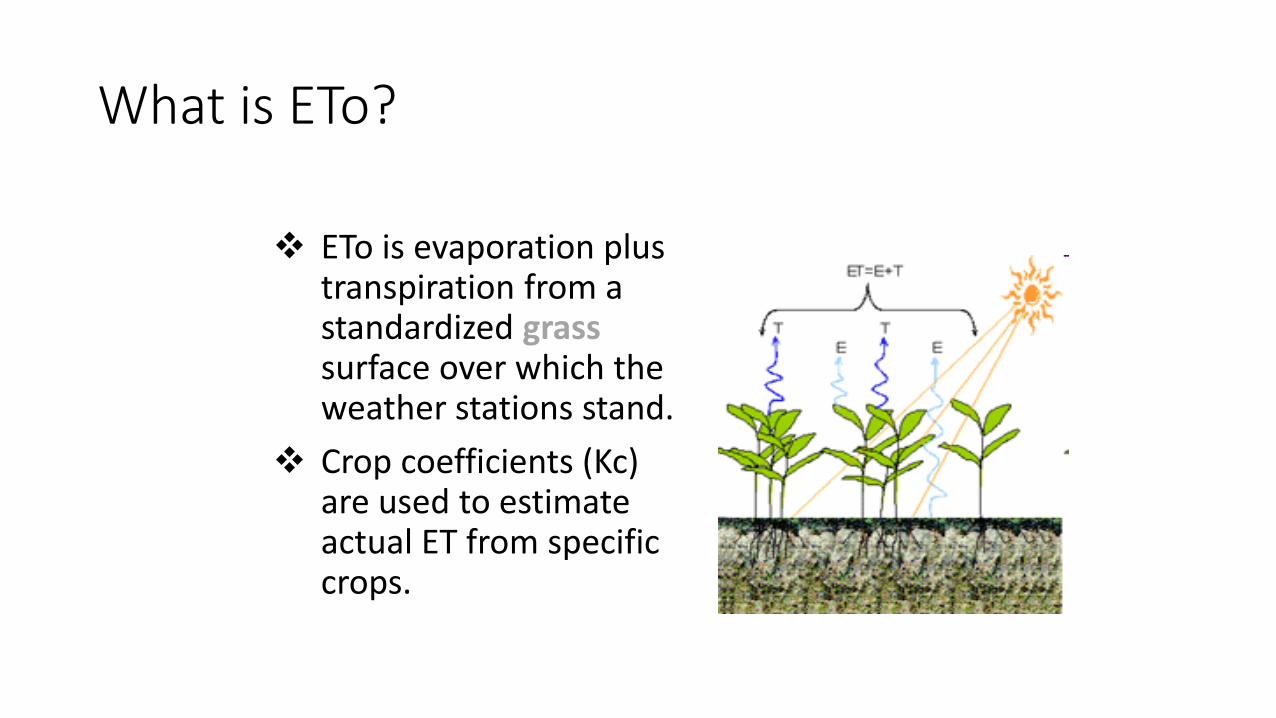
What is ETo?
ETo is evaporation plus transpiration from a standardized grasssurface over which the weather stations stand.
Crop coefficients (Kc) are used to estimate actual ET from specific crops.
Who owns stations?
Some stations are owned by Gov.
Others are owned by cooperators, such as:Local water agencies
Universities
Cities
Conservation Districts (CD)
Private industries
WQS Data
The following weather data are measured at the WQS stations:Air temperature (Ta)
Relative humidity (RH)
Solar radiation (Rs)
Wind speed (U2)
Wind direction
Precipitation (P)
Soil temperature (Ts)
WQS Data (cont.)
Dataloggers poll the sensors every minute. Sixty minute-by-minute readings are
averaged/totaled. Daily maximum, minimum, average, and total values
are calculated by the end of each day. Hourly and daily values are stored in the
dataloggers. CIMIS servers call stations every hour and retrieve
data in CSV format. Data goes through QC and ETo is calculated. Hourly ETo is aggregated to produce daily ETo.
Who Uses WQS Data?
Growers
Consultants
Water agencies
Public agencies
Home owners
Researchers
Firefighters
Schools
Investigators
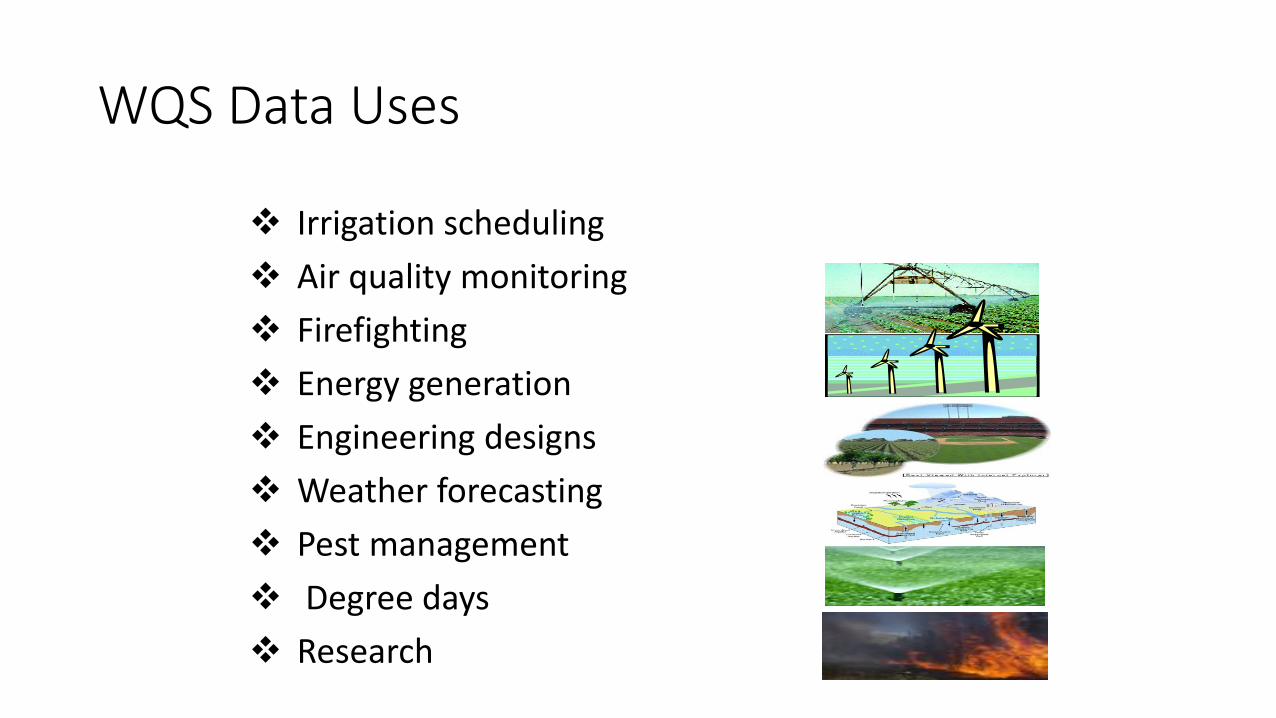
WQS Data Uses
Irrigation scheduling
Air quality monitoring
Firefighting
Energy generation
Engineering designs
Weather forecasting
Pest management
Degree days
Research
Benefits of Using WQS Data
The following are some of the benefits of using WQS data:Save water and energy
Mitigate the impacts of drought and climate change
Improve the environment
Produce high quality yield and better looking land scape
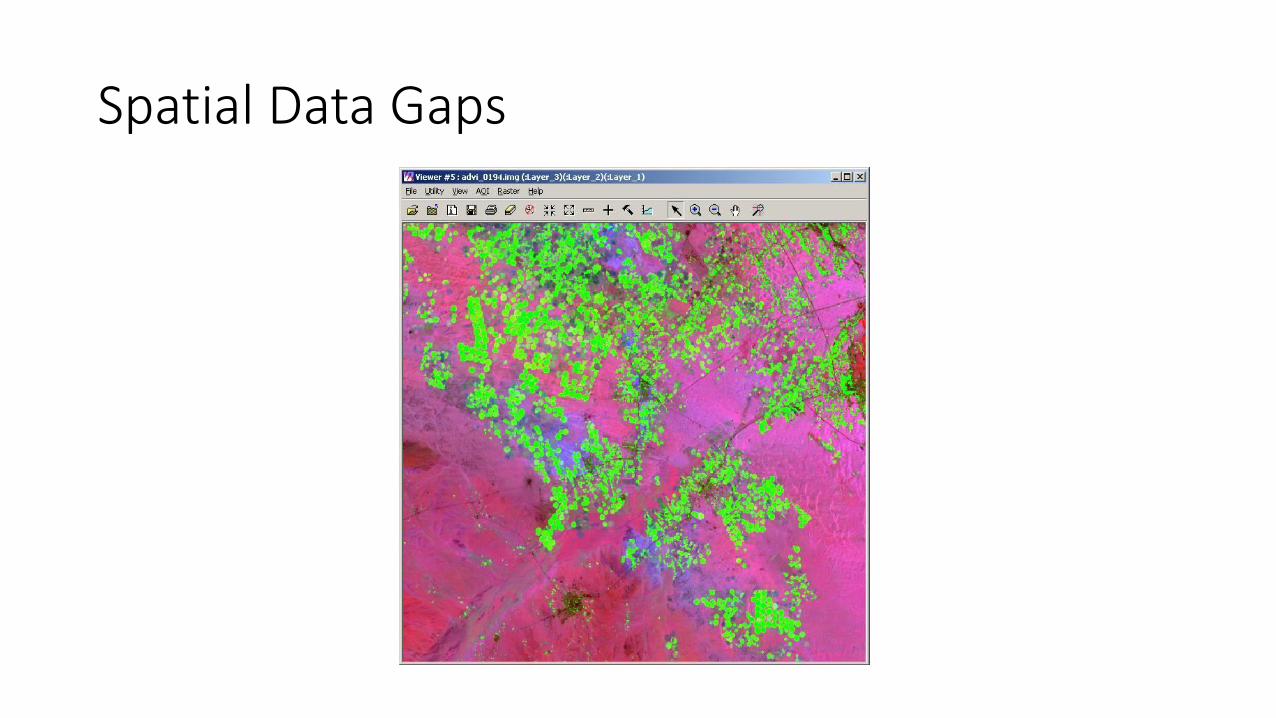
Spatial Data Gaps
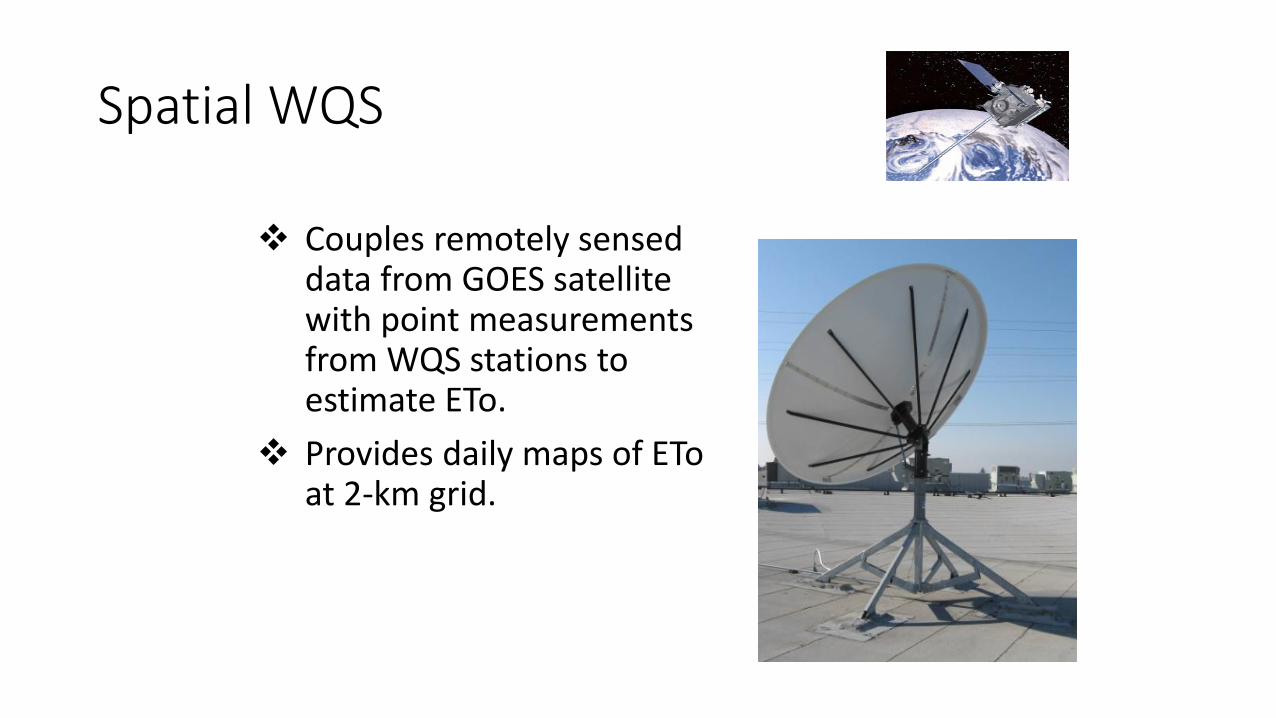
Spatial WQS
Couples remotely sensed data from GOES satellite with point measurements from WQS stations to estimate ETo.
Provides daily maps of ETo at 2-km grid.
Spatial ETo Estimation
Rs is derived from the GOES data using Heliosat-II model.
Ta, RH, and U2 are interpolated between CIMIS stations using the Spline interpolation method.
The ASCE version of the Penman-Monteith equation is used to calculate ETo.
Challenges
Station maintenance
Sensor failures
Station siting
Public outreach
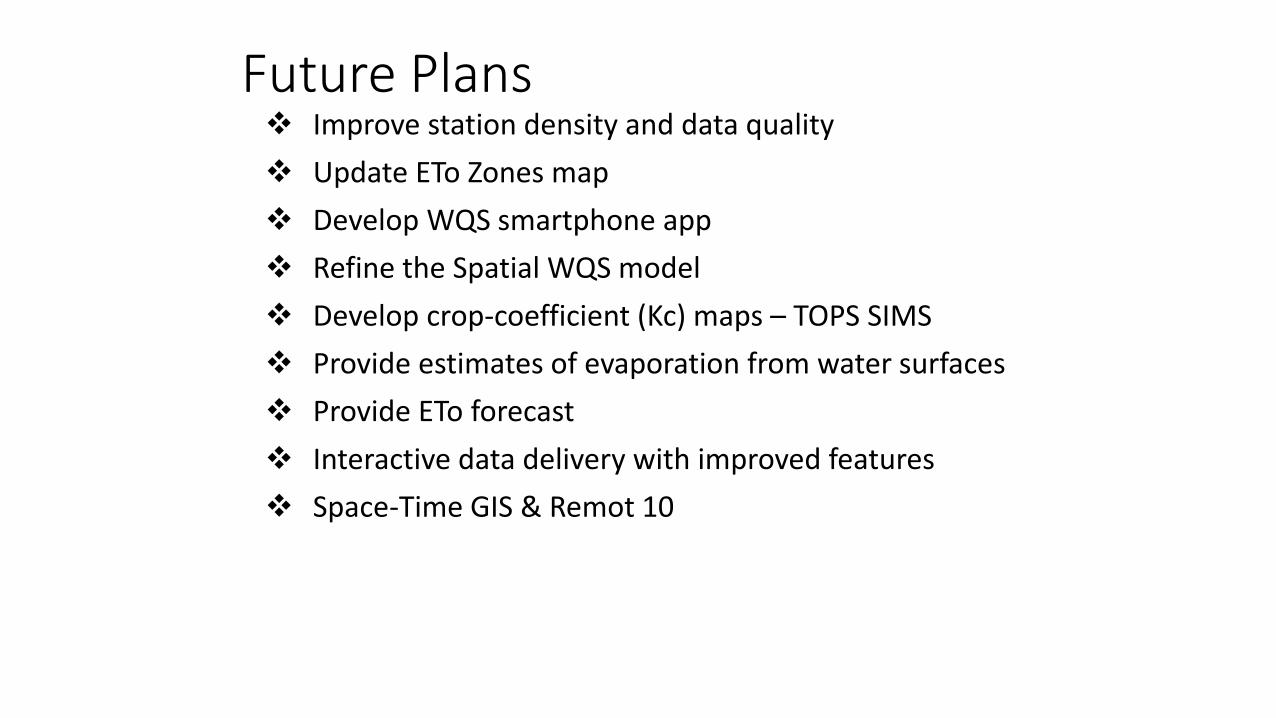
Future Plans Improve station density and data quality
Update ETo Zones map
Develop WQS smartphone app
Refine the Spatial WQS model
Develop crop-coefficient (Kc) maps – TOPS SIMS
Provide estimates of evaporation from water surfaces
Provide ETo forecast
Interactive data delivery with improved features
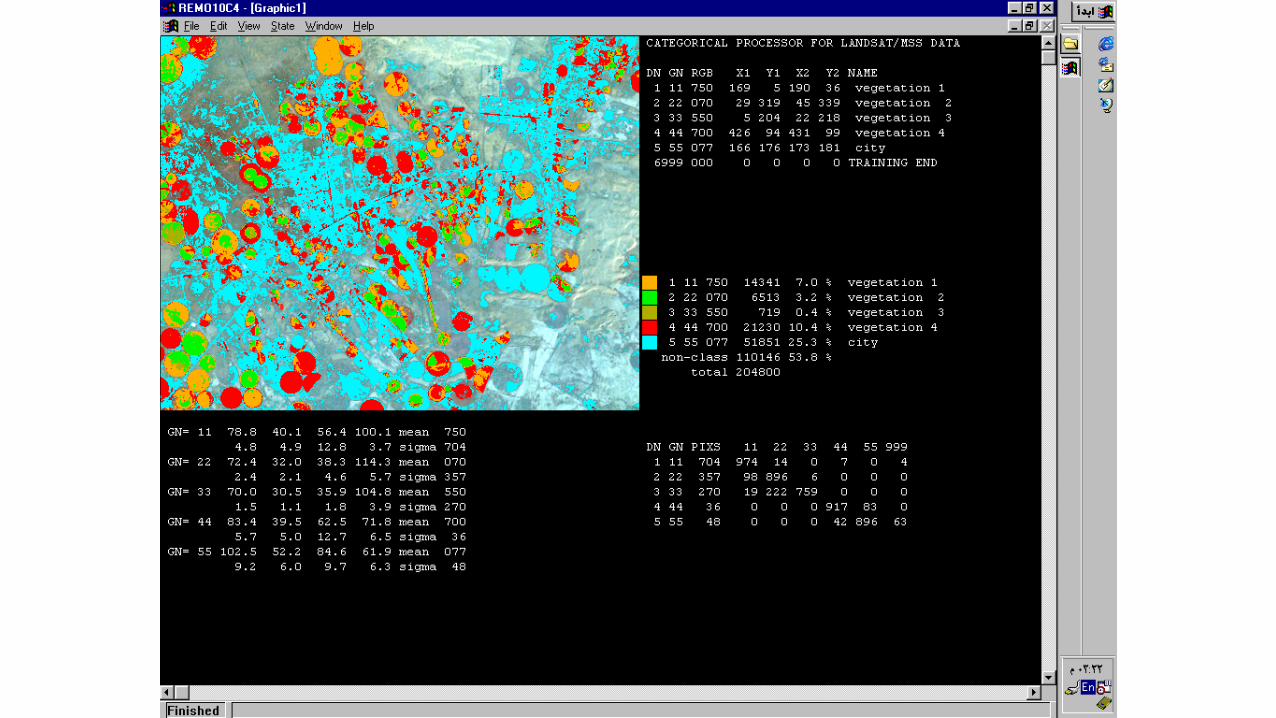
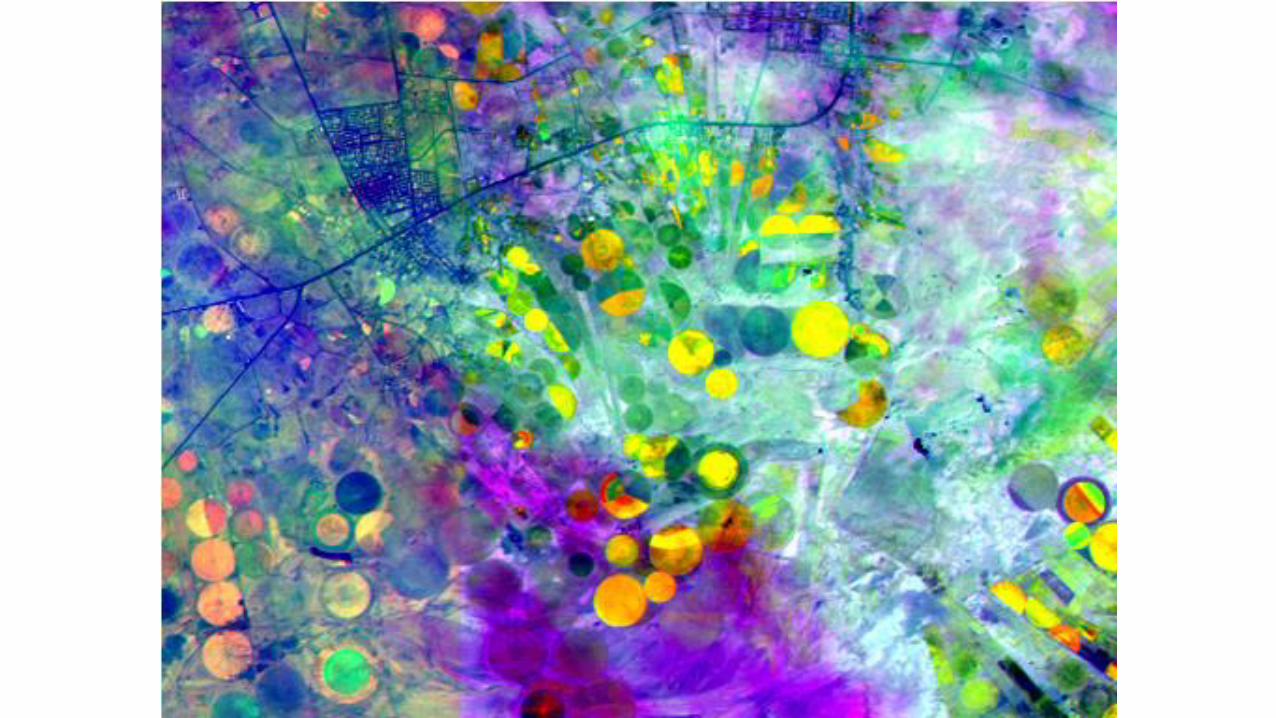
Space-Time GIS & Remot 10
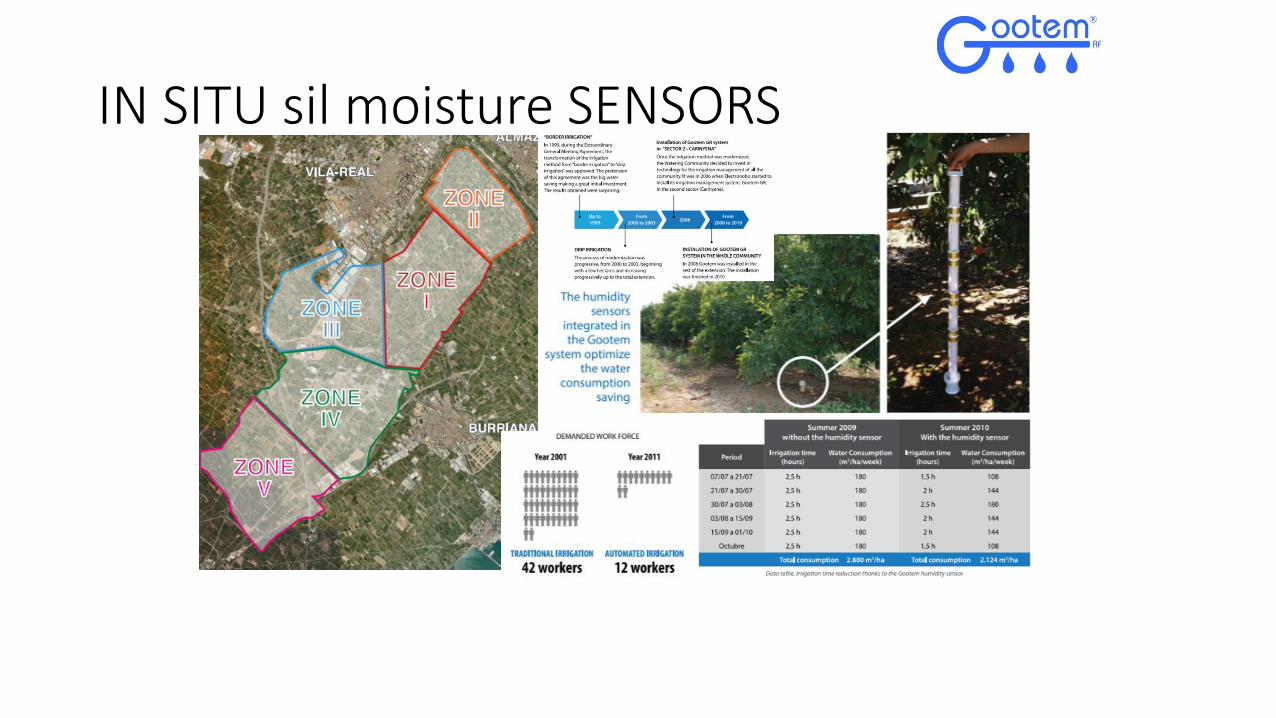
IN SITU sil moisture SENSORS
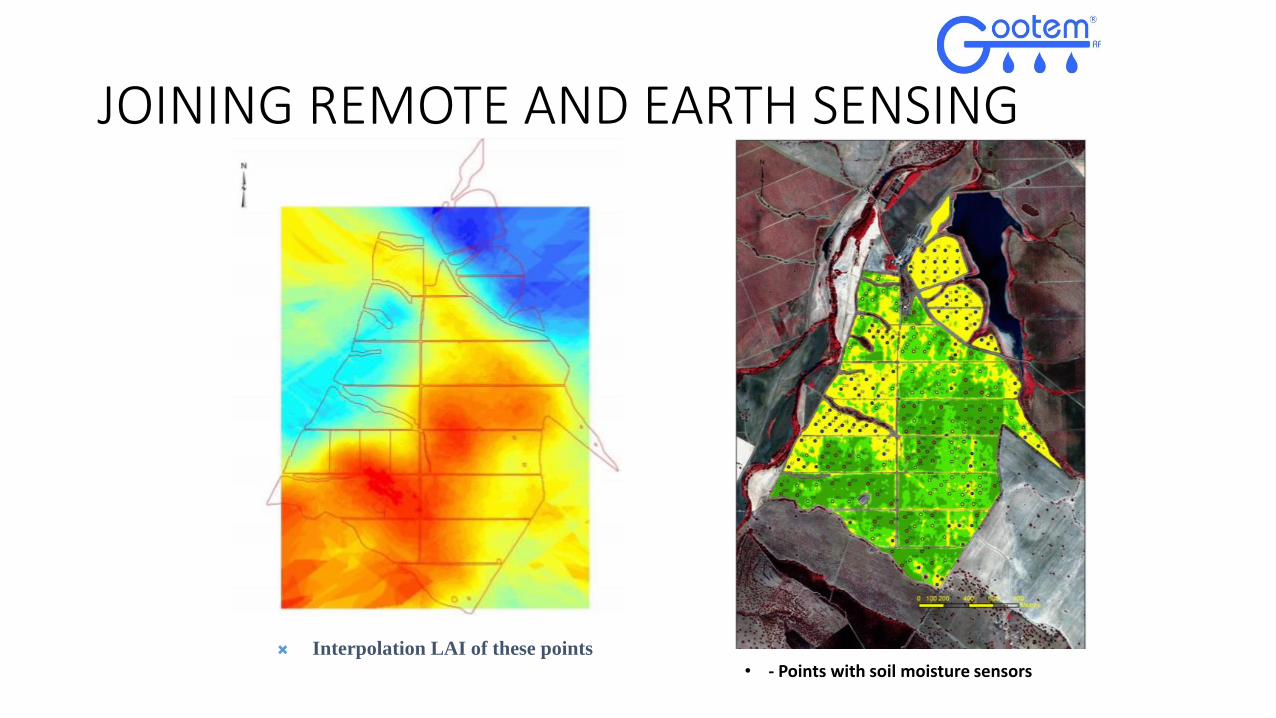
JOINING REMOTE AND EARTH SENSING
• - Points with soil moisture sensors Interpolation LAI of these points
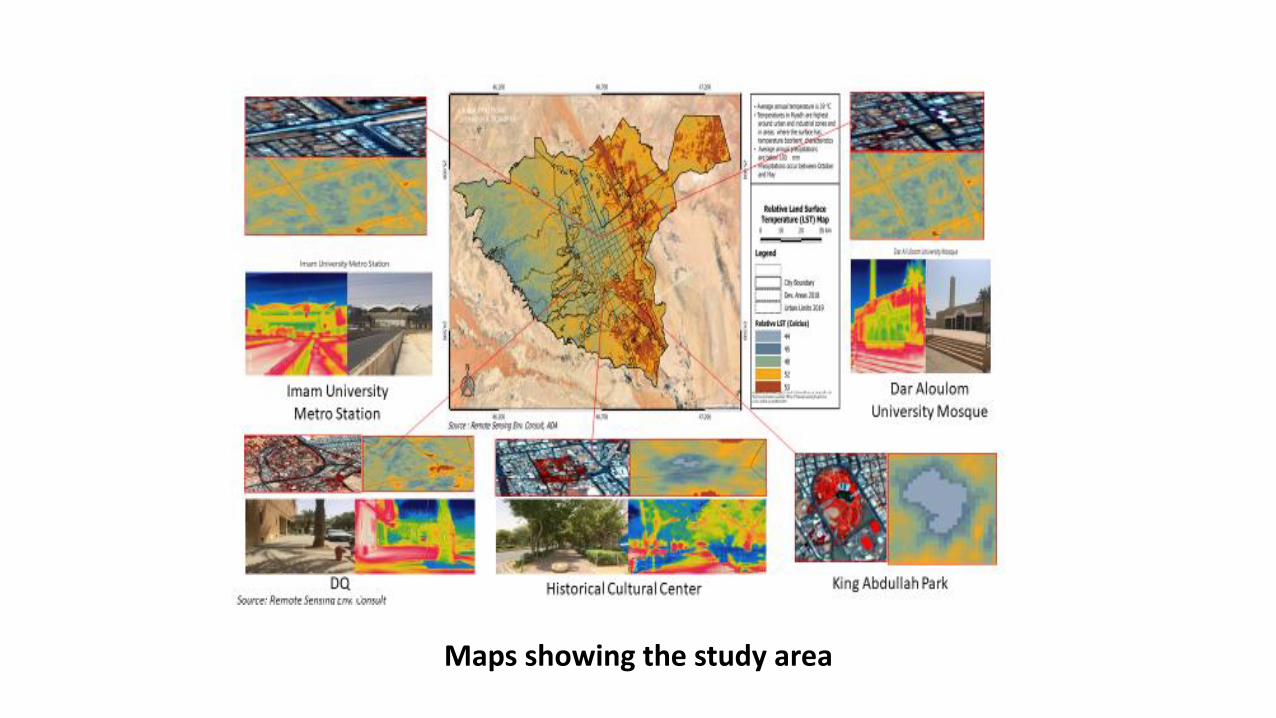
Maps showing the study area
39
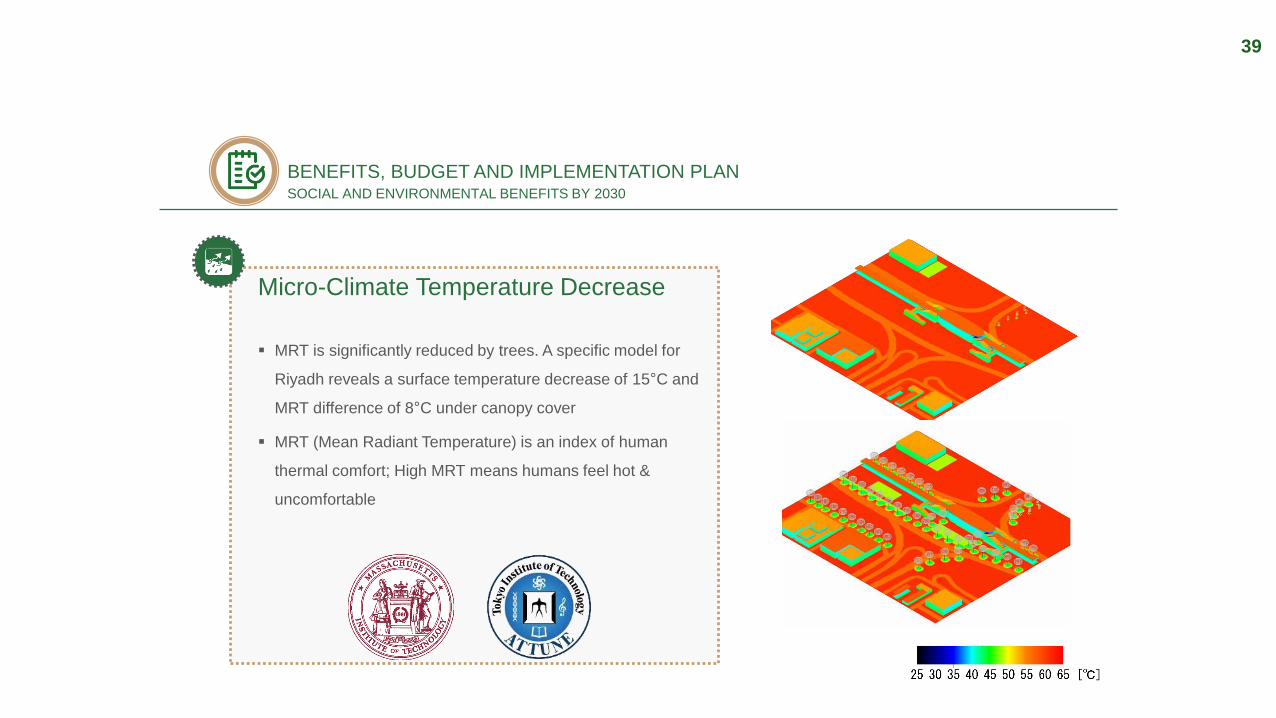
BENEFITS, BUDGET AND IMPLEMENTATION PLANSOCIAL AND ENVIRONMENTAL BENEFITS BY 2030
Micro-Climate Temperature Decrease
MRT is significantly reduced by trees. A specific model for
Riyadh reveals a surface temperature decrease of 15°C and
MRT difference of 8°C under canopy cover
MRT (Mean Radiant Temperature) is an index of human
thermal comfort; High MRT means humans feel hot &
uncomfortable
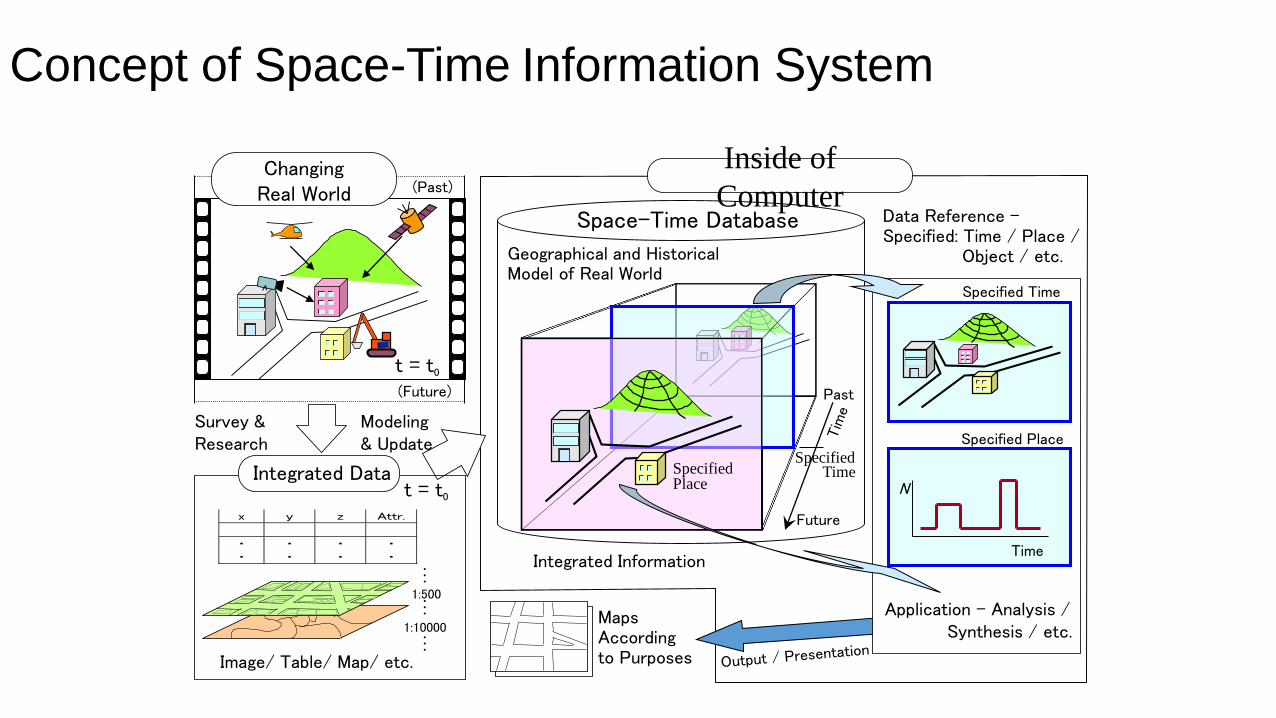
Survey & Research
Inside of
ComputerSpace-Time Database
Modeling& Update
MapsAccording to Purposes
Geographical and Historical Model of Real World
SpecifiedTime
Past
Future
Specified Time
Data Reference -Specified: Time / Place /
Object / etc.
Integrated Datat = t0
1:10000
1:500
……
…
Image/ Table/ Map/ etc.
x y z Attr.
・ ・ ・ ・
・ ・ ・ ・ Time
N
Specified Place
Application – Analysis /Synthesis / etc.
Integrated Information
SpecifiedPlace
ChangingReal World
t = t0
(Future)
(Past)
Concept of Space-Time Information System
Development and Use of Modern Technologies in Monitoring Control
Sultan Al-Sultan
Akita Prefectural University-Japan

Questions?