Embed Size (px)
Citation preview

Development and Validation of the Delaying Gratification Inventory
Michael HoergerUniversity of Rochester Healthcare Decision-Making Group and
Central Michigan University
Stuart W. Quirk and Nathan C. WeedCentral Michigan University
Deficits in gratification delay are associated with a broad range of public health problems, such asobesity, risky sexual behavior, and substance abuse. However, 6 decades of research on the construct hasprogressed less quickly than might be hoped, largely because of measurement issues. Although pastresearch has implicated 5 domains of delay behavior, involving food, physical pleasures, social inter-actions, money, and achievement, no published measure to date has tapped all 5 components of thecontent domain. Existing measures have been criticized for limitations related to efficiency, reliability,and construct validity. Using an innovative Internet-mediated approach to survey construction, wedeveloped the 35-item 5-factor Delaying Gratification Inventory (DGI). Evidence from 4 studies and alarge, diverse sample of respondents (N � 10,741) provided support for the psychometric properties ofthe measure. Specifically, scores on the DGI demonstrated strong internal consistency and test–retestreliability for the 35-item composite, each of the 5 domains, and a 10-item short form. The 5-factorstructure fit the data well and had good measurement invariance across subgroups. Construct validity wassupported by correlations with scores on closely related self-control measures, behavioral ratings, BigFive personality trait measures, and measures of adjustment and psychopathology, including those on theMinnesota Multiphasic Personality Inventory-2-Restructured Form. DGI scores also showed incrementalvalidity in accounting for well-being and health-related variables. The present investigation holdsimplications for improving public health, accelerating future research on gratification delay, and facil-itating survey construction research more generally by demonstrating the suitability of an Internet-mediated strategy.
Keywords: impulsivity, delay discounting, self-control, Internet research, test construction
Supplemental materials: http://dx.doi.org/10.1037/a0023286.supp
Delaying gratification refers to the tendency to forego strongimmediate satisfaction for the sake of salient long-term rewards.Although most develop a burgeoning capacity to delay gratifica-tion by early adolescence, adulthood is marked by substantialindividual differences in delay behavior (Lee, Lan, Wang, & Chiu,2008). National Institutes of Health (2009, p. 2) guidelines identifygratification delay as having a nontrivial impact on public health,with 6 decades of research linking poor gratification delay tosocietal problems, including obesity, substance abuse, risky sexualbehavior, psychopathology, consumer debt, criminality, and loweducational attainment (Baumeister, Vohs, & Tice, 2007; Bembe-nutty & Karabenick, 2004; DeWall, Baumeister, Stillman, & Gal-liot, 2007; Gottdiener, Murawski, & Kucharski, 2008; Seeyave et
al., 2009; Wulfert, Safren, Brown, & Wan, 1999). Despite itsimportance, research on gratification delay has not progressed asquickly as might be hoped largely because of measurement limi-tations and inconsistent findings (Baumeister et al., 2007; Lee etal., 2008; Mauro & Harris, 2000; McLeish & Oxoby, 2007; Rich-ards, Zhang, Mitchell, & de Wit, 1999; Smith & Hantula, 2008).We put forth a framework for conceptualizing gratification delay,examine the relative merits of available measurement strategies,and use a novel, Internet-mediated approach to survey develop-ment.
Theoretical Framework
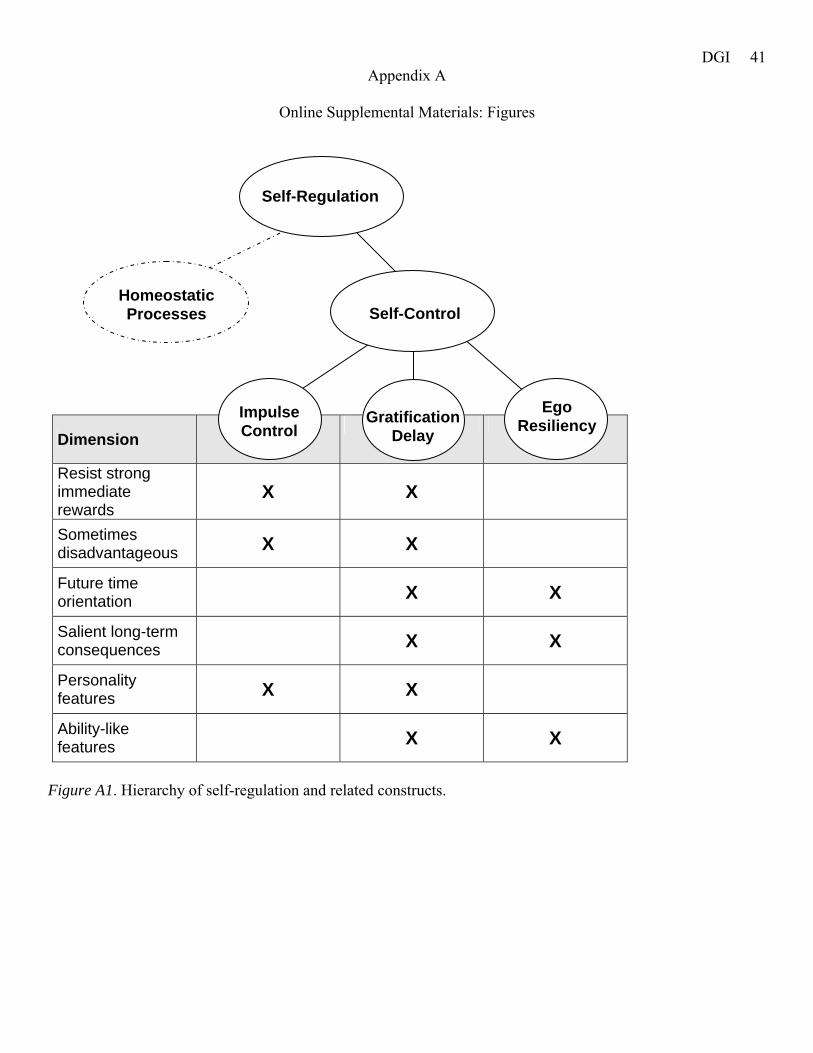
Historically, terms like gratification delay, self-regulation, self-control, impulsivity, and ego resiliency have often been usedinterchangeably or inconsistently (Funder, Block, & Block, 1983;Gailliot et al., 2007; Lee et al., 2008; Mauro & Harris, 2000;Mischel, Cantor, & Feldman, 1996; Mischel & Gilligan, 1964;Muraven, Baumeister, & Tice, 1999), and subtle distinctions be-tween constructs have been ignored (see Figure A1, Appendix A,in the supplemental materials). Authoritative reviews emphasizethat under the umbrella of self-regulation exists self-control(Baumeister et al., 2007; Gailliot et al., 2007), which can beunderstood as a continuum of three constructs, with gratificationdelay occupying conceptual space between impulse control andego resiliency (Funder & Block, 1989). Delay of gratification issimilar to impulse control in that both involve resisting strong
This article was published Online First April 11, 2011.Michael Hoerger, University of Rochester Healthcare Decision-Making
Group; Department of Psychology, Central Michigan University. Stuart W.Quirk and Nathan C. Weed, Department of Psychology, Central MichiganUniversity.
This research was supported by the Central Michigan University Dis-sertation Research Support Grant and by Grant T32MH018911 from theNational Institutes of Health.
Correspondence concerning this article should be addressed to MichaelHoerger, University of Rochester Medical Center, Department of Psychi-atry, 300 Crittenden Boulevard, Rochester, NY 14642. E-mail:[email protected]
Psychological Assessment © 2011 American Psychological Association2011, Vol. 23, No. 3, 725–738 1040-3590/11/$12.00 DOI: 10.1037/a0023286
725
rewards, can occasionally be disadvantageous, and have traitlikefeatures (Baumeister & Vohs, 2004; Funder & Block, 1989;Funder et al., 1983; Gottdiener et al., 2008; Ramanathan & Menon,2006). Alternately, gratification delay is similar to ego resiliency(but different from impulse control) in that both require a futuretime orientation, involve carefully weighing consequences, andhave ability features (Bembenutty & Karabenick, 2004; Funder &Block, 1989; Mischel, Shoda, & Peake, 1988; Twenge, Catanese,& Baumeister, 2003). Thus, operationalizing gratification delayinvolves posing choices between evocative immediate rewards andsalient long-term consequences.
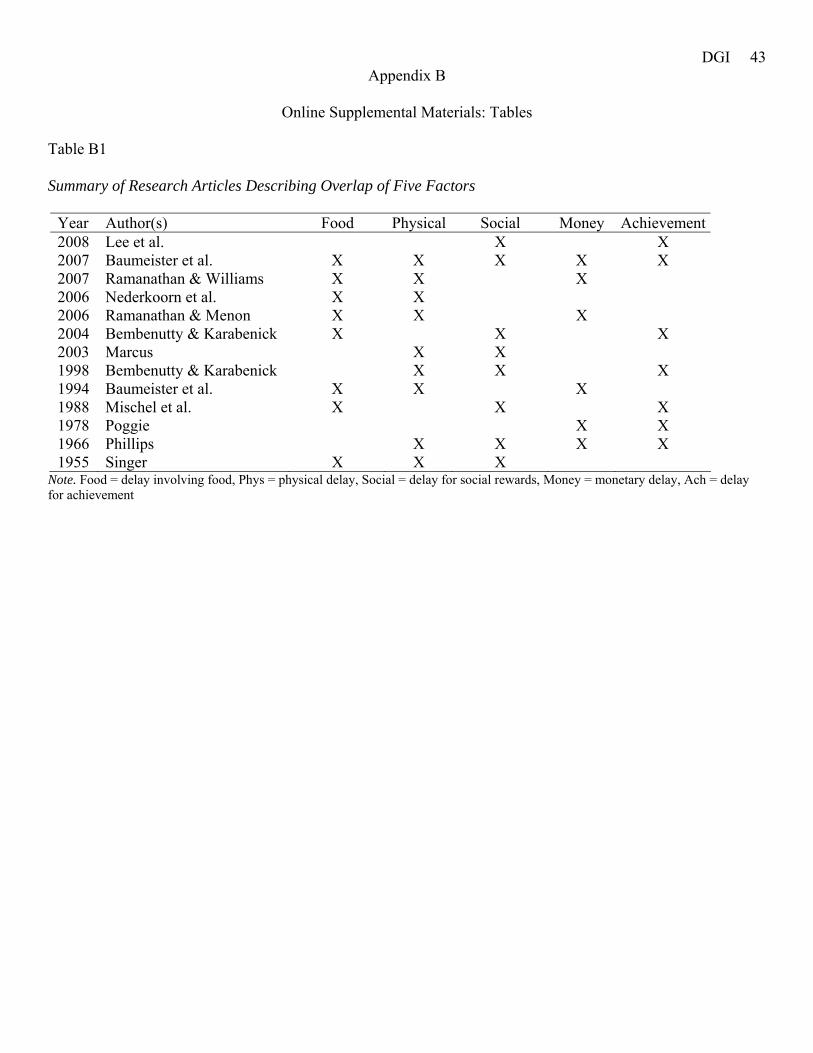
In addition to synthesizing past research to identify a cleardefinition of gratification delay, there is a need to articulate thecontent domain of the construct. We examined five domains ofgratification delay, involving (a) food, (b) physical pleasures, (c)social interactions, (d) money, and (e) achievement. Baumeister etal. (2007, Box 1, p. 353) described a somewhat similar set of fivedomains of behavior with evolutionary significance that werevulnerable to ego depletion. Further, several additional studieshave described at least two of the hypothesized five factors ofdelay behavior (see Table B1 in the supplemental materials; e.g.,Baumeister, Heatherton, & Tice, 1994; Bembenutty & Karabenick,1998, 2004; Lee et al., 2008; Mischel et al., 1988; Ramanathan &Williams, 2007). This investigation was designed to develop ascale measuring individual differences in the five domains ofgratification delay that have received attention in past research.
Measurement Strategies
In 6 decades, three types of measures have mainly been used toassess gratification delay: early performance-based strategies, Mis-chel’s paradigm, and delay discounting tasks. Performance mea-sures have included the number of human movement responses onthe Rorschach, maze and tracing tasks, time estimation, the Stroop,and stop-signal tasks. In addition to being time consuming, thesemeasures have a disjointed theoretical relationship to gratificationdelay (Rapaport, 1951) and have demonstrated poor evidence ofconstruct validity (Nederkoorn, Smulders, Havermans, Roefs, &Jansen, 2006; Singer, Meltzoff, & Goldman, 1952; Wormith &Hasenpusch, 1979).
Given these pitfalls, Mischel (Funder et al., 1983; Mischel,1958; Mischel & Ayduk, 2002; Mischel et al., 1988) explored thebehavioral decision-making paradigm as a more suitable methodfor assessing delay of gratification. As reviewed by Mischel(1996), classic studies involved young children choosing betweenreceiving one marshmallow immediately or two marshmallowsafter a brief (e.g., 20 min) delay period. Although this constitutesa clear operationalization of the construct, limitations of this strat-egy include narrow coverage of the content domain, inefficiency,and low suitability to adult participants. Of greater concern, thisparadigm often relies on one or a very limited number of choices,yielding a dichotomous indicator of delay behavior, which atten-uates reliability and validity estimates (Funder et al., 1983; Mauro& Harris, 2000; Mischel, 1958; Wormith & Hasenpusch, 1979).Multiple observations of delay behavior yield stronger results(Funder & Block, 1989; Mischel & Gilligan, 1964), but narrowcontent domain and age limitations remain.
First designed for animal studies, delay discounting tasks haverecently gained popularity for assessing gratification delay in
human adults (e.g., Reynolds, 2006). Using real or hypotheticalmonetary reinforcers, the approach examines changes in responsecurves, or other metrics, as a result of greater delays in reinforce-ment. The tasks consist of a lengthy series of items that askparticipants to choose, for example, between $50 today and $90tomorrow. The delay period is incrementally increased until theexaminee opts for the immediate reward, signaling a maximumdelay period. Task limitations include being time consuming,covering only one aspect of the content domain (i.e., money), andbeing costly if real reinforcers are used. Also, there is strongerevidence for predictive validity (Reynolds, 2006; Shamosh et al.,2008) than for construct validity (McLeish & Oxoby, 2007; Rich-ards et al., 1999; Smith & Hantula, 2008; Wormith & Hasenpusch,1979). This led Reynolds (2006) to call for “a better understandingof what is being assessed with these measures” (p. 665), as theymay tap working memory, logical reasoning, withdrawal sensitiv-ity, or other important constructs beyond gratification delay.
Survey methodology provides practical and psychometric ben-efits over alternative strategies. The practical advantages of beingable to recruit large samples of adults quickly and inexpensivelyhave been shown in studies on the three published scales, includingthe 12-item Deferment of Gratification Questionnaire (Ray &Najman, 1986), the 10-item Academic Delay of Gratification Scale(Bembenutty & Karabenick, 1998), and the 22-item Multidimen-sional Delay of Gratification Scale (Ward, Perry, Woltz, & Doolin,1989). Yet, existing scales have room for improvement in contentvalidity and score reliability. Specifically, no published scale hasexplicitly addressed the entire content domain relevant to measur-ing gratification delay. The Deferment of Gratification Question-naire was crafted without apparent review of the broad contentdomain of gratification delay, and the Academic Delay of Grati-fication Scale focuses on achievement. The Multidimensional De-lay of Gratification Scale was intended to measure two sociopo-litical aspects of gratification delay in South African Apartheid-eraopposition, but the factor structure was unsupported, and addi-tional domains were not included. Internal consistency reliabilityfor scores on the three measures has fallen short of expectations,ranging from .68 to .74, with potential culprits including surveybrevity and difficult item wording. Our goal was to extend thepractical advantages of surveys by developing a five-factor mea-sure of gratification delay that produces scores of high reliability.
Internet Methodology
The growth of publicly available Web-based psychology studiessuggests potential avenues for scale development research. Com-pared with traditional laboratory studies conducted in person withundergraduates, Internet-mediated research permits several advan-tages, including increased sampling efficiency, greater sampleheterogeneity, decreased research time, and lower costs (Hoerger,2010; Hoerger & Currell, in press). For example, two Web studiesof individual differences have surpassed 100,000 participants(Nosek, Banaji, & Greenwald, 2002; Srivastava, John, Gosling, &Potter, 2003). Large, heterogeneous samples are particularly allur-ing for test construction projects. Power stabilizes item-total cor-relations, allowing the best set of items to be selected from a largeritem pool, and sample heterogeneity improves external validity. Incontrast, overreliance on small convenience samples can threaten
726 HOERGER, QUIRK, AND WEED

cross-sample reliability estimates (e.g., the Subtle items of theMinnesota Multiphasic Personality Inventory; Graham, 2006).
The upside of Internet-mediated studies can substantially over-shadow risks. Foremost, early methodological concerns aboutWeb-based research (e.g., measurement inequivalence) have notbeen borne out by data (De Beuckelaer & Lievens, 2009; Gosling,Vazire, Srivastava, & John, 2004). Further, technico-ethical issues,such as confidentiality and consent, can be handled effectively forlow-risk studies (Hoerger & Currell, in press; Kraut et al., 2004).One realistic concern is that the public is unlikely to complete alengthy battery of validity measures (Krug, 2005). As such, weinitiated a two-step approach to development and validation. Dur-ing development, the survey was to be administered to a broadpublic sample, optimizing evidence for reliability and factor struc-ture. Validation evidence from a lengthier set of measures was tocome primarily from traditional convenience samples of under-graduates, who are less deterred by study length (Hoerger, 2010).
Present Investigation
The present investigation involved four Internet-mediated stud-ies on the development and validation of the Delaying Gratifica-tion Inventory (DGI). In Studies 1 and 2, we focused on scaledevelopment, using a large, diverse sample of adults worldwide.These studies were designed to provide evidence regarding inter-nal consistency reliability, factor structure, and measurement in-variance, with ancillary analyses also providing provisional evi-dence of test–retest reliability and construct validity. In Study 1,we administered a large pool of items in order to craft the final35-item scale, and Study 2 was a cross-sample replication andextension. In Studies 3 and 4, we focused on validation, usingsmaller convenience samples of undergraduates. Study 3 providedevidence of test–retest reliability, construct validity, and incremen-tal validity, whereas in Study 4, we focused exclusively on validityevidence involving adjustment and psychopathology correlates ofthe resulting survey’s scores.
Studies 1 and 2
Methods
Procedures. Large, worldwide samples participated in pilottesting and Studies 1 and 2 through the Web. We rationallydeveloped a large pool of items, based on our five-factor frame-work, and these items were piloted extensively online to hundredsof participants. On the basis of participants’ anonymous feedback,we removed or modified items that were potentially confusing orbiased. In combination with psychometric evidence, the item poolwas iteratively revised, ultimately resulting in a manageable set of70 items measuring the five domains of gratification delay. Thisitem pool was administered online during Study 1. The results ofStudy 1 were used to devise the 35-item DGI, which was admin-istered online in Study 2. These studies were intended to providereplicable evidence of internal consistency, factor structure, andmeasurement invariance. Also, a small set of additional items wasadministered in Study 2 to provide initial evidence of constructvalidity, and test–retest reliability was examined for a subset ofparticipants completing the measure twice.
These studies were designed to minimize cost, optimize partic-ipant recruitment, and meet high ethical standards for Internet-mediated research (Hoerger & Currell, in press). The study websitewas accessible through research sites, search engines, relevantWikipedia pages, Facebook, discussion forums, and blogs. Afterentering the site, participants could access the investigator’s con-tact information, relevant research articles, institutional reviewboard approval documentation, frequently asked questions, and anonline consent form to begin participation. After completing thesurvey, participants received additional study information, innoc-uous tailored personality feedback based on their survey responses(coded with Perl common gateway interface), and optional linksfor providing anonymous feedback and entering a cash drawing for$100.
Numerous procedures were used to reduce repeat or invalidresponse contamination. For most browsers, JavaScript ensuredthat all questions were answered prior to form submission. Toguard against multiple submissions, participants were asked di-rectly whether they had participated previously, and the top of thesurvey included an unusual picture to assist their memory of thesite (a picture of an okapi, a zebra-like animal). We also trackedpartial Internet protocol (IP) addresses (see Hoerger & Currell, inpress), which are standard IP addresses but with the leading digitremoved, thereby ensuring some tracking capability while betterensuring anonymity. Response validity items were also embeddedwithin survey content. Finally, participants had the incentive ofresponding honestly to gain realistic personality feedback.
Measures. All study measures were completed in English.Participants indicated whether they had completed the surveypreviously and optionally provided demographic information, in-cluding gender, age, ethnicity (based on the 2000 U.S. Censuscategories), location (all U.S. states, Canada, Mexico, Europe,Asia, Australia, South America, or Africa), highest grade com-pleted, and high school grade point average.
DGI. The 35-item scale (see Table 1) yields gratificationdelay scores for five domains (food, physical pleasures, socialinteractions, money, and achievement), a 35-item composite (DGI-35), and a 10-item short-form composite (DGI-10). Seventeenitems are reverse-coded, and participants reported how well eachitem described them, using a scale from 1 (strongly disagree) to 5(strongly agree).
Personality and behavioral tendencies. In Study 2 only,participants rated themselves on 30 single-item personality traitdescriptors (e.g., “Neuroticism: to feel sad, worried, anxious, ner-vous, depressed, moody, frustrated, irritated, and out of control”)and 17 single-item behavioral tendencies (e.g., “I pay bills ontime”); see the Results section for a complete listing. Participantsrated how well traits described them on a scale from 1 (belowaverage) to 9 (above average) and rated behavioral tendencies ona scale from 1 (never) to 5 (always). Very brief measures haveshown merit for studies in which hypothesized correlations weresizeable (Donnellan, Oswald, Baird, & Lucas, 2006; Wanous,Reichers, & Hudy, 1997), and brevity was necessary for maintain-ing participant recruitment (Hoerger, 2010; Krug, 2005).
Participants. Data from a large sample of survey respondents(n � 10,241) in Studies 1 and 2 were cleaned to remove invalidresponses prior to core analyses. Reasons for exclusion includedmissing data, invalid response sets, repeat participation as indi-cated by self-report, repeat participation as indicated by a recurrent
727DELAYING GRATIFICATION INVENTORY

partial IP address with matching demographics, and accidentalduplicate form submissions. Of the responses, 95% were retainedas valid (Study 1: 1,900 of 1,982; Study 2: 7,771 of 8,259).Participants were diverse in terms of age (M � 30.6, SD � 10.9years), ethnicity, location, and education level (see Table 2).
Results and Discussion
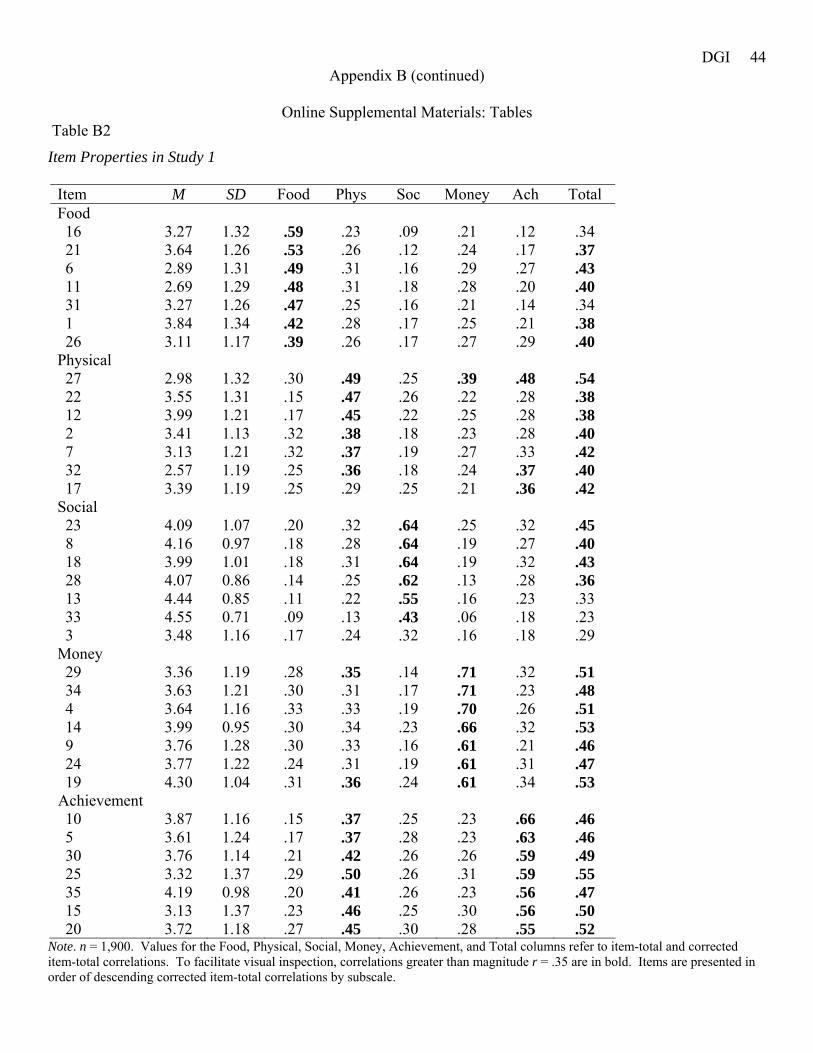
The results of Study 1 were used to develop a reliable 35-itemscale, covering the five domains of gratification delay (for item–total correlations, see Tables B2 and B3 in the supplementalmaterials). Scale means, standard deviations, internal consistencyreliabilities, and intercorrelations are shown for all U.S. partici-pants from both studies in Table 3 (and are separated by study,gender, and location in Tables B4 through B8 in the supplementalmaterials). Across subgroups, internal consistency reliability wasstrong for scores on the DGI-35 composite scale (� � .90) andgood for scores on the DGI-10 short form (� � .77). Thus, both the
Table 1Delaying Gratification Inventory (DGI) Items by Domain
Item Text
Food
1 I can resist junk food when I want to.6 I would have a hard time sticking with a special,
healthy diet.a,b
11 If my favorite food were in front of me, I would have adifficult time waiting to eat it.a
16 It is easy for me to resist candy and bowls of snackfoods.
21 Sometimes I eat until I make myself sick.a
26 I have always tried to eat healthy because it pays off inthe long run.b
31 Even if I am hungry, I can wait until it is meal timebefore eating something.
Physical
2 I am able to control my physical desires.7 I like to get to know someone before having a physical
relationship.12 My habit of focusing on what “feels good” has cost me
in the long run.a
17 I have given up physical pleasure or comfort to reachmy goals.b
22 I prefer to explore the physical side of romanticinvolvements right away.a
27 When faced with a physically demanding chore, Ialways tried to put off doing it.a,b
32 I have lied or made excuses in order to go do somethingmore pleasurable.a
Social
3 I hate having to take turns with other people.a
8 Usually I try to consider how my actions affect others.13 I think that helping each other benefits society.a
18 I try to consider how my actions will affect other peoplein the long-term.b
23 I do not consider how my behavior affects otherpeople.a,b
28 I value the needs of other people around me.33 There is no point in considering how my decisions
affect other people.a
Money
4 When I am able to, I try to save away a little money incase an emergency should arise.
9 It is hard for me to resist buying things I cannot afford.a
14 I try to spend my money wisely.b
19 I cannot be trusted with money.a,b
24 When someone gives me money, I prefer to spend itright away.a
29 I manage my money well.34 I enjoy spending money the moment I get it.a
Achievement
5 I worked hard in school to improve myself as a person.10 I have tried to work hard in school so that I could have
a better future.15 In school, I tried to take the easy way out.a
20 I am capable of working hard to get ahead in life.25 I cannot motivate myself to accomplish long-term
goals.a,b
30 I have always felt like my hard work would pay off inthe end.b
35 I would rather take the easy road in life than get ahead.a
a Indicates reverse-coded item. b Indicates inclusion on DGI-10 shortform composite.
Table 2Demographic Characteristics for Participants in Studies 1 and 2
Demographic characteristic
Study 1 Study 2
n % n %
Age18–19 322 17.5 870 11.720–29 808 44.0 3,296 44.130–39 369 20.1 1,805 24.240–49 215 11.7 917 12.350–59 100 5.4 452 6.160–69 21 1.1 114 1.570� 3 0.2 12 0.2
GenderFemale 888 47.1 3,578 46.3Male 997 52.9 4,142 53.7
Race/ethnicityWhite and non-Latino 1,401 74.4 5,770 74.6Black or African descent 66 3.5 237 3.1Asian descent 210 11.1 919 11.9Hispanic or Latino of any race 71 3.8 293 3.8Biracial or Multiracial 87 4.6 285 3.7Other 49 2.6 226 2.9
LocationUnited States 1,178 62.9 3,747 49.0Canada 146 7.8 412 5.4Mexico 8 0.4 15 0.2Europe 329 17.6 1,088 14.2Asia 103 5.5 402 5.3Australia 84 4.5 1,879 24.6South America 18 1.0 56 0.7Africa 7 0.4 51 0.7
Education level (U.S. only)Doctoral degree 63 5.4 264 7.1Master’s degree 160 13.7 668 17.9Bachelor’s degree 296 25.3 966 25.9Some college 423 36.2 1,214 32.6High school diploma 162 13.9 425 11.4Not a high school graduate 65 5.6 192 5.1
Note. For Study 1, n � 1,900; however, responses were missing for age(n � 62), gender (n � 15), ethnicity (n � 16), location (n � 27), educationlevel (n � 9), and grade point average (n � 57). For Study 2, n � 7,771,but responses were missing for age (n � 305), gender (n � 51), ethnicity(n � 41), location (n � 121), education level (n � 18), and grade pointaverage (n � 134).
728 HOERGER, QUIRK, AND WEED

long and short forms produced reliable measurements of generalindividual differences in gratification delay. Across participantgroups, subscale scores also had good reliability (� � .69–.89) andwere modestly intercorrelated (r � .23–.60). Item-level statisticsfor the DGI-35 were stable across samples, and items loadedrelatively uniquely on their designated domains. As expected, thefive domains had modestly overlapping variance but also ac-counted for unique aspects of gratification delay.
Internal consistency and domain intercorrelations were similaracross gender and participant location, but some mean differenceswere present (see Tables B5 through B8 in the supplementalmaterials). Specifically, female participants scored slightly higherthan male participants in terms of composite gratification delay(DGI-35: d � 0.17–0.21) and across most domains, with thegreatest female advantage observed in the achievement domain(d � 0.41–0.42). In contrast, male participants reported greatergratification delay in the food domain (d � 0.22–0.28). In terms oflocation, U.S. participants differed from international participantsmainly in terms of greater delay of gratification in the achievementdomain (d � 0.25–0.32). Observed demographic differences werepresent but generally small to moderate in size and consistent withprior research.
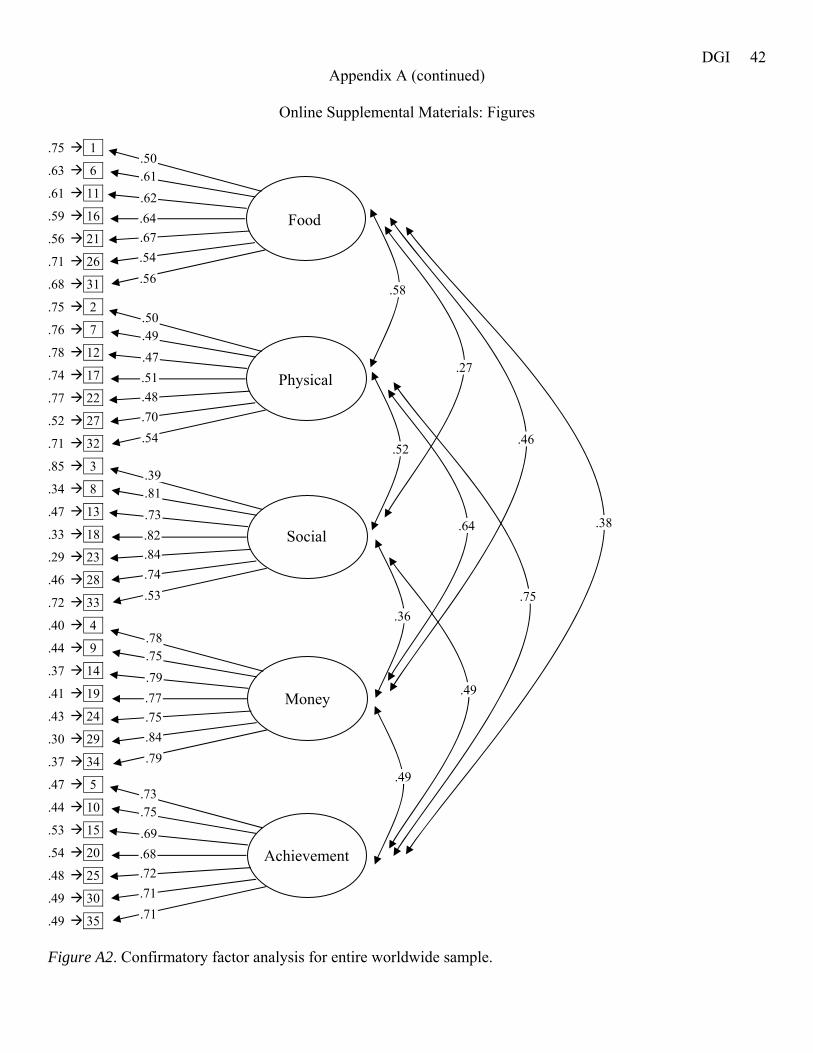
Confirmatory factor analysis supported the hypothesized five-factor model, which was robustly upheld across demographicgroups. Confirmatory factor analysis model fit was examined withLISREL 8.80, using Satorra and Bentler’s (1988) method, whichcorrects for interval data. To adequately characterize model fit,most researchers report several fit statistics, such as the compar-ative fit index, the normed fit index, root-mean-square error ofapproximation, standardized root mean residual, the Akaike infor-mation criterion, chi-square, and the ratio of chi-square to degreesof freedom (�2/df). First, we examined model fit for the entiresample of Study 1 and 2 participants. The hypothesized five-factormodel (for a diagram, see Figure A2 in the supplemental materials)fit the data well: comparative fit index � .964, normed fit index �.962, root-mean-square error of approximation � .057, standard-ized root mean residual � .058, Akaike information criterion �18,031, Satorra–Bentler scaled �2(550) � 17,871, p � .001, and�2/df � 32.49. Because the physical and achievement domainswere the most related, we compared our theory-driven model to afour-factor model combining these domains. We also used multi-group confirmatory factor analysis to compare the five-factorstructure by study sample, gender, and participant location. Thefour-factor model was rejected because it offered no appreciable
improvement in fit, and the five-factor model was found tohave strong structural, factor, and variance–covariance invarianceacross samples, genders, and participant locations (see Table B9 inthe supplemental materials).
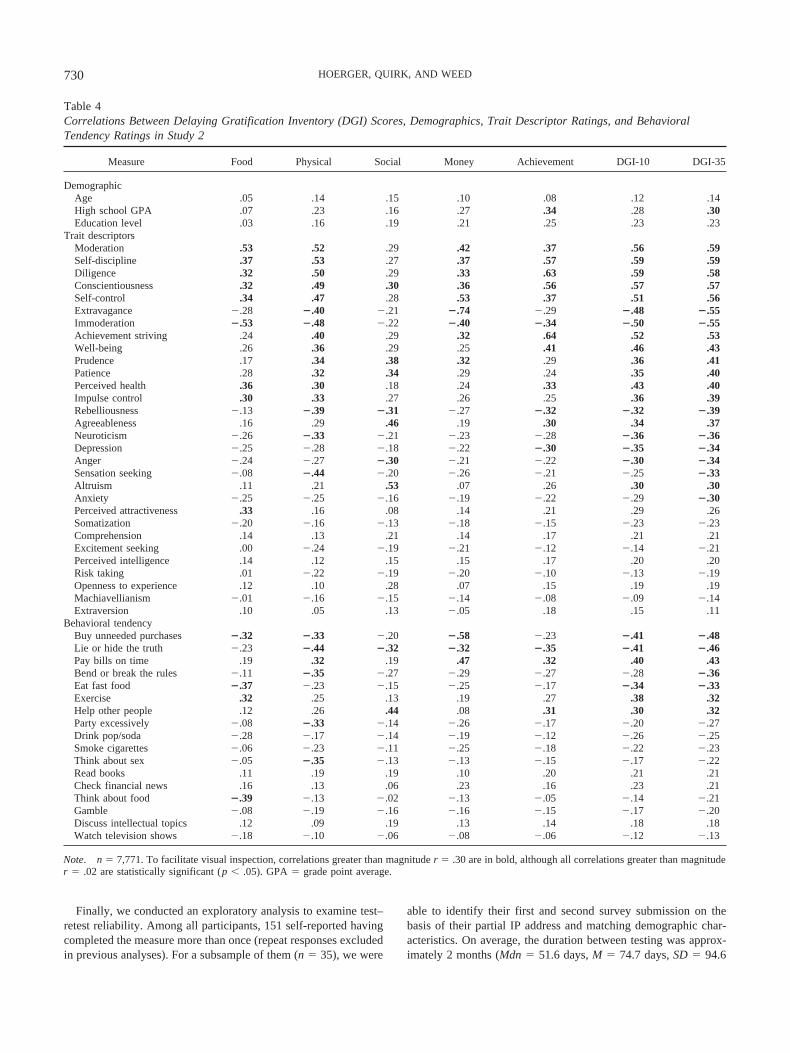
Table 4 shows initial validity evidence for DGI scores in Study2. In general, scores correlated highly with those from closelyrelated constructs, such as self-discipline, self-control, conscien-tiousness, and moderation. DGI composite scores were alsostrongly related to health (r � .40–.43) and well-being (r �.43–.46), and scores increased slightly with age and educationalattainment. Patterns of correlations varied in theoretically mean-ingful ways across domains of gratification delay. Among the fivedomains, the food domain scores correlated most highly withmoderation/immoderation, health, anxiety, perceived attractive-ness, somatization, fast food consumption, thinking about food,exercise, soda drinking, and watching television. Notable corre-lates of the physical domain include sensation seeking, reportedlying, rebelliousness, rule breaking, sexual thoughts, impulse con-trol, partying excessively, neuroticism, anxiety, excitement seek-ing, smoking cigarettes, risk taking, gambling, and Machiavellian-ism. The social domain was most distinct, relating to altruism,agreeableness, helping other people, prudence, patience, anger,openness to experience, comprehension, and discussing intellec-tual topics. Money domain scores were linked to extravagance,buying unneeded purchases, self-control, paying bills on time,smoking cigarettes, checking financial news, and gambling. Fi-nally, the achievement score was predictive of achievement striv-ing, diligence, self-discipline, conscientiousness, well-being, de-pression, high school grade point average, education level, readingbooks, extraversion, and perceived intelligence. Correlations be-tween DGI-35 scores and the traits and behavioral tendencieslisted in Table 4 varied minimally across gender, location, andparticipant age decade (average magnitude of deviation in r acrosssubgroups was .03). In summary, the food domain is related todelay behavior involving food, health, and activity level; thephysical domain is related to sensation seeking, drives, and thrills;the social domain is related to altruistic and prosocial behaviors;the money domain is related to day-to-day financial management;and the achievement domain is related to conscientiousness andachievement striving. The validity of score interpretations wereconsistent across demographic groups studied. Thus, promisinginitial findings implicated the need for more detailed follow-upstudies.
Table 3Delaying Gratification Inventory (DGI) Scale Score Properties in Studies 1 and 2 for All U.S.Participants
Scale M SD 1 2 3 4 5 6 7
1. Food 22.3 5.8 (.75)2. Physical 22.8 5.2 .43 (.71)3. Social 29.3 4.4 .25 .43 (.81)4. Money 26.8 6.4 .36 .50 .33 (.89)5. Achievement 26.7 6.0 .33 .58 .43 .44 (.85)6. DGI-10 36.3 6.9 .59 .73 .60 .66 .75 (.79)7. DGI-35 127.9 20.2 .66 .81 .63 .75 .77 .92 (.91)
Note. N � 4,925. Alphas are indicated in parentheses.
729DELAYING GRATIFICATION INVENTORY
Finally, we conducted an exploratory analysis to examine test–retest reliability. Among all participants, 151 self-reported havingcompleted the measure more than once (repeat responses excludedin previous analyses). For a subsample of them (n � 35), we were
able to identify their first and second survey submission on thebasis of their partial IP address and matching demographic char-acteristics. On average, the duration between testing was approx-imately 2 months (Mdn � 51.6 days, M � 74.7 days, SD � 94.6
Table 4Correlations Between Delaying Gratification Inventory (DGI) Scores, Demographics, Trait Descriptor Ratings, and BehavioralTendency Ratings in Study 2
Measure Food Physical Social Money Achievement DGI-10 DGI-35
DemographicAge .05 .14 .15 .10 .08 .12 .14High school GPA .07 .23 .16 .27 .34 .28 .30Education level .03 .16 .19 .21 .25 .23 .23
Trait descriptorsModeration .53 .52 .29 .42 .37 .56 .59Self-discipline .37 .53 .27 .37 .57 .59 .59Diligence .32 .50 .29 .33 .63 .59 .58Conscientiousness .32 .49 .30 .36 .56 .57 .57Self-control .34 .47 .28 .53 .37 .51 .56Extravagance �.28 �.40 �.21 �.74 �.29 �.48 �.55Immoderation �.53 �.48 �.22 �.40 �.34 �.50 �.55Achievement striving .24 .40 .29 .32 .64 .52 .53Well-being .26 .36 .29 .25 .41 .46 .43Prudence .17 .34 .38 .32 .29 .36 .41Patience .28 .32 .34 .29 .24 .35 .40Perceived health .36 .30 .18 .24 .33 .43 .40Impulse control .30 .33 .27 .26 .25 .36 .39Rebelliousness �.13 �.39 �.31 �.27 �.32 �.32 �.39Agreeableness .16 .29 .46 .19 .30 .34 .37Neuroticism �.26 �.33 �.21 �.23 �.28 �.36 �.36Depression �.25 �.28 �.18 �.22 �.30 �.35 �.34Anger �.24 �.27 �.30 �.21 �.22 �.30 �.34Sensation seeking �.08 �.44 �.20 �.26 �.21 �.25 �.33Altruism .11 .21 .53 .07 .26 .30 .30Anxiety �.25 �.25 �.16 �.19 �.22 �.29 �.30Perceived attractiveness .33 .16 .08 .14 .21 .29 .26Somatization �.20 �.16 �.13 �.18 �.15 �.23 �.23Comprehension .14 .13 .21 .14 .17 .21 .21Excitement seeking .00 �.24 �.19 �.21 �.12 �.14 �.21Perceived intelligence .14 .12 .15 .15 .17 .20 .20Risk taking .01 �.22 �.19 �.20 �.10 �.13 �.19Openness to experience .12 .10 .28 .07 .15 .19 .19Machiavellianism �.01 �.16 �.15 �.14 �.08 �.09 �.14Extraversion .10 .05 .13 �.05 .18 .15 .11
Behavioral tendencyBuy unneeded purchases �.32 �.33 �.20 �.58 �.23 �.41 �.48Lie or hide the truth �.23 �.44 �.32 �.32 �.35 �.41 �.46Pay bills on time .19 .32 .19 .47 .32 .40 .43Bend or break the rules �.11 �.35 �.27 �.29 �.27 �.28 �.36Eat fast food �.37 �.23 �.15 �.25 �.17 �.34 �.33Exercise .32 .25 .13 .19 .27 .38 .32Help other people .12 .26 .44 .08 .31 .30 .32Party excessively �.08 �.33 �.14 �.26 �.17 �.20 �.27Drink pop/soda �.28 �.17 �.14 �.19 �.12 �.26 �.25Smoke cigarettes �.06 �.23 �.11 �.25 �.18 �.22 �.23Think about sex �.05 �.35 �.13 �.13 �.15 �.17 �.22Read books .11 .19 .19 .10 .20 .21 .21Check financial news .16 .13 .06 .23 .16 .23 .21Think about food �.39 �.13 �.02 �.13 �.05 �.14 �.21Gamble �.08 �.19 �.16 �.16 �.15 �.17 �.20Discuss intellectual topics .12 .09 .19 .13 .14 .18 .18Watch television shows �.18 �.10 �.06 �.08 �.06 �.12 �.13
Note. n � 7,771. To facilitate visual inspection, correlations greater than magnitude r � .30 are in bold, although all correlations greater than magnituder � .02 are statistically significant (p � .05). GPA � grade point average.
730 HOERGER, QUIRK, AND WEED

days). Test–retest correlations were strong across scale scores:food (r � .74), physical (r � .84), social (r � .74), money (r �.90), achievement (r � .86), DGI-10 (r � .87), and DGI-35 (r �.90). Although a more detailed follow-up is needed, availableevidence supports strong test–retest reliability of DGI scores.
Results support the utility of Web-based scale development andprovide strong psychometric evidence for DGI scores. On the basisof a diverse worldwide sample of over 10,000 adult respondents,we found evidence for internal consistency reliability, test–retestreliability, a theoretically driven factor structure, measurementinvariance, and construct validity. Studies 3 and 4 were designedto pick up where Study 2 left off, by examining additional validityevidence in greater depth.
Study 3
Methods
Participants and procedures. Whereas Studies 1 and 2focused on internal consistency and factor structure, Study 3 wasdesigned to examine test–retest reliability under more controlledcircumstances, additional evidence for construct validity, and in-cremental validity. An undergraduate convenience sample wasrecruited, given the study length and lack of substantive demo-graphic differences in gratification delay in Study 2. The study wasadministered in two phases, both through SurveyMonkey.com. InPhase 1, participants (n � 207) completed the DGI among mea-sures for other studies; four participants were dropped because ofinvalid response sets. A subset of participants (n � 64) agreed tocomplete Phase 2 two months later, completing the DGI again andother measures of personality and behavior. Participants weremainly young (age: M � 19.3, SD � 2.4; standing: 76.4% fresh-men), female (65.6%), White (93.8%), and of average academicability (ACT: M � 22.6, SD � 3.9). DGI scores were unrelated toage, years in school, and gender (p � .10); findings for ACTscores and other cognitive indicators are reviewed later.
Measures. Participants completed the 35-item DGI and thesame single-item personality and behavior ratings used in Study 2.They also reported demographic information, including age, race,gender, high school and college grade point averages, and ACTscore.
Self-control constructs. Participants completed three self-control measures. The 36-item Self-Control Scale (� � .88; Tang-ney et al., 2004) primarily taps impulse control but also hitsloosely on delay of gratification, competencies, and conscientious-ness, with items like “I am good at resisting temptation” rated ona scale from 1 (not at all) to 5 (very much). The 30-item BarrattImpulsivity Scale (� � .87; Patton, Stanford, & Barratt, 1995)focuses on impulse control but also taps broader aspects of self-control and emotional stability. Items like “I concentrate easily”are rated on a scale from 1 (never) to 5 (always). Finally, the10-item Academic Delay of Gratification Scale (� � .72; Bembe-nutty & Karabenick, 1998) involves hypothetical decisions be-tween immediate pleasures and long-term academic goals. Partic-ipants respond to items like “(A) Study a little everyday for anexam and spend less time with your friend, OR (B) Spend moretime with your friends and cram just before the test?” rated on ascale from 1 (definitely choose A) to 4 (definitely choose B).
Big Five. Participants completed a 150-item version of a BigFive personality questionnaire (Goldberg et al., 2006). The scalemeasures neuroticism (� � .89), extraversion (� � .87), opennessto experience (� � .79), agreeableness (� � .89), and conscien-tiousness (� � .92) as well as six facets for each domain. Itemslike “Prefer variety to routine” are rated on a scale from 1 (dis-agree) to 9 (agree).
Results and Discussion
Basic evidence of internal consistency, test–retest reliability,and construct validity of the DGI support initial findings fromStudies 1 and 2. Specifically, internal consistency and test–retestreliabilities were strong for the DGI-35 composite (� � .88,rretest � .88) and subscale scores (average � � .77, rretest � .76).Thus, in addition to performing well with a diverse, worldwidesample, scores on the measure also demonstrated adequate reli-ability in a university convenience sample. Before examining newvalidity evidence, DGI scores were examined for their associationswith trait descriptors and behavioral tendencies previously inves-tigated in Study 2 (for details, see Table B10 in the supplementalmaterials). The pattern of correlations is notably similar to that ofStudy 2, providing replicable, albeit basic, evidence that DGIscores are validly interpretable, even across distinct samples.
To provide additional evidence of the validity of DGI scores, weexamined correlates with several indicators of academic achieve-ment, the Big Five personality domains and 30 underlying facets,and several closely related measures of self-control (see Table 5).Correlations with other self-control measures were generallystrong, and the social and achievement domains had sizeablecorrelations with ACT score and grade point average. DGI scoreswere generally associated with greater conscientiousness and re-duced neuroticism. Specific DGI domains were associated withaspects of agreeableness, extraversion, and openness. The DGIsocial domain was particularly associated with altruism.
Scores on the DGI also showed solid evidence for incrementalvalidity in predicting a broad range of outcomes, including well-being and health-related behaviors. Specifically, we examined howwell DGI scores predicted relevant outcomes over and above fiveclosely related rival measures, including the Self-Control Scale,the Barratt Impulsivity Scale, the Academic Delay of GratificationScale, the Big Five Agreeableness domain, and the Big FiveConscientiousness domain. Incremental validity was examinedwith two analytic approaches. First, we examined whether any ofthe DGI scores outperformed all five rival measures in predictingany of the 47 traits and behavioral tendencies listed in Table 4 (andTable B10 in the supplemental materials). Given that the DGI iscomposed of 35 items and the rival measures collectively consistedof 136 items, evidence for incremental validity would be notable inthese statistically conservative analyses. For 57% of the traitdescriptors, at least one of the DGI scales had a higher correlationthan all rival scales. Significantly, for 65% of the behavioraltendencies, at least one of the DGI scales outperformed each of thefive rival measures. Thus, the DGI correlated more highly with awide range of theoretically related constructs than did a number ofrival measures that consisted collectively of a much larger itempool.
Hierarchical multiple regression was used to examine incremen-tal validity in predicting well-being and health-related variables.
731DELAYING GRATIFICATION INVENTORY
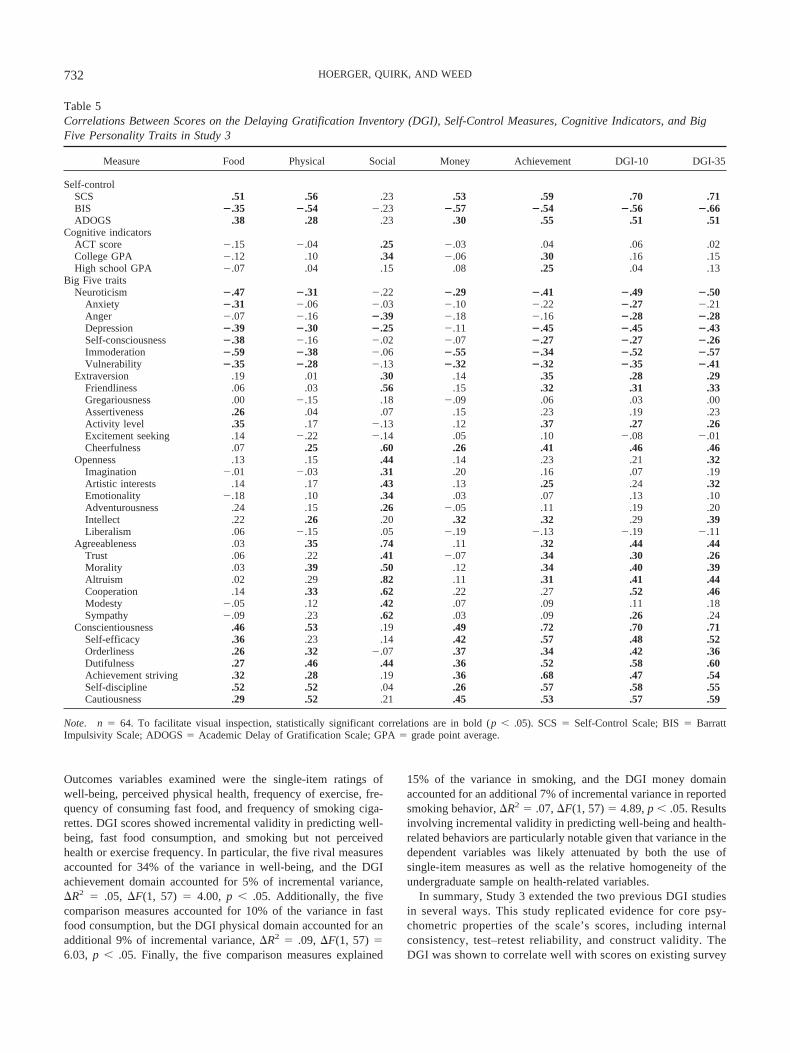
Outcomes variables examined were the single-item ratings ofwell-being, perceived physical health, frequency of exercise, fre-quency of consuming fast food, and frequency of smoking ciga-rettes. DGI scores showed incremental validity in predicting well-being, fast food consumption, and smoking but not perceivedhealth or exercise frequency. In particular, the five rival measuresaccounted for 34% of the variance in well-being, and the DGIachievement domain accounted for 5% of incremental variance,�R2 � .05, �F(1, 57) � 4.00, p � .05. Additionally, the fivecomparison measures accounted for 10% of the variance in fastfood consumption, but the DGI physical domain accounted for anadditional 9% of incremental variance, �R2 � .09, �F(1, 57) �6.03, p � .05. Finally, the five comparison measures explained
15% of the variance in smoking, and the DGI money domainaccounted for an additional 7% of incremental variance in reportedsmoking behavior, �R2 � .07, �F(1, 57) � 4.89, p � .05. Resultsinvolving incremental validity in predicting well-being and health-related behaviors are particularly notable given that variance in thedependent variables was likely attenuated by both the use ofsingle-item measures as well as the relative homogeneity of theundergraduate sample on health-related variables.
In summary, Study 3 extended the two previous DGI studiesin several ways. This study replicated evidence for core psy-chometric properties of the scale’s scores, including internalconsistency, test–retest reliability, and construct validity. TheDGI was shown to correlate well with scores on existing survey
Table 5Correlations Between Scores on the Delaying Gratification Inventory (DGI), Self-Control Measures, Cognitive Indicators, and BigFive Personality Traits in Study 3
Measure Food Physical Social Money Achievement DGI-10 DGI-35
Self-controlSCS .51 .56 .23 .53 .59 .70 .71BIS �.35 �.54 �.23 �.57 �.54 �.56 �.66ADOGS .38 .28 .23 .30 .55 .51 .51
Cognitive indicatorsACT score �.15 �.04 .25 �.03 .04 .06 .02College GPA �.12 .10 .34 �.06 .30 .16 .15High school GPA �.07 .04 .15 .08 .25 .04 .13
Big Five traitsNeuroticism �.47 �.31 �.22 �.29 �.41 �.49 �.50
Anxiety �.31 �.06 �.03 �.10 �.22 �.27 �.21Anger �.07 �.16 �.39 �.18 �.16 �.28 �.28Depression �.39 �.30 �.25 �.11 �.45 �.45 �.43Self-consciousness �.38 �.16 �.02 �.07 �.27 �.27 �.26Immoderation �.59 �.38 �.06 �.55 �.34 �.52 �.57Vulnerability �.35 �.28 �.13 �.32 �.32 �.35 �.41
Extraversion .19 .01 .30 .14 .35 .28 .29Friendliness .06 .03 .56 .15 .32 .31 .33Gregariousness .00 �.15 .18 �.09 .06 .03 .00Assertiveness .26 .04 .07 .15 .23 .19 .23Activity level .35 .17 �.13 .12 .37 .27 .26Excitement seeking .14 �.22 �.14 .05 .10 �.08 �.01Cheerfulness .07 .25 .60 .26 .41 .46 .46
Openness .13 .15 .44 .14 .23 .21 .32Imagination �.01 �.03 .31 .20 .16 .07 .19Artistic interests .14 .17 .43 .13 .25 .24 .32Emotionality �.18 .10 .34 .03 .07 .13 .10Adventurousness .24 .15 .26 �.05 .11 .19 .20Intellect .22 .26 .20 .32 .32 .29 .39Liberalism .06 �.15 .05 �.19 �.13 �.19 �.11
Agreeableness .03 .35 .74 .11 .32 .44 .44Trust .06 .22 .41 �.07 .34 .30 .26Morality .03 .39 .50 .12 .34 .40 .39Altruism .02 .29 .82 .11 .31 .41 .44Cooperation .14 .33 .62 .22 .27 .52 .46Modesty �.05 .12 .42 .07 .09 .11 .18Sympathy �.09 .23 .62 .03 .09 .26 .24
Conscientiousness .46 .53 .19 .49 .72 .70 .71Self-efficacy .36 .23 .14 .42 .57 .48 .52Orderliness .26 .32 �.07 .37 .34 .42 .36Dutifulness .27 .46 .44 .36 .52 .58 .60Achievement striving .32 .28 .19 .36 .68 .47 .54Self-discipline .52 .52 .04 .26 .57 .58 .55Cautiousness .29 .52 .21 .45 .53 .57 .59
Note. n � 64. To facilitate visual inspection, statistically significant correlations are in bold (p � .05). SCS � Self-Control Scale; BIS � BarrattImpulsivity Scale; ADOGS � Academic Delay of Gratification Scale; GPA � grade point average.
732 HOERGER, QUIRK, AND WEED

measures of self-control and the Big Five, providing strongerevidence for construct validity than could be obtained in Study2. Additionally, although the DGI correlated well with relatedconstructs, it afforded incremental validity in predicting self-reports of well-being and health-related behaviors. Notwith-standing these strengths, evidence linking DGI scores to adjust-ment and psychopathology would provide greater support for itsapplied use.
Study 4
Methods
Participants and procedures. Study 4 was designed togather additional evidence of the validity of DGI scores, with agreater focus on correlates related to adjustment and psychopa-thology. Because of proprietary restrictions, the Minnesota Multi-phasic Personality Inventory–2–Restructured Form (MMPI-2-RF;Ben-Porath & Tellegen, 2008) had to be administered in person;therefore, the study was divided into two phases. First, 293 under-graduate participants completed the majority of study measuresonline through SurveyMonkey.com. Second, a subset of 58 par-ticipants agreed to complete the MMPI-2-RF in a laboratory ses-sion 2 weeks later. We used validity items embedded within Phase1 measures as well as MMPI-2-RF validity profile analysis (forguidelines, see Ben-Porath & Tellegen, 2008) to eliminate a fewinvalid responders. The vast majority of Phase 1 (n � 286) andMMPI-2-RF (n � 56) participants responded validly and wereretained for analyses. Participants were primarily young (age: M �19.7, SD � 2.1; standing: 51% freshmen), female (65.1%), andWhite (90.1%). The DGI Social subscale scores increased slightlywith age, r � .12, p � .04. Additionally, female participantsscored higher than male participants on the DGI-35 composite,d � 0.11, t(282) � 4.09, p � .001, and Physical, Social, andAchievement subscales (average d � 0.13).
Measures. The DGI was administered again, and internalconsistency remained adequate for the DGI-35 composite (� �.87) and subscale scores (average � � .73). Demographic infor-mation was also collected, including age, race, and gender.
Self-control constructs. To provide additional evidence forconvergent validity, the DGI was compared with three relatedmeasures. The 12-item Deferment of Gratification Questionnaire(� � .71; Ray & Najman, 1986) assesses gratification delay withitems such as “Do you fairly often find that it is worthwhile to waitand think things over before deciding?” The yes–no responseformat was altered to a scale from 1 (completely untrue) to 9(completely true). Ego resiliency and impulse control were mea-sured with Letzring, Block, and Funder’s (2005) 14-item Ego-Resiliency Scale (� � .74) and 37-item Ego-Undercontrol Scale(� � .85). Items include “I usually think carefully about somethingbefore acting” and “I tend to buy things on impulse,” rated on ascale from 1 (does not apply at all) to 4 (applies very strongly).
Food-related problems. Problematic eating behavior wasmeasured with the 33-item Dutch Eating Behavior Questionnaire(� � .93; van Strien, Frijters, Berger, & Defares, 1986). Itemslike “Do you have a desire to eat when you are bored or restless?”are rated on a scale from 1 (never) to 5 (very often), and the scaleproduces three composite scores, including restrained eating, emo-
tional eating, and external eating (eating when snacks are morereadily available).
Physically risky behavior. Risky behaviors involving sex,drugs, and alcohol were measured with 30 items adapted from theAdd Health Questionnaire (� � .82; Resnick et al., 1997), such as“Have you ever used chewing tobacco?” and “Have you ever paidsomeone for sex?”
Social problems. The 32-item Inventory of InterpersonalProblems–Short Circumplex form (� � .92; Soldz, Budman,Demby, & Merry, 1995) was used to measure social adjustmentproblems along eight dimensions: domineering, vindictive, cold,socially avoidant, nonassertive, exploitable, overly nurturant, andintrusive. Items like “I keep other people at a distance too much”were rated on a scale from 1 (completely disagree) to 5 (completelyagree).
Money problems. Financial problems were assessed with 10items adapted from the Add Health Questionnaire (� � .57;Resnick et al., 1997), including “In the past 12 months, was therea time when you had to borrow money from a friend?” and “Doyou have any credit card debt?”
Achievement problems. The 25-item Academic Maladjust-ment scale from the Student Adaptation to College Questionnaire(� � .86; Baker & Siryk, 1989) measured achievement problemswith items like “I am attending classes regularly” rated from 1(applies very closely to me) to 9 (doesn’t apply to me at all).
Psychopathology. The 338-item MMPI-2-RF (Ben-Porath &Tellegen, 2008) measures psychopathology along 50 overlappingdimensions with a true–false format. The MMPI-2-RF was admin-istered in a group setting 2 weeks after the initial measures werecompleted online.
Results and Discussion
Scores on the DGI were related to those on a variety of othermeasures of self-control, adjustment, and psychopathology. Ashypothesized, the DGI demonstrated continued evidence of con-struct validity by correlating well with self-control measures, anddomains were related to adjustment problems in theoreticallymeaningful ways (see Table 6). The food domain was associatedwith binge eating and idle snacking (external eating). The physicaldomain was related to substance use and number of sexual part-ners. The social domain predicted a broad range of interpersonalproblems, although several domains had relevant correlates. Themoney domain was mildly predictive of problematic personalfinancial behaviors as well as substance use. Further, the achieve-ment domain was strongly related to academic adjustment.
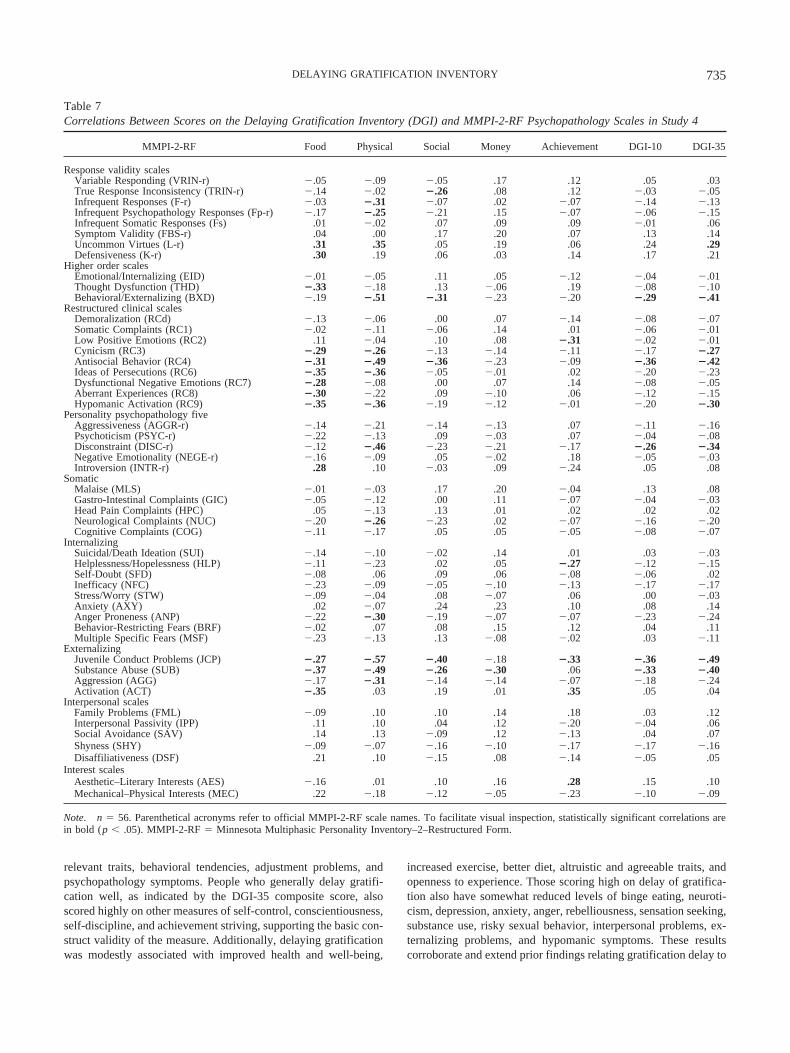
DGI scores were also associated with scores on the MMPI-2-RF(see Table 7). In general, DGI scores were associated with scoresindicating positive psychological adjustment, as noted by associationswith validity indices and negative correlations with substantive scales.In particular, DGI scores were powerfully predictive of decreasedexternalizing symptoms, as measured by the MMPI-2-RF Behavioral/Externalizing scale, Antisocial Behavior scale, Juvenile ConductProblems scale, Substance Abuse scale, and related scales. Correlatesvaried across domains. Those scoring high on the food domain wereless likely to have substance problems, atypical or unhelpful thinkingpatterns, hypomanic symptoms, and behavior problems. They werealso more likely to be introverted. The physical domain was robustlyrelated to fewer externalizing problems (e.g., r � �.57 with Juvenile
733DELAYING GRATIFICATION INVENTORY
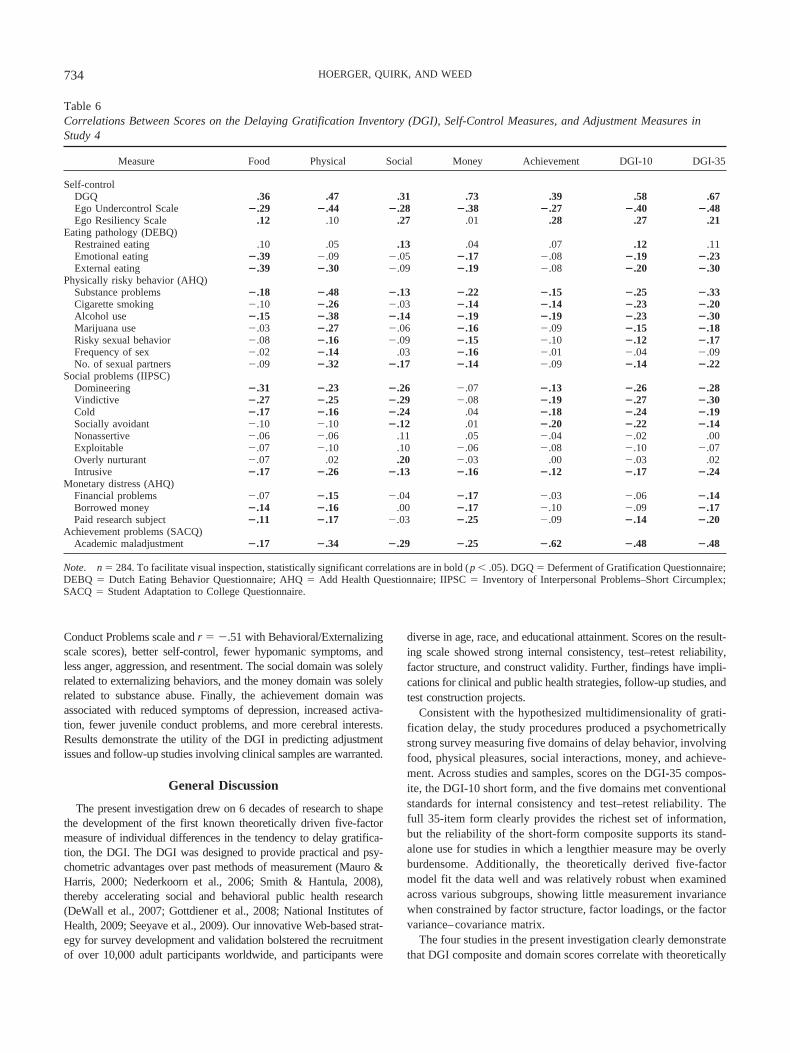
Conduct Problems scale and r � �.51 with Behavioral/Externalizingscale scores), better self-control, fewer hypomanic symptoms, andless anger, aggression, and resentment. The social domain was solelyrelated to externalizing behaviors, and the money domain was solelyrelated to substance abuse. Finally, the achievement domain wasassociated with reduced symptoms of depression, increased activa-tion, fewer juvenile conduct problems, and more cerebral interests.Results demonstrate the utility of the DGI in predicting adjustmentissues and follow-up studies involving clinical samples are warranted.
General Discussion
The present investigation drew on 6 decades of research to shapethe development of the first known theoretically driven five-factormeasure of individual differences in the tendency to delay gratifica-tion, the DGI. The DGI was designed to provide practical and psy-chometric advantages over past methods of measurement (Mauro &Harris, 2000; Nederkoorn et al., 2006; Smith & Hantula, 2008),thereby accelerating social and behavioral public health research(DeWall et al., 2007; Gottdiener et al., 2008; National Institutes ofHealth, 2009; Seeyave et al., 2009). Our innovative Web-based strat-egy for survey development and validation bolstered the recruitmentof over 10,000 adult participants worldwide, and participants were
diverse in age, race, and educational attainment. Scores on the result-ing scale showed strong internal consistency, test–retest reliability,factor structure, and construct validity. Further, findings have impli-cations for clinical and public health strategies, follow-up studies, andtest construction projects.
Consistent with the hypothesized multidimensionality of grati-fication delay, the study procedures produced a psychometricallystrong survey measuring five domains of delay behavior, involvingfood, physical pleasures, social interactions, money, and achieve-ment. Across studies and samples, scores on the DGI-35 compos-ite, the DGI-10 short form, and the five domains met conventionalstandards for internal consistency and test–retest reliability. Thefull 35-item form clearly provides the richest set of information,but the reliability of the short-form composite supports its stand-alone use for studies in which a lengthier measure may be overlyburdensome. Additionally, the theoretically derived five-factormodel fit the data well and was relatively robust when examinedacross various subgroups, showing little measurement invariancewhen constrained by factor structure, factor loadings, or the factorvariance–covariance matrix.
The four studies in the present investigation clearly demonstratethat DGI composite and domain scores correlate with theoretically
Table 6Correlations Between Scores on the Delaying Gratification Inventory (DGI), Self-Control Measures, and Adjustment Measures inStudy 4
Measure Food Physical Social Money Achievement DGI-10 DGI-35
Self-controlDGQ .36 .47 .31 .73 .39 .58 .67Ego Undercontrol Scale �.29 �.44 �.28 �.38 �.27 �.40 �.48Ego Resiliency Scale .12 .10 .27 .01 .28 .27 .21
Eating pathology (DEBQ)Restrained eating .10 .05 .13 .04 .07 .12 .11Emotional eating �.39 �.09 �.05 �.17 �.08 �.19 �.23External eating �.39 �.30 �.09 �.19 �.08 �.20 �.30
Physically risky behavior (AHQ)Substance problems �.18 �.48 �.13 �.22 �.15 �.25 �.33Cigarette smoking �.10 �.26 �.03 �.14 �.14 �.23 �.20Alcohol use �.15 �.38 �.14 �.19 �.19 �.23 �.30Marijuana use �.03 �.27 �.06 �.16 �.09 �.15 �.18Risky sexual behavior �.08 �.16 �.09 �.15 �.10 �.12 �.17Frequency of sex �.02 �.14 .03 �.16 �.01 �.04 �.09No. of sexual partners �.09 �.32 �.17 �.14 �.09 �.14 �.22
Social problems (IIPSC)Domineering �.31 �.23 �.26 �.07 �.13 �.26 �.28Vindictive �.27 �.25 �.29 �.08 �.19 �.27 �.30Cold �.17 �.16 �.24 .04 �.18 �.24 �.19Socially avoidant �.10 �.10 �.12 .01 �.20 �.22 �.14Nonassertive �.06 �.06 .11 .05 �.04 �.02 .00Exploitable �.07 �.10 .10 �.06 �.08 �.10 �.07Overly nurturant �.07 .02 .20 �.03 .00 �.03 .02Intrusive �.17 �.26 �.13 �.16 �.12 �.17 �.24
Monetary distress (AHQ)Financial problems �.07 �.15 �.04 �.17 �.03 �.06 �.14Borrowed money �.14 �.16 .00 �.17 �.10 �.09 �.17Paid research subject �.11 �.17 �.03 �.25 �.09 �.14 �.20
Achievement problems (SACQ)Academic maladjustment �.17 �.34 �.29 �.25 �.62 �.48 �.48
Note. n � 284. To facilitate visual inspection, statistically significant correlations are in bold (p � .05). DGQ � Deferment of Gratification Questionnaire;DEBQ � Dutch Eating Behavior Questionnaire; AHQ � Add Health Questionnaire; IIPSC � Inventory of Interpersonal Problems–Short Circumplex;SACQ � Student Adaptation to College Questionnaire.
734 HOERGER, QUIRK, AND WEED
relevant traits, behavioral tendencies, adjustment problems, andpsychopathology symptoms. People who generally delay gratifi-cation well, as indicated by the DGI-35 composite score, alsoscored highly on other measures of self-control, conscientiousness,self-discipline, and achievement striving, supporting the basic con-struct validity of the measure. Additionally, delaying gratificationwas modestly associated with improved health and well-being,
increased exercise, better diet, altruistic and agreeable traits, andopenness to experience. Those scoring high on delay of gratifica-tion also have somewhat reduced levels of binge eating, neuroti-cism, depression, anxiety, anger, rebelliousness, sensation seeking,substance use, risky sexual behavior, interpersonal problems, ex-ternalizing problems, and hypomanic symptoms. These resultscorroborate and extend prior findings relating gratification delay to
Table 7Correlations Between Scores on the Delaying Gratification Inventory (DGI) and MMPI-2-RF Psychopathology Scales in Study 4
MMPI-2-RF Food Physical Social Money Achievement DGI-10 DGI-35
Response validity scalesVariable Responding (VRIN-r) �.05 �.09 �.05 .17 .12 .05 .03True Response Inconsistency (TRIN-r) �.14 �.02 �.26 .08 .12 �.03 �.05Infrequent Responses (F-r) �.03 �.31 �.07 .02 �.07 �.14 �.13Infrequent Psychopathology Responses (Fp-r) �.17 �.25 �.21 .15 �.07 �.06 �.15Infrequent Somatic Responses (Fs) .01 �.02 .07 .09 .09 �.01 .06Symptom Validity (FBS-r) .04 .00 .17 .20 .07 .13 .14Uncommon Virtues (L-r) .31 .35 .05 .19 .06 .24 .29Defensiveness (K-r) .30 .19 .06 .03 .14 .17 .21
Higher order scalesEmotional/Internalizing (EID) �.01 �.05 .11 .05 �.12 �.04 �.01Thought Dysfunction (THD) �.33 �.18 .13 �.06 .19 �.08 �.10Behavioral/Externalizing (BXD) �.19 �.51 �.31 �.23 �.20 �.29 �.41
Restructured clinical scalesDemoralization (RCd) �.13 �.06 .00 .07 �.14 �.08 �.07Somatic Complaints (RC1) �.02 �.11 �.06 .14 .01 �.06 �.01Low Positive Emotions (RC2) .11 �.04 .10 .08 �.31 �.02 �.01Cynicism (RC3) �.29 �.26 �.13 �.14 �.11 �.17 �.27Antisocial Behavior (RC4) �.31 �.49 �.36 �.23 �.09 �.36 �.42Ideas of Persecutions (RC6) �.35 �.36 �.05 �.01 .02 �.20 �.23Dysfunctional Negative Emotions (RC7) �.28 �.08 .00 .07 .14 �.08 �.05Aberrant Experiences (RC8) �.30 �.22 .09 �.10 .06 �.12 �.15Hypomanic Activation (RC9) �.35 �.36 �.19 �.12 �.01 �.20 �.30
Personality psychopathology fiveAggressiveness (AGGR-r) �.14 �.21 �.14 �.13 .07 �.11 �.16Psychoticism (PSYC-r) �.22 �.13 .09 �.03 .07 �.04 �.08Disconstraint (DISC-r) �.12 �.46 �.23 �.21 �.17 �.26 �.34Negative Emotionality (NEGE-r) �.16 �.09 .05 �.02 .18 �.05 �.03Introversion (INTR-r) .28 .10 �.03 .09 �.24 .05 .08
SomaticMalaise (MLS) �.01 �.03 .17 .20 �.04 .13 .08Gastro-Intestinal Complaints (GIC) �.05 �.12 .00 .11 �.07 �.04 �.03Head Pain Complaints (HPC) .05 �.13 .13 .01 .02 .02 .02Neurological Complaints (NUC) �.20 �.26 �.23 .02 �.07 �.16 �.20Cognitive Complaints (COG) �.11 �.17 .05 .05 �.05 �.08 �.07
InternalizingSuicidal/Death Ideation (SUI) �.14 �.10 �.02 .14 .01 .03 �.03Helplessness/Hopelessness (HLP) �.11 �.23 .02 .05 �.27 �.12 �.15Self-Doubt (SFD) �.08 .06 .09 .06 �.08 �.06 .02Inefficacy (NFC) �.23 �.09 �.05 �.10 �.13 �.17 �.17Stress/Worry (STW) �.09 �.04 .08 �.07 .06 .00 �.03Anxiety (AXY) .02 �.07 .24 .23 .10 .08 .14Anger Proneness (ANP) �.22 �.30 �.19 �.07 �.07 �.23 �.24Behavior-Restricting Fears (BRF) �.02 .07 .08 .15 .12 .04 .11Multiple Specific Fears (MSF) �.23 �.13 .13 �.08 �.02 .03 �.11
ExternalizingJuvenile Conduct Problems (JCP) �.27 �.57 �.40 �.18 �.33 �.36 �.49Substance Abuse (SUB) �.37 �.49 �.26 �.30 .06 �.33 �.40Aggression (AGG) �.17 �.31 �.14 �.14 �.07 �.18 �.24Activation (ACT) �.35 .03 .19 .01 .35 .05 .04
Interpersonal scalesFamily Problems (FML) �.09 .10 .10 .14 .18 .03 .12Interpersonal Passivity (IPP) .11 .10 .04 .12 �.20 �.04 .06Social Avoidance (SAV) .14 .13 �.09 .12 �.13 .04 .07Shyness (SHY) �.09 �.07 �.16 �.10 �.17 �.17 �.16Disaffiliativeness (DSF) .21 .10 �.15 .08 �.14 �.05 .05
Interest scalesAesthetic–Literary Interests (AES) �.16 .01 .10 .16 .28 .15 .10Mechanical–Physical Interests (MEC) .22 �.18 �.12 �.05 �.23 �.10 �.09
Note. n � 56. Parenthetical acronyms refer to official MMPI-2-RF scale names. To facilitate visual inspection, statistically significant correlations arein bold (p � .05). MMPI-2-RF � Minnesota Multiphasic Personality Inventory–2–Restructured Form.
735DELAYING GRATIFICATION INVENTORY
improved psychosocial adjustment (Bembenutty & Karabenick,2004; Funder & Block, 1989; Mischel & Mischel, 1983; Funder etal., 1983; Lee et al., 2008; Ramanathan & William, 2007). Thegeneral pattern of correlations was similar, although slightly at-tenuated, for scores on the DGI-10 short-form composite scale,indicating its utility when administration of a lengthier scale mightbe untenable. Additionally, correlates of DGI domain scores weredistinct and varied in theoretically meaningful ways. The fooddomain was related to dietary habits, preoccupation with food, andactivity level. The physical domain was the greatest predictor ofexternalizing behaviors, including aggression, sensation seeking,substance use, risky sexual behavior, and rule breaking. The socialdomain was related to altruism, interpersonal warmth, open-mindedness, and prosocial behavior. The money domain was re-lated to splurging, paying bills on time, and financial distress.Finally, the academic domain was related to conscientiousness,achievement striving, academic adjustment, and well-being.
The present investigation must be qualified by several importantlimitations. First, findings were based primarily on a broad, diversesample of general adults, and no claims are made about thegeneralizability of DGI correlates to specialized or clinical popu-lations. Studies linking gratification delay to specific physical andmental health problems are encouraged, particularly given thatfindings involving the MMPI-2-RF were restricted to an under-graduate sample. Second, outcome measures relied on self-report.The incorporation of structured behavioral observations, medicalrecord data, or other methods that do not rely on self-report wouldprovide additional tests of validity. Third, although test–retestcorrelations provide evidence for the stability of DGI scores, thisinvestigation does not directly address the degree to which grati-fication delay is modifiable, indicating that prospective interven-tion studies on emotional skill development are warranted. Fourth,additional evidence documenting the association between DGImoney scores and significant real-world financial behavior isneeded. Potential avenues include predicting business success,bankruptcy, credit card debt, and retirement planning.
Study limitations are balanced by several strengths worth not-ing. First, the use of large, diverse worldwide samples in Studies1 and 2 afforded substantial statistical power and facilitated thegeneralizability of the resulting scale. Second, the technico-ethicalrigor of the study website reinforced American PsychologicalAssociation ethical guidelines for Internet-mediated research (Ho-erger & Currell, in press), facilitated participant recruitment andenjoyment, and suggests strategies for future Web-based research-ers. Third, the DGI was designed for flexible and widespread use.The measure is nonproprietary, and clinicians and researchers havethe option of administering the 35-item inventory or the 10-itemshort form, depending on their constraints and interests.
In conclusion, we hope the development of the DGI will providea significant step forward in research on gratification delay. Scoreson the DGI have strong psychometric properties and can be ad-ministered efficiently to diverse samples of adults. Regarding theinvestigation’s clinical and public health implications, the DGIcould be used by trained individual therapists, Department ofSocial Services workers, school counselors, community socialworkers, prison group therapists, Alcoholics Anonymous, occupa-tional rehabilitation programs, and pastoral counselors to identifyindividuals at risk for particular adjustment problems and to betterroute clients to appropriate intervention services. The scale can
also be incorporated into public health studies attempting to pre-dict academic achievement, externalizing behavior problems, psy-chopathology, consumer financial planning, and health care deci-sion making. Finally, the methodological approach suggestsavenues for efficient, low-cost survey development.
References
Baker, R., & Siryk, B. (1989). SACQ: Student Adaptation to CollegeQuestionnaire manual. Los Angeles, CA: Western Psychological Ser-vices.
Baumeister, R. F., Heatherton, T. F., & Tice, D. M. (1994). Losing control:How and why people fail at self-regulation. San Diego, CA: AcademicPress.
Baumeister, R. F., & Vohs, K. D. (2004). Understanding self-regulation:An introduction. In R. F. Baumeister (Ed.), Handbook of self-regulation:Research, theory, and applications (p. 2). New York, NY: GuilfordPress.
Baumeister, R. F., Vohs, K., & Tice, D. (2007). The strength model ofself-control. Current Directions in Psychological Science, 16, 351–355.doi:10.1111/j.1467-8721.2007.00534.x
Bembenutty, H., & Karabenick, S. (1998). Academic delay of gratification.Learning and Individual Differences, 10, 329–346. doi:10.1016/S1041-6080(99)80126-5
Bembenutty, H., & Karabenick, S. (2004). Inherent association betweenacademic delay of gratification, future time perspective, and self-regulated learning. Educational Psychology Review, 16, 35–57. doi:10.1023/B:EDPR.0000012344.34008.5c
Ben-Porath, Y. S., & Tellegen, A. (2008). The Minnesota MultiphasicPersonality Inventory–2–Restructured Form: Manual for administra-tion, scoring, and interpretation. Minneapolis, MN: University of Min-nesota Press.
De Beuckelaer, A., & Lievens, F. (2009). Measurement equivalence ofpaper-and-pencil and Internet organizational surveys: A large scaleexamination in 16 countries. Applied Psychology: An InternationalReview, 58, 336–361. doi:10.1111/j.1464-0597.2008.00350.x
DeWall, C. N., Baumeister, R. F., Stillman, T. F., & Galliot, M. T. (2007).Violence restrained: Effects of self-regulation and its depletion on ag-gression. Journal of Experimental Social Psychology, 43, 62–76. doi:10.1016/j.jesp.2005.12.005
Donnellan, M. B., Oswald, F. L., Baird, B. M., & Lucas, R. E. (2006). TheMini-IPIP Scales: Tiny-yet-effective measures of the Big Five factors ofpersonality. Psychological Assessment, 18, 192–203. doi:10.1037/1040-3590.18.2.192
Funder, D., & Block, J. (1989). The role of ego-control, ego-resiliency, andIQ in delay of gratification in adolescence. Journal of Personality andSocial Psychology, 57, 1041–1050. doi:10.1037/0022-3514.57.6.1041
Funder, D., Block, J., & Block, J. (1983). Delay of gratification: Somelongitudinal personality correlates. Journal of Personality and SocialPsychology, 44, 1198–1213. doi:10.1037/0022-3514.44.6.1198
Gailliot, M. T., Baumeister, R., DeWall, C., Maner, J., Plant, E., Tice, D.,. . . Schmeichel, B. (2007). Self-control relies on glucose as a limitedenergy source: Willpower is more than a metaphor. Journal of Person-ality and Social Psychology, 92, 325–336. doi:10.1037/0022-3514.92.2.325
Goldberg, L. R., Johnson, J. A., Eber, H. W., Hogan, R., Ashton, M. C.,Cloninger, C. R., & Gough, H. C. (2006). The International PersonalityItem Pool and the future of public-domain personality measures. Journalof Research in Personality, 40, 84–96. doi:10.1016/j.jrp.2005.08.007
Gosling, S. D., Vazire, S., Srivastava, S., & John, O. (2004). Should wetrust Web-based studies? A comparative analysis of six preconceptionsabout Internet questionnaires. American Psychologist, 59, 93–104. doi:10.1037/0003-066X.59.2.93
Gottdiener, W., Murawski, P., & Kucharski, L. (2008). Using the delay
736 HOERGER, QUIRK, AND WEED
discounting task to test for failures in ego control in substance abusers:A meta-analysis. Psychoanalytic Psychology, 25, 533–549. doi:10.1037/0736-9735.25.3.533
Graham, J. (2006). MMPI-2: Assessing personality and psychopathology.New York, NY: Oxford University Press.
Hoerger, M. (2010). Participant dropout as a function of survey length inInternet-mediated university studies: Implications for study design andvoluntary participation in psychological research. Cyberpsychology, Be-havior, and Social Networking, 13, 697–700. doi:10.1089/cyber.2009.0445
Hoerger, M., & Currell, C. (in press). Ethical issues in Internet research. In:S. Knapp, L. VandeCreek, M. Handelsman, & M. Gottlieb, (Eds), APAhandbook of ethics in psychology. Washington, DC: American Psycho-logical Association.
Kraut, R., Olson, J., Banaji, M., Bruckman, A., Cohen, J., & Couper, M.(2004). Psychological research online: Report of Board of ScientificAffairs’ Advisory Group on the conduct of research on the Internet.American Psychologist, 59, 105–117. doi:10.1037/0003-066X.59.2.105
Krug, S. (2005). Don’t make me think: A common sense approach to Webusability (2nd ed.). Berkeley, CA: New Riders.
Lee, P., Lan, W., Wang, C., & Chiu, H. (2008). Helping young children todelay gratification. Early Childhood Education Journal, 35, 557–564.doi:10.1007/s10643-008-0240-9
Letzring, T. D., Block, J., & Funder, D. C. (2005). Ego-control andego-resiliency: Generalization of self-report scales based on personalitydescriptions from acquaintances, clinicians, and the self. Journal ofResearch in Personality, 39, 395–422. doi:10.1016/j.jrp.2004.06.003
Mauro, C. F., & Harris, Y. (2000). The influence of maternal child-rearingattitudes and teaching behaviors on preschoolers’ delay of gratification.Journal of Genetic Psychology: Research and Theory on Human De-velopment, 161, 292–306. doi:10.1080/00221320009596712
McLeish, K. N., & Oxoby, R. J. (2007). Measuring impatience: Eliciteddiscount rates and the Barratt Impulsiveness Scale. Personality andIndividual Differences, 43, 553–565. doi:10.1016/j.paid.2007.01.002
Mischel, W. (1958). Preference for delayed reinforcement: An experimen-tal study of a cultural observation. Journal of Abnormal and SocialPsychology, 56, 57–61. doi:10.1037/h0041895
Mischel, W. (1996). From good intentions to willpower. In P. M. Gollwit-zer & J. A. Bargh (Eds.), The psychology of action: Linking cognitionsand motivation to behavior (pp. 197–218). New York, NY: Guilford.
Mischel, W., & Ayduk, O. (2002). Self-regulation in a cognitive–affectivepersonality system: Attentional control in the service of the self. Self andIdentity, 1, 113–120. doi:10.1080/152988602317319285
Mischel, W., Cantor, N., & Feldman, S. (1996). Principles in self-regulation: The nature of willpower and self-control. In F. T. Higgins &A. Gruglanski (Eds.), Social psychology: Handbook of basic principles(pp. 687–696). New York, NY: Guilford Press.
Mischel, W., & Gilligan, C. (1964). Delay of gratification, motivation forthe prohibited gratification, and responses to temptation. Journal ofAbnormal and Social Psychology, 69, 411–417. doi:10.1037/h0048918
Mischel, H., & Mischel, W. (1983). The development of children’s knowl-edge of self-control strategies. Child Development, 54, 603–619.
Mischel, W., Shoda, Y., & Peake, P. (1988). The nature of adolescentcompetencies predicted by preschool delay of gratification. Journal ofPersonality and Social Psychology, 54, 687–696.
Muraven, M., Baumeister, R., & Tice, D. (1999). Longitudinal improve-ment of self-regulation through practice: Building self-control strengththrough repeated exercise. Journal of Social Psychology, 139, 446–457.doi:10.1080/00224549909598404
National Institutes of Health. (2009). NIH science of behavior change.Retrieved from http://nihroadmap.nih.gov/documents/SOBC_Meeting_Summary_2009.pdf
Nederkoorn, C., Smulders, F., Havermans, R., Roefs, A., & Jansen, A.
(2006). Impulsivity in obese women. Appetite, 47, 253–256. doi:10.1016/j.appet.2006.05.008
Nosek, B., Banaji, M., & Greenwald, A. (2002). Harvesting implicit groupattitudes and beliefs from a demonstration web site. Group Dynamics:Theory, Research, and Practice, 6, 101–115. doi:10.1037/1089-2699.6.1.101
Patton, J. H., Stanford, M. S., & Barratt, E. S. (1995). Factor structureof the Barratt Impulsiveness Scale. Journal of Clinical Psychology,51, 768 –774. doi:10.1002/1097-4679(199511)51:6�768::AID-JCLP2270510607�3.0.CO;2-1
Ramanathan, S., & Menon, G. (2006). Time-varying effects of chronichedonic goals on impulsive behavior. Journal of Marketing Research,43, 628–641. doi:10.1509/jmkr.43.4.628
Ramanathan, S., & Williams, P. (2007). Immediate and delayed emotionalconsequences of indulgence: The moderating influence of personalitytype on mixed emotions. Journal of Consumer Research, 34, 212–223.doi:10.1086/519149
Rapaport, D. (1951). Organization and pathology of thought. New York,NY: Columbia University Press. doi:10.1037/10584-000
Ray, J., & Najman, J. (1986). The generalizability of deferment of grati-fication. Journal of Social Psychology, 126, 117–119. doi:10.1080/00224545.1986.9713578
Resnick, M. D., Bearman, P. S., Blum, R. W., Bauman, K. E., Harris,K. M., Jones, J., . . . Udry, J. R. (1997). Protecting adolescents fromharm: Findings from the National Longitudinal Study on AdolescentHealth. JAMA, 278, 823–832. doi:10.1001/jama.278.10.823
Reynolds, B. (2006). A review of delay-discounting research with humans:Relations to drug use and gambling. Behavioural Pharmacology, 17,651–667. doi:10.1097/FBP.0b013e3280115f99
Richards, J. B., Zhang, L., Mitchell, S. H., & de Wit, H. (1999). Delay orprobability discounting in a model of impulsive behavior: Effect ofalcohol. Journal of the Experimental Analysis of Behavior, 71, 121–143.doi:10.1901/jeab.1999.71-121
Satorra, A., & Bentler, P. M. (1988). Scaling corrections for chi-squarestatistics in covariance structure analysis. In Proceedings of the Businessand Economic Statistics Section of the American Statistical Association(pp. 308–313). Alexandria, VA: American Statistical Association.
Seeyave, D. M., Coleman, S., Appugliese, D., Corwyn, R. F., Bradley,R. H., Davidson, N. S., . . . Lumeng, J. C. (2009). Ability to delaygratification at age 4 years and risk of overweight at age 11 years.Archives of Pediatrics and Adolescent Medicine, 163, 303–308.
Shamosh, N. A., DeYoung, C. G., Green, A. E., Reis, D. L., Johnson, M.Conway, A. R. A., . . . Gray, J. (2008). Individual differences in delaydiscounting. Psychological Science, 19, 904–911. doi:10.1111/j.1467-9280.2008.02175.x
Singer, J. L., Meltzoff, J., & Goldman, G. D. (1952). Rorschach movementresponses following motor inhibition and hyperactivity. Journal of Con-sulting Psychology, 16, 359–364. doi:10.1037/h0063452
Smith, C. L., & Hantula, D. A. (2008). Methodological considerations inthe study of delay discounting in intertemporal choice: A comparison oftasks and modes. Behavior Research Methods, 40, 940–953. doi:10.3758/BRM.40.4.940
Soldz, S., Budman, S., Demby, A., & Merry, J. (1995). A Short Form of theInventory of Interpersonal Problems Circumplex Scales. Assessment, 2,53–63. doi:10.1177/1073191195002001006
Srivastava, S., John, O. P., Gosling, S. D., & Potter, J. (2003). Develop-ment of personality in adulthood: Set like plaster or persistent change?Journal of Personality and Social Psychology, 84, 1041–1053. doi:10.1037/0022-3514.84.5.1041
Tangney, J. P., Baumeister, R. F., & Boone, A. L. (2004). High self-controlpredicts good adjustment, less pathology, better grades, and interper-sonal success. Journal of Personality, 72, 271–322.
Twenge, J. M., Catanese, K. R., & Baumeister, R. F. (2003). Socialexclusion and the deconstructed state: Time perception, meaningless-
737DELAYING GRATIFICATION INVENTORY

ness, lethargy, lack of emotion, and self-awareness. Journal of Person-ality and Social Psychology, 85, 409 – 423. doi:10.1037/0022-3514.85.3.409
van Strien, T., Frijters, J. E. R., Berger, G. P. A., & Defares, P. B. (1986). TheDutch Eating Behavior Questionnaire (DEBQ) for assessment of restrained,emotional, and external eating behavior. International Journal of Eating Dis-orders, 5, 295–315. doi:10.1002/1098-108X(198602)5:2�295::AID-EAT2260050209�3.0.CO;2-T
Wanous, J. P., Reichers, A. E., & Hudy, M. J. (1997). Overall jobsatisfaction: How good are single-item measures? Journal of AppliedPsychology, 82, 247–252. doi:10.1037/0021-9010.82.2.247
Ward, W. E., Perry, T. B., Woltz, J., & Doolin, E. (1989). Delay ofgratification among Black college student leaders. Journal of BlackPsychology, 15, 111–128. doi:10.1177/00957984890152004
Wormith, J., & Hasenpusch, B. (1979). Multidimensional measurement ofdelayed gratification preference with incarcerated offenders. Journal ofClinical Psychology, 35, 218–225.
Wulfert, E., Safren, S., Brown, I., & Wan, C. (1999). Cognitive, behav-ioral, and personality correlates of HIV-positive persons’ unsafe sexualbehavior. Journal of Applied Social Psychology, 29, 223–244. doi:10.1111/j.1559-1816.1999.tb01383.x
Received October 5, 2010Revision received December 22, 2010
Accepted January 24, 2011 �
738 HOERGER, QUIRK, AND WEED
DGI 41 Appendix A
Online Supplemental Materials: Figures
Dimension
Resist strong immediate rewards
X X
Sometimes disadvantageous X X
Future time orientation X X
Salient long-term consequences X X
Personality features X X
Ability-like features X X
Figure A1. Hierarchy of self-regulation and related constructs.
Self-Regulation
Homeostatic Processes Self-Control
Impulse Control
Gratification Delay
Ego Resiliency
DGI 42 Appendix A (continued)
Online Supplemental Materials: Figures
.75 1
.63 6
.61 11
.59 16
.56 21
.71 26
.68 31
.75 2
.76 7
.78 12
.74 17
.77 22
.52 27
.71 32
.85 3
.34 8
.47 13
.33 18
.29 23
.46 28
.72 33
.40 4
.44 9
.37 14
.41 19
.43 24
.30 29
.37 34
.47 5
.44 10
.53 15
.54 20
.48 25
.49 30
.49 35
Figure A2. Confirmatory factor analysis for entire worldwide sample.
.50
.61
.62
.64
.67
.54
.56
.50
.49
.47
.51
.48
.70
.54
.39
.81
.73
.82
.84
.74
.53
.78
.75
.79
.77
.75
.84
.79
.73
.75
.69
.68
.72
.71
.71
Food
Physical
Social
Money
Achievement
.49
.49
.75
.36
.38 .64
.46.52
.58
.27
DGI 43 Appendix B
Online Supplemental Materials: Tables
Table B1 Summary of Research Articles Describing Overlap of Five Factors
Year Author(s) Food Physical Social Money Achievement2008 Lee et al. X X 2007 Baumeister et al. X X X X X 2007 Ramanathan & Williams X X X 2006 Nederkoorn et al. X X 2006 Ramanathan & Menon X X X 2004 Bembenutty & Karabenick X X X 2003 Marcus X X 1998 Bembenutty & Karabenick X X X 1994 Baumeister et al. X X X 1988 Mischel et al. X X X 1978 Poggie X X 1966 Phillips X X X X 1955 Singer X X X
Note. Food = delay involving food, Phys = physical delay, Social = delay for social rewards, Money = monetary delay, Ach = delay for achievement
DGI 44 Appendix B (continued)
Online Supplemental Materials: Tables
Table B2
Item Properties in Study 1
Item M SD Food Phys Soc Money Ach Total Food 16 3.27 1.32 .59 .23 .09 .21 .12 .34 21 3.64 1.26 .53 .26 .12 .24 .17 .37 6 2.89 1.31 .49 .31 .16 .29 .27 .43 11 2.69 1.29 .48 .31 .18 .28 .20 .40 31 3.27 1.26 .47 .25 .16 .21 .14 .34 1 3.84 1.34 .42 .28 .17 .25 .21 .38 26 3.11 1.17 .39 .26 .17 .27 .29 .40 Physical 27 2.98 1.32 .30 .49 .25 .39 .48 .54 22 3.55 1.31 .15 .47 .26 .22 .28 .38 12 3.99 1.21 .17 .45 .22 .25 .28 .38 2 3.41 1.13 .32 .38 .18 .23 .28 .40 7 3.13 1.21 .32 .37 .19 .27 .33 .42 32 2.57 1.19 .25 .36 .18 .24 .37 .40 17 3.39 1.19 .25 .29 .25 .21 .36 .42 Social 23 4.09 1.07 .20 .32 .64 .25 .32 .45 8 4.16 0.97 .18 .28 .64 .19 .27 .40 18 3.99 1.01 .18 .31 .64 .19 .32 .43 28 4.07 0.86 .14 .25 .62 .13 .28 .36 13 4.44 0.85 .11 .22 .55 .16 .23 .33 33 4.55 0.71 .09 .13 .43 .06 .18 .23 3 3.48 1.16 .17 .24 .32 .16 .18 .29 Money 29 3.36 1.19 .28 .35 .14 .71 .32 .51 34 3.63 1.21 .30 .31 .17 .71 .23 .48 4 3.64 1.16 .33 .33 .19 .70 .26 .51 14 3.99 0.95 .30 .34 .23 .66 .32 .53 9 3.76 1.28 .30 .33 .16 .61 .21 .46 24 3.77 1.22 .24 .31 .19 .61 .31 .47 19 4.30 1.04 .31 .36 .24 .61 .34 .53 Achievement 10 3.87 1.16 .15 .37 .25 .23 .66 .46 5 3.61 1.24 .17 .37 .28 .23 .63 .46 30 3.76 1.14 .21 .42 .26 .26 .59 .49 25 3.32 1.37 .29 .50 .26 .31 .59 .55 35 4.19 0.98 .20 .41 .26 .23 .56 .47 15 3.13 1.37 .23 .46 .25 .30 .56 .50 20 3.72 1.18 .27 .45 .30 .28 .55 .52
Note. n = 1,900. Values for the Food, Physical, Social, Money, Achievement, and Total columns refer to item-total and corrected item-total correlations. To facilitate visual inspection, correlations greater than magnitude r = .35 are in bold. Items are presented in order of descending corrected item-total correlations by subscale.

DGI 45 Appendix B (continued)
Online Supplemental Materials: Tables
Table B3
Item Properties in Study 2
Item M SD Food Phys Soc Money Ach Total Food 16 3.08 1.32 .50 .20 .09 .17 .14 .30 21 3.93 1.13 .51 .25 .15 .23 .18 .36 6 2.79 1.30 .48 .29 .13 .25 .22 .38 11 2.61 1.25 .48 .30 .16 .28 .16 .38 31 3.36 1.26 .44 .26 .17 .21 .19 .35 1 3.47 1.41 .38 .26 .12 .20 .16 .31 26 3.27 1.21 .42 .33 .21 .31 .34 .45 Physical 27 3.02 1.31 .36 .49 .29 .43 .47 .57 22 3.45 1.27 .11 .46 .25 .26 .25 .35 12 3.96 1.19 .12 .42 .28 .24 .26 .35 2 3.44 1.14 .30 .38 .21 .27 .29 .41 7 2.99 1.24 .36 .31 .20 .26 .35 .42 32 2.34 1.21 .23 .40 .24 .30 .31 .41 17 3.18 1.25 .29 .35 .26 .30 .30 .45 Social 23 4.28 0.92 .17 .34 .67 .28 .33 .46 8 4.16 0.93 .15 .29 .66 .23 .29 .41 18 3.98 0.99 .20 .37 .66 .28 .38 .49 28 4.17 0.82 .16 .30 .61 .20 .32 .41 13 4.54 0.80 .12 .26 .56 .24 .25 .37 33 4.56 0.68 .10 .15 .42 .14 .21 .26 3 3.59 1.14 .20 .27 .33 .22 .20 .33 Money 29 3.54 1.16 .31 .44 .25 .74 .41 .60 34 3.60 1.22 .31 .40 .23 .71 .28 .54 4 3.68 1.26 .29 .36 .23 .70 .26 .51 14 4.08 0.98 .28 .40 .32 .67 .38 .57 9 3.91 1.25 .30 .37 .24 .65 .26 .51 24 3.96 1.19 .26 .36 .27 .65 .36 .53 19 4.35 1.01 .27 .37 .29 .62 .34 .53 Achievement 10 3.90 1.17 .15 .34 .27 .28 .65 .46 5 3.53 1.27 .15 .36 .28 .26 .64 .46 30 3.92 1.06 .24 .39 .31 .33 .59 .52 25 3.39 1.38 .34 .50 .31 .36 .59 .58 35 4.27 0.92 .24 .37 .32 .25 .58 .48 15 3.27 1.34 .23 .45 .29 .31 .59 .52 20 3.77 1.17 .24 .39 .31 .30 .57 .50
Note. n = 7,771. Values for the Food, Physical, Social, Money, Achievement, and Total columns refer to item-total and corrected item-total correlations. To facilitate visual inspection, correlations greater than magnitude r = .35 are in bold. Items are presented in same order as previous table for ease of comparison.
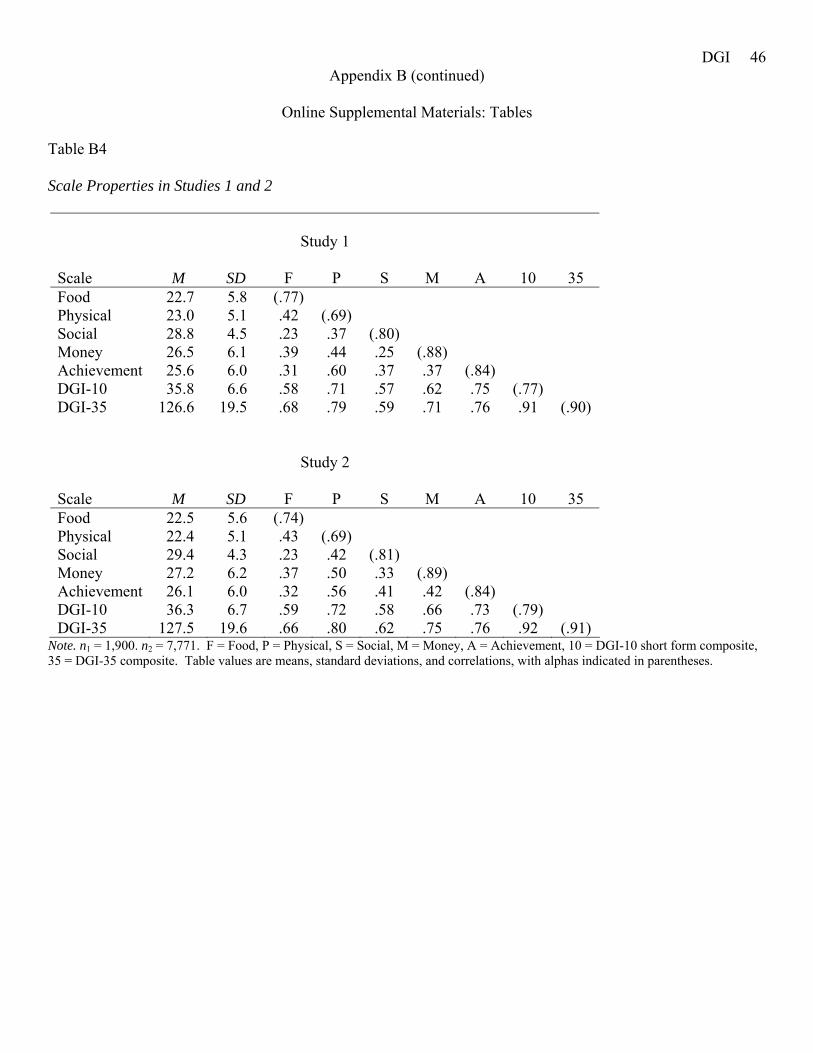
DGI 46 Appendix B (continued)
Online Supplemental Materials: Tables
Table B4 Scale Properties in Studies 1 and 2
Study 1
Scale
M
SD
F
P
S
M
A
10
35
Food 22.7 5.8 (.77) Physical 23.0 5.1 .42 (.69) Social 28.8 4.5 .23 .37 (.80) Money 26.5 6.1 .39 .44 .25 (.88) Achievement 25.6 6.0 .31 .60 .37 .37 (.84) DGI-10 35.8 6.6 .58 .71 .57 .62 .75 (.77) DGI-35 126.6 19.5 .68 .79 .59 .71 .76 .91 (.90)
Study 2
Scale
M
SD
F
P
S
M
A
10
35
Food 22.5 5.6 (.74) Physical 22.4 5.1 .43 (.69) Social 29.4 4.3 .23 .42 (.81) Money 27.2 6.2 .37 .50 .33 (.89) Achievement 26.1 6.0 .32 .56 .41 .42 (.84) DGI-10 36.3 6.7 .59 .72 .58 .66 .73 (.79) DGI-35 127.5 19.6 .66 .80 .62 .75 .76 .92 (.91)
Note. n1 = 1,900. n2 = 7,771. F = Food, P = Physical, S = Social, M = Money, A = Achievement, 10 = DGI-10 short form composite, 35 = DGI-35 composite. Table values are means, standard deviations, and correlations, with alphas indicated in parentheses.
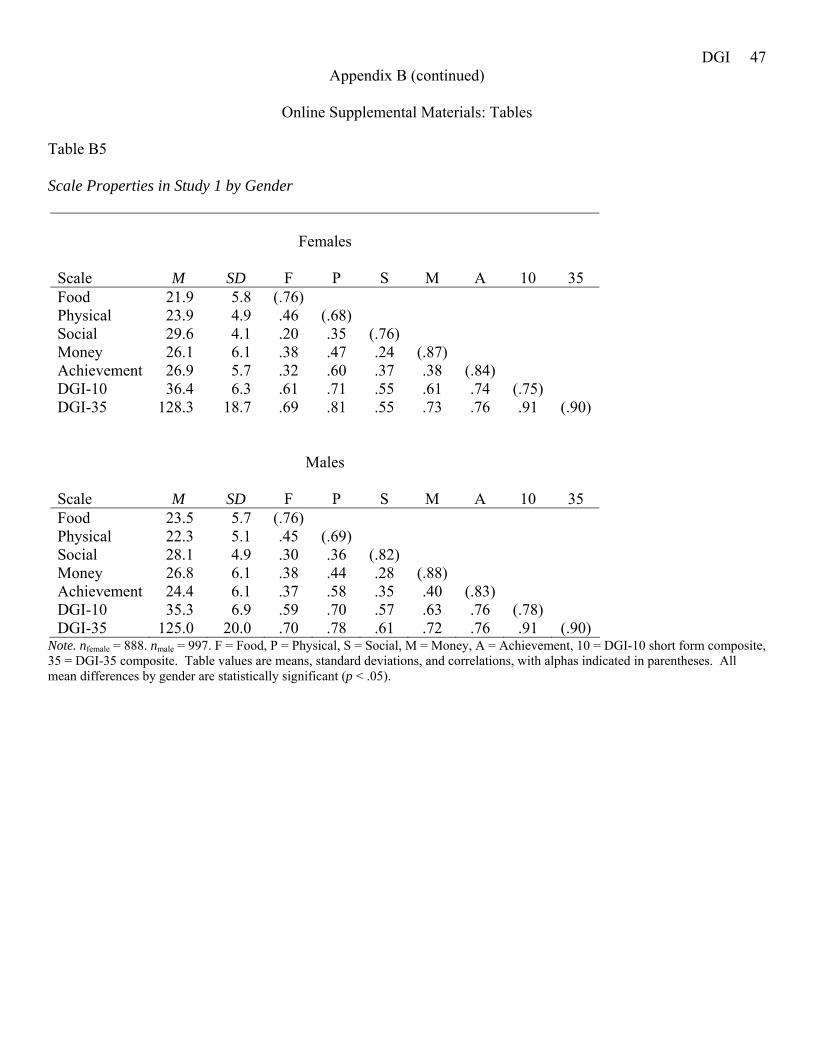
DGI 47 Appendix B (continued)
Online Supplemental Materials: Tables
Table B5 Scale Properties in Study 1 by Gender
Females
Scale
M
SD
F
P
S
M
A
10
35
Food 21.9 5.8 (.76) Physical 23.9 4.9 .46 (.68) Social 29.6 4.1 .20 .35 (.76) Money 26.1 6.1 .38 .47 .24 (.87) Achievement 26.9 5.7 .32 .60 .37 .38 (.84) DGI-10 36.4 6.3 .61 .71 .55 .61 .74 (.75) DGI-35 128.3 18.7 .69 .81 .55 .73 .76 .91 (.90)
Males
Scale
M
SD
F
P
S
M
A
10
35
Food 23.5 5.7 (.76) Physical 22.3 5.1 .45 (.69) Social 28.1 4.9 .30 .36 (.82) Money 26.8 6.1 .38 .44 .28 (.88) Achievement 24.4 6.1 .37 .58 .35 .40 (.83) DGI-10 35.3 6.9 .59 .70 .57 .63 .76 (.78) DGI-35 125.0 20.0 .70 .78 .61 .72 .76 .91 (.90)
Note. nfemale = 888. nmale = 997. F = Food, P = Physical, S = Social, M = Money, A = Achievement, 10 = DGI-10 short form composite, 35 = DGI-35 composite. Table values are means, standard deviations, and correlations, with alphas indicated in parentheses. All mean differences by gender are statistically significant (p < .05).
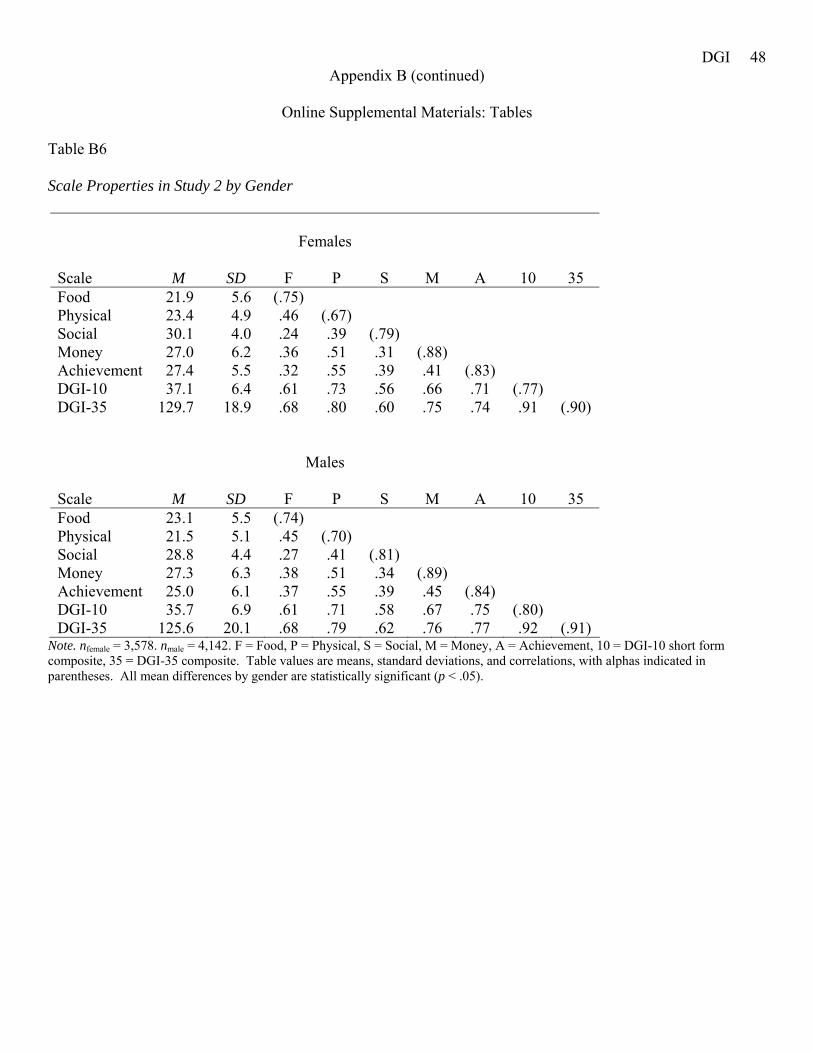
DGI 48 Appendix B (continued)
Online Supplemental Materials: Tables
Table B6 Scale Properties in Study 2 by Gender
Females
Scale
M
SD
F
P
S
M
A
10
35
Food 21.9 5.6 (.75) Physical 23.4 4.9 .46 (.67) Social 30.1 4.0 .24 .39 (.79) Money 27.0 6.2 .36 .51 .31 (.88) Achievement 27.4 5.5 .32 .55 .39 .41 (.83) DGI-10 37.1 6.4 .61 .73 .56 .66 .71 (.77) DGI-35 129.7 18.9 .68 .80 .60 .75 .74 .91 (.90)
Males
Scale
M
SD
F
P
S
M
A
10
35
Food 23.1 5.5 (.74) Physical 21.5 5.1 .45 (.70) Social 28.8 4.4 .27 .41 (.81) Money 27.3 6.3 .38 .51 .34 (.89) Achievement 25.0 6.1 .37 .55 .39 .45 (.84) DGI-10 35.7 6.9 .61 .71 .58 .67 .75 (.80) DGI-35 125.6 20.1 .68 .79 .62 .76 .77 .92 (.91)
Note. nfemale = 3,578. nmale = 4,142. F = Food, P = Physical, S = Social, M = Money, A = Achievement, 10 = DGI-10 short form composite, 35 = DGI-35 composite. Table values are means, standard deviations, and correlations, with alphas indicated in parentheses. All mean differences by gender are statistically significant (p < .05).
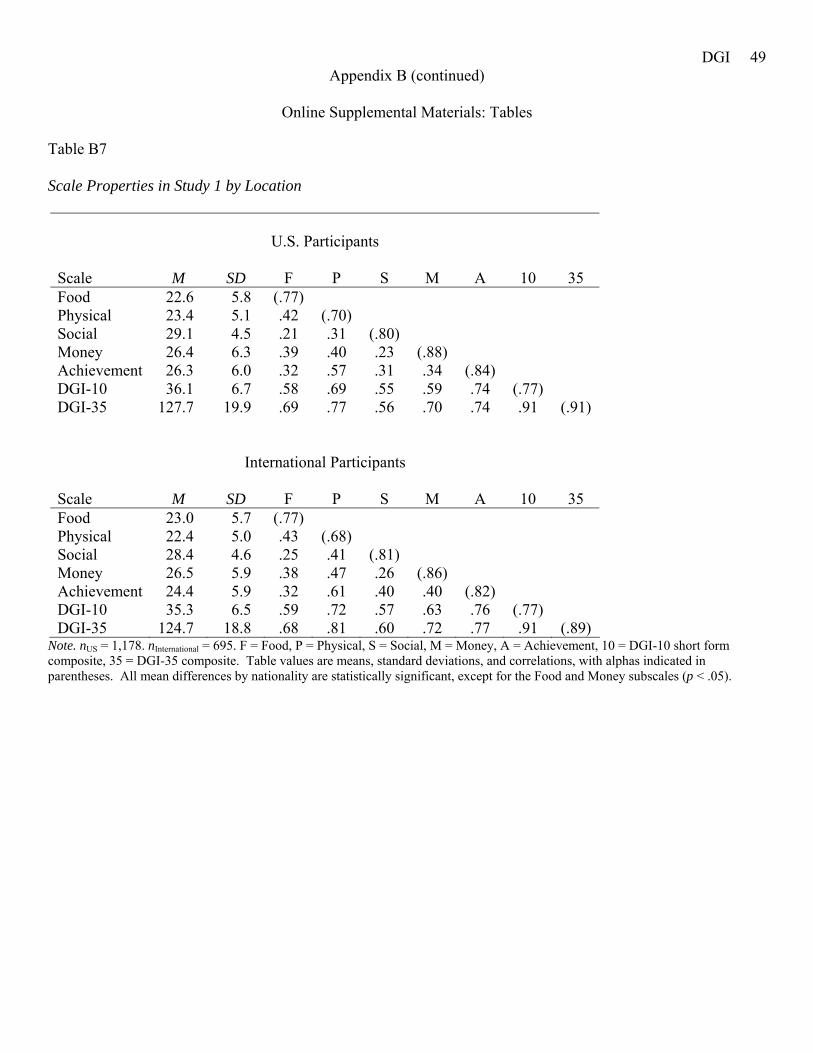
DGI 49 Appendix B (continued)
Online Supplemental Materials: Tables
Table B7 Scale Properties in Study 1 by Location
U.S. Participants
Scale
M
SD
F
P
S
M
A
10
35
Food 22.6 5.8 (.77) Physical 23.4 5.1 .42 (.70) Social 29.1 4.5 .21 .31 (.80) Money 26.4 6.3 .39 .40 .23 (.88) Achievement 26.3 6.0 .32 .57 .31 .34 (.84) DGI-10 36.1 6.7 .58 .69 .55 .59 .74 (.77) DGI-35 127.7 19.9 .69 .77 .56 .70 .74 .91 (.91)
International Participants
Scale
M
SD
F
P
S
M
A
10
35
Food 23.0 5.7 (.77) Physical 22.4 5.0 .43 (.68) Social 28.4 4.6 .25 .41 (.81) Money 26.5 5.9 .38 .47 .26 (.86) Achievement 24.4 5.9 .32 .61 .40 .40 (.82) DGI-10 35.3 6.5 .59 .72 .57 .63 .76 (.77) DGI-35 124.7 18.8 .68 .81 .60 .72 .77 .91 (.89)
Note. nUS = 1,178. nInternational = 695. F = Food, P = Physical, S = Social, M = Money, A = Achievement, 10 = DGI-10 short form composite, 35 = DGI-35 composite. Table values are means, standard deviations, and correlations, with alphas indicated in parentheses. All mean differences by nationality are statistically significant, except for the Food and Money subscales (p < .05).

DGI 50 Appendix B (continued)
Online Supplemental Materials: Tables
Table B8 Scale Properties in Study 2 by Location
U.S. Participants
Scale
M
SD
F
P
S
M
A
10
35
Food 22.2 5.7 (.75) Physical 22.6 5.3 .43 (.71) Social 29.4 4.4 .25 .44 (.81) Money 26.9 6.4 .36 .51 .35 (.89) Achievement 26.8 6.0 .33 .57 .44 .45 (.85) DGI-10 36.4 6.9 .59 .74 .61 .67 .75 (.80) DGI-35 128.0 20.3 .66 .81 .64 .76 .77 .92 (.91)
International Participants
Scale
M
SD
F
P
S
M
A
10
35
Food 22.8 5.4 (.73) Physical 22.2 4.9 .42 (.68) Social 29.3 4.1 .22 .39 (.80) Money 27.4 6.1 .38 .49 .30 (.89) Achievement 25.3 5.9 .32 .56 .38 .40 (.83) DGI-10 36.3 6.6 .59 .71 .56 .65 .73 (.79) DGI-35 127.0 19.0 .67 .79 .60 .75 .76 .91 (.90)
Note. nUS = 3,747. nInternational = 3,903. F = Food, P = Physical, S = Social, M = Money, A = Achievement, 10 = DGI-10 short form composite, 35 = DGI-35 composite. Table values are means, standard deviations, and correlations, with alphas indicated in parentheses. All mean differences by nationality are statistically significant, except for the Social subscale and DGI-10 scale (p < .05).
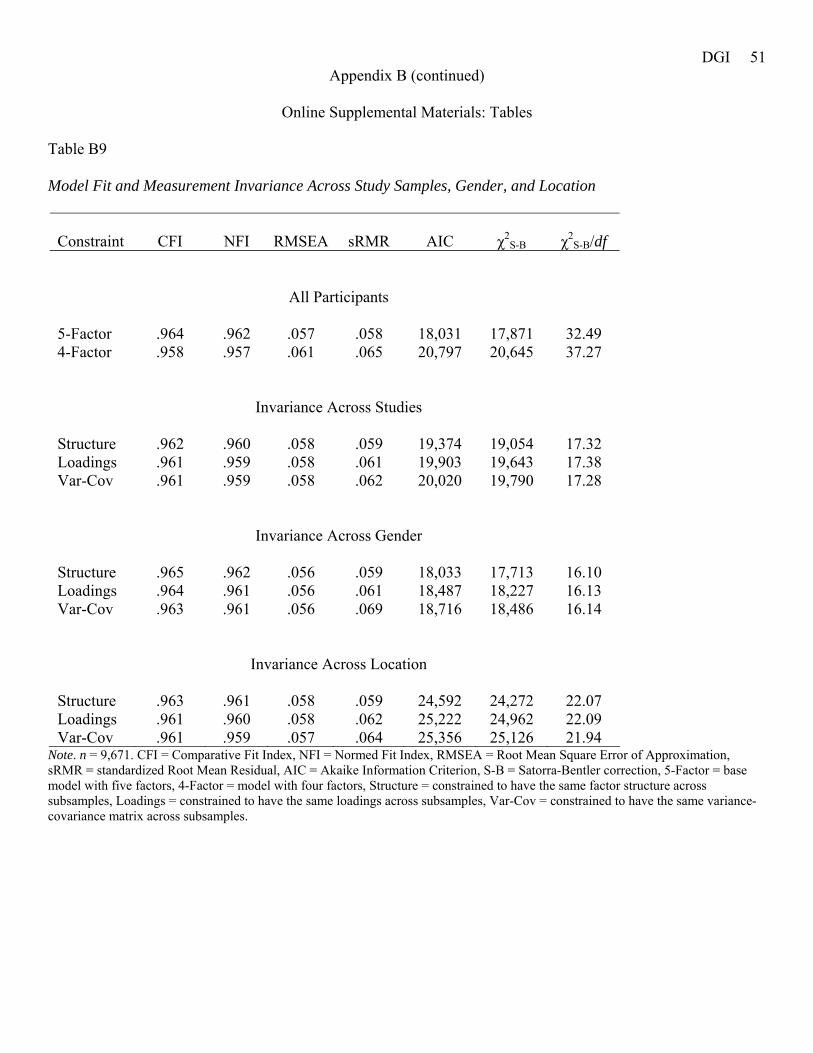
DGI 51 Appendix B (continued)
Online Supplemental Materials: Tables
Table B9 Model Fit and Measurement Invariance Across Study Samples, Gender, and Location
Constraint
CFI
NFI
RMSEA
sRMR
AIC
χ2
S-B
χ2S-B/df
All Participants 5-Factor
.964
.962
.057
.058
18,031
17,871
32.49
4-Factor .958 .957 .061 .065 20,797 20,645 37.27
Invariance Across Studies Structure
.962
.960
.058
.059
19,374
19,054
17.32
Loadings .961 .959 .058 .061 19,903 19,643 17.38 Var-Cov .961 .959 .058 .062 20,020 19,790 17.28
Invariance Across Gender Structure
.965
.962
.056
.059
18,033
17,713
16.10
Loadings .964 .961 .056 .061 18,487 18,227 16.13 Var-Cov .963 .961 .056 .069 18,716 18,486 16.14
Invariance Across Location Structure
.963
.961
.058
.059
24,592
24,272
22.07
Loadings .961 .960 .058 .062 25,222 24,962 22.09 Var-Cov .961 .959 .057 .064 25,356 25,126 21.94
Note. n = 9,671. CFI = Comparative Fit Index, NFI = Normed Fit Index, RMSEA = Root Mean Square Error of Approximation, sRMR = standardized Root Mean Residual, AIC = Akaike Information Criterion, S-B = Satorra-Bentler correction, 5-Factor = base model with five factors, 4-Factor = model with four factors, Structure = constrained to have the same factor structure across subsamples, Loadings = constrained to have the same loadings across subsamples, Var-Cov = constrained to have the same variance-covariance matrix across subsamples.

DGI 52
Appendix B (continued)
Online Supplemental Materials: Tables Table B10 Replication of Correlations between DGI Scores, Trait Descriptor Ratings, and Behavioral Tendency Ratings in Study 3
Measure F P S M A 10 35 Trait Descriptors Moderation .54 .24 .06 .29 .35 .46 .44 Self-Discipline .53 .41 .20 .26 .59 .68 .58 Diligence .51 .44 .21 .37 .65 .60 .64 Conscientiousness .47 .36 .03 .15 .56 .43 .45 Self-Control .22 .24 .27 .33 .20 .37 .37 Extravagance -.08 -.19 -.29 -.63 -.31 -.31 -.46 Immoderation -.59 -.07 -.05 -.32 -.35 -.40 -.42 Achievement-Striving .29 .42 .23 .43 .68 .59 .60 Well-Being .34 .20 .21 .16 .46 .41 .40 Prudence .15 .48 .36 .32 .29 .47 .46 Patience .27 .36 .43 .30 .20 .39 .45 Perceived Health .26 .07 .09 .11 .34 .24 .26 Impulse Control .43 .24 .25 .14 .35 .39 .41 Rebelliousness -.20 -.45 -.49 -.34 -.37 -.56 -.54 Agreeableness .17 .34 .49 .05 .27 .46 .37 Neuroticism -.21 -.21 -.18 .12 -.27 -.27 -.20 Depression -.34 -.19 .01 -.02 -.30 -.26 -.24 Anger -.15 -.09 -.29 -.03 -.09 -.25 -.18 Sensation-Seeking -.26 -.55 -.19 -.40 -.30 -.47 -.49 Altruism .10 .24 .62 .04 .19 .35 .33 Anxiety -.15 .02 .01 .02 -.05 -.10 -.04 Perceived Attractiveness .35 .04 .00 .11 .20 .23 .21 Somatization -.01 .19 -.02 -.07 -.06 .01 .00 Comprehension .22 .34 .18 .26 .27 .31 .37 Excitement-Seeking .19 -.31 -.31 -.21 -.04 -.22 -.19 Perceived Intelligence .21 .18 .09 .18 .11 .23 .23 Risk-Taking .08 -.28 -.31 -.11 -.08 -.24 -.19 Openness to Experience .02 .07 .28 .05 .10 .07 .15 Machiavellianism .14 .03 -.18 -.06 .04 -.04 -.01 Extraversion .05 -.12 .10 -.09 .23 .04 .05 Behavioral Tendency Buy unneeded purchases -.31 -.32 -.15 -.54 -.29 -.38 -.49 Lie or hide the truth -.12 -.26 -.30 -.25 -.37 -.30 -.38 Pay bills on time .10 .17 .17 .37 .37 .32 .35 Bend or break the rules -.19 -.49 -.48 -.43 -.33 -.55 -.56 Eat fast food -.04 -.37 -.22 .01 -.12 -.28 -.20 Exercise .33 .09 -.14 -.16 .33 .30 .12 Help other people -.05 .30 .55 .01 .26 .34 .30 Party excessively -.21 -.47 -.24 -.29 -.25 -.37 -.42

DGI 53 Drink pop / soda .17 -.03 -.33 .02 -.07 -.14 -.06 Smoke cigarettes -.11 -.30 -.31 -.39 -.37 -.41 -.44 Think about sex -.05 -.30 -.27 -.20 -.18 -.29 -.29 Read books .04 .48 .15 .09 .23 .27 .27 Check financial news .33 .16 -.17 .04 .19 .09 .16 Think about food -.39 .03 .09 -.11 .09 -.05 -.09 Gamble -.02 -.23 -.33 -.21 -.11 -.27 -.26 Discuss intellectual topics .15 .08 -.09 .16 .16 .14 .14 Watch television shows -.07 -.06 -.16 .05 -.09 -.14 -.09
Note. n = 64. F = Food, P = Physical, S = Social, M = Money, A = Achievement, 10 = DGI-10 short form composite, 35 = DGI-35 composite. For consistency with manuscript Table 3, items are presented in the same order rather than descending. To facilitate visual inspection, statistically significant correlations are bold (p < .05).