Embed Size (px)
Citation preview
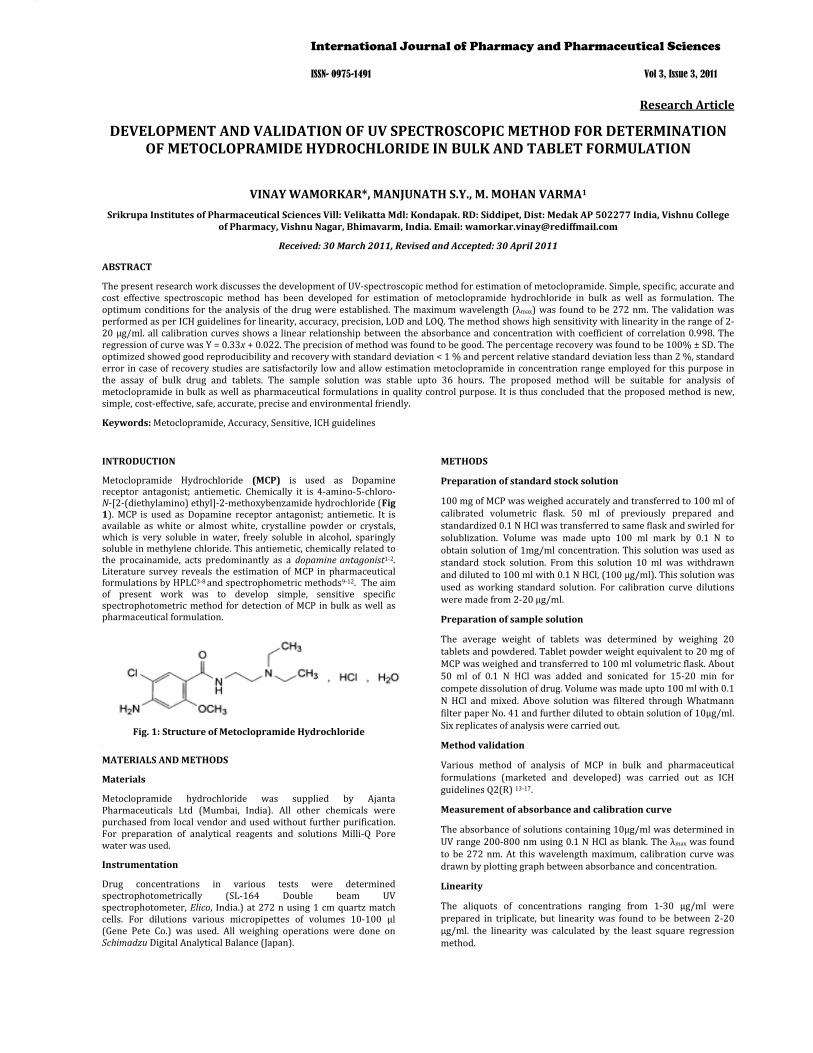
Research Article
DEVELOPMENT AND VALIDATION OF UV SPECTROSCOPIC METHOD FOR DETERMINATION OF METOCLOPRAMIDE HYDROCHLORIDE IN BULK AND TABLET FORMULATION
VINAY WAMORKAR*, MANJUNATH S.Y., M. MOHAN VARMA1 Srikrupa Institutes of Pharmaceutical Sciences Vill: Velikatta Mdl: Kondapak. RD: Siddipet, Dist: Medak AP 502277 India, Vishnu College
of Pharmacy, Vishnu Nagar, Bhimavarm, India. Email: [email protected]
Received: 30 March 2011, Revised and Accepted: 30 April 2011
ABSTRACT
The present research work discusses the development of UV‐spectroscopic method for estimation of metoclopramide. Simple, specific, accurate and cost effective spectroscopic method has been developed for estimation of metoclopramide hydrochloride in bulk as well as formulation. The optimum conditions for the analysis of the drug were established. The maximum wavelength (λmax) was found to be 272 nm. The validation was performed as per ICH guidelines for linearity, accuracy, precision, LOD and LOQ. The method shows high sensitivity with linearity in the range of 2‐20 µg/ml. all calibration curves shows a linear relationship between the absorbance and concentration with coefficient of correlation 0.998. The regression of curve was Y = 0.33x + 0.022. The precision of method was found to be good. The percentage recovery was found to be 100% ± SD. The optimized showed good reproducibility and recovery with standard deviation < 1 % and percent relative standard deviation less than 2 %, standard error in case of recovery studies are satisfactorily low and allow estimation metoclopramide in concentration range employed for this purpose in the assay of bulk drug and tablets. The sample solution was stable upto 36 hours. The proposed method will be suitable for analysis of metoclopramide in bulk as well as pharmaceutical formulations in quality control purpose. It is thus concluded that the proposed method is new, simple, cost‐effective, safe, accurate, precise and environmental friendly.
Keywords: Metoclopramide, Accuracy, Sensitive, ICH guidelines
INTRODUCTION
Metoclopramide Hydrochloride (MCP) is used as Dopamine receptor antagonist; antiemetic. Chemically it is 4‐amino‐5‐chloro‐ N‐[2‐(diethylamino) ethyl]‐2‐methoxybenzamide hydrochloride (Fig 1). MCP is used as Dopamine receptor antagonist; antiemetic. It is available as white or almost white, crystalline powder or crystals, which is very soluble in water, freely soluble in alcohol, sparingly soluble in methylene chloride. This antiemetic, chemically related to the procainamide, acts predominantly as a dopamine antagonist1‐2. Literature survey reveals the estimation of MCP in pharmaceutical formulations by HPLC3‐8 and spectrophometric methods9‐12. The aim of present work was to develop simple, sensitive specific spectrophotometric method for detection of MCP in bulk as well as pharmaceutical formulation.
Fig. 1: Structure of Metoclopramide Hydrochloride [
MATERIALS AND METHODS
Materials
Metoclopramide hydrochloride was supplied by Ajanta Pharmaceuticals Ltd (Mumbai, India). All other chemicals were purchased from local vendor and used without further purification. For preparation of analytical reagents and solutions Milli‐Q Pore water was used.
Instrumentation
Drug concentrations in various tests were determined spectrophotometrically (SL‐164 Double beam UV spectrophotometer, Elico, India.) at 272 n using 1 cm quartz match cells. For dilutions various micropipettes of volumes 10‐100 µl (Gene Pete Co.) was used. All weighing operations were done on Schimadzu Digital Analytical Balance (Japan).
METHODS
Preparation of standard stock solution
100 mg of MCP was weighed accurately and transferred to 100 ml of calibrated volumetric flask. 50 ml of previously prepared and standardized 0.1 N HCl was transferred to same flask and swirled for solublization. Volume was made upto 100 ml mark by 0.1 N to obtain solution of 1mg/ml concentration. This solution was used as standard stock solution. From this solution 10 ml was withdrawn and diluted to 100 ml with 0.1 N HCl, (100 µg/ml). This solution was used as working standard solution. For calibration curve dilutions were made from 2‐20 µg/ml.
Preparation of sample solution
The average weight of tablets was determined by weighing 20 tablets and powdered. Tablet powder weight equivalent to 20 mg of MCP was weighed and transferred to 100 ml volumetric flask. About 50 ml of 0.1 N HCl was added and sonicated for 15‐20 min for compete dissolution of drug. Volume was made upto 100 ml with 0.1 N HCl and mixed. Above solution was filtered through Whatmann filter paper No. 41 and further diluted to obtain solution of 10µg/ml. Six replicates of analysis were carried out.
Method validation
Various method of analysis of MCP in bulk and pharmaceutical formulations (marketed and developed) was carried out as ICH guidelines Q2(R) 13‐17.
Measurement of absorbance and calibration curve
The absorbance of solutions containing 10µg/ml was determined in UV range 200‐800 nm using 0.1 N HCl as blank. The λmax was found to be 272 nm. At this wavelength maximum, calibration curve was drawn by plotting graph between absorbance and concentration.
Linearity
The aliquots of concentrations ranging from 1‐30 µg/ml were prepared in triplicate, but linearity was found to be between 2‐20 µg/ml. the linearity was calculated by the least square regression method.
International Journal of Pharmacy and Pharmaceutical Sciences
ISSN- 0975-1491 Vol 3, Issue 3, 2011
Wamorkar et al. Int J Pharm Pharm Sci, Vol 3, Issue 3, 2011, 171174
172
Precision and accuracy
Precision is degree of repeatability of an analytical method under normal operation conditions. The precision and accuracy were determined with standard quality control samples prepared in triplicate at different concentration levels covering the entire linearity range. The precision of assay was determined by repeatability (intraday), intermediate precision (inter‐day) and reported as %RSD for a statistically significant number of replicate measurements. The intermediate precision was studied by comparing the assay on three different days and the results are documented as the standard deviation and %RSD. Accuracy is the percentage of analyte recovered by assay from known added amount. Data from nine determinations over three concentration levels covering the specified range were obtained.
LOD and LOQ
The limit of detection (LOD) is defined as the lowest concentration of an analyte that an analytical process can reliably differentiate from back‐ground levels. In this study LOD and LOQ were based on the standard deviation of response and the slope of corresponding curve using following equation:
LOD = 3.3 σ/ S
Where σ is standard deviation of Y‐intercept and S is slope of calibration curve.
The limit of quantification (LOQ) is defined as the lowest concentration of calibration curve that can be measured with an acceptable accuracy, precision and variability. The value of LOQ was determined using following equation:
LOQ = = 10 σ/ S
Recovery study
Recovery of the analyte of interest from a given matrix can be used as a measure of the accuracy or the bias of the method. The same range of concentrations, as employed in the linearity studies, was used. To study the accuracy, precision and reproducibility of the proposed method and dosage forms, recovery experiments were carried out using the standard addition method. These studies were performed by the addition of known amounts of pure MCP to the pre‐analyzed tablet formulation and the mixtures were analyzed using the proposed techniques. After parallel analyses, the recovery results were calculated using the related calibration equations.
Stability studies
The stability of RIS in 0.1N HCL solution was studied by the UV method. Sample solutions were prepared in triplicate and stored at 4 and 25°C for 3 days.
RESULTS AND DISCUSSION
The development of a simple, rapid, sensitive and accurate analytical method for the routine quantitative determination of samples will reduce unnecessary tedious sample preparations and the cost of materials and labor. In the start of the method development for this drug, different solvents were tested such as water, methanol, 0.1N HCl, 0.1N NaOH and Phosphate buffer (pH7.4). Due to greater solubility and reproducible readings of maximum absorbance, 0.1 N HCl was taken under consideration for further work.
MCP is a UV‐absorbing molecule with specific chromophores in the structure that absorb at a particular wavelength and this fact was successfully employed for their quantitative determinations using the UV spectrophotometric method. The λmax of the drug for analysis was determined by taking scans of the drug sample solutions in the entire UV region. It was found to be that only one peak was observed in this method at the wavelength of 272 nm.
Calibration curves
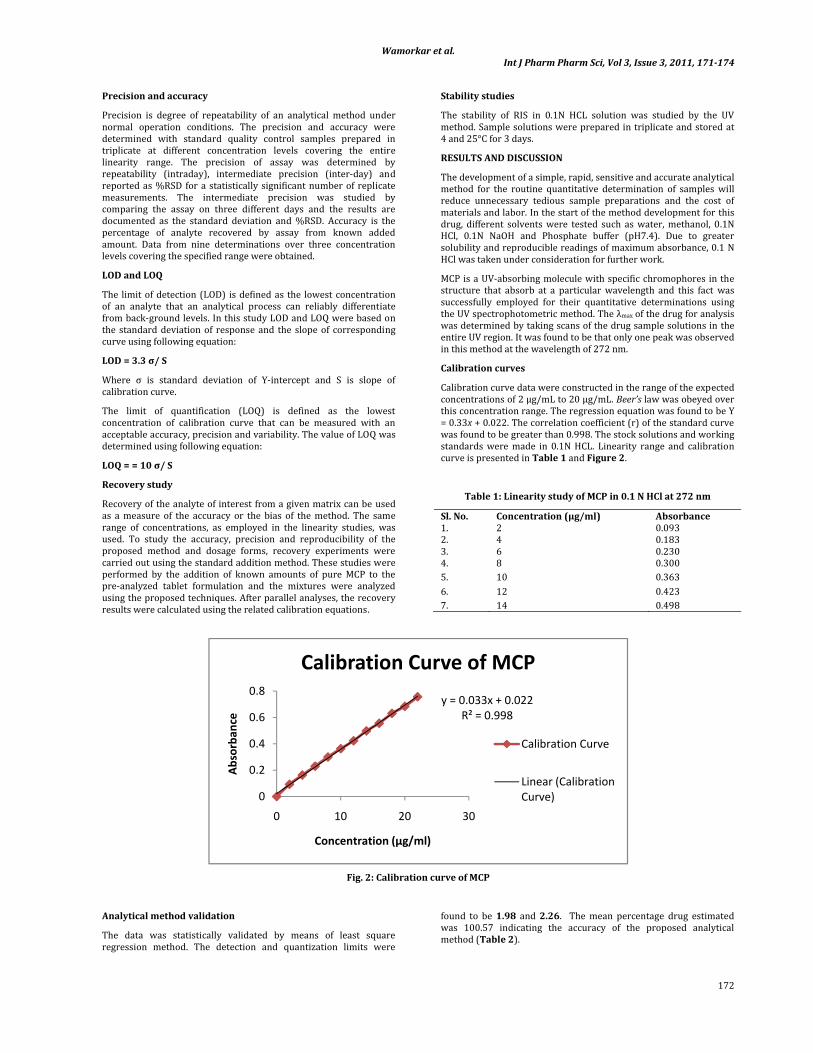
Calibration curve data were constructed in the range of the expected concentrations of 2 µg/mL to 20 µg/mL. Beer’s law was obeyed over this concentration range. The regression equation was found to be Y = 0.33x + 0.022. The correlation coefficient (r) of the standard curve was found to be greater than 0.998. The stock solutions and working standards were made in 0.1N HCL. Linearity range and calibration curve is presented in Table 1 and Figure 2.
Table 1: Linearity study of MCP in 0.1 N HCl at 272 nm
Sl. No. Concentration (µg/ml) Absorbance 1. 2 0.0932. 4 0.183 3. 6 0.230 4. 8 0.3005. 10 0.3636. 12 0.423 7. 14 0.498
Fig. 2: Calibration curve of MCP
Analytical method validation
The data was statistically validated by means of least square regression method. The detection and quantization limits were
found to be 1.98 and 2.26. The mean percentage drug estimated was 100.57 indicating the accuracy of the proposed analytical method (Table 2).
y = 0.033x + 0.022R² = 0.998
0
0.2
0.4
0.6
0.8
0 10 20 30
Absorba
nce
Concentration (µg/ml)
Calibration Curve of MCP
Calibration Curve
Linear (Calibration Curve)
Wamorkar et al. Int J Pharm Pharm Sci, Vol 3, Issue 3, 2011, 171174
173
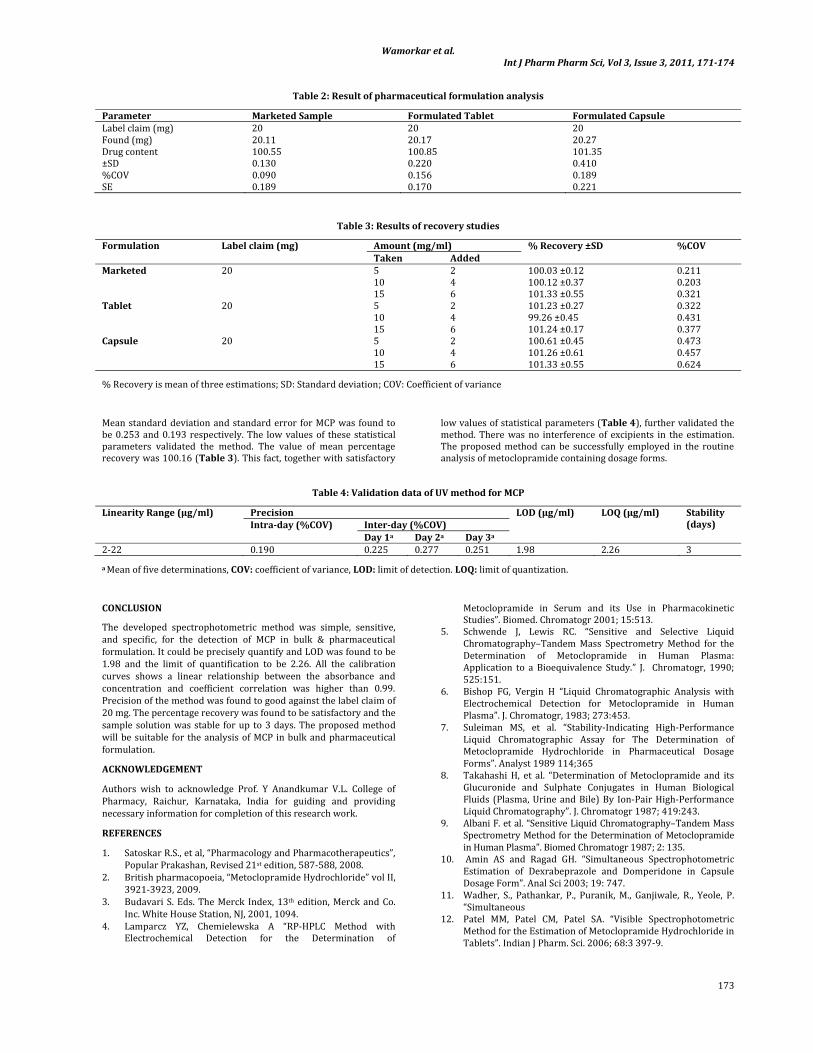
Table 2: Result of pharmaceutical formulation analysis
Parameter Marketed Sample Formulated Tablet Formulated Capsule Label claim (mg) 20 20 20 Found (mg) 20.11 20.17 20.27 Drug content 100.55 100.85 101.35 ±SD 0.130 0.220 0.410 %COV 0.090 0.156 0.189 SE 0.189 0.170 0.221
Table 3: Results of recovery studies
Formulation Label claim (mg) Amount (mg/ml) % Recovery ±SD %COV Taken Added
Marketed 20 5 2 100.03 ±0.12 0.211 10 4 100.12 ±0.37 0.203 15 6 101.33 ±0.55 0.321
Tablet 20 5 2 101.23 ±0.27 0.32210 4 99.26 ±0.45 0.431 15 6 101.24 ±0.17 0.377
Capsule 20 5 2 100.61 ±0.45 0.47310 4 101.26 ±0.61 0.45715 6 101.33 ±0.55 0.624
% Recovery is mean of three estimations; SD: Standard deviation; COV: Coefficient of variance
Mean standard deviation and standard error for MCP was found to be 0.253 and 0.193 respectively. The low values of these statistical parameters validated the method. The value of mean percentage recovery was 100.16 (Table 3). This fact, together with satisfactory
low values of statistical parameters (Table 4), further validated the method. There was no interference of excipients in the estimation. The proposed method can be successfully employed in the routine analysis of metoclopramide containing dosage forms.
Table 4: Validation data of UV method for MCP
Linearity Range (µg/ml) Precision LOD (µg/ml) LOQ (µg/ml) Stability (days) Intraday (%COV) Interday (%COV)
Day 1a Day 2a Day 3a 2‐22 0.190 0.225 0.277 0.251 1.98 2.26 3
a Mean of five determinations, COV: coefficient of variance, LOD: limit of detection. LOQ: limit of quantization.
CONCLUSION
The developed spectrophotometric method was simple, sensitive, and specific, for the detection of MCP in bulk & pharmaceutical formulation. It could be precisely quantify and LOD was found to be 1.98 and the limit of quantification to be 2.26. All the calibration curves shows a linear relationship between the absorbance and concentration and coefficient correlation was higher than 0.99. Precision of the method was found to good against the label claim of 20 mg. The percentage recovery was found to be satisfactory and the sample solution was stable for up to 3 days. The proposed method will be suitable for the analysis of MCP in bulk and pharmaceutical formulation.
ACKNOWLEDGEMENT
Authors wish to acknowledge Prof. Y Anandkumar V.L. College of Pharmacy, Raichur, Karnataka, India for guiding and providing necessary information for completion of this research work.
REFERENCES
1. Satoskar R.S., et al, “Pharmacology and Pharmacotherapeutics”, Popular Prakashan, Revised 21st edition, 587‐588, 2008.
2. British pharmacopoeia, “Metoclopramide Hydrochloride” vol II, 3921‐3923, 2009.
3. Budavari S. Eds. The Merck Index, 13th edition, Merck and Co. Inc. White House Station, NJ, 2001, 1094.
4. Lamparcz YZ, Chemielewska A “RP‐HPLC Method with Electrochemical Detection for the Determination of
Metoclopramide in Serum and its Use in Pharmacokinetic Studies”. Biomed. Chromatogr 2001; 15:513.
5. Schwende J, Lewis RC. “Sensitive and Selective Liquid Chromatography–Tandem Mass Spectrometry Method for the Determination of Metoclopramide in Human Plasma: Application to a Bioequivalence Study.” J. Chromatogr, 1990; 525:151.
6. Bishop FG, Vergin H “Liquid Chromatographic Analysis with Electrochemical Detection for Metoclopramide in Human Plasma”. J. Chromatogr, 1983; 273:453.
7. Suleiman MS, et al. “Stability‐Indicating High‐Performance Liquid Chromatographic Assay for The Determination of Metoclopramide Hydrochloride in Pharmaceutical Dosage Forms”. Analyst 1989 114;365
8. Takahashi H, et al. “Determination of Metoclopramide and its Glucuronide and Sulphate Conjugates in Human Biological Fluids (Plasma, Urine and Bile) By Ion‐Pair High‐Performance Liquid Chromatography”. J. Chromatogr 1987; 419:243.
9. Albani F. et al. “Sensitive Liquid Chromatography–Tandem Mass Spectrometry Method for the Determination of Metoclopramide in Human Plasma”. Biomed Chromatogr 1987; 2: 135.
10. Amin AS and Ragad GH. “Simultaneous Spectrophotometric Estimation of Dexrabeprazole and Domperidone in Capsule Dosage Form”. Anal Sci 2003; 19: 747.
11. Wadher, S., Pathankar, P., Puranik, M., Ganjiwale, R., Yeole, P. “Simultaneous
12. Patel MM, Patel CM, Patel SA. “Visible Spectrophotometric Method for the Estimation of Metoclopramide Hydrochloride in Tablets”. Indian J Pharm. Sci. 2006; 68:3 397‐9.
Wamorkar et al. Int J Pharm Pharm Sci, Vol 3, Issue 3, 2011, 171174
174
13. ICH, QIA Stability Testing of New Drug Substances and Products, Int. Conf on Harmonization, Geresa, November 1996.
14. J.M. Green. “A Practical Guide to Analytical Method Validation”, Anal. Chem. News and Features, 305A – 309A 1996.
15. Wegscheider, “Validation of Analytical Methods, in: Accreditation and Quality Assurance in Analytical Chemistry”, H. Guenzler, Springer (Ed.) Verlag, Berlin 1996.
16. J. Vessman, “Selectivity or Specificity? Validation of Analytical Methods from the Perspective of an Analytical Chemist in the
Pharmaceutical Industry”, J. Pharm and Biomed. Anal., 1996; 14, 867 – 869.
17. G.C. Hokanson, “A Life Cycle Approach to the Validation of Analytical Methods during Pharmaceutical Product Development, Part–II: Changes and the Need for Additional Validation”, Pharm. Tech., 1994: 92 ‐100.
18. Spectrophotometric Estimation of Paracetamol and Metoclopramide Hydrochloride in Solid Dosage Form.” Indian J Pharm Sci. 2008; 70(3): 393‐5.