Embed Size (px)
Citation preview
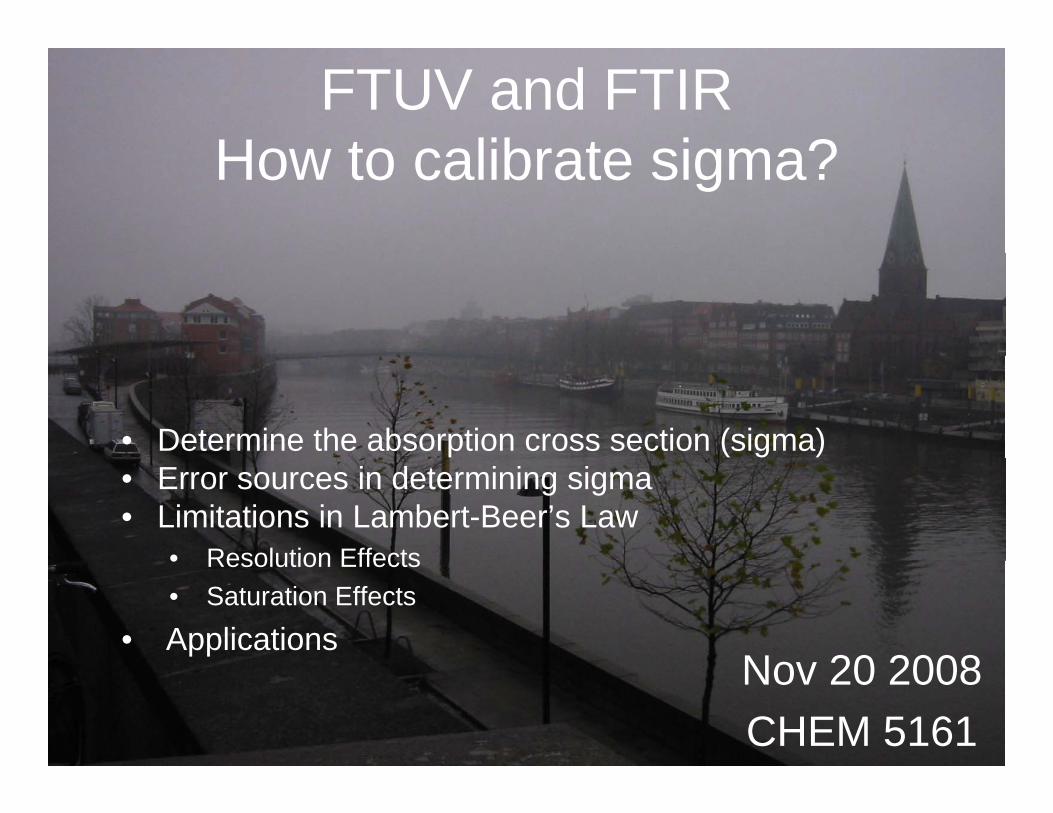
FTUV and FTIRHow to calibrate sigma?How to calibrate sigma?
• Determine the absorption cross section (sigma)• Error sources in determining sigma• Limitations in Lambert-Beer’s Law
• Resolution Effects• Resolution Effects• Saturation Effects
• ApplicationsNov 20 2008Nov 20 2008CHEM 5161
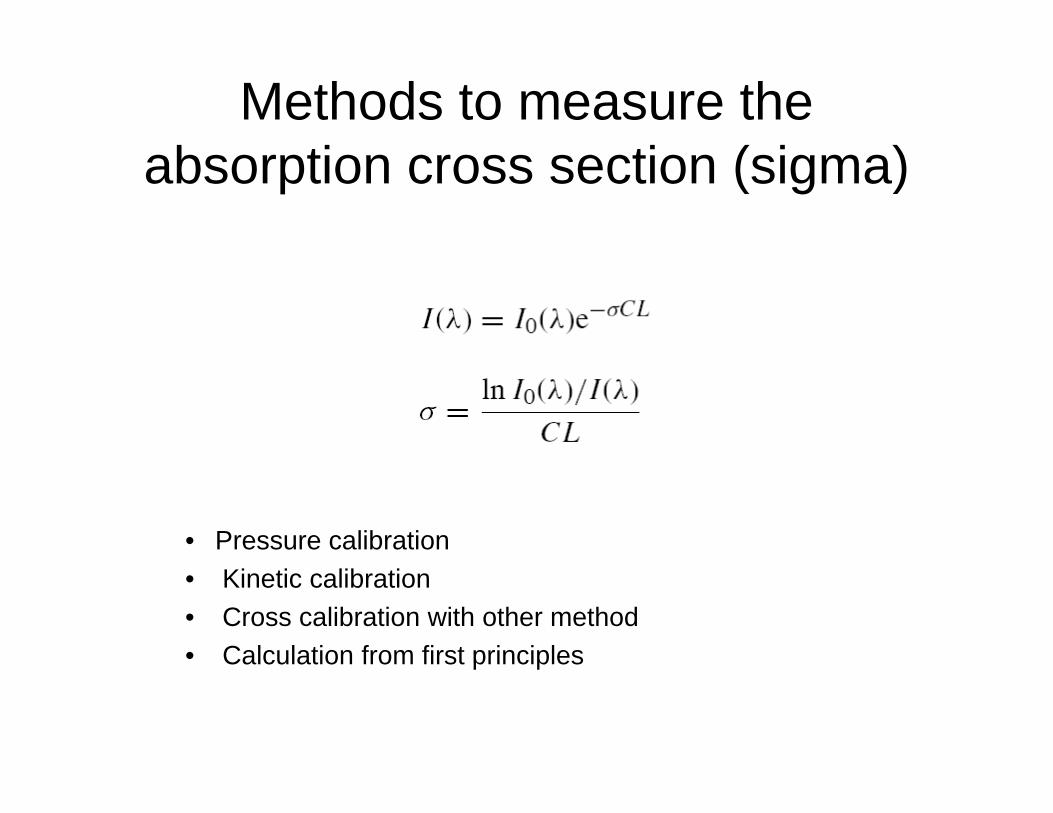
Methods to measure the b ti ti ( i )absorption cross section (sigma)
• Pressure calibration• Kinetic calibration• Cross calibration with other method• Calculation from first principlesCalculation from first principles
Glyoxal (CHOCHO) background• Unstable molecule: Cuvet spectra not practicle• Wavelength calibration is not well known• Wavelength calibration is not well known • Only low resolution spectra are available
• instrument function unknowninstrument function unknown• limits sensitivity• limits selectivity (NO2, Xe-lamp, Fraunhofer lines)limits selectivity (NO2, Xe lamp, Fraunhofer lines)
• Nonlinearities have been reported (but not yet explained)• up to 50% scatter in cross section valuesp %• Intercalibration of DOAS, FTIR, TDL, CDR not yet feasible
⇒ High resolution sigma (UV/Vis and IR)⇒ Good wavelength calibration
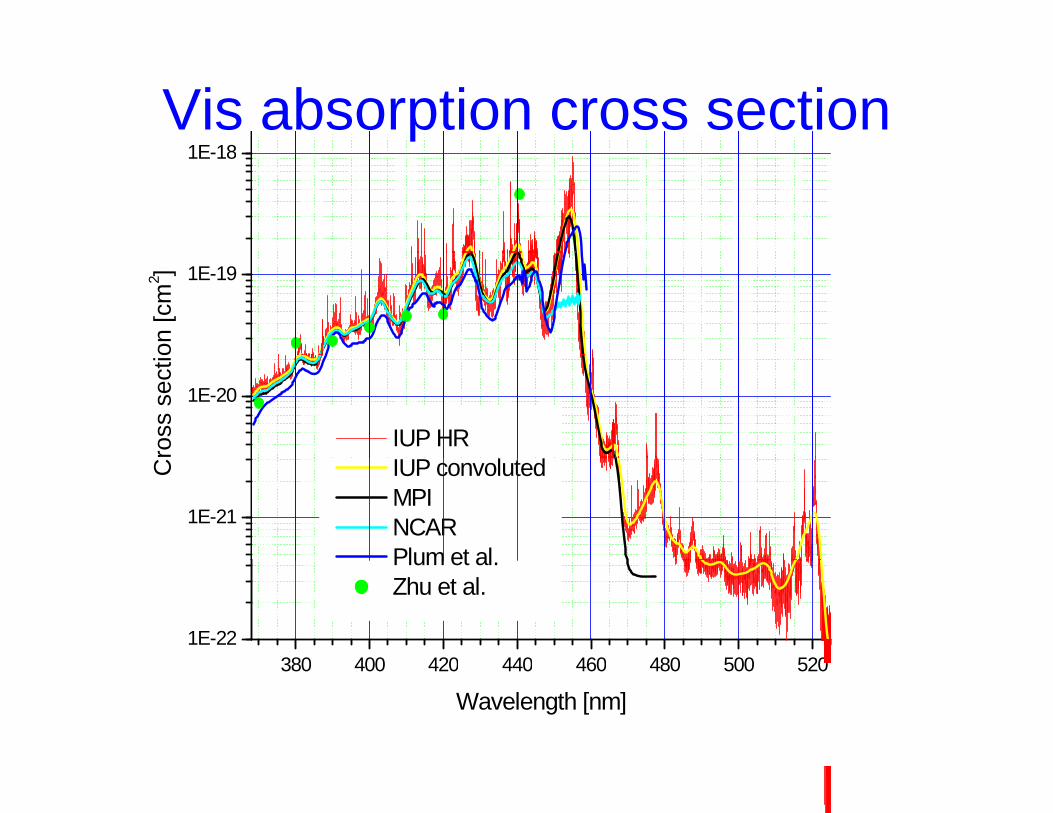
Vis absorption cross section1E 181E-18
1E-19
on [c
m2 ]
1E-20
IUP HRross
sec
ti
1E-21
IUP convoluted MPI NCARPlum et al
C
380 400 420 440 460 480 500 5201E-22
Plum et al. Zhu et al.
380 400 420 440 460 480 500 520
Wavelength [nm]
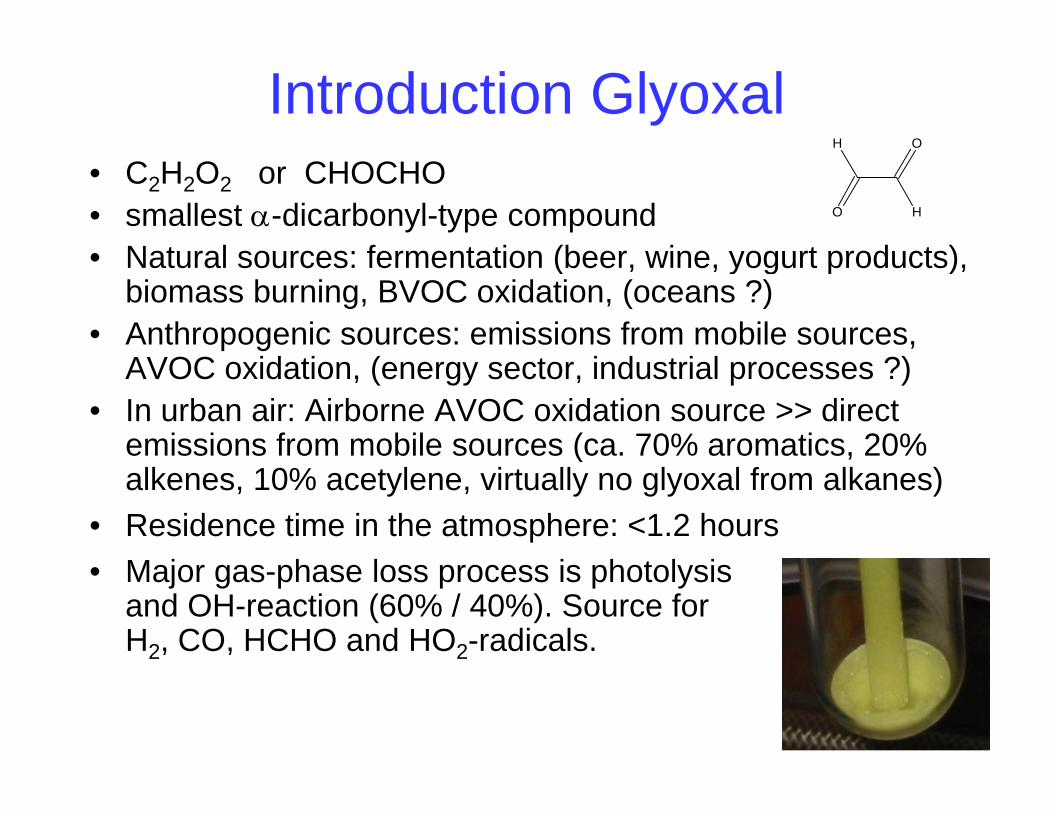
Introduction GlyoxalOH
• C2H2O2 or CHOCHO• smallest α-dicarbonyl-type compound• Natural sources: fermentation (beer wine yogurt products)
O H
• Natural sources: fermentation (beer, wine, yogurt products), biomass burning, BVOC oxidation, (oceans ?)
• Anthropogenic sources: emissions from mobile sources, AVOC oxidation, (energy sector, industrial processes ?)
• In urban air: Airborne AVOC oxidation source >> direct emissions from mobile sources (ca. 70% aromatics, 20% ( ,alkenes, 10% acetylene, virtually no glyoxal from alkanes)
• Residence time in the atmosphere: <1.2 hoursM j h l i h t l i• Major gas-phase loss process is photolysis and OH-reaction (60% / 40%). Source for H2, CO, HCHO and HO2-radicals.
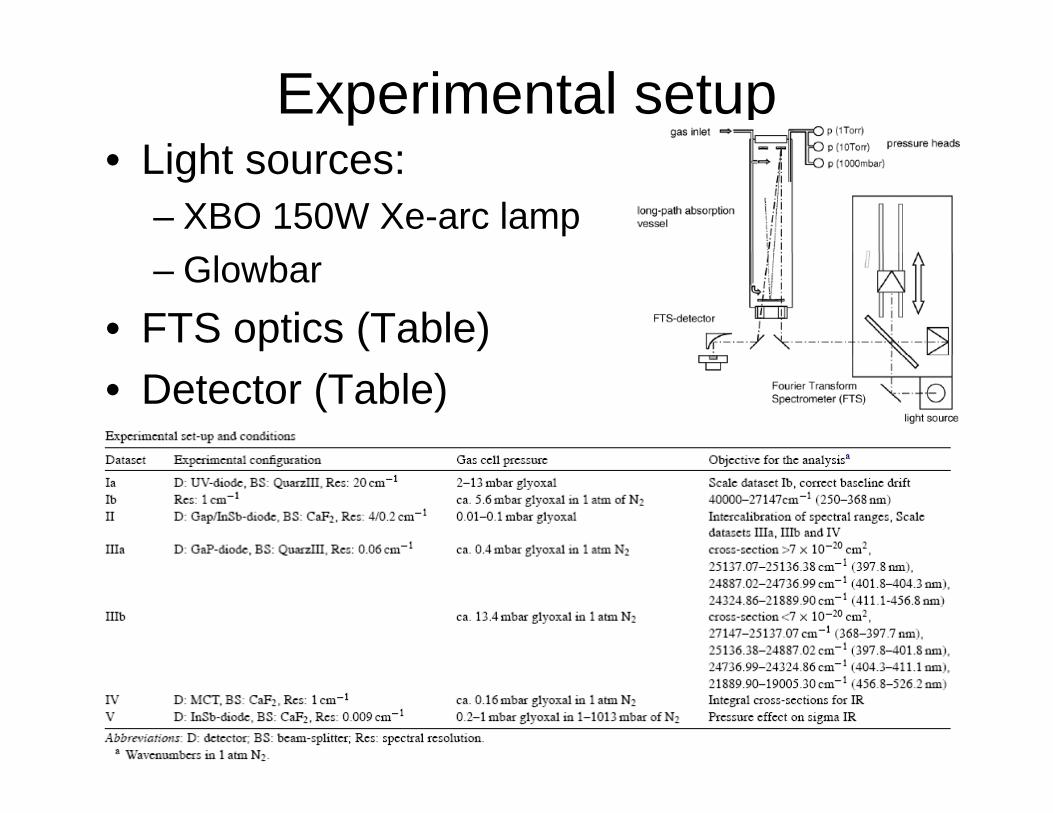
Experimental setupLi ht• Light sources:– XBO 150W Xe-arc lamp– Glowbar
• FTS optics (Table)• Detector (Table)
Experimental conditions• White-cell coupled to the Bruker FTS 120 HR
absorption path: L = 163 cmabsorption path: L 163 cmGlyoxal pressure: 0.005 – 13 mbar (MKS Baratrons)
• Low resolution measurements:short integration times (10 min)Linearity of Lambert-beers law was demonstratedIR and UV integral cross-sections were simultaneously determinedIR and UV integral cross sections were simultaneously determined
• High resolution measurements:long integration times (12 hours)IR spectra: unapodized spectral resolution of 0.009 cm-1
UV spectra: unapodized spectral resolution of 0.06 cm-1
high S/N levelhigh S/N level• Wavenumber accuracy checked from NO2 spectra, linked to I2 spectra
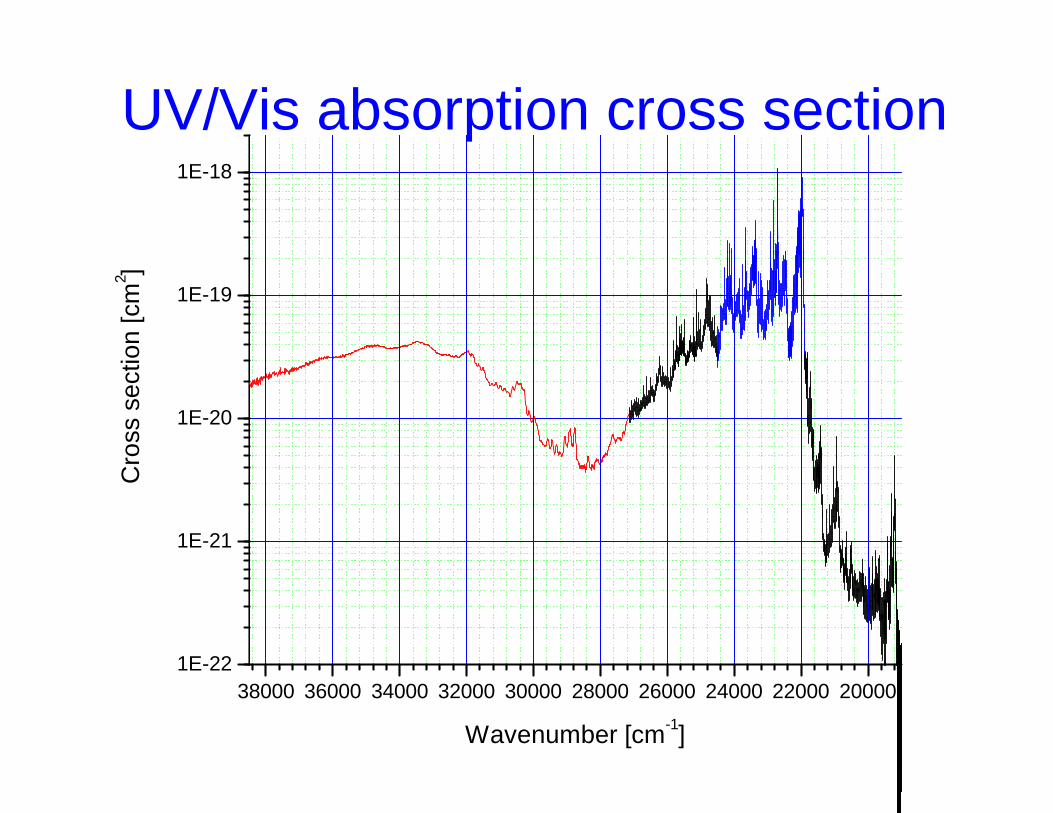
UV/Vis absorption cross section1E-18
1E-19
on [c
m2 ]
1E-20
ross
sec
tio
1E-21
Cr
1E 2238000 36000 34000 32000 30000 28000 26000 24000 22000 20000
1E-22
Wavenumber [cm-1]
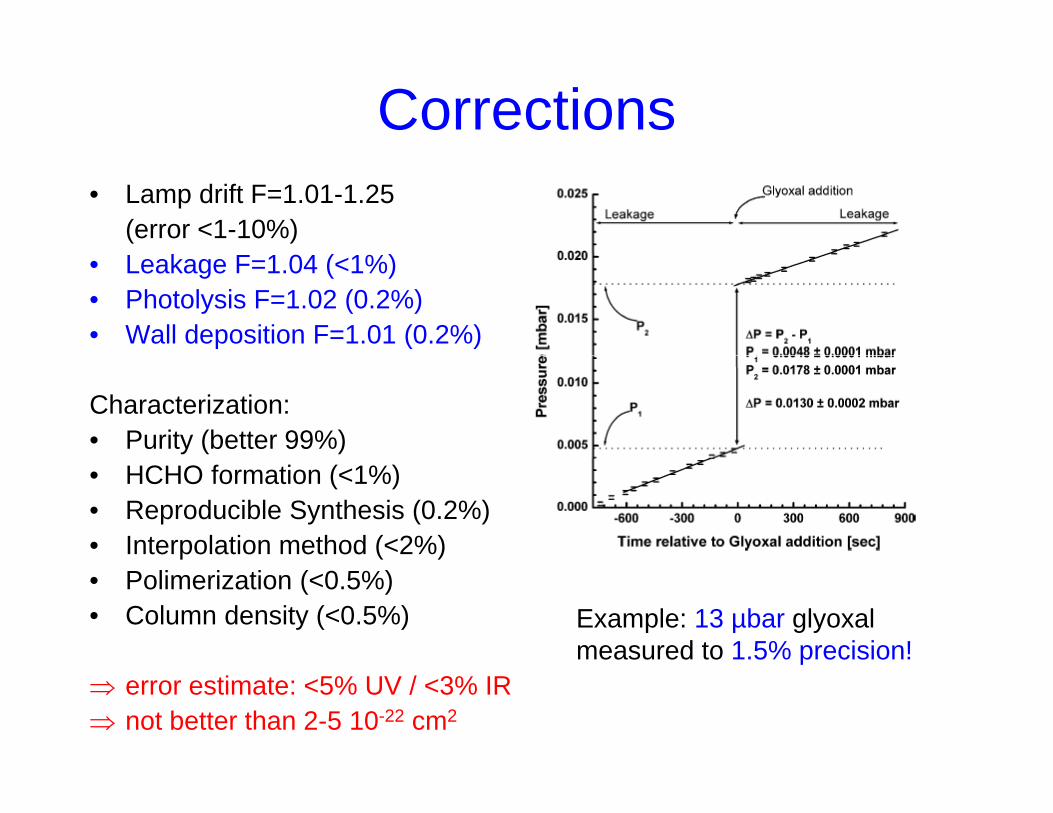
Corrections• Lamp drift F=1.01-1.25
(error <1-10%)• Leakage F=1.04 (<1%)• Photolysis F=1.02 (0.2%)• Wall deposition F=1.01 (0.2%)
Characterization:• Purity (better 99%)• HCHO formation (<1%) • Reproducible Synthesis (0.2%)• Interpolation method (<2%)
Example: 13 µbar glyoxal measured to 1.5% precision!
• Polimerization (<0.5%)• Column density (<0.5%)
p⇒ error estimate: <5% UV / <3% IR⇒ not better than 2-5 10-22 cm2
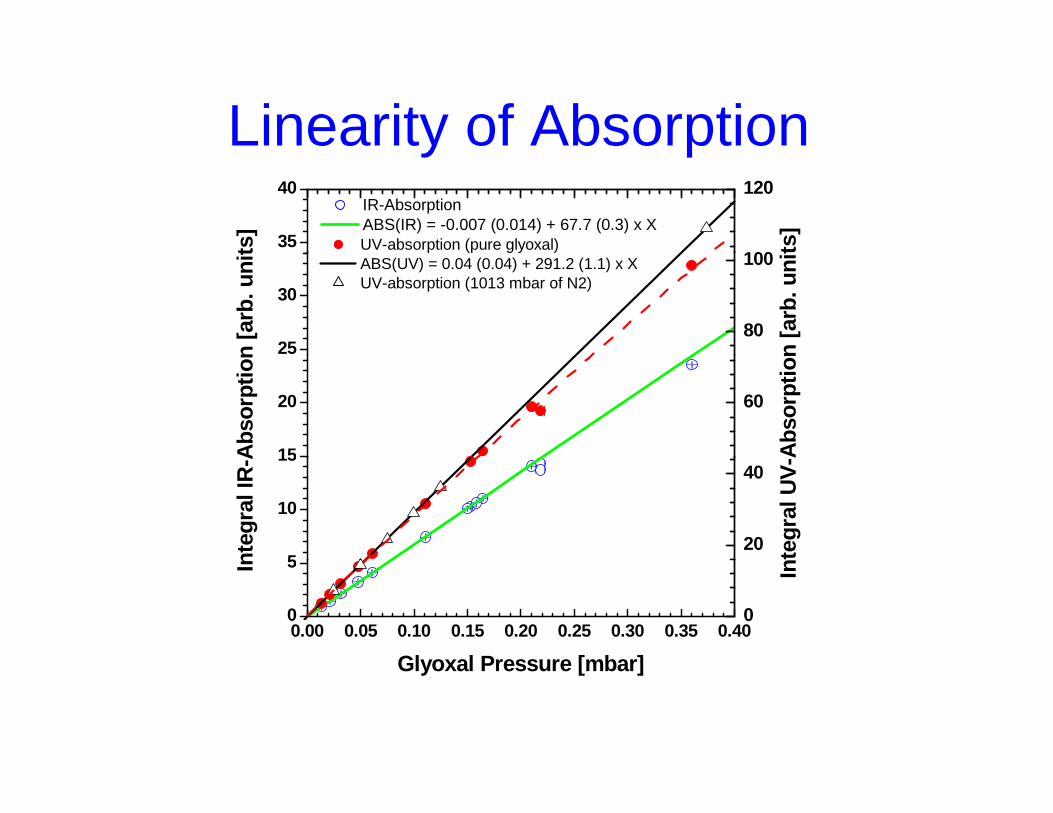
Linearity of Absorptiony p
35
40
ts]
IR-Absorption ABS(IR) = -0.007 (0.014) + 67.7 (0.3) x X
ts]
100
120
UV-absorption (pure glyoxal)
25
30
n [a
rb. u
nit
n [a
rb. u
nit
80
100( g y )
ABS(UV) = 0.04 (0.04) + 291.2 (1.1) x X UV-absorption (1013 mbar of N2)
15
20
Abso
rptio
n
Abso
rptio
n
60
5
10
15
nteg
ral U
V-A
nteg
ral I
R-A
20
40
0.00 0.05 0.10 0.15 0.20 0.25 0.30 0.35 0.400
5 InIn
Glyoxal Pressure [mbar]
0
Glyoxal Pressure [mbar]
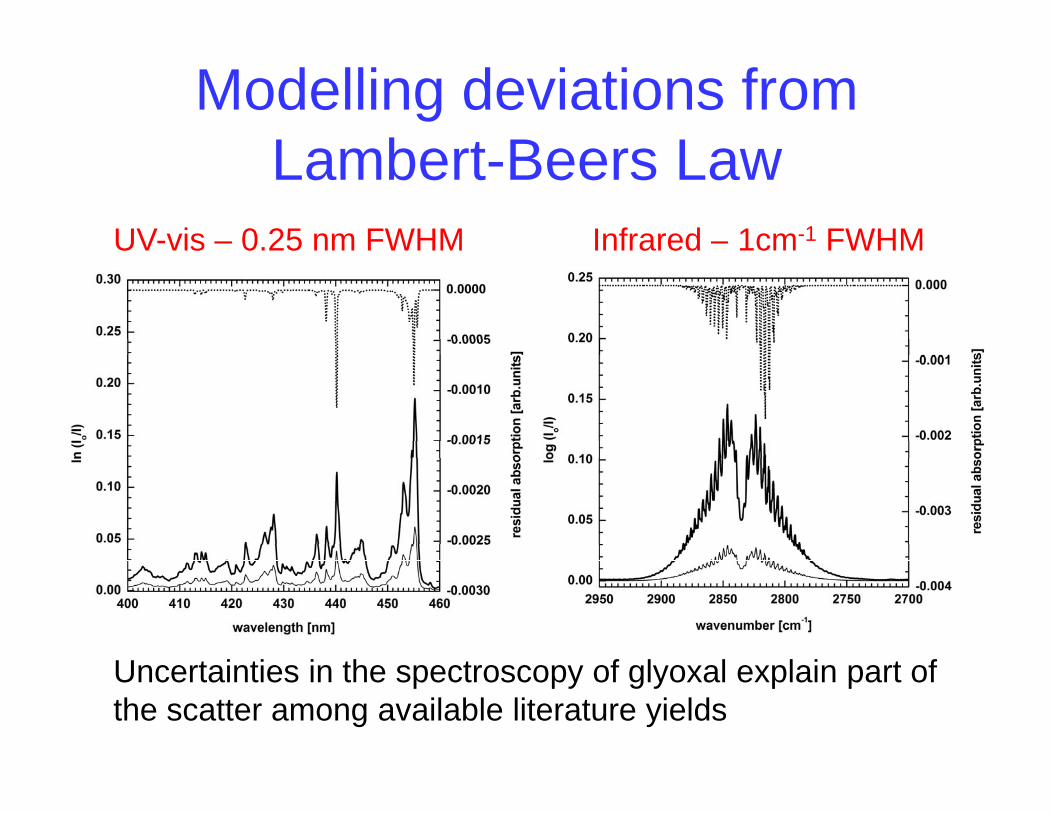
Modelling deviations from Lambert Beers LawLambert-Beers Law
UV-vis – 0.25 nm FWHM Infrared – 1cm-1 FWHM
U t i ti i th t f l l l i t fUncertainties in the spectroscopy of glyoxal explain part of the scatter among available literature yields
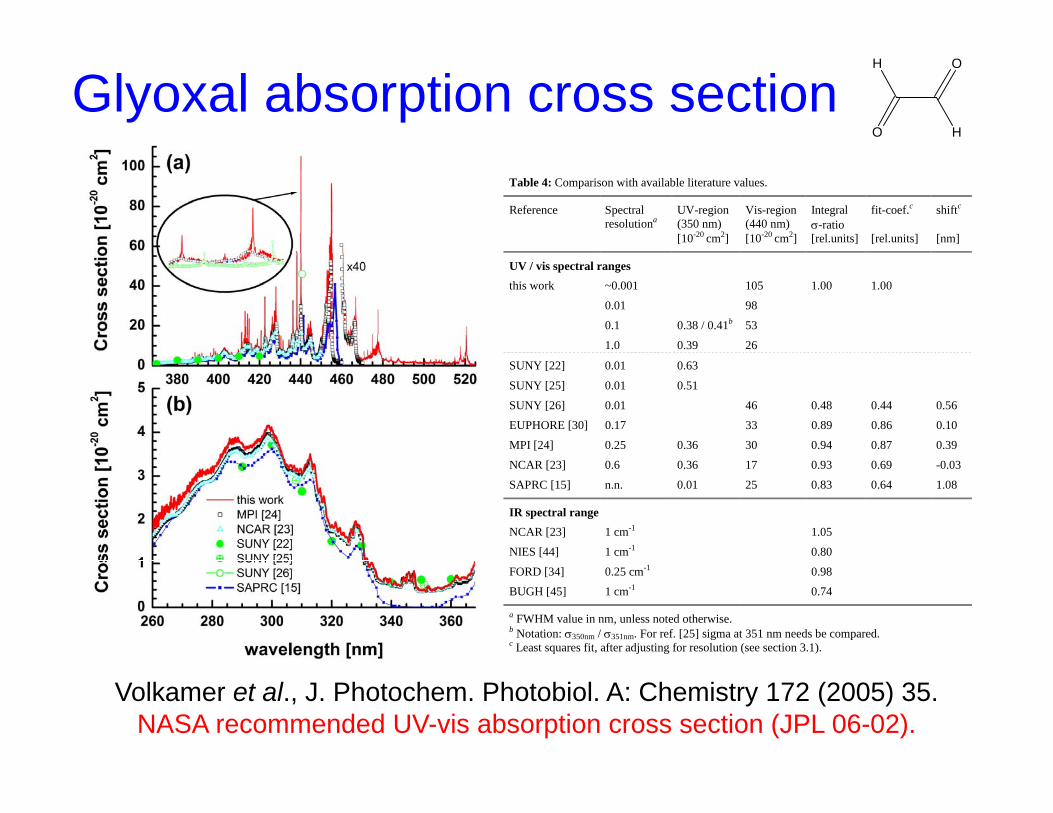
Glyoxal absorption cross sectionO
O H
H
Table 4: Comparison with available literature values.
Reference Spectral resolutiona
UV-region (350 nm)
Vis-region (440 nm)
Integral σ-ratio
fit-coef.c shiftc
[10-20 cm2] [10-20 cm2] [rel.units] [rel.units] [nm]
UV / vis spectral ranges this work ~0.001 105 1.00 1.00
0.01 98
0.1 0.38 / 0.41b 53
1.0 0.39 26
SUNY [22] 0.01 0.63
SUNY [25] 0.01 0.51
SUNY [26] 0.01 46 0.48 0.44 0.56
EUPHORE [30] 0.17 33 0.89 0.86 0.10
MPI [24] 0.25 0.36 30 0.94 0.87 0.39
NCAR [23] 0.6 0.36 17 0.93 0.69 -0.03
SAPRC [15] n.n. 0.01 25 0.83 0.64 1.08
IR spectral range NCAR [23] 1 cm-1 1.05
NIES [44] 1 cm-1 0.80
FORD [34] 0.25 cm-1 0.98
BUGH [45] 1 cm-1 0.74
a FWHM value in nm, unless noted otherwise. b Notation: σ350nm / σ351nm. For ref. [25] sigma at 351 nm needs be compared. c Least squares fit, after adjusting for resolution (see section 3.1).
Volkamer et al., J. Photochem. Photobiol. A: Chemistry 172 (2005) 35.NASA recommended UV-vis absorption cross section (JPL 06-02).
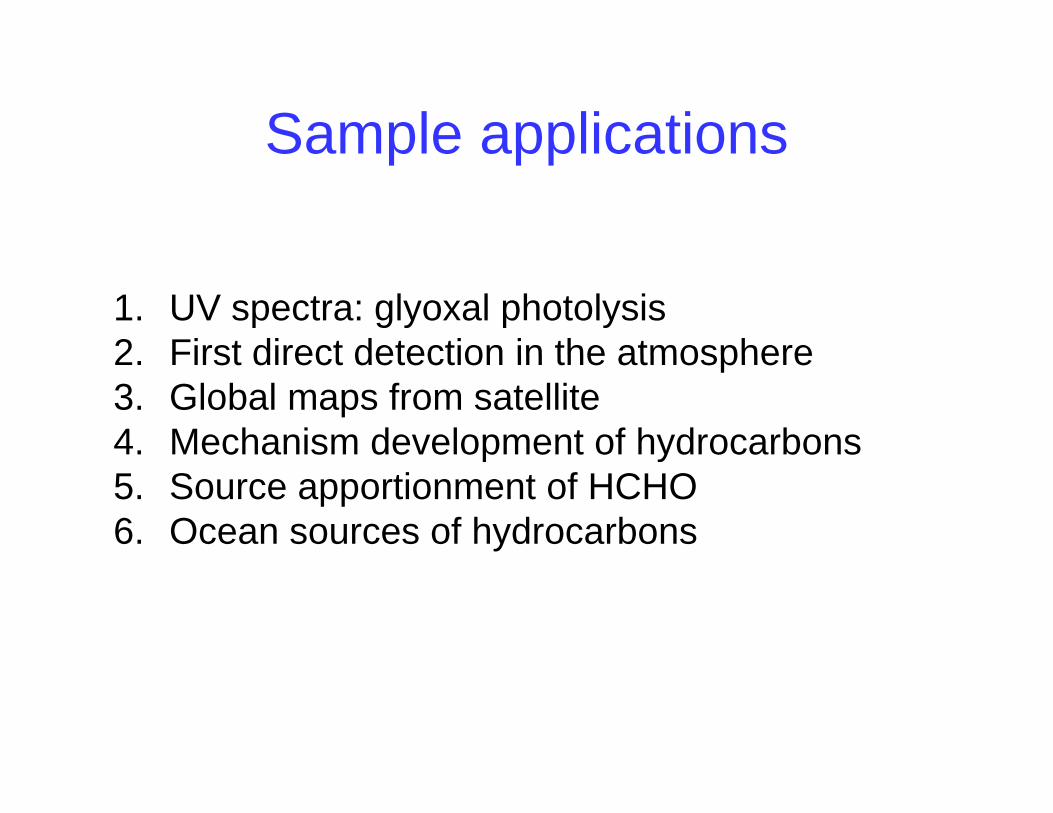
Sample applicationsSample applications
1. UV spectra: glyoxal photolysis 2 First direct detection in the atmosphere2. First direct detection in the atmosphere3. Global maps from satellite4. Mechanism development of hydrocarbonsp y5. Source apportionment of HCHO6. Ocean sources of hydrocarbons
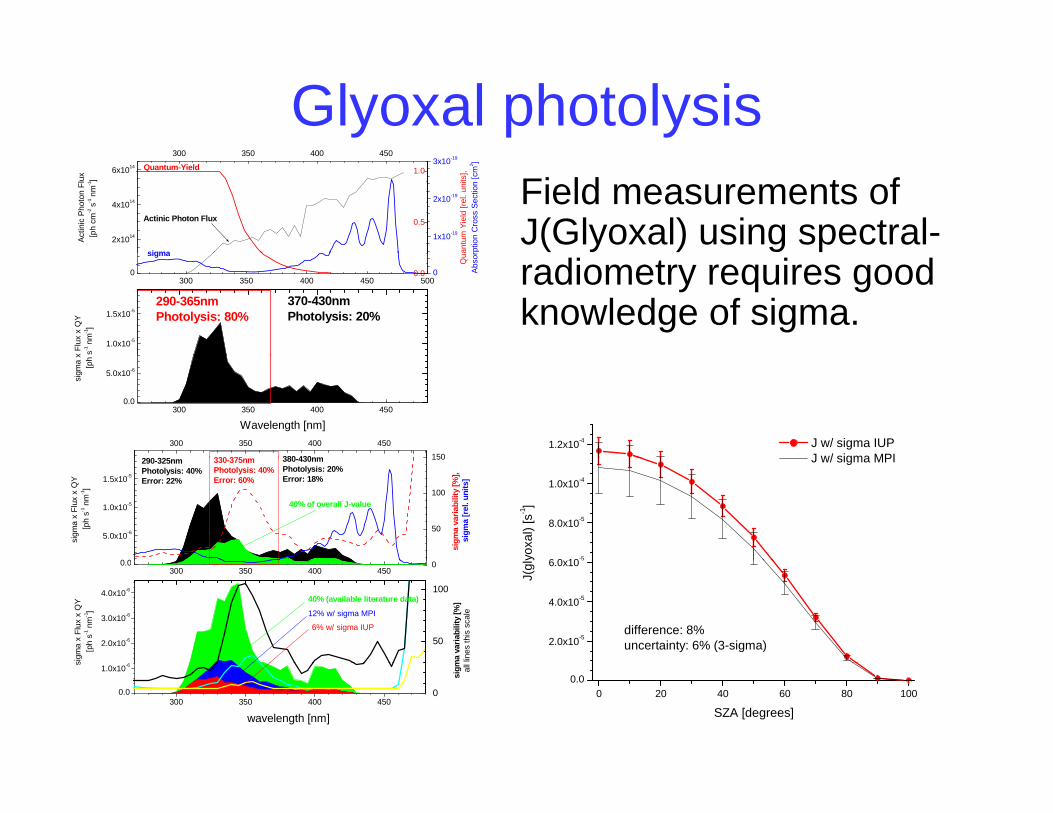
Glyoxal photolysis300 350 400 450300 350 400 450
1x10-19
2x10-19
3x10-19
0.5
1.0
2x10¹⁴
4x10¹⁴
6x10¹⁴
antu
m Y
ield
[rel
. uni
ts],
rptio
n C
ross
Sec
tion
[cm
2 ]
Quantum-Yield
Actin
ic P
hoto
n Fl
ux[p
h cm
-2 s
-1 n
m-1]
sigma
Actinic Photon Flux
Field measurements of J(Glyoxal) using spectral-
00.0300 350 400 450 500
0
1.0x10⁻⁵
1.5x10⁻⁵
Qua
Abso
r
sigma
x Fl
ux x
QY
s-1 n
m-1]
370-430nmPhotolysis: 20%
290-365nm Photolysis: 80%
radiometry requires good knowledge of sigma.
300 350 400 4500.0
5.0x10⁻⁶
sigm
a x
[ph
Wavelength [nm]300 350 400 450
150380 430nm330 375290 325
1.2x10⁻⁴ J w/ sigma IUPJ w/ sigma MPI
0 0
5.0x10⁻⁶
1.0x10⁻⁵
1.5x10⁻⁵
50
100
150380-430nmPhotolysis: 20%Error: 18%
330-375nm Photolysis: 40%Error: 60%
290-325nm Photolysis: 40%Error: 22%
sigm
a x
Flux
x Q
Y
[ph
s-1 n
m-1]
40% of overall J-value
sigm
a va
riabi
lity
[%],
sigm
a [r
el. u
nits
]
6 0 10-5
8.0x10⁻⁵
1.0x10⁻⁴
J w/ sigma MPI
yoxa
l) [s
-1]
300 350 400 4500.0 0
2.0x10⁻⁶
3.0x10⁻⁶
4.0x10⁻⁶
50
100
40% (available literature data)
ma
varia
bilit
y [%
]lin
es th
is s
cale
sigm
a x
Flux
x Q
Y [p
h s-1
nm
-1]
6% w/ sigma IUP
12% w/ sigma MPI
2.0x10⁻⁵
4.0x10⁻⁵
6.0x10
difference: 8%uncertainty: 6% (3-sigma)
J(gl
300 350 400 4500.0
1.0x10⁻⁶
0
sigm al
l s
wavelength [nm]
0 20 40 60 80 1000.0
SZA [degrees]
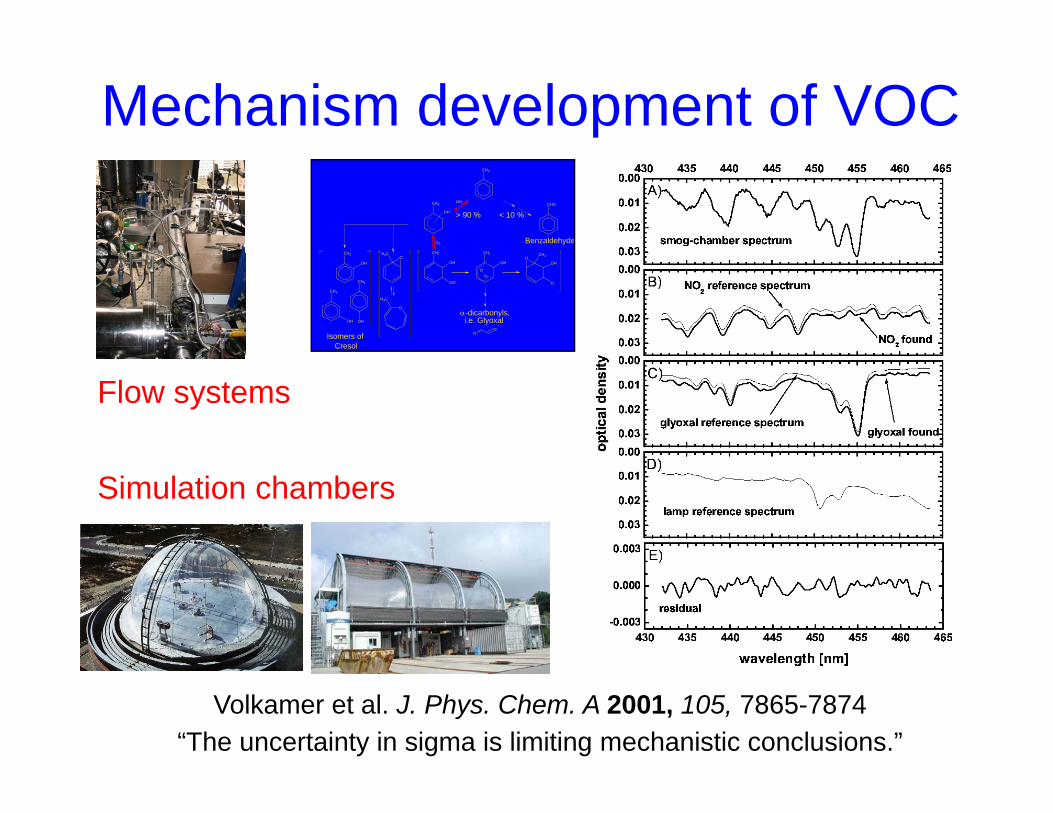
Mechanism development of VOCCH3
CH3
OH
CH3
CHO
CH3CH
O2
OH
CH
< 10 %> 90 %
BenzaldehydeCH3
OH
OO
CH3
OH
OO.
CH3
OH
O
OCH3 O
. .
O
CH3
CH3
OH
CH3
OH
CH3
OH
-dicarbonyls,αi.e. Glyoxal
OOIsomers of
Cresol
Flow systems
Simulation chambers
Volkamer et al. J. Phys. Chem. A 2001, 105, 7865-7874“The uncertainty in sigma is limiting mechanistic conclusions.”
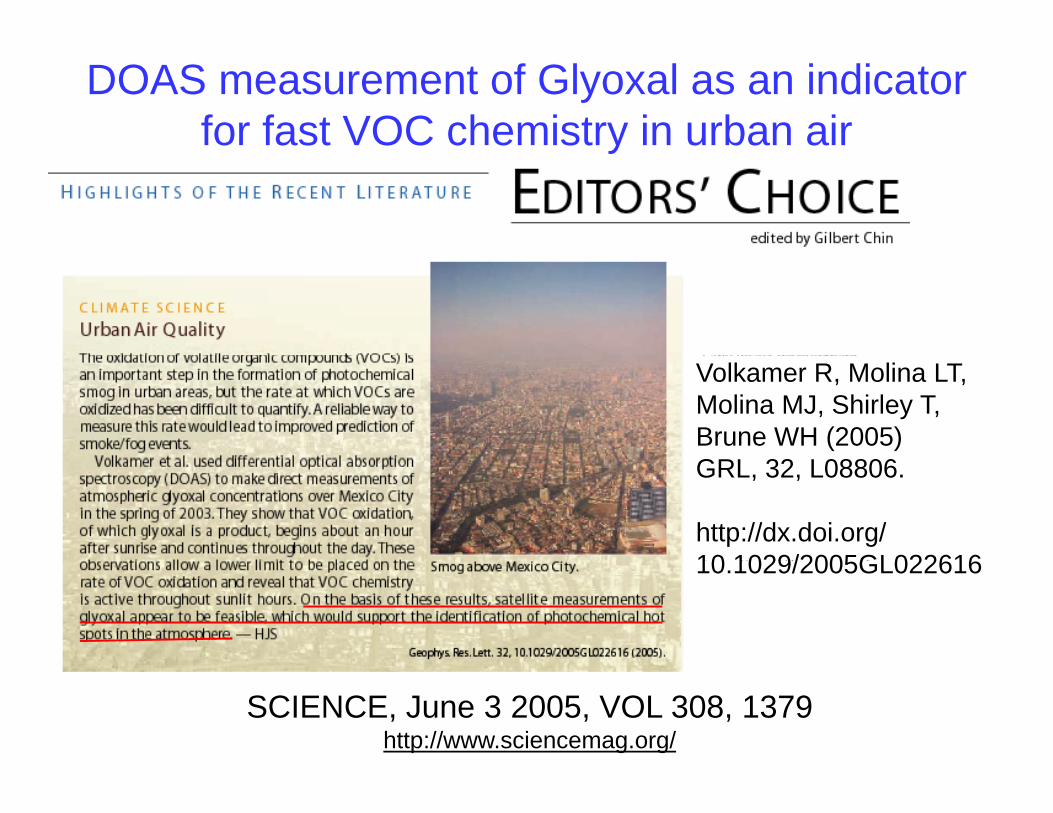
DOAS measurement of Glyoxal as an indicator for fast VOC chemistry in urban airy
Volkamer R, Molina LT, Molina MJ, Shirley T, Brune WH (2005)GRL, 32, L08806.
http://dx.doi.org/10 1029/2005GL02261610.1029/2005GL022616
SCIENCE, June 3 2005, VOL 308, 1379http://www.sciencemag.org/
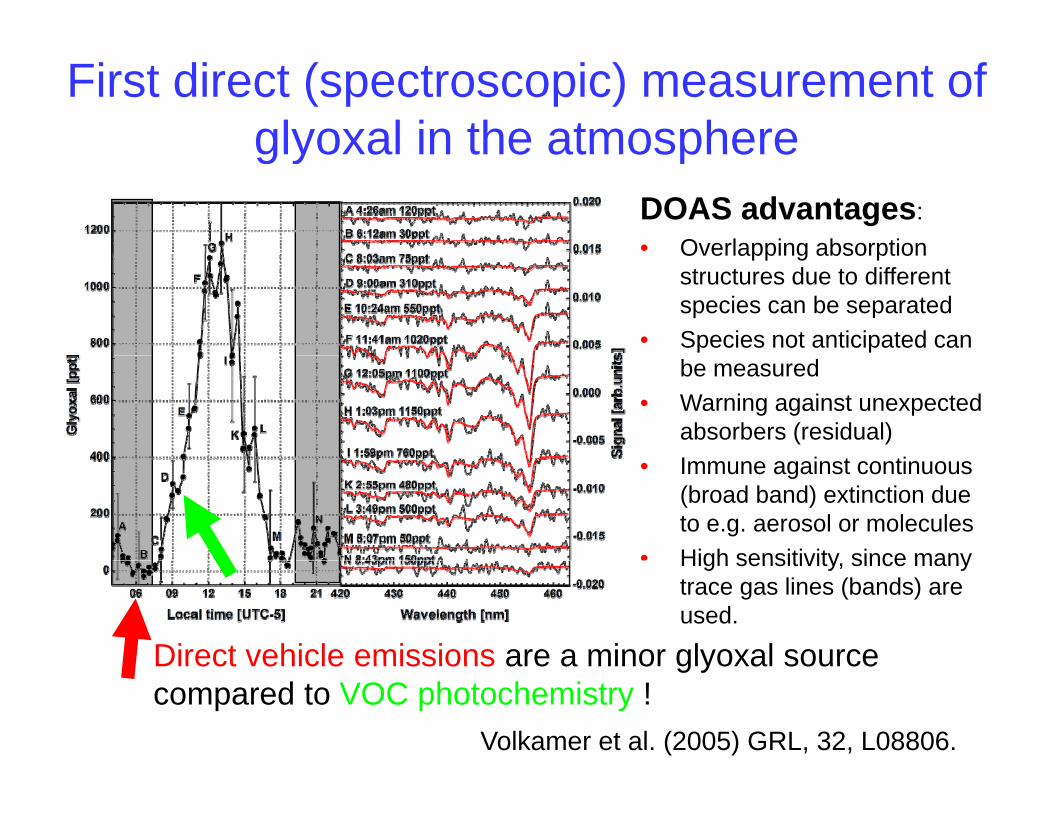
First direct (spectroscopic) measurement of glyoxal in the atmosphereglyoxal in the atmosphere
DOAS advantages:• Overlapping absorptionOverlapping absorption
structures due to different species can be separated
• Species not anticipated can be measured
• Warning against unexpected absorbers (residual)I i t ti• Immune against continuous (broad band) extinction due to e.g. aerosol or molecules
• High sensitivity since many
Direct vehicle emissions are a minor glyoxal source
High sensitivity, since many trace gas lines (bands) are used.
Direct vehicle emissions are a minor glyoxal source compared to VOC photochemistry !
Volkamer et al. (2005) GRL, 32, L08806.
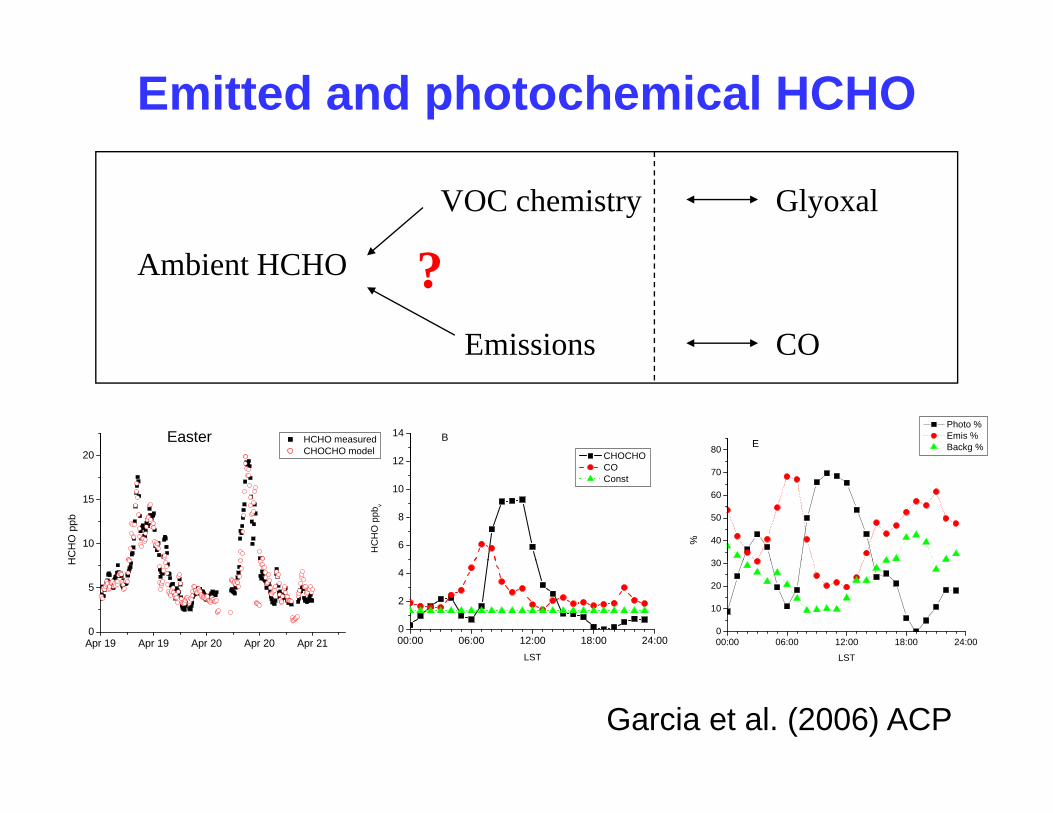
Emitted and photochemical HCHO
bi
VOC chemistry Glyoxal
?Ambient HCHO
Emissions CO
?
80 E
Photo % Emis % Backg %
12
14 B
CHOCHO20Easter HCHO measured
CHOCHO model
30
40
50
60
70
%6
8
10
12
HC
HO
ppb
v
CHOCHO CO Const
10
15
20
HC
HO
ppb
00:00 06:00 12:00 18:00 24:000
10
20
30
LST
00:00 06:00 12:00 18:00 24:000
2
4
LSTApr 19 Apr 19 Apr 20 Apr 20 Apr 210
5
H
Garcia et al. (2006) ACP
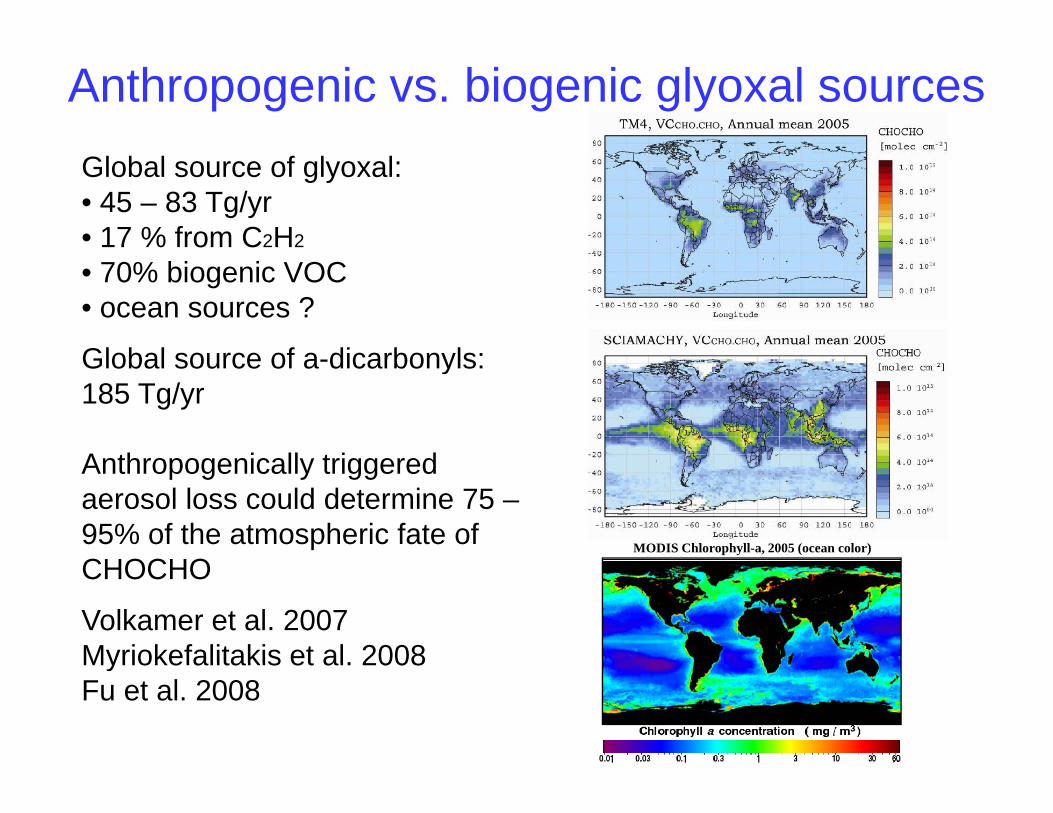
Anthropogenic vs. biogenic glyoxal sourcesGlobal source of glyoxal:• 45 – 83 Tg/yr• 17 % from C2H2
• 70% biogenic VOC• ocean sources ?
Global source of a dicarbonyls:Global source of a-dicarbonyls: 185 Tg/yr
A th i ll t i dAnthropogenically triggered aerosol loss could determine 75 –95% of the atmospheric fate of CHOCHO
MODIS Chlorophyll-a, 2005 (ocean color)
CHOCHO
Volkamer et al. 2007 Myriokefalitakis et al. 2008Myriokefalitakis et al. 2008 Fu et al. 2008
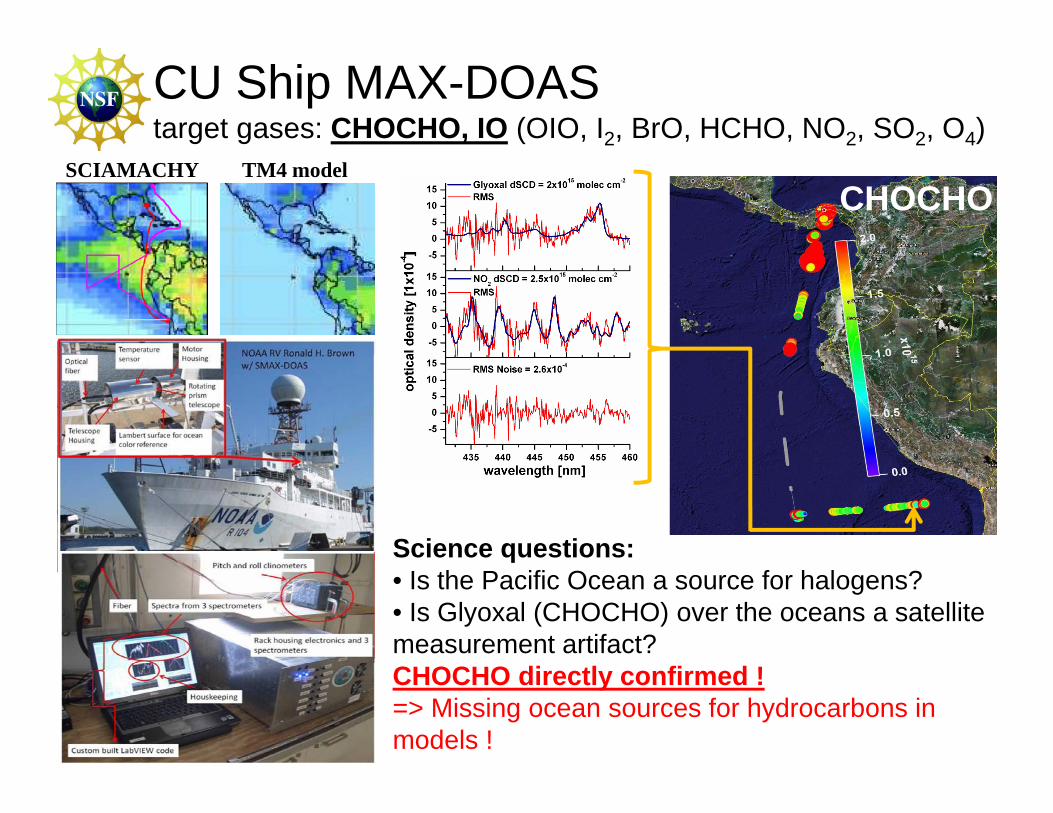
CU Ship MAX-DOAStarget gases: CHOCHO, IO (OIO, I2, BrO, HCHO, NO2, SO2, O4)
SCIAMACHY TM4 modelCHOCHO
Science questions:q• Is the Pacific Ocean a source for halogens?• Is Glyoxal (CHOCHO) over the oceans a satellite measurement artifact? CHOCHO directly confirmed !=> Missing ocean sources for hydrocarbons in models !