Embed Size (px)
Citation preview

2003 Summer Bioengineering Conference, June 25-29, Sonesta Beach Resort in Key Biscayne, Florida
INTRODUCTION In recent years we have studied the hemodynamic effects of surgical corrections of mitral valve prolapse both computationally and experimentally [1-3]. Our experimental tests were performed with a simplified-geometry, steady-flow hydraulic bench, with mitral valves of porcine origin, in which the original chordae tendineae were maintained [3]. In the effort of extending the study to more realistic, diastolic flow conditions, we have now designed a new, physiologic behaving heart simulator. Heart simulators (or, pulse duplicators) are mainly used in the assessment of prosthetic heart valves. Most heart simulators use flexible sacs to substitute for the natural ventricle’s contraction/relaxation phases [4-7]. In such devices (particularly, in [6]) the ventricle sac shape is molded so as to mimic the ventricular chamber’s natural geometry when the sac is at rest. However no particular attention is paid in reproducing the shape changes that the natural ventricular chamber experiences during the cardiac cycle. It may be expected that the dynamics of wall movements influence sensibly the fluid dynamics of ventricle filling, which is especially important when the studied valve is in the mitral position. In our novel heart simulator, the ventricle sac has been conceived so as to deform in a natural-like fashion during filling. The ventricle sac has been designed through structural FEM analysis. Prototypes have been manufactured and subjected to experimental validation tests. MATERIALS AND METHODS To keep wall deformation under control, we chose the end-systolic (ES) ventricle shape as a reference. That is, the shape of the artificial ventricular sac at rest reproduces the ES shape. Ventricle filling up to the end-diastolic (ED) configuration happens with wall stretching induced by depressurizing the sac’s outer face. In this way, no buckling takes place during the distension/contraction cycle and therefore wall deformation may be predicted with accuracy. The ES sac geometry has been drawn basing on natural morphometry, namely on the natural curvature of wall sections taken at different positions along the apex-to-base axis [8]. The resulting geometry is sketched in Fig. 1a. Mitral and aortic valvular planes form an angle of
150° [9] and delimit the volume on top, forming the base of the ventricle. The apex-to-base axis measures 60mm; valvular diameters are 38mm (mitral) and 30mm (aortic). The inner volume was kept as small as possible, compatibly with the necessity of having a rigid base for valve mounting. The resulting ES volume is 71ml.
Figure 1. a) Sketch of the ventricular sac geometry.
b) Ventricle wall discretization. c) Reinforcing bands. Finite-element design A finite-element model of the ventricle sac at ES conditions has been developed (Fig. 1b). The wall was meshed with Gambit (Fluent Inc.) with 2223 nodes (2216 shell elements, 72 of which triangular, the others quadrangular). Shell thickness was set to 0.21 mm, with E = 570 kPa, representing a silicone layer, whose mechanical properties have been evaluated with tensile tests. In order to attain a physiologic-like deformation behavior, circumferential reinforcement bands were added, as evidenced in Fig. 1c. In the optimized configuration, three 3-mm and two 1.5-mm-wide bands appear. The nodes of the base were constrained with an encaster. Diastolic filling was simulated with ABAQUS (HK&S), by imposing a negative pressure on the outer model surface, until an ejection fraction (FE = (VED–VES)/VED) of about 0.55 was reached.
DEVELOPMENT OF A MODEL LEFT VENTRICLE WITH PHYSIOLOGIC-LIKE DIASTOLIC BEHAVIOUR FOR STUDYING MITRAL VALVE SURGICAL CORRECTION
Gianfranco B. Fiore, Alberto Redaelli, Marco Rasponi, Roberto Fumero
Department of Bioengineering Politecnico di Milano
Milan, Italy
a)
c)b)
Starting page #: 0429
2003 Summer Bioengineering Conference, June 25-29, Sonesta Beach Resort in Key Biscayne, Florida
Physiologic likeness was evaluated by means of the following indexes: 1) the ratio between ventricular eccentricities at the ED and ES configurations: this ratio is approximately 1 during the whole cycle in the real heart; 2) the fractional shortening (FS) of the longitudinal axis: it is AF>0.22 physiologically; 3) the ED curvature of the wall section taken at different positions along the apex-to-base axis [8]. Manufacturing and bench tests Prototype manufacturing involved the following subsequent steps: 1) machining a model from a block of Cibatool BM5460 resin with a numerically-controlled milling machine; 2) obtaining a matrix by thermoforming a PMMA sheet; 3) obtaining a mould by pouring a bi-component epoxy resin into the matrix; 4) spraying the mould with a thin PTFE layer; 5) dipping the mould into a silicone-xylene mixture several times, until the necessary thickness is obtained (mean thickness: 206 µm), and letting silicone cure; 6) manual fixing of the reinforcing bands, made from a Dacron-reinforced silicone sleeve. Figure 2 shows photographs of the parts described so far. Bench tests were conducted by measuring the internal pressure secondary to given volume changes, applied with a syringe pump. At each volume increment, digital photographs were taken and post-processed to reduce optical distortion. The ventricular short and long axes were measured on the pictures taken from the posterior view.
Figure 2. (From left to right): initial machined model; PMMA
matrix; epoxy mould; final, reinforced prototype sac. RESULTS Figure 3 reports the resulting values for the average wall curvature calculated at seven sections taken normally to the apex-to-base axis from simulations. Values are compared with the reference physiological values reported in [8]. The agreement is satisfactory.
0.3
0.6
0.9
1.2
1.5
1.8
S1 S2 S3 S4 S5 S6 S7
Section
Curv
atur
e (c
m−1
)
ES
ED
(Apex) (Base)
Figure 3. The ES and ED wall curvature. Solid lines with dev. bars: data from [8]; dashed lines: our simulations.
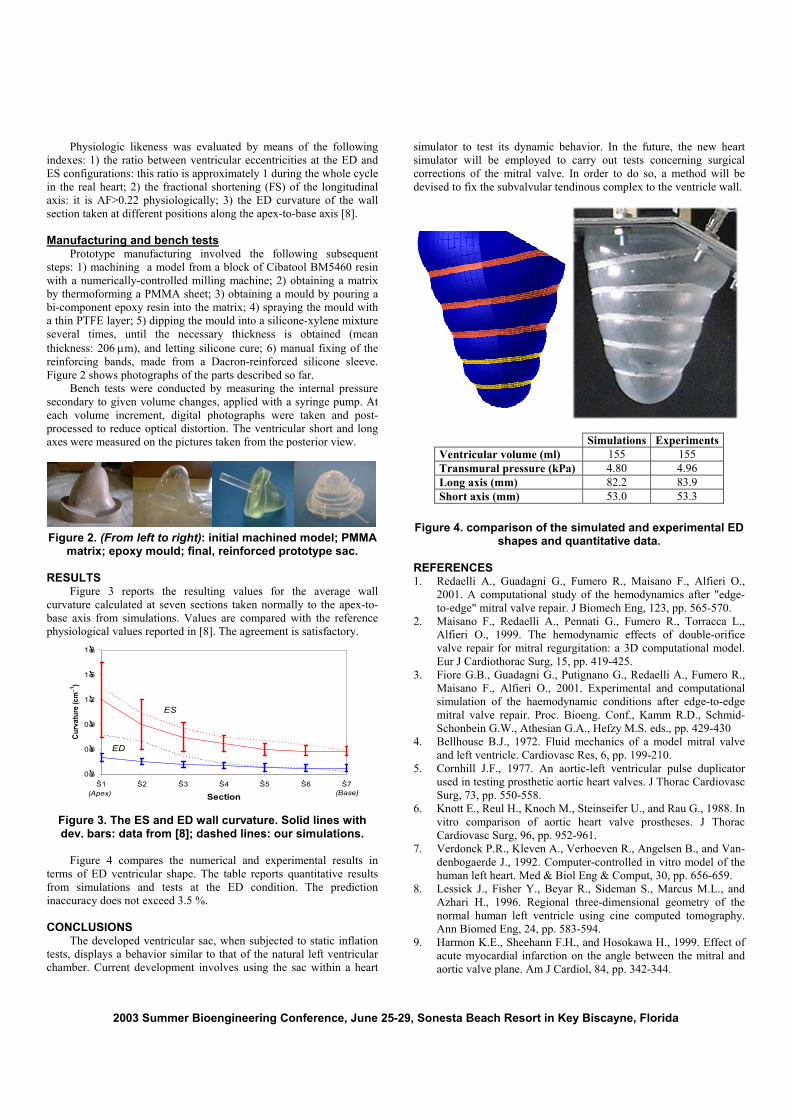
Figure 4 compares the numerical and experimental results in terms of ED ventricular shape. The table reports quantitative results from simulations and tests at the ED condition. The prediction inaccuracy does not exceed 3.5 %. CONCLUSIONS The developed ventricular sac, when subjected to static inflation tests, displays a behavior similar to that of the natural left ventricular chamber. Current development involves using the sac within a heart
simulator to test its dynamic behavior. In the future, the new heart simulator will be employed to carry out tests concerning surgical corrections of the mitral valve. In order to do so, a method will be devised to fix the subvalvular tendinous complex to the ventricle wall.
Simulations ExperimentsVentricular volume (ml) 155 155 Transmural pressure (kPa) 4.80 4.96 Long axis (mm) 82.2 83.9 Short axis (mm) 53.0 53.3
Figure 4. comparison of the simulated and experimental ED
shapes and quantitative data. REFERENCES 1. Redaelli A., Guadagni G., Fumero R., Maisano F., Alfieri O.,
2001. A computational study of the hemodynamics after "edge-to-edge" mitral valve repair. J Biomech Eng, 123, pp. 565-570.
2. Maisano F., Redaelli A., Pennati G., Fumero R., Torracca L., Alfieri O., 1999. The hemodynamic effects of double-orifice valve repair for mitral regurgitation: a 3D computational model. Eur J Cardiothorac Surg, 15, pp. 419-425.
3. Fiore G.B., Guadagni G., Putignano G., Redaelli A., Fumero R., Maisano F., Alfieri O., 2001. Experimental and computational simulation of the haemodynamic conditions after edge-to-edge mitral valve repair. Proc. Bioeng. Conf., Kamm R.D., Schmid-Schonbein G.W., Athesian G.A., Hefzy M.S. eds., pp. 429-430
4. Bellhouse B.J., 1972. Fluid mechanics of a model mitral valve and left ventricle. Cardiovasc Res, 6, pp. 199-210.
5. Cornhill J.F., 1977. An aortic-left ventricular pulse duplicator used in testing prosthetic aortic heart valves. J Thorac Cardiovasc Surg, 73, pp. 550-558.
6. Knott E., Reul H., Knoch M., Steinseifer U., and Rau G., 1988. In vitro comparison of aortic heart valve prostheses. J Thorac Cardiovasc Surg, 96, pp. 952-961.
7. Verdonck P.R., Kleven A., Verhoeven R., Angelsen B., and Van-denbogaerde J., 1992. Computer-controlled in vitro model of the human left heart. Med & Biol Eng & Comput, 30, pp. 656-659.
8. Lessick J., Fisher Y., Beyar R., Sideman S., Marcus M.L., and Azhari H., 1996. Regional three-dimensional geometry of the normal human left ventricle using cine computed tomography. Ann Biomed Eng, 24, pp. 583-594.
9. Harmon K.E., Sheehann F.H., and Hosokawa H., 1999. Effect of acute myocardial infarction on the angle between the mitral and aortic valve plane. Am J Cardiol, 84, pp. 342-344.