Embed Size (px)
Citation preview

Patient Satisfaction Tool
49VOL. 49 NO. 4 2015 ACTA MEDICA PHILIPPINA
______________
Presented as a poster entitled "Patient Satisfaction in Philippine Healthcare Institutions (Level IV DOH Hospitals) Phases 1 and 2" at the 15th National Health Research Forum for Action: Bridging Theory and Practice to achieve Kalusugan Pangkalahatan, October 21-22, 2014, Mariott Hotel, Pasay City, Philippines. Corresponding author: Paulo Ma. N. Pagkatipunan, MD, MHA, DPA, DrPH Department of Ophthalmology and Visual Sciences Philippine General Hospital University of the Philippines Manila Taft Avenue, Ermita, Manila 1000 Philippines Telephone: +632 5548400 local EHRO Fax No.: +632 5233140 Email: [email protected]
Development of a Patient Satisfaction Tool for Tertiary Hospitals in the Philippines: the Filipino Patient-Based Approach*
Paulo Maria N. Pagkatipunan
Department of Ophthalmology and Visual Sciences, College of Medicine and Philippine General Hospital, University of the Philippines Manila
*The original research study on which this journal article is based was commissioned by the Department of Health for its 2012 Health Systems Research Management, in support of Universal Health Care in the Philippines. The views and opinions contained in this article are those of the author and do not necessarily represent those of the Philippine Department of Health
Introduction The quality of healthcare delivery is dynamic and
should always be improved. The problem is defining and measuring such a complex concept. But it is uncontroversial that a major component of the concept of quality of health care is the satisfaction of patients to the health care delivered to them. Research has identified a clear link between patient outcomes and patient satisfaction survey scores.
This burden of measurement of patient satisfaction has been borne by each hospital, partly to improve health care delivery and partly to show investors, health maintenance organizations and for marketing purposes. This is mostly true for private hospitals in the Philippines where competition for admission of paying patients is considered a rat race and where viability and income generation is of utmost importance.
On the other hand, in the country’s public hospital sector, sustainability is dependent on government subsidy: from the local government for devolved hospitals and from the Department of Health (DOH) for the regional and public medical centers. In short, sustainability is dependent on subsidy from the government and not from the income generated from paying patients. But even in this milieu, the DOH requires that all hospitals should have a Patient Satisfaction Survey as part of the evaluation of the quality of healthcare delivered by the hospitals. And this may form part of the basis for subsidy allocation.
The DOH itself has no unified/harmonized tool to measure patient satisfaction. All of the DOH hospitals have made their own survey tool, the content of which used literature, albeit mostly foreign in origin, and which were not validated in the local setting.
It is in this light that this study proposed a way in which a Patient Satisfaction Survey tool may be made in the context of what the Filipino patient feels matters to them most. This article focused on the approach in which this particular tool
ORIGINAL ARTICLE

Patient Satisfaction Tool
50 VOL. 49 NO. 4 2015ACTA MEDICA PHILIPPINA
was made, and not on the number of patients seen or the number of hospitals studied.
Methods
The study consisted of two phases: the first phase was the development of the Patient Satisfaction Tool; the second phase was the pre-testing of this tool. Phase 1 is a cross sectional study of one randomly selected DOH hospital in the National Capital Region and one randomly selected regional DOH hospital. It included collection of qualitative data with the result of crafting a Patient Satisfaction Tool. Phase 2 involved pre-testing of the Patient Satisfaction Tool. This was done by having the questionnaire piloted to one DOH hospital in the NCR and one regional hospital in each of the three big island groups which was not included in the sampling population in Phase 1. The questionnaires were then collected and revised accordingly. This was done to ensure clarity and proper understanding of the data collection instruments. Then the tool underwent statistical validation.
This study was reviewed by the Department of Health Institutional Review Board and Ethical Review Board. Sampling
The respondents of the study for both Phases 1 and 2 included admitted Filipino patients. Patients were selected from those who were already being discharged for the day regardless of how long they were in the hospital. The rationale is that the patients who are in the process of being discharged had already acquired the full experience of hospital stay and therefore had full satisfaction or dissatisfaction with the totality of the hospital environment.
Phase 1 included the administration of the qualitative patient survey to one Regional DOH hospital and one tertiary hospital in the National Capital Region (NCR). After consulting with the experts in DOH, it was deemed necessary that patients in the pediatric, the adult and geriatric age groups should be represented. Moreover, it was agreed that these patients should represent the cases most seen in DOH hospitals namely a) communicable, b) non-communicable, c) cancer, and d) obstetrics and gynecology cases. For this pilot study, 15 cases per category of case, with 5 from each age group, would be sufficient. This totaled 60 in-patients per hospital.
Phase 2 included pretesting of the crafted tool in three Regional DOH hospitals (one per big island group) and one specialty hospital in the NCR with 150 subjects for each said hospital. The proportion of patients to be taken from each major department (surgery, obstetrics and gynecology, pediatrics and internal medicine) depended on the average proportion of discharged patients for the two previous years, 2011 and 2012, in the said departments.
All of the patients being discharged from the participating hospitals were included in the study to a point
until the sample size for each hospital was already reached or until the given time (one week) had already elapsed for each hospital. This method, called Time-Location Sampling (also known as Venue Sampling), is a probabilistic method used to recruit members of a target population at specific times in set venues. The sampling framework consists of venue-day-time units (VDT)–also known as time-location units–which represent the potential universe of venues, days and times.1 Tool Development
Qualitative Tool for Phase 1. After consulting with the experts at the DOH, the Interview Schedule included eight categories: the Admission Process, the Rooms, Nurses, Doctors, Laboratory, Radiology, Pharmacy and the Discharge Process. The Interview Schedule was made in such a way as to bring out the subjective experiences of the respondents. It was made in the concept of phenomenology in which respondents’ answers should emphasize the immediacy of experience—as the individual's personal world as directly experienced.2 Basically, the questions were made to have subjective answers: consciousness and the content of conscious experiences such as judgments, perceptions, and emotions.3
Patient Satisfaction Tool for Phase 2. After familiarization with the data sets, i.e. the answers of the respondents to the qualitative tool, the data sets, in the vernacular, were coded into “categories,” a method not unlike that used in thematic analysis, although, in this case, it is less rigid in process. According to Holloway and Todres4
“thematizing meanings” is one of a few shared generic skills across qualitative analysis. For this reason, Boyatzis characterizes it not as a specific method but as a tool to use across different methods.5 Similarly, Ryan and Bernard locate thematic coding as a process performed within major ‟analytic traditions (such as grounded theory), rather than a specific approach in its own right.6
The selection of a theme follows the rules of Braun and Clarke.7 Accordingly, a theme, in this case “categories,” captures something important about the data in relation to the research question, and represents some level of patterned response or meaning within the data set. Furthermore, the “keyness” of a theme is not necessarily dependent on quantifiable measures, but in terms of whether it captures something important in relation to the overall research question. In this case, the data sets were further sorted into a “positive” or a “negative” grouping to support the importance (“keyness”) of the data to the respondents.
Because of the eclectic nature of this research tool development, phenomenology and thematic approach were both combined to make categories in the final questionnaire.
Patient Satisfaction Tool
51VOL. 49 NO. 4 2015 ACTA MEDICA PHILIPPINA
Results
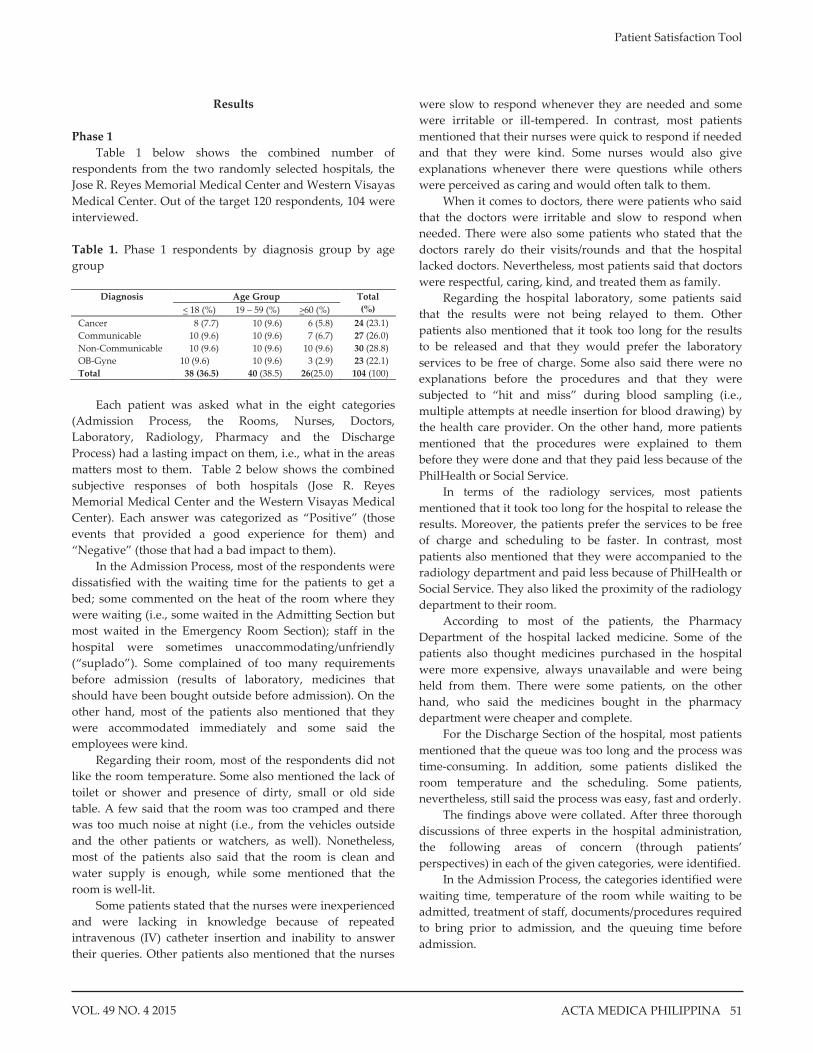
Phase 1 Table 1 below shows the combined number of
respondents from the two randomly selected hospitals, the Jose R. Reyes Memorial Medical Center and Western Visayas Medical Center. Out of the target 120 respondents, 104 were interviewed. Table 1. Phase 1 respondents by diagnosis group by age group
Diagnosis Age Group Total
(%) < 18 (%) 19 – 59 (%) >60 (%) Cancer 8 (7.7) 10 (9.6) 6 (5.8) 24 (23.1) Communicable 10 (9.6) 10 (9.6) 7 (6.7) 27 (26.0) Non-Communicable 10 (9.6) 10 (9.6) 10 (9.6) 30 (28.8) OB-Gyne 10 (9.6) 10 (9.6) 3 (2.9) 23 (22.1) Total 38 (36.5) 40 (38.5) 26(25.0) 104 (100)
Each patient was asked what in the eight categories
(Admission Process, the Rooms, Nurses, Doctors, Laboratory, Radiology, Pharmacy and the Discharge Process) had a lasting impact on them, i.e., what in the areas matters most to them. Table 2 below shows the combined subjective responses of both hospitals (Jose R. Reyes Memorial Medical Center and the Western Visayas Medical Center). Each answer was categorized as “Positive” (those events that provided a good experience for them) and “Negative” (those that had a bad impact to them).
In the Admission Process, most of the respondents were dissatisfied with the waiting time for the patients to get a bed; some commented on the heat of the room where they were waiting (i.e., some waited in the Admitting Section but most waited in the Emergency Room Section); staff in the hospital were sometimes unaccommodating/unfriendly (“suplado”). Some complained of too many requirements before admission (results of laboratory, medicines that should have been bought outside before admission). On the other hand, most of the patients also mentioned that they were accommodated immediately and some said the employees were kind.
Regarding their room, most of the respondents did not like the room temperature. Some also mentioned the lack of toilet or shower and presence of dirty, small or old side table. A few said that the room was too cramped and there was too much noise at night (i.e., from the vehicles outside and the other patients or watchers, as well). Nonetheless, most of the patients also said that the room is clean and water supply is enough, while some mentioned that the room is well-lit.
Some patients stated that the nurses were inexperienced and were lacking in knowledge because of repeated intravenous (IV) catheter insertion and inability to answer their queries. Other patients also mentioned that the nurses
were slow to respond whenever they are needed and some were irritable or ill-tempered. In contrast, most patients mentioned that their nurses were quick to respond if needed and that they were kind. Some nurses would also give explanations whenever there were questions while others were perceived as caring and would often talk to them.
When it comes to doctors, there were patients who said that the doctors were irritable and slow to respond when needed. There were also some patients who stated that the doctors rarely do their visits/rounds and that the hospital lacked doctors. Nevertheless, most patients said that doctors were respectful, caring, kind, and treated them as family.
Regarding the hospital laboratory, some patients said that the results were not being relayed to them. Other patients also mentioned that it took too long for the results to be released and that they would prefer the laboratory services to be free of charge. Some also said there were no explanations before the procedures and that they were subjected to “hit and miss” during blood sampling (i.e., multiple attempts at needle insertion for blood drawing) by the health care provider. On the other hand, more patients mentioned that the procedures were explained to them before they were done and that they paid less because of the PhilHealth or Social Service.
In terms of the radiology services, most patients mentioned that it took too long for the hospital to release the results. Moreover, the patients prefer the services to be free of charge and scheduling to be faster. In contrast, most patients also mentioned that they were accompanied to the radiology department and paid less because of PhilHealth or Social Service. They also liked the proximity of the radiology department to their room.
According to most of the patients, the Pharmacy Department of the hospital lacked medicine. Some of the patients also thought medicines purchased in the hospital were more expensive, always unavailable and were being held from them. There were some patients, on the other hand, who said the medicines bought in the pharmacy department were cheaper and complete.
For the Discharge Section of the hospital, most patients mentioned that the queue was too long and the process was time-consuming. In addition, some patients disliked the room temperature and the scheduling. Some patients, nevertheless, still said the process was easy, fast and orderly.
The findings above were collated. After three thorough discussions of three experts in the hospital administration, the following areas of concern (through patients’ perspectives) in each of the given categories, were identified.
In the Admission Process, the categories identified were waiting time, temperature of the room while waiting to be admitted, treatment of staff, documents/procedures required to bring prior to admission, and the queuing time before admission.

Patient Satisfaction Tool
52 VOL. 49 NO. 4 2015ACTA MEDICA PHILIPPINA
Table 2. Phase 1 Qualitative Interview results
ADMISSION PROCESS Positive Negative
1. Given immediate attention – 61/104 a.Immediately given a room b.Immediately medically checked-up after arriving
3. employees are friendly – 4/104
1. took a long time before given a room (>3hrs -12 hours)-54/104 a. attended meetings even during working hours b. Because still being observed at the ER c. Many patients d. Waits for the orderly so that everyone will be simultaneously brought to rooms e. slow processes f. no vacant beds g. waiting for doctor h. waits for the results of the labs
2. did not give immediate attention- 9/104 a. has to buy prescribed meds first b. has to have companion to sign the waiver c. No money to buy meds d. Many patients
3. Admission has long queue (can take up to 20 queuing people) – 20/104 4. hot at the queue in admitting section 5/104 5. very hard because not familiar with the hospital 6.employees were discourteous (“suplado) 7. hot – 5/104 8. No doctor – 3/104
ROOMS Positive Negative
1.clean and uninterrupted water – 96/104 2. bright and lights are working -46/104
1. Warm (“mainit”)- 80/104 2.Insufficient toilets -49/104
a. Insufficient no. of toilets for so many patients b. one of the only two toilets are broken c. Only two toilets can be used and the other one is a shower
3. insufficient place to put things, many cockroaches, rusty - 47/104 4.Noisy at night – 24/104
a. jeeps’ horns are noisy b. other patients/companions are noisy
5. cramped – 30/104 a. two to a bed b.no bed for companion
NURSES Positive Negative
1.Gives attention – 38/104 2. Courteous - 36/104 3. explains when there are questions-13/104 4.goes at once if needed (5-15minutes) -18/104 5. tells jokes/”ma-chika” – 10/104
1.Nurse are unfriendly and discourteous -19/104 a. Shouts when talking b. sharp tongued c. scowls
2. slow to respond if needed – 25/104 a. Should call many times before approaching b. Can take up to 30 minutes from the time you call their help before approaching c. Needs to call 3 times before approaching
3. does not know – 14/104 a. Inserts several times b. Asks others before answering your question
4. Discourteous (suplada) does not smile – 13/104

Patient Satisfaction Tool
53VOL. 49 NO. 4 2015 ACTA MEDICA PHILIPPINA
DOCTORS Positive Negative
1.Courteous – 23/104 2.Attentive – 9 /104 3.Friendly – 23/104 4. treats us like family
1.Mataray – 23/104 2. not talk professionally / sharp tongued – 5/104 3. slow to respond if needed – 13/104
a. doctor attends to many patients b. Assigned doctor is not available
4. seldom do rounds – 11/104 5. few doctors – 8/104
LABORATORY Positive Negative
1. accompanies you to and from – 18/104 2. Explains – 14/104 3. Cheaper because of PhilHealth/ Social Service
1.results are slow – 22/104 2. many insertion in skin – 4/104 3. has cost- 17/104 4. does not give explanations – 6/104
RADIOLOGY Positive Negative
1.accompanied by an employee – 16/104 2. become cheaper because of PhilHealth/ Social Service – 11/104 3. Near – 16/104
1. slow results – 14/104 2.has costs- 13/104 3. Long queue/slow scheduling – 8/104
- Many patients that are ahead of you in schedule PHARMACY
Positive Negative 1. some drugs are cheaper in the hospital – 25/104 2. all can be bought in the hospital – 3/104
1. lacking in drugs – 76/104 2. More expensive in the hospital/cheaper outside– 23/104 3. no available med in the hospital – 4/104 4. looks like they are selfish (pinagdadamot) – 11/104
- nurse said no drugs at the pharmacy but patient beside us bought from the pharmacy
DISCHARGE Positive Negative
1.Fast – 14/104 2.Quick – 17/104 3. Orderly – 6/104
1. long queue at the billing – 37/104 2. schedule at the billing only in the afternoons -11/104 3. Slow – 32/104 4. hot– 13/104
Responses regarding the Room where the patients
stayed were broken down into the following categories: physical environment, number of toilets/showers, temperature inside the room, conditions of peacefulness and quietness, cleanliness, side table/cabinet, space per patient and smell.
Categories gleaned from the responses regarding Nurses were their cheerfulness/friendliness, courteousness and kindness, knowledge, skills and response time to call.
For the Doctors, the categories identified were courtesy and kindness, knowledge as regards treatment/management of respondents’ diseases/conditions, skills as to management of cases, response time to call, frequencyof visits/rounds with the respondents and explanation as to medications and procedures to be done.
The categories for the Laboratory Department were the completeness of laboratory tests in the hospital, speed of coming out with the results, the cost of laboratory examinations.
The Radiology Department’s categories were completeness of radiology procedures in the hospital, speed of coming out with the results, the manner in which the results were relayed to respondents, the cost of the examinations and the scheduling of examinations.
The identified categories in the Pharmacy Department were completeness of medicines in the hospital, the cost of such medicines and the dispensing process.
The Discharge Process has the following identified categories: speed and ease of the discharge process, waiting time and queuing time.
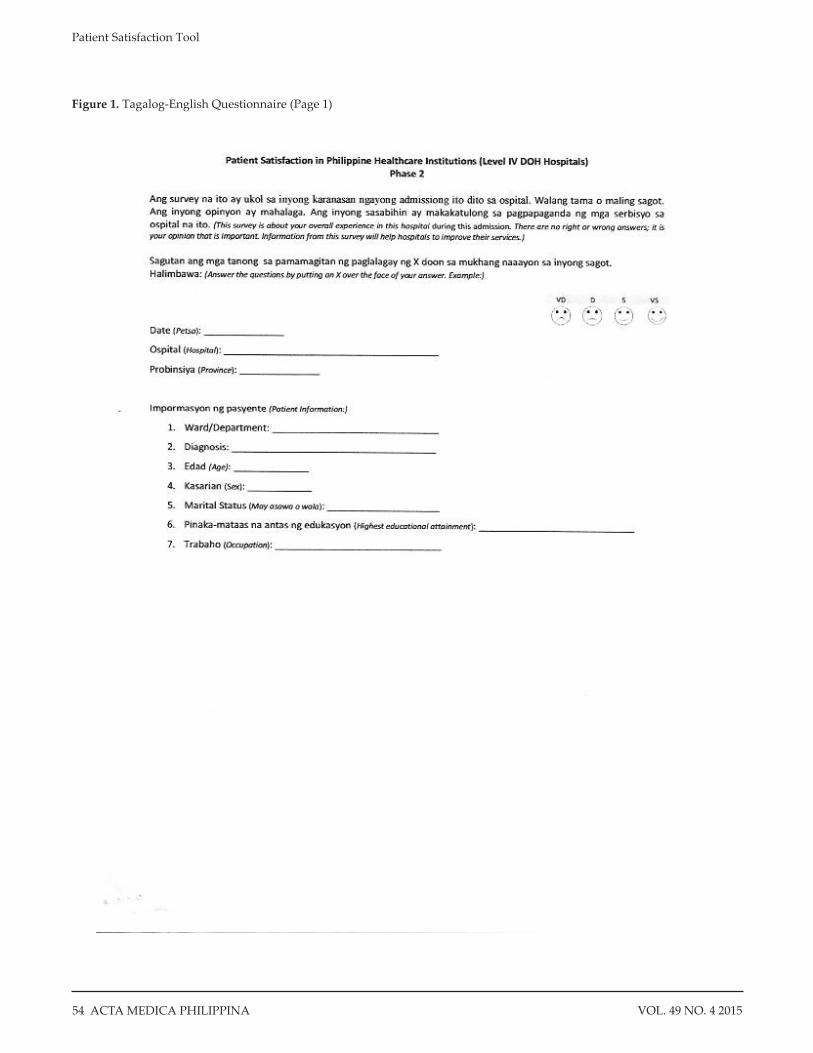
The areas of concern within each category was translated by the same panel of experts in hospital administration, into questions which make up the Patient Satisfaction Tool (Figure 1) marking the end of Phase 1.This was then validated in Phase 2.
Patient Satisfaction Tool
54 VOL. 49 NO. 4 2015ACTA MEDICA PHILIPPINA
Figure 1. Tagalog-English Questionnaire (Page 1)
Patient Satisfaction Tool
55VOL. 49 NO. 4 2015 ACTA MEDICA PHILIPPINA
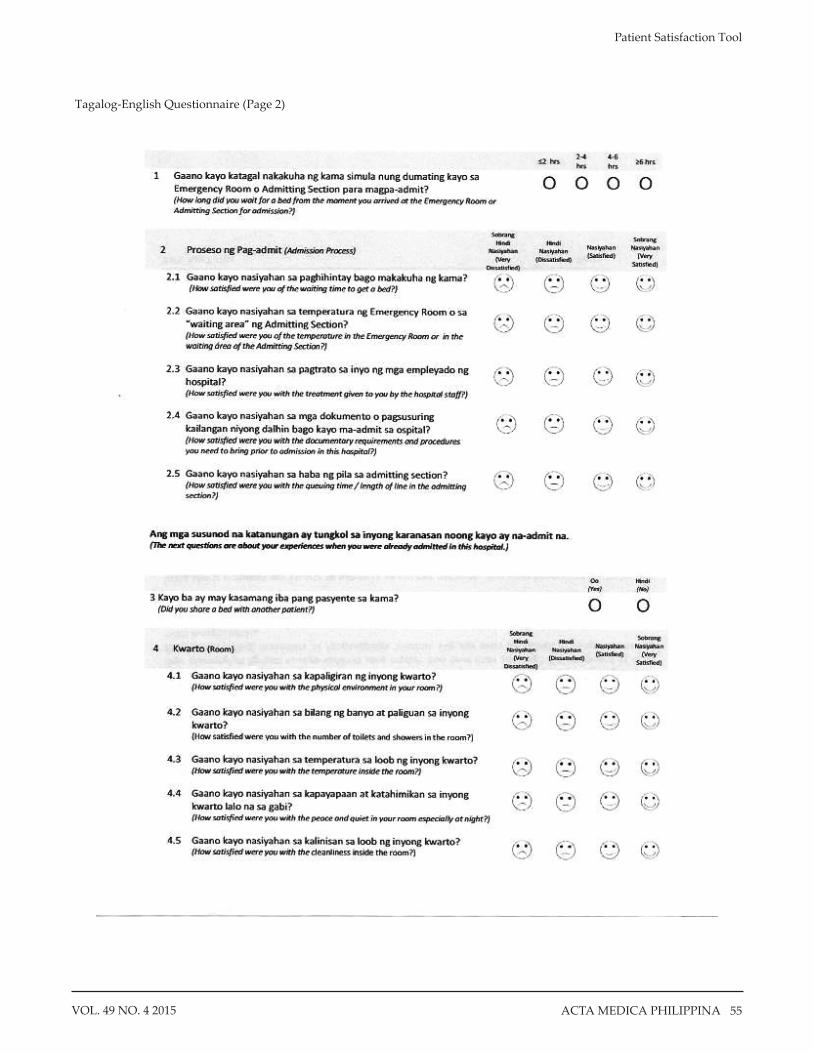
Tagalog-English Questionnaire (Page 2)
Patient Satisfaction Tool
56 VOL. 49 NO. 4 2015ACTA MEDICA PHILIPPINA
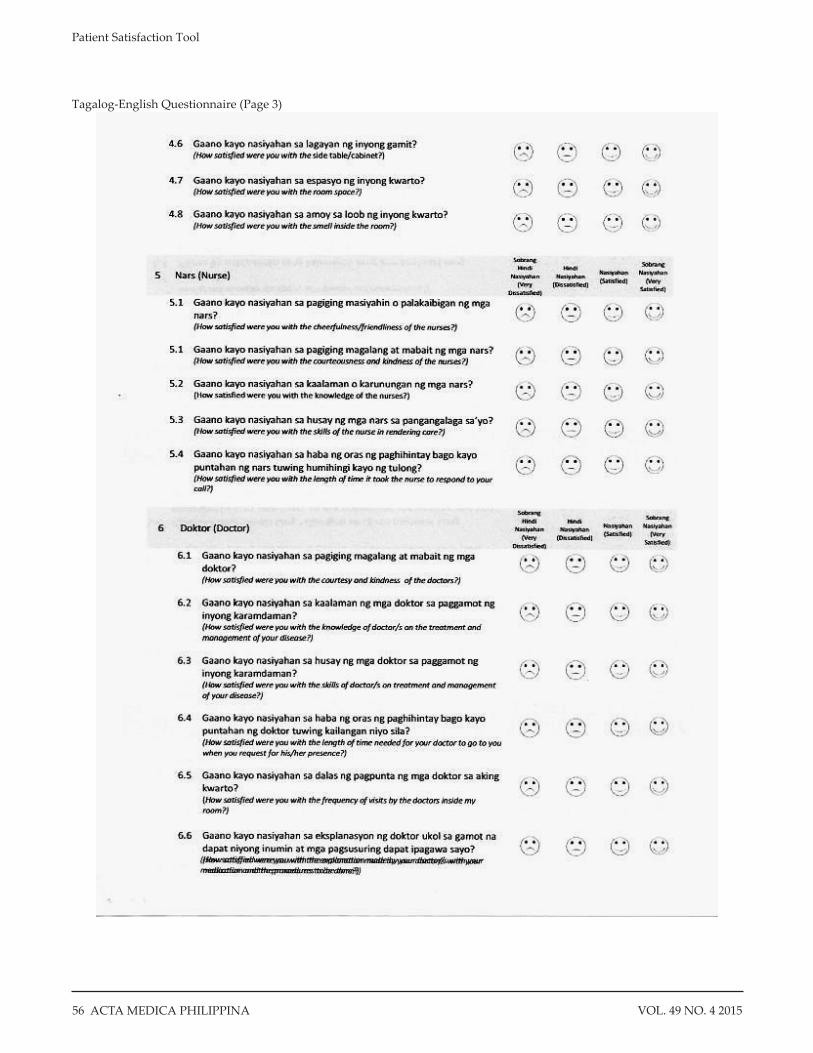
Tagalog-English Questionnaire (Page 3)

Patient Satisfaction Tool
57VOL. 49 NO. 4 2015 ACTA MEDICA PHILIPPINA
Tagalog-English Questionnaire (Page 4)

Patient Satisfaction Tool
58 VOL. 49 NO. 4 2015ACTA MEDICA PHILIPPINA
Tagalog-English Questionnaire (Page 5)
Patient Satisfaction Tool
59VOL. 49 NO. 4 2015 ACTA MEDICA PHILIPPINA
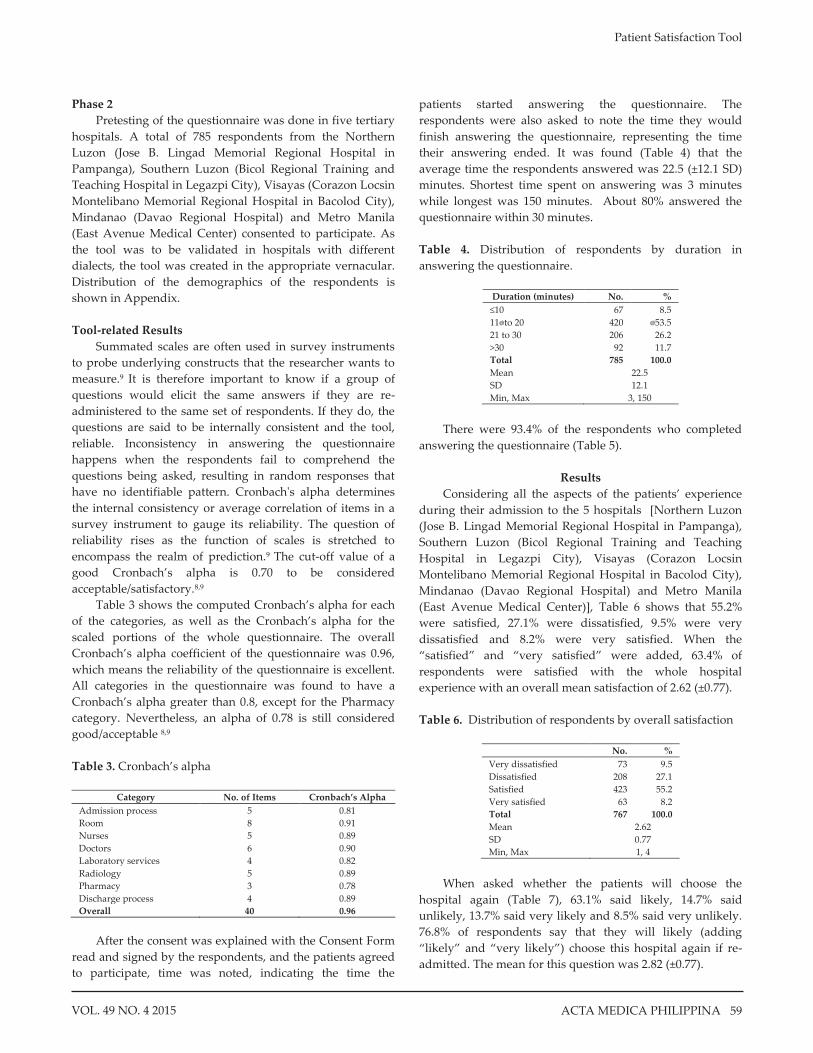
Phase 2 Pretesting of the questionnaire was done in five tertiary
hospitals. A total of 785 respondents from the Northern Luzon (Jose B. Lingad Memorial Regional Hospital in Pampanga), Southern Luzon (Bicol Regional Training and Teaching Hospital in Legazpi City), Visayas (Corazon Locsin Montelibano Memorial Regional Hospital in Bacolod City), Mindanao (Davao Regional Hospital) and Metro Manila (East Avenue Medical Center) consented to participate. As the tool was to be validated in hospitals with different dialects, the tool was created in the appropriate vernacular. Distribution of the demographics of the respondents is shown in Appendix. Tool-related Results
Summated scales are often used in survey instruments to probe underlying constructs that the researcher wants to measure.9 It is therefore important to know if a group of questions would elicit the same answers if they are re-administered to the same set of respondents. If they do, the questions are said to be internally consistent and the tool, reliable. Inconsistency in answering the questionnaire happens when the respondents fail to comprehend the questions being asked, resulting in random responses that have no identifiable pattern. Cronbach's alpha determines the internal consistency or average correlation of items in a survey instrument to gauge its reliability. The question of reliability rises as the function of scales is stretched to encompass the realm of prediction.9 The cut-off value of a good Cronbach’s alpha is 0.70 to be considered acceptable/satisfactory.8,9
Table 3 shows the computed Cronbach’s alpha for each of the categories, as well as the Cronbach’s alpha for the scaled portions of the whole questionnaire. The overall Cronbach’s alpha coefficient of the questionnaire was 0.96, which means the reliability of the questionnaire is excellent. All categories in the questionnaire was found to have a Cronbach’s alpha greater than 0.8, except for the Pharmacy category. Nevertheless, an alpha of 0.78 is still considered good/acceptable 8,9
Table 3. Cronbach’s alpha
Category No. of Items Cronbach’s Alpha
Admission process 5 0.81 Room 8 0.91 Nurses 5 0.89 Doctors 6 0.90 Laboratory services 4 0.82 Radiology 5 0.89 Pharmacy 3 0.78 Discharge process 4 0.89 Overall 40 0.96
After the consent was explained with the Consent Form
read and signed by the respondents, and the patients agreed to participate, time was noted, indicating the time the
patients started answering the questionnaire. The respondents were also asked to note the time they would finish answering the questionnaire, representing the time their answering ended. It was found (Table 4) that the average time the respondents answered was 22.5 (±12.1 SD) minutes. Shortest time spent on answering was 3 minutes while longest was 150 minutes. About 80% answered the questionnaire within 30 minutes. Table 4. Distribution of respondents by duration in answering the questionnaire.
Duration (minutes) No. % ≤10 67 8.5 11�to 20 420 �53.5 21 to 30 206 26.2 >30 92 11.7 Total 785 100.0 Mean 22.5 SD 12.1 Min, Max 3, 150
There were 93.4% of the respondents who completed
answering the questionnaire (Table 5).
Results Considering all the aspects of the patients’ experience
during their admission to the 5 hospitals [Northern Luzon (Jose B. Lingad Memorial Regional Hospital in Pampanga), Southern Luzon (Bicol Regional Training and Teaching Hospital in Legazpi City), Visayas (Corazon Locsin Montelibano Memorial Regional Hospital in Bacolod City), Mindanao (Davao Regional Hospital) and Metro Manila (East Avenue Medical Center)], Table 6 shows that 55.2% were satisfied, 27.1% were dissatisfied, 9.5% were very dissatisfied and 8.2% were very satisfied. When the “satisfied” and “very satisfied” were added, 63.4% of respondents were satisfied with the whole hospital experience with an overall mean satisfaction of 2.62 (±0.77). Table 6. Distribution of respondents by overall satisfaction
No. %
Very dissatisfied 73 9.5 Dissatisfied 208 27.1 Satisfied 423 55.2 Very satisfied 63 8.2 Total 767 100.0 Mean 2.62 SD 0.77 Min, Max 1, 4
When asked whether the patients will choose the
hospital again (Table 7), 63.1% said likely, 14.7% said unlikely, 13.7% said very likely and 8.5% said very unlikely. 76.8% of respondents say that they will likely (adding “likely” and “very likely”) choose this hospital again if re-admitted. The mean for this question was 2.82 (±0.77).

Patient Satisfaction Tool
60 VOL. 49 NO. 4 2015ACTA MEDICA PHILIPPINA
Table 7. Distribution of respondents by whether they will choose the same hospital in case they will be admitted again
No. % Very unlikely 65 8.5 Unlikely 113 14.7 Likely 484 63.1 Very likely 105 13.7 Total 767 100.0 Mean 2.82 SD 0.77 Min, Max 1, 4
On whether they will recommend the hospital to their
family and friends for hospitalization (Table 8), 60.5% said likely, 17.2% said unlikely, 14.4% said very likely and 7.8% said very unlikely. When “likely” and “very likely” were added, 74.9% of respondents were likely to recommend the same hospital to their families and friends. The mean likelihood was 2.81 (±0.77). Table 8. Distribution of respondents by whether they will recommend the hospital to their family and friends for hospitalization
No. % Very unlikely 60 7.8 Unlikely 132 17.2 Likely 463 60.5 Very likely 110 14.4 Total 765 100.0 Mean 2.81 SD 0.77 Min, Max 1, 4
Table 9 below shows that as a whole, with a highest
mean satisfaction rating of 3.04, the respondents were satisfied with the services the Doctors are rendering in the hospital while the Discharge Process was the service in the hospitals in which the respondents had the least satisfaction with a mean satisfaction of 2.40.
Table 9. Mean Satisfaction by Category
N Mean SD Admission Process 777 2.61 0.59 Room 776 2.55 0.63 Nurses 773 2.93 0.62 Doctors 771 3.04 0.60 Laboratory Services 759 2.74 0.62 Radiology 675 2.78 0.62 Pharmacy 768 2.60 0.69 Discharge Process 759 2.40 0.70
Conclusions and Recommendations
The author’s approach to making a Patient Satisfaction Tool based on the respondents (patients) themselves was a novel way of making a survey questionnaire and, to the author’s knowledge, a first in the country. More importantly, the tool made from this approach may reflect the true
satisfaction or dissatisfaction of the patients regarding their whole hospital experience because it was based on matters that had an impact with them during their hospital stay.
In a gist, the following were the flow of events in making the said tool: Patients were interviewed and areas of concern (through patients’ perspectives) were identified in the first phase of the study. Through these categories, a tool was crafted and validated. The self-administered questionnaire/tool developed was pre-tested and the computed Cronbach’s alpha for each of the categories, as well as the Cronbach’s alpha for the scaled portions of the whole questionnaire is excellent. All categories in the questionnaire were further found to have a Cronbach’s alpha greater than 0.8, except for the Pharmacy category, nevertheless, an alpha of 0.78 is still considered good/acceptable. Considering that it takes less than 30 minutes to answer the survey (88% of the respondents), the tool is considered user friendly and can be done after the discharged orders has been given and while awaiting clearance for discharge.
With the survey tool having an excellent reliability (Cronbach’s alpha = 0.96), it is recommended that, in its present form:
1) The survey tool be administered to all the tertiary DOH hospitals to determine the patients’ satisfaction of the services rendered by the said hospitals (Phase 3);
2) Validate the questionnaire to primary and secondary hospitals.
These kinds of surveys are best done at least on a yearly
basis in each hospital. This is to identify which services needs to be improved. More importantly, the feedback given by the patient through the questionnaire should help to improve the work of the physician, hospital itself, and also the system of treating patients.10
___________
References 1. Gayet C, Fernandez-Cerdeno A. Time Location Sampling and
Respondent Driven Sampling. [Online]. [cited 2015 March]. Available from http://iussp2009.princeton.edu/papers/93359.
2. Wikipedia. Phenomenology [Oline]. [cited 2015 March]. Available from http://en.wikipedia.org/wiki/Phenomenology_(philosophy).
3. Hicks S. Understanding Postmodernism: Skepticism and Socialism from Rousseau to Foucault. Tempe, AZ: Scholargy; 2004.
4. Holloway I, Todres L. The status of method: flexibility, consistency and coherence. Qual Res. 2003; 3(3):345-57.
5. Boyatzis RE. Transforming qualitative information: Thematic analysis and code development. Thousand Oaks, CA: Sage; 1998.
6. Ryan GW, Bernard HR. Data management and analysis methods. In: Denzin NK, Lincoln YS, eds. Handbook of Qualitative Research, 2nd ed. Thousand Oaks, CA: Sage; 1998. pp. 769-802.
7. Braun V, Clarke V. Using thematic analysis in psychology. Qual Res Psychol. 2006; 3(2):77-101
8. Santos J, Reynaldo A. Cronbach's Alpha: A Tool for Assessing the Reliability of Scales. J Extension. 1999; 37(2).
9. Bland JM, Altman DG. Cronbach's Alpha. BMJ. 1997; 314(7080):572. 10. Prakash B. Patient Staisfaction. J Cutan Aesthet Surg. 2010 Sep-Dec;
3(3): 151–155.
Patient Satisfaction Tool
61VOL. 49 NO. 4 2015 ACTA MEDICA PHILIPPINA
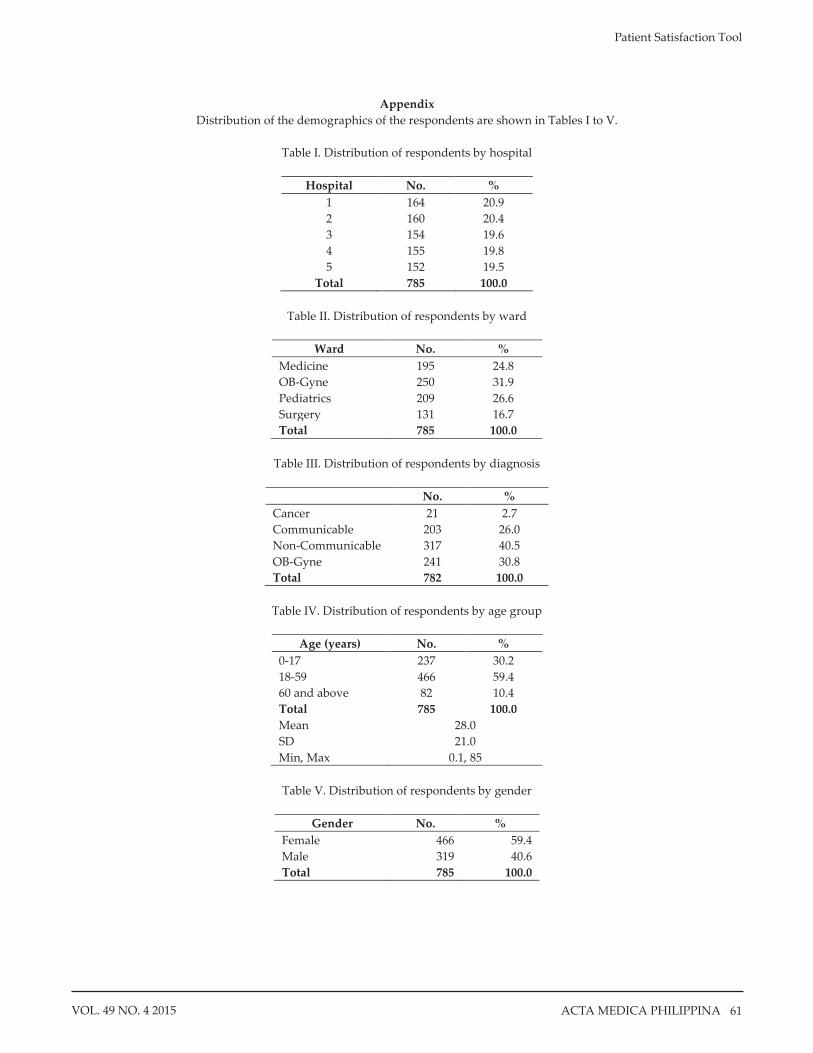
Appendix Distribution of the demographics of the respondents are shown in Tables I to V.
Table I. Distribution of respondents by hospital
Hospital No. %
1 164 20.9 2 160 20.4 3 154 19.6 4 155 19.8 5 152 19.5
Total 785 100.0
Table II. Distribution of respondents by ward
Ward No. % Medicine 195 24.8 OB-Gyne 250 31.9 Pediatrics 209 26.6 Surgery 131 16.7 Total 785 100.0
Table III. Distribution of respondents by diagnosis
No. %
Cancer 21 2.7 Communicable 203 26.0 Non-Communicable 317 40.5 OB-Gyne 241 30.8 Total 782 100.0
Table IV. Distribution of respondents by age group
Age (years) No. %
0-17 237 30.2 18-59 466 59.4 60 and above 82 10.4 Total 785 100.0 Mean 28.0 SD 21.0 Min, Max 0.1, 85
Table V. Distribution of respondents by gender
Gender No. %
Female 466 59.4 Male 319 40.6 Total 785 100.0