Embed Size (px)
Citation preview

This is the pre-peer reviewed version of the following article: Mona M. Khamis, Darryl J. Adamko and Anas El-Aneed. (2017), Development of a validated LC- MS/MS method for the quantification of 19 endogenous asthma/COPD potential urinary biomarkers. Analytica Chimica Acta, 989: 45-58. which has been published in final form at doi: 10.1016/j.aca.2017.08.007. This article may be used for non-commercial purposes in accordance with Elsevier and conditions for self-archiving.
Development of a validated LC- MS/MS method for the quantification of 19 endogenous
asthma/COPD potential urinary biomarkers
Mona M. Khamis1, Darryl J. Adamko2 and Anas El-Aneed1
1 College of Pharmacy and Nutrition, University of Saskatchewan, Saskatoon, SK, Canada. 2 Department of Pediatrics, College of Medicine, University of Saskatchewan, Saskatoon, SK, Canada.
Abstract
Obstructive airways inflammatory diseases sometimes show overlapping symptoms that hinder
their early and correct diagnosis. Current clinical tests are tedious and are of inadequate specificity
in special population such as the elderly and children. Therefore, we are developing tandem mass
spectrometric (MS/MS) methods for targeted analysis of urine biomarkers. Recently, proton-
nuclear magnetic resonance (1H-NMR) analysis proposed 50 urinary metabolites as potential
diagnostic biomarkers among asthma and chronic obstructive pulmonary disease (COPD) patients.
Metabolites are divided into 3 groups based on chemical nature. For group 1 (amines and phenols,
19 urinary metabolites), we developed and validated a high performance liquid chromatographic
(HPLC)-MS/MS method using differential isotope labeling with dansyl chloride. Method
development included the optimization of the derivatization reaction, the MS/MS conditions, and
the chromatographic separation. Linearity varied from 2 to 4800 ng/mL and the use of 13C2-labeled
derivatives allowed for the correction of matrix effects as well as the unambiguous confirmation
of the identity of each metabolite in the presence of interfering isomers in urine. Despite the
challenges associated with method validation, the method was fully validated as per the food and
drug administration (FDA) and the European medicines agency (EMA) recommendations.
Validation criteria included linearity, precision, accuracy, dilution integrity, selectivity, carryover,
and stability. Challenges in selectivity experiments included the isotopic contributions of the
analyte towards its internal standard (IS), that was addressed via the optimization of the IS
concentration. In addition, incurred sample analysis was performed to ensure that results from
patient samples are accurate and reliable. The method was robust and reproducible and is currently
being applied in a cohort of asthma and COPD patient urine samples for biomarker discovery
purposes.

2
1. Introduction
Asthma and chronic obstructive pulmonary disease (COPD) are a major cause of morbidity and
they impose a huge economic burden with more than 600 million patients are currently diagnosed
with these illnesses [1]. Despite the distinct differences in the pathophysiology of asthma and
COPD, their diagnosis using currently available diagnostic tools is difficult in a typical primary
care setting [2-6]. It is common for some patients to experience an overlap in the clinical
presentations of asthma and COPD or even have both as co-existing conditions [2, 7, 8]. This is
particularly valid with asthmatic smokers, elderly with normally declined lung functions, and those
with more severe asthma [2-4]. Correct diagnosis is crucial as each disease has different
therapeutic strategies [4]. Accordingly, with the inaccessibility of accurate diagnostic tools in
typical primary care settings, the diagnosis of asthma and COPD is too often based on history as
described by the patient. Therefore, recent work has focused on novel approaches to diagnosis.
Metabolomics is the study of the end products of cellular metabolism in healthy and diseased states
[9-12]. Applied metabolomics in medicine aims to link different biochemical pathways with
disease diagnosis, severity, and therapeutic response [11, 12]. It has demonstrated promising
outcomes in biomarker discovery and in personalized medicine [11, 13, 14]. Among the various
biological fluids, urine is ideal for metabolomic analysis. Its collection is non-invasive and it has
richer metabolite content in comparison to blood, saliva, exhaled breath condensate or
bronchoalveolar lavage [9, 10]. Beyond lung disease, urine metabolomics has been mostly studied
for improving the detection of various types of cancer [15, 16], including that in the renal system
[17, 18]. Investigation of the urine metabolome has also included, but not limited to, the diagnosis
of jaundice syndrome [19] and chronic heavy metal toxicity [20], the understanding of

3
pathophysiology of depression [21] and the prediction of acute renal injury following
cardiopulmonary bypass surgery in children [22].
Previous metabolomic studies on asthma or COPD subjects have been conducted in different
biological fluids mostly in untargeted/semi-targeted approach [9, 10]. For instance, a 1H-NMR
study of COPD blood samples showed lower levels of alanine, valine and isoleucine in comparison
to healthy individuals [23]. Using the same platform, exhaled breath condensate (EBC) of COPD
patients revealed significantly lower levels of valine and lysine, while the levels of serine and
tyrosine were significantly higher in comparison to controls [24]. An increase in arginine levels
and a decrease in glutamine, valine and isoleucine levels were also observed in the serum of COPD
patients [25, 26]. On the other hand, the serum of asthmatic patients, using 1H-NMR, showed low
levels of arginine along with valine and alanine, whereas; high histidine and glutamine levels were
observed [27]. It can be concluded from these studies, that amino acids metabolism is an important
pathway in the pathogenesis of asthma and COPD.
Pertaining to urine, comparisons of the metabolomic profiles of healthy participants with either
asthmatic [28, 29] or COPD subjects [30, 31] have been reported. Despite providing useful
metabolomic information, these ‘disease/no disease’ studies are less interesting in clinical practice.
People know when they have chronic trouble breathing. The more important question is knowing
the cause or type of chronic lung disease and the type of treatment it requires. Accordingly,
metabolomics investigating the disease severity in asthma or COPD shows more promise for
translational and personalized medicine in primary care settings [32-34]. However, previous
reports either involved few specific classes of metabolites (e.g. volatile metabolites) [32, 33] or
resulted in the identity confirmation of very few metabolites [34].

4
To move to this important next stage, accurate targeted analysis is needed to clinically validate
potentially therapeutic biomarkers. Contrary to the progress achieved in untargeted metabolomics,
targeted quantification of endogenous metabolites is still at its infancy. Challenges in absolute
quantification include the wide variations in metabolite concentration with diverse
physicochemical properties [12]. In addition, neither endogenous metabolite- free matrices nor
appropriate regulatory guidelines for the validation of bioanalytical methods for endogenous
metabolites are available [35-37].
To the best of our knowledge, only 1 semi-targeted 1H-NMR study investigated the differences in
the urine metabolome between asthma and COPD patients [38]. Based on this investigation, a
group of urine metabolites were suggested as potential diagnostic biomarkers differentiating
asthma and COPD. Before these 1H-NMR based metabolites can be used in a clinical lab, they
require further validation. The suggested biomarkers were sub-divided into 3 groups based on their
functional groups. Group 1 contains 19 metabolites that bear a primary amine, secondary amine or
a phenolic group (Table 1). Group 2 contains 17 organic acids metabolites, whose identities and
their validated quantification method will be described in a separate publication. Finally, group 3
contains 11 miscellaneous metabolites; including: quaternary ammonium compounds, sugars and
nucleic acids as well as amino and organic acids that were not compatible with the developed
methods for groups 1 and 2. Herein, we developed a fully validated LC-MS/MS method for the
absolute quantification of a subset of 19 potential biomarker metabolites for the diagnosis of
asthma and COPD. We adopted the deferential isotope labeling (DIL) approach [39] for the
development of the quantification method. Amine and/or phenol functional groups contained
within our metabolites can be derivatized with 12C2/13C2-Dansyl chloride (DNS-Cl) as described
by Guo et al. [39]. DIL has been mostly used for relative quantification purposes of the

5
metabolome [39-42], however, despite the usefulness of published semi-quantitative studies using
DIL-DNS-Cl, we are required by regulatory bodies a full validation of the analytical method since
clinical data will be obtained. The presented work discusses the usefulness of DIL strategy for
absolute biomarker quantification and approaches to address the challenges typically faced in
endogenous quantitative metabolomics.
Table 1: Chemical structure of investigated metabolites of group 1
Group I (amino acids metabolites)
3-bromotyrosine
OHNH2
O
OH
Br
3-chlorotyrosine
OHNH2
O
OH
Cl
1-methylhistamine
N
N
NH2
CH3
Alanine
CH3OH
O
NH2
Arginine NH2
NH
O
OH
NH2
NH
Asparagine
OH
O
NH2NH2
O
Ethanolamine
NH2
OH
Glycine
NH2
OH
O
Glutamine
NH2
OH
O
NH2
O
Histidine
N
NH
OH
O
NH2
Isoleucine
O
OHCH3
CH3
NH2
Lysine
O
OH
NH2
NH2
Sarcosine
CH3
NHOH
O
Serine
O
OH
NH2
OH
Threonine
CH3 OH
O
NH2
OH
Tyrosine
OHNH2
O
OH
Tryptophan
NH
NH2
O
OH
Taurine
NH2
S
OH
O
O
Valine
O
OHNH2
CH3
CH3
2. Experimental
2.1. Materials and chemicals
All chemicals were purchased from Sigma Aldrich (Oakville, ON, CA) unless otherwise stated. 3-
bromo tyrosine (98%) was purchased from abcam (Cambridge, UK) and sarcosine (99.4%) was
6
purchased from Santa Cruz biotechnology (Santa Cruz, CA, USA). Optima® LC-MS grade
acetonitrile (ACN) and water was purchased from Fischer Scientific (ON, CA). The concentration
of creatinine within subject samples was determined using Jaffe’s colorimetric reaction using
QuantiChrom™ creatinine assay kit (QC, CA) [43, 44].
2.2. Synthesis of 12C2 /13C2-DNS-Cl
13C2-DNS-Cl bears 2- 13C-methyl groups attached to the amino terminal within the naphthalene
moiety of reagent. Structures of 12C2/13C2 -DNS-Cl are compiled in Supplemental materials
(Appendix I, Figure 1). The 13C2-labeled reagent was not available commercially. Accordingly, it
was synthesized in house along with the non-isotopic form in a 2-step reaction procedure [39, 45,
46]. Synthesis protocol was modified from published methodologies in order to produce the
highest yield of DNS-Cl (Supplemental materials (Appendix I, Figure 1)). The combination of the
2 step reaction is novel to the published methodology reported for the production of 12C2/13C2-
DNS-Cl in metabolomics [39]. The use of the commercially available 12C2-DNS-Cl was avoided
because of its inadequate purity demonstrated by the precipitation of a white residual powder in
ACN at the working concentration of the reagent. On the other hand, the 2 synthesized forms of
DNS-Cl (12C2 -and 13C2-) were readily soluble in ACN without any insoluble matter, and were
consequently used throughout the work.
2.3. Patients characteristics
Patients were enrolled after obtaining written informed consent, as approved by the University of
Saskatchewan’s biomedical research ethics board. Patients, seen at the Royal university hospital,
Saskatoon, SK, were selected within an age group of 40-69 years old and were clinically assessed
by a physician. Samples analyzed were age and gender matched as much as possible. No diet or

7
time of collection restrictions were followed as the aim of the experiment was to identify
metabolites that were sufficiently altered between asthma and COPD patient groups at a level that
surpasses such variation. Urine samples collected from 42 patients were analyzed in this work.
Patients’ characteristics are as follows; gender (females: 59.5%), body mass index (BMI: ≤25;
45%, 25.1-30; 33%, 30.1-40; 14% and >40; 12%), age (40-50 years; 12%, 51-60 years; 48%, 61-
69 years; 40%).
2.4. Preparation of standard solutions
A standard stock solution for each standard reference analyte was separately prepared at 3 mg/mL
in 50% ACN. For solubility/sensitivity aspects, the following exceptions were made; sarcosine
and asparagine were prepared at 1.5 mg/mL in 50% ACN, tyrosine at 3 mg/mL in 0.1 M HCl and
3-bromotyrosine and 3-chlorotyrosine at 3 mg/mL in water.
A. 12C2-derivatized analytes stock solution preparation
Aliquots from the aforementioned analyte standard stock solutions were combined to prepare a
standard working stock solution mixture of the 19 underivatized analytes at concentrations varying
from 12.5 to 160 µg/mL. The basic derivatization reaction was adopted from Dr. Liang Li’s group,
University of Alberta, Canada [39, 47]. However, changes to the experimental conditions were
needed to optimize the reaction. The procedure was tailored to accommodate the introduction of
the 13C2-derivatized ISs mixture in calibration, validation (quality control, QC) solutions and
patients’ samples.
Briefly a volume of 50 µL of the working stock solution was mixed with 30 µL
bicarbonate/carbonate buffer (pH 9.4, 0.5 M) and 40 µL 12C2-DNS-Cl (10.13 mg/mL in ACN).
The mixture was vortexed for 10 sec, spun down and placed in a thermostatically controlled water

8
bath at 60 ºC for 30 minutes. Excess DNS-Cl was quenched through the addition of 10 µL 0.25 M
NaOH with further heating at 60 ºC for 10 min. Seventy µL of 300 mM formic acid (FA) in 50%
ACN were added to acidify the medium and the resulting solution is referred to, further on, as the
12C2-derivatized analytes stock solution. For the preparation of calibration standard solutions and
QC samples, aliquots from the 12C2-derivatized analytes stock solution were appropriately diluted
in 50% ACN to a volume of 40 µL and spiked into 60 µL of blank surrogate urine matrix containing
10 µL 13C2-derivatized ISs solution. The mixtures were transferred into HPLC vials equipped with
100 µL inserts for analysis.
B. 13C2-derivatized internal standards (ISs) preparation
13C2-DNS-Cl (10.13 mg/mL in ACN) was used for the derivatization and the reaction mixture was
completed to 250 µL with 50% ACN. A volume of 10 µL of the aforementioned solution
introduced the optimized concentration of the 13C2-derivatized ISs into the final mixtures.
2.5. Urine preparation
A. Blank surrogate urine matrix preparation
A pooled urine sample was prepared by mixing equal aliquots from 32 asthma patients, 6 COPD
patients and 23 healthy controls. Pooled urine was stored in aliquots at -80 ºC and derivatized as
previously described using ACN instead of 12C2-DNS-Cl. This matrix was used in the dilution of
standard solutions, QC samples as well as urine samples for the quantification of highly abundant
metabolites.
B. Patient’s urine sample preparation

9
Following collection, samples were promptly placed at -80 ºC. Within 1 week of expected sample
analysis, samples were thawed to room temperature and divided into aliquots then refrozen at -80
ºC. At the time of the analysis; individual urine aliquots were allowed to thaw at room temperature
and were 2 fold diluted with ACN, vortexed and centrifuged at 13,000 rpm for 10 min. A volume
of 50 µL of the supernatant solution was derivatized as previously described in 2.4.A. Following
the addition of 300 mM FA in 50 % ACN, 50 µL of the resulting solution were diluted into 50 µL
50% ACN containing 10 µL 13C2-derivatized ISs. The final solution was transferred to an HPLC
vial for analysis. For metabolites frequently present at high concentration (i.e. glycine, alanine,
histidine and glutamine), derivatized urine samples were appropriately diluted with blank
surrogate urine matrix. Fifty µL of the appropriate dilution were mixed with 50 µL of 50% ACN
containing 10 µL 13C2-derivatized ISs.
2.6. Instrumentation
LC-MS/MS analysis was performed on a 1200 Agilent HPLC system (Mississauga, ON, Canada)
interfaced to an AB Sciex 4000 API QTRAP instrument (AB Sciex, Concord, ON, Canada). The
optimized instrumentation settings for chromatographic separation, derivatized analytes
identification and quantification are compiled in Supplemental Tables (Table 1).
2.7. Method Validation
A. Matrix effects and suitability of the blank surrogate urine
We introduced the blank surrogate urine matrix approach to simulate derivatized urine and to be
used in standards and QC samples preparation as well as in the dilution of highly concentrated
patient samples. Matrix effects encountered from the blank surrogate urine matrix were evaluated
according to equations 1, 2 as recommended by the European medicines agency (EMA) [36] using

10
high QC (HQC; 83% of upper limit of quantification (ULOQ)) and low QC (LQC; 2.6 × the lower
limit of quantification, LLOQ) samples. Six replicates at low and high QC levels were prepared as
described under 12C2-derivatized analytes stock solution preparation and spiked into 6 different
surrogate urine matrices prepared from 6 different sources of control urine according to the
procedure in 2.5.A. The absolute peak areas of the derivatized analytes were compared to those of
analogues QC samples prepared in 50% ACN (i.e. neat solvent) [35, 36, 48]. The EMA also
recommends the calculation of the CV% of IS normalized matrix factor (MF), where a CV% value
of less than 15% indicates acceptable interferences from the matrix [36].
Equation 1: Matrix factor (MF) = B/A
Equation 2: IS normalized MF = MF analyte/MF IS
Where B is the absolute peak area of the analyte in surrogate urine matrix and A is the
absolute peak area of the analyte in neat solvent (50% ACN).
In addition, the U.S. Food and Drug Administration (FDA) recommends the comparison of the
slopes of the calibration curves as a mean to evaluate matrix effects in ligand binding assays. [35]
This approach is adopted to test the suitability of the surrogate blank urine as a valid substitute
matrix for real derivatized urine. The methodological approach is described in details in Appendix
II, supplementary materials.
B. Selectivity
Six double blanks containing only solvents and acidic/basic reagents (i.e., no analytes or DNS-Cl)
were prepared and spiked into 6 blank surrogate matrices prepared from 6 different sources of

11
control urine according to the procedure in 2.5.B. The interferences experienced at the retention
times of the 19 derivatized metabolites or their analogues 13C2-derivatized ISs were measured and
the absolute peak areas were compared to that of the mean LLOQ according to equation 3. The
method is deemed selective for an analyte and its 13C2-derivatized IS if the interferences observed
in the double blanks are less than 20% and 5% of LLOQ, respectively [36].
Equation 3: = Standard or IS MRM channel =��������������������������
������������������× 100
C. Carry over effects
Carry over effects were investigated according to EMA guidelines [36]. The responses in blank
solutions injected after highly concentrated samples were compared to that of the LLOQ. Carry
over effects can be deemed insignificant if the interference observed in the subsequent blanks is
less than 20% and 5% of LLOQ for the analyte and its corresponding IS, respectively [36].
D. Linearity
For the construction of 8 points-calibration curves, volumes from the 12C2-derivatized analytes
stock solution were serially diluted with 50% ACN. Forty microliters of the appropriate dilution
were mixed with 60 µL blank surrogate urine matrix containing 10 µL 13C2-derivatized ISs
solution. Regression equations of the peak area ratios vs. the corresponding concentrations were
generated using the least square regression model with a weighing factor of 1/x2. For accepting the
calibration curve for each analyte; the back calculated concentration of the calibration points had
to fall within 15% of the nominal concentration with the exception of the LLOQ which can tolerate

12
up to 20% difference. At least 75% (6 out of 8) of the calibration points must fulfil this criterion
[35, 36, 49]. The lower limit of quantification was determined according to the signal-to-noise
ratio. The analyte response at the lowest end of the calibration curve should be at least 5 times
higher than the signal encountered at the blank [35, 36].
E. Intra- and inter- day accuracy and precision
The intra- and inter-day accuracy and precision of the developed method were assessed, on 3 non
consecutive days, using 4 QC levels covering the range of the calibration curves [35, 36, 49]. The
HQC was set at 83% of the ULOQ. The middle QC (MQC) was set at 42% of the calibration range
and the lower QC (LQC) was 2.6 times the concentration of the LLOQ. The LLOQ is the fourth
level of the QC samples. QC samples were prepared from different stock solutions in 6 replicates,
spiked into surrogate urine matrix and analyzed on 3 different days for the evaluation of inter-day
accuracy and precision. The mean of the observed concentration must be within 15% of the
nominal concentration for all levels with the exception of the LLOQ (within 20%). In addition, it
must not deviate from the nominal concentration more than 15 % with the exception of the LLOQ
in which a coefficient of variation (CV%) of 20% is still acceptable [35, 36, 49].
F. Stability studies
Stability was assessed using freshly prepared QC samples at multiple levels including benchtop
stability, autosampler stability, freeze thaw stability, and short- and long-term stability. Details of
the stability experiments are shown in Appendix III, supplementary materials.
G. Dilution integrity

13
An aliquot from 12C2-derivatized analytes stock solution was spiked into surrogate urine matrix to
produce a simulated urine sample in which the concentrations of the analytes are 6.7 folds higher
than the ULOQ. Aliquots from this solution were 5, 10 and 20 fold diluted with blank surrogate
urine and 50 µL of each were mixed with 50 µL of 50% ACN containing 10 µL of 13C2-derivatized
ISs. Patients’ samples that were initially analyzed early in the method development phase and were
found to contain analytes at concentrations above their ULOQ, especially for histidine, were used
to evaluate the investigated dilution range. After derivatization, these patients’ urine samples were
diluted using blank surrogate urine matrix and reinjected into the system. This experiment was of
particular importance in order to confirm the appropriateness of the tested dilution range before
the application of the validated method on the study samples.
H. Incurred sample analysis
In addition to QC samples, the accuracy and precision of the developed method were also evaluated
on patient urine samples. Four patient samples were selected so that they would contain very low,
very high and middle creatinine values amongst the analyzed patient samples. Sample analysis
was done over 2 consecutive days and a third day which was 2 weeks apart. The concentrations of
the analytes obtained from their reanalysis should be within 20% of their mean for at least 67% of
the repeats [36]. Since, guidelines adopt similar cut-off values for the acceptance of method
accuracy and precision, a CV% value of up to 20% was also deemed appropriate for the evaluation
of the precision of the analysis.
2.8. Analysis of patient urine samples
Asthma and COPD patient urine samples were processed as described under 2.5.B. along with
calibration and validation standards. The analytical run was started by equilibrating the instrument

14
with triple injections of a HQC sample [50]. This was done to ensure the acceptable performance
of the system before the analysis of a sample batch [50]. The batch was also ended by triple
injection of the high QC sample to ensure system suitability throughout the batch [50]. Each batch
consisted of double blank, blank, 8- point calibration set, 3 levels of QC samples prepared in
duplicate and urine samples [35, 36]. To minimize any chances of carry over effects, samples
were arranged ascendingly according to their creatinine values. Data from the QC samples provide
the basis of accepting or rejecting a single run. At least 67% of the QC samples must fall within
15% of their respective nominal values. At least 50% of the QC samples at each level must fulfil
this criterion [35, 36, 49].
3. Results and Discussion
3.1. Rationale for adopting DIL strategy
DNS-Cl is a well-established derivatizing reagent that readily reacts with primary and secondary
amines as well as phenols in alkaline medium [51]. It is, therefore, an ideal choice for the targeted
19 metabolites. Chemical derivatization enhances the chromatographic separation of such polar
and low molecular weight metabolites on conventional reversed stationary phases (e.g. C18) [39].
In addition, derivatization unifies, to some extent, the physicochemical properties of the produced
derivatives bearing the same signature dansyl moiety [39]. Derivatization can also improves ESI
ionization [39-41] and the introduced tag, such as DNS shift low molecular weight metabolites by
234 Daltons out of the low m/z region that typically exhibits high background noise, allowing for
improved detectability [39].
Most importantly, DIL can address one of the major hurdles in absolute metabolite quantification
that is the availability of suitable internal standards (IS). Structural analogues cannot guarantee the

15
accuracy and precision of quantification [39, 52] and the use of isotopically-labeled ISs is
challenging due to their price or commercial availability [39, 53]. DIL technique uses 2
isotopologues of a derivatizing reagent to produce light and heavy (deuterated or 13C-containing)-
derivatized metabolites. DIL using DNS-Cl allowed for the generation of a stable isotope IS for
each target metabolite of the 19 targeted molecules, as discussed below.
3.2. Method development
3.2.1. Optimization of the derivatization reaction and sample preparation
Since the metabolites of interest are endogenous in nature; it was essential to optimize the reaction
conditions in patient urine samples and in the standard mixture (data not shown). Each
derivatization reaction condition was varied while keeping all other conditions constant. Heating
temperature was tried at 45 ºC and 60 ºC, while the heating time was investigated at 15, 30, 45 and
60 min. Both conditions were optimized at 60 ºC and 30 min, respectively. Finally the reagent
volume was tried at 20, 40, 60 and 80 µl and the volume was optimized at 40 µl. Heating the
reaction mixture for a period of 60 min at 60 ºC as reported [39, 47] did not add any significant
enhancement in the obtained responses, particularly, in the urine sample. In addition, no significant
advantage was obtained by using the same volume from a relatively high concentrated 12C2-DNS-
Cl solution (20 mg/mL).
A volume of 30 µL of 0.5 M carbonate/bicarbonate buffer (pH 9.4), was sufficient to create the
basic medium necessary for a reproducible dansylation reaction in urine and standard solutions.
Higher volumes of the buffer were associated with an incompatible high salt content manifested
as phase separation in the reaction mixtures. Although the basic method was based on published

16
work [39, 47], the optimization experiments favored a shorter reaction time with much less reagent
content, and consequently, less contamination/ion suppression in the mass spectrometer.
Another vital element of the derivatization reaction is the composition of the organic/aqueous
medium. A medium of 54% ACN was essential to prevent phase separation of the organic DNS-
Cl solution in the reaction mixture following derivatization. Interestingly, a similar observation of
solvent incompatibility was reported along with the formation of an unknown precipitate in the
reaction medium that contained 33% ACN [42]. However, increasing the ACN content to 50%
was sufficient to overcome both issues [42].
For the optimization of patient samples preparation, urine was 1:1 diluted with ACN and
centrifuged at 13,000 rpm for 10 min. Enhancement in the analytical signals was not observed
upon the filtration of the supernatant with 0.2 or 0.45 µm PVDF filters (data not shown). Therefore,
for the sake of simplicity and metabolite loss prevention, 50 µL aliquots from the centrifuged
supernatant were directly transferred into the reaction vial for derivatization.
Pertaining to the stoichiometry of the reaction; histidine and lysine bear 2 primary amino groups,
while tyrosine and bromo- and chloro- derivatives of tyrosine bear a primary amine and phenolic
functional groups. The reaction of these metabolites with DNS-Cl could proceed either in a 1:1
[54] or 1:2 [39] stoichiometric fashion. We found that, under the derivatization conditions
described above, the mono tagged tyrosine compounds represented less than 10% of the double
derivatized products. In the case of lysine, 70% of the derivatized entity was a double tagged
species. Histidine formed an almost equal ratio of both forms. The consistency of the
stoichiometric behavior was assured through 2 main observations; a) the derivatization
optimization experiments and b) DNS-Cl hydrolytic product.

17
The optimization of 12C2-DNS-Cl concentration/volume confirmed that no improvements in the
intensity of the double tagged species were observed with higher concentrations/volumes of the
reagent. On the other hand, heating the reaction mixture for an additional 10 min period in the
presence of NaOH resulted in the hydrolysis of excess DNS-Cl into dansyl hydroxide [51]. The
presence of dansyl hydroxide, monitored at m/z 252.1>170.1 in the injected standards and urine
solutions confirmed that a remaining unreacted portion of DNS-Cl was indeed present at the end
of the derivatization reaction and was successfully hydrolyzed with NaOH. Based on the above
findings, transitions corresponding to the double tagged species were selected for all of the
aforementioned analytes bearing 2 potential reaction sites allowing for a 4.01 Da difference
between each analyte and its corresponding IS. In addition, the double tagged metabolites were of
higher hydrophobicity and were consequently well separated from other mono-tagged metabolites.
The enhanced ionization of the double tagged metabolites due to the higher organic solvent content
needed for their elution allowed for higher sensitivity during quantification.
3.2.2. Optimization of the mass spectrometric detection and quantification
The MS/MS fragmentation pattern for each derivatized metabolite was generated and rationalized.
Product ions observed from the collision induced dissociation (CID)-MS/MS of the derivatives
contained the dansyl moiety and that was in agreement with the reported fragmentation behavior
of the reagent [47].
The most abundant product ions for all metabolites are observed at m/z 157.09 and m/z 170.1,
corresponding to the methyl amino naphthalene and dimethylamino naphthalene charged moieties,
respectively (Figure 1) [47]. In order to allow for adequate mass spectrometric separation at unit
resolution between each analyte and its IS, it was favorable to maintain the isotopically labeled

18
methyl groups within the selected MRM transitions to achieve a mass difference of 2 mass units.
For this reason, the product ion at m/z 170.1 was selected as the quantifier transition for all analytes.
The collision energy and declustering potential were optimized for each analyte for maximum
generation of the quantifier product ion. Additionally, diagnostic product ions were identified,
whenever possible, for each analyte to confirm its identity in patient urine samples (Supplemental
Tables (Table 1)).
Figure 1: Schematic representation of the general fragmentation pattern of the dansylated analyte.

19
3.2.3. Optimization of the chromatographic separation
Adequate separation of all analytes was achieved over 33 minute run using the optimized binary
gradient mobile phase system (Figure 2). The presence of a perfectly co-eluting IS bearing 13C2-
carbons for each metabolite aided in its unambiguous identification in complex patient urine
samples. For instance, urine samples contained multiple isomers of isoleucine that could also react
with dansyl chloride. The secondary diagnostic product ion at m/z 350 was also present within the
closest eluting peak to isoleucine which can be probably attributed to leucine (Supplemental
materials, Appendix IV, Figure 2)). However, the combination of retention time matching with
standard isoleucine peak in addition to pairing with 13C2-derivatized IS added absolute confidence
in its quantification. LC base-line resolved unidentified isomeric dansylated metabolites peaks
were also noticed for alanine and arginine.
Figure 2: Representative extracted ion chromatogram of the optimized method for the
quantification of 19 dansylated analytes in standard mixture.
XIC of +MRM (58 pairs): 295.110/170.100 Da ID: EtNH2 from Sample 6 (4) of DataSET1.wiff (Turbo Spray) Max. 9.4e5 cps.
2 4 6 8 10 12 14 16 18 20 22 24 26 28 30 32Time, min
0.0
1.0e5
2.0e5
3.0e5
4.0e5
5.0e5
6.0e5
7.0e5
8.0e5
9.0e5
1.0e6
1.1e6
1.2e6
1.3e6
1.4e6
1.5e6
1.6e6
1.7e6
1.8e6
1.9e6
2.0e6
2.1e6
2.2e6
2.3e6
2.4e6
2.5e6
2.6e6
In
te
ns
ity
,
cp
s
8.29
TAU
Cl-TYR
ETNH2
GLY
ALA
SAR
SER
THREO
ARG
ASP
1MH
VAL
TRP
GLU
ISO
LYS
HIS
TYR
Br-TYR

20
3.3. Method validation
The guidelines for bioanalytical method validation issued by the FDA [35, 49] and EMA [36] were
followed. Despite being inclusive platforms for pharmaceutical/biomedical analyses, these
guidelines were not always sufficient to address the challenges associated with endogenous
metabolite quantification. In the following discussions; validation criteria of these guidelines are
discussed along with atypical analytical/statistical approaches that were adopted to meet the
unforeseen challenges identified during method development and validation.
Evaluation of blank surrogate urine matrix suitability
The FDA recommends the use of the same sample matrix for the construction of calibration curves
and QC samples [35, 49]. However, this is not feasible when conducting a metabolomic study,
where the metabolites of interest are endogenously present in the blank matrix. With the absence
of guidelines on the acceptable matrix for standard preparations in metabolomics, various
strategies have been employed including the use of solvents of reconstitution, simulated and
stripped matrices, biological fluids with low endogenous concentration of metabolites, standard
addition method or deuterated surrogate analytes [37, 55-57].
On the other hand, underivatized urine was recently used as a surrogate matrix to which derivatized
analytes were added [58]. The latter approach seemed, in principle, as the best strategy to adopt in
this work. However, the derivatization procedure involved the addition of Na2CO3/NaHCO3
buffer, NaOH and FA that could change the nature of the urine (i.e. the matrix). Therefore, we
introduced the surrogate blank urine matrix approach. Modified student t- test was used for the
comparison between surrogate and derivatized matrices [58, 59]. t-test values were always lower
than t-critical values at p= 0.05 suggesting the insignificant difference between both matrices.

21
Therefore, the use of the surrogate urine matrix provided the most accurate concentration within
the real derivatized patient samples (Supplemental Tables (Table 2)).
Evaluation of matrix effects
The FDA states that the identification and elimination of matrix effects should be investigated
during the development phase of an LC-MS/MS method, however, it does not provide any
guidelines on the evaluation of such effects [35]. On the other hand, specific guidelines on the
evaluation of matrix effects have been compiled by the EMA [36]. We found that the matrix factor
was 96-130%, where, the majority of analytes suffered from low ion enhancement effect
(Supplemental Tables (Table 3)). This effect, not commonly seen in MS, was further confirmed
through the comparison of the slopes of calibration curves generated in surrogate blank urine and
neat solvent (50% ACN) (Supplemental materials, Appendix V (Figure 3)). The vast variation in
the obtained slopes further confirmed the unsuitability of the solvent as a substitute to the surrogate
blank urine or derivatized urine samples (Supplemental materials, Appendix V, (Figure 3)).
The CV% of IS normalized MF was lower than 15% in the developed method. In fact, the average
values of the IS normalized MF were almost close to unity for all metabolites which indicates a
very close similarity in the MS response between the analyte and it’s IS, typically satisfied with
the use of isotope coded IS (Supplemental Tables (Table 3)) [57]. As such, the elution of a pair of
chemically and physically similar compounds provides the best correction of matrix effects
encountered from the urine.
Selectivity
Selectivity is described as the ability of the analytical method to unequivocally identify and
quantify the analyte of interest in the presence of other components within a biological matrix [35,
36]. The FDA recommends the use of 6 different sources of the blank biological matrix to confirm

22
the selectivity at the LLOQ. However, the acceptance values for a selective method were not
suggested [35]. On the other hand, the EMA guidelines specify that within the double blanks,
interferences should be less than 20% and 5% of LLOQ of the analyte and its corresponding IS,
respectively [36].
As seen in Table 2, interferences encountered at the analyte and the IS channels for the 19
metabolites were found to be less than 14 and 2%, respectively. If only these guidelines were to
be followed, such results would be sufficient to confirm the selectivity of the developed method
for the 19 metabolites [35, 36]. However, due to the use of 13C2-labeled internal standards that
differ from their 12C2- counterparts by merely 2 mass units, other challenges were associated with
the IS purity and its natural isotopic contribution. This necessitated extra analytical assessments
which were not specifically mentioned in the currently available bioanalytical method validation
protocols. Such challenge is expected as clinical metabolomics is relatively a new area of
investigation with little reports available on validated methods for absolute quantification.
The first interference, IS purity, is expected to arise from any 12C2-DNS-Cl impurity in the 13C2-
DNS-Cl that will eventually result in the false positive estimation of the analyte’s concentration
[60]. The 12C2- impurity within 13C2-reagent would react in the IS reaction mixture giving rise to
12C2-derivatized analyte. In addition, the amount of the produced 13C2-derivatized IS would be less
than the expected theoretical values. Being expressed as a ratio, the responses at the lower end of
the calibration curve will be the most affected by any impurity of the used IS. In general, it can be
argued that despite the absence of guidelines to evaluate the isotopic purity of DIL IS, the FDA
and EMA recommendations can be still applicable if the 12C2-impurities within the 13C2-
derivatized are treated as other interferences at the analyte’s MRM channel.

23
Accordingly, in order to address purity issues, the typical selectivity experiment was repeated,
however, the double blanks were spiked with the optimized 13C2-derivatized concentration with
no 12C2-analytes added. Contributions from 12C2-impurities were then evaluated at the analytes
channel. As shown in Table 2, these interferences were below 20% for all analytes; in fact all of
them were below 12% with the vast majority below 7% (Table 2). This assessment confirms the
adequate purity of the 13C2-reagent and accordingly, the adequate purity of the IS-produced
derivatives.
The second source of interference is the contribution of the [M+H+2]+ natural isotopic peak of the
12C2-analyte on its IS’s Q1/Q3 transition. This contribution is more critical for all metabolites
bearing 1 dansyl tag as each IS differs from its 12C2-analyte by 2 mass units. On the other hand,
doubly derivatized ISs, namely, 13C4-lysine, 13C4-histidine, 13C4-tyrosine, 13C4-chloro- and 13C4-
bromo-tyrosine have adequate mass separation beyond the natural isotopic pattern of their
analogues 12C4-analytes (4.01 units).
For singly tagged compounds, the isotopic interference is more significant at the higher end of the
calibration curve. At high concentrations of the analyte, its [M+H+2]+ isotopic peak concomitantly
increases resulting in a false increase in the IS peak area also being integrated at the [M+H+2]+
channel. Consequently, a possible false negative estimation of the analyte response, expressed as
a ratio relative to the IS, is possible leading to a non-linear relationship (Supplemental materials,
Appendix VI (Figure 4)). The isotopic contribution can be corrected either through subtraction or
applying algorithm programs for deisotoping or via narrowing the linear range to avoid the
significant contribution of the analyte at higher concentration [60-62]. Neither of these approaches
were suitbale solution during the development/validation phase of this method, taking into account
that a wide linear range was needed to cover the vast variation in concentrations among different

24
metabolites. In addition, each metabolite can also considerably vary in concentration among urine
samples depending on the hydration state of a patient. And for the sake of the method’s simplicity,
an extra correction step that would need an in-house computer program was sought to be avoided.
Alternately, another approach was adopted in which the concentration of the IS is increased so that
the effect of the isotopic contribution from its analyte become negligible [60]. Logically, the
maximum possible isotopic contribution would be encountered at the ULOQ. For this reason,
triplicates of the ULOQ were prepared without the inclusion of the IS and were analyzed. The
mean response due to the contribution of the analyte’s isotopic peak was calculated at the IS’s
channel. ISs spiked at concentrations equivalent to 66% of the ULOQ resulted in isotopic
interferences less than 3% in the IS’s peak area which did not compromise the validity of method’s
linearly, accuracy and precision (Table 1, Supplemental materials, Appendix VI, (Figure 4)).

25
1Mean % Response = (Area double blank/mean LLOQ Area) ×100, n (double blank)= 6, n (LLOQ)= 3
2Mean % Response = (Area blank/mean LLOQ Area) ×100, n (blank)= 6, n (LLOQ)= 3
3n (ULOQ)=3
Selectivity Purity of
13C2-DNS-Cl
Isotopic
contribution
Analyte
Mean % Response of
double blank at the
analyte channel ±
SD1
Mean % Response of
double blank at the IS
channel ± SD1
Mean % Response
of blank at the
analyte channel±
SD2
Mean % isotopic
contribution of the
ULOQ on the IS
channel ± SD3
SAR 5.34 ± 2.51 0.79 ± 0.47 6.3 ± 0.7 1.10 ± 0.31
1MH 2.20 ± 1.40 1.77 ± 2.03 2.6 ± 1.6 2.18 ± 0.43
ISO 6.75 ± 2.79 1.58 ± 1.21 9.4 ± 0.8 1.09 ± 0.41
VAL 6.78 ± 1.25 1.26 ± 0.91 11.3 ± 1.4 1.16 ± 0.42
3BrTyr 1.49 ± 0.75 1.55 ± 0.99 7.0 ± 9.2 2.43 ± 0.57
3ClTyr 1.02 ± 0.82 0.75 ± 0.85 2.3 ± 2.1 0.92 ± 0.26
HIS 8.38 ± 5.27 0.82 ± 0.57 8.8 ± 9.9 0.15 ± 0.04
THRE 7.39 ± 0.84 1.17 ± 0.64
7.1 ± 2.4
1.42 ± 0.26
TRP 4.69 ± 1.89 0.69 ± 0.51 6.8 ± 1.8 0.99 ± 0.27
ALA 8.42 ± 1.39 1.61 ± 0.49 9.5 ± 1.7 1.53 ± 0.30
GLU 4.52 ± 3.64 0.97 ± 0.95 5.3 ± 1.7 1.15 ± 0.21
TYR 2.91 ± 1.97 0.54 ± 0.64 4.5 ± 4.6 0.30 ± 0.07
SER 13.40 ± 4.38 1.32 ± 1.17 8.7 ± 4.7 1.29 ±0.24
ARG 3.38 ± 2.40 1.09 ± 1.56 2.5 ± 1.6 1.60 ±0.27
GLY 9.09 ± 2.03 0.63 ± 0.45 8.3 ± 2.7 1.47 ±0.22
EtNH2 5.80 ± 4.35 0.53 ± 0.52 7.0 ± 0.6 2.39 ±0.05
TAU 5.43 ± 3.01 0.89 ± 0.46 5.5 ± 1.8 1.42 ±0.08
ASP 4.08 ± 3.11 0.58 ± 0.42 5.1 ± 3.3 1.15 ± 0.16
LYS 1.79 ± 1.34 0.52 ± 0.47 0.5 ± 0.5 0.37 ± 0.15
Table 2: Selectivity of the developed method, purity and isotopic contribution assessment of the 13C2-
DNS-Cl

26
Carry over effects
No specific recommendations are available in the FDA guidelines for the evaluation of carry over
effects, therefore, the EMA guidelines were used [35, 36]. Briefly, blank urine samples were
analyzed following the injection of the ULOQ of the calibration curve as well as selected patient
samples with high analyte concentrations. The responses obtained at the analyte channel in these
blank solutions did not exceed 20% of that of the LLOQ indicating a negligible carry over
(Supplemental Tables (Table 3)). However, during the processing of a preliminary batch of 12
patients’ samples, 2 metabolites in 2 samples showed carry over effects in their subsequent blank
injections. No relationship was identified between the observed carry over effects and the
contained analyte concentration; in fact, the analytes were within their linear ranges. This
observation can be probably explained by the late elution of residues that had been retained on the
column from previously highly concentrated solutions injected over time [57].
To further avoid the rare possibility of carryover, we routinely injected blank samples after the
ULOQ or HQC. Patient samples were also arranged ascendingly as per their creatinine values. The
frequency of blank injection was increased towards the analysis of patient samples with high
creatinine values. The autosampler needle was also washed using 5% isopropanol between the
injected samples.
Lower limit of quantification and linearity
The LLOQ was determined based on the regulatory guidelines, in which, at the LLOQ, each
analyte peak area mean (n=6) is at least 5 times higher than that observed at the double blank [35,
36]. For validating method linearity, a set of 8 calibration standards was used to construct a 200
fold linear curve for each derivatized analyte over the concentration ranges compiled in
Supplemental Tables (Table 4). At least 75% of the calibration standards; 6 points including the
LLOQ and ULOQ, showed acceptable deviations from their nominal values (±20% for LLOQ,

27
±15% for the other points). As seen in Supplemental Tables (Table 4), satisfactory linear
relationships were achieved (r2 ≥0.990).
Linearity was first constructed using the simple least square regression model. In order to assess
the homoscedasticity of the regression analysis; an F-test for the variances of LLOQ and HQC
samples was conducted [63]. For all analytes, Fexperimental was larger than Fcritical indicating the
necessity of a weighing factor to correct for the influence of the standard deviation of the large
concentrations on the lower ones (Supplemental Tables (Table 5)). Factors of 1/x and 1/x2 were
tested and CV% for each calculated regression concentration was computed against the nominal
value. For all analytes, a factor of 1/x2 resulted in the least sum of absolute CV% values across the
whole calibration range, and consequently, 1/x2 was used for curves weighing (Supplemental
Tables (Table 5)) [63].
Intra- and inter day accuracy and precision
As seen from the data gathered in Supplemental Tables (Tables 6 and 7), acceptable intra- and
inter- day accuracies were demonstrated through the % recovery (%R) values that were between
85% and 115% at all levels, as per the FDA and EMA guidelines [35, 36]. Intra and inter-day
precision was also acceptable with a CV% less than 17% for the LLOQ and less than 15% for all
other levels.
Stability
Stability studies were mainly conducted to ensure that the concentrations of the derivatized
metabolites are not varied under conditions that are likely to be encountered during sample
processing and analysis. On a routine basis, 3 hours was the average sample processing time for a
set of 15 patient samples along with the needed standards and QC solutions. For this reason, HQC
and LQC samples (5 replicates) were processed as described and they were set aside for an

28
additional 4 h period at room temperature. QC samples analyzed against freshly prepared
calibration standards were stable for 4 h, where their % R values were between 95% and 112%
and their CV% values were less than 10% (Supplemental Tables (Table 8)).
In addition to sample processing times, the relatively lengthy chromatographic run time
necessitated the evaluation of the autosampler stability. QC samples were found stable for 48 h at
4 ºC (Supplemental Tables (Table 8)), thus allowing for overnight collection of data from patient
samples.
Freeze-thaw stability was also evaluated by exposing the prepared QC samples for 3 cycles of
freezing to -80 ºC and thawing to room temperature. Freezing time in each cycle was not less 12
h. Again, derivatized QC samples were found stable (Supplemental Tables (Table 8)). Although
our standard operating procedure recommends the analysis of freshly prepared patient samples,
the freeze-thaw stability of the processed samples showed that refreezing is possible during
unforeseen instrument down times.
Short and long term storage stability for 2 weeks and 3 months, respectively, was also appraised.
From the data gathered (Supplemental Tables (Table 8)), derivatized samples remained stable after
a 2 week storage period. However, the samples were not stable when stored for a longer period of
time as the accuracies ranged from 75% to 89.9%. This finding was not of a concern as the
derivatized samples are unlikely to be reanalyzed after a 3 month storage period. Alternatively, a
freshly thawed urine sample can be analyzed if needed. Additionally, data gathered in
Supplemental Tables (Table 8) for evaluating 3-month stock stability showed acceptable accuracy
and precision of the analyzed QC samples.

29
Finally, the stability of underivatized urine (i.e. the metabolome stability) while being stored at -
80 ºC, was assessed. An aliquot of a selected patient sample was thawed, processed and analyzed
against a freshly prepared calibration curve once monthly over a 4 months period. The precision
of the analysis for the majority of the quantified metabolites was acceptable as demonstrated by
the CV% values that were less than 15%. The only metabolite outliers were arginine (15.97%) and
sarcosine (51.3%) (Supplemental Tables (Table 8)). The unacceptable CV% for sarcosine can be
attributed to its instability on the 3rd and 4th months of analyses. There is a common consensus that
lower temperatures of storage can preserve the metabolomic profile of biological samples.
Unfortunately, a comprehensive study that compares accurate metabolomes quantities is lacking,
A recent review by Khamis el al [64] provided more information on the published literature
regarding urine metabolome stability under different temperatures.
Dilution integrity
Dilution integrity was tested by mixing 12C2-derivatized analytes stock solution with blank
surrogate urine matrix at ratio of 4:1. The obtained data demonstrates the acceptable accuracy and
precision where the %R values were within ±15% and were not deviating by more than 15%
(Supplemental tables (Table 9)). Dilution integrity was also evaluated at 50 and 100 fold level,
however, unacceptable accuracies were usually obtained in some of the replicates leading to
additional unacceptable precisions (data not shown). Nonetheless, there was not a single event
during the analysis of 80 patient urine samples in which a 20 fold dilution was not sufficient to
measure any of the derivatized metabolites existing outside their ULOQ.
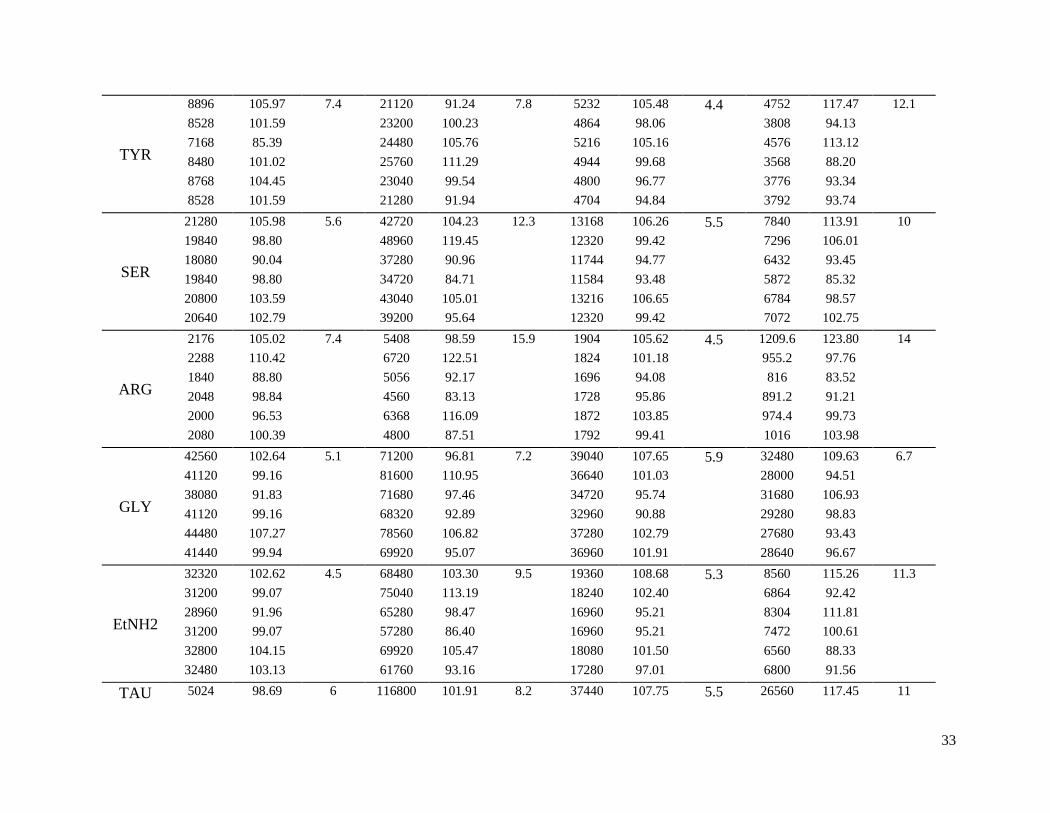
Incurred sample reanalysis
Recent opinions suggest that despite the rigidity in validating bioanalytical methods; standards and
QC samples may not entirely reflect the extent of the variation experienced in patient samples [65].
Consequently, incurred sample reanalysis has been encouraged to be included within the validation

30
studies [36, 65]. In some cases, significant differences in the concentrations of analytes were
reported when study samples were reanalyzed despite the acceptance of the batch through the
included QC samples [65]. Despite the absence of recommendations with the FDA, the EMA
suggests that 10% of the samples should be reanalyzed if the studied samples are less than 1000.
The calculated concentrations should be within 20% of their mean in 67% of the repeats [36, 65].
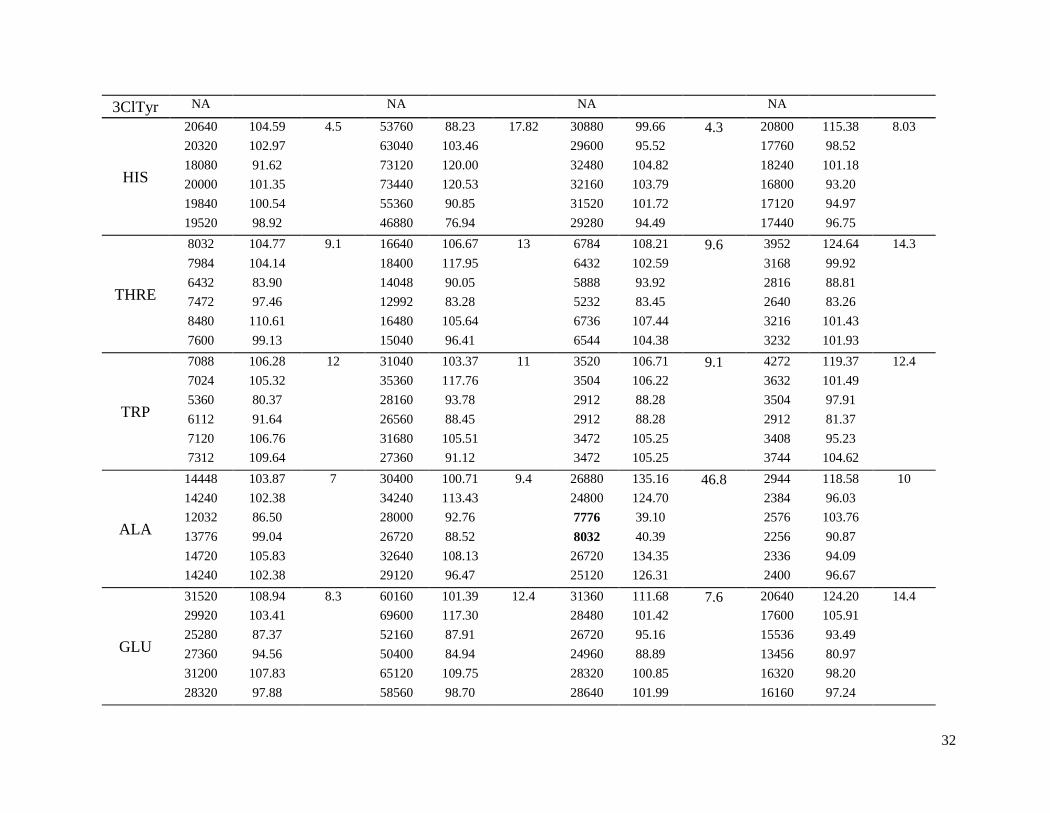
Accordingly, for a batch of 42 patient samples, aliquots from 4 selected patient urine samples were
freshly thawed on 3 different days and analyzed in duplicates (6 replicates in total). For 2 patients,
the concentrations of all quantified metabolites were below 17 % of their mean in at least 67% of
the repeats (Table 3) meeting the specifications set by the EMA that is 20% in at least 67% [36,
65]. For 1 patient, 1 metabolite out of the 19 targets, 1-methylhistamine, showed unacceptable
accuracies in 50% of the repeats specifically (%R = 71%, 121% and 125%). As for the last patient,
percentage recoveries of alanine were possibly biased by the analyses obtained from day 3
(statistical outliers) (Table 3). Setting the distorted arithmetic mean as the reference for the
calculation of % R, i.e. accuracy of alanine, resulted in values ranging from 39-135%. In fact, these
findings confirm the limitations of the available EMA guidelines where values compared to the
arithmetic mean are highly likely to be influenced by outlier values. On the other hand, there have
been analytical calls for using the original value as the reference value with the aim of avoiding
the error induced by the skewed mean [65]. Despite the fact that the outliers represent around only
1.2% of the total measured values, the limited number of repeated patient samples remains as a
limitation to that study. It should be emphasized that the remaining 18 metabolites in patients 2
and 3 were within the acceptable criteria, as set by regulatory bodies.

31
Analyte Study subject 1
Study subject 2 Study subject 3 Study subject 4
Found
(ng/mL), n=6
%R
CV Found (ng/mL)
n=6
%R
CV Found (ng/mL)
n=6
%R
CV Found (ng/mL)
n=6
%R
CV
(%) (%) (%) (%)
SAR 265.6 101.53 4.7
361.6 101.19 11
140.8 106.62 6.11
104.8 112.54 12.3
256 97.86 412.8 115.52 137.92 104.44 79.68 85.57
241.6 92.35 340.8 95.37 122.4 92.69 106.88 114.78
262.4 100.31 299.2 83.73 123.68 93.66 96.32 103.44
278.4 106.42 385.6 107.91 138.56 104.93 82.08 88.14
265.6 101.53 344 96.27 128.96 97.66 88.96 95.53
1MH
163.2 101.04 10.2 320 110.40 22.4 74.88 109.30 12.7 75.84 112.46 12.9
161.6 100.05
363.2 125.30
72.8 106.27
59.68 88.49
135.04 83.61
233.6 80.59
55.36 80.81
79.68 118.15
154.08 95.39
204.8 70.65
59.84 87.35
60.32 89.44
184 113.92
352 121.44
76.32 111.41
60.8 90.15
171.2 105.99
265.6 91.63
71.84 104.87
68.32 101.30
ISO
796.8 106.37 11.7 4592 108.44 12.8 486.4 108.12 10 323.2 111.91 9.6
769.6 102.74
5072 119.77
480 106.70
267.2 92.52
588.8 78.60
3952 93.32
406.4 90.34
318.4 110.25
710.4 94.84
3504 82.75
382.4 85.00
289.6 100.28
817.6 109.15
4208 99.37
457.6 101.72
252.8 87.53
811.2 108.29
4080 96.35
486.4 108.12
281.6 97.51
VAL
3264 105.15 9.6 12656 105.35 10.3 2448 104.79 6.3 1452.8 110.26 11.2
2896 93.30
13824 115.07
2448 104.79
1228.8 93.26
2640 85.05
11520 95.89
2240 95.89
1550.4 117.67
3056 98.45
10544 87.77
2112 90.41
1265.6 96.05
3376 108.76
12624 105.08
2480 106.16
1214.4 92.17
3392 109.28
10912 90.83
2288 97.95
1193.6 90.59
3BrTyr NA
NA
NA
NA
Table 3: Incurred sample reanalysis for 4 patient samples using the optimized analytical method
32
3ClTyr NA
NA
NA
NA
HIS
20640 104.59 4.5 53760 88.23 17.82 30880 99.66 4.3 20800 115.38 8.03
20320 102.97
63040 103.46
29600 95.52
17760 98.52
18080 91.62
73120 120.00
32480 104.82
18240 101.18
20000 101.35
73440 120.53
32160 103.79
16800 93.20
19840 100.54
55360 90.85
31520 101.72
17120 94.97
19520 98.92
46880 76.94
29280 94.49
17440 96.75
THRE
8032 104.77 9.1 16640 106.67 13 6784 108.21 9.6 3952 124.64 14.3
7984 104.14
18400 117.95
6432 102.59
3168 99.92
6432 83.90
14048 90.05
5888 93.92
2816 88.81
7472 97.46
12992 83.28
5232 83.45
2640 83.26
8480 110.61
16480 105.64
6736 107.44
3216 101.43
7600 99.13
15040 96.41
6544 104.38
3232 101.93
TRP
7088 106.28 12 31040 103.37 11 3520 106.71 9.1 4272 119.37 12.4
7024 105.32
35360 117.76
3504 106.22
3632 101.49
5360 80.37
28160 93.78
2912 88.28
3504 97.91
6112 91.64
26560 88.45
2912 88.28
2912 81.37
7120 106.76
31680 105.51
3472 105.25
3408 95.23
7312 109.64
27360 91.12
3472 105.25
3744 104.62
ALA
14448 103.87 7 30400 100.71 9.4 26880 135.16 46.8 2944 118.58 10
14240 102.38
34240 113.43
24800 124.70
2384 96.03
12032 86.50
28000 92.76
7776 39.10
2576 103.76
13776 99.04
26720 88.52
8032 40.39
2256 90.87
14720 105.83
32640 108.13
26720 134.35
2336 94.09
14240 102.38
29120 96.47
25120 126.31
2400 96.67
GLU
31520 108.94 8.3 60160 101.39 12.4 31360 111.68 7.6 20640 124.20 14.4
29920 103.41
69600 117.30
28480 101.42
17600 105.91
25280 87.37
52160 87.91
26720 95.16
15536 93.49
27360 94.56
50400 84.94
24960 88.89
13456 80.97
31200 107.83
65120 109.75
28320 100.85
16320 98.20
28320 97.88
58560 98.70
28640 101.99
16160 97.24
33
TYR
8896 105.97 7.4 21120 91.24 7.8 5232 105.48 4.4 4752 117.47 12.1
8528 101.59
23200 100.23
4864 98.06
3808 94.13
7168 85.39
24480 105.76
5216 105.16
4576 113.12
8480 101.02
25760 111.29
4944 99.68
3568 88.20
8768 104.45
23040 99.54
4800 96.77
3776 93.34
8528 101.59
21280 91.94
4704 94.84
3792 93.74
SER
21280 105.98 5.6 42720 104.23 12.3 13168 106.26 5.5 7840 113.91 10
19840 98.80
48960 119.45
12320 99.42
7296 106.01
18080 90.04
37280 90.96
11744 94.77
6432 93.45
19840 98.80
34720 84.71
11584 93.48
5872 85.32
20800 103.59
43040 105.01
13216 106.65
6784 98.57
20640 102.79
39200 95.64
12320 99.42
7072 102.75
ARG
2176 105.02 7.4 5408 98.59 15.9 1904 105.62 4.5 1209.6 123.80 14
2288 110.42
6720 122.51
1824 101.18
955.2 97.76
1840 88.80
5056 92.17
1696 94.08
816 83.52
2048 98.84
4560 83.13
1728 95.86
891.2 91.21
2000 96.53
6368 116.09
1872 103.85
974.4 99.73
2080 100.39
4800 87.51
1792 99.41
1016 103.98
GLY
42560 102.64 5.1 71200 96.81 7.2 39040 107.65 5.9 32480 109.63 6.7
41120 99.16
81600 110.95
36640 101.03
28000 94.51
38080 91.83
71680 97.46
34720 95.74
31680 106.93
41120 99.16
68320 92.89
32960 90.88
29280 98.83
44480 107.27
78560 106.82
37280 102.79
27680 93.43
41440 99.94
69920 95.07
36960 101.91
28640 96.67
EtNH2
32320 102.62 4.5 68480 103.30 9.5 19360 108.68 5.3 8560 115.26 11.3
31200 99.07
75040 113.19
18240 102.40
6864 92.42
28960 91.96
65280 98.47
16960 95.21
8304 111.81
31200 99.07
57280 86.40
16960 95.21
7472 100.61
32800 104.15
69920 105.47
18080 101.50
6560 88.33
32480 103.13
61760 93.16
17280 97.01
6800 91.56
TAU 5024 98.69 6 116800 101.91 8.2 37440 107.75 5.5 26560 117.45 11

34
5264 103.40
127840 111.54
35680 102.69
20640 91.27
4672 91.78
111360 97.16
33120 95.32
24800 109.67
4944 97.12
100800 87.95
32480 93.48
21920 96.93
5568 109.38
120960 105.54
36000 103.61
20960 92.69
5072 99.63
109920 95.91
33760 97.16
20800 91.98
ASP
7408 105.63 6.6 15584 103.34 16.1 7152 106.73 7.8 4592 124.69 15.4
7280 103.80
17920 118.83
6864 102.43
3648 99.06
6256 89.20
13088 86.79
5936 88.58
3216 87.33
6656 94.90
11552 76.60
6192 92.40
2960 80.38
7360 104.94
17280 114.59
7200 107.44
3856 104.71
7120 101.52
15056 99.84
6864 102.43
3824 103.84
LYS
2032 109.04 12.5 7408 102.43 13.5 8816 111.16 10.7 6144 108.32 14.2
1952 104.75 8560 118.36 8368 105.51 4960 87.45
1421 76.25 6928 95.80
7152 90.18 6928 122.14
1792 96.16 5840 80.75
6768 85.34 5888 103.81
2016 108.18 8016 110.84 8736 110.15 4784 84.34
1968 105.61 6640 91.81 7744 97.65 5328 93.94

35
3.3 Analysis of patient samples
Figures 3A and 3B are representative extracted ion chromatograms obtained from urine sample
analyzed from asthmatic and COPD patients, respectively. Histidine and glutamine, in most of the
samples, were present at concentrations above their ULOQ and sample dilution was required for
their quantification. Occasionally (less than 30% of the studied samples) alanine and taurine
quantification needed sample dilution as well, and rare cases of out-of-the range high
concentrations (less than 5% of the samples) were observed for tryptophan, valine, ethanolamine
and threonine. One interesting finding is that creatinine concentration was not always indicative
of other metabolite concentration despite having a constant output/day/subject [66]. For bromo
and chloro-tyrosine, both of them were not detected within all patient samples. This agrees well
with the literature in which specific sample pre-concentration and extraction steps were needed for
their quantification [67, 68].
Patient urine samples were analyzed by the developed methodology and data was analyzed using
partial least square discriminant analysis (PLS-DA). Blinded asthma and COPD samples analyzed
using SIMCA® software (Umetrics, Sweden) were adequately assigned with their correct
diagnosis based on the concentration of metabolites included in the training set (data not shown).
The altered metabolites identified as the final biomarkers for differential diagnosis of asthma and
COPD along with the involved biochemical pathways is outside the scope of this work, however,
data generated from all metabolites previously identified from the 1H-NMR will be compiled in a
separate research article focusing on the clinical relevance.

36
4 Conclusion
An accurate, sensitive and validated method for the quantification of 19 urinary metabolites
bearing amino and/or phenolic groups is successfully developed. The DIL approach is used so that
conventional C18 column is applied with significant enhancement in ionization. Dansyl chloride
was an excellent choice for derivatization as it allowed for the generation of an internal standard
for each metabolite addressing matrix effects and any variations resulting from sample
preparations. During method validation, key challenges were observed, particularly in the
optimization the linear ranges for each metabolite in patient urine samples. Validation of
selectivity was also halted by the presence of isotopic contribution from the light derivatized
metabolites.
The statistical analysis using partial least square discriminant analysis (PLS-DA) from the
dansylated metabolites will be combined with the results obtained from the remaining 50 target
metabolites. The results from patient samples and the identified biomarkers for the differential
diagnosis of asthma and COPD will be published in a separate research article where more
emphasis on clinical aspect of the findings is discussed.
In summary, we have demonstrated the combination of DIL with LC-MS/MS analysis for targeted
biomarker discovery. This technique can allow the development and validation of robust analytical
methods needed for biomarkers quantification prior to FDA submission. By adopting this
methodology, different submetabolome of carboxylic acids [58], alcohols [69] and thiols [70] can
be targeted and quantified.

37
Figure 3: Extracted ion chromatogram of derivatized metabolites quantified in A) asthma and B)
COPD patient urine sample.
XIC of +MRM (58 pairs): 295.110/170.100 Da ID: EtNH2 from Sample 23 (P30) of DataSET1.wiff (Turbo Spray) Max. 9.0e5 cps.
2 4 6 8 10 12 14 16 18 20 22 24 26 28 30 32Time, min
0.0
2.0e5
4.0e5
6.0e5
8.0e5
1.0e6
1.2e6
1.4e6
1.6e6
1.8e6
2.0e6
2.2e6
2.4e6
2.6e6
2.8e6
3.0e6
3.2e6
3.4e6
3.6e6
3.8e6
4.0e6
4.2e6
4.4e64.5e6
In
te
ns
it
y,
c
ps
8.32
TAU ASP
ARG
GLU
1MH
TYR
ALA
ETNH2
GLY
SER
THREO
SAR VAL
LYS
HIS
ISO
Cl-TYRBr-TYR
TRP
XIC of +MRM (58 pairs): 295.110/170.100 Da ID: EtNH2 from Sample 28 (P46) of DataSET1.wiff (Turbo Spray) Max. 1.1e6 cps.
2 4 6 8 10 12 14 16 18 20 22 24 26 28 30 32Time, min
0.0
2.0e5
4.0e5
6.0e5
8.0e5
1.0e6
1.2e6
1.4e6
1.6e6
1.8e6
2.0e6
2.2e6
2.4e6
2.6e6
2.8e6
3.0e6
3.2e6
3.4e6
3.6e6
3.8e6
4.0e6
4.2e6
In
te
ns
it
y,
c
ps
8.34
TAU ASP
ARG
GLU
1MH
TYR
ALA
ETNH2
GLY
SER
THREO
SAR VAL
LYS
HIS
ISO
Cl-TYRBr-TYR
TRP
A
B

38
Acknowledgment
The authors acknowledge funding form Saskatchewan Health Research Foundation and
AllerGen NCE Inc. (AllerGen). Funding for the purchase of the ABSciex QTRAP 4000
instrument was obtained through a Canada Foundation for Innovation grant- Leaders
Opportunity Fund. We also acknowledge Dr. Liang Li, University of Alberta, for valuable
discussions and for providing labeled DNS-Cl for initial experiments. Ms. Hanan Awad, Dr.
Randy Purves and Ms. Deborah Michel are acknowledged for their technical help and valuable
discussions. Dr. Kenneth Nelson is acknowledged for his assistance on the synthesis of DNS-Cl
reagents used in this study. Dr. George Katselis is acknowledged for his feedback to the
manuscript contents. Ms. Khamis thanks the College of Pharmacy and Nutrition for scholarship
funding.
39
References
[1] A.A. Cruz, J. Bousquet, N. Khaltaev, Global surveillance, prevention and control of chronic respiratory diseases: a comprehensive approach, World Health Organization2007. [2] P. Gibson, J. Simpson, The overlap syndrome of asthma and COPD: what are its features and how important is it?, Thorax, 64 (2009) 728-735. [3] E.G. Tzortzaki, A. Proklou, N.M. Siafakas, Asthma in the elderly: can we distinguish it from COPD?, Journal of allergy, 2011 (2011). [4] J. Chang, Z. Mosenifar, Differentiating COPD from asthma in clinical practice, Journal of intensive care medicine, 22 (2007) 300-309. [5] R.H. Green, C.E. Brightling, S. McKenna, B. Hargadon, D. Parker, P. Bradding, A.J. Wardlaw, I.D. Pavord, Asthma exacerbations and sputum eosinophil counts: a randomised controlled trial, The Lancet, 360 (2002) 1715-1721. [6] H.L. Petsky, C.J. Cates, A. Li, J.A. Kynaston, C. Turner, A.B. Chang, Tailored interventions based on exhaled nitric oxide versus clinical symptoms for asthma in children and adults, Cochrane Database Syst Rev, 4 (2009). [7] L. Fromer, C.B. Cooper, A review of the GOLD guidelines for the diagnosis and treatment of patients with COPD, International journal of clinical practice, 62 (2008) 1219-1236. [8] D.G. Tinkelman, D.B. Price, R.J. Nordyke, R. Halbert, Misdiagnosis of COPD and asthma in primary care patients 40 years of age and over, Journal of Asthma, 43 (2006) 75-80. [9] S. Snowden, S.-E. Dahlén, C.E. Wheelock, Application of metabolomics approaches to the study of respiratory diseases, Bioanalysis, 4 (2012) 2265-2290. [10] B.F. Nobakht M. Gh, R. Aliannejad, M. Rezaei-Tavirani, S. Taheri, A.A. Oskouie, The metabolomics of airway diseases, including COPD, asthma and cystic fibrosis, Biomarkers, 20 (2015) 5-16. [11] A. Zhang, H. Sun, X. Wu, X. Wang, Urine metabolomics, Clinica Chimica Acta, 414 (2012) 65-69. [12] W.B. Dunn, D.I. Broadhurst, H.J. Atherton, R. Goodacre, J.L. Griffin, Systems level studies of mammalian metabolomes: the roles of mass spectrometry and nuclear magnetic resonance spectroscopy, Chemical Society Reviews, 40 (2011) 387-426. [13] R.D. Beger, T. Colatsky, Metabolomics data and the biomarker qualification process, Metabolomics, 8 (2012) 2-7. [14] M. Mamas, W.B. Dunn, L. Neyses, R. Goodacre, The role of metabolites and metabolomics in clinically applicable biomarkers of disease, Archives of toxicology, 85 (2011) 5-17. [15] H. Wu, R. Xue, L. Dong, T. Liu, C. Deng, H. Zeng, X. Shen, Metabolomic profiling of human urine in hepatocellular carcinoma patients using gas chromatography/mass spectrometry, Analytica chimica acta, 648 (2009) 98-104. [16] H.M. Woo, K.M. Kim, M.H. Choi, B.H. Jung, J. Lee, G. Kong, S.J. Nam, S. Kim, S.W. Bai, B.C. Chung, Mass spectrometry based metabolomic approaches in urinary biomarker study of women's cancers, Clinica Chimica Acta, 400 (2009) 63-69. [17] H.J. Issaq, O. Nativ, T. Waybright, B. Luke, T.D. Veenstra, E.J. Issaq, A. Kravstov, M. Mullerad, Detection of bladder cancer in human urine by metabolomic profiling using high performance liquid chromatography/mass spectrometry, The Journal of urology, 179 (2008) 2422-2426. [18] K. Kim, P. Aronov, S.O. Zakharkin, D. Anderson, B. Perroud, I.M. Thompson, R.H. Weiss, Urine metabolomics analysis for kidney cancer detection and biomarker discovery, Molecular & cellular proteomics, 8 (2009) 558-570. [19] X. Wang, A. Zhang, Y. Han, P. Wang, H. Sun, G. Song, T. Dong, Y. Yuan, X. Yuan, M. Zhang, Urine metabolomics analysis for biomarker discovery and detection of jaundice syndrome in patients with liver disease, Molecular & Cellular Proteomics, 11 (2012) 370-380.

40
[20] A. Lafaye, C. Junot, B.R.L. Gall, P. Fritsch, J.C. Tabet, E. Ezan, Metabolite profiling in rat urine by liquid chromatography/electrospray ion trap mass spectrometry. Application to the study of heavy metal toxicity, Rapid Communications in Mass Spectrometry, 17 (2003) 2541-2549. [21] S. Zheng, M. Yu, X. Lu, T. Huo, L. Ge, J. Yang, C. Wu, F. Li, Urinary metabonomic study on biochemical changes in chronic unpredictable mild stress model of depression, Clinica Chimica Acta, 411 (2010) 204-209. [22] R.D. Beger, R.D. Holland, J. Sun, L.K. Schnackenberg, P.C. Moore, C.L. Dent, P. Devarajan, D. Portilla, Metabonomics of acute kidney injury in children after cardiac surgery, Pediatric Nephrology, 23 (2008) 977-984. [23] D.A. Rodríguez, G. Alcarraz-Vizán, S. Díaz-Moralli, M. Reed, F.P. Gómez, F. Falciani, U. Günther, J. Roca, M. Cascante, Plasma metabolic profile in COPD patients: effects of exercise and endurance training, Metabolomics, 8 (2012) 508-516. [24] I. Bertini, C. Luchinat, M. Miniati, S. Monti, L. Tenori, Phenotyping COPD by 1H NMR metabolomics of exhaled breath condensate, Metabolomics, 10 (2014) 302-311. [25] B.K. Ubhi, J.H. Riley, P.A. Shaw, D.A. Lomas, R. Tal-Singer, W. MacNee, J.L. Griffin, S.C. Connor, Metabolic profiling detects biomarkers of protein degradation in COPD patients, European Respiratory Journal, 40 (2012) 345-355. [26] B.K. Ubhi, K.K. Cheng, J. Dong, T. Janowitz, D. Jodrell, R. Tal-Singer, W. MacNee, D.A. Lomas, J.H. Riley, J.L. Griffin, Targeted metabolomics identifies perturbations in amino acid metabolism that sub-classify patients with COPD, Molecular BioSystems, 8 (2012) 3125-3133. [27] J. Jung, S.H. Kim, H.S. Lee, G. Choi, Y.S. Jung, D. Ryu, H.S. Park, G.S. Hwang, Serum metabolomics reveals pathways and biomarkers associated with asthma pathogenesis, Clinical & Experimental Allergy, 43 (2013) 425-433. [28] E.J. Saude, C.D. Skappak, S. Regush, K. Cook, A. Ben-Zvi, A. Becker, R. Moqbel, B.D. Sykes, B.H. Rowe, D.J. Adamko, Metabolomic profiling of asthma: diagnostic utility of urine nuclear magnetic resonance spectroscopy, Journal of Allergy and Clinical Immunology, 127 (2011) 757-764. e756. [29] E.J. Saude, I.P. Obiefuna, R.L. Somorjai, F. Ajamian, C. Skappak, T. Ahmad, B.K. Dolenko, B.D. Sykes, R. Moqbel, D.J. Adamko, Metabolomic biomarkers in a model of asthma exacerbation: urine nuclear magnetic resonance, American journal of respiratory and critical care medicine, 179 (2009) 25-34. [30] J.L. McClay, D.E. Adkins, N.G. Isern, T.M. O’Connell, J.B. Wooten, B.K. Zedler, M.S. Dasika, B.T. Webb, B.-J. Webb-Robertson, J.G. Pounds, 1H nuclear magnetic resonance metabolomics analysis identifies novel urinary biomarkers for lung function, Journal of proteome research, 9 (2010) 3083-3090. [31] L. Wang, Y. Tang, S. Liu, S. Mao, Y. Ling, D. Liu, X. He, X. Wang, Metabonomic profiling of serum and urine by 1H NMR-based spectroscopy discriminates patients with chronic obstructive pulmonary disease and healthy individuals, PloS one, 8 (2013) e65675. [32] C.C. Loureiro, I.F. Duarte, J. Gomes, J. Carrola, A.S. Barros, A.M. Gil, J. Bousquet, A.T. Bom, S.M. Rocha, Urinary metabolomic changes as a predictive biomarker of asthma exacerbation, Journal of Allergy and Clinical Immunology, 133 (2014) 261. [33] C.C. Loureiro, A.S. Oliveira, M. Santos, A. Rudnitskaya, A. Todo-Bom, J. Bousquet, S.M. Rocha, Urinary metabolomic profiling of asthmatics can be related to clinical characteristics, Allergy, 71 (2016) 1362-1365. [34] E. Mattarucchi, E. Baraldi, C. Guillou, Metabolomics applied to urine samples in childhood asthma; differentiation between asthma phenotypes and identification of relevant metabolites, Biomedical Chromatography, 26 (2012) 89-94. [35] Food and Drug Administration, FDA guidance for industry: bioanalytical method validation, US Department of Health and Human Services, Food and Drug Administration, Center for Drug Evaluation and Research: Rockville, MD, (2001).
41
[36] Eurapean Meciecnes Agency (EMA), Committee for Medicinal Products for Human Use (CHMP), Guideline on Bioanalytical Method Validation, (2011). [37] J.W. Lee, R.S. Weiner, J.M. Sailstad, R.R. Bowsher, D.W. Knuth, P.J. O’Brien, J.L. Fourcroy, R. Dixit, L. Pandite, R.G. Pietrusko, Method validation and measurement of biomarkers in nonclinical and clinical samples in drug development: a conference report, Pharmaceutical research, 22 (2005) 499-511. [38] D.J. Adamko, P. Nair, I. Mayers, R.T. Tsuyuki, S. Regush, B.H. Rowe, Metabolomic profiling of asthma and chronic obstructive pulmonary disease: A pilot study differentiating diseases, Journal of Allergy and Clinical Immunology, 136 (2015) 571-580. e573. [39] K. Guo, L. Li, Differential 12C-/13C-isotope dansylation labeling and fast liquid chromatography/mass spectrometry for absolute and relative quantification of the metabolome, Analytical chemistry, 81 (2009) 3919-3932. [40] F. Xu, L. Zou, Y. Liu, Z. Zhang, C.N. Ong, Enhancement of the capabilities of liquid chromatography–mass spectrometry with derivatization: general principles and applications, Mass spectrometry reviews, 30 (2011) 1143-1172. [41] T. Toyo’oka, LC–MS determination of bioactive molecules based upon stable isotope-coded derivatization method, Journal of pharmaceutical and biomedical analysis, 69 (2012) 174-184. [42] R. Zhou, K. Guo, L. Li, 5-Diethylamino-naphthalene-1-sulfonyl Chloride (DensCl): A novel triplex isotope labeling reagent for quantitative metabolome analysis by liquid chromatography mass spectrometry, Analytical chemistry, 85 (2013) 11532-11539. [43] J.R. Delanghe, M.M. Speeckaert, Creatinine determination according to Jaffe—what does it stand for?, NDT plus, (2011) sfq211. [44] Q.C.A. Kit, https://www.bioassaysys.com/Creatinine-Assay-Kit.html. [45] F. Bergmann, W. Pfleiderer, Nucleotides. Part XLI. The 2-dansylethoxycarbonyl ( 2-{[5-(dimethylamino) naphthalen-1-yl] sulfonyl} ethoxycarbonyl; dnseoc) group for protection of the 5′-hydroxy function in oligodeoxyribonucleotide synthesis, Helvetica chimica acta, 77 (1994) 203-215. [46] A. Mendel, Improved preparation of 5-dimethylamino-1-naphthalenesulfonyl chloride, Journal of Chemical and Engineering Data, 15 (1970) 340-341. [47] J. Zheng, L. Li, Fragmentation of protonated dansyl-labeled amines for structural analysis of amine-containing metabolites, International Journal of Mass Spectrometry, 316 (2012) 292-299. [48] B. Matuszewski, M. Constanzer, C. Chavez-Eng, Strategies for the assessment of matrix effect in quantitative bioanalytical methods based on HPLC-MS/MS, Analytical chemistry, 75 (2003) 3019-3030. [49] V.P. Shah, K.K. Midha, J.W. Findlay, H.M. Hill, J.D. Hulse, I.J. McGilveray, G. McKay, K.J. Miller, R.N. Patnaik, M.L. Powell, Bioanalytical method validation—a revisit with a decade of progress, Pharmaceutical research, 17 (2000) 1551-1557. [50] C.J. Briscoe, M.R. Stiles, D.S. Hage, System suitability in bioanalytical LC/MS/MS, Journal of pharmaceutical and biomedical analysis, 44 (2007) 484-491. [51] N. Seiler, Use of the dansyl reaction in biochemical analysis, Methods of Biochemical Analysis, Volume 18, (1970) 259-337. [52] E. Stokvis, H. Rosing, L. López-Lázaro, J. Schellens, J. Beijnen, Switching from an analogous to a stable isotopically labeled internal standard for the LC-MS/MS quantitation of the novel anticancer drug Kahalalide F significantly improves assay performance, Biomedical Chromatography, 18 (2004) 400-402. [53] Z. Lei, D.V. Huhman, L.W. Sumner, Mass spectrometry strategies in metabolomics, Journal of Biological Chemistry, 286 (2011) 25435-25442. [54] F. Mazzotti, H. Benabdelkamel, L.D. Donna, C.M. Athanassopoulos, A. Napoli, G. Sindona, Light and heavy dansyl reporter groups in food chemistry: amino acid assay in beverages, Journal of Mass Spectrometry, 47 (2012) 932-939.

42
[55] S. Ito, K. Tsukada, Matrix effect and correction by standard addition in quantitative liquid chromatographic–mass spectrometric analysis of diarrhetic shellfish poisoning toxins, Journal of Chromatography A, 943 (2002) 39-46. [56] M. Jemal, A. Schuster, D.B. Whigan, Liquid chromatography/tandem mass spectrometry methods for quantitation of mevalonic acid in human plasma and urine: method validation, demonstration of using a surrogate analyte, and demonstration of unacceptable matrix effect in spite of use of a stable isotope analog internal standard, Rapid Communications in Mass Spectrometry, 17 (2003) 1723-1734. [57] C. Viswanathan, S. Bansal, B. Booth, A.J. DeStefano, M.J. Rose, J. Sailstad, V.P. Shah, J.P. Skelly, P.G. Swann, R. Weiner, Quantitative bioanalytical methods validation and implementation: best practices for chromatographic and ligand binding assays, Pharmaceutical research, 24 (2007) 1962-1973. [58] A. Stanislaus, K. Guo, L. Li, Development of an isotope labeling ultra-high performance liquid chromatography mass spectrometric method for quantification of acylglycines in human urine, Analytica chimica acta, 750 (2012) 161-172. [59] J.H. Zar, Biostatistical Analysis, Prentice Hall1999. [60] Q.A. Xu, T.L. Madden, LC-MS in drug bioanalysis, Springer Science & Business Media2012. [61] D.J. Borts, L.D. Bowers, Direct measurement of urinary testosterone and epitestosterone conjugates using high-performance liquid chromatography/tandem mass spectrometry, Journal of mass spectrometry, 35 (2000) 50-61. [62] L.B. Fay, S. Métairon, M. Baumgartner, Linearization of second-order calibration curves in stable isotope dilution–mass spectrometry, Flavour and fragrance journal, 16 (2001) 164-168. [63] A.M.d. Almeida, M.M. Castel-Branco, A. Falcao, Linear regression for calibration lines revisited: weighting schemes for bioanalytical methods, Journal of Chromatography B, 774 (2002) 215-222. [64] M.M. Khamis, D.J. Adamko, A. El-Aneed, Mass spectrometric based approaches in urine metabolomics and biomarker discovery, Mass spectrometry reviews, (2015). [65] P. Timmerman, S. Luedtke, P. van Amsterdam, M. Brudny-Kloeppel, B. Lausecker, S. Fischmann, S. Globig, C.-J. Sennbro, J.M. Jansat, H. Mulder, Incurred sample reproducibility: views and recommendations by the European Bioanalysis Forum, Bioanalysis, 1 (2009) 1049-1056. [66] B.M. Warrack, S. Hnatyshyn, K.-H. Ott, M.D. Reily, M. Sanders, H. Zhang, D.M. Drexler, Normalization strategies for metabonomic analysis of urine samples, Journal of Chromatography B, 877 (2009) 547-552. [67] H.-J.C. Chen, W.-L. Chiu, Simultaneous detection and quantification of 3-nitrotyrosine and 3-bromotyrosine in human urine by stable isotope dilution liquid chromatography tandem mass spectrometry, Toxicology letters, 181 (2008) 31-39. [68] H. Mita, N. Higashi, M. Taniguchi, A. Higashi, Y. Kawagishi, K. Akiyama, Urinary 3-bromotyrosine and 3-chlorotyrosine concentrations in asthmatic patients: lack of increase in 3-bromotyrosine concentration in urine and plasma proteins in aspirin-induced asthma after intravenous aspirin challenge, Clinical & Experimental Allergy, 34 (2004) 931-938. [69] S. Zhao, X. Luo, L. Li, Chemical Isotope Labeling LC-MS for High Coverage and Quantitative Profiling of the Hydroxyl Submetabolome in Metabolomics, Analytical Chemistry, (2016). [70] P. Liu, Y.-Q. Huang, W.-J. Cai, B.-F. Yuan, Y.-Q. Feng, Profiling of thiol-containing compounds by stable isotope labeling double precursor ion scan mass spectrometry, Analytical chemistry, 86 (2014) 9765-9773.