Embed Size (px)
Citation preview

ACTAUNIVERSITATIS
UPSALIENSISUPPSALA
2017
Digital Comprehensive Summaries of Uppsala Dissertationsfrom the Faculty of Medicine 1336
Development of EnhancedMolecular Diagnostic Tools forProtein Detection and Analysis
TONGE EBAI
ISSN 1651-6206ISBN 978-91-554-9930-3urn:nbn:se:uu:diva-320380

Dissertation presented at Uppsala University to be publicly examined in B/B42, BMC,Husargatan 3, Uppsala, Wednesday, 14 June 2017 at 13:00 for the degree of Doctor ofPhilosophy (Faculty of Medicine). The examination will be conducted in English. Facultyexaminer: Professor Peter Nilsson (KTH, SciLifelab Stockholm).
AbstractEbai, T. 2017. Development of Enhanced Molecular Diagnostic Tools for Protein Detectionand Analysis. Digital Comprehensive Summaries of Uppsala Dissertations from the Faculty ofMedicine 1336. 83 pp. Uppsala: Acta Universitatis Upsaliensis. ISBN 978-91-554-9930-3.
Improved diagnosis, prognosis and disease follow-up is a fundamental procedure and a constantchallenge in medicine. Among the different molecular biomarkers, proteins are the essentialregulatory component in blood; hence, by developing enhanced specific and sensitive moleculartools will gives great insight into the different processes in disease treatment. In this thesis, webuild on the proximity ligation assay to develop and apply new adaptable methods to facilitateprotein detection.
In paper I, I present a variant of the proximity ligation assay (we call PLARCA) using microtiter plate for detection and quantification of protein using optical density as readout in thefluorometer. PLARCA detected femtomolar levels of these proteins in patient samples, whichwas considerably below the detection threshold for ELISA.
In paper II, we developed and adapted a new method into the in situ PLA methods fordetection and identification of extracellular vesicles (EVs) using flow cytometry as readout (amethod we call ExoPLA). We identified five target proteins on the surface of the Evs and usingthree colors, we identified the EV using flow cytometer.
In paper III, we aim to improve the efficiency of in situ PLA by creating and developing newdesigns and versions of the assay we called Unfold probes Through comparison of detectionof protein using in situ PLA versus Unfold probes, we observed considerable decrease in non-specific signals, and also a lower detection threshold.
In paper IV, we describe the development of a solid phase proximity extension (sp-PEA) assayfor protein detection and quantification. We compared detection of IL-8, TNF-alpha, IL-10 andIL-6 using spPEA and PEA; spPEA demonstrations over 2 orders of magnitudes in the lowerdetection concentrations by decreased in background noise.
Keywords: protein detection, proximity ligation assays, proximity extension assay, rollingcircle amplification, ELISA, flow cytometry, fluorescence microscopy
Tonge Ebai, Department of Immunology, Genetics and Pathology, Molecular tools,Rudbecklaboratoriet, Uppsala University, SE-751 85 Uppsala, Sweden.
© Tonge Ebai 2017
ISSN 1651-6206ISBN 978-91-554-9930-3urn:nbn:se:uu:diva-320380 (http://urn.kb.se/resolve?urn=urn:nbn:se:uu:diva-320380)

“Never regard study as a duty, but as the enviable opportunity to learn to know the liberating influence of beauty in the realm of the spirit for your own personal joy and to the profit of the community to which your later work belongs” Albert Einstein
To my Family and Friends


List of Papers
This thesis is based on the following papers, which are referred to in the text by their Roman numerals.
I. Ebai T., de Oliveira F., Löf L., Wik L., Schweiger C., Larsson A., Keilholtz U., Haybaeck J., Landegren U., and Kamali-Moghaddam M., (2017) Sensitive protein detection in microtiter plates by proximi-ty ligation with rolling circle amplification (PLARCA). Clinical Chemistry, Under revision
II. Löf L., Ebai T., Dubois L., Wik L., Ronquist K.G., Nolander O., Lundin E., Söderberg O., Landegren U., and Kamali-Moghaddam M. (2016) Detecting individual extracellular vesicles using a multicolor in situ proximity ligation assay with flow cytometry readout. Paper subti-tle. Scientific Reports. 6, 34358; doi: 10.1038/srep34358
III. Klaesson A., Grannas K., Ebai T., Zieba A., Koos B., Raykova D., Oelrich J., Arngården L., Nong R., Söderberg O., and Landegren U., (2017) Enhanced in situ proximity ligation assays via Unfolding PLA probes. Manuscript
IV. Ebai T., Wu Y., Kamali-Moghaddam M., and Landegren U. (2017) Protein detection by sensitive magnetic bead-based proximity exten-sion assays. Manuscript
Reprints were made with permission from the respective publishers.

Related work by author
Review Articles
I. Ebai T., Landegren U., and Kamali-Moghaddam M., (2015) Parallel protein detection by solid-phase proximity ligation assay with real-time PCR or sequencing. Curr. Protoc. Mol. Biol. 4109:20.10.1-20.10.25. doi: 10.1002/0471142727.mb2010s109
II. Löf L., Arngården L., Ebai T., Söderberg O., Landegren U., and Ka-mali-Moghaddam M. (2018) Detection of Extracellular Vesicles Using Proximity Ligation Assay with Flow Cytometry Readout-ExoPLA. Curr. Protoc. Flow Cytometry In Print.
Book Chapter
III. Cane G., Leuchowius K.J., Söderberg O., Kamali-Moghaddam M., Jarvis M., Helbring I., Pardell K., Koos B., Ebai T., and Landegren U., (2017) Protein Diagnostics by Proximity Ligation: Combining Multiple Recognition and DNA Amplification for Improved Protein Analyses Molecular Diagnostics (Third Edition), Academic Press pg. 219-231

Contents
Part 1 ............................................................................................................. 11
Introduction ................................................................................................... 12
1. Human proteome ....................................................................................... 141.1 Basic building blocks .......................................................................... 141.2 Bodily fluid ......................................................................................... 171.3 Biomarkers .......................................................................................... 211.4 Analytical guidelines and tests of method validation ......................... 23
2 Affinity reagents and applications .............................................................. 262.1 Affinity reagents ................................................................................. 272.2 Labeling of affinity reagents ............................................................... 30
3. Proteomics ................................................................................................. 323.1 Proteomics .......................................................................................... 323.2 Looking into organelles ...................................................................... 33
4 Historical, current and emerging proteomic technologies ......................... 354.1 History; an analytical approach .......................................................... 354.2 Overview on current non-targeted proteomic technologies ............... 364.3 Overview of targeted proteomics technologies .................................. 37
4.3.1 DNA assisted immunoassays ...................................................... 444.3.2 Proximity-based DNA assisted immunoassay ............................ 46
4.4 Proximity based IA: Still lagging ....................................................... 47
Part II ............................................................................................................. 51
5 Present Investigations ................................................................................. 525.1 Sensitive protein detection in microtiter plates by proximity ligation with rolling circle amplification (PLARCA) - Paper I ............................. 53
5.1.1 Introduction ................................................................................. 535.1.2 Aim of study ............................................................................... 545.1.3 Summary of finding .................................................................... 54

5.2 Detecting individual extracellular vesicles using a multicolor in situ proximity ligation assay with flow cytometric readout - Paper II ............ 56
5.2.1 Introduction ................................................................................. 565.2.2 Aim of study ............................................................................... 585.2.3 Summary of finding .................................................................... 58
5.3 Enhanced in situ proximity ligation assays via Unfolding PLA probes - Paper III .................................................................................................. 59
5.3.1 Introduction ................................................................................. 595.3.2 Aim of study ............................................................................... 605.3.3 Summary of finding .................................................................... 60
5.4 Protein detection by sensitive magnetic bead-based proximity extension assays - Paper IV ..................................................................... 63
5.4.1 Introduction ................................................................................. 635.4.2 Aim of study ............................................................................... 635.4.3 Summary of finding .................................................................... 64
III Conclusions and Perspectives .................................................................. 65
IV Acknowledgments .................................................................................... 68
V References ................................................................................................. 74

Abbreviations
BSA Bovine serum albumin CV Coefficient of variation DBCO Dibenzocyclooctyne DMSO Dimethyl sulfoxide DTT Dithiothreitol DNA Deoxyribonucleic acid DARPins Designed ankyrin repeats proteins EndoIV Endonuclease IV EIA Enzyme immunoassay ELISA Enzyme-linked immunosorbent assay EV Extracellular vesicles FACS Fluorescence activated cell sorter FITC Fluorescein isothiocyanate GDF-15 Growth differentiation factor 15 HRP Horse radish peroxidase LOD Limit of detection IF Immunofluorescence IHC Immunohistochemistry IL Interleukin IgG Immunoglobulin G IRCA Immuno rolling circle amplification KD Dissociation constant MS Mass spectrometry PCR Polymerase chain reaction PLA Proximity ligation assay PTM Posttranslational modification RCA Rolling circle amplification RCP Rolling circle product RNA Ribonucleic acid SP-PEA Solid phase proximity extension assay SP-PLA Solid phase proximity ligation assay VEGF Vascular endothethial growth factor UNG Uracil-DNA glycosylase


11
Part 1

12
Introduction
All I wanted growing up was to be part of something that could help others. I wanted to be part of the solution; I wanted to be the change that made some-one else’s life better. Developing diagnostic tools that could predict early on the course of an illness and prevent curable diseases became something I wanted to be part of. To be able to develop these diagnostics tools we need to understand the molecules (RNA, DNA, and proteins) that work coopera-tively to fulfill different biological processes. The human body is a complex mass of cells interacting with each other and secreting enormous numbers of molecules that vary in size, concentrations, and functions but all acting to-gether to perform different regulatory roles in the body. These secreted mol-ecules make up the human plasma proteome; composed of millions of anti-bodies and a multitude of other classes of proteins, which are involved in different biological activities, ranging from modulation of pathological con-ditions (including cancer, autoimmune diseases), the mediator of cellular responses, to modulation of receptor-mediated signal transduction. The plasma proteome has for decades been a rich source of biomolecules that represent the health of the human body and used as a diagnostic medium. The plasma proteome has an enormous role in circulation; it contains pro-teins that serve as messengers between organs such as hormones, and can indicate disease state of organs when leaked into blood, for instance, in cases of myocardial infarction, prostate cancer, and also proteins molecular ma-chinery, which carry out several structural, catalytic, metabolic processes in living systems. Therefore, quantifying the relative abundance of these pro-teins gives us an opportunity to characterize little errors related to diseases and follow disease progressions in individual patients. To understand, dis-cover, detect, characterize, validate and analyze these biomolecules in the human body, strategies and tools are required. This thesis presented here aimed at developing new diagnostic tools to address the issue of detecting, quantifying and analyzing proteins. The concept of this work was a target-based approach to use the existing tools and improve the performance by creating new designs, detections platforms, and application of enhanced tools in clinically relevant diseases. Herein presented are four new molecular tools that were developed for this thesis.
Paper I describes the combination of the proximity ligation and in situ as-say systems to develop a new assay system. This variant assay system uses readout mode which complements already existing instrumentations used in

13
hospital laboratories and clinics. Paper II present a new method called Ex-oPLA for detection of extracellular vesicles (EVs). Extracellular vesicles are membrane-bound vesicles released from cells, may be relevant biomarkers and functions as cell-to-cell communicator agents carrying RNA, DNA, and proteins.
Investigating spatial localization of proteins in cells and tissue in situ is an excellent way to understand signaling events and protein-protein interac-tions. The primary goal of Paper III was to increase the efficiency of in situ protein detection. We had realized that the design for the current in situ pro-tein detection method suffered from the limited efficiency that arises from non-circular templated that cannot be amplified. My role in this project was to measure quantitatively how much efficiency gained with this new method that we call UnFold. UnFold was used to evaluated the measurement cyto-kines spiked in non-human serum in comparison with in situ.
Another tool that can measure and quantify protein in serum, plasma, and blood is the proximity extension assay (PEA). PEA is a powerful assay as up to 92 proteins, and four controls measured in just one µL of blood with great sensitivity. However, low abundant proteins are usually missed because there are few molecules to be detected in such small volumes, and because of contributions from background signals. Paper IV founded on the hypothe-sis that by using a solid phase, increasing sample volume, provide a greater number of molecules to be detected; also excess reagents may be removed by washes, and the use of sets of three, rather than two antibodies, decrease the risk of nonspecific reactions. All these effects can help increasing the detection of the low abundant protein.
The tools presented in this thesis will contribute to the detection, quantifi-cation, and analysis of proteins, extracellular vesicles and applied to differ-ent diseases as a diagnostic toolbox both for researchers in academia and industry and finally also in clinical laboratories in hospitals and clinics.

14
1. Human proteome
In De Rerum Natura, Lucretius wrote: “Nothing comes from nothing.” In the central dogma of molecular biology (1) put forward by Francis Crick in 1970, which detailed the allocation of information from DNA to RNA and then to protein but also stating unequivocally that the information in protein can not transferred to DNA or RNA. In deciding on how to write this thesis, I imagined the readers to be people ranging from non-science, non-biotechnology background to colleagues and others with clinical, biological and biotechnological expertise. So, in this part of the thesis, a basic overview of the biology and technical aspect will be discussed. This first part will fo-cus on biomolecules, their disease reporting characteristics, challenges and analytical criteria when developing tools to detect and analyze these biomol-ecules.
1.1 Basic building blocks In the 50s, the idea that DNA was the carrier of genetic information astound-ed biologist with the insight of how the simple molecular structure with two parallel chains consisting of four bases Adenine, Thymine, Cytosine, Gua-nine, each linked together covalently by sugars that are attached to phos-phate groups in DNA. The structure and its implications were described by Watson and Crick (2). Langridge and colleagues in 1957 made refinement to the structure via further x-ray crystallography studies (3) where they con-firmed double helix model brought forth by Watson and Crick. Meselson and Stahl confirmed this transfer of information from parental to daughter generations with experiments where they radio-labeled bacteria with N15 and grew them for 14 generations and using ultraviolet absorption photography. They observed that the nitrogen of the DNA was divided equally between subunits. It remained intact throughout many generations, also each daughter molecules had a copy of the parental subunit after replication, there was a doubling in the molecular machinery, and they showed differences of the heavy, light and mixed chains by ultracentrifugation as an effect of semicon-servative replication (4).
As described in the central dogma of molecular biology, the information embodied in protein transferred from DNA. Nirenberg and Matthaei discov-ered the key to breaking the genetic code in 1960.. As the saying goes, an

15
experiment is as good as its control, Nirenberg and Matthaei had developed an in vitro system for protein synthesis when they discovered that upon dis-ruption of the cells, protein synthesis stopped. Trying to lengthen the short phase during which in vitro synthesis takes place, they added ribosomal RNA into the reaction where all 20 amino acids incorporated into the new proteins. Their control experiment was set up with mock RNA, and this proved more valuable as they equally had all 20 amino acid incorporated into the new protein. To confirm their discovery, they used the enzyme pol-ynucleotide phosphorylase to synthesize random RNA molecules from available precursors without a template to form a mock RNA only consisting of U residues as the polyuridylic acid from UTP (5, 6). Protein synthesis occurred when they added the poly U into new cell suspension that was dis-rupted and interestingly, 14C labeled phenylalanine was incorporated into the protein. This results confirmed earlier work by Brenner and colleagues (7) hypothesizing that ribosomes cannot distinguish mock RNA from naturally occurring RNA. The mock mRNA carried the genetic code for phenylalanine as UUU, and the ribosomes read it with high efficiency. Additional genetic code for the other amino acid where rapidly annotated (8-10). This approach leads to the synthesis of synthetic mRNA thereby deciphering the full genet-ic code. Ten years earlier, George Gamow had proposed the genetic code (11) in his Diamond code whereby several triplets selected in a specific manner coded for any given amino acid, and these codes were degenerate and overlapping. In the 60s, Brenner, Crick, Barnett, and Watts-Tobin for-mulated that the three letter stands for a word, which was the codon instruct-ing the incorporation of one amino acid.
The cell-free protein synthesis experiments carried out by Matthaei and Nirenberg concluded that DNA was not directly involved in protein synthe-sis, but RNA (Figure 1.1) was responsible for incorporating amino acids to form proteins and finally that this amino acid was representative of the ge-netic code, which occurred in triplets and that some of the codons were de-generate. They are the most complex of all biomolecules; there are 20 amino acids in proteins with each amino acid having a distinct structural and chem-ical composition. The word protein stems from the Greek word proteios meaning ‘the most important one’ or ‘first one’ (12), the name protein coined and adopted in the 18th and 19th centuries by JJ Berzelius and GJ Mulder. Proteins are made up of a string of amino acids each linked together by covalent peptide bonds. HE Fischer first proposed the word peptide. Pro-teins are polypeptides which form repeating units along the polypeptide backbone forming different structure (13). The structure grouped as (a) pri-mary (linear sequence of amino acid); secondary (alpha helixes and beta sheets structures that are stabilized by hydrogen bonds); tertiary structures (depicts the formation of globular structure via folding of polypeptide chain); quaternary structure (showing the arrangement of multiple polypep-tide subunits stacked together). F Sanger in 1951 determined the primary

16
structure of insulin (14) which further established Fischer’s proposal for the polypeptide nature of proteins. Proteins are the molecular machinery that is responsible for carrying out catalytic, regulatory and metabolic functions (enzymes, hormones), structural (bones), signaling transduction, cell cycle control, gene transcription, and translation. There exist about 20,500 protein-coding genes in the human genome (15-17), which give rise to the unknown number of protein variants (Figure 1.1). An enormous majority of the human genes are subjected to differential transcriptional start, variable splicing (18, 19), giving rise to proteins translated from different splice variants, pro-cessing and posttranslational modifications (20) (such as glycosylation, and phosphorylation). All these different protein exhibit large functions and are of the several diagnostic significances (21-23). Therefore, by characterizing and measuring proteins, we get a plethora of information about the health and disease state of individuals.
Proteins that are only transcribed when needed like regulatory proteins (24), pheromones in yeast (25); time-dependent genes like cell cycle genes in yeast (26) and humans (27); bacterial proteins optimized for genes for fast translation within short operons (28) and also in codon-containing genes (29).
Figure 1.1: Mechanism of protein synthesis from a single gene in a cell in eu-karyotes.
Cytoplasm
Nucleus
Introns Exons
Transcription
5’ capping RNA splicing3’ polyadenylation
DNA
PrimaryRNA transcript
mRNA
Export into cytoplasm
5’ UTR 3’ UTRmRNA
Protein NH C00H
Post-translationalmodification
Compartmentalization
Proteolysis

17
In the nucleus, cellular machinery identifies the promoter and transcribes a gene into mRNA, which contain both introns and exons. Before transporta-tion of the mRNA from the nucleus to the cytoplasm, the introns are re-moved by RNA splicing. The transcripts are also 5’ capped, spliced and 3’ polyadenylated and for each gene structurally distinct several primary tran-scripts are translated into proteins. Posttranslational modification, compart-mentalization and proteolysis then regulate proteins function.
Huge initiatives at the Human Proteome Organization (HUPO), called the Human Proteome Project (HPP), aims to revolutionize our understanding of the relative abundance, protein localization and interacting partners of the human proteome by characterizing every protein from every predicted gene (30). Other project includes the Human Protein Atlas (HPA) whose main aim is to map protein distribution in healthy and cancer tissue (31).
1.2 Bodily fluid In 1878, the French Physiologist Claude Bernard (also known as the founder of modern experimental physiology) wrote, "The stability of the internal environment (the milieu intérieur) is the condition for the free and independ-ent life” a state that was later characterized as homeostasis by WB Cannon in 1939. All vital biochemical, mechanical and physiological function of hu-mans happen in an environment with multiple functions, consisting of cardi-ovascular and vascular (capillaries, arteries, and veins) system. This envi-ronment sustain the body fluid, which makes up approximately 3/5th of the adult human body and divided into compartments. These compartments are mainly the intracellular and extracellular fluids. All compartments are vital but the extracellular one is of great importance when it comes to proteome mining, and the application opportunities that the tools presented in this the-sis can provide. The extracellular fluid is made up of the macroenvironment (blood) and the microenvironment (interstitial tissue fluid: extracellular and cellular elements). Blood is the single most populated macroenvironment in the human body. Blood comprises about 8% of the total human body weight, and it is an exceptionally complex systemic fluid, which functions mainly as the transporter (nutrients, waste products, gas) systems, while it maintains homeostasis of ions, water, and pH in the body. Over the average lifespan of a human individual, the heartbeats over 2.5 billion times injecting over 200 million liters of blood. An average adult (of about 70 kg) has about 6 liters of blood that flows continuously throughout the body to sustain the body’s physiological functions. These physiological functions include the transfer of nutrients (oxygen, electrolytes, enzymes, hormones, carbon dioxide), to bal-ance and maintain pH and control temperature and chemical composition within the intracellular and extracellular elements of the tissue microenvi-ronments. The body’s arsenal for fighting all infectious agents and its de-

18
fense mechanism widely found in blood. The milieu intérieur brought forth by Bernard included the bodily fluid and maintenance therein, which led Starling to write the “Wisdom of the body” in which he acknowledged “that living organism preserve the constancy of their internal milieu notwithstand-ing the significant variations in food, water intake and other environmental” (32). About half of the whole blood volume is made up of different cell types including red blood cells (erythrocytes), white blood cells (leucocytes) and platelets (thrombocytes). The latter two are involved in the defense systems of the body. Blood is the body’s transporter, and about 55% of its volume is made up of a liquid fluid called serum and plasma. Plasma and serum pre-pared from blood by different means. Plasma is collected by treating blood with an anticoagulant (EDTA, heparin or sodium citrate) and removing the blood cells by centrifugation. In the collection of serum, no anticoagulant used and it is collected by removing all cells and blot clotting proteins. Plasma and serum are different not just in their mode of production but also in their qualitative content. The serum is void of numerous coagulation fac-tors and fibrinogens, and it contains a higher amount of abundant proteins such as globulins (33) thus making plasma the fluid of choice in proteomics. Studies carried out by the HUPO/HPPP (34, 35) also concluded that plasma is preferable to serum due to less degradation. However, care should be tak-en during plasma preparation, as the choice of anticoagulant should be based on the intended end point protein analysis. In this thesis, plasma samples have been used to validate the tools developed as discussed in the paper I & II .
The plasma proteome is in constant communication with the tissue mi-croenvironment delivering and receiving nutrients and signals via the lym-phatic system. In a paper by Liotta et al. they wrote: “every cell in the body leaves a record of its physiological state in the products sheds into the blood” (36). Anderson and Anderson elaborated (37) the Putnam’s classification of the function of proteins by adding proteins that are (i) secreted from solid tissue (like liver and intestines), (ii) antibodies, (iii) proteins that act away from site of production like hormones, (iv) receptor ligands that function in mediating local responses and may have short residual time in plasma like cytokines, (v) tissue leakages protein that may arise as a result of cell death for example creatine kinase (38), (vi) aberration secretions, which mainly include proteins, cells released from cancer cells into plasma and (vii) for-eign pathogen that infect and release pathogens into the blood. As explained by Liotta and Anderson, the plasma proteome is important for revealing the pathological and physiological state of humans and used extensively in bio-medical research and clinically for diagnosis and prognosis of diseases. To further elaborate on the utility of these different class of protein, Leigh An-derson looked at a subset of an FDA-cleared or approved group of protein classified into the same category above as follows (i) proteins with function in plasma 45%, (ii) proteins leaked from tissue 25%, (ii) receptor ligand

19
proteins like cytokines 18%, (iii) aberrant secretions from cancer tissues 6% and (iv) immunoglobulin 6% (39). Blood is predominantly rich in red blood cells (carried hemoglobin for oxygen transfer), white blood cells (which includes basophils, eosinophil, neutrophils and monocytes) and platelets (important in homeostasis by preventing blood clot and loss). Questions often raised about the plasma proteome include; how many proteins are there?? What types of proteins are present? How much communication does the other proximal bodily fluid have with plasma? Anderson and Anderson in their epic tale on plasma proteome quotes the dynamic range of protein concentrations in plasma varies from albumin (most abundant ≈ 40 mg/mL (mM)) to interleukin-6 (in the pg/mL (pM) range) in the order of 1010 with IL-6 being the least in concentration (37, 39). As mentioned earlier, about the complexity and difference of the proteome and genome, the well-know human protein-coding gene has been approximated to about 20,500 (15), which does not indicate the different splice variants for each gene, the func-tion of the different proteins and their utility in diagnostics or as biomarkers. As written by Landegren et al. “the question about how many plasma protein variants to distinguish for diagnostic purposes is unlikely to receive a clear-cut answer anytime soon” (40). Plasma communicates directly with the tis-sue microenvironment (tissue secretion or damage) and other proximal bodi-ly fluids from body cells, tissues, and organs. To give a basic picture of the other bodily fluid, I list them in Figure 1.2 with their organs of origins. The plasma proteome provides opportunities such as the availability of most ac-cessible soluble proteins that is acquired by noninvasive means and contains tissue-derived proteins. Some specific drawbacks include that it is extremely complex with an enormous uncharacterized dynamic range and unstandard-ized protocol. Addressing the problems of the broad dynamic range of the plasma proteome, the paper I demonstrates that with new molecular tools, the dynamic range can be increased by 102 orders of magnitude when com-pared with current state of the art technology for detecting and analyzing protein in plasma. Also, the protein content and biochemical properties of these fluids are different e.g. the pH ranges from 1.7 – 8.2 from the gastric to the bile respectively. Several studies have been performed to characterize the proteome of saliva (41), tears (42) and CSF (43) that provides useful bi-omarker candidates for the diluted proteins in the plasma proteome. While some of these alternative sources are very reachable and noninvasive, such as urine and saliva, other sources are less accessible and more invasive methods are required to collect, e.g. biopsies. Tissue compartment, known as the tissue proteome is another source for protein analysis where detail in-formation at the subcellular level shows protein distribution patterns, expres-sion protein profiles, protein localization, functional aspects of the protein with focus to protein-protein interactions, posttranslational modifications, signal transduction, membrane-bound proteins and interaction between nu-clear and cytoplasmic proteins. The drawback with these sample types is that

20
surgical procedure is needed and the samples have a non-homogenous repre-sentation due to cell-cell variations. The human protein atlas, an online re-source where antibodies with peroxidases are used to map out spatial distri-bution of different proteins (44). In research setting, cell lines, fixed tissues are used to model experiments to understand the tissue proteome and Paper III in this thesis talk about novel tools for in situ detection and quantifica-tion.
Figure 1.2: Bodily fluids Cell to cell communication is an important function in all organisms, and this exchange of information among cells occurs in the soluble matrix by direct interactions (45). Another class of biomolecules that is indicative of the state of humans is extracellular vesicles (EVs). These EVs are produced by many eukaryotic cells and contain mRNA, non-coding RNA, and pro-teins, which can be transported and delivered to other cell types and even different species with alternative functionalities (46). EVs are found in eu-karyotes and prokaryotes (47, 48). Recently, lots of studies have been carried out to evaluate the potential of this class of potential biomarkers and their implications in diseases. EVs have been isolated from body fluids, and there are ever increasing evidence of the role of EVs in cell maintenance like in propagating growth in hematopoietic progenitor cells and genetic infor-mation transfer (49), stimulate tissue repair (50) and blood coagulation by activating platelets (51). EVs are classified based on their biogenesis and cellular origin. Based on biogenesis, EVs can be exosomes, microvesicles and apoptotic (52) bodies. For the scope of this thesis, I will briefly talk about different EVs classes. In the late 70s, membrane-bound vesicles were discovered in the prostatic fluid (53-55) and the name exosomes were coined by RM Johnstone in 1987 (56). Exosomes are derived from endocytic path-ways (57) and they vary in size from 30 to 200 nm in diameter. On the other hand, microvesicles are budded off from the plasma membrane (58) and

21
their size may be up to 2,000 nm in diameter. Recently, various tissue specif-ic and cell type exosomes and microvesicles have been described. Examples of those include (a) prostasomes, which are nano-sized microvesicles that are secreted by the acinar epithelial cells in prostate gland: they function as in-tercellular communication between the cells of the acinar cells of the pros-tate gland and the spermatozoa (59), (b) Cardiosomes are exosomes and/or microvesicles from the cardiomyocytes (60), and (c) Vexosomes are associ-ated with adenovirus vectors and can be exosomes or microvesicles; with proposed function being good delivery tool (61). Additional types included Ectosomes (which are vesicles secreted from monocytes and neutrophils), microparticles (shed from platelets in endothelial cells in blood), and Tolero-somes (are vesicles that are purified from the serum of antigen-fed mice). Some of these tissue and cell specific EVs are emerging biomarker targets (62). In cancer cells during apoptosis, many vesicles are released from the cells. In prostate and ovarian cancer, small vesicles released from the organ and they share specific and similar signatures to their tissue, and they can reveal the original tumor cell (63, 64).
1.3 Biomarkers In 1844, there was an accident by Alexander McBean, a London grocer, while on vacation. He had fallen in a cave and immediately felt as if some-thing had given way in his chest, and he was unable to stir and in extreme pain; his physician, William Macintyre, recorded this observation (65). He was diagnosed and was treated for myeloma but in 1846, he had a relapse from myeloma, was functioning well but in extreme pain, and he later died. An autopsy was carried out by Dr. Macintyre and in the presence of Dr. Thomas Watson, and he described McBean’s bone marrow as “blood-red and gelatiniform” and microscopy coherent with plasma cell qualities. An additional test was done (examination of the physicals and chemical proper-ties of the urine) revealed that he died from “atrophy from albuminuria.” The two physicians sent his samples collected during the fall and autopsy results to Dr. Bence Jones (also know as the “father of clinical chemistry”) at the St. Johns hospital in London who was interested in chemical experiments on albumin in urine. In 1847, he published the study (66) based on McBean’s urine sample linking the presence of proteins in urine to myeloma (pro-teinuria detection in multiple myeloma).
The term biomarker was used and published in 1980 by Paone and col-leagues in a study where they showed that serum galactosyl transferase could be a potential marker to follow up treatment for cancer and breast cancer recurrence (67). The NIH in 1998 suggested the definition of a biomarker as “a characteristic that is objectively measured and evaluated as an indication of a normal biologic process, a pathogenic process, or a pharmacologic re-

22
sponse to a therapeutic intervention.” More than ten decades later Dr. Bence Jones’ discovery led Korngold and Lipari to identify and characterize the kappa and lambda free light chain (FLS) (68), which was later approved by the FDA in 2001 as diagnostic, prognostic, monitoring biomarker for diseas-es.
For the rest of this thesis, I will refer to biomarker as a molecular bi-omarker rather than the physiological (e.g. heart rate in cardiac arrest or body temperature in high fevers) or physical (change in eye color like in yellow fever) aspects of the definition. Biomarkers are used at different clin-ical stages and settings.
In this section of the thesis, I will give a brief overview of the different category of biomarkers, the biomolecules highly explored, the clinical rele-vance, opportunities, challenges and the market status. Keep in mind that the focus of this thesis is to develop molecular tools for protein biomarkers. Other forms of disease indicators include DNA, RNA, extracellular vesicles, and metabolites.
To shed some light on a first category (diagnostic, prognostic and predic-tive) of biomarkers, I will use this case study. With a one-month history of difficulty speaking and imbalance, a 65-year-old woman went to the hospi-tal. Two years earlier, immunohistochemistry analysis had revealed E-cadherin, progesterone receptors (PR) and estrogen receptors (ER) were positive, and so was her human epidermal growth factor 2 (Her2) levels by fluorescent in situ hybridization (FISH) on breast tissue. ER is a diagnostic marker for metastatic breast carcinoma because it only expressed in breast tissue. E-cadherin, on the other hand is a protein that is expressed in ad-herens junctions in epithelial tissue and it is a diagnostic marker for meta-static carcinoma (69). In normal brain tissue and or primary brain tumors, there is no expression of E-cadherin; hence the presence of this protein indi-cated an external epithelial primary site (70, 71). Diagnostic biomarkers help to detect and identify the disease state and stage. This woman was diag-nosed with metastatic breast cancer and solitary brain lesion that was malig-nant. These two biomarkers due to their biology are also significant prognos-tic markers. A prognostic marker indicates diseases outcome and is used in clinical trials to stratify patients for treatment but they do not necessarily predict the response to the treatment. Certain prognostic markers indicate favorable outcomes and others do not. In her case, she had a positive ER and PR, and these are associated with a favorable outcome as these group of patients have a lower mortality rate after diagnosis (72), not taking into ac-count other confounding factors like age, diseases state, race, tumor grade and so on. She had treatment with surgery, chemotherapy, and radiotherapy. To access the efficacy of the treatment, predictive biomarkers are used. With her being positive for ER and Her2, her follow-up treatment with chemo-therapy included Herceptin and Tamoxifen (73, 74). Predictive (or respon-sive) biomarkers are used to provide information on the effect of a particular

23
treatment and facilitates targeted therapy (75). A positive ER and Her2 over-expression are favorable predictive biomarkers because studies show that such cancers are sensitive to Tamoxifen and Herceptin (74). As discussed above, some biomarkers that act as diagnostic, prognostic and predictive markers like the ER protein.
Other biomarkers used includes (i) safety biomarkers (76) used predomi-nantly in the preclinical toxicological validation of new drugs to predict and monitor the early onset of drug toxicity. (ii) Efficacy biomarkers, (iii) Phar-macodynamics biomarkers are used to characterize pharmacology models to demonstrate pharmacokinetic and pharmacodynamics relation with a drug under development, (iv) Surrogate biomarkers are defined as “laboratory measurement or physical sign that is used in therapeutic trials as a substitute for a clinically meaningful endpoint that is a direct measure of how a patient feels, functions, or survives and is expected to predict the effect of the thera-py” (77). Surrogate biomarkers are used in the early phase of drug develop-ment to obtain information that may be critical for further development (78) and (v) Validation biomarkers mostly used in drug development.
Biomarkers market reports projects growth of about 13.8% over the next decade. These projections arise from continuous growth of $29.3 billion to $53.34 billion from 2016 to 2021. The trends include an increase in the number of cancers, growing investments in R&D and the increasing usage of biomarkers in the pharmaceutical industry (Biomarkers Market Analysis and Trends - Product, Type, Disease Indication, and Application - Forecast to 2025 Report, Oct 2016. ID3951909).
Certain guidelines are put in place monitor and validate the characteriza-tion, detection, quantification, and analyzes of biomarkers. There are differ-ent regulatory institutions like the FDA, via the Good Laboratory Practice (GLP), the International Conference on Harmonization (ICH) and the ISO/IEC 17025.
1.4 Analytical guidelines and tests of method validation As the title of this thesis suggests, I set out to develop new molecular tools that could improve the depth at which we detect proteins. While there are many methods available, there are some guidelines and terminologies that all molecular tools adhere. In this part of the thesis, I will briefly describe those terminologies, and my hope is that it will be helpful when we progress into the projects mentioned in this thesis. Figure 1.4 illustrates the observed standard curve for protein detection and some analytical properties. IHC defines Specificity/Selectivity as “the ability to assess the analyte une-quivocally in the presence of components which may be expected to be pre-sent. Typically this might include impurities, degradants, matrix, and so

24
forth.” In simple terms, specificity is the ability of a molecular tool to recog-nize all negative samples as negative and positive samples as positive. Sensitivity is the assays ability to measure the actual signal. However, de-pending on applications, sensitivity in the molecular sense refers to the ca-pability of the assay to measure minute amount of analytes, while in clinical sensitivity, the ability to detect and identify all positive events. Three differ-ent means are used to characterize sensitivity; (i) how little molecules can be detected (ii) how small changes can be detected and (iii) how many of the true positives identified
Figure 1.4: Schematic illustration of a real protein detection standard curve Increase in protein concentration ideally should correspond to an increase in detec-tion signal. However, there is background noise that arises from non-specific bind-ing of detection reagents to surfaces or aggregations, non-specific adsorption to media and or cross reactivity to non-target analytes. A and B represents the analyti-cal detection range (dynamic range) which is includes the lower and upper detection limits. A also represents the sensitivity of the assay. Also, above some level of input no further increase of signal is seen.
ICH defines Precision as “the precision of an analytical procedure is defined as the closeness of agreement (degree of scatter) between a series of meas-urements obtained from multiple sampling of the same homogeneous sample under the prescribed conditions.” Precision may be considered at three lev-els: repeatability, intermediate precision and reproducibility. ICH defines Accuracy as “the closeness of agreement between the conven-tional true value or an accepted reference value and the value found.”

25
ICH defines Linearity as “an analytical procedure as its ability (within a given range) to obtain test results that are directly proportional to the con-centration (amount) of analyte in the sample.” ICH defines Range as “the interval from the upper to the lower concentra-tion (amounts) of analyte in the sample (including these concentrations) for which it has been demonstrated that the analytical procedure has a suitable level of precision, accuracy and linearity.” In simple terms, the range is the ratio between the highest and the lowest measurement within the linear phase of the curve. ICH defines Limit of detection (LOD) as “the lowest amount of analyte in a sample, which can be detected but not necessarily quantitated as an exact value.” Based on the level of significance in the assay, the LOD for a partic-ular analyte can be calculated as such that the concentration of an analyte that corresponds to a signal that is three standard deviation above the back-ground signal. ICH defines Limit of quantification (LOQ) as “the lowest amount of ana-lyte in a sample, which can be quantitatively determined with suitable preci-sion and accuracy.” ICH defines Robustness as “a measure of its capacity to remain unaffected by small, but deliberate variations in method parameters. It provides an indi-cation of the procedure’s reliability during normal usage.” Coefficient of variation is the level of spread or variation between experi-ments, its calculated as the standard deviation by the mean and it has no units.

26
2 Affinity reagents and applications
For molecules to be detected, there needs to be a tool that does the detection in a specific manner. In 1959, Yalow and Berson reported (79) for the first time the use of antibodies for the detection of human insulin. Antibodies have since then played a pivotal role as affinity reagents in in vitro and in vivo experiments in both academia and industry. Three terms usually associ-ated with affinity reagents includes affinity, selectivity, and specificity. Af-finity in the biological context refers to the strength of binding of two mole-cules A and B. Selectivity is the ability of an affinity reagent to bind a mole-cule (e.g. A) over other molecules (e.g. B or C or D) in the systems. Finally, specificity is one of the most widely used terms in this field refers to the ability of an affinity reagent to bind to its target molecule with zero cross-reactivity towards non-target molecules.
The interaction between A and B are influenced by parameters such as temperature and pH but the basic system is as represented below:
[A]+ [B] ⇌ [AB]
Keq = KA/KD = [AB]/[A][B]
Where [A] and [B] are concentrations of affinity reagent (A) and target (B) molecule in equilibrium with [AB]. KA and KD are associations, and dissoci-ations constants of A and B. The dissociation constant (KD) has units M, and it is the preferred measured to the affinity of affinity reagents. The common range for dissociations is in the micro- to nano-molar scale, however strong-er interactions have KD in the pico- to the femtomolar range. The different tools to measure affinity include but are not limited to Surface Plasmon Res-onance (SPR) and Isothermal Titration Calorimetry (ITC) (80, 81). In this part of this thesis, I will give an overview of the different affinity reagents, their applications, the opportunities, challenges, and applications in life sciences with focus on antibodies since that is what has been used in this work.

27
2.1 Affinity reagents Antibodies are the most widely used affinity reagents used in the life scienc-es. They are naturally occurring biomolecules known as immunoglobulins that are produced by B cells to protect the body against foreign pathogens. They are large biomolecules made up of four polypeptide chain, having a molecular weight of 150 kDa. The are made of two light (L) chains (contain-ing about 220 amino acid) and two identical heavy (H) chains (containing about 440 amino acid), which are linked to each other covalently by disul-phide bonds forming a Y-shaped structure. Each of the four polypeptide chains is made up of the variable (V) and constant (C) regions; VL and VH confer specificity to the antibody and make up the antigen-binding site and bestows antibody avidity. The hinge region of the heavy chains ensures good antigen binding flexibility for binding. There are five classes of immuno-globulins in humans IgG, IgA, IgD, IgM, and IgE. IgG and IgA have sub-classes, which are classified based on the unique sequence of the hinge and Fc region (Figure 2.1)
Figure 2.1: Structure of an antibody. An IgG antibody consists of four polypeptides chain, two heavy (denoted CH, VH) and two light chains (denoted CL, VL) and both chains are linked by disulphide bond. The terminal of both chains have variable antigen determining regions. The tail end of the antibody is called the Fc fragment (or effector region) and consists of portions of the heavy chains. There are five different types of heavy chain (α,δ,ε,γ and µ), which determine the class of IgG (IgA, IgD, IgE, IgD and IgM). There are two type of light chains κ and λ.

28
In 1984, Köhler, Milstein, and Jerne won the Nobel Prize. In 1975, Köhler and Milstein reported a hybridoma technology that could be used to produce mouse monoclonal antibodies (82). Fusing myeloma cells with spleen cells from mice immunized with the target antigen gave rise to hybridoma cells that produce monoclonal antibodies with the desired specificity. Each of these hybridoma cells produces only one antibody, which were purified from their supernatant with all the antibodies directed against the same specific epitope on the antigen (82). On the other hand, polyclonal antibodies are produced via immunization animals such as mouse, rabbit, goat, sheep, and donkey with an antigen (83). The serum collected after the inoculation con-tains a mixture of IgGs that are produced by different B cell. Some of which recognize different parts of the antigen (84) The polyclonal antibodies are then purified using specific antigen immobilized on affinity chromatography matrices to produce specific antibodies (85) or using protein A/G columns (86). Monoclonal and polyclonal antibodies are widely used in basic re-search and diagnostics. However, when compared to polyclonal antibodies, preparation of monoclonal antibodies requires extra expertise, cumbersome work and long times (87) (4 – 8 weeks for polyclonal compared to 3 – 6 months for monoclonal antibodies production). Details on the different ap-plications of antibodies will be discussed in the technologies section of this thesis.
The above-described affinity reagents are based on a natural selection sys-tems and they have some limitations. In the in vivo selection systems, the antigen used to immunize animals cannot be pathogenic, toxic antigens (like drugs), unstable proteins or highly conserved proteins such as histones (88). All these constraints have led to the development of alternative affinity rea-gent with in vitro systems. Progress in recombinant affinity reagents has resulted in the development of platforms whereby high throughput recombi-nant affinity reagents are generated with distinctive characteristics such as library sizes, means of selection, and classes of reagents. These affinity rea-gents can be modified to include tags that will facilitate modifications, puri-fication and they are usually small in size. Variants of recombinant antibod-ies include the antigen-binding fragments (Fab), single-chain variable frag-ment (scFv), Nanobodies and Yumabs. These antibody fragments produced by introducing genes into vectors for in vitro display systems that encode the V domain from the heavy and light chain of an antibody. These two domains can then be joined by disulphide bonds to form the antigen binding frag-ments or joined with an oligopeptide linker to form single-chain variable fragment (89-91) Another class of recombinant antibody fragment is a single monomeric variable antibody domain called nanobodies. They are about 12-14 kDa in size and are produced in camelids whose antibodies lack the light chain (92, 93). Alternatively, recombinant antibody fragments can be ex-pressed in a form that preserves some of the natural characteristics of the antibody. Expressing the Fc region of an antibody from a certain species and

29
merging it with the ScFv fragments that are selected by an in vitro system, ScFv-Fc (94) fragments are created that are called Yumabs (http://yumab.com).
Though there are natural antibodies and antibodies fragments that are widely used in research and industries; there is an expanding range of alter-natives that are non-immunoglobulin derived affinity reagents. These are protein scaffolds such as DARPins, affibodies, and anticalins. The designed ankyrin repeat proteins (DARPins) are about 14 kDa in size, are they are derived from natural ankyrin protein consisting of four to five repeats of motifs of these proteins (95). The ankyrin proteins are involved in different biological processes such as inflammation and cell signaling. Affibodies, on the other hand are 6 kDa size scaffold based on the Z domain from staphylo-coccal protein A (96). DARPins and nanobodies are very stable compared to other affinity reagents. Another class of non-antibody affinity reagents is the nucleic acid based affinity reagents like aptamers and SOMAmers. Aptamers are single-stranded DNA or RNA binders (97) while SOMAmers are so–called slow off rate-modified aptamers, which are generated via a selection process based on the slow off rate on target antigens, and using chemically modified nucleotides (98, 99). These new alternatives provide opportunities whereby the need for animal immunization is avoided. With all this advanc-es, there is still a great need to harmonize, characterize, and validate the ex-isting affinity reagents for research.
In this regard, there is ongoing efforts and consortium with the aim to sys-tematically produce affinity reagents against all proteins encoded by the 20,500 human genes, build databases, and portals to catalog the character-ized affinity reagents. These programs include the Human Protein Project (HPP) by the Human Protein Organization (HUPO; https://www.hupo.org), AFFINOMICS Project (http://www.affinomics.org), ProteomeBinder (http://www.proteomebinders.org), NIH Protein Capture Reagent Program (https://proteincapture.org), and Human Protein Atlas (http://www. protein-atlas.org).
Antibody application in therapy has evolved immensely in the last dec-ades with novel super specific antibodies used in treatments alone and in combination with chemotherapy as well. In therapeutics, affinity reagents have been successfully used in therapy for treatment of many cancers such as the FDA approved alemtuzumab, Trastzumab, Ibritumomab tiuxetan Ipilimumab (100-102) and Nivolumab (103) for melanoma and bladder can-cer respectively, which are monoclonal antibodies. RNA aptamers MacugenTM approved (104) by the FDA in the treatment of age-related mac-ular degeneration. Other potential therapeutic reagents include Yumabs, DARPins and nanobodies (105, 106).

30
2.2 Labeling of affinity reagents Labeling of affinity reagent has increased tremendously with antibody-based applications in research, diagnostics and clinical applications. From the dis-covery of electrophoresis for protein separation by Arne Tiselius in 1937 to setting up the first radio-immunosorbent technique for antigen quantification by Wilde and Porath in 1966, labeled of antibodies via different methods. 80 years later, labeling of affinity reagents is as relevant in studying of protein biochemistry, pharmacokinetics, protein localization and expression and protein-protein interaction. In this section, I will briefly discussion the dif-ferent labeling methods for proteins and antibodies with the focus on anti-body labeling.
For better understanding, I will divide the labeling types in vivo and in vitro chemical labeling.
The most common labeling approach for antibodies and proteins in vitro is via primary amino groups in lysine residues or N-termini of the protein sequences. Small molecules called N-hydroxysuccinimide ester (NHS) serves as a linker between the antibody and the molecules that need to be attached. When performing this labeling method, care should be taken as the NHS-ester readily hydrolyzes under alkaline conditions. Examples of other NHS-ester based coupling reactions includes attaching a biotin or a fluoro-phore to an amine group via biotin- and fluorophore – NHS-ester. Papers I, II and IV in this thesis use this type of conjugation to couple oligonucleotide to primary and or secondary antibodies. Carboxylic groups in side chains of aspartic or glutamic acid in the Fc region of antibodies or at their C-termini can also be labeled by using 1-ethyl-3-(3-dimethylaminopropyl) car-bodiimide (EDC), which activates the COOH to allow for coupling of the desired molecule. In the case of antibody labeling, this method is more suit-able as it allows for the preservation of the antigen-binding site of the anti-body thereby preventing reduced specificity and efficiency of binding. An-other frequently used labeling method is a thiol or sulfhydryl coupling. This type of labeling is specific to label cysteine side chain in proteins and anti-bodies. Here, succinimidyl-4-[N-maleimidomethyl]cyclohexane-1-carboxylate (SMCC) acts a heterobifunctional crosslinker. The cysteine-containing (16) biomolecule is reduced with DTT or another reducing agent, which allows for the coupling to the reactive maleimide-labeled derivative to form a thioester linkage. This technique though widely used, is the most unfavorable for labeling antibodies and proteins. In antibodies, both the heavy and light chain of the antibody is linked via S-S bond and reducing the antibody may cause instability via the hinge region also disruption of the Fab region of the antibody thereby reducing affinity and avidity. Paper III em-ploy the succinimidyl 6-hydrazinonicotinate acetone hydrazone (SANH) coupling chemistry to couple oligos to secondary antibodies.

31
The other labeling approach is in vivo. With the increase in recombinant affinity reagents, this mode of labeling has become a standard. Site-directed labeling is carried out during the production of reagents via recombinant DNA technologies like the fusion of targeted gene to protein in different expression systems. Examples of in vivo labeling including in vivo coupling of biotin to lysine in the biotin carboxyl-carrier protein subunit of acetyl-CoA carboxylase in E coli using the endogenous enzymes BirA (107), Sort-ase tags (108) and a wide variety of other tags.

32
3. Proteomics
3.1 Proteomics Understanding and exploration of proteins dates back to the days of Louis Pasteur in the middle of 1800s; he was a chemist but also interested in the basic question of understanding what was unique about the chemistry of living systems and their involvement in the treatment of human diseases. Marc Wilkins only devised the term proteome in 1994 and defined it as the study of protein on a large scale. The term PROTEOME was explained by Wilkins as PROTEin expressed in the genOME via RNA (Figure 1.1). How-ever, there is no one to one relationship between the proteome and the ge-nome. Besides, the terminologies involved at the level of the proteome is intrinsically far more complex than in the genome from the basic alphabet (20 amino acid compared to 4 nucleotides for DNA) to genes that can be spliced forming a plethora of protein products. Hence, the study of proteins can be categorized (Figure 3.1) to include; approaches to identifying and measuring their relative abundances, identifying and characterizing protein-protein interactions, identifying and characterizing post translations modifi-cation, analyzing protein function and localizations, signaling pathways, detection and measurement in different sample types just to name a few.
Figure 3.1: Type of proteomics, applications in biology and technologies
Proteomics
ProteinExpression
StructuralProteomics
FunctionalProteomics
ProteomeMining
Protein-proteinInteractions
Post-translationalmodifications
- Signal transduction- Diseases mechanism
- 3Dcharacterisationof biomolecules- Proteins structure-Subproteomeisolation-Organellecomposition-Proteincomplexes
- Yeast2 H- Mouseknockouts- Affinitypurified protein complexes
- Drugdiscovery- Targetidentification/validation- Differential display
- Yeasttwo-hybrid- Co-precipitation- Phage display- In situ PLA
- Glycosylation- Phosphorylation- Proteolysis- Ubiquitylation
33
Looking back to Pasteur’s interest, this thesis is focus in developing molecu-lar tools to detect and measure proteins in a complex biological material that facilitates diseases diagnosis and future treatment.
3.2 Looking into organelles Other techniques developed for studying protein localization, expressions, posttranslational modifications (PTMs) include yeast 2-hybrid, Western blot (WB), Immunofluorescence (IF), immunohistochemistry (IHC) and in situ PLA (will be discussed later). The yeast 2-hybrid (Y2H) is techniques used for studying protein-protein interaction, was developed by Fields and Songs in 1989 (109). In Western blot, proteins blotted from an electrophoresis gel into a membrane. WB was first described by Burnett in 1981 as the tool to analyze and detect protein(110). WB can be used in a direct mode whereby the protein is detected directly with an antibody linked to a fluorophore or enzymes to create the signal whereas an indirect WB utilizes a secondary antibody that carries the detection moiety and is directed against the primary antibody. Advantages of direct WB include shorter time, less cross-reactivity from a secondary antibody, can multiplex while indirect WB includes signal amplification by requiring secondary, no labeling of primary antibody hence less distortion of Fab and one secondary antibody can be used against many primaries. Drawbacks with direct WB include, primary antibodies are expen-sive, and labeling may reduce immunoreactivity, low signal amplification while increase cross-reactive and additional step in indirect WB. Immunoflu-orescence and immunohistochemistry are usually used to investigate endog-enous proteins in situ that is in cells and tissue (111). Both technologies uti-lize as affinity reagents mainly antibodies conjugated to fluorophore or en-zymes (112) and the signal generated is visualized by confocal or wide-field microscopy. The signal produced by these methods depends on the strength of the specific fluorophore signal compared to the auto fluorescence arising from the background of the sample. IF and IHC is applied in numerous clini-cal applications (113).
Flow cytometry is another powerful tool that measures multiple (up to 20) physical parameters in a single cell, or other particles such as a microorgan-ism, virus, chromosome or nuclei by allowing them to travel past a light source in the fluid stream. Also, it provides a great opportunity in diagnos-tics in a diverse majority of cancer and blood-related diseases with lots of molecular and cellular information within a given cell. Fulwyler reported the first flow cytometer in 1965 when he demonstrated the separation of cells by volume (114). The flow cytometry principle is based on its ability to meas-ure different characteristics and fluorescence of the cells. A computer visual-izes the signals and displays the intensity of each cell as a dot plot or histo-gram. Light reaching the cell diffracts into a pattern (scattering) that is de-

34
tected. This scattering of light reflects different properties of the cell such as size, shape, the presence of a nucleus, membrane, and granularity, and so on. Two type of scattering light detected; the forward (FS), and side (SS) scatter. The FS range of light scattering is about 0.5 – 10°, and it is proportional to the cell size. SS has a scattering range of about 90° and is affected by the shape and complexity of the cell. Herzenberg et al. presented the first fluo-rescence-activating cell sorter (FACS) to sort and identify fetal cells in the maternal system (115, 116). In FACS, the cells flow through a microfluidic droplet system where the size determined by electrical (positive or negative) charge, pre-set on the computer. When fluorescence labeled probes are used, they are excited, and they emit at longer wavelengths that are detected. In paper II, we used flow cytometry as the readout of the cleaved exosomes with rolling circle amplification products that were labeled with a different fluorophore. One of the many advantages of flow cytometry is its multi-parametric function, which makes it possible to look at a subpopulation of cells in a heterogeneous population a vital tool in cancer diagnostics. Flow cytometry is greatly used in research for detection of DNA damage, protein expression cell viability and molecular biology, immunology and pathology. It is a powerful instrument in medicine with FDA approved usage in hema-tology, tumor immunology and many others.
35
4 Historical, current and emerging proteomic technologies
4.1 History; an analytical approach Detection, separation, and characterization of protein have grown signifi-cantly from the days of immunochemistry by SA Arrhenius in 1859 to se-quential technological progressions to the invention of ultracentrifugation by T Svedberg in 1924 and electrophoresis by AW Tiselius in 1937. These men paved the way for more advanced analytical technologies for protein separa-tion and quantification. UK Laemmli was the first in 1970 to describe pro-tein separation in polyacrylamide gels (117) based on the molecular mass using the one-dimension electrophoresis (1-DE). Though a pretty simple, reliable and reproducible method, it had limitations in that the protein to be characterized were first purified and could only resolve protein with a mass of 10 – 300 kDa. O’Farrell developed an enhanced protein separation tech-nique called the 2-dimension electrophoresis (2-DE) where the protein is separated based on the isoelectric point and molecular mass. He could re-solve with high sensitivity about 5000 different proteins from E. coli (118). This work was built on work done by AW Tiselius (electrophoresis), UK Laemmli with the 1-DE (117), isoelectric focusing and gel gradient electro-phoresis by KG Kendrick and J Margolis (119) and the stacking system with SDS described in 1964 by L. Ornstein and BJ Davis (120, 121). With the 2D technique, protein modified in vivo systems from any biological system could be resolved. This lead to the analysis and the separation of proteins in other animals such as work done by J Klose. He mapped proteins in serum in mouse tissue and was the first to point out the relevance of 2-DE in identify-ing mutations (122) and GA Scheele who using the exocrine pancreas from guinea pig separated about 19 distinct with a molecular weight that was larg-er than 10 kDa in 1974 (123). Although the 2-DE is still of importance to-day, there are some shortcomings to the technology. It is labor intensive, hydrophilic or hydrophobic (and larger) proteins with 3>pH<10 cannot enter the gel for the first dimensions, different solubilization (pH gradient condi-tions) of the protein (124), low copy number proteins are not properly repre-sented and also the dynamic range of protein could not be covered (125). With the above limitations peculiar to 2-DE, alternative protein separation and quantifications technologies were developed. Alternative advancement

36
to the existing tools geared towards improving the sensitivity of identifying the proteins that were separated by the gel. Edman sequencing developed in 1949 by P Edman (126) was the earliest protein-sequencing tool to deter-mine the amino acid composition in intact proteins or enzymatic degradation (127). It was a powerful tool, which provided the linked between the sepa-rated and purified proteins with their amino acid sequence compositions of the gene of origin via the N-terminal sequence of the protein. Edman se-quencing through a reliable and an automated protein sequencing technology had low sensitivity in that it could mostly sequence relatively high abun-dance proteins and with the emergency of mass spectrometric methods, it became obsolete.
4.2 Overview on current non-targeted proteomic technologies Mass spectrometry is one of the greatest tools in proteomic specifically in biomarkers discovery and validation. Flashback to 1886, E Goldstein a Ger-man physicist observed that the rays in gas discharged under low pressure travelled in the opposite positive direction (from anode) to the negatively charged cathode ray. In 1898, W Wien, showed that the rays could deflect strong electric and magnetic field and that the mass-to-charge ratio of the particles have opposite polarity. JJ Thomson a British chemist in 1897 demonstrated that the cathode rays where made up of unknown negatively charged particles and he went on to measure the charge-to-mass ratio of the-se molecules and he created the first mass spectrograph. AJ Dempster (1918) and FW Aston (1919) developed the mass spectrometer, which allowed for identification of the mass and isotopic composition of elements in samples and was a great tool to physicist identifying isotopes. Up on to 1980, MS was a great analytical power horse tool to chemist and physicist and in 1984, JB Fenn & colleagues demonstrated the use of electrospray ionization (ESI; the molecules are dissolved and analyzed in solvent) for peptide and protein fragmentation via ionization without the need for excessive fragmentation. That earned Fenn a shared Nobel Prize in Chemistry in 2002 with K. Tanaka. F. Hillenkamp, M. Karas and colleagues in 1985 described matrix-assisted laser adsorption ionization (MALDI; the peptide are mixed & ad-sorbed in a matrix and a short laser is directed towards the surface to ionize both matrix & sample). Other ionization methods include ion trap, soft laser desorption and SELDI. Because MS is not the main focus of this thesis, I will give a brief overview on the technology. Herein, I have decided to cate-gorize MS into non-targeted & targeted. Non-targeted MS is mainly attrac-tive for unbiased identification of protein in discovery-designed studies. Samples for MS are first treated with enzymes to generate short peptides
37
before different fractionation is done followed by MS. Here MALDI or ESI is employed on the samples to generate ionized molecules without destroy-ing them, which are then detected in the mass spectrometer. Non-targeted MS has low throughput, high abundant protein mask the low abundant pro-teins (unless an enrichment or depletion step is incorporated before peptides are produced) and the sensitivity is in the µg/mL to mg/mL range. On the other hand, targeted MS provides a more sensitive and quantitative detection and analysis of protein and is widely used in biomedicine. Here, the targeted molecules are selected prior to MS. The most commonly utilized MS is the selective reaction monitoring (SRM). Here, the masses are first filtered via the triple quadruple mass spectrometer followed by the selection of the spe-cific analytes as ionized fragments or molecular ions. There is also the mul-tiple reaction monitoring (MRM), Stable Isotope Standard and Capture by Anti-Peptide Antibodies (SISCAPA) where specific peptides are enriched and capture with antibodies before MS. Over the years, MS achieves high specificity and has demonstrated high multiplexing power, with this poten-tial, reproducibility (arise from the numerous steps involved from fractiona-tion to identification of proteins) is still a problem.
4.3 Overview of targeted proteomics technologies In this section of the thesis, I will look at the existing targeted affinity based technologies with this thought in mind, how are proteins identified and re-ported? Also, I will take you briefly down the memory lane of immunoassay development history, assay formats, assay types, limitations and challenges, commercially available immunoassays and I will focus more on the proximi-ty DNA assisted assays. Figure 4.3.1 illustrates the timeline of affinity-based immunoassays and some properties.

38
Figure 4.3.1: Affinity-based immunoassays formats development timeline and some properties The table below demonstrates (a) effects of cross reactivity (b) capability of looking at multiple targets (c) background signal effect from non-specific adsorption to rea-gents and surfaces and (d) Increased specificity and sensitivity from additional proofreading.
In 1959, Yalow and Berson described the detection of insulin using a com-petitive radioactive radioisotope antigen in plasma, which they called the radioimmunoassay (RIA) (79). In 1967, Wilde and colleagues described the detection of IgE using a radioimmunoassay method they called radioaller-gosorbent test (128). Miles and Hales in 1968 modified the technique by using a radioactive isotope-labeled antibody to measure insulin in plasma. In 1971, Engvall and Perlmann demonstrated that using alkaline phosphatase as a reporter molecule, they could detect IgG in serum and the enzyme-linked immunosorbent assay (ELISA) was born (129). This assay was performed using a single antibody against the target. In 1981, Uotila et al. described the first sandwich ELISA for alpha-fetoprotein with a capture monoclonal anti-body immobilized and detection antibody coupled to an enzyme (130). Rog-er Ekins in 1989 proposed the ambient analytes immunoassay which only meant that the immobilized molecule on micro spots would exhibit higher signal intensities by area thereby reducing the signal to noise ratio (131). George Feinberg and colleagues did early work on microspots-based immu-noassays in the 60s for the diagnosis of autoimmune diseases and proposed its importance to diagnostics. In the years after the sequencing of the human genome, DNA microarray technology was developed and used extensively and profoundly in genomic research. DNA microarray is now an established and reliable method for analyzing gene expression profiling (132), and FDA approved for clinical testing (AmpliChip CYP450 microarray by Roche). Protein analysis using this assay format is still lagging behind even though cellular information of the protein is more important for phenotypic charac-terization. Moreover, the rise in the use of planar or microarray format for protein only came post genome-wide study. This type of assay format is out
39
of the scope of this thesis, but I will mention some characteristics and appli-cations of the system. The early use of microarray for protein demonstrated in the early 2000s by Macbeath and Schreiber (133) where they showed pro-tein-protein interaction, identified small molecules target for protein and substrate for protein kinases. This paved the ways for more protein microar-ray by Haab and colleagues (134) where they used the robot to spot their antibodies on microarrays and quantified over 100 proteins in a complex matrix. Over the years many research groups have used the microarray for-mat to characterize hundreds of proteins using different surfaces. In protein microarray, surfaces for coupling chemistries include adsorption, covalent and affinity binding. In comparing the success of DNA microarray to protein microarray, there is still a long way to go for proteins. The main problem associated with the stability of the protein (their hydrophobic and hydro-philic nature), the functionality of the proteins after immobilization (which depends on their tertiary and quaternary structures) and the interactions in different media (ionic, electrostatic interactions, Van da Waals, and hydro-gen bond). Antibodies and or proteins are spotted on arrays (usually glass slides), using different chemistries with the sole aim to have maximum bind-ing irrespective of how they bind (specific or non-specific),and a blocking step is always carried out. Storage of the arrays is a huge issue as maintain-ing antibody functionality is of importance. Antibody microarray has been applied in autoimmunity, allergy, some cancers, proteins expressions and signaling (135). Commercially available proteomic microarrays included ProtoArray®
Human Protein Microarray (https://www.thermofisher.com), IMMrayTM (http://immunovia.com) and Proteome ProfilerTM Antibody Arrays (https://www.rndsystems.com) just to name a few. Another immunoassay format is the bead-based immunoassays also know as suspension assays. In this assay format, affinity reagents immobilized on microparticles that are later used to capture targets allowing for washes. Just like microarrays, the microspheres can be polystyrene (non-magnetic) and paramagnetic which are pre-functionalized with different chemistries and reactive groups. The most commonly used today are streptavidin, carboxylic and epoxy surfaces. The sizes of these microspheres also vary from 1 µm to 6.5 µm in diameter. For the rest this section, the terms microspheres and paramagnetic particles will be use interchangeably. In Paper IV in this thesis, we use streptavidin functionalize paramagnetic particles to develop the assay for protein detec-tion and quantification method. The use of microspheres based immunoassay goes back to 1977 when Horan and Wheeless demonstrated its use in single cell sorting and analysis by flow cytometry (136). Subsequent work with this support system was done primarily for readout by flow cytometry. McHugh and colleagues later demonstrated the used of three sizes of polystyrene mi-crosphere to set up an immunoassay where they immobilized antigen on the microspheres and used antibody labeled fluorophore to detect and quantify

40
proteins from Candida albicans using flow cytometry (137). The method and application described in Paper II take advantage of paramagnetic parti-cles as a solid support to perform the assay and detection products with readout using flow cytometry. Alternative strategies to produce microspheres was implemented when different fluorophore was introduced into the core of the microspheres, which then allowed for multiple analytes detection via varying spectral ranges allowing distinction of 64 different particles (138). The company Luminex has now developed 100- to 500-plex immunoassays (xMAP® and FLEXMAP 3D®) using this technology. Other companies like Singulex and Quanterix have developed ultra-sensitive protein detection and quantification technologies using bead-based immunoassay systems. Com-parison and evaluation of the performance of bead-based immunoassays and the traditional sandwich immunoassays (ELISAs) have been carried; with several groups consistently reporting increased assay sensitivities (139, 140). Planar microarray-based formats have some limitations such as requiring spotting instrumentation, images analysis, software, scanners, data collection and experienced users, different from those for bead-based assays. Also, to the solid support (microarray or beads) assays, solution phase (homogenous) immunoassays are also in play. Here there is no need for washes of unbound reagents and everything happens in an aqueous mixture, hence making it preferable over solid support based assays that require either slides or beads. In addition, there is no need to immobilize affinity reagents, which maintains high functionality of the Fab regions, which sometimes can alter during treatment with small molecules for immobilization. With all these ad-vantages, solution phase immunoassays still have limitations. Since there are no washes involved, there is an increase in the background noise, which reduces the assay sensitivity. Several solution phase immunoassays devel-oped for protein detection and quantification in different diseases (141-143). In Paper IV, we have developed a solid phase version of a solution phase assay, using paramagnetic particles to increase the performance of the assay by introducing washing steps and increasing the analytes assay volume, while also increase the numbers of antibodies needed for detection from two to three.
Perlmann and Engvall used alkaline phosphatase instead of radioactive labels for protein detection and created a new era in the diagnostics field. The safety concerns in the utilization of the radioactive substance was no longer an issue, and the analytical performance of ELISA was equivalent to that of RIA. ELISA is the most widely used protein detection tool in clinics, hospitals, industry and academic research for diagnostics and follow-up and is considered the gold standard. Over the years, various readout format of ELISA has been developed, in addition to the fluorescence optical density, chemiluminescence and electrochemiluminescent a commonly used. There are reverse-phase, forward-phase, direct, and indirect immunoassays (IA) (Figure 4.3.2). Reverse-phase IA, the antigen is first absorbed in a non-

41
specific manner in the plate, and the detection antibody (primary antibody coupled to a reporter molecule) is used directly on the antigen, unbound detection antibody is washed off, and the enzyme substrate is added to detect the antibody enzymes interaction. Forward-phase includes immobilization of affinity reagent, and which then captures the target antigen. Direct IA involves a capture affinity reagent on solid support. This then captures the target antigen and is detected by a primary antibody coupled to an enzyme or fluorophore, which reports the targets. In indirect IA, a capture antibody is first immobilized on the surface to capture the antigen; an unlabeled primary antibody then incubated with the captured antigen. A secondary antibody coupled to a reporter recognizes the primary antibody. Since multiple sec-ondary antibodies can recognize a single primary antibody, there is signal amplification thereby increasing the sensitivity of detection. Most commer-cial ELISAs, utilize the indirect assay system where the primary antibody that recognizes the target coupled to biotin followed by streptavidin-linked to the reporter molecule. Here, binding by multiple reporters result in signal amplification and increased detection sensitivity. However, background is-sues still arise as detection reagents can bind non-specifically to the solid support. Commercial ELISA has sensitivity in the pg/mL (or pM) levels for analytes like IL-6 with dynamic ranges of about three orders of magnitudes, and coefficient of variations below 5%. The need to analyze molecules that are present at low concentrations is ever present, as a tool to monitor diseas-es and for early diagnosis. This has led to the development of ultrasensitive immunoassays. In 1979 Harris et al. reported the first ultrasensitive immuno-assay for detection of cholera toxin and rotavirus using RIA (116) and Shalev et al. in 1980 reported a high-sensitive ELISA (HS-ELISA) for IgG detection in mouse (144): both in zeptomolar concentrations. In 2010, Rissin et al. demonstrated sub-femtomolar detection ranges in a single molecule detection ELISA format and used this technology they detected PSA in pa-tients who had undergone prostatectomy. This enabled monitoring of these patients with prostate cancer for reoccurrence (145, 146). Here, magnetic particles are used to capture target protein, and individual beads confined in femtoliter wells, which allows for digital counting of signals from even sin-gle labeled antibodies in the individual wells. The company Quanterix Cor-poration has commercialized this SiMoA technology. Another category of emerging single molecule detection methods is the Erenna immunoassay systems by the company Singulex. Here, magnetic microparticles are also used to capture target protein, followed by detection by fluorescence-labeled antibodies. The labeled antibodies are then chemically eluted from the mag-netic microparticles, and single fluorescent molecules are counted using a capillary flow system. The assay has been applied to detect troponin, a bi-omarker for acute myocardial infarction (147). In contrast to over the coun-ter ELISAs where the readout is an analogy measurement of total bulk fluo-rescence, these single-molecule protein detection assays offer a unique ad-
42
vantage in that individually labeled antibodies are detected, and the precision is increased significantly if sufficient numbers of molecules are counted. Also, the background signal is minimized as even single labeled antibodies are clearly detected above signals from plates or assay medium as in the case of the SiMoA and Erenna systems. Even though these emerging technologies offer significant analytical sensitivities, there are limitations as with any sandwich IA. They have limited multiplexing abilities as cross-reactivity of detection molecules increases as the number of molecules to be detected increases (148). It is worth mentioning that although these IA are reported as single molecule assays, to achieve detection above background hundreds of protein molecules are needed in the sample. Also, since this IA utilize the same molecular architecture as regular sandwich ELISA, limitations in spec-ificity becomes an issue as non-specific adsorption of detection reagents give rise to signals, and false positive signals may also arise from antibody pairs detecting irrelevant proteins non-specifically (4.3.1).

43
Figure 4.3.2: Schematic overview of affinity-based immunoassay format (a) Represents immunoassays fluorophore conjugated to antibodies and (b) DNA- assisted immunoassays
So far, all the technologies I have explained above utilize fluorophore or enzymes directly coupled to antibodies (or other affinity reagents), which serve as detection moieties. In the next part, I will talk about DNA-based (aptamers and SOMAmers), and DNA-assisted immunoassay (Immuno pol-ymerase chain reaction (iPCR), Immuno rolling circle amplification (iRCA), proximity ligation assay (PLA) and proximity extension assay (PEA). All the papers I, II, III, IV in this thesis irrespective of the assay format and other features mentioned above are based on the proximity DNA-assisted technol-ogy. Also, all immunoassay systems described above and subsequent discus-sions are targeted rather than fishing expeditions.
Aptamers and SOMAmers based immunoassays belong to the DNA-based immunoassays class of affinity reagents. Aptamers are versatile short single-stranded DNA (or RNA) oligonucleotide affinity molecules that bind to spe-
SandwichIA
IndirectIA
(A) Traditional Immunoassay (IA)
(B) DNA-assisted Immunoassay
iRCA iPCR PLA PEA PLARCA
ReverseIA
ForwardIA

44
cific target molecules sometimes termed chemical antibodies. They are pro-duced via in vitro selection from large random libraries using their ability to discriminate false targets via the systemic evolution of ligands by exponen-tial enrichment (SELEX) system (97). SOMAmers are Slow Off-rate Modi-fied Aptamers that are DNA aptamers with modified bases that upon binding to specific target proteins fold into a complex 3D structure (149). The speci-ficity is ensured by the in vitro selection using large DNA libraries and SELEX to isolate reagents with slow dissociation rate. SOMAmers is the core behind the SOMAscan proteomic platform of the company SomaLogic whose aim is to set up highly multiplex protein detection and analysis assays for personalized, preventive diagnosis and treatment. This technology com-bines the SOMAmers molecular recognition elements and DNA microarray to read out target proteins in biological samples. SOMAscan has been used in clinical studies for diagnostic biomarker discovery in non-small lung can-cer (150) among others. They possess many appealing qualities such as the size of the reagents, which is between 6-30 kDa compared to 150 kDa for antibodies; this makes them an attractive reagent for tissue penetration, they can have high affinity, and multivalent aptamers can have even higher affini-ty due to the selection process.
4.3.1 DNA assisted immunoassays In 1992, Sano and colleagues developed and introduced the first DNA-assisted immunoassays using PCR as the readout, which they called im-munoPCR (151) (Figure 4.3.2). Quantification of the resulting DNA am-plicon was analyzed with traditional gel electrophoresis, which made it quite laborious and not so precise. The invention of the real-time PCR advanced the growth of the DNA-assisted immunoassays in the late 1990s. Other vari-ants of this form of immunoassay were developed such as the immuno-rolling circle amplifications (152) (Figure 4.3.2). Another class of DNA immunoassay is called the bio-barcode assay developed in the Mirkin’s group. Here, target proteins are captured by magnetic nanoparticles and de-tected by antibodies that are co-immobilized with barcode DNA on gold nanoparticles. The DNA molecules are then released upon antibody binding and captured on DNA microarrays. The detection was done via a reduction reaction of silver ions, catalyzed by the gold particles to silver, resulting in light scattering of the developed silver spots (153).
These particular categories of immunoassays take advantages of the prop-erties of DNA including their specificity, DNA hybridization, opportunities to amplify DNA, the flexibility of ligations, and other enzymatic capabilities and the ability to store an enormous amount of information to enable barcod-ing.
I will use a few sentence to explain the different advantages that DNA confers to immunoassays. DNA hybridization based on the Watson and

45
Crick base-pairing specific nucleic acid complementarity (G=C and A=T/U). All DNA microarray technology utilizes hybridization to capture, detect and report molecules. In 1988, Landegren and colleagues developed an assay to discriminate single nucleotide substitution by oligonucleotide ligation assay (OLA) using the substrate fidelity of T4 DNA ligase (154). Ligation is an enzymatic process whereby a phosphodiester bond formed between the 3’-OH and the 5’-PO4 in the DNA strands. Lehman first used the reaction in the lab in 1973. DNA repair utilizes ligase and it has been used extensively in molecular biology for cloning. In 1994, Nilsson and colleagues described a process where DNA was detected by circularization of oligonucleotide probes called Padlock probes (155). These are single-stranded DNA mole-cules that comprise two target-complementary end sequences and a non-hybridizing backbone, which includes sequences required for detection. The target complementary arms recognize its target, and with a ligase enzyme, the two arms are joined to form a circle, which can then be amplified using rolling circle amplification (RCA). Rolling circle amplification is an iso-thermal linear DNA amplification process first described as rolling circle replication by Fire and Xu (156) where they demonstrated that “rolling circle synthesis in a simple enzymatic system that can produce tandem repeats of monomers as short as 34 nucleotides”. RCA has been used extensively in in situ experiments for detection of protein localization, interactions, and post-translational modification (157, 158). Banér et al. demonstrated that using Phi29 DNA polymerase, 100 nucleotides of circular DNA can produce strands containing up to 900 copies of complements of the circles in 60 min of rolling time by approximating the polymerization rate at 1500 nucleotide incorporations per minute (159). The combination of target-dependent liga-tion of padlocks and amplification by RCA makes them a powerfully specif-ic and sensitive tools for molecular diagnostics (160). Also, the ability to design specific target-complementary region and utilize the non-hybridization backbone (for tagging, barcoding, and detection), makes pad-lock probes a powerful tool to investigate multiple analytes at the same time. Papers I, II and III makes used of this power tools in showcasing their enhanced abilities as a molecular diagnostic tool for protein detection in vitro and in vivo. Up to this point, all technologies I have discussed utilize the same molecular architecture as the traditional ELISA, which is that of dual recognition of target protein molecules. As mentioned above, even with their great analytical sensitivities among other great features, they share sim-ilar setbacks such as increased non-specific signals from assay medium, increased non-specific absorption of detection reagents and increased the cross-reactivity of detection reagents against target proteins (Figure 4.3.1).

46
4.3.2 Proximity-based DNA assisted immunoassay Proximity-based DNA-assisted immunoassays include PLA and PEA, they have a different molecular architecture compared to the other IA categories (Figure 4.3.2). Fredriksson et al. first reported this assay format in 2002 when they used aptamer as PLA reagents to detect and quantify platelet growth factor (PDGF) in solutions and could detect zeptomolar concentra-tions (141). In this assay setup, affinity reagents (that can be pairs of mono-clonal or single polyclonal antibody preparations) functionalized with DNA oligonucleotides that together can bind to different sites on target proteins. The juxtaposition of DNA-coupled affinity reagents binding the same target allows for the DNA strands to be brought close together which allows tem-plated ligation of the single stranded DNA on the antibodies, or an extension by polymerization in the case of proximity extension assays (PEA) (161). These assays have been performed in homogenous and solid support formats in case of PLA (162). The ligation and or extension gives rise to templates that can be amplified by PCR or in the case of in situ assays via RCA (157). To address the issue of background signal from non-specific binding of de-tection reagents and the non-specific signal from assay medium which oc-curs in the traditional ELISA, signal generation in proximity-based IA only arise from amplifiable products of pairs of affinity reagents agreeing on the presence of a target protein. In addition, the prerequisite of requiring two affinity reagents to agree on a target in addition to ligation to form the ampli-fiable template improves the assay specificity and reduces cross-reactivity. To further enhance the specificity of PLA, the solid phase variant of the as-say was developed using magnetic microparticles to act as a solid support with immobilize antibodies that then capture target proteins (163). The solid support format then allows for washing of unbound detection reagents, thereby reducing background signals. Even though the efficiency of each step in this assay is not 100%, however, triple recognition allows for more proofreading, which serves by increasing assay specificity. Advantages of this assay system, as with iPCR and iRCA is the flexibility of designing oligonucleotides for multiple target detection, the introduction of barcodes to identify different sample types and the versatility of enzymatic reaction to enable amplification. PLA has been adapted for various applications from protein visualization in situ (157, 164), protein-protein interaction (158, 165, 166), protein-DNA interactions (167), posttranslational modifications meas-urement of biomarkers in single (168, 169), multiple protein detection (170-172), detect infectious reagents (173) and applied to Western blot (174)
A more stringent PLA design requiring more than three antibodies have also been developed and demonstrated with triple binding (175) and quadru-ple antibodies (63) to generate DNA templates that can be amplified. PLA is a power technology, which allows for even the smallest amount of targets to be detected by the amplification via PCR and RCA. In Paper I, we set out to

47
incorporate the PLA with RCA readout on microtiter plates with optical density readout. A variant, which can be easily, adapted to already existing fluorescence readout instruments in clinics and hospitals.
As mentioned earlier, PEA is another variant of the proximity-based as-says and has been commercialized by the company Olink Proteomics. Here, they only require 1 µL or 5 µL of sample (plasma or serum) for analyzing sets of 92 proteins without any washes and with moderate background (171, 176). In Paper IV, we have developed a solid phase variant of the assay where use increased amounts of reagents and washes serve to improve assay sensitivity further. An additional capture antibody on beads will also in-crease assay-proofreading functions to enhance specificity. Furthermore, the adaptation and application of PLA for in situ protein detection on fixed cells and tissue section is a powerful tool, which allows for PTM studies, intercel-lular interactions, and localization. The Duolink assay is using PLA technol-ogy and represents a commercial product of this technology for in situ pro-tein detection, being licensed and sold by Sigma-Aldrich. A detection effi-ciency of 100% of all target molecules in a sample is the ultimate goal. In in situ PLA, some factors that prevent us from achieving this ultimate aim. These include the limited efficiencies of the different enzymatic steps, oligo-nucleotide design systems, and the dissociation constant of the affinity rea-gents. In Paper III, we set out to develop a new system with better oligonu-cleotide design and enzymatic conditions. We call the new assay system UnFolding probes, which increase the assay efficiency of the traditional in situ PLA design.
4.4 Proximity based IA: Still lagging After all said, proximity based immunoassays also comes with limitations. In the final part of this segment, I will address some of the concerns of proximi-ty based IAs. In complex or dense biological milieus, the proximity-based detection system can give rise to false positive signals. This is particularly true when performing in situ experiments on tissues and cell lines. Limiting the minimum distance needed to give rise to signals can reduce this effect, and so will the concentration of the detection reagents. However, this is usu-ally difficult when doing in situ experiments. In homogenous assay system where no washes are involved, signals can be generated by false proximity between affinity reagents irrespective of the presences of the target antigen. Here, the concentration of detection reagents, incubations times and kinetics are critical parameters to reducing false signals. In PLA experiments based on solid support, we still experience some background noise in the absence of protein. This is mainly due to sticking of PLA probes to the beads surface and or to the antibody immobilized on the solid support. Improved blocking reagents may be the remedy for the nonspecific binding of detection reagents

48
to beads, but one may need to try alternative binders to counter the effect of binding of detection probes to the immobilized antibodies. About 15 years after the first publication of the proximity ligation assay, can we now say that PLA is a mature technology that can compete with conven-tional or emerging technologies? Looking at the different areas of applica-tions of PLA, one can safely say that we are almost there. Commercially available assays like PEA from Olink and Duolink from Sigma put this tech-nology at the forefront of current tools in proteomics. With this said, my answer to the above question is NO. As mentioned above the advantages of PLA, which included enhanced specificity, sensitivity, broader dynamic range and the ease multiplexing. However, when it comes to application in routine clinical applications, precision is another important parameter. Currently, the coefficient of variation (CV) of PLA assay is between 15 – 40%, this is far from that of approved clinical immunoassays. A significant proportion of the CV arises from the PCR which depending on the number of molecule to be detected range from 5% to 20%. Improving the precision of PLA will not only make it more suitable for clinical use, but it will signif-icantly increase the number of detectable molecules. Previous work to ad-dress this issue has used sequencing as readout. Although sequencing is a well-established technology, the enormous amount of data coupled with additional assay steps may make this less practical for routine use. In paper I, the use of RCA instead of PCR is a step towards achieving this goal, as the precision of this isothermal form of amplification is approximately 5%. Likewise, the use of already existing and approved instrumentation makes this approach more feasible with further optimization to meet with the dif-ferent regulations.
Another limiting factor that comes to mind is the issue of specificity and sensitivity. The question regarding sensitivity is, are the assays detecting and reporting all the correct target molecules present in the sample? How much of the detection signal comes from true targets? What are the limiting steps in the assay? These questions though easy to formulate theoretically, are not so easy to answer practically. For example, the disparity between the ob-served vs. expected results can be summed up as assay inefficiency. This affects the sensitivity (often denoted as limits of detections and or lower limits of quantification) of the assay. The specificity, another key element of PLA, manifests itself at two levels, the multiple recognitions of affinity rea-gents on their target and the ligation of the pair of reagents. Can this multiple target recognition pose a problem for the assay? The simple answer is yes! When using single polyclonal antibody preparations that have been divided to make pairs of detection probes carrying the two DNA arms, there is a 50% chance that antibodies carrying the same DNA sequence can be bind to the same target hence decreasing efficiency. Also, by requiring two binding events to generate a signal, the likelihood of identifying a particular target

49
drops. Using monoclonal antibodies or “monospecific” affinity binders can amend this problem.


51
Part II

52
5 Present Investigations
Looking back at the title of this thesis, the projects discussed here are about the development of enhanced molecular diagnostic tools for protein detec-tion and analysis. The overall objective was to develop tools that could po-tentially be used in routine clinical settings to detect and quantify low abun-dant protein. To introduce the work reported in this thesis, Figure 5.1 will present how present investigation fits in the proteomic puzzle.
Figure 5.1: Synopsis of the papers presented in the thesis The projects presented in thesis can be applied into different categories of the prote-ome. (a) Papers I (PLARCA) & IV (SP-PEA) can be applied into proteome mining for detection and analysis, (b) while paper II (ExoPLA) into structural proteomics for organelle identification and characterizations and finally (c) paper III can be applied into detecting and quantifying protein expressions, PTMs and studying pro-tein-protein interactions
Proteomics
Paper IV(SP-PEA)
Paper (PLARCA
Paper II Paper III(Unfold
ProteomeMining
Post-translationalmodifications
Protein-proteinInteractions
ProteinExpression
StructuralProteomics

53
5.1 Sensitive protein detection in microtiter plates by proximity ligation with rolling circle amplification (PLARCA) - Paper I 5.1.1 Introduction Proteins are crucial to all cellular processes from cell structure formation, to transport of molecules in and out of cells, to biochemical processes and to determine disease state and they are for diagnostic purposes. Antibody are versatile and powerful tools for the analysis of various molecular and cellu-lar process as well as clinical and biomedical diagnostics (177). Antibody-based detection methods have greatly advanced with the introduction of the radio immunoassay and ELISA (79, 129) respectively. Since that era, several formats of immunoassays and read out techniques have emerged for protein detection. Several versions of immunoassays have been developed have been discussed in section 4.3 of this thesis.
DNA-assisted protein detection assays have been discussed in 4.3.1. Proximity ligation assay (141) detects protein with dual detection reagent recognitions (thereby increasing the specificity) and enhanced sensitivity. There is a need to adapt such a powerful technology in current protein detec-tion methods used in clinics and hospital laboratories. We used the microtiter plate to immobilize monoclonal and or polyclonal antibodies, and incubate overnight at 4°C on a shaker. Unbound antibody was washed off and a blocking buffer added and incubated at room temperature. The plate was washed and the target antigen was diluted in appropriate buffer was added and incubated at room temperature. Unbound antigen was washed, and the PLA probes were added and incubated at RT, upon target recognition, this pair of PLA probes guides oligonucleotide ligation, followed by amplifica-tion via RCA. The RCA products were then detected by HRP-labeled oligo-nucleotides, followed by TMB substrate to generate colorimetric products, that is readout with an absorbance microplate reader (Figure 5.1.1).

54
Figure 5.1.1: Schematic description of PLARCA. (I) Antibodies are immobilized via hydrophobic interaction in wells of microtiter plates, followed by washes and blocking of nonspecific binding. Bound antibodies are used to capture target proteins from added samples, followed by washes to re-move unbound sample components. (II) Next, a pair of PLA probes (antibody-DNA conjugates) is added that can recognize captured target molecules, followed by washes. (III) DNA oligonucleotides are then added along with a ligase allowing the oligonucleotides to be ligated into DNA circles, templated by oligonucleotides on one of the PLA probes. (IV) A DNA polymerase is added to initiate replication of the DNA circles via RCA, primed from that antibody-conjugated oligonucleotide which did not template ligation. (V) Finally, the RCA products are detected by add-ing HRP-labeled oligonucleotides to the RCA product, followed after washes by addition of the TMB substrate
5.1.2 Aim of study The objective of this project was to develop a variant of PLA that are adapted easily to hospital laboratories and clinics that use the regular ELISA for diagnostic and prognosis
5.1.3 Summary of finding The performance of PLARCA showed no significant difference when IL-2, IL-8, IL-6, and VEGF spiked in serum compared to buffer (Figure 5.1.2).
I II III IV V

55
Figure 5.1.2: Comparison of results from assays for IL-2 and IL-8 in buffer (blue) or 10% (red), or 50% (green) chicken serum. Y-axes show optical density (OD) measured at 450 nm while the X-axes show protein concentrations in molarity (top) and weight per volume (bottom). Averages of measurements done in triplicate are shown with standard deviations indicated with error bars.
Comparison of PLARCA with traditional ELISA revealed that PLARCA detected low femtomolar concentrations in IL-4, IL-6, and GDF-15 in serum with increased dynamic range (Figure 5.1.3). Analysis and detection of IL-4 and IL-6 in colorectal cancer tissue lysates and plasma from prostate cancer patients demonstrate PLARCA detecting IL-4 and IL-6, considerably below the detection limits of traditional ELISA (Figure 5.1.4).
Figure 5.1.3: Performance of PLARCA vs. ELISA Comparison of PLARCA (squares) and ELISA (diamonds) for measuring levels of IL-4 and GDF-15.Averages of measurements done in triplicate are shown with standard deviations indicated with error bars.

56
.
Figure 5.1.4: Measurement of cytokine concentrations in colorectal and prostate cancer. Measurement of IL-4 and of IL-6 with PLARCA and ELI-SA in plasma samples from 25 prostate cancer patients and 24 healthy con-trols. PLARCA and ELISA limits of detection were calculated from the standards in Table 2 for IL-4 and IL-6 (see paper I). The age ranges for these patients and controls are illustrated in Supplemental Table 2 (see paper I). Each dot represents the mean of a triplicate. p values were calculated using a two-sample Wilcoxon rank sum test.
5.2 Detecting individual extracellular vesicles using a multicolor in situ proximity ligation assay with flow cytometric readout - Paper II 5.2.1 Introduction Currently, discovery and characterization of extracellular vesicles (EVs) in a biological sample is of great importance (178). Exosomes and microvesicles are the two classes that can be distinguished based on their biogenesis. Exo-somes are about 40 to 200 nm in diameters and have important roles in many biological processes and have been shown to be promising biomarkers for some diseases (179). Currently, the main methods used for exosome detec-tion and characterization is by flow cytometry (180). However, their size makes it difficult to distinguish single EVs from the background of the mi-crofluidics of the traditional flow cytometry instruments. We identified five target proteins on the surface of EVs and using three fluorescent dyes, and we successfully distinguished specific EVs.
LOD
LOD
Patients Controls
PLARCA
[IL-6
] (pg
/mL)
Patients Controls
p < 0.001
p = 0.521
1000
100
10
1
0.1
0.01
ELISA
LOD
LOD
Patients Controls Patients Controls
ELISAPLARCA
[IL-4
] (pg
/mL)
p < 0.0001
p = 0.348
1000
100
10
1
0.1
0.01

57
Here, beads were functionalized with oligonucleotides containing uracil bases, monoclonal and or polyclonal antibodies conjugated to a complemen-tary uracil-containing oligonucleotide that hybridizes to the oligonucleotides coupled to the beads. This hybrid system allows for enzymatic cleavage with UNG/EndoIV. Antibody captures exosmes via specific surface proteins, and unbound exosomes are washed off. Four PLA probes are used to detect three different surface proteins. We designed the same common probes that recog-nize dipeptidyl peptidase 4 (CD26) which is present in most EVs and paired with antibodies directed against Neprilysin (CD10), Aminopeptidase N (CD13), and Cathepsin B. Unbound probes are removed by washing and a ligation mixture is added into the reaction. After ligation, enzymatic diges-tion of the uracil containing hybrid system is done to release the detectable moieties into solution. Rolling circle amplification is then performed in solu-tion-phase, followed by detection with three different fluorophores coupled to oligonucleotides used for detection (Figure 5.2.1). Finally, flow cytometry is used for quantification and analysis
Figure 5.2.1: Illustrations and assay format of ExoPLA
u u u u u u
u u u u u u
u u u u u u
u u u u u u
u u
u u
u
u
u
u u u u u u
u u u u u uu u u u u u
u u u u u u

58
5.2.2 Aim of study Develop a multicolor in situ PLA method for extracellular vesicles detection and quantification with flow cytometry readout
5.2.3 Summary of finding By analyzing exosomes in human plasma, we developed and adopted a new method called ExoPLA that can detect and characterize individual exosomes using the multi-color detection using flow cytometry.
Using purified prostasomes as a model, we could use specific surface pro-tein markers to detect them and confirm the data with fluorescence micros-copy analysis (Figure 5.2.2).
The performance of the ExoPLA was compared to the conventional bead-base assay. ExoPLA method could detect as little as 200 pg/mL of pros-tasomes compared to 20 !g/mL using the commercial bead-based method.
By isolating extracellular vesicles from myeloid cell line U937, breast cancer cell line MCF7 and prostasomes from seminal fluid, ExoPLA could also distinguish the different EV populations
Figure 5.2.2: Detection of Evs from cell lines. Detection of Evs from isolated from U937 cells in a mix with prostasomes ratio 1:1, and 3:1, and a mix between EVs from U937 cells and MCF7 cells ratio 1:1, and 3:1, using the multicolor ExoPLA assay with the selective PLA probe against CD114, only present on EVs from U937 cells. The ratios are based on the total protein con-centration of the EVs. The top rows are all events and the bottom rows are gated plots.
Moreover finally, in a complex biological matrix, 10 !g/mL or 200 !g/mL of prostasomes was spiked in 10% human plasma from a healthy female. With control experiments, ExoPLA was able to distinguish these populations

59
5.3 Enhanced in situ proximity ligation assays via Unfolding PLA probes - Paper III 5.3.1 Introduction Proteins are key regulatory biomolecules that control most cellular processes through signaling networks involving posttranslational modifications and interactions. These cellular processes define disease states hence developing tools efficient for identifying this processing therefore, is vital towards un-derstanding diseases. In situ PLA (157) is a sensitive and specific tool for detection of these cellular processes in cells. This method enables us to visu-alize protein interactions, modification, and co-localization in situ (181, 182). However, there is an efficiency limitation to the current approach. We developed a new version of the reagents that we call UnFolding probes. In this version of the assay, the efficiency and convenience of detection are improved by designing the assays such that the necessary antibody-oligonucleotide conjugates carry with them all elements required for detec-tion via rolling circle amplification. Only after proximal binding of pairs of probes and washes is an enzyme cocktail added that allows the probes to interact to form circular templates for amplification (Figure 5.3.1).
Figure 5.3.1: Schematic representation of Unfold
I
I: Immobilize antibody on solid support and capture protein II: Incubate with Unfold probesIII: UNG/EndoIV treatment of Unfold probesIV: LigationV: RCA and detection
II III IV V

60
5.3.2 Aim of study The aim was to improve the efficiency of the in situ proximity ligation assay by decreasing the rolling circle amplification of non-targeted circular DNA templates.
5.3.3 Summary of finding Unfold probes show improved signal to noise ration over in situ PLA. Sec-ondly, we improved the assay efficiency for Unfold probes compared to the in situ. In phosphorylation experiments, we compared Unfold and in situ in BJ-hTert cells that were stimulated with platelets-derived growth factor-BB. Unfold detected higher number of phosphorylation compared to in situ (Fig-ure 5.3.2).
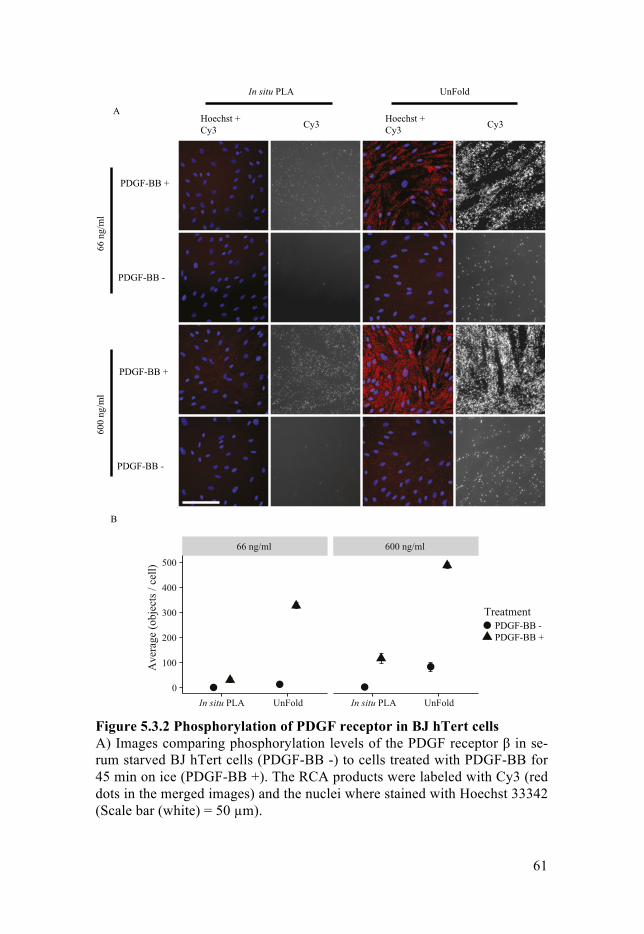
61
Figure 5.3.2 Phosphorylation of PDGF receptor in BJ hTert cells A) Images comparing phosphorylation levels of the PDGF receptor β in se-rum starved BJ hTert cells (PDGF-BB -) to cells treated with PDGF-BB for 45 min on ice (PDGF-BB +). The RCA products were labeled with Cy3 (red dots in the merged images) and the nuclei where stained with Hoechst 33342 (Scale bar (white) = 50 µm).
In situ PLA
PDGF-BB +
PDGF-BB -
PDGF-BB +
PDGF-BB -
UnFold
Cy3Hoechst +Cy3
Hoechst +Cy3Cy3
66 n
g/m
l60
0 ng
/ml
B
A
66 ng/ml 600 ng/ml
0
100
200
300
400
500
In situ PLA UnFold In situ PLA UnFold
Ave
rage
(obj
ects
/ cel
l)
TreatmentPDGF-BB -PDGF-BB +

62
B) Quantification of signal comparing in situ PLA and UnFold at different probe concentrations. (n=3, Error bar represents SEM). We also made comparison of Unfold and in situ PLA on microtiter with absorbance readout, Unfold showed increased signal intensity that thereby increased the lower limits of detection about 10-fold (Figure 5.3.3)
Figure 5.3.3: Performance comparison of S3, ELISA and Unfold for detection of IL-6 Comparison of ELISA (blue), S3 (red) and Unfold buffer (green) in 10% chicken serum. y-axis show optical density (OD) measured at 450 nm and the x-axis show protein concentrations in weight per volume. Averages of measurements done in triplicates are shown with standard deviations indicated with error bars.
0.001
0.01
0.1
1
10
0.0 0.001 0.01 0.1 1 10 100 1000
OD
(450
nm
)
[IL-6] (pM)
Unfold
ELISA LOD S3
LOD
Unfold LOD

63
5.4 Protein detection by sensitive magnetic bead-based proximity extension assays - Paper IV 5.4.1 Introduction Detection of protein in the blood can serve as an indicator of a biological process in humans. Early detection of certain proteins in blood is vital for early disease diagnosis and prevention. Proximity extension assay (142) is a homogenous sensitive and specific protein detection and analysis method. The current assay format utilizes a microliter sample volume, and no wash-ing of unbound detection reagents is required. The fact that unbound detec-tion reagents are not removed by washes increase the background noise, and hence decreases the detection threshold of the assay. The assay is set up such that antibodies of interest are immobilized on magnetic particles and incu-bated at room temperature. The immobilized antibody then captures the tar-get protein and unbound antigen is washed off. Next, detection reagents are added and incubated after unbound reagents have been washed off. The ex-tension and qPCR mix is then prepared and added to the reaction (Figure 5.4.1).
Figure 5.4.1: Schematic description of spPEA. A. Schematic representation of magnetic bead-based PEA assay (I) Antibodies are functionalized on magnetic particles, incubated and unbound antibodies are washed (II) Functionalized antibody is then used to capture antigen from sample, incubated and free antigens are washed off (II) Pairs of PEA probes are then added to the reac-tion, incubated and free (and or loosely bound) probes are washed off. (IV) Enzymes required for extension and polymerization are then added to the mix, incubated, followed by PCR amplification
5.4.2 Aim of study In this study, we developrd a solid phase format of the proximity extension assay (PEA) for the analysis and quantification of clinical material. To im-prove the performance of the PEA (161, 171) we used magnetic particles,
I II III IV rt-PCR

64
which allowed us to wash off excess detection reagents and also increase the sample volume to introduce more detectable molecules.
5.4.3 Summary of finding We developed a protocol for protein detection on magnetic particles. We compared detection of IL-8, IL-10 and IL-6 using spPEA and PEA. SpPEA demonstrated over 2 orders of magnitudes lower detection levels compare to the homogenous form of the assay (Figure 5.4.2).
Figure 5.4.2: Comparison of bead-based PEA vs. solution-based PEA Assay performance comparison of spPEA (blue), and PEA (red). Comparison of detection of (A) IL-6, (B) IL-10 and (C) TNF-alpha in assay buffer. X-axis repre-sents the concentration in mass per volume and y-axis represent Ct All experiments where done in duplicates and the standard deviation is shown in the arrow bars

65
III Conclusions and Perspectives
What is limiting the adaptation of new molecular tools to routine clinical use? I woke up to this thought every single day since I started this journey. As of this day that I write this section of my thesis, I checked on PubMed with the words ‘immunoassay and there were 483,413 articles published from 1967 – 2017. At the same time, I searched the FDA database and found 500 approved in vitro diagnostic assays (IVDs). The economics of the pro-portion of failed and unapproved methods comes to mind. In the same re-gard, concerning the agent by which immunoassays are built on (antibodies) as my mind wandered to the comment made by Bradbury, Plückthun and 110 co-signatories in 2015 “To save millions of dollars and dramatically improve reproducibility, protein-binding reagents must be defined by their sequences and produced as recombinant proteins”. Are poor quality antibod-ies the only reason we only have 1 approved IVD for every 966 reported in the literature? This can be debated (since antibodies are a crucial component in immunoassays), but in my opinion, the answer is no. Many parameters contribute to poor performance, antibodies, sample collections validation, control samples, substrates, analysis methods, and instrumentation. All the above parameters have an effect on the analytical characteristics, which in-cludes sensitivity, specificity (or selectivity), throughput, dilution linearity, reproducibility, robustness, and precision
In the words of Marie Curie, “One never notices what has been done, one can only see what remains to be done.” Looking at how far immunotherapy has come, and the increasing use of antibodies in different types of cancers treatment, one must say and agree that there is a bright light at the end of the tunnel for immunoassays in IVDs. Hundreds of millions of dollars are wasted each year in antibodies usage both in academia and industry. Numerous re-ports, letters, and publications have been written with proposals on improved means for validating antibodies. Should we keep on writing proposals and never getting to a point where we arrive at an agreement on whats needs to be done? As the father of medicine Hippocrates put it “Declare the past, diagnose the present, foretell the future; practice these acts. As to diseases, make a habit of two things – to help, or at least to do no harm”. In 2016, Uhlen et al. wrote, “ We convened an ad hoc International Working Group for Antibody Valida-tion to formulate the best approaches for validating antibodies used in com-mon research applications provide guidelines that ensure antibody reproduci-bility. We recommend five conceptual ‘pillars’ for antibody validation to be

66
employed in an application-specific manner”. No one solution from the differ-ent reports will fit all; researchers from academia and industry must come together in sync to put into practice all that is said and written. Alternative recombinant affinity binders have gained applause over the years. However, the demand to validate them for immunoassays (IVDs) is not as appealing as its application in pharmaceuticals. What do we do?
When it comes to protein detection and analysis, almost everybody utilizes and adapts their assay to the sandwich ELISA format. Once the scientific re-search community decides to come up with specific guidelines for affinity reagents evaluation and validations, then some of the problems mentioned above with double binder immunoassay will be solved. In the meantime, DNA-assisted proximity based immunoassays come forth with some solutions on specificity, sensitivity, and throughput. In this thesis, we got to compare the new tools developed and presented herein with existing tools for detecting protein from simple to complex matrix. In Paper I, we demonstrated improved detection limits, better dynamic range over traditional ELISA and single bind-ers DNA-assisted method. This does not end here, having the best samples to show the relevance of these assays is as important as developing them.
Which led me to my next concern. Availability of well characterized, eval-uated and stored samples material. In developing immunoassays, validation is an important aspect that enables other users to implement what has been de-veloped. Sample stability can dramatically impact the results of analytes measurement. As we are aware, downstream testing of methods is significant-ly affected by poor quality pre-analytical sampling. Consequently, the investi-gation of different storage conditions, sample tubes, anticoagulants, and cen-trifugation conditions, among other factors can be vital. International and Eu-ropean efforts like the International Society for Biological and Environmental Repositories (ISBER) and Biobanking and Bimolecular Resources Research Infrastructure (BBMRI) have put in place policies on optimizing sample col-lection, storage, and analysis. Data about how these different factors affect assay validation should be made available to avoid variations from these sources. With everything in place, accessibility of optimized well-characterized samples should be made available for necessary assay valida-tions without excessive bureaucratic procedures. We ‘immunoassay develop-ers’ are all after the same thing, which is providing a better analytical tool for clinical diagnosis, prognosis and diseases monitoring. All these factors are central in decision-making by medical practitioners in hospitals. The availabil-ity of well-validated antibodies, samples and other resources that make immu-noassay successful does not necessarily ensure a sensitive, accurate or multi-plex immunoassay. As discussed in section 1.2, leakage of a few proteins from damaged tissues or proteins secreted from endocrine epithelial organs into blood get diluted, which creates a need for enhanced protein detection assays with improved sensitivity. This will enable early detection of proteins that may reveal diseases processes in organs that are difficult to access, they by facilitat-

67
ing early diagnosis, treatment or possibly disease prevention. Tools like Ex-oPLA can specifically distinguish different proteins on microvesicles surface with high specificity and sensitivity in a complex biological matrix and are therefore vital for early diagnosis. Over the past decade, lots of emerging pro-tein assay technologies such as Simoa and Erenna assays have been developed with ‘single protein’ sensitivities. With the complexity of diseases, looking at proteins one at a time is not going to cut it. With still a long way to go from having highly validated antibodies, cross-reactivity for irrelevant proteins and sticking of detection reagents to surfaces becomes a central issue for these single binders assays. Not forgetting the Immuno RCA / PCR assays as well. They, on the other hand, can handle the investigation of multiple proteins due to their DNA-based architecture. In this regard, it is worth mentioning that DNA-assisted proximity bases immunoassays are efficient methods for sensi-tive, multiplex and specific protein detection in complex matrices. Somebody may argue that specificity or selectivity may be difficult to prove. I will have to disagree with that point. The molecular architecture of proximity ligations or extension assays is built on the two antibodies coupled to DNA molecules having to agree on the presence of a target. Now, I will take a second to go back to double binders’ immunoassays. They don’t have such a requirement, and anywhere a detection reagents sticks, absorbs on the surface or matrix will give rise to signal which merges with the actual signal. This is not the case with PLA, PEA or PLARCA systems as the probability of detecting a targeted decrease as the number of detection events needed to take place increases. Notwithstanding, in other work not described in this thesis, we are designing experiments to investigate the phenomenon of specificity. From an exploratory assay design perspective, alternative recombinant binders can be used to detect and distinguish proteins from the same family. This can also be a real advance in technology development and hopefully clinical adaptation.
As I try finalizing my work discussed in this thesis, the question I ask my-self is, where does all the work presented in this thesis fit in the proteomic tree? As shown in (Figure 5.1), the field of proteomics covers a multitude of domains, my niche for my thesis with the papers I, II, III and IV, extends from studying protein expression in cells and tissues to PTMs, protein-protein inter-actions, EVs, and proteome mining (target detection and quantification).
In section 1, I started with the quotes from Lucretius “Nothing comes from nothing.” The work presented in this thesis is built on work done by many across disciplines from the publishing of RIA in 1959 to PLA assay in 2002 and everything before, during and after. I still wake up with this question, what is limiting the adaptation of new molecular tools for routine clinical use?
Now, I know it is all work in progress as we continue to build on improving existing technologies.

68
IV Acknowledgments
Paulo Coelho de Souza in the Alchemist said, “When you want something, all the universe conspires in helping you to achieve it.” Throughout this journey, I have been fortunate to meet and work with some amazing but really diverse group of individuals. How could I have kept track of them all throughout these years? Here, I will acknowledge colleagues, supervisors, committee members, admin personnel, mentors, family, friends and family. My utmost gratitude goes to my faculty opponent Prof. Peter Nilsson and my examination board Docent Ylva Ivarsson, Prof. Vladimir Tolmachev and Mats Inganäs and my chairperson Docent Anna Dimberg. Thank you all for accepting to read my thesis and your participation in the discussion and evaluation of my work. As Christopher Pike (real name Kevin McFadden) in Sati puts it “A true teacher would never tell you what to do. But he would give you the knowledge with which you could decide what would be best for you to do.” That is what Ulf Landegren is in my opinion. It took a long, long, long, long time to warm up to his brilliance in everything science and otherwise. I usu-ally will leave his office more confused in an amazing way (now in retro-spect) than when I got in. There was always something to reflect on. Thank you for your unfading interest in pushing your ideas against traditional methods.
Tack för din värdefulla och entusiastiska handledning och för den in-spirerande vetenskapliga och innovativa atmosfären i din forskargrupp. “He has a right to criticize, who has the heart to help,” said by Abraham Lincoln. Thank you, Masood Kamali, for your support throughout this jour-ney. Thank you for all the practical, technical and scientific help. Thank you for all the random knocks on your ever-open door for all sorts of questions even in the midst of your deadlines. Thank you for your enthusiasm. Thank you for tolerating my thinking out loud and being myself.
سپاس از تک تک چیزھایی کھ بھ من آموزش .کار کردن در کنار شما، باعث افتخار من بوده استدادید و یک دنیا سپاس بابت تالش بی وقفھ تان برای اینکھ ھمھ چیزھا را محیا کردید تا پروژه ھا
ھرگز ھرگز ھرگز محبتھای شما را .ھمانطور کھ برنامھ ریزی کرده بودیم برای من پیش برود.فراموش نخواھم کرد

69
Ulf & Masood, thanks for not confusing me more with very different and diverse opinions. Thank you, both for teaching me how to listen & think when developing tools. Thanks to the European Union Commission for funding the BioMaX pro-gram that I was a part of. Thanks to the fantastic team and my fellow col-leagues Delfina, Sole, Fabi, Deniz, Elena, Stefano, Tamara, Beda, Malte, Diego, Matteo, Rory and Donacien. Thank you all for making the dead-lines, meetings, and trips enjoyable. Exploring science and Europe with you all was an experience I will never forget. Thanks for all the fun memories (with lots of crazy pictures ☺). I pray and hope we have a reunion this time in Africa ☺ I would like to thank the IGP administration staff for their selfless work in ensuring the smooth life of this journey. Christina Magnusson, you are one of the most selfless people I me this far. Thank you for all you do, your effi-ciency, your warmth, and the pure light you elude. Thank you Tuulikki for your warmth ☺ and always speaking to me in Swedish. Claes Wadelius Thank for all your help and corrections with the defense application. Thanks for all the fun activities for both learning and fun organized by the IGP Ph.D. student council. The winter masquerade party and the symposiums were very lovely. Moltools past and present, It will be tough to remember everything but in the words of Maya Angelou “People will forget what you said, people will for-get what you did, but people will never forget how you made them feel.” To the present members of the group Peter, your knowledge in cell biology among other things always leads me to knocks on your door. Thank you for the fascinating scientific discussions and lunch social talks, you should laugh often☺. Phathu, you may never get around to learn that pidgin English but thank you for always listening to crazy thoughts and imagination. Thank you for all the interesting discussions and the late night lab work and workouts. You are a great gym partner☺. Lei, your drive to make all things easier gave me a different perspective. Thank you for all the discussion on DNA-related stuff, the lots of laughter and my many questions. Thanks to you & your wife for my little friend Estelle & the pure joy she plants in my heart when she calls my name☺. Felipe, my office mate, I thank you for the energy you bring to work every day. Your love for star wars made me try to get into it, but that was not going to happen (I tried☺). Johan H, you always had the best illustrations to describe your work. Thank you for the occasional discus-sion and your every willingness to help. And your Fika homemade is always delicious☺. Rasel thanks, for sharing your enthusiasms at work and your love for all things Pharmaco☺. Sophie, your extensive knowledge on all things statistics is fantastic. Thank you for all the discussions and chats. Thank you for sharing your Chinese medicines for my different headache

70
problems and always with a smile☺. Hongxing Thanks for encouraging me, and also taking pictures. Thank you for always reminding us about respect for others & also to take care of equipment in the lab. Your warmth & smile is soothing☺. Reddy, thank for the interesting discussion about different variants of setting up PLA. Caroline, thank you for always sharing your broad knowledge of science. Thank you for all the new publications on all things single cells and technology development. Thanks also for scheduling group meetings throughout the years’☺. Radiosa, thank you for all the dis-cussions, all the interesting questions. Your love & care makes you a fun person to be with☺. Johan O, thank you for your endless help with my computer problems. Thank for teaching me new about the tech world. Elin, your organization skills beat it. Thank you for your warmth☺. Thank you for organizing wonderful Christmas parties, putting up the Christmas tree, and little things that make work feel like home☺. Johanna, thank you for keeping the lab for us. Thank you for the entire home made goodies by the coffee machine. Thank you for your warmth & good heart☺. Erik, your knowledge in all things money-hunting☺ is a valuable resource. Thank you for all the songs in the all the parties. Liza your strength and energy in deal-ing with everything is a source of admiration. Thank you for all the beautiful times, meetings, lunches, and most importantly your smile☺, priceless☺. Anne-Li ☺, I never met any Swede who was so outgoing, carefree and smart at the same time. Thank you for sharing so much with me and making my stay here beautiful. Thanks for all the lunches, diners outside work and dances at parties☺. Gucci, thanks for the interesting discussions. Rachel, you introduced me into the lab and thought me most of the things I know today. Thank you for your endless help in dealing with my many ques-tions☺. Thank you for introducing me to PLA, C2CA, and making lovely images. Spyros thanks for always answering my questions, providing alter-natives to solving problems and responding to my emails. Junhong, thanks for the interesting discussion about science. We had some much fun outside the lab, thank for introducing me to sushi, and other Chinese food☺. Maria H, thanks for your enthusiasm and all things conjugations. Johan V thanks for introducing me to Luminex technology. Christina thanks for taking care of he lab and ensuring its smooth functioning. Andries thank for your tre-mendous insight into all things molecular biology and signaling. Joakim thank for your great sense humor and looking for better ways to preserve samples. Agata, you are what we call beauty and brains. Thanks for not only sharing your knowledge in setting up western blots but also your in-credible fashion sense☺. Lotta W, thank you for providing me with samples for my first paper and for sharing your passion for all things exosomes. Di, thank you for sharing your brilliance, smart way of thinking and the after work games & fun ☺. Thanks to Leisa, Femi, Yajun, your interest in developing molecular tools is ever fresh. Thank for starting the spPEA projects, which I am now contin-

71
uing. Hannan darling,☺ thank you for the wonderful discussions, the after work lunches. Thanks for sharing your view about life and for understanding my frustrations☺. Samaneh thanks for being my student, and helping me to learn as I teach. Söderberg group: Ola, thank you for sharing your knowledge in cell biology, pathology, developing molecular tools. Thank you for the morning swim-ming lessons. Dorotheya thank you for all the discussions, your constant smile and positive energy☺. Axel thanks for keeping the HPLC in working conditions and teaching me how to set it up. Thanks for the interesting dis-cussions. Johan H thanks for all the scientific discussions. Bjorn thanks for the nice discussions. Linda, I will never forget my first kettle bell class, you are a tough cookie. Thank you for the interesting discussions over the years ☺. Karin G you made me feel at home at work. Thank you for all the activi-ties like the before lunch running. Please do not lose your selflessness☺☺. Carl-Magnus, thank you for trying to help me understand how depression works ☺. Your passion for charity is amazing. Gaelle thanks for all the discussion and after work fun ☺. To Nilsson (MolDia) group: Mats N, your positive energy made it so much easier to talk to you. Thank you for your optimistic view on science and life. Thanks to the member of the MolDia group past and present Elin L. your energy and presence were amazing, thanks for being a good dance partner at defense parties. Anja, Thank you for all discussions and introducing me into the forensic teaching course. Annika your warmth and positive energy I will never forget. Thomas thanks for always helping me with the micro-scope every time I was in Stockholm. Marco M thanks for all the laughter about all things. Thanks for always explaining your projects and thinking that I am crazy☺. Malte, what a journey we had together, thank you for being my partner in BioMax adventure☺. Camilla, your aim of stretching blobs, was always fascinating. David H. thanks you for all showing me how to design & experiment with all things padlocks. Thank for introducing me to macros on Excel. Tagrid, thank your for being a friend, a sister and you ever smiley face☺ love you, lady☺. Elin F thanks for introducing me to Perl programming. Lotta thank you for all things selectors and your critical opin-ion on things. Thanks to Mustapha Amal, Anna, Tomas Rongqin and Magda for the dynamic environment. Thanks to Andries L. and the OncoTrack consortium for providing the samples for my work. Thanks to the Dynal Thermo Fisher people in Oslo, Norway for teaching me the different ways of coupling antibodies to magnetic particles. A special thank goes to Marie and Daren for their hospitality made the stay incredible

72
Thanks to the Mentor4Research program for the amazing opportunity to learn from my mentor Katarina B. Thank for making the time to teach me things on commercialization, managements and much more. Thank for your guidance, help, and I look forward learning more from your expertise. In the words of Nellie McClung, “Women are going to form a chain, a great-er sisterhood than the world has ever known” The “Girls Club” is that sister-hood that made my life so much easier. Aww, ladies, you all know how much I love you Ruta, Fernanda, Vicky, Maryam, and Zohren. Our lunches, diners, and hangout were some of the best moments throughout this journey. You all have a very special place in my heart forever ☺ To the one person who has always been a source of inspiration is Joyce B Endeley. Your drive and work ethics are just incredible. You make it possi-ble for young girls like me to dream to be more in the society where women in higher education is scares To other academic people, I have met. Fidelis Cho your enthusiasm about science and you believe in me. Thank you for your encouragements. Thanks to Lloyd R, thank you for giving me an opportunity to study at Oulu Univer-sity for my masters. Jamie C, you accepted me into your lab for my master project and introduced me into the world of crystals. Aman R, thank you for your love for developing assays for resource limiting setting. Thank you for always encouraging me to be more. Ekoli E., Agbor B., Elali J., Sammy A., Laplace “Pages”, Anne Y., Eric E., Lotta W. Cedrique E., Lucy O., Astrid A., Bessem B., Pearl O., and Pense M., thanks for your love & support ☺☺ Thank my family away from home Emmy, Marie, Vera, Marilyn, Flore, Ma Ju, Daddy Melvin, Mr. Ebot, and Etchu E To my family Papa and Mami, you guys, controlled everything in my life with an iron fist but when it came to school and career choice that was up to me. Thanks for the solid foundations you set for me to achieve my dreams. Thanks for the numerous and endless sacrifices you had to make. Agbor☺, you are the most challenging but smart member of the family. I love you with all your madness☺. To my amazing not so baby sisters Mawa☺ and Manyi☺ thank you for your continuous support and love. Thanks for making me the happiest aunt on the planet with the loves of my life Florian E☺ , Declan M☺ , Francis E☺ , Nathan E☺ and Micah M☺ . Thanks to my uncle after my heart, Uncle Steve, I wish people saw the world through your eyes. Your selflessness is mesmerizing. Thanks to the Ebai & Sona families for their love and support. Thanks to my in-laws for sharing their son with me.

73
To my partner, my lover, my bestie, my tech guy, my man crush, and my go-to-guy Eyong. Thank you for your continual support, understanding, and patience. You make it all so much easier. Thank you ☺

74
V References
1. F C. Central dogma of molecular biology. Nature. 1970;227:3. 2. JD W, Crick FHC. Molecular structure of nucleic acids; a structure for
deoxyribose nucleic acid. Nature. 1953;171(0028-0836 (Print)):737 - 8. 3. Langridge R, Seeds W, Wilson H, Hooper C, Wilkins M, Hamilton L.
Molecular structure of deoxyribonucleic acid (DNA). The Journal of biophysical and biochemical cytology. 1957;3(5):767.
4. Meselson M, Stahl FW. The replication of DNA in Escherichia coli. Proceedings of the National Academy of Sciences. 1958;44(7):671-82.
5. Matthaei JH, Jones, O. W. , Martin, R. G. , and Nirenberg, M. W. . CHARACTERISTICS AND COMPOSITION OF RNA CODING UNITS. Proc Natl Acad Sci USA. 1962;48(666).
6. Nirenberg MW, Matthaei JH. THE DEPENDENCE OF CELL- FREE PROTEIN SYNTHESIS IN E. COLI UPON NATURALLY OCCURRING OR SYNTHETIC POLYRIBONUCLEOTIDES. Proc Natl Acad Sci U S A. 1961;47(10):1588-602.
7. S. B, F. J, M. M. An unstable intermediate carrying information from genes to ribosomes for protein. Nature. 1961;190(0028-0836 (Print)):576-81.
8. Speyer JF, Lengyel P, Basilio C, Ochoa S. SYNTHETIC POLYNUCLEOTIDES AND THE AMINO ACID CODE, IV. Proc Natl Acad Sci U S A. 1962;48(3):441-8.
9. Wahba AJ, Miller RS, Basilio C, Gardner RS, Lengyel P, Speyer JF. SYNTHETIC POLYNUCLEOTIDES AND THE AMINO ACID CODE, IX. Proc Natl Acad Sci U S A. 1963;49(6):880-5.
10. Gardner RS, Wahba AJ, Basilio C, Miller RS, Lengyel P, Speyer JF. SYNTHETIC POLYNUCLEOTIDES AND THE AMINO ACID CODE, VII. Proc Natl Acad Sci U S A. 1962;48(12):2087-94.
11. Gamow G. Possible Relation between Deoxyribonucleic Acid and Protein Structures. Nature. 1954;173(4398):318-.
12. Vickery HB. The Origin of the Word Protein. The Yale Journal of Biology and Medicine. 1950;22(5):387-93.
13. Linderstrom-Lang KU. Proteins and enzymes : Lane medical lectures, 1951: Stanford University Press; Oxford University Press; 1952.
14. Sanger F, Tuppy H. The amino-acid sequence in the phenylalanyl chain of insulin. 1. The identification of lower peptides from partial hydrolysates. Biochemical Journal. 1951;49(4):463-81.
15. Clamp M, B. F, Kamal M, Xie X, Cuff J, Lin MF, et al. Distinguishing protein-coding and noncoding genes in the human genome. Proc Natl Acad Sci USA. 2007;109(49):19428 - 33.
16. Venter JC, Adams MD, Myers EW, Li PW, Mural RJ, Sutton GG, et al. The Sequence of the Human Genome. Science. 2001;291(5507):1304.
17. Ewing B, Green P. Analysis of expressed sequence tags indicates 35,000 human genes. Nat Genet. 2000;25(2):232-4.

75
18. Leff SE, Rosenfeld MG. Complex Transcriptional Units: Diversity in Gene Expression by Alternative RNA Processing. Annual Review of Biochemistry. 1986;55(1):1091-117.
19. Mironov AA, Fickett JW, Gelfand MS. Frequent alternative splicing of human genes. Genome research. 1999;9(12):1288-93.
20. Jensen LJ, Gupta R, Blom N, Devos D, Tamames J, Kesmir C, et al. Prediction of Human Protein Function from Post-translational Modifications and Localization Features. Journal of Molecular Biology. 2002;319(5):1257-65.
21. Mahotka C, Wenzel M, Springer E, Gabbert HE, Gerharz CD. Survivin-ΔEx3 and Survivin-2B: Two Novel Splice Variants of the Apoptosis Inhibitor Survivin with Different Antiapoptotic Properties. Cancer research. 1999;59(24):6097.
22. Hatakeyama K, Ohshima K, Fukuda Y, Ogura S-i, Terashima M, Yamaguchi K, et al. Identification of a novel protein isoform derived from cancer-related splicing variants using combined analysis of transcriptome and proteome. PROTEOMICS. 2011;11(11):2275-82.
23. Scotlandi K, Zuntini M, Manara MC, Sciandra M, Rocchi A, Benini S, et al. CD99 isoforms dictate opposite functions in tumour malignancy and metastases by activating or repressing c-Src kinase activity. Oncogene. 2007;26(46):6604-18.
24. Kawamoto S, Matsumoto Y, Mizuno K, Okubo K, Matsubara K. Expression profiles of active genes in human and mouse livers. Gene. 1996;174(1):151-8.
25. de Godoy LMF, Olsen JV, Cox J, Nielsen ML, Hubner NC, Frohlich F, et al. Comprehensive mass-spectrometry-based proteome quantification of haploid versus diploid yeast. Nature. 2008;455(7217):1251-4.
26. Greenbaum D, Colangelo C, Williams K, Gerstein M. Comparing protein abundance and mRNA expression levels on a genomic scale. Genome Biology. 2003;4(9):117.
27. Ly T, Ahmad Y, Shlien A, Soroka D, Mills A, Emanuele MJ, et al. A proteomic chronology of gene expression through the cell cycle in human myeloid leukemia cells. eLife. 2014;3:e01630.
28. Maier T, Schmidt A, Güell M, Kühner S, Gavin AC, Aebersold R, et al. Quantification of mRNA and protein and integration with protein turnover in a bacterium. Molecular Systems Biology. 2011;7(1).
29. Jayapal KP, Philp RJ, Kok Y-J, Yap MGS, Sherman DH, Griffin TJ, et al. Uncovering Genes with Divergent mRNA-Protein Dynamics in Streptomyces coelicolor. PLoS One. 2008;3(5):e2097.
30. A Gene-centric Human Proteome Project: HUPO-The Human Proteome organization. Molecular & Cellular Proteomics. 2010;9(2):427-9.
31. Uhlén M, Björling E, Agaton C, Szigyarto CA-K, Amini B, Andersen E, et al. A Human Protein Atlas for Normal and Cancer Tissues Based on Antibody Proteomics. Molecular & Cellular Proteomics. 2005;4(12):1920-32.
32. Starling EH. THE WISDOM OF THE BODY: The Harveian Oration, delivered before The Royal College of Physicians of London on St. Luke's Day, 1923. British Medical Journal. 1923;2(3277):685-90.
33. Mannello F. Serum or Plasma Samples? Arteriosclerosis, Thrombosis, and Vascular Biology. 2008;28(4):611.
34. DE M, R K, H W, V G, B D, R Z, et al. A wide range of protein isoforms in serum and plasma uncovered by a quantitative. Proteomics. 2005;13(1615-9853 (Print)): 3343-52.

76
35. GS O, DJ S, M A, TW B, R M, H H, et al. Overview of the HUPO Plasma Proteome Project: results from the pilot phase with. Proteomics. 2005;13(1615-9853 (Print)):3226-45.
36. Liotta LA, Ferrari M, Petricoin E. Clinical proteomics: Written in blood. Nature. 2003;425(6961):905-.
37. Anderson NL, Anderson NG. The human plasma proteome: history, character, and diagnostic prospects. Mol Cell Proteomics. 2002;1(11):845-67.
38. Anderson NL, Polanski M, Pieper R, Gatlin T, Tirumalai RS, Conrads TP, et al. The Human Plasma Proteome: A Nonredundant List Developed by Combination of Four Separate Sources. Molecular & Cellular Proteomics. 2004;3(4):311-26.
39. Anderson NL. The Clinical Plasma Proteome: A Survey of Clinical Assays for Proteins in Plasma and Serum. Clinical chemistry. 2010;56(2):177.
40. Landegren U, Vanelid J, Hammond M, Nong RY, Wu D, Ulleras E, et al. Opportunities for sensitive plasma proteome analysis. Anal Chem. 2012;84(4):1824-30.
41. Hu S, Loo JA, Wong DT. Human saliva proteome analysis and disease biomarker discovery. Expert review of proteomics. 2007;4(4):531-8.
42. Zhou L, Zhao SZ, Koh SK, Chen L, Vaz C, Tanavde V, et al. In-depth analysis of the human tear proteome. Journal of Proteomics. 2012;75(13):3877-85.
43. Schutzer SE, Liu T, Natelson BH, Angel TE, Schepmoes AA, Purvine SO, et al. Establishing the Proteome of Normal Human Cerebrospinal Fluid. PLoS One. 2010;5(6):e10980.
44. Uhlén M, Fagerberg L, Hallström BM, Lindskog C, Oksvold P, Mardinoglu A, et al. Tissue-based map of the human proteome. Science. 2015;347(6220).
45. Lee Y, El Andaloussi S, Wood MJA. Exosomes and microvesicles: extracellular vesicles for genetic information transfer and gene therapy. Human molecular genetics. 2012;21(R1):R125-R34.
46. Valadi H, Ekstrom K, Bossios A, Sjostrand M, Lee JJ, Lotvall JO. Exosome-mediated transfer of mRNAs and microRNAs is a novel mechanism of genetic exchange between cells. Nat Cell Biol. 2007;9(6):654-9.
47. Chatterjee SN, Das J. Electron Microscopic Observations on the Excretion of Cell-wall Material by Vibrio cholerae. Microbiology. 1967;49(1):1-11.
48. TJ B. - Structures of gram-negative cell walls and their derived membrane vesicles. D - 2985120r. 1999(- 0021-9193 (Print)):- 4725-33.
49. Ratajczak J, Miekus K, Kucia M, Zhang J, Reca R, Dvorak P, et al. Embryonic stem cell-derived microvesicles reprogram hematopoietic progenitors: evidence for horizontal transfer of mRNA and protein delivery. Leukemia. 2006;20(5):847-56.
50. Gatti S, Bruno S, Deregibus MC, Sordi A, Cantaluppi V, Tetta C, et al. Microvesicles derived from human adult mesenchymal stem cells protect against ischaemia–reperfusion-induced acute and chronic kidney injury. Nephrology Dialysis Transplantation. 2011;26(5):1474-83.
51. del Conde I, Shrimpton CN, Thiagarajan P, López JA. Tissue-factor–bearing microvesicles arise from lipid rafts and fuse with activated platelets to initiate coagulation. Blood. 2005;106(5):1604.
52. Elmore S. Apoptosis: A Review of Programmed Cell Death. Toxicologic pathology. 2007;35(4):495-516.
53. G R, M H. - Restoration of detergent-inactivated adenosine triphosphatase activity of human. D - 0217513. 1977(- 0006-3002 (Print)):- 483-6.
54. G R, I B, A G, B S. - An Mg2+ and Ca2+-stimulated adenosine triphosphatase in human prostatic. D - 0423506. 1978(- 0303-4569 (Print)):- 427-33.

77
55. G R, I B. - The prostasome: its secretion and function in man. - Biochim Biophys Acta 1985 Sep 9;822(2):203-18. 1985(- 0006-3002 (Print)):- 203-18.
56. RM J, M A, JR H, L O, C T. - Vesicle formation during reticulocyte maturation. Association of plasma membrane. D - 2985121r. 1987(- 0021-9258 (Print)):- 9412-20.
57. Mayers JR, Audhya A. Vesicle formation within endosomes: An ESCRT marks the spot. . Communicative & Integrative Biology. 2012;5(1):50- 6.
58. Cocucci E, Racchetti G, Meldolesi J. Shedding microvesicles: artefacts no more. Trends in Cell. 2009;19(2):43 - 51.
59. G R. - Prostasomes are mediators of intercellular communication: from basic research to. J Intern Med. 2012;271(4):400-13.
60. Waldenström A, Gennebäck N, Hellman U, Ronquist G. Cardiomyocyte Microvesicles Contain DNA/RNA and Convey Biological Messages to Target Cells. PLoS One. 2012;7(4):e34653.
61. Maguire CA, Balaj L, Sivaraman S, Crommentuijn MHW, Ericsson M, Mincheva-Nilsson L, et al. Microvesicle-associated AAV Vector as a Novel Gene Delivery System. Molecular Therapy. 2012;20(5):960-71.
62. Tompkins AJ, Chatterjee D, Maddox M, Wang J, Arciero E, Camussi G, et al. The emergence of extracellular vesicles in urology: fertility, cancer, biomarkers and targeted pharmacotherapy. Journal of Extracellular Vesicles. 2015;4:10.3402/jev.v4.23815.
63. Tavoosidana G, Ronquist G, Darmanis S, Yan J, Carlsson L, Wu D, et al. Multiple recognition assay reveals prostasomes as promising plasma biomarkers for prostate cancer. Proc Natl Acad Sci U S A. 2011;108(21):8809-14.
64. Taylor DD, Gercel-Taylor C. MicroRNA signatures of tumor-derived exosomes as diagnostic biomarkers of ovarian cancer. Gynecol Oncol. 2008;110(1):13-21.
65. Macintyre W. Case of Mollities and Fragilitas Ossium, accompanied with urine strongly charged with animal matter. Medico-chirurgical transactions. 1850;33:211-32.
66. Jones HB. On a New Substance Occurring in the Urine of a Patient with Mollities Ossium. Philosophical Transactions of the Royal Society of London. 1848;138:55-62.
67. JF P, TP W, RR B, JH S. Serum UDP-galactosyl transferase as a potential biomarker for breast carcinoma. J Surg Oncol. 1980;15(1):59-66.
68. Korngold L, Lipari R. Multiple-myeloma proteins. III. The antigenic relationship of Bence Jones proteins to normal gamma-globulin and multiple-myeloma serum proteins. Cancer. 1956;9(2):262-72.
69. M T. Cadherins: a molecular family important in selective cell-cell adhesion. Annu Rev Biochem. 1990(59):237-52.
70. Chao YL, Shepard CR, Wells A. Breast carcinoma cells re-express E-cadherin during mesenchymal to epithelial reverting transition. Molecular Cancer. 2010;9(1):179.
71. Kowalski PJ, Rubin MA, Kleer CG. E-cadherin expression in primary carcinomas of the breast and its distant metastases. Breast Cancer Research. 2003;5(6):R217.
72. Grann VR, Troxel AB, Zojwalla NJ, Jacobson JS, Hershman D, Neugut AI. Hormone receptor status and survival in a population-based cohort of patients with breast carcinoma. Cancer. 2005;103(11):2241-51.
73. Hudis CA. Trastuzumab — Mechanism of Action and Use in Clinical Practice. New England Journal of Medicine. 2007;357(1):39-51.

78
74. Jordan VC. Tamoxifen (ICI46,474) as a targeted therapy to treat and prevent breast cancer. British Journal of Pharmacology. 2006;147(S1):S269-S76.
75. Oldenhuis CNAM, Oosting SF, Gietema JA, de Vries EGE. Prognostic versus predictive value of biomarkers in oncology. European Journal of Cancer. 2008;44(7):946-53.
76. Sasseville VG, Mansfield KG, Brees DJ. Safety Biomarkers in Preclinical Development. Veterinary Pathology. 2013;51(1):281-91.
77. Temple R. Are surrogate markers adequate to assess cardiovascular disease drugs? JAMA. 1999;282(8):790-5.
78. Katz R. Biomarkers and Surrogate Markers: An FDA Perspective. NeuroRx. 2004;1(2):189-95.
79. Yalow RS, Berson SA. Assay of Plasma Insulin in Human Subjects by Immunological Methods. Nature. 1959;184(4699):1648-9.
80. U J, L F, B I, B J, R K, K L, et al. Real-time biospecific interaction analysis using surface plasmon resonance and a. Biotechniques. 1991;11(5):620-7.
81. Leavitt S, Freire E. Direct measurement of protein binding energetics by isothermal titration calorimetry. Current Opinion in Structural Biology. 2001;11(5):560-6.
82. Kohler G, Milstein C. Continuous cultures of fused cells secreting antibody of predefined specificity. Nature. 1975;256(5517):495-7.
83. Hanly WC, Artwohl JE, Bennett BT. Review of Polyclonal Antibody Production Procedures in Mammals and Poultry. ILAR Journal. 1995;37(3):93-118.
84. Wright K. Antibodies a laboratory manual: By E Harlow and D Lane. pp 726. Cold Spring Harbor Laboratory. 1988. $50 ISBN 0-87969-314-2. Biochemical Education. 1989;17(4):220-.
85. Hjelm B, Forsström B, Igel U, Johannesson H, Stadler C, Lundberg E, et al. Generation of monospecific antibodies based on affinity capture of polyclonal antibodies. Protein Science : A Publication of the Protein Society. 2011;20(11):1824-35.
86. Huse K, Böhme H-J, Scholz GH. Purification of antibodies by affinity chromatography. Journal of Biochemical and Biophysical Methods. 2002;51(3):217-31.
87. M L, CF H. Critical steps in the production of polyclonal and monoclonal antibodies. Ilar J. 2005;46(3):269-79.
88. Bradbury ARM, Sidhu S, Dubel S, McCafferty J. Beyond natural antibodies: the power of in vitro display technologies. Nat Biotech. 2011;29(3):245-54.
89. Hoogenboom HR, Chames P. Natural and designer binding sites made by phage display technology. Immunology Today. 2000;21(8):371-8.
90. G W, AD G, RE H, HR H. Making antibodies by phage display technology. Annu Rev Immunol. 1994;12(0732-0582 (Print)):433-55.
91. Holliger P, Hudson PJ. Engineered antibody fragments and the rise of single domains. Nat Biotech. 2005;23(9):1126-36.
92. S M. - Nanobodies: natural single-domain antibodies. - Annu Rev Biochem. 2013;82(1545-4509 (Electronic)):775-97.
93. Hust M, Meyer T, Voedisch B, Rülker T, Thie H, El-Ghezal A, et al. A human scFv antibody generation pipeline for proteome research. Journal of Biotechnology. 2011;152(4):159-70.
94. Hust M, Dübel S. Mating antibody phage display with proteomics. Trends in biotechnology. 2004;22(1):8-14.
95. Binz HK, Stumpp MT, Forrer P, Amstutz P, Plückthun A. Designing Repeat Proteins: Well-expressed, Soluble and Stable Proteins from Combinatorial

79
Libraries of Consensus Ankyrin Repeat Proteins. Journal of Molecular Biology. 2003;332(2):489-503.
96. PA N. Alternative binding proteins: affibody binding proteins developed from a small. FEBS 2008;275(11):2668-76.
97. Tuerk C, Gold L. Systematic evolution of ligands by exponential enrichment: RNA ligands to bacteriophage T4 DNA polymerase. Science. 1990;249(4968):505.
98. Eaton BE. The joys of in vitro selection: chemically dressing oligonucleotides to satiate protein targets. Current Opinion in Chemical Biology. 1997;1(1):10-6.
99. Gold L, Janjic N, Jarvis T, Schneider D, Walker JJ, Wilcox SK, et al. Aptamers and the RNA World, Past and Present. Cold Spring Harbor Perspectives in Biology. 2012;4(3):a003582.
100. Hodi FS, O'Day SJ, McDermott DF, Weber RW, Sosman JA, Haanen JB, et al. Improved Survival with Ipilimumab in Patients with Metastatic Melanoma. New England Journal of Medicine. 2010;363(8):711-23.
101. Curran MA, Montalvo W, Yagita H, Allison JP. PD-1 and CTLA-4 combination blockade expands infiltrating T cells and reduces regulatory T and myeloid cells within B16 melanoma tumors. Proceedings of the National Academy of Sciences. 2010;107(9):4275-80.
102. administration FaD. https://www.fda.gov/Drugs/default.htm [ 103. Antonia SJ, López-Martin JA, Bendell J, Ott PA, Taylor M, Eder JP, et al.
Nivolumab alone and nivolumab plus ipilimumab in recurrent small-cell lung cancer (CheckMate 032): a multicentre, open-label, phase 1/2 trial. The Lancet Oncology. 2016;17(7):883-95.
104. Ng EWM, Shima DT, Calias P, Cunningham ET, Guyer DR, Adamis AP. Pegaptanib, a targeted anti-VEGF aptamer for ocular vascular disease. Nat Rev Drug Discov. 2006;5(2):123-32.
105. Dübel S. Recombinant therapeutic antibodies. Applied Microbiology and Biotechnology. 2007;74(4):723-9.
106. Löfblom J, Feldwisch J, Tolmachev V, Carlsson J, Ståhl S, Frejd FY. Affibody molecules: Engineered proteins for therapeutic, diagnostic and biotechnological applications. Febs Lett. 2010;584(12):2670-80.
107. Bessette PH, Rice JJ, Daugherty PS. Rapid isolation of high-affinity protein binding peptides using bacterial display. Protein Engineering, Design and Selection. 2004;17(10):731-9.
108. Dorr BM, Ham HO, An C, Chaikof EL, Liu DR. Reprogramming the specificity of sortase enzymes. Proc Natl Acad Sci U S A. 2014;111(37):13343-8.
109. Fields S, Song O-k. A novel genetic system to detect protein–protein interactions. Nature. 1989;340(6230):245-6.
110. WN B. Western blotting": electrophoretic transfer of proteins from sodium dodecyl. Analytical biochemistry. 1981;112(0003-2697 (Print)):195-203.
111. The Demonstration of Pneumococcal Antigen in Tissues by the Use of Fluorescent Antibody. The Journal of Immunology. 1942;45(3):159.
112. Nakane PK, Pierce GB. ENZYME-LABELED ANTIBODIES FOR THE LIGHT AND ELECTRON MICROSCOPIC LOCALIZATION OF TISSUE ANTIGENS. The Journal of Cell Biology. 1967;33(2):307-18.
113. Solomayer EF, Becker S, Pergola-Becker G, Bachmann R, Krämer B, Vogel U, et al. Comparison of HER2 status between primary tumor and disseminated tumor cells in primary breast cancer patients. Breast Cancer Res Tr. 2006;98(2):179-84.

80
114. Fulwyler MJ. Electronic Separation of Biological Cells by Volume. Science. 1965;150(3698):910.
115. W. A. Bonner HRH, R. G. Sweet, and L. A. Herzenberg. Fluorescence Activated Cell Sorting. Review of Scientific Instruments. 1972;43(3):404-9.
116. Harris CC, Yolken RH, Krokan H, Hsu IC. Ultrasensitive enzymatic radioimmunoassay: application to detection of cholera toxin and rotavirus. Proceedings of the National Academy of Sciences. 1979;76(10):5336-9.
117. UK L. Cleavage of structural proteins during the assembly of the head of bacteriophage. Nature. 1970;15(227 (5259)):680-5.
118. O'Farrell PH. High Resolution Two-Dimensional Electrophoresis of Proteins. The Journal of biological chemistry. 1975;250(10):4007-21.
119. Kenrick KG, Margolis J. Isoelectric focusing and gradient gel electrophoresis: A two-dimensional technique. Analytical biochemistry. 1970;33(1):204-7.
120. L. O. DISC ELECTROPHORESIS. I. BACKGROUND AND THEORY. Ann N Y Acad Sci. 1964;121(- 0077-8923 (Print)):321-49.
121. Bj D. DISC ELECTROPHORESIS. II. METHOD AND APPLICATION TO HUMAN SERUM PROTEINS. Ann N Y Acad Sci 1964;1964(121):404-27.
122. Klose J. Protein mapping by combined isoelectric focusing and electrophoresis of mouse tissues. Humangenetik. 1975;26(3):231-43.
123. Scheele GA. Two-dimensional gel analysis of soluble proteins. Charaterization of guinea pig exocrine pancreatic proteins. Journal of Biological Chemistry. 1975;250(14):5375-85.
124. A G, C O, G B, A H, B S, R W, et al. The current state of two-dimensional electrophoresis with immobilized pH. Electrophoresis. 2000;21( 0173-0835 (Print)):1037-53.
125. GL C, VC W, DF H, JC S. The dynamic range of protein expression: a challenge for proteomic research. Electrophoresis. 2000;6(0173-0835 (Print)):1104-15.
126. P. E. A method for the determination of amino acid sequence in peptides. Arch Biochem. 1949;22(0096-9621 (Print)):475.
127. Aebersold RH, Leavitt J, Saavedra RA, Hood LE, Kent SB. Internal amino acid sequence analysis of proteins separated by one- or two-dimensional gel electrophoresis after in situ protease digestion on nitrocellulose. Proc Natl Acad Sci U S A. 1987;84(20):6970-4.
128. L W, and BH, SG J. Diagnosis of allergy by an in-vitro test for allergen antibodies. Lancet. 1967;25(7526):1105-7.
129. Engvall E - Perlmann P. Enzyme-linked immunosorbent assay (ELISA). Quantitative assay of immunoglobulin G. 1971(0019-2791 (Print)).
130. M U, E R, E E. Two-site sandwich enzyme immunoassay with monoclonal antibodies to human. Journal of immunological methods. 1981;42(0022-1759 (Print)):11-5.
131. Ekins R. A shadow over immunoassay. Nature. 1989;340(6231):256-8. 132. van 't Veer LJ, Dai H, van de Vijver MJ, He YD, Hart AAM, Mao M, et al.
Gene expression profiling predicts clinical outcome of breast cancer. Nature. 2002;415(6871):530-6.
133. MacBeath G, Schreiber SL. Printing Proteins as Microarrays for High-Throughput Function Determination. Science. 2000;289(5485):1760.
134. Haab BB, Dunham MJ, Brown PO. Protein microarrays for highly parallel detection and quantitation of specific proteins and antibodies in complex solutions. Genome Biology. 2001;2(2):research0004.1.
135. C W, CA B. Antibody-based microarrays. Methods Mol Biol. 2009;509(1064-3745 (Print)):57-84.

81
136. Horan PK, Wheeless LL. Quantitative single cell analysis and sorting. Science. 1977;198(4313):149.
137. TM M, YJ W, HO C, LL B, DP S. Development of a microsphere-based fluorescent immunoassay and its comparison to an enzyme immunoassay for the detection of antibodies to three antigen preparations from Candida albicans. J immunolo Methods 1989;116(0022-1759 (Print)):213-9.
138. Fulton RJ, McDade RL, Smith PL, Kienker LJ, Kettman JR. Advanced multiplexed analysis with the FlowMetrix<sup>TM</sup> system. Clinical chemistry. 1997;43(9):1749.
139. W dJ, H tV, BJ P, W K, GT R. Simultaneous Detection of 15 Human Cytokines in a Single Sample of Stimulated Peripheral Blood Mononuclear Cells. Clin Diagn Lab Immunol. 2003;1(1071-412X (Print)):133-9.
140. Dasso J, Lee J, Bach H, Mage RG. A comparison of ELISA and flow microsphere-based assays for quantification of immunoglobulins. Journal of immunological methods. 2002;263(1–2):23-33.
141. Fredriksson S, Gullberg M, Jarvius J, Olsson C, Pietras K, Gustafsdottir SM, et al. Protein detection using proximity-dependent DNA ligation assays. Nat Biotechnol. 2002;20(5):473-7.
142. Lundberg M, A. E, Tran B, Assarsson E, Fredriksson S. Homogeneous antibody-based proximity extension assays provide sensitive and specific detection of low-abundant proteins in human blood. Nucleic Acids Res. 2011;39(15):e102.
143. XH X, RB J, J G, B L. Novel solution-phase immunoassays for molecular analysis of tumor markers. Analyst. 2001;8( 0003-2654 (Print)):1285-92.
144. Shalev A, Greenberg AH, McAlpine PJ. Detection of attograms of antigen by a high-sensitivity enzyme-linked immunoabsorbent assay (HS-ELISA) using a fluorogenic substrate. Journal of immunological methods. 1980;38(1):125-39.
145. Rissin DM, Kan CW, Campbell TG, Howes SC, Fournier DR, Song L, et al. Single-molecule enzyme-linked immunosorbent assay detects serum proteins at subfemtomolar concentrations. Nat Biotech. 2010;28(6):595-9.
146. Rissin DM, Walt DR. Digital Concentration Readout of Single Enzyme Molecules Using Femtoliter Arrays and Poisson Statistics. Nano Lett. 2006;6(3):520-3.
147. Todd J, B F, Held D, Morey J, Livingston R, Goix P. Ultrasensitive flow-based immunoassays using single-molecule counting. 2007(0009-9147 (Print)).
148. Juncker D, Bergeron S, Laforte V, Li H. Cross-reactivity in antibody microarrays and multiplexed sandwich assays: shedding light on the dark side of multiplexing. Current Opinion in Chemical Biology. 2014;18:29-37.
149. Vaught JD, Bock C, Carter J, Fitzwater T, Otis M, Schneider D, et al. Expanding the Chemistry of DNA for in Vitro Selection. J Am Chem Soc. 2010;132(12):4141-51.
150. Mehan MR, Williams SA, Siegfried JM, Bigbee WL, Weissfeld JL, Wilson DO, et al. Validation of a blood protein signature for non-small cell lung cancer. Clinical Proteomics. 2014;11(1):32-.
151. Sano T, C S, Cantor CR. Immuno-PCR: very sensitive antigen detection by means of specific antibody-DNA conjugates. Science. 1992;258(5079):120- 2.
152. Schweitzer B, Wiltshire S, Lambert J, O'Malley S, Kukanskis K, Zhu Z, et al. Immunoassays with rolling circle DNA amplification: A versatile platform for ultrasensitive antigen detection. Proceedings of the National Academy of Sciences. 2000;97(18):10113-9.
153. Nam JM, Thaxton CS, Mirkin CA. Nanoparticle-based bio-bar codes for the ultrasensitive detection of proteins. Science. 2003;301(5641):1884-6.

82
154. Landegren U, Kaiser R, Sanders J, Hood L. A ligase-mediated gene detection technique. Science. 1988;241(4869):1077-80.
155. Nilsson M, Malmgren H, Samiotaki M, Kwiatkowski M, Chowdhary BP, Landegren U. Padlock probes: circularizing oligonucleotides for localized DNA detection. Science. 1994;265(5181):2085-8.
156. Fire A, Xu SQ. Rolling replication of short DNA circles. Proceedings of the National Academy of Sciences. 1995;92(10):4641-5.
157. Soderberg O, Gullberg M, Jarvius M, Ridderstrale K, Leuchowius KJ, Jarvius J, et al. Direct observation of individual endogenous protein complexes in situ by proximity ligation. Nat Methods. 2006;3(12):995-1000.
158. Gu GJ, Lund H, Wu D, Blokzijl A, Classon C, von Euler G, et al. Role of individual MARK isoforms in phosphorylation of tau at Ser(2)(6)(2) in Alzheimer's disease. Neuromolecular Med. 2013;15(3):458-69.
159. Baner J, Nilsson M, Mendel-Hartvig M, Landegren U. Signal amplification of padlock probes by rolling circle replication. Nucleic Acids Res. 1998;26(22):5073-8.
160. Goo N-I, Kim D-E. Rolling circle amplification as isothermal gene amplification in molecular diagnostics. BioChip Journal. 2016;10(4):262-71.
161. Lundberg M, Eriksson A, Tran B, Assarsson E, Fredriksson S. Homogeneous antibody-based proximity extension assays provide sensitive and specific detection of low-abundant proteins in human blood. Nucleic Acids Res. 2011(1362-4962 (Electronic)):1-8.
162. Darmanis S, Nong RY, Hammond M, Gu J, Alderborn A, Vanelid J, et al. Sensitive plasma protein analysis by microparticle-based proximity ligation assays. Mol Cell Proteomics. 2010;9(2):327-35.
163. Darmanis S, Nong RY, Hammond M, Gu J, Alderborn A, Vanelid J, et al. Sensitive plasma protein analysis by microparticle-based proximity ligation assays. Mol Cell Proteomics. 2010;9(2):327-35.
164. Leuchowius K, Clausson C-M, Erbilgin Y, Botling J, - BJF, Landegren U, et al. Parallel visualization of multiple protein complexes in individual cells in tumor tissue. Molecular & Cellular Proteomics. 2013;12(1535-9484 (Electronic)):1563-71.
165. Gu GJ, Wu D, Lund H, Sunnemark D, Kvist AJ, Milner R, et al. Elevated MARK2-dependent phosphorylation of Tau in Alzheimer's disease. Journal of Alzheimer's disease : JAD. 2013;33(3):699-713.
166. Zatloukal B, Kufferath I, Thueringer A, Landegren U, Zatloukal K, Haybaeck J. Sensitivity and Specificity of In situ Proximity Ligation for Protein Interaction Analysis in a Model of Steatohepatitis with Mallory-Denk Bodies. PLoS One. 2014;9(5):e96690.
167. Gustafsdottir SM, Schlingemann J, Rada-Iglesias A, Schallmeiner E, Kamali-Moghaddam M, Wadelius C, et al. In vitro analysis of DNA-protein interactions by proximity ligation. Proc Natl Acad Sci U S A. 2007;104(9):3067-72.
168. Gullberg M, Gustafsdottir SM, Schallmeiner E, Jarvius J, Bjarnegard M, Betsholtz C, et al. Cytokine detection by antibody-based proximity ligation. Proc Natl Acad Sci U S A. 2004;101(22):8420-4.
169. Zhu L, Koistinen H, Landegren U, Stenman UH. Proximity ligation measurement of the complex between prostate specific antigen and alpha1-protease inhibitor. Clinical chemistry. 2009;55(9):1665-71.
170. Darmanis S, Nong RY, Vanelid J, Siegbahn A, Ericsson O, Fredriksson S, et al. ProteinSeq: high-performance proteomic analyses by proximity ligation and next generation sequencing. PLoS One. 2011;6(9):e25583.

83
171. Assarsson E, Lundberg M, Holmquist G, Bjorkesten J, Thorsen SB, Ekman D, et al. Homogenous 96-plex PEA immunoassay exhibiting high sensitivity, specificity, and excellent scalability. PLoS One. 2014;9(1932-6203 (Electronic)).
172. Lind A-L, Wu D, Freyhult E, Bodolea C, Ekegren T, Larsson A, et al. A Multiplex Protein Panel Applied to Cerebrospinal Fluid Reveals Three New Biomarker Candidates in ALS but None in Neuropathic Pain Patients. PLoS One. 2016;11(2):e0149821.
173. Gustafsdottir S - Nordengrahn A, Fredriksson S, Wallgren P, Rivera E, Schallmeiner E, Merza M, et al. Detection of individual microbial pathogens by proximity ligation. Clinical chemistry. 2006;52(6):1152-60.
174. Liu Y, Gu J, Hagner-McWhirter A, Sathiyanarayanan P, Gullberg M, Soderberg O, et al. Western blotting via proximity ligation for high performance protein analysis. Mol Cell Proteomics. 2011;10(11):O111 011031.
175. Schallmeiner E, Oksanen E, Ericsson O, Spangberg L, Eriksson S, Stenman UH, et al. Sensitive protein detection via triple-binder proximity ligation assays. Nat Methods. 2007;4(2):135-7.
176. Thorsen SB, Lundberg M, Villablanca A, Christensen SLT, Belling KC, Nielsen BS, et al. Detection of serological biomarkers by proximity extension assay for detection of colorectal neoplasias in symptomatic individuals. Journal of Translational Medicine. 2013;11(1):253.
177. Gosling JP. A decade of development in immunoassay methodology. Clinical chemistry. 1990;36(8).
178. Raposo G, Stoorvogel W. Extracellular vesicles: Exosomes, microvesicles, and friends. The Journal of Cell Biology. 2013;200(4):373-83.
179. Tavoosidana G, Ronquist G, Darmanis S, Yan J, Carlsson L, Wu D, et al. Multiple recognition assay reveals prostasomes as promising plasma biomarkers for prostate cancer. Proc Natl Acad Sci U S A. 2011;108(21):8809-14.
180. Simpson RJ, Lim JW, Moritz RL, Mathivanan S. Exosomes: proteomic insights and diagnostic potential. Expert review of proteomics. 2009;6(3):267-83.
181. Leuchowius KJ, Jarvius M, Wickstrom M, Rickardson L, Landegren U, Larsson R, et al. High content screening for inhibitors of protein interactions and post-translational modifications in primary cells by proximity ligation. Mol Cell Proteomics. 2010;9(1):178-83.
182. Gu G, Lund H, Wu D, Blokzijl A, Classon C, Euler G, et al. Role of Individual MARK Isoforms in Phosphorylation of Tau at Ser262 in Alzheimer’s Disease. Neuromol Med. 2013;15(3):458-69.
Acta Universitatis UpsaliensisDigital Comprehensive Summaries of Uppsala Dissertationsfrom the Faculty of Medicine 1336
Editor: The Dean of the Faculty of Medicine
A doctoral dissertation from the Faculty of Medicine, UppsalaUniversity, is usually a summary of a number of papers. A fewcopies of the complete dissertation are kept at major Swedishresearch libraries, while the summary alone is distributedinternationally through the series Digital ComprehensiveSummaries of Uppsala Dissertations from the Faculty ofMedicine. (Prior to January, 2005, the series was publishedunder the title “Comprehensive Summaries of UppsalaDissertations from the Faculty of Medicine”.)
Distribution: publications.uu.seurn:nbn:se:uu:diva-320380
ACTAUNIVERSITATIS
UPSALIENSISUPPSALA
2017


![Assessing value of innovative molecular diagnostic tests ... · companies involve the use of specific biomarkers [3]. More-over, molecular diagnostic tests (also molecular genetic](https://img.pdfslide.net/doc/110x75/603a70cecb5e006a3e75a1b5/assessing-value-of-innovative-molecular-diagnostic-tests-companies-involve-the.jpg)