Embed Size (px)
Citation preview

ORI GIN AL PA PER
Development of Fast Ionization Wave Discharges at HighPulse Repetition Rates
Keisuke Takashima • Igor V. Adamovich • Uwe Czarnetzki •
Dirk Luggenholscher
Received: 15 July 2011 / Accepted: 5 April 2012 / Published online: 28 April 2012� Springer Science+Business Media, LLC 2012
Abstract Positive and negative polarity fast ionization wave discharges in nitrogen and
dry air are studied in a rectangular geometry channel over a wide range of time delays
between the discharge pulses, s = 10 ms to 25 ls (pulse repetition rates of m = 100 Hz–
40 kHz). The discharge is generated by alternating polarity high-voltage pulses (peak
voltage 18–23 kV, pulse duration 50–60 ns). Ionization wave speed and electric field
distributions in the discharge are measured by a calibrated capacitive probe. Plasma images
show that for long time delays between the pulses, above s * 1 ms (pulse repetition rate
up to m * 1 kHz), the positive polarity wave propagates along the channel walls and the
negative polarity wave tends to propagate along the centerline. For time delays below
s * 0.5–1.0 ms (above m * 1–2 kHz), both positive and negative polarity waves become
diffuse, while wave speed and peak electric field in the wave front become nearly inde-
pendent of the polarity. Wave speed remains nearly constant for s * 1–10 ms (up to
m * 1 kHz), 0.8–0.9 cm/ns, and decreases for shorter time delays, by 30–40 % at
s = 25 ls (m = 40 kHz). Peak electric field in the positive polarity wave decreases sig-
nificantly as the pulse repetition rate is increased, from 2.7–3.0 kV/cm to 1.2–1.5 kV/cm.
Comparison of experimental results in nitrogen with kinetic modeling calculations at high
pulse repetition rates, when the discharge is diffuse, shows good agreement. Calculation
results show that peak electric field reduction at high pulse repetition rates is mainly due to
higher electron density in the decaying plasma generated by the previous discharge pulse.
Reduction of wave speed and coupled energy at high repetition rates is primarily due to
slower voltage rise and lower pulse peak voltage, limited by the pulse generator. The
model shows that at high pulse repetition rates most of the discharge power is coupled to
the plasma behind the wave, at E/N * 200–300 Td. Discharge energy loading at
m = 1–40 kHz is 1–2 meV/molecule/pulse.
K. Takashima � I. V. Adamovich (&)Department of Mechanical and Aerospace Engineering, The Ohio State University, Columbus,OH, USAe-mail: [email protected]
U. Czarnetzki � D. LuggenholscherDepartment of Physics and Astronomy, Ruhr University Bochum, Bochum, Germany
123
Plasma Chem Plasma Process (2012) 32:471–493DOI 10.1007/s11090-012-9377-9
Keywords Fast ionization wave � Nanosecond pulse � Electric field measurements �Kinetic modeling
Introduction
Fast ionization wave (FIW) discharges have been extensively studied over the last decades.
A review of experimental results in this field and theoretical models developed in 1980s
and 1990s can be found in [1, 2]. Since mid-1990s, fundamental kinetic processes in
nanosecond pulse discharges and their applications have been studied at Moscow Institute
of Physics and Technology (e.g. see [3–5] and references therein). At the present time, a
large body of experimental data is available on fast ionization wave speed and attenuation
coefficient in various gases over a wide range of pressures, as well as on wave front
dynamics, UV/visible emission from the wave, and generation of high-energy (runaway)
electrons in the wave front. Recently, numerical and analytic models of FIW discharge
have been developed and validated experimentally for wave speeds of *1 cm/ns [6].
The main difference between streamer discharges and FIW discharges is that the latter
demonstrate high spatial uniformity and reproducibility, thus allowing accurate measure-
ments of discharge parameters in a repetitively pulsed mode. Qualitative similarity
between these two types of discharges is due to the fact that key elementary processes
controlling discharge propagation are electron impact ionization in the discharge front and
photoionization. The transition between the streamer and the ionization wave discharge
modes is rather gradual, and requires high peak reduced electric fields and therefore high
pulse voltage rise rates, typically of the order of *1–10 kV/ns. At these conditions, the
ionization wave speed is of the order of *1–10 cm/ns [1]. Due to the high reduced electric
field in the discharge front, up to E/N * 103 Td (1 Td = 10-17 V cm2), the role of high-
energy electrons in ionization kinetics can be significant [7].
Current interest in characterization of FIW discharges is driven mainly by their potential
for applications such as plasma chemical fuel reforming [8], plasma-assisted combustion
[4, 5, 9, 10], pumping of electric discharge excited lasers [9], and generation of high-
energy electrons [7]. A unique capability of FIW discharges to generate significant ioni-
zation and to load a significant fraction of input energy into molecular dissociation and
electronic excitation at high pressures and over large distances, before ionization insta-
bilities have time to develop [3–5], is very attractive for these applications. Also, high peak
electron/ion and electronically excited species concentrations reached in near-surface FIW
discharges result in rapid energy thermalization on sub-microsecond time scale, which is
critical for high-speed flow control using nanosecond pulse surface plasma actuators [11–
13]. Most of these applications involve discharge operation at high pulse repetition rates,
from a few kHz up to *100 kHz, to maximize time-averaged electron density [9], number
densities of excited species and radicals [9, 10, 14], or to match flow instability frequencies
[13, 15]. Insight into FIW formation and propagation dynamics at high pulse repetition
rates requires the use of non-intrusive optical diagnostics with sub-nanosecond time res-
olution, as well as development of predictive kinetic models and their validation.
The main objectives of the present work are (i) measurements of wave speed, electric
field in the wave front, and coupled pulse energy in FIW discharges in nitrogen and dry air
operated at high pulse repetition rates, and (ii) comparison of the experimental results with
kinetic modeling calculations to obtain insight into wave propagation dynamics and energy
coupling kinetics. To reduce heating of the flow while producing significant pre-ionization
472 Plasma Chem Plasma Process (2012) 32:471–493
123
in the discharge channel typical for high pulse repetition rates, the discharge is operated in
repetitive burst mode, at a low burst repetition rate and short time delay between the pulses
in the burst (i.e. high pulse repetition rate in the burst).
Experimental
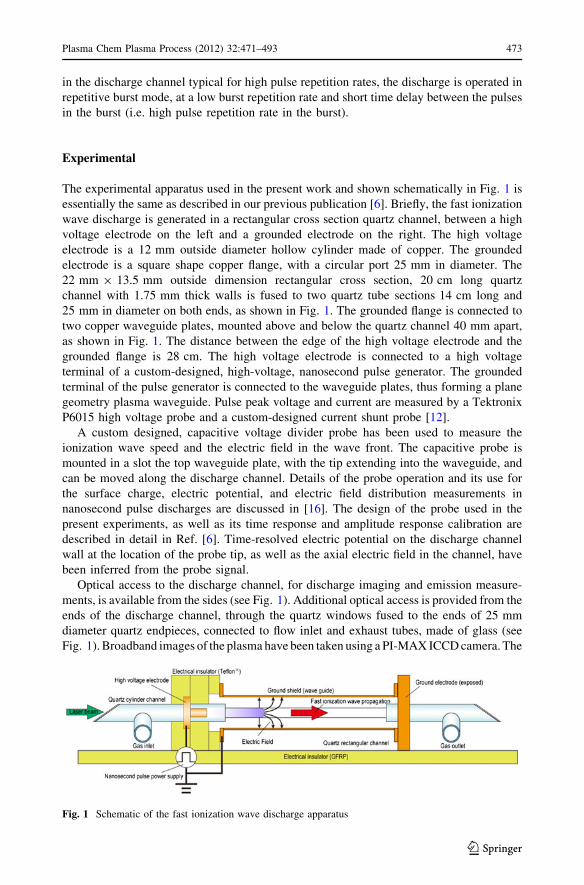
The experimental apparatus used in the present work and shown schematically in Fig. 1 is
essentially the same as described in our previous publication [6]. Briefly, the fast ionization
wave discharge is generated in a rectangular cross section quartz channel, between a high
voltage electrode on the left and a grounded electrode on the right. The high voltage
electrode is a 12 mm outside diameter hollow cylinder made of copper. The grounded
electrode is a square shape copper flange, with a circular port 25 mm in diameter. The
22 mm 9 13.5 mm outside dimension rectangular cross section, 20 cm long quartz
channel with 1.75 mm thick walls is fused to two quartz tube sections 14 cm long and
25 mm in diameter on both ends, as shown in Fig. 1. The grounded flange is connected to
two copper waveguide plates, mounted above and below the quartz channel 40 mm apart,
as shown in Fig. 1. The distance between the edge of the high voltage electrode and the
grounded flange is 28 cm. The high voltage electrode is connected to a high voltage
terminal of a custom-designed, high-voltage, nanosecond pulse generator. The grounded
terminal of the pulse generator is connected to the waveguide plates, thus forming a plane
geometry plasma waveguide. Pulse peak voltage and current are measured by a Tektronix
P6015 high voltage probe and a custom-designed current shunt probe [12].
A custom designed, capacitive voltage divider probe has been used to measure the
ionization wave speed and the electric field in the wave front. The capacitive probe is
mounted in a slot the top waveguide plate, with the tip extending into the waveguide, and
can be moved along the discharge channel. Details of the probe operation and its use for
the surface charge, electric potential, and electric field distribution measurements in
nanosecond pulse discharges are discussed in [16]. The design of the probe used in the
present experiments, as well as its time response and amplitude response calibration are
described in detail in Ref. [6]. Time-resolved electric potential on the discharge channel
wall at the location of the probe tip, as well as the axial electric field in the channel, have
been inferred from the probe signal.
Optical access to the discharge channel, for discharge imaging and emission measure-
ments, is available from the sides (see Fig. 1). Additional optical access is provided from the
ends of the discharge channel, through the quartz windows fused to the ends of 25 mm
diameter quartz endpieces, connected to flow inlet and exhaust tubes, made of glass (see
Fig. 1). Broadband images of the plasma have been taken using a PI-MAX ICCD camera. The
Fig. 1 Schematic of the fast ionization wave discharge apparatus
Plasma Chem Plasma Process (2012) 32:471–493 473
123

present experiments have been conducted in nitrogen and in dry air at a pressure of
P = 10 Torr. The baseline nitrogen flow rate is 100 sccm, which corresponds to the flow
velocity through the discharge channel of approximately u = 0.7 m/s at P = 10 Torr. The
flow rate through the discharge section and the pressure are controlled by mass flow con-
trollers and by a shutoff valve between the test section and the vacuum pump.
The high-voltage nanosecond pulse generator [6], also used in the present experiments,
has been custom designed to generate alternating polarity pulses with peak voltage of 10–
30 kV, pulse duration 50–100 ns, and pulse repetition rate up to 50 kHz. In the present
work, the pulser is operated at repetition rates of 100 Hz–40 kHz. The pulse output voltage
is regulated by varying the voltage of a DC power supply providing input to the pulse
generator. Increasing input DC voltage also reduces the output pulse duration. Figure 2
shows typical positive and negative polarity pulse shapes generated in nitrogen at
P = 10 Torr at different pulse repetition rates. The experimental voltage waveforms
shown in Fig. 2 can be approximated by a Gaussian shape pulse,
U ¼ Upeak exp � t0 � t
s
� �2� �
; ð1Þ
with Upeak = 21–19 kV and s = 30–37 ns (FWHM of 50–61 ns) for UDC = 720 V and
pulse repetition rate in the range of m = 0.1–40 kHz. Pulse peak voltage reduction and
pulse duration increase at high pulse repetition rates (above m = 5 kHz, see Fig. 2) are due
to the relatively slow charging of capacitors in the DC power supply. Pulse voltage
waveforms taken in atmospheric pressure nitrogen, when no breakdown is detected in the
discharge channel, are almost the same as shown in Fig. 2.
Kinetic Model
To model the ionization wave propagation in the rectangular geometry channel, shown
schematically in Fig. 3, we used a quasi-one-dimensional hydrodynamic plasma model in
Fig. 2 Typical positive andnegative polarity voltage pulsewaveforms generated by thepulsed plasma generator fordifferent pulse repetition rates
474 Plasma Chem Plasma Process (2012) 32:471–493
123

the drift–diffusion approximation. The model has been derived from a two-dimensional
plasma model assuming weak transverse nonuniformity of the FIW discharge, as discussed
in greater detail in Ref. [2] and in our previous paper [6]. In Fig. 3, the channel length and
half-height are L = 30 cm and a = 0.5 cm, respectively, the dielectric thickness is
h = 1.5 cm, and the dielectric constant is e = 1. The governing equations in the discharge
channel and the boundary conditions on the high-voltage electrode (at x = 0) and on the
grounded electrode (at x = L) are as follows,
onþotþ
o lþnþE� �
ox¼ mine � b nþne ð2Þ
one
ot� o leneEð Þ
ox� lenek2u ¼ mine � b nþne; ð3Þ
oEx
oxþ k2u ¼ e
e0
q; Ex ¼ �ouox
ð4Þ
nþðx ¼ 0Þ ¼ 0 one=oxðx ¼ 0Þ ¼ 0 neðx ¼ LÞ ¼ 0 onþ=oxðx ¼ LÞ ¼ 0 ð5Þ
uðx ¼ 0; tÞ ¼ UðtÞ uðx ¼ L; tÞ ¼ 0: ð6ÞInitial conditions for the electron and ion densities and for the potential in the discharge
channel are
ne ¼ nþ ¼ no; u ¼ 0: ð7ÞIn Eqs. (2)–(4), k is the wavenumber of a linear electrostatic wave formed in a weakly
pre-ionized, rectangular geometry waveguide (see Fig. 3) at the conditions when ionization
is negligible [2],
tanðkaÞ tanðkhÞ ¼ v ¼ e1þ r
e0f
¼ e
1þ eneleEx
e0f
; f ¼ 1
ududt: ð8Þ
For small wavenumbers (i.e. long wavelengths), a simple asymptotic expression for the
wavenumber can be used,
ka� 1; kh� 1 : k � vah
� �1=2
: ð9Þ
The rate of electron impact ionization is assumed to be controlled by the local electric
field. The expression for the ionization frequency, mi, used in Eqs. (2)–(4) is a fit to the
a
h Dielectric,
Grounded waveguide
High voltage electrode,
U(t) x
y
Pre-ionized plasma channel, n0
L
Fig. 3 Schematic of the plasma channel and the dielectric layer in simplified quasi-two-dimensionalgeometry
Plasma Chem Plasma Process (2012) 32:471–493 475
123
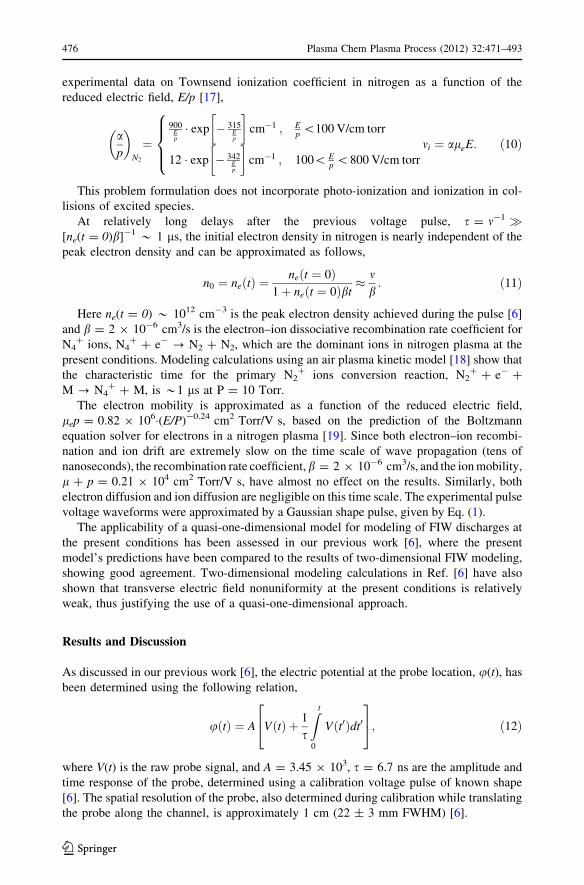
experimental data on Townsend ionization coefficient in nitrogen as a function of the
reduced electric field, E/p [17],
ap
�
N2
¼900
Ep
� exp � 315Ep
� �cm�1 ; E
p \100 V/cm torr
12 � exp � 342Ep
� �cm�1 ; 100\ E
p \800 V/cm torr
8>><>>:
mi ¼ aleE: ð10Þ
This problem formulation does not incorporate photo-ionization and ionization in col-
lisions of excited species.
At relatively long delays after the previous voltage pulse, s = m-1 �[ne(t = 0)b]-1 * 1 ls, the initial electron density in nitrogen is nearly independent of the
peak electron density and can be approximated as follows,
n0 ¼ neðtÞ ¼neðt ¼ 0Þ
1þ neðt ¼ 0Þbt� m
b: ð11Þ
Here ne(t = 0) * 1012 cm-3 is the peak electron density achieved during the pulse [6]
and b = 2 9 10-6 cm3/s is the electron–ion dissociative recombination rate coefficient for
N4? ions, N4
? ? e- ? N2 ? N2, which are the dominant ions in nitrogen plasma at the
present conditions. Modeling calculations using an air plasma kinetic model [18] show that
the characteristic time for the primary N2? ions conversion reaction, N2
? ? e- ?
M ? N4? ? M, is *1 ls at P = 10 Torr.
The electron mobility is approximated as a function of the reduced electric field,
lep = 0.82 9 106�(E/P)-0.24 cm2 Torr/V s, based on the prediction of the Boltzmann
equation solver for electrons in a nitrogen plasma [19]. Since both electron–ion recombi-
nation and ion drift are extremely slow on the time scale of wave propagation (tens of
nanoseconds), the recombination rate coefficient, b = 2 9 10-6 cm3/s, and the ion mobility,
l ? p = 0.21 9 104 cm2 Torr/V s, have almost no effect on the results. Similarly, both
electron diffusion and ion diffusion are negligible on this time scale. The experimental pulse
voltage waveforms were approximated by a Gaussian shape pulse, given by Eq. (1).
The applicability of a quasi-one-dimensional model for modeling of FIW discharges at
the present conditions has been assessed in our previous work [6], where the present
model’s predictions have been compared to the results of two-dimensional FIW modeling,
showing good agreement. Two-dimensional modeling calculations in Ref. [6] have also
shown that transverse electric field nonuniformity at the present conditions is relatively
weak, thus justifying the use of a quasi-one-dimensional approach.
Results and Discussion
As discussed in our previous work [6], the electric potential at the probe location, u(t), has
been determined using the following relation,
uðtÞ ¼ A VðtÞ þ 1
s
Z t
0
Vðt0Þdt0
24
35; ð12Þ
where V(t) is the raw probe signal, and A = 3.45 9 103, s = 6.7 ns are the amplitude and
time response of the probe, determined using a calibration voltage pulse of known shape
[6]. The spatial resolution of the probe, also determined during calibration while translating
the probe along the channel, is approximately 1 cm (22 ± 3 mm FWHM) [6].
476 Plasma Chem Plasma Process (2012) 32:471–493
123

Figure 4 shows a schematic of high-voltage pulse time sequence used in the present
experiments. The pulsed plasma generator operated in the ‘‘double-pulse’’ mode, with
‘‘bursts’’ of two opposite polarity pulses generated in rapid succession, with time delay
between the pulses of s = 10 ms–25 ls (corresponding to pulse repetition rate ranging from
0.1–40 kHz), and a low burst repetition rate of 20 Hz, thus keeping the flow at near room
temperature. This approach allowed isolating the effect of high residual electron density
remaining in the decaying plasma generated by the previous pulse from the gas temperature
rise, which would occur during continuous discharge operation at a high pulse repetition rate.
Figure 5a plots electric potentials measured in a positive polarity wave in nitrogen at
P = 10 Torr, time delay between the pulses of s = 10 ms (pulse repetition rate of
m = 100 Hz), and burst repetition rate of 20 Hz. The potentials at probe locations, u(t), are
inferred from the raw probe signals, V(t), using Eq. (12). The probe signals are taken for
multiple probe tip locations ranging from x = 5 to x = 25 cm from the high voltage
electrode, 1 cm apart. The traces in Fig. 5a are averaged over 200 positive polarity dis-
charge pulses (i.e. 10 s). It can be seen that the results are reproduced very well run-to-run,
with excellent signal-to-noise, which is critical for inference of the electric field from the
probe signals. Figure 5a illustrates that the wave of electric potential propagates to the
right, from the high voltage electrode to the grounded electrode. The potentials measured
by the probe start decreasing when the wave reaches the grounded electrode. Figure 5b
plots time-resolved axial electric field at midpoints between the probe locations, i.e. at
x = 5.5, 6.5, … 24.5 cm, determined from the potential difference at these locations. It can
be seen that the wave front initially steepens while peak electric field increases consid-
erably (from about 2 kV/cm to nearly 3 kV/cm), before reaching a quasi-steady-state shape
(at x & 12 cm). Behind the wave, the field remains low, in the range of E = 0.3–0.7 kV/
cm. Finally, Fig. 5c plots the wave front arrival time, as well as peak potential, peak
electric field, and potential at the moment when the field peaks, at different probe locations.
Fig. 4 Schematic of ‘‘double-pulse’’ operation of the pulsed plasma generator for a negative-positivepolarity, and b positive–negative polarity. Pulse repetition rate m = 0.1–40 kHz (time delay between pulses10 ms–25 ls), burst repetition rate 20 Hz
Plasma Chem Plasma Process (2012) 32:471–493 477
123

The uncertainty of the capacitive probe tip location is ±0.5 mm, and the estimated
uncertainty of the wave speed inferred from the slope of the t–x diagram such as shown in
Fig. 5c is 2 %. From Fig. 5c, it can be seen that far from the high voltage electrode (at
x [ 12 cm), the wave speed becomes nearly constant, V = 0.89 cm/ns at x = 12–25 cm.
In this region, peak electric field in the wave front remains about the same,
E & 2.8–3.0 kV/cm. The potential at the location of peak field also remains approximately
the same, u = 6.5–7.0 kV, although the peak potential in the wave decreases by more than
a factor of two, from 19 to 9 kV as it propagates along the discharge channel (see Fig. 5c).
The results shown in Fig. 5 are similar to our previous measurements in a FIW dis-
charge in nitrogen operated at low pulse repetition rates of 10–20 Hz [6]. When time delay
between the pulses is reduced to s = 100 ls (pulse repetition rate increased to
m = 10 kHz), both peak field in the wave front and the wave speed are reduced signifi-
cantly, as shown in Fig. 6. This occurs in spite of rather modest peak pulse voltage
Fig. 5 a Time-resolved potentials; b time-resolved axial electric fields; c ionization wave front arrival time,peak potential, peak electric field, and potential at the moment when electric field peaks at different probelocations. Data obtained for 21 different locations of the capacitive probe 1 cm apart, ranging from 5 to25 cm from the high voltage electrode. Nitrogen, P = 10 Torr, m = 100 Hz, positive polarity wave (pulsesequence as shown in Fig. 4a
478 Plasma Chem Plasma Process (2012) 32:471–493
123
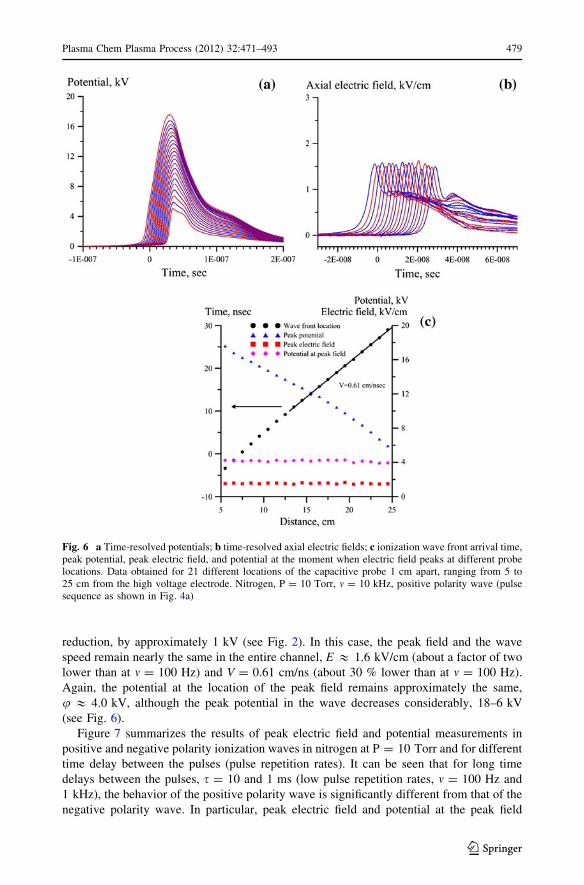
reduction, by approximately 1 kV (see Fig. 2). In this case, the peak field and the wave
speed remain nearly the same in the entire channel, E & 1.6 kV/cm (about a factor of two
lower than at m = 100 Hz) and V = 0.61 cm/ns (about 30 % lower than at m = 100 Hz).
Again, the potential at the location of the peak field remains approximately the same,
u & 4.0 kV, although the peak potential in the wave decreases considerably, 18–6 kV
(see Fig. 6).
Figure 7 summarizes the results of peak electric field and potential measurements in
positive and negative polarity ionization waves in nitrogen at P = 10 Torr and for different
time delay between the pulses (pulse repetition rates). It can be seen that for long time
delays between the pulses, s = 10 and 1 ms (low pulse repetition rates, m = 100 Hz and
1 kHz), the behavior of the positive polarity wave is significantly different from that of the
negative polarity wave. In particular, peak electric field and potential at the peak field
Fig. 6 a Time-resolved potentials; b time-resolved axial electric fields; c ionization wave front arrival time,peak potential, peak electric field, and potential at the moment when electric field peaks at different probelocations. Data obtained for 21 different locations of the capacitive probe 1 cm apart, ranging from 5 to25 cm from the high voltage electrode. Nitrogen, P = 10 Torr, m = 10 kHz, positive polarity wave (pulsesequence as shown in Fig. 4a)
Plasma Chem Plasma Process (2012) 32:471–493 479
123

location are considerably higher in the positive polarity wave (see Fig. 7). For long time
delays between the pulses, s = 100 and 50 ls (high pulse repetition rates, m = 10 and
20 kHz), the values of both these parameters in positive and negative polarity waves are
reduced significantly (especially for the positive polarity) and become rather close to each
other. Also, at high pulse repetition rates, peak electric field and potential at the peak field
location remain nearly the same along the entire discharge channel, for both polarities, i.e.
the initial wave steepening (e.g. see Fig. 5b is not observed. Basically, at these conditions
the ionization wave becomes nearly self-similar (e.g. see Fig. 6b), and opposite polarity
waves begin to ‘‘mirror image’’ each other. Similar behavior has been observed in FIW
discharges in dry air, also at P = 10 Torr (see Fig. 8).
Fig. 7 Peak electric field and potential at the moment when electric field peaks versus axial location, fordifferent pulse repetition rates: a,b positive polarity wave (see Fig. 4a); c,d negative polarity wave (seeFig. 4b. Nitrogen, P = 10 Torr
480 Plasma Chem Plasma Process (2012) 32:471–493
123

The results of wave speed measurements in nitrogen and dry air are shown in Fig. 9.
The wave speed has been determined from the slope of the t–x diagrams, such as shown in
Figs. 5 and 6, in the discharge channel region where the wave reaches quasi-steady-state
speed. From Fig. 9, it can be seen that for long time delays between the pulses, above
s * 1 ms (low pulse repetition rates, up to m * 1 kHz), the positive polarity wave speed
in nitrogen and air exceeds that of the negative polarity by 5–15 %, consistent with our
previous measurements in nitrogen [6]. For shorter time delays between the pulses, below
s * 1 ms (at higher pulse repetition rates, above m * 1 kHz), the wave speed begins to
decrease for both polarities, with the negative polarity wave speed becoming somewhat
higher. For s = 25 ls (m = 40 kHz), the wave speed is reduced by 30–40 % compared to
the baseline value at s = 10 ms (m = 100 Hz). Similar trend is observed in the discharge
Fig. 8 Peak electric field and potential at the moment when electric field peaks versus axial location, fordifferent pulse repetition rates: a,b positive polarity wave (see Fig. 4a); c,d negative polarity wave (seeFig. 4b). Dry air, P = 10 Torr
Plasma Chem Plasma Process (2012) 32:471–493 481
123

pulse energy coupled to the plasma, plotted in Fig. 10. It can be seen that coupled pulse
energy in nitrogen and dry air decreases at high pulse repetition rates (above m * 1 kHz)
for both discharge pulse polarities, from 5 to 6 mJ/pulse at m = 100 Hz to 2.5 mJ/pulse at
m = 40 kHz (nitrogen) and from 6 to 7 mJ/pulse at m = 100 Hz to approximately 3 mJ/
pulse at m = 40 kHz (air).
Figure 11 shows broadband, single-shot ICCD images of positive polarity ionization
waves in nitrogen at P = 10 Torr and for different time delays between the pulses,
Fig. 9 Positive and negative polarity ionization wave speed versus pulse repetition rate. a Nitrogen; b Dryair. P = 10 Torr
Fig. 10 Coupled pulse energy in positive and negative polarity ionization wave discharges versus pulserepetition rate. a Nitrogen; b Dry air. P = 10 Torr
482 Plasma Chem Plasma Process (2012) 32:471–493
123

s = 10 ms, 1 ms, and 100 ls (pulse repetition rates of m = 100 Hz, 1 kHz, and 10 kHz).
In the images, the wave propagates left to right. The camera gate is sgate = 4 ns, time delay
between the frames is 2 ns, and the field of view of the images is 4.6 cm by 3.1 cm. The
images are centered midway through the rectangular quartz channel (see Fig. 1), at
x = 15 cm. The camera was triggered externally, by a trigger pulse provided by the high-
voltage pulse generator, with jitter of about 1 ns. Pulse-to-pulse reproducibility of the
ionization wave launch timing and wave speed is very good, such that 4–8 shot averaged
images appear essentially identical to the single-shot images shown in Fig. 11. The wave
speed at these conditions is V & 0.9 cm/ns (at m = 100 Hz and 1 kHz) and V & 0.6 cm/
ns (at m = 10 kHz, see Fig. 9a), such that the 4 ns camera gate provides fairly low spatial
resolution in the axial direction, approximately Daxial * 2.5–4 cm. However, estimated
transverse resolution, Dtrans * w�sgate, where w * 5 9 107 cm/s is electron drift velocity
in nitrogen at the upper bound reduced electric field Eaxial/N * 103 Td (Etrans � Eaxial) is
Dtrans * 0.1 cm. Therefore the images in Fig. 11 resolve the transverse structure of the
ionization wave front fairly well. From Fig. 11, it can be seen that at m = 100 Hz
(s = 10 ms), the emission is brighter along the top and bottom walls of the channel rather
in the volume, i.e. the wave propagates ‘‘hugging the walls’’ adjacent to the waveguide
plates. At m = 1 kHz (s = 1 ms), bright emission also appears in the channel volume,
although a distinct near-wall structure is still detectable. Finally, at m = 10 kHz
(s = 100 ls), the plasma emission becomes diffuse, without clearly defined near-wall
Fig. 11 Single-shot ICCD camera images of positive polarity ionization wave front in nitrogen at differentpulse repetition rates: a 100 Hz; b 1 kHz; c 10 kHz. Nitrogen, P = 10 Torr, camera gate 4, 2 ns delaybetween frames
Plasma Chem Plasma Process (2012) 32:471–493 483
123
regions, although emission intensity on the center of the channel is somewhat lower. UV/
visible emission spectra taken at the conditions of Fig. 11 show that plasma emission is
dominated by the nitrogen second positive bands.
Two-dimensional kinetic modeling of a single-pulse, positive polarity FIW discharge in
nitrogen conducted in Ref. [6] reproduced the wall hugging effect, observed at low pulse
repetition rates, qualitatively. These results have shown that higher electron density near
the channel walls adjacent to the waveguide plates is caused by the electric field
enhancement near the wall due to the jump in permittivity, as well as by secondary photo-
electron emission from the wall irradiated by the UV photons from the plasma. At the
present conditions (using alternating polarity pulses), electron accumulation on the channel
walls is caused by electron motion away from the high voltage electrode toward the walls
during the negative polarity pulse, preceding the positive pulse. Note that even at these
conditions the two-dimensional kinetic model [6] predicts fairly weak transverse electric
field nonuniformity. As the pulse repetition rate is increased, higher residual electron
density remaining from the previous pulse is expected to make volume electron impact
ionization more significant compared to ionization by secondary electrons emitted from
dielectric surfaces. This would reduce the wall hugging effect, as observed in the present
experiments (see Fig. 11). Also, transverse nonuniformity of the FIW discharge at low
pulse repetition rates is likely to be reduced by reducing high voltage pulse duration (i.e.
increasing the rate of voltage rise on the electrode, dU/dt) and pressure. As discussed in
Ref. [6], this would result in higher peak electric field in the wave, more rapid electron
impact ionization in the volume, and higher wave speed. For example, spatially uniform
FIW discharges in air have been obtained using voltage pulses with 5 ns rise time [20].
Figure 12 shows 4-shot averaged images of positive and negative polarity FIW front in
nitrogen at P = 10 Torr. One can see that, as the pulse repetition rate is increased, the
positive polarity wave gradually transitions from a ‘‘wall-hugging’’ mode to a volumetric
mode. As the pulse repetition rate increases from 100 Hz to 1 kHz, a diffuse luminous
structure appears in the volume of the discharge channel, which occupies nearly the entire
channel at m = 1–4 kHz. At m = 10 kHz, bright regions near the top and bottom walls of
the channel merge with the structure in the volume of the channel. Above 10 kHz, the FIW
discharge remains diffuse and fills the entire channel, while emission intensity near the
centerline appears to decrease. In negative polarity waves at low pulse repetition rates
(below m * 1 kHz, see Fig. 12b), a well-defined bright region can be identified along the
centerline of the discharge channel. Note that the effect of electron accumulation on the
walls is absent if the positive polarity pulse is generated first. In this case, discharge
propagation during the subsequent negative polarity pulse is primarily due to electron
motion in the direction of the wave, which produces pre-ionization ahead of the wave front.
The extent of electron penetration ahead of the wave strongly depends on the electron
energy in the wave front, i.e. on peak reduced electric field in the wave, which is primarily
controlled by the rate of voltage rise on the electrode, dU/dt, and discharge pressure [6].
Basically, high-energy electrons would penetrate further ahead at higher dU/dt and lower
pressures, thus enhancing discharge uniformity. At lower dU/dt and higher pressures, the
negative polarity wave is more likely to be ‘‘constricted’’ to the near-centerline region,
where breakdown near the electrode occurs first. At the present conditions,
dU/dt * 0.4 kV/ns at P = 10 Torr (see Fig. 2), which is significantly lower compared to
dU/dt * 2 kV/ns at P = 8 Torr in Ref. [20]. This may explain qualitatively greater
transverse nonuniformity of the negative polarity wave at the present conditions compared
to the results of Ref. [20]. Diffuse emission in the volume of the negative polarity dis-
charge gradually becomes brighter as the pulse repetition rate is increased, until the
484 Plasma Chem Plasma Process (2012) 32:471–493
123

discharge becomes diffuse and volume-filling above m * 2 kHz (see Fig. 12b). Similar to
the positive polarity discharge, at high pulse repetition rates (4 kHz and above) emission
intensity near the centerline becomes somewhat lower than near the walls.
The results obtained at the same conditions in dry air, shown in Fig. 13, are consistent
with nitrogen results, although transverse nonuniformity of the wave front in this case is
noticeably reduced. Qualitative similarity between FIW discharge behavior in nitrogen and
Fig. 12 ICCD camera images (4-shot averages) of ionization wave front at different pulse repetition rates(indicated in the images), a positive polarity wave, b negative polarity wave. Nitrogen, P = 10 Torr, cameragate 4 ns
Plasma Chem Plasma Process (2012) 32:471–493 485
123

in dry air, which can be seen in Figs. 7, 8, 9, 10 and 12, 13, suggests that electron
attachment and negative ions kinetics are not playing significant role in ionization wave
front development at the present conditions. Indeed, at high peak reduced electric fields
involved, E/N * 300–1,000 Td, electron impact ionization in air dominates dissociative
attachment, O2 ? e ? O ? O- [17]. Also, at low pressures the effect of three-body
attachment, O2 ? e ? M ? O2- ? M, on electron density decay in dry air between the
Fig. 13 ICCD camera images (8-shot averages) of ionization wave front at different pulse repetition rates(indicated in the images), a positive polarity wave, b negative polarity wave. Dry air, P = 10 Torr, cameragate 4 ns
486 Plasma Chem Plasma Process (2012) 32:471–493
123
discharge pulses is not very significant, with the characteristic time of satt *(katt�[O2]�[M])-1 * 100 ls, longer or comparable to the characteristic time for electron–
ion recombination, srec * (bne)-1 * 1–100 ls for ne = 1010–1012 cm-3.
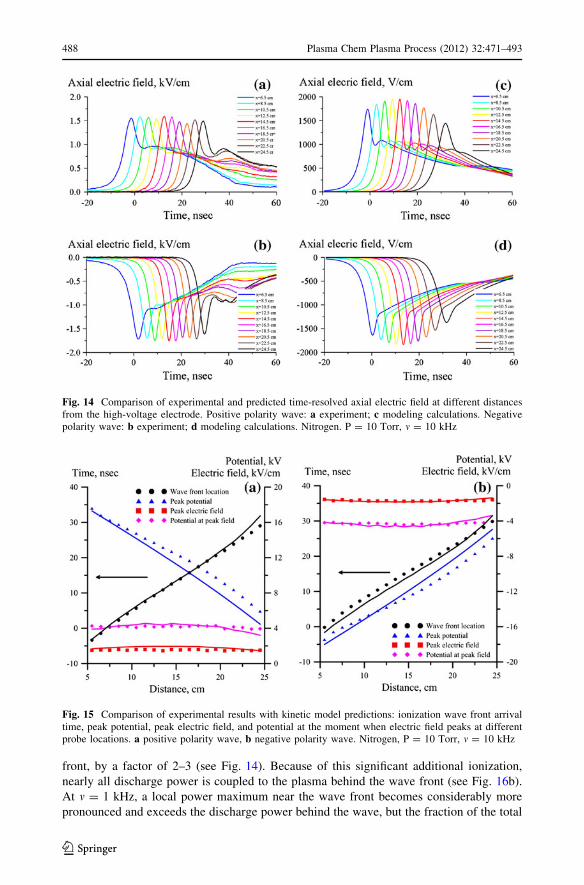
Figure 14 compares experimental time-resolved axial electric field in positive and
negative polarity FIW discharges in nitrogen at P = 10 Torr and m = 10 kHz (a,b) with
kinetic model predictions (c,d). The results are shown at different distances from the high-
voltage electrode, ranging from x = 6.5 to 24.5 cm, with 2 cm increments. At these
conditions, both the positive and the negative polarity waves appear diffuse and volume
filling (see Fig. 12), which justifies the use of a quasi-one-dimensional kinetic model. For
comparison with the experimental data, the predicted electric field plotted in Fig. 14 has
been approximated as a difference between the potentials at two axial locations Dx = 1 cm
apart, i.e. Ei?1/2 & ui-ui?1. At the conditions of Fig. 14, this value is about 5 % lower
than the actual electric field, Ex = -du/dx, calculated by the model. Since Dx & 1/
2�DFWHM of the capacitive probe, this illustrates that at these conditions, the probe mea-
surements underestimate the peak electric field in the wave front by a few percent, due to
the finite spatial resolution of the probe. From Fig. 14, it can be seen that the model
reproduces peak electric field values as well as time dependence of the electric field fairly
well. Note that in the experiment, peak electric field remains nearly the same in the entire
range of distances covered by the capacitive probe, while the model predicts first a gradual
rise of peak electric field followed by a gradual reduction (see Fig. 14). The model also
overpredicts the electric field at long times after the wave arrival.
Figure 15 compares the experimental wave front arrival time, as well as peak potential,
peak electric field, and potential at the moment when the field peaks with the model
predictions, at the conditions of Fig. 14. It can be seen that the predicted peak electric field
and potential at the field peak are in good agreement with the experiment, although the
model somewhat overpredicts the wave amplitude attenuation and underpredicts the wave
speed. The predicted wave speed (i.e. the inverse slope of the wave trajectory in Fig. 15)
increases when the predicted peak electric field is increased, and decreases when the peak
field begins to decay (compare Figs. 14c,d, 15). In particular, significant wave speed
reduction is predicted by the model at large distances from the high voltage electrode (see
Fig. 15). Such wave speed reduction is not detected in the experiment, where both peak
field and the wave speed remain nearly constant throughout most of the discharge channel.
Note that at relatively long voltage pulse durations (*50 FWHM, see Fig. 2) and
relatively low peak discharge currents measured (*10 A), the discharge cell behaves
essentially as an electrostatic load. The estimated inductance of the discharge section,
approximated as a conducting wire of length l = 30 cm and radius of a = 0.5 cm placed
between two conducting planes, h = 3 cm apart from each plane (see Fig. 3), is
L * 0.2 lH. For the peak current through the discharge of I * 10 A, varying over
s * 25 ns, the upper bound estimate of the inductance e.m.f. is of the order of UL * LI/s * 80 V (induced electric field of EL * 3 V/cm), which is negligible compared to the
axial electric field behind the wave front measured in the experiment, a few hundred V/cm
(see Fig. 14).
Figure 16 plots the electron density and the discharge power distributions at the con-
ditions of Figs. 14 and 15. The results for positive and negative polarity waves are shown
by solid and dashed lines, respectively. The distributions are shown for every 5 ns, with the
last output time corresponding to the moment when the applied pulse voltage peaks,
t0 = 18 ns (see Fig. 2). From Fig. 16a, it can be seen that after the wave front has passed,
the electron density continues to increase, by up to an order of magnitude, although the
electric field behind the wave is reduced significantly compared to the peak value in the
Plasma Chem Plasma Process (2012) 32:471–493 487
123
front, by a factor of 2–3 (see Fig. 14). Because of this significant additional ionization,
nearly all discharge power is coupled to the plasma behind the wave front (see Fig. 16b).
At m = 1 kHz, a local power maximum near the wave front becomes considerably more
pronounced and exceeds the discharge power behind the wave, but the fraction of the total
Fig. 14 Comparison of experimental and predicted time-resolved axial electric field at different distancesfrom the high-voltage electrode. Positive polarity wave: a experiment; c modeling calculations. Negativepolarity wave: b experiment; d modeling calculations. Nitrogen. P = 10 Torr, m = 10 kHz
Fig. 15 Comparison of experimental results with kinetic model predictions: ionization wave front arrivaltime, peak potential, peak electric field, and potential at the moment when electric field peaks at differentprobe locations. a positive polarity wave, b negative polarity wave. Nitrogen, P = 10 Torr, m = 10 kHz
488 Plasma Chem Plasma Process (2012) 32:471–493
123
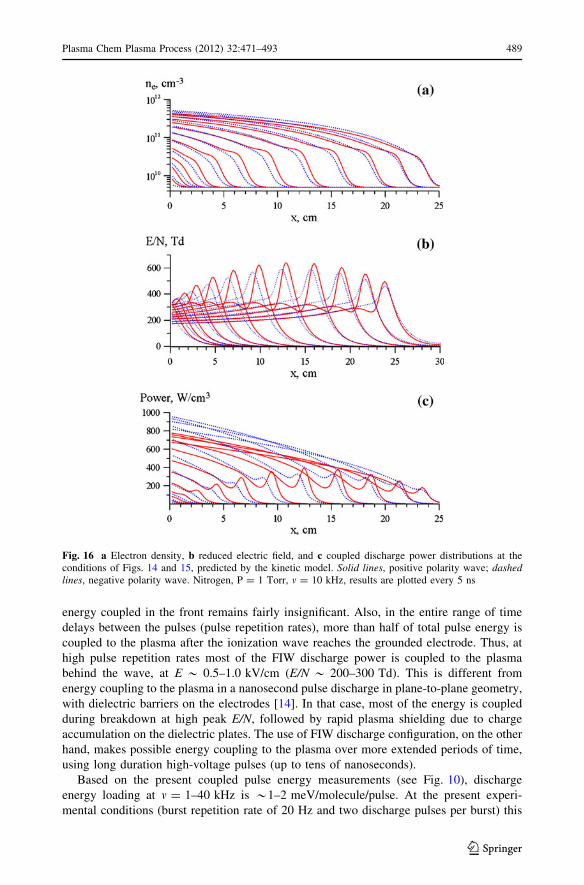
energy coupled in the front remains fairly insignificant. Also, in the entire range of time
delays between the pulses (pulse repetition rates), more than half of total pulse energy is
coupled to the plasma after the ionization wave reaches the grounded electrode. Thus, at
high pulse repetition rates most of the FIW discharge power is coupled to the plasma
behind the wave, at E * 0.5–1.0 kV/cm (E/N * 200–300 Td). This is different from
energy coupling to the plasma in a nanosecond pulse discharge in plane-to-plane geometry,
with dielectric barriers on the electrodes [14]. In that case, most of the energy is coupled
during breakdown at high peak E/N, followed by rapid plasma shielding due to charge
accumulation on the dielectric plates. The use of FIW discharge configuration, on the other
hand, makes possible energy coupling to the plasma over more extended periods of time,
using long duration high-voltage pulses (up to tens of nanoseconds).
Based on the present coupled pulse energy measurements (see Fig. 10), discharge
energy loading at m = 1–40 kHz is *1–2 meV/molecule/pulse. At the present experi-
mental conditions (burst repetition rate of 20 Hz and two discharge pulses per burst) this
Fig. 16 a Electron density, b reduced electric field, and c coupled discharge power distributions at theconditions of Figs. 14 and 15, predicted by the kinetic model. Solid lines, positive polarity wave; dashedlines, negative polarity wave. Nitrogen, P = 1 Torr, m = 10 kHz, results are plotted every 5 ns
Plasma Chem Plasma Process (2012) 32:471–493 489
123

corresponds to the temperature rise of a few degrees above room temperature, if all input
energy is thermalized. The estimated decay time of metastable N2(A3R) molecules gen-
erated in the discharge, mainly due to collisional energy pooling processes, is a few
hundred microseconds. This is approximately two orders of magnitude shorter than time
delay between the discharge bursts (50 ms), such that most of electronically excited
metastables decay between the bursts, suggesting that accumulation of excited species over
multiple bursts is a minor effect. Note that in the present experiments, varying burst
repetition rate from 10 Hz (20 pulses per second) to 40 Hz (80 pulses per second) did not
result in detectable difference in the measured wave speed or peak electric field.
Similarity between parameter distributions in positive and negative polarity waves at
high pulse repetition rates, when the wave does not exhibit significant transverse non-
uniformity (see Fig. 13), is apparent in Figs. 14, 15, 16. The present quasi-one-dimen-
sional, local ionization, hydrodynamic plasma model offers straightforward interpretation
of this behavior. At the present conditions, the ratio of electron drift velocity and wave
speed is fairly low, w/V * 0.05–0.1. Therefore swapping the electric field direction, such
that the electrons move either into the wave our out of the wave, does not affect the wave
dynamics. Indeed, it can be shown that in these two cases the electron density distribution
is a self-similar solution of the following ordinary differential equation [6],
dne
dn¼ mine
V � w; ð13Þ
where n = x?Vt for a wave propagating to the right, and the plus sign is used for the
positive polarity wave. From Eq. (13), it can be seen that changing the polarity would
change the electron density only by a few percent.
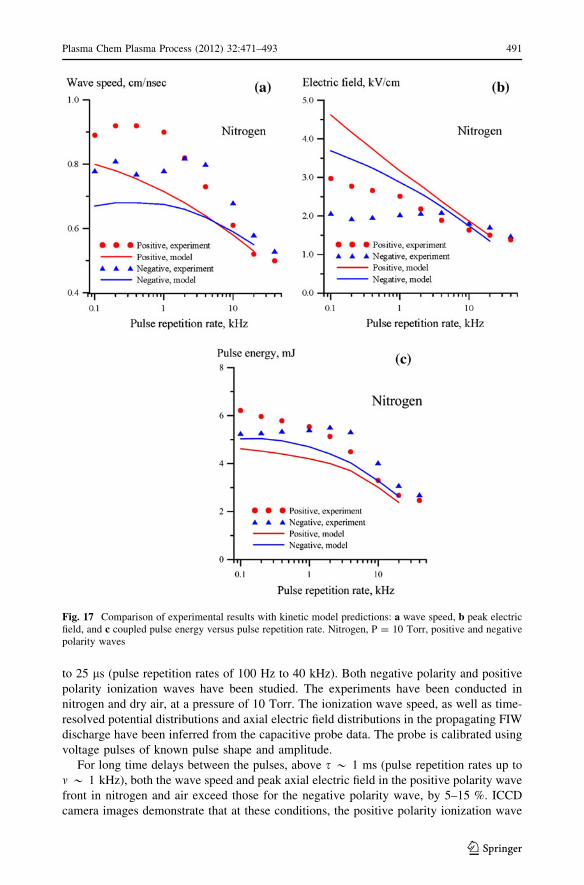
Figure 17 compares experimental wave speed, peak electric field, and coupled pulse
energy in nitrogen with the kinetic model predictions. It can be seen that the model
correctly reproduces the trends of reduction of these parameters as the pulse repetition rate
is increased. However, the model considerably underpredicts peak electric field at low
pulse repetition rates, i.e. at the conditions when the FIW discharge exhibits significant
transverse nonuniformity (see Figs. 12, 13). Analysis of the calculations results shows that
peak electric field reduction in the wave front at high pulse repetition rates is primarily due
to higher residual electron density in the discharge channel, which limits the electric field
by more rapid charge separation in the wave front. This effect is also predicted by the
analytic FIW discharge model developed in our previous work [6]. Reduction of wave
speed and coupled energy at pulse repetition rates higher than a few kHz is mainly due to
slower voltage rise on the electrode at these conditions (dU/dt, see Fig. 2), limited by the
nanosecond pulse generator performance.
Summary
In the present work, fast ionization wave (FIW) discharge propagating along a rectangular
geometry channel/plasma waveguide and operated for short time delays between the pulses
(i.e. at high pulse repetition rates) is studied experimentally and using kinetic modeling.
The repetitive nanosecond pulse discharge in the rectangular cross section channel is
generated using a custom built pulsed plasma generator (peak voltage 10–30 kV, pulse
duration 50–100 ns, rate of voltage rise up to *1 kV/ns), producing a sequence of
alternating polarity high-voltage pulses with time delay between the pulses of s = 10 ms
490 Plasma Chem Plasma Process (2012) 32:471–493
123
to 25 ls (pulse repetition rates of 100 Hz to 40 kHz). Both negative polarity and positive
polarity ionization waves have been studied. The experiments have been conducted in
nitrogen and dry air, at a pressure of 10 Torr. The ionization wave speed, as well as time-
resolved potential distributions and axial electric field distributions in the propagating FIW
discharge have been inferred from the capacitive probe data. The probe is calibrated using
voltage pulses of known pulse shape and amplitude.
For long time delays between the pulses, above s * 1 ms (pulse repetition rates up to
m * 1 kHz), both the wave speed and peak axial electric field in the positive polarity wave
front in nitrogen and air exceed those for the negative polarity wave, by 5–15 %. ICCD
camera images demonstrate that at these conditions, the positive polarity ionization wave
Fig. 17 Comparison of experimental results with kinetic model predictions: a wave speed, b peak electricfield, and c coupled pulse energy versus pulse repetition rate. Nitrogen, P = 10 Torr, positive and negativepolarity waves
Plasma Chem Plasma Process (2012) 32:471–493 491
123

in nitrogen and air propagates along the walls of the discharge channel adjacent to the
waveguide plates, while the negative polarity wave tends to propagate along the centerline
of the channel. For short time delays between the pulses, below s * 0.5–1.0 ms (pulse
repetition rates above m * 1–2 kHz), the positive and the negative polarity waves begin to
‘‘mirror image’’ each other, i.e. polarity dependence of the wave speed and peak field in the
wave front becomes weak. At these conditions, both peak field and electric potential at the
peak field location remains nearly constant along the entire discharge channel, in spite of
significant reduction of peak potential in the wave, by a factor of 2–3. Also, at these
conditions, both positive and negative polarity waves become diffuse and volume-filling,
although emission intensity near the walls of the discharge channel remains higher than
near the channel centerline, especially above *10 kHz.
Wave speed in nitrogen and air remains nearly constant for time delays between the
pulses above s * 1 ms (pulse repetition rate up to m * 1 kHz) and begins to decrease as
time delay between the pulses is reduced further, by up to 30–40 % at s = 25 ls
(m = 40 kHz). Peak electric field in the positive polarity wave front decreases significantly
as the pulse repetition rate is increased, both in nitrogen and in air. Peak electric field
reduction versus pulse repetition rate in negative polarity waves is not as pronounced,
especially in nitrogen. Both in nitrogen and in air, reducing time delay between the pulses
(increasing pulse repetition rate) results in significant reduction of discharge pulse energy
coupled to the plasma, by more than a factor of two.
Comparison of the experimental results in nitrogen with quasi-one-dimensional kinetic
modeling calculations at high pulse repetition rates, *5–40 kHz, shows good agreement,
both for positive and negative polarity waves. At lower pulse repetition rates, *100 Hz–
5 kHz, the model considerably overpredicts peak electric field in the wave front. Kinetic
modeling calculations show that peak electric field reduction as the pulse repetition rate is
increased is mainly due to higher residual electron density in the decaying plasma,
remaining from the previous discharge pulse. Reduction of wave speed and coupled energy
at high pulse repetition rates is primarily due to slower pulse voltage rise, limited by the
nanosecond pulse generator performance. The results of modeling calculations show that at
high pulse repetition rates most of the FIW discharge power is coupled to the plasma
behind the wave, at E/N * 200–300 Td. At these conditions, most of the input discharge
power in molecular gases is spent on electronic excitation and dissociation by electron
impact. This demonstrates significant potential of large volume, high pulse repetition rate
FIW discharges for novel plasma chemical applications.
Acknowledgments This work has been supported by the US Department of Energy Plasma ScienceCenter, by the Department of Physics and Astronomy of the Ruhr-University Bochum, and by the ResearchDepartment ‘‘Plasmas with Complex Interactions’’ of the Ruhr-University Bochum. We would also like tothank Svetalana Starikovskaia for numerous helpful discussions, and Bernd Becker, Frank Kremer, StefanWietholt, and Thomas Zierow for their help with the experimental apparatus.
References
1. Vasilyak LM, Kostyuchenko SV, Kudryavtsev NN, Filyugin IV (1994) Fast ionization waves underelectrical breakdown conditions. Physics-Uspekhi 37:247–269
2. Lagarkov AN, Rutkevich IM (1994) Ionization waves in electric breakdown of gases, Chapter 4.Springer, New York
3. Starikovskaia SM, Anikin NB, Pancheshnyi SV, Zatsepin DV, Starikovskii AYu (2001) Pulsedbreakdown at high overvoltage: development, propagation and energy branching. Plasma Sour SciTechnol 10:344–355
492 Plasma Chem Plasma Process (2012) 32:471–493
123

4. Starikovskaya SM (2006) Plasma assisted ignition and combustion. J Phys D Appl Phys 39:R265–R2995. Starikovskii AY, Anikin NB, Kosarev IN, Mintoussov EI, Nudnova MM, Rakitin AE, Roupassov DV,
Starikovskaia SM, Zhukov VP (2008) Nanosecond-pulsed discharges for plasma-assisted combustionand aerodynamics. J Propuls Power 24:1182–1197
6. Takashima K, Adamovich IV, Xiong Z, Kushner MJ, Starikovskaia S, Czarnetzki U, Luggenholscher D(2011) Experimental and modeling analysis of fast ionization wave discharge propagation in a rect-angular geometry. Phys Plasmas 18(8):083505-1–083505-17
7. Tarasenko VF, Yakovlenko SI (2004) The electron runaway mechanism in dense gases and the pro-duction of high-power subnanosecond electron beams. Physics-Uspekhi 47:887–905
8. Petitpas G, Rollier J-D, Darmon A, Gonzalez-Aguilar J, Metkemeijer R, Fulcheri L (2007) A com-parative study of non-thermal plasma assisted reforming technologies. Int J Hydrogen Energy32:2848–2867
9. Adamovich IV, Lempert WR, Rich JW, Utkin YG (2008) Repetitively pulsed nonequilibrium plasmasfor magnetohydrodynamic flow control and plasma-assisted combustion. J Propuls Power 24(6):1198–1215
10. Adamovich IV, Choi I, Jiang N, Kim J-H, Keshav S, Lempert WR, Mintusov E, Nishihara M, SamimyM, Uddi M (2009) Plasma assisted ignition and high-speed flow control: non-thermal and thermaleffects. Plasma Sour Sci Technol 18(3):034018-1–034018-13
11. Roupassov DV, Nikipelov AA, Nudnova MM, Starikovskii AYu (2009) Flow separation control byplasma actuator with nanosecond pulsed-periodic discharge. AIAA J 47(1):168
12. Nishihara M, Takashima K, Rich JW, Adamovich IV (2011) Mach 5 Bow shock control by a nano-second pulse surface dielectric barrier discharge. Phys Fluids 23(6):066101-1–066101-11
13. Little J, Takashima K, Nishihara M, Adamovich I, Samimy M (2012) Separation control with nano-second pulse driven dielectric barrier discharge plasma actuators. AIAA J 50:350–365
14. Adamovich IV, Nishihara M, Choi I, Uddi M, Lempert WR (2009) Energy coupling to the plasma inrepetitive nanosecond pulse discharges. Phys Plasmas 16(11):113505-1–113505-13
15. Yan H, Gaitonde D (2010) Effect of thermally induced perturbation in supersonic boundary layers. PhysFluids 22(6):064101-1–064101-11
16. Anikin NB, Pancheshnyi SV, Starikovskaia SM, Starikovskii AYu (1998) Breakdown development athigh overvoltage: electric field, electronic levels excitation and electron density. J Phys D Appl Phys31:826–833
17. Raizer YP (1991) Gas discharge physics, Chapters 2,4. Springer, Berlin18. Uddi M, Jiang N, Adamovich IV, Lempert WR (2009) Nitric oxide density measurements in air and air/
fuel nanosecond pulse discharges by laser induced fluorescence. J Phys D Appl Phys 42(7):075205-1–075205-18
19. Hagelaar GJM, Pitchford LC (2005) Solving the Boltzmann Equation to obtain electron transportcoefficients and rate coefficients for fluid models. Plasma Sour Sci Technol 14:722–733
20. Anikin NB, Zavialova NA, Starikovskaia SM, Starikovskii AYu (2008) Nanosecond discharge devel-opment in long tubes. IEEE Trans Plasma Sci 36:902–903
Plasma Chem Plasma Process (2012) 32:471–493 493
123