Embed Size (px)
Citation preview
Christian Albert, Benjamin Burkhard, Sabrina Daube, Katharina Dietrich, Barbara Engels, Jakob Frommer, Martin Götzl,
Adrienne Grêt-Regamey, Beate Job-Hoben, Roger Keller, Stefan Marzelli, Christoph Moning, Felix Müller, Sven-Erik Rabe, Irene Ring,
Elisabeth Schwaiger, Burkhard Schweppe-Kraft and Henry Wüstemann
Development of National Indicators for Ecosystem Services
Recommendations for Germany Discussion Paper
Foto / Grafik
BfN-Skripten 411 2015

Development of National Indicators for Ecosystem Services
Recommendations for Germany Discussion Paper
Christian Albert Benjamin Burkhard
Sabrina Daube Katharina Dietrich
Barbara Engels Jakob Frommer
Martin Götzl Adrienne Grêt-Regamey
Beate Job-Hoben Roger Keller
Stefan Marzelli Christoph Moning,
Felix Müller Sven-Erik Rabe
Irene Ring Elisabeth Schwaiger
Burkhard Schweppe-Kraft Henry Wüstemann
Cover picture: Upper Reaches (B. Schweppe-Kraft)
Authors‘ addresses Burkhard Schweppe-Kraft Katharina Dietrich Barbara Engels Beate Job-Hoben
Federal Agency for Nature Conservation, Competence Centre Ecosystem Services and Natural Capital, Bonn
Stefan Marzelli Sabrina Daube Christoph Moning
Ifuplan – Institute for Environmental Planning and Spatial Development, Munich
Adrienne Grêt-Regamey Sven Erik Rabe
ETH Zurich, Institute for Landscape and Spatial Development
Jakob Frommer Umweltbundesamt, Dessau-Roßlau Roger Keller Federal Office for the Environment (FOEN), Bern Martin Götzl Elisabeth Schwaiger
Environment Agency Austria, Vienna
Christian Albert Leibniz Universität Hannover, Institute for Environmental Planning and Helmholtz Centre for Environmental Research (UFZ), Leipzig
Felix Müller Benjamin Burkhard
Kiel University, Department Ecosystem Management
Irene Ring Helmholtz Centre for Environmental Research (UFZ), Leipzig Henry Wüstemann Technische Universität Berlin, Institute for Landscape Architecture and
Environmental Planning, Landscape Economics
Scientific Supervision: Dr. Burkhard Schweppe-Kraft Division I 2.1 “Legal Affairs, Economics and Ecologically Sound Regional
Development”
English Translation: Amanda Warne-Lorscheider E-Mail: [email protected]
This publication is included in the literature database “DNL-online” (www.dnl-online.de)
BfN-Skripten are not available in book trade. A pdf version can be downloaded from the internet at: http://www.bfn.de/0502_skripten.html.
Publisher: Bundesamt für Naturschutz (BfN) Federal Agency for Nature Conservation Konstantinstrasse 110 53179 Bonn, Germany URL: http://www.bfn.de
The publisher takes no guarantee for correctness, details and completeness of statements and views in this report as well as no guarantee for respecting private rights of third parties. Views expressed in this publica-tion are those of the authors and do not necessarily represent those of the publisher.
This work with all its parts is protected by copyright. Any use beyond the strict limits of the copyright law without the con-sent of the publisher is inadmissible and punishable.
Reprint, as well as in extracts, only with permission of Federal Agency for Nature Conservation.
Printed by the printing office of the Federal Ministry for Environment, Nature Conservation, Building and Nuclear Safety
Printed on 100% recycled paper.
ISBN 978-3-89624-146-7
Bonn, Germany 2015
Outline
Preliminary remarks on the status of the present paper 4 Acknowledgements 4 1 Introduction 5
- Mapping and Assessment of ecosystem services in the framework of the implementation of the European Biodiversity Strategy 5
- Development of approaches for nationwide assessment of ecosystem services in Germany 5
- Supplement to landscape planning at the level of states, regions and municipalities 7
2 Proposals for indicators of ecosystem services at the federal level 8 2.1 Indicators of provisioning services 8 2.1.1 Natural fertility of arable soils – agricultural plant production 12 2.1.2 Proportion of grasslands in agricultural areas – animal production 15 2.1.3 Timber stocks – timber production 16 2.2 Indicators of regulation services 18 2.2.1 Self-cleaning potential of waterways 18 2.2.2 Protection of groundwater quality 21 2.2.3 Erosion mitigation 24 2.2.4 Mitigation of flood hazard by water retention in floodplains 27 2.2.5 Pollination and biological pest control – natural and semi-natural areas and small
structures in agricultural landscapes 30 2.2.6 Reduction of greenhouse gas emissions (in particular rewetting of peat soils) 32 2.2.7 Microclimatic buffering and balancing features and air filter effect of urban green
areas 33 2.3 Indicators of cultural ecosystem services 35
- Problems related to a lack of common definitions 35 - Initial focus on recreation combined with nature experience an aesthetics 38
2.3.1 Suitability of the countryside for recreation 37 2.3.2 Suitability of urban areas for recreation 40
- Supplement through a representative sample set for supply and demand of recreational areas 41
3. Notes on selected questions –information regarding the further development of indicators 41
3.1 Requirements on the accuracy of collection and analysis: warning system or contribu-tion to a welfare index 41
3.2 Indicators for conditions and/or development opportunities of ecosystem services 42 3.3 Consideration of supply and demand 42 3.4 Current, future or potential services 43 3.5 Differentiating between ecosystem service and product 43 3.6 Intermediate and final ecosystem services - avoid double counting 44 3.7 Use of simple or complex data modelling 44 3.8 Previously unrecognized ecosystem services 45 Literature / Sources 48
3
Preliminary remarks on the status of this paper
The initial implementation of the requirements and objectives of Target 2, Action 5 of the Eu-ropean Biodiversity Strategy: “Mapping and Assessment of Ecosystems and their Services” by 2014 is the aim of the recommendations formulated in this paper.
Within the scope of a research project beginning at the end of 2011 and on behalf of the German Federal Agency for Nature Conservation, the foundation that should allow for the implementation of Target 2, Action 5 in Germany at the national level has been developed (Ifuplan et al. 2014). Based on this foundation, the following text presents the proposed indi-cators and cartographic representations (mapping) to be used nationwide.
This proposal does not yet take into account the ecosystem services of seas and coasts. A systematic approach has also not yet been established for the description of the state of the ecosystems. Both tasks must be undertaken in the course of the implementation.
This paper is intended as a technical basis for further discussion on the implementation of Target 2, Action 5 at the national and European levels.
As this is a “work in progress”, comments and proposed amendments will be gladly accepted until such time as a decision on the first set of indicators has been reached. According to the current schedule, this should not be before the end of 2015.
Comments on this discussion paper are therefore welcome.
BfN, June 2015
Acknowledgements
The authors would like to thank all of those who contributed technical and conceptual advice, questions and discussion to the recommendations presented here. Special thanks go out to our colleagues from the Centre for Natural Capital (Kompetenzzentrum Naturkapital) at the Federal Agency for Nature Conservation, and the Federal Environment Agency, Dessau-Roßlau, without whom this discussion paper would not have reached its present quality.
4
1 Introduction
Mapping and assessment of ecosystem services in scope of the implementation of the European Biodiversity Strategy The term ecosystem services, used worldwide since the global Millennium Ecosystem As-sessment (MA 2005) and the international TEEB study (The Economics of Ecosystems and Biodiversity) (TEEB 2010), refers to those benefits provided to people by ecosystems. As a rule, the distinction is usually: provisioning services (e.g. provision of food, wood, drinking water), regulation services (e.g. flood protection by water retention in floodplains, self-cleaning function of waters, erosion control function of woody plants, insect pollination) and cultural services (e.g. landscape aesthetics, importance of landscape elements for the feel-ing of well-being, the function of ecosystems and landscapes for the purpose of recreation). The MA and the TEEB study have shown that these services are at risk world-wide and that their prolonged decline also results in economic disadvantages.
Often, the decline of these services is due to the one-sided exploitation of individual nature services without consideration of their ecological interdependencies, together with the simul-taneous loss of wild plants and animals and their habitats. For this reason, the conservation of ecosystem services has been an explicit objective of the Convention on Biological Diversi-ty since 2010 (CBD 2010). The European Union has included the goal of ecosystem services conservation in the European Biodiversity Strategy, which is a part of the overlapping flag-ship initiative “a resource-efficient Europe” (European Commission 2011a and b). Target 2, Action 5 of the EU Biodiversity Strategy calls upon the EU Member States to map and as-sess the state of ecosystems and their services in their national territory by 2014, assess the economic value of such services, and promote the integration of these values into account-ing and reporting systems at the EU and national levels by 2020.
Development of approaches for nationwide assessment of ecosystem services in Germany Within the scope of a research project beginning at the end of 2011 and on behalf of the German Federal Agency for Nature Conservation, the foundation that should allow for the implementation of Target 2, Action 5 in Germany at the national level has been developed (Ifuplan et al. 2014). Using this groundwork the following text makes recommendations on a first set of national indicators and cartographic representations which can be used to begin with the monitoring and assessment of ecosystem services in Germany on the national level.
During the ecosystem services indicator development process, the Federal Agency for Na-ture Conservation regularly consults with the Swiss Office for the Environment (FOEN) and the Austrian Federal Agency (UBA), both of which have already developed indicators for ecosystem services (Staub et al. 2011, Götzl et al. 2011). Representatives of UBA and FOEN have, within the framework of a project advisory group, contributed to the development of this set of indicators (see Chapter 2). The feedback from UBA and FOEN are reflected in particular in Chapter 3 of the present recommendations. Jointly formulated perspectives dealing with an approach to ecosystem services was also recently published in Natur- und Landschaft (Keller, Schweppe-Kraft, Schwarzl 2014). Switzerland is currently reviewing which data are available in order for them to assess and map the inventory of ecosystem services developed there.
The ecosystem services of seas and coasts are not yet included in the present proposal. Furthermore, due to the lack of spatially-specific data available, the condition of the ecosys-
5
tems has not yet been systematically taken into account in the assessment of their services. The latter can be justified in the assessment of ecosystem services, if these services are highly dependent on the particular ecosystem type (e.g. forest or field), but less so for the particular expression of the ecosystem type (e.g. deciduous or coniferous forest). The indica-tors could possibly be further improved through the additional inclusion of condition data pre-viously not taken into account (see 3.1). Apart from this, according to Action 5, the assess-ment of the condition of the ecosystems is a task which is yet to be achieved.
The definition and classification of ecosystem services – as agreed upon by the MAES Working Group of the Directorate General – Environment (MAES et al. 2013) – is based on categories in the Common International Classification of Ecosystem Services catalogue (CICES, Haines-Young & Potschin 2013). Substantiated deviations are made at certain points, for instance in the assessment of provisioning services (see 2.1.1 and 3.1.5).
It is generally recommended not only to include the current ecosystem services, which arise out of the current demand, including public demand, but also the potential (capacity) or ra-ther the supply of services available (Schweppe-Kraft 2013, Burkhard et al. 2014, Von Haaren et al. 2014). The current productivity may also increase due to increasing burden and demand (e.g. higher nitrate removal from a river due to additional nitrate input, see also 3.3). Today's high productivity can also lead to low productivity in the future (see 2.2.2 and 3.4). An analysis of the development of the capability and supply of ecosystem services is equally as important to the politics of preserving nature’s services (and capacity, potential) as the analyses of the use.
In addition, for some ecosystem services a spatially differentiated mapping of supply and demand have a high informative value, whereas for other ecosystem services, this is unnec-essary. Because of the diminishing costs for transportation services, the place of production of many provisioning services in particular, is today becoming economically less and less relevant to their value. If one considers the external effects in addition to the operational costs of transportation, the spatially-close intertwined relationships between supply and de-mand gains a greater importance, also economically. Currently, however, agriculturally-produced goods in particular are, for the most part – at least in the industrialized countries – produced for a global market. The market prices of these goods are therefore largely inde-pendent of regional differences in demand (e.g. settlement areas versus rural areas). For many regulation and cultural services, and also for provisioning services whose price is largely driven by transportation costs, such as water, for example, the value is strongly de-pendent upon whether or not a high demand at the place of supply exists, which is targeted to this specific local supply. An example of a corresponding regulation service is water reten-tion in floodplains. Their importance for flood protection depends specifically on the type and intensity of the land use of the area whose protection is enhanced by the increased water retention in the floodplain. If these areas are densely populated, then the “demand” for water retention in the area to be protected is high. If the area is not occupied or used, then a de-mand for water retention does not exist. It is similar with the erosion mitigation effects of hedges, which are needed especially on those agricultural lands which are highly vulnerable to erosion. Clean groundwater should of course be protected everywhere; fact is, however, that the protection from contamination is of utmost importance where the water is used, or will be used in the future, for drinking water. It is therefore proposed that, for ecosystem ser-vices with a corresponding, unique spatial demand, to contrast the assessment of the supply with a spatially differentiated indicator for the demand. In this way it can be made clear, in which areas the capacity of ecosystems are of particular or of lesser importance, due to dif-ferences in demand (see also 3.3).
6
Where the lack of data available makes the direct assessment of the current services difficult or even impossible, juxtaposition of the often more easily assessable spatial supply with the specific spatial demand targeted to this supply can also be used as a basis to assess proxies for the intensity of current use. An example would be the assessment of recreation services through a comparison of the suitability for recreation with, for instance, the population density as an indicator of the demand for recreation in each area.
Due to the fact that, for some ecosystem services listed in the CICES catalogue, there is no need (at least at the national level) for political intervention, no indicators have been devel-oped for these services. The corresponding ecosystem services are either practically non-existent in Germany, have only a very minor role or are not at risk (see, among others, 2.1 and 3.8). Within the European coordination process it should be clarified whether the addi-tion of these services is required to ensure a harmonized implementation of Action 5 on a European level.
Supplement to landscape planning at the level of states, regions and municipalities German is a federal state in which major decisions are taken at the sub-national level by the states and the municipalities. In the development of national indicators for ecosystem ser-vices for the implementation of Action 5 of the European Biodiversity Strategy, this must be taken into consideration. The national level has, therefore, only indirect or informal influence on many decisions that directly or indirectly relate to ecosystem services, for example in the context of conservation planning, the agricultural subsidy policy, land use planning or the wa-ter maintenance and development.
In Germany, a landscape planning system (BNatSchG, §§8-12) with the objective of main-taining the performance and operability of nature and the usability and development of natu-ral resources has existed on the level of the states, the counties and the municipalities since 1976. This means that many of the tasks that are associated with the implementation of Ac-tion 5 at the national and European levels are already being performed at the sub-national level via this planning system. However, the landscape plans vary widely from one another both in their time points and survey periods. They do not, therefore, currently offer a common basis for a national collection and assessment of ecosystem services.
The nationwide collection and assessment of ecosystem services in the framework of this first implementation must therefore be performed largely independently of the landscape planning of the states, regions, counties and municipalities. The national collection and eval-uation should be such that it can provide additional information and guidance from a broader perspective for the use in smaller-scale planning. The accuracy of the data should be based on the requirements of the superordinate objective and do not necessarily need to have the same level of detail that is necessary to meet specific planning decisions on the smaller-scale, for instance in deciding the optimal position for infrastructure or settlement develop-ment. The proposed indicators are relatively coarsely classified (see 3.1), but they are likely to be useful in the multi-stage nature of the German planning system, as a first approach for a nationwide detection of the development trends of ecosystem services.
It is hoped and expected that the national and sub-national approaches to evaluation and assessment of ecosystem services will, over the long term, grow increasingly similar to each other.
7
2 Proposals for indicators of ecosystem services at the federal level
The purpose of the following recommendations is an initial implementation of the require-ments and objectives of Action 5 of the European Biodiversity Strategy. They are based on the proposals developed by the MAES Working Group for the implementation of Action 5 (Maes et al. 2013 and 2014), but are adapted to the specific environmental, socio-economic and institutional conditions in Germany (see Chapters 1 and 3.8). Because the first imple-mentation of Action 5 was expected to take place in 2014, mainly the data that is already available or can be synthesized from existing data is being used. This approach necessarily involves some compromises in accuracy. It should be noted that in Target 2, Action 5 it is not the exact magnitude of the ecosystem service that is captured, but rather the changes that are in the foreground. Therefore, the methods and data used must firstly be reviewed in or-der to see if they reflect changes in ecosystem services over time with reasonably reliability. With increasing data availability and with increasing knowledge of the variety of existing in-ternational and national research on the detection and assessment of ecosystem services, it is possible to develop the indicators in terms of their significance and accuracy.
The authors and the Federal Agency for Nature Conservation consider this proposal a tech-nical / expert basis for further discussion on the implementation of Target 2, Action 5 of the European Biodiversity Strategy at the national and European levels. As the process of im-plementing Action 5 continues it will become apparent which indicators are of particular im-portance to administrative and political decision-making processes, if important indicators are still missing, whether, from a European perspective, indicators should be supplemented and which indicators urgently require further development of their content.
For each of the following indicators, a comprehensive quantitative metric at the federal level, as well as a cartographic representation of indicator value for different regions, is planned. The exact definitions of some of the proposed indicators are still flexible. The maps shown are therefore primarily to be understood as a first illustration. They are not yet fully reviewed and may in some cases contain errors. To allow for a continuous monitoring of the develop-ment, indicators and cartographic representations should be able to be updated at regular intervals. Table 1 gives an overview of the proposed indicators which will be explained in more detail below.
8
2.1 Indicators of provisioning services The intensive use of provisioning services often leads to a loss of biodiversity (MA 2005). Presenting indicators for provisioning services in the context of a set of indicators for the im-plementation of the European Biodiversity Strategy could also lead to the misconception that the use of nature for agricultural, forestry and fishing purposes is an objective that, as part of the conservation strategies, should be actively pursued on equal footing with the conserva-tion of biological diversity. This impression could be avoided if one would exclude the eco-system services in question from the implementation of Action 5. An alternative solution for terrestrial ecosystems would be to represent the preservation of agricultural and forestry ar-eas using an indicator that summatively measures the potential for agricultural and forestry use by assessing the degree of the changes to non-populated areas. One such indicator (“land use”) is already part of the German Biodiversity Strategy (BMUB 2013). A still further alternative in the area of provisioning services would be to consider the intensity of use of these services instead of the service provided by nature, or the stress factors for biodiversity and other ecosystem services that result from this intensity. Such indicators would be, for instance, nitrate surpluses in agriculture, narrow crop rotations or a purely income-oriented tree species selection.
If it is decided that, despite these concerns, indicators for ecosystem services in the area of provisioning services should still be included, then the following parameters could be used:
- The natural fertility of arable soils as an indicator for the contribution of the ecosystem to agricultural plant production,
- The proportion of grasslands in agricultural areas as a sub-indicator for animal production,
- The supply of wood in the forest as well as logging as indicators for the provision and use of wood products.
An indicator for the contribution of ecosystems to the quantitative supply of drinking water and water for other uses (groundwater recharge) was developed. Adding this indicator to the indicator set could also be dispensed with. Germany is well equipped with regard to water availability versus consumption. Only 17.6% of the amount of available water is used, with water consumption showing a downward trend (BDEW 2013). Problems remain with regards to the quality of untreated water, particularly by impacts through contamination from the agri-cultural lands. The groundwater quality and the interaction between different ecosystem uses (including agriculture, grassland, forest, settlements) and natural conditions, such as soil and geological layers in the protection of groundwater, are covered by indicators in the area of regulatory services.
For various reasons, indicators for collectible products (mushrooms, berries etc.), commer-cial and recreational fishing in fresh water ecosystems and for fish production in aquaculture have not been developed (see Chapter 3.8).
9
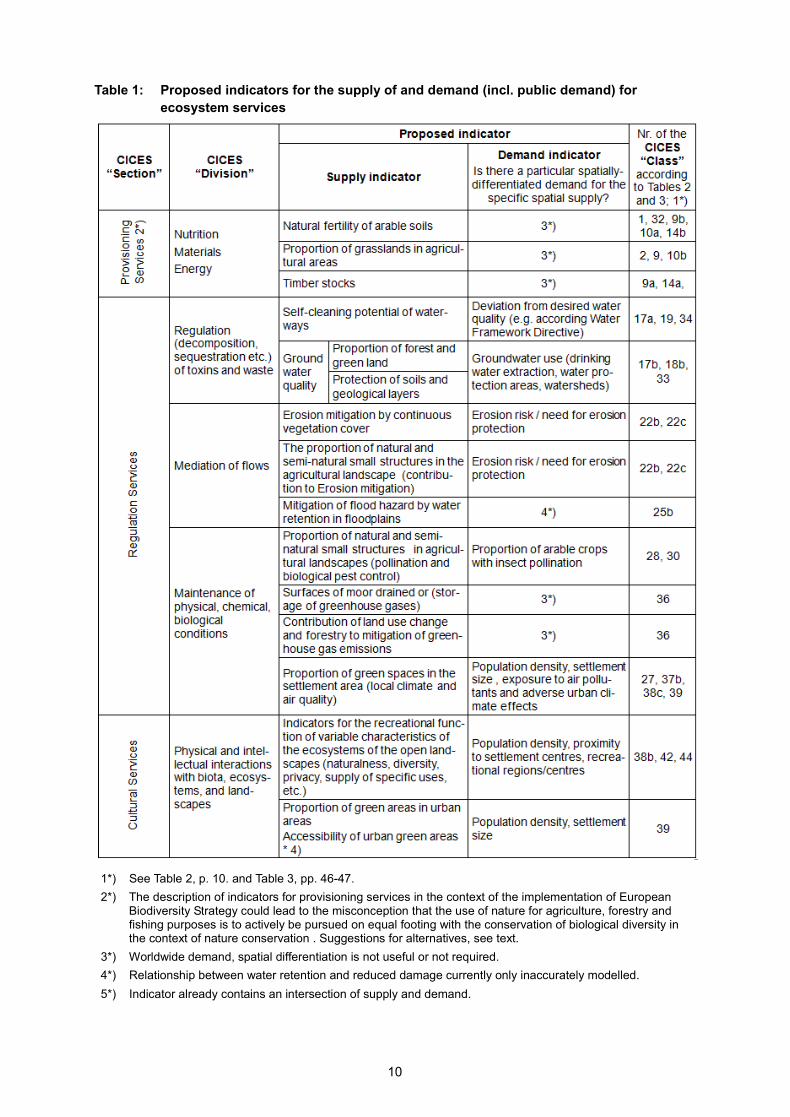
Table 1: Proposed indicators for the supply of and demand (incl. public demand) for ecosystem services
1*) See Table 2, p. 10. and Table 3, pp. 46-47. 2*) The description of indicators for provisioning services in the context of the implementation of European
Biodiversity Strategy could lead to the misconception that the use of nature for agriculture, forestry and fishing purposes is to actively be pursued on equal footing with the conservation of biological diversity in the context of nature conservation . Suggestions for alternatives, see text.
3*) Worldwide demand, spatial differentiation is not useful or not required. 4*) Relationship between water retention and reduced damage currently only inaccurately modelled. 5*) Indicator already contains an intersection of supply and demand.
10
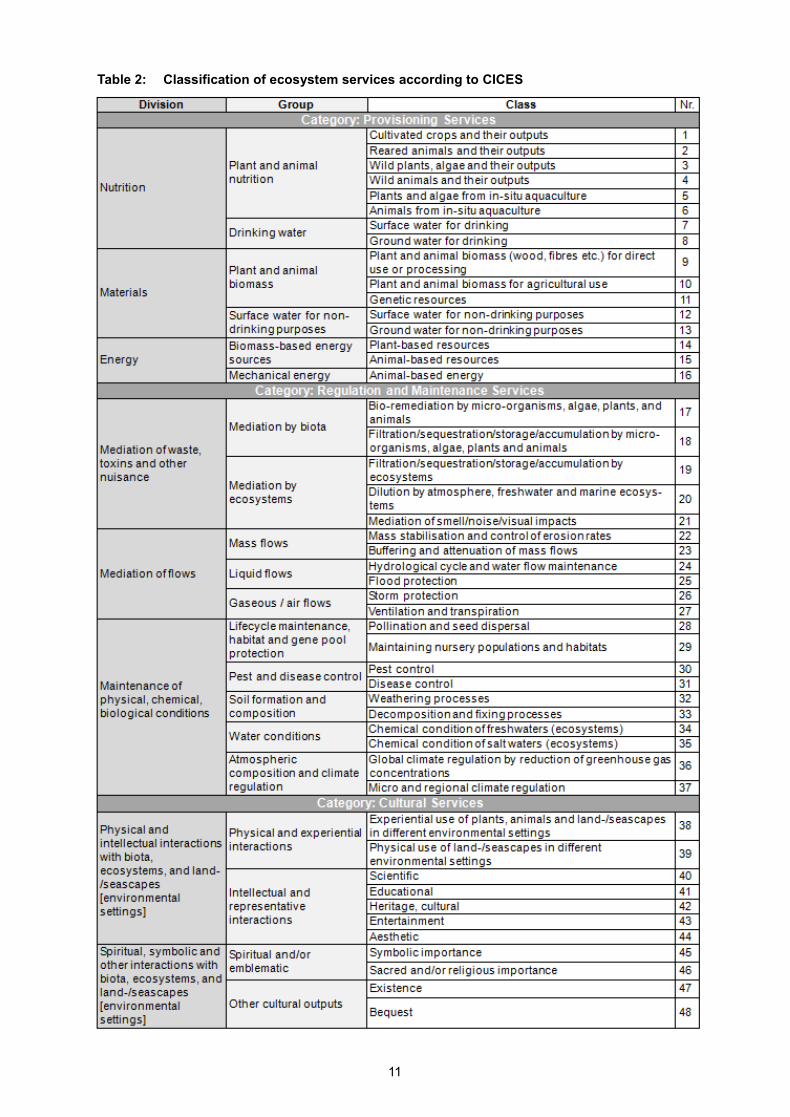
Table 2: Classification of ecosystem services according to CICES
11
2.1.1 Natural fertility of arable soils – agricultural plant production
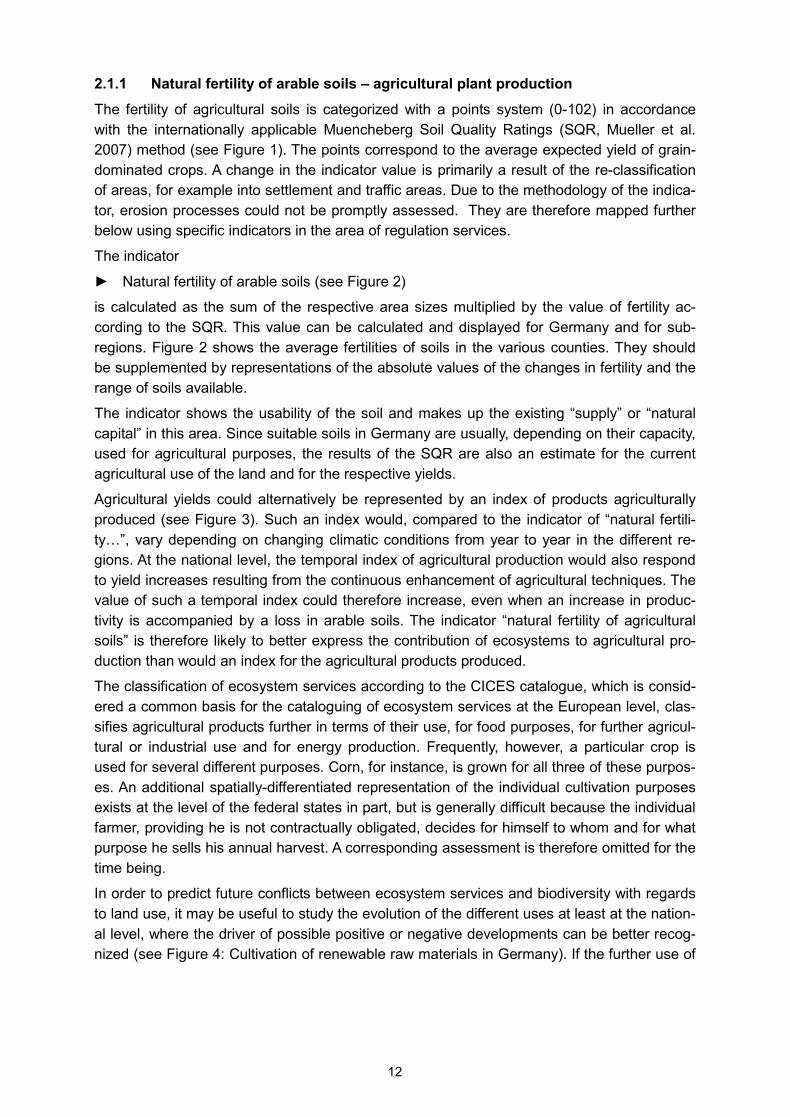
The fertility of agricultural soils is categorized with a points system (0-102) in accordance with the internationally applicable Muencheberg Soil Quality Ratings (SQR, Mueller et al. 2007) method (see Figure 1). The points correspond to the average expected yield of grain-dominated crops. A change in the indicator value is primarily a result of the re-classification of areas, for example into settlement and traffic areas. Due to the methodology of the indica-tor, erosion processes could not be promptly assessed. They are therefore mapped further below using specific indicators in the area of regulation services.
The indicator
► Natural fertility of arable soils (see Figure 2)
is calculated as the sum of the respective area sizes multiplied by the value of fertility ac-cording to the SQR. This value can be calculated and displayed for Germany and for sub-regions. Figure 2 shows the average fertilities of soils in the various counties. They should be supplemented by representations of the absolute values of the changes in fertility and the range of soils available.
The indicator shows the usability of the soil and makes up the existing “supply” or “natural capital” in this area. Since suitable soils in Germany are usually, depending on their capacity, used for agricultural purposes, the results of the SQR are also an estimate for the current agricultural use of the land and for the respective yields.
Agricultural yields could alternatively be represented by an index of products agriculturally produced (see Figure 3). Such an index would, compared to the indicator of “natural fertili-ty…”, vary depending on changing climatic conditions from year to year in the different re-gions. At the national level, the temporal index of agricultural production would also respond to yield increases resulting from the continuous enhancement of agricultural techniques. The value of such a temporal index could therefore increase, even when an increase in produc-tivity is accompanied by a loss in arable soils. The indicator “natural fertility of agricultural soils” is therefore likely to better express the contribution of ecosystems to agricultural pro-duction than would an index for the agricultural products produced.
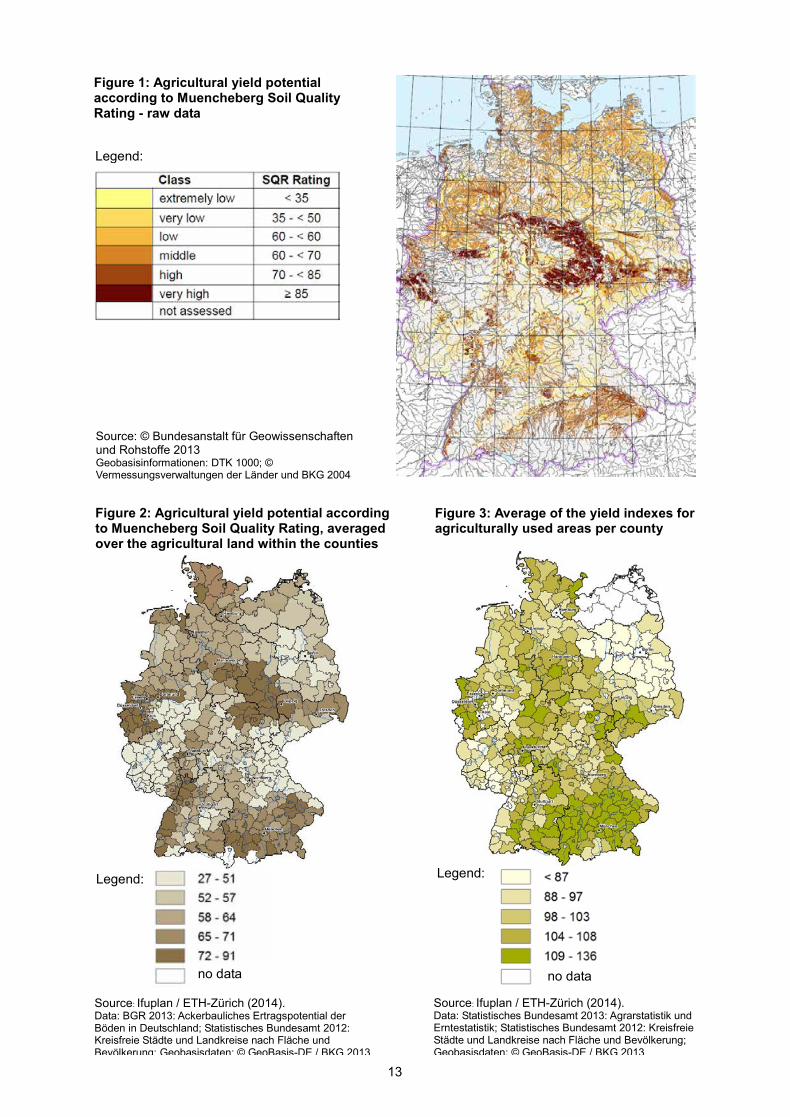
The classification of ecosystem services according to the CICES catalogue, which is consid-ered a common basis for the cataloguing of ecosystem services at the European level, clas-sifies agricultural products further in terms of their use, for food purposes, for further agricul-tural or industrial use and for energy production. Frequently, however, a particular crop is used for several different purposes. Corn, for instance, is grown for all three of these purpos-es. An additional spatially-differentiated representation of the individual cultivation purposes exists at the level of the federal states in part, but is generally difficult because the individual farmer, providing he is not contractually obligated, decides for himself to whom and for what purpose he sells his annual harvest. A corresponding assessment is therefore omitted for the time being.
In order to predict future conflicts between ecosystem services and biodiversity with regards to land use, it may be useful to study the evolution of the different uses at least at the nation-al level, where the driver of possible positive or negative developments can be better recog-nized (see Figure 4: Cultivation of renewable raw materials in Germany). If the further use of
12
Legend:
Figure 3: Average of the yield indexes for agriculturally used areas per county
Source: Ifuplan / ETH-Zürich (2014). Data: Statistisches Bundesamt 2013: Agrarstatistik und Erntestatistik; Statistisches Bundesamt 2012: Kreisfreie Städte und Landkreise nach Fläche und Bevölkerung; Geobasisdaten: © GeoBasis-DE / BKG 2013
no data
Figure 1: Agricultural yield potential according to Muencheberg Soil Quality Rating - raw data
Legend:
Source: © Bundesanstalt für Geowissenschaften und Rohstoffe 2013 Geobasisinformationen: DTK 1000; © Vermessungsverwaltungen der Länder und BKG 2004
Legend:
Figure 2: Agricultural yield potential according to Muencheberg Soil Quality Rating, averaged over the agricultural land within the counties
Source: Ifuplan / ETH-Zürich (2014). Data: BGR 2013: Ackerbauliches Ertragspotential der Böden in Deutschland; Statistisches Bundesamt 2012: Kreisfreie Städte und Landkreise nach Fläche und Bevölkerung; Geobasisdaten: © GeoBasis-DE / BKG 2013
no data
13
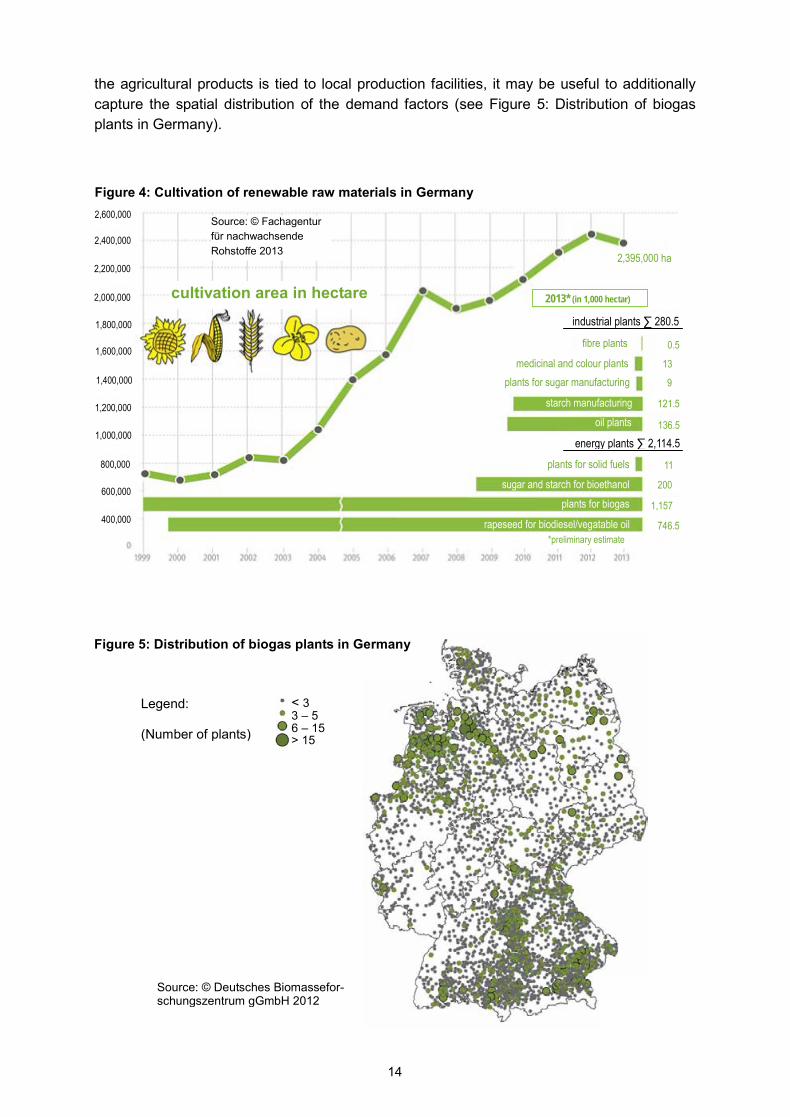
the agricultural products is tied to local production facilities, it may be useful to additionally capture the spatial distribution of the demand factors (see Figure 5: Distribution of biogas plants in Germany).
Figure 4: Cultivation of renewable raw materials in Germany
Source: © Fachagentur für nachwachsende Rohstoffe 2013
cultivation area in hectare
fibre plants
medicinal and colour plants plants for sugar manufacturing
0.5
13
9
121.5
136.5
11
200
1,157
746.5 *preliminary estimate
starch manufacturing oil plants
sugar and starch for bioethanol plants for biogas
rapeseed for biodiesel/vegatable oil
plants for solid fuels
2013* (in 1,000 hectar)
2,395,000 ha
industrial plants ∑ 280.5
energy plants ∑ 2,114.5
2,600,000
2,400,000
2,200,000
2,000,000
1,800,000
1,600,000
1,400,000
1,200,000
1,000,000
800,000
600,000
400,000
Legend: (Number of plants)
Figure 5: Distribution of biogas plants in Germany
Source: © Deutsches Biomassefor-schungszentrum gGmbH 2012
< 3 3 – 5 6 – 15 > 15
14
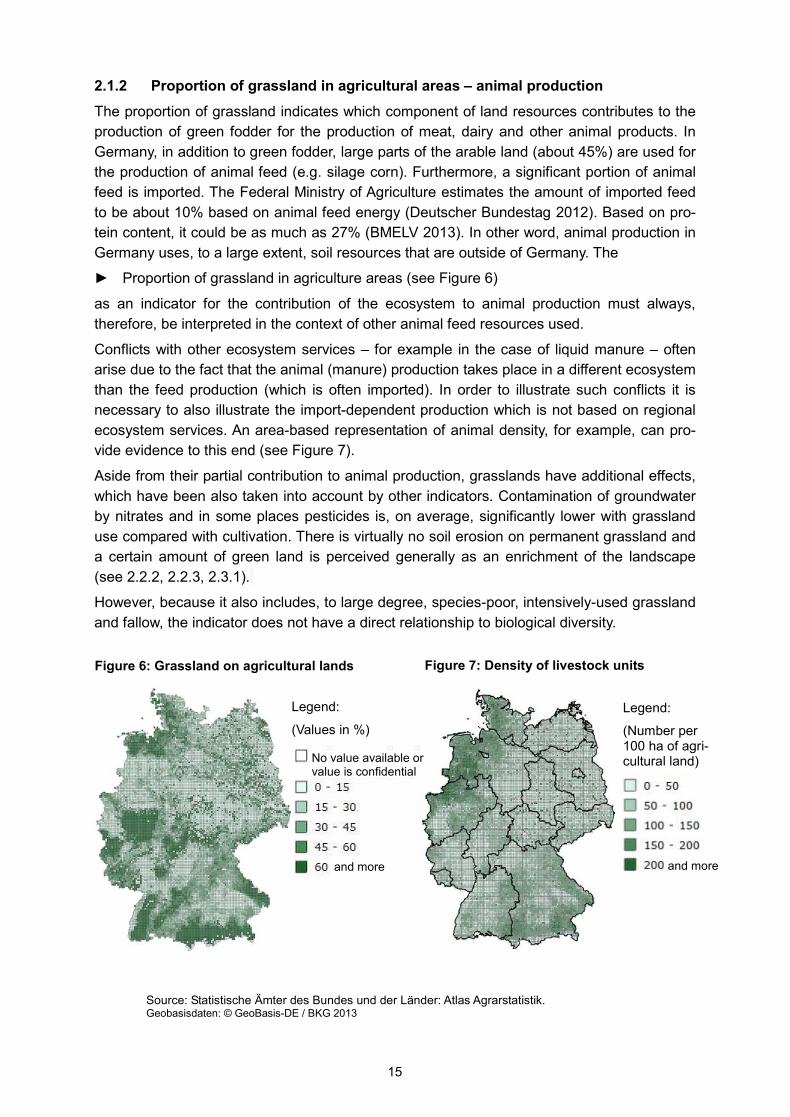
2.1.2 Proportion of grassland in agricultural areas – animal production
The proportion of grassland indicates which component of land resources contributes to the production of green fodder for the production of meat, dairy and other animal products. In Germany, in addition to green fodder, large parts of the arable land (about 45%) are used for the production of animal feed (e.g. silage corn). Furthermore, a significant portion of animal feed is imported. The Federal Ministry of Agriculture estimates the amount of imported feed to be about 10% based on animal feed energy (Deutscher Bundestag 2012). Based on pro-tein content, it could be as much as 27% (BMELV 2013). In other word, animal production in Germany uses, to a large extent, soil resources that are outside of Germany. The
► Proportion of grassland in agriculture areas (see Figure 6)
as an indicator for the contribution of the ecosystem to animal production must always, therefore, be interpreted in the context of other animal feed resources used.
Conflicts with other ecosystem services – for example in the case of liquid manure – often arise due to the fact that the animal (manure) production takes place in a different ecosystem than the feed production (which is often imported). In order to illustrate such conflicts it is necessary to also illustrate the import-dependent production which is not based on regional ecosystem services. An area-based representation of animal density, for example, can pro-vide evidence to this end (see Figure 7).
Aside from their partial contribution to animal production, grasslands have additional effects, which have been also taken into account by other indicators. Contamination of groundwater by nitrates and in some places pesticides is, on average, significantly lower with grassland use compared with cultivation. There is virtually no soil erosion on permanent grassland and a certain amount of green land is perceived generally as an enrichment of the landscape (see 2.2.2, 2.2.3, 2.3.1).
However, because it also includes, to large degree, species-poor, intensively-used grassland and fallow, the indicator does not have a direct relationship to biological diversity.
Legend:
(Values in %) Legend:
(Number per 100 ha of agri-cultural land)
Figure 7: Density of livestock units Figure 6: Grassland on agricultural lands
No value available or value is confidential
and more
Source: Statistische Ämter des Bundes und der Länder: Atlas Agrarstatistik. Geobasisdaten: © GeoBasis-DE / BKG 2013
and more
15
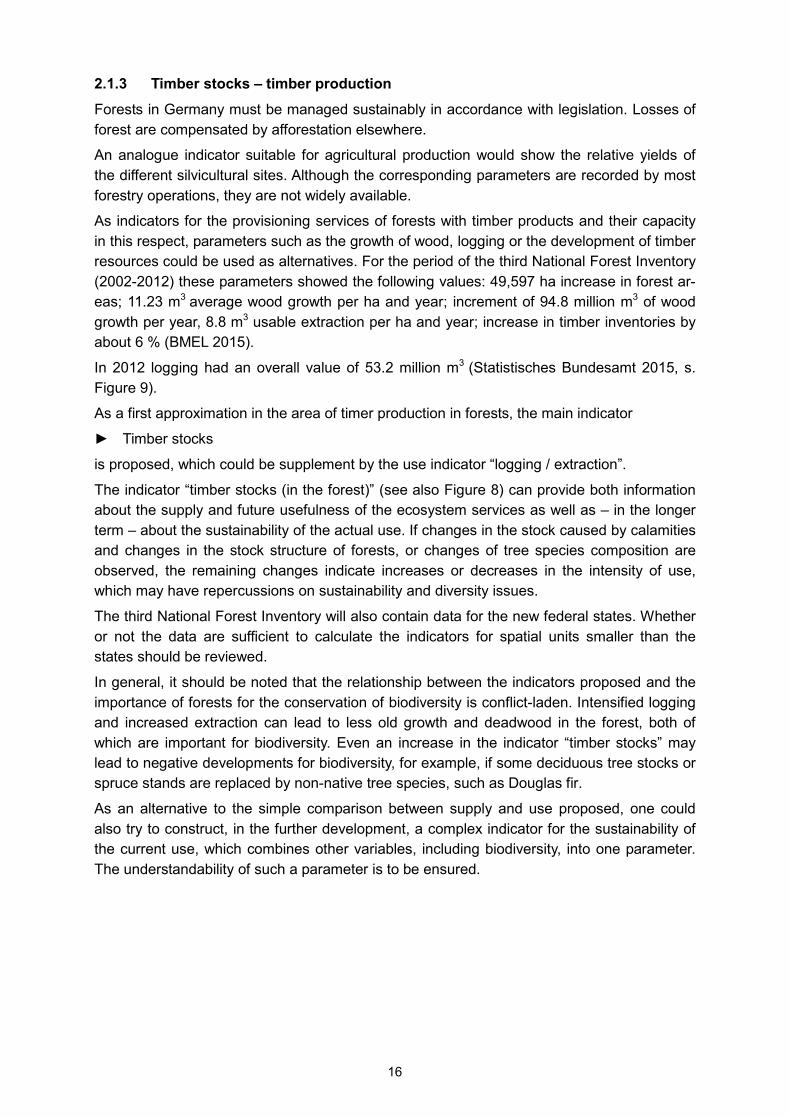
2.1.3 Timber stocks – timber production
Forests in Germany must be managed sustainably in accordance with legislation. Losses of forest are compensated by afforestation elsewhere.
An analogue indicator suitable for agricultural production would show the relative yields of the different silvicultural sites. Although the corresponding parameters are recorded by most forestry operations, they are not widely available.
As indicators for the provisioning services of forests with timber products and their capacity in this respect, parameters such as the growth of wood, logging or the development of timber resources could be used as alternatives. For the period of the third National Forest Inventory (2002-2012) these parameters showed the following values: 49,597 ha increase in forest ar-eas; 11.23 m3 average wood growth per ha and year; increment of 94.8 million m3 of wood growth per year, 8.8 m3 usable extraction per ha and year; increase in timber inventories by about 6 % (BMEL 2015).
In 2012 logging had an overall value of 53.2 million m3 (Statistisches Bundesamt 2015, s. Figure 9).
As a first approximation in the area of timer production in forests, the main indicator
► Timber stocks
is proposed, which could be supplement by the use indicator “logging / extraction”.
The indicator “timber stocks (in the forest)” (see also Figure 8) can provide both information about the supply and future usefulness of the ecosystem services as well as – in the longer term – about the sustainability of the actual use. If changes in the stock caused by calamities and changes in the stock structure of forests, or changes of tree species composition are observed, the remaining changes indicate increases or decreases in the intensity of use, which may have repercussions on sustainability and diversity issues.
The third National Forest Inventory will also contain data for the new federal states. Whether or not the data are sufficient to calculate the indicators for spatial units smaller than the states should be reviewed.
In general, it should be noted that the relationship between the indicators proposed and the importance of forests for the conservation of biodiversity is conflict-laden. Intensified logging and increased extraction can lead to less old growth and deadwood in the forest, both of which are important for biodiversity. Even an increase in the indicator “timber stocks” may lead to negative developments for biodiversity, for example, if some deciduous tree stocks or spruce stands are replaced by non-native tree species, such as Douglas fir.
As an alternative to the simple comparison between supply and use proposed, one could also try to construct, in the further development, a complex indicator for the sustainability of the current use, which combines other variables, including biodiversity, into one parameter. The understandability of such a parameter is to be ensured.
16
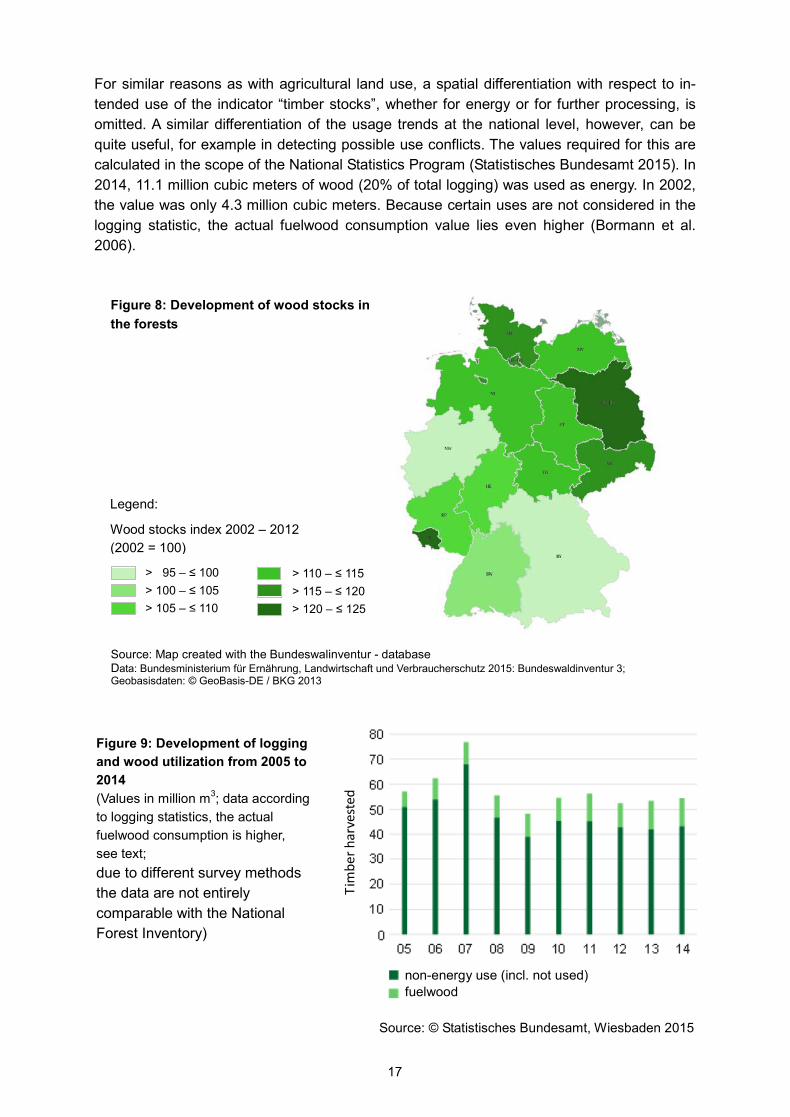
For similar reasons as with agricultural land use, a spatial differentiation with respect to in-tended use of the indicator “timber stocks”, whether for energy or for further processing, is omitted. A similar differentiation of the usage trends at the national level, however, can be quite useful, for example in detecting possible use conflicts. The values required for this are calculated in the scope of the National Statistics Program (Statistisches Bundesamt 2015). In 2014, 11.1 million cubic meters of wood (20% of total logging) was used as energy. In 2002, the value was only 4.3 million cubic meters. Because certain uses are not considered in the logging statistic, the actual fuelwood consumption value lies even higher (Bormann et al. 2006).
Figure 9: Development of logging and wood utilization from 2005 to 2014 (Values in million m3; data according to logging statistics, the actual fuelwood consumption is higher, see text; due to different survey methods the data are not entirely comparable with the National Forest Inventory)
Source: © Statistisches Bundesamt, Wiesbaden 2015
Tim
ber h
arve
sted
non-energy use (incl. not used) fuelwood
Source: Map created with the Bundeswalinventur - database Data: Bundesministerium für Ernährung, Landwirtschaft und Verbraucherschutz 2015: Bundeswaldinventur 3; Geobasisdaten: © GeoBasis-DE / BKG 2013
Legend:
Figure 8: Development of wood stocks in the forests
Wood stocks index 2002 – 2012 (2002 = 100)
> 95 – ≤ 100 > 100 – ≤ 105 > 105 – ≤ 110
> 110 – ≤ 115 > 115 – ≤ 120 > 120 – ≤ 125
17
2.2 Indicators of regulation services
In the area of regulation services, seven areas for indicators are proposed:
- Self-cleaning potential of waterways;
- Protection of groundwater quality;
- Erosion mitigation;
- Mitigation of flood hazard by water retention in floodplains;
- Pollination and biological pest control through natural and semi-natural small structures in agricultural landscapes;
- Reduction of greenhouse gas emissions (through forest management, changes in land use and rewetting of peat soils);
- Microclimatic buffering and balancing features and air filter effect of urban green areas.
2.2.1 Self-cleaning potential of waterways Inorganic and organic contaminants of waterways, such as nitrogen and phosphorus from agriculture or from water treatment plants, can be degraded, neutralized or are sequestered long-term into sediments through physical, chemical and biological processes. Relevant for these processes are near-natural states of the banks and channel bed, etc., as well as near-natural, floodable floodplains that are as wide as possible. Clean, structurally-rich waters bring benefits for recreation, reduce costs for drinking water treatment, are a prerequisite for a rich flora and fauna and help achieve the European objectives for the protection of inland waters and seas.
Mapping of water bodies performed by the states using comparable methodology provide the basis data for the proposed indicator. As an expression for the self-cleaning potential, the following can be used:
► Proportion of river with good structural integrity (see Figure 10).
The more accurate indicator of the self-cleaning effect in the water would be the actual re-duction of contaminants. However, on the one hand, such a parameter could often only be a rough estimate. On the other hand, in somewhat intact waters, an increase in pollution would result in an increased degradation service. Improvements in the indicator would then be as-sociated with a deterioration of the environmental situation, which would defeat the funda-mental purpose of the monitoring of ecosystem services.
Instead of directly assessing the actual reduction of contaminants an alternative way to de-scribe services could be based on a combination of self-cleaning potential, taken as a kind of supply indicator, with water quality standing for the demand side. Combinations of high self-cleaning potential and bad water quality would then indicate low services whereas cases with low self-cleaning potential or high water quality would also indicate low services. Fur-thermore, such an indicator could additionally suggest that the value of one and the same amount of reduction is apparently higher where water quality is relatively bad compared with situations where the contamination is already low.
With a simple juxtaposition of potential and need it can be shown whether changes in the self-purification potential have taken place, where the water quality has already reached a relatively good value, or where a great need for cleaning services still exists.
Due to a focus on the requirements of the implementation of the European Water Framework Directive, some states have decided to, for the time being, no longer continue mapping the
18
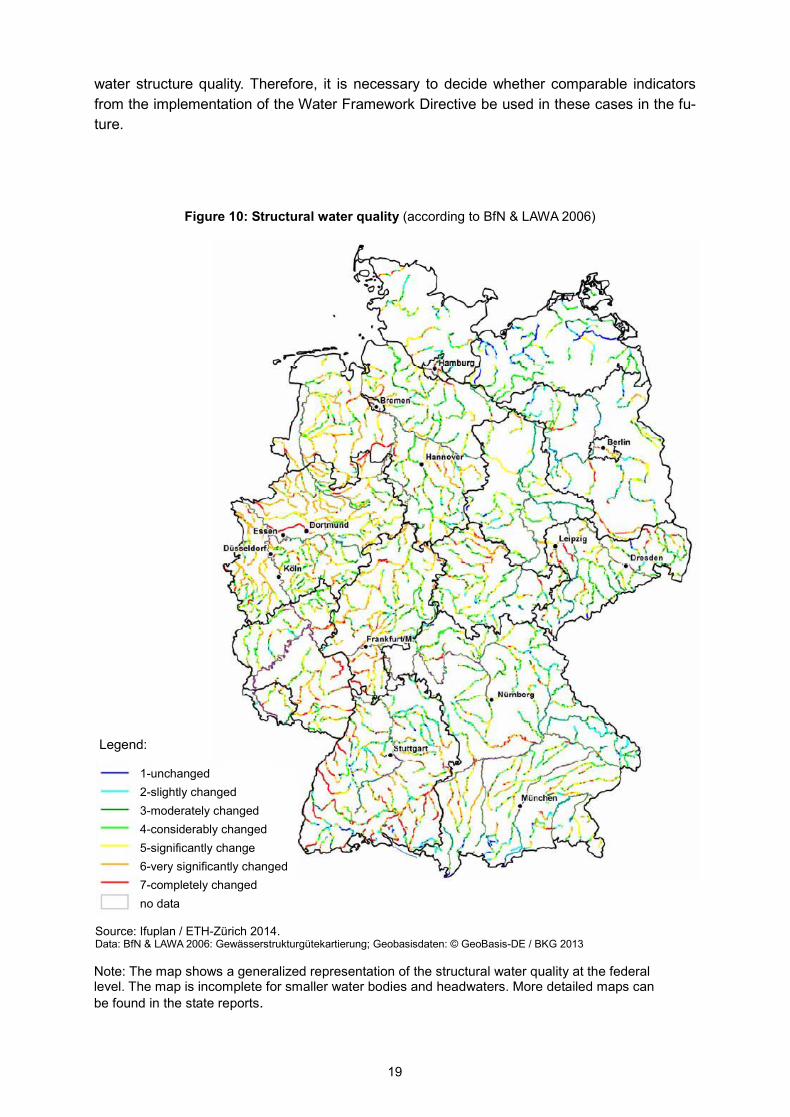
water structure quality. Therefore, it is necessary to decide whether comparable indicators from the implementation of the Water Framework Directive be used in these cases in the fu-ture.
Figure 10: Structural water quality (according to BfN & LAWA 2006)
Legend:
Note: The map shows a generalized representation of the structural water quality at the federal level. The map is incomplete for smaller water bodies and headwaters. More detailed maps can be found in the state reports.
1-unchanged 2-slightly changed 3-moderately changed 4-considerably changed 5-significantly change 6-very significantly changed 7-completely changed no data
Source: Ifuplan / ETH-Zürich 2014. Data: BfN & LAWA 2006: Gewässerstrukturgütekartierung; Geobasisdaten: © GeoBasis-DE / BKG 2013
19
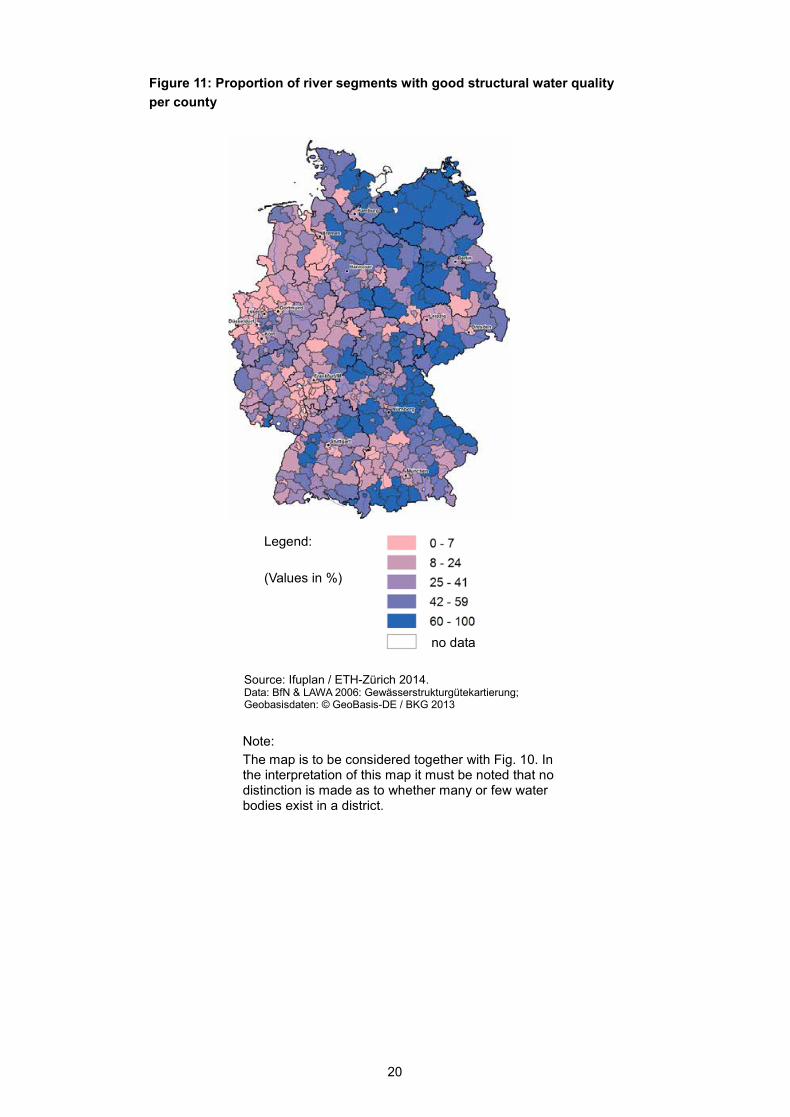
Figure 11: Proportion of river segments with good structural water quality per county
Legend: (Values in %)
Note: The map is to be considered together with Fig. 10. In the interpretation of this map it must be noted that no distinction is made as to whether many or few water bodies exist in a district.
no data
Source: Ifuplan / ETH-Zürich 2014. Data: BfN & LAWA 2006: Gewässerstrukturgütekartierung; Geobasisdaten: © GeoBasis-DE / BKG 2013
20
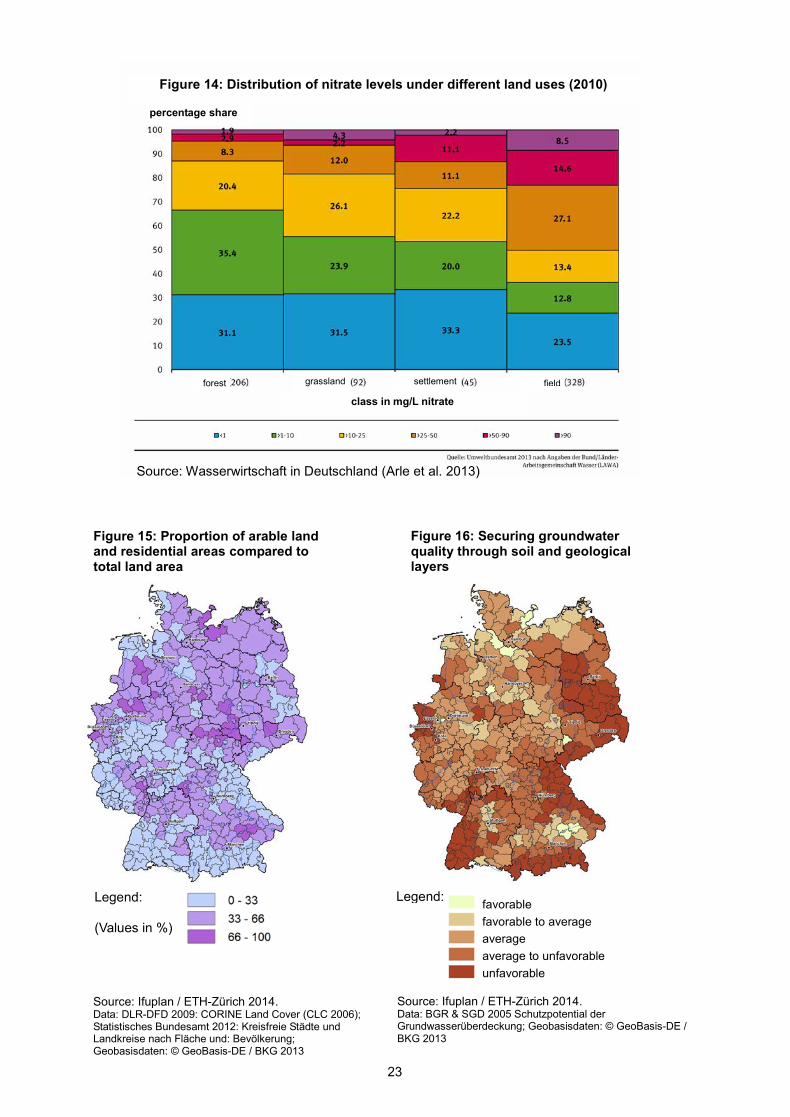
2.2.2 Protection of groundwater quality
The ecosystem service for the supply of clean groundwater is particularly threatened by, aside from other harmful substances which, at present, only occur at relatively low concen-trations, excessive nitrate concentrations. This leads to additional costs through, amongst other things, increased use of uncontaminated water resources and additional technical treatment measures.
A significant source of nitrate pollution is agricultural production. Specific management measures, a more targeted control of fertilizer use, and the conversion to organic farming can reduce or avoid nitrate inputs to groundwater.
The risk of nitrate contamination from cultivation and residential areas is particularly high, whereas the risk from grasslands and woodlands is low (see Figure 14).
Natural conditions which have a reduction effect on nitrate inputs, such as a high buffer ca-pacity of the soil and protecting geological layers, represent moderating regulation services that could reduce the nutrient contamination of groundwater. Sustained high nutrient inputs can, however, lead to a breakdown of these filters and buffers, resulting in a sudden increase in the concentration in groundwater.
In light of the interaction between the various natural and anthropogenic factors which are crucial for clean groundwater, it is proposed that the service of the clean groundwater supply be represented by several sub-indicators:
► The “proportion of groundwater with good chemical condition” (or alternatively, not uni-versally defined, a characteristic value of nitrate pollution in the German EU monitoring network) (see Figure 12 and Figure 13) is the real target indicator;
► The “protection potential by groundwater cover” (see Figure 15) (soil and geological lay-ers) illustrates natural buffering functions between an input in the soil and contamination of groundwater. This potential can be reduced or destroyed by pollution. However, the current data available does not allow for the current damage to the potential to be mapped;
► The “proportion of grassland and forest compared to the total area” addresses those ecosystems with the lowest soil contamination. The reason is not an
outstanding ecosystem service, but primarily the fact that the anthropogenic contamina-tion of these ecosystems is lowest. Conversely, a higher “proportion of farmland and res-idential areas” (see Figure 16) is an indicator of high stress on the groundwater. It should be examined whether the addition of the proportion of organic farmland should be considered in this indicator;
► In order to direct measures more targeted to areas of current urgent needs, it is also useful to combine the data presented above with spatial data on the use of groundwater resources as a demand indicator (for example: water protection areas, sanctuaries, catchment areas).
21
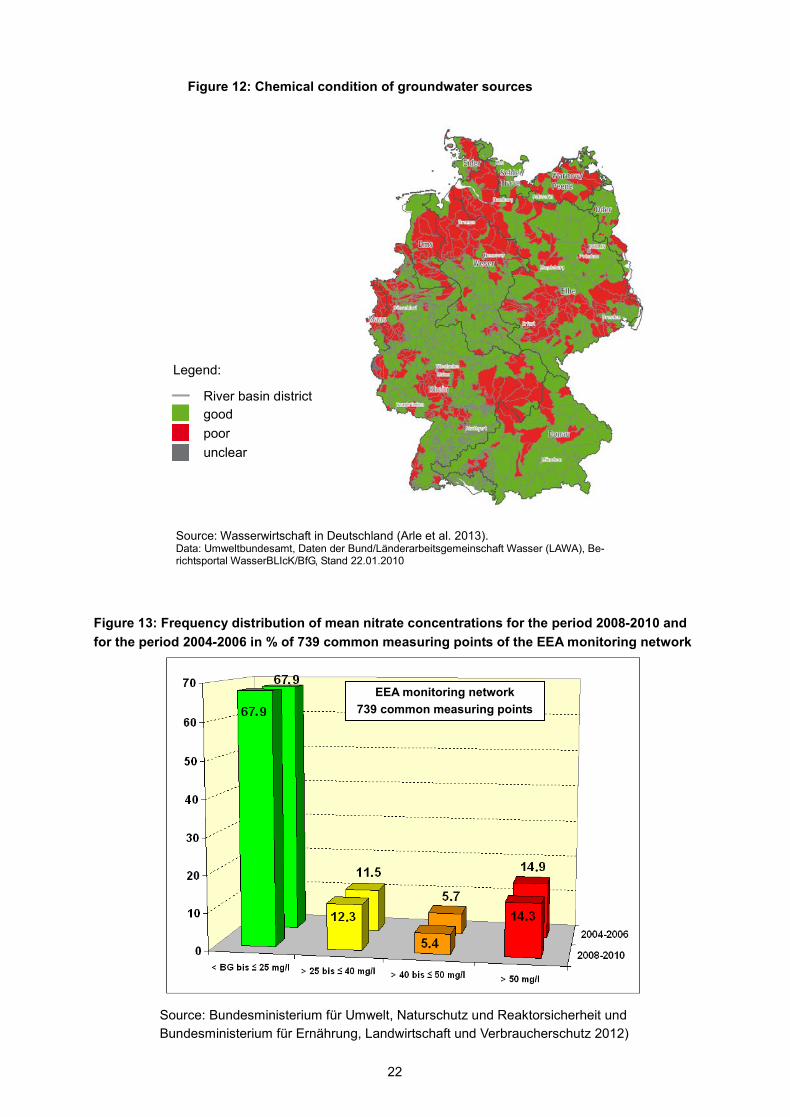
Figure 12: Chemical condition of groundwater sources
Legend:
River basin district good poor unclear
Figure 13: Frequency distribution of mean nitrate concentrations for the period 2008-2010 and for the period 2004-2006 in % of 739 common measuring points of the EEA monitoring network
Source: Bundesministerium für Umwelt, Naturschutz und Reaktorsicherheit und Bundesministerium für Ernährung, Landwirtschaft und Verbraucherschutz 2012)
EEA monitoring network 739 common measuring points
Source: Wasserwirtschaft in Deutschland (Arle et al. 2013). Data: Umweltbundesamt, Daten der Bund/Länderarbeitsgemeinschaft Wasser (LAWA), Be-richtsportal WasserBLIcK/BfG, Stand 22.01.2010
22
Source: Wasserwirtschaft in Deutschland (Arle et al. 2013)
Figure 14: Distribution of nitrate levels under different land uses (2010)
class in mg/L nitrate
percentage share
forest grassland settlement field
Figure 16: Securing groundwater quality through soil and geological layers
Legend: favorable favorable to average average average to unfavorable unfavorable
Source: Ifuplan / ETH-Zürich 2014. Data: BGR & SGD 2005 Schutzpotential der Grundwasserüberdeckung; Geobasisdaten: © GeoBasis-DE / BKG 2013
Figure 15: Proportion of arable land and residential areas compared to total land area
Legend: (Values in %)
Source: Ifuplan / ETH-Zürich 2014. Data: DLR-DFD 2009: CORINE Land Cover (CLC 2006); Statistisches Bundesamt 2012: Kreisfreie Städte und Landkreise nach Fläche und: Bevölkerung; Geobasisdaten: © GeoBasis-DE / BKG 2013
23
2.2.3 Erosion mitigation
Wind and water erosion reduce the suitability of soils for agricultural and forestry production, and can also cause harm to settlements and infrastructure, as well as lead to adverse sedi-mentation effects in the aquatic environment.
Erosion takes place mainly on vegetation-free surfaces. Affected, therefore, is mainly arable land. About 14 % of the arable land in Germany have a long-term average soil erosion by wind or water of more than 3 tonnes per hectare per year. In contrast, the average annual rate of soil formation is only about 2 tonnes per hectare (Umweltbundesamt 2010, Grassl 1997).
Ways to prevent or reduce erosion include the conversion of arable land to other land use types, such as forest or green land and changes in agricultural use (e.g. no-till processing, cover crops, transverse cultivation). As well, the addition of small structures (especially hedges) can, depending on the design and orientation, reduce the wind speed and, at a par-allel to the slope orientation or planting in gullies, can also reduce water erosion processes. The current focus on field boundaries can reduce water erosion processes only slightly.
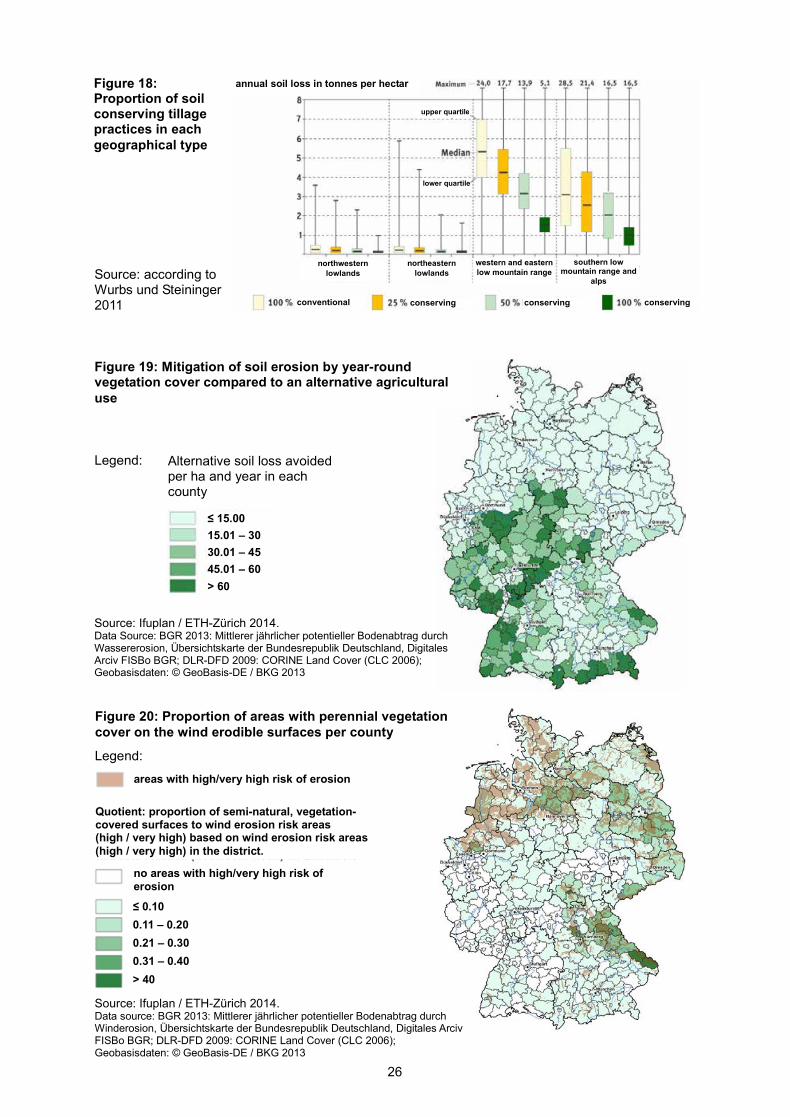
Only averages and no site-specific data about the type, location and extent of erosion-reducing farming practices are currently available (see Figure 18).
As indicators of ecosystem services to mitigate erosion processes, the following are pro-posed:
► Reduction of water erosion by year-round vegetation cover (especially forest, grassland) compared to an alternative agricultural use (see Figure 19);
► Proportion of areas with perennial vegetation cover (especially forest, grassland) on the wind erodible surfaces (see Figure 20);
► The proportion of small structures in the agricultural landscape (see Figures 23 and 24).
The prediction models for water erosion are developed to the point where they can express the amount of erosion caused by normal field use in tonnes of soil loss per hectare per year (see Figure 17). Virtually no erosion takes place in forests and permanent pasture. By super-imposing the actual use with the map of soil erosion risk, one can calculate quantitatively the reduction in erosion a particular use brings, compared to farming.
For wind erosion, only area-wide risk assessments on an ordinal scale (smaller – larger) have been performed. Therefore, a quantitative assessment analogous to soil erosion is not currently available. The proposed percentage value (percentage of land with perennial vege-tation cover) is an auxiliary variable. After the Federal Institute for Geosciences and Natural Resources provides new calculations, it should be assessed whether the indicator can be further improved.
Comprehensive quantitative effect estimates are missing for the erosion control effect of small structures in the agricultural landscape. Therefore, here as well, a simple percentage indicator is provisionally proposed. Currently, the Federal Environment Office is conducting a study on wind erosion risk, including wind barriers. It should be then examined whether a further improvement of the indicator is useful here, also. Analogous to the procedure for self-cleaning potential of waters, changes in the indicator “proportion of small structures…” should be determined separately for areas with high and lower demand for erosion control. Corresponding demand indicators are shown in Figure 17:
24
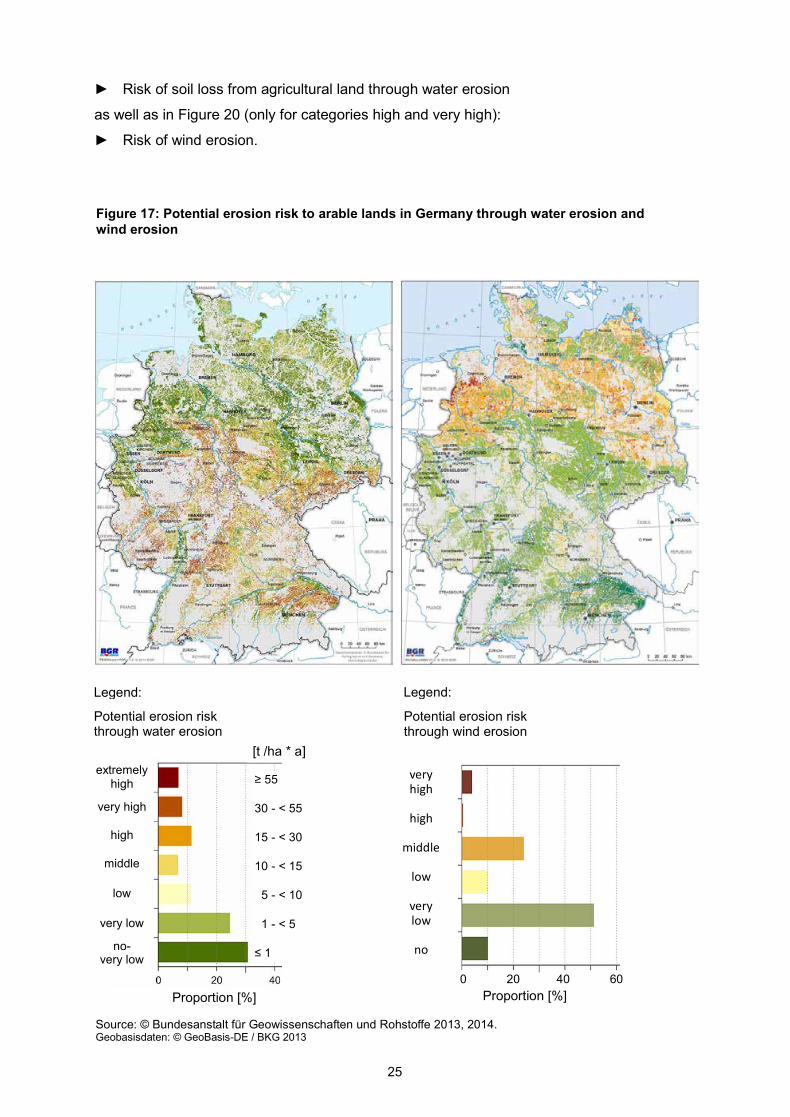
► Risk of soil loss from agricultural land through water erosion
as well as in Figure 20 (only for categories high and very high):
► Risk of wind erosion.
Source: © Bundesanstalt für Geowissenschaften und Rohstoffe 2013, 2014. Geobasisdaten: © GeoBasis-DE / BKG 2013
Figure 17: Potential erosion risk to arable lands in Germany through water erosion and wind erosion
Legend:
Potential erosion risk through water erosion
very high
high
middle
low
very low
no
Legend:
Potential erosion risk through wind erosion
≥ 55
30 - < 55
15 - < 30
10 - < 15
5 - < 10
1 - < 5
≤ 1
Proportion [%]
[t /ha * a] extremely
high
very high
high
middle
low
very low
no- very low
Proportion [%] 0 20 40 60
25
Legend:
Figure 19: Mitigation of soil erosion by year-round vegetation cover compared to an alternative agricultural use
Alternative soil loss avoided per ha and year in each county
Source: Ifuplan / ETH-Zürich 2014. Data Source: BGR 2013: Mittlerer jährlicher potentieller Bodenabtrag durch Wassererosion, Übersichtskarte der Bundesrepublik Deutschland, Digitales Arciv FISBo BGR; DLR-DFD 2009: CORINE Land Cover (CLC 2006); Geobasisdaten: © GeoBasis-DE / BKG 2013
≤ 15.00 15.01 – 30 30.01 – 45 45.01 – 60 > 60
Figure 18: Proportion of soil conserving tillage practices in each geographical type
Source: according to Wurbs und Steininger 2011
annual soil loss in tonnes per hectar
upper quartile
lower quartile
northwestern lowlands
northeastern lowlands
western and eastern low mountain range
southern low mountain range and
alps
conventional conserving conserving conserving
Source: Ifuplan / ETH-Zürich 2014. Data source: BGR 2013: Mittlerer jährlicher potentieller Bodenabtrag durch Winderosion, Übersichtskarte der Bundesrepublik Deutschland, Digitales Arciv FISBo BGR; DLR-DFD 2009: CORINE Land Cover (CLC 2006); Geobasisdaten: © GeoBasis-DE / BKG 2013
Figure 20: Proportion of areas with perennial vegetation cover on the wind erodible surfaces per county
Legend:
≤ 0.10 0.11 – 0.20 0.21 – 0.30 0.31 – 0.40 > 40
Quotient: proportion of semi-natural, vegetation-covered surfaces to wind erosion risk areas (high / very high) based on wind erosion risk areas (high / very high) in the district.
areas with high/very high risk of erosion
no areas with high/very high risk of erosion
Legend:
26
2.2.4 Mitigation of flood hazard by water retention in floodplains
The natural floodplains of rivers have been increasingly narrowed by a straightening of the watercourses and embankments. Approximately two-thirds of the alluvial floodplains in Ger-many have been lost in this way. This has the consequence that flood waves are increasingly higher and the risk of flooding increases.
The natural flood areas in the floodplain of a river absorb water during a flooding event. At the same time, water is released slower from the side area of the flood plain compared to the main channel. Thus, the peak height of a flood wave is reduced longitudinally and trans-versely to the river.
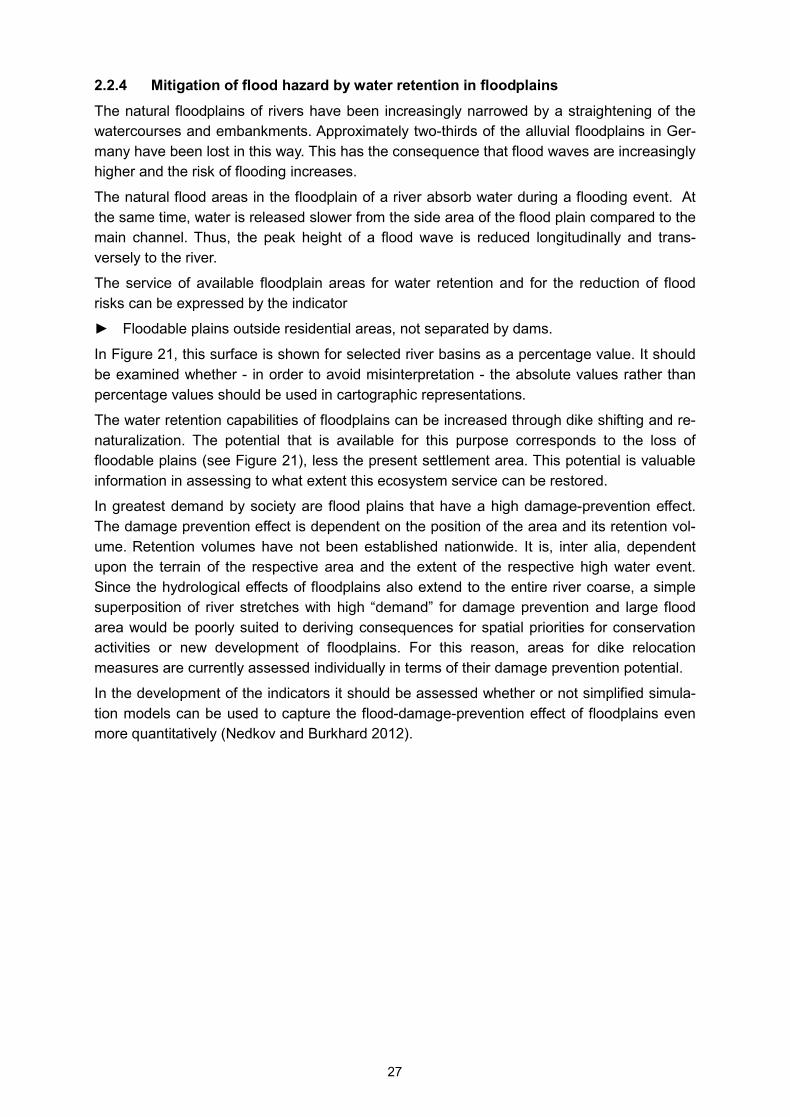
The service of available floodplain areas for water retention and for the reduction of flood risks can be expressed by the indicator
► Floodable plains outside residential areas, not separated by dams.
In Figure 21, this surface is shown for selected river basins as a percentage value. It should be examined whether - in order to avoid misinterpretation - the absolute values rather than percentage values should be used in cartographic representations.
The water retention capabilities of floodplains can be increased through dike shifting and re-naturalization. The potential that is available for this purpose corresponds to the loss of floodable plains (see Figure 21), less the present settlement area. This potential is valuable information in assessing to what extent this ecosystem service can be restored.
In greatest demand by society are flood plains that have a high damage-prevention effect. The damage prevention effect is dependent on the position of the area and its retention vol-ume. Retention volumes have not been established nationwide. It is, inter alia, dependent upon the terrain of the respective area and the extent of the respective high water event. Since the hydrological effects of floodplains also extend to the entire river coarse, a simple superposition of river stretches with high “demand” for damage prevention and large flood area would be poorly suited to deriving consequences for spatial priorities for conservation activities or new development of floodplains. For this reason, areas for dike relocation measures are currently assessed individually in terms of their damage prevention potential.
In the development of the indicators it should be assessed whether or not simplified simula-tion models can be used to capture the flood-damage-prevention effect of floodplains even more quantitatively (Nedkov and Burkhard 2012).
27
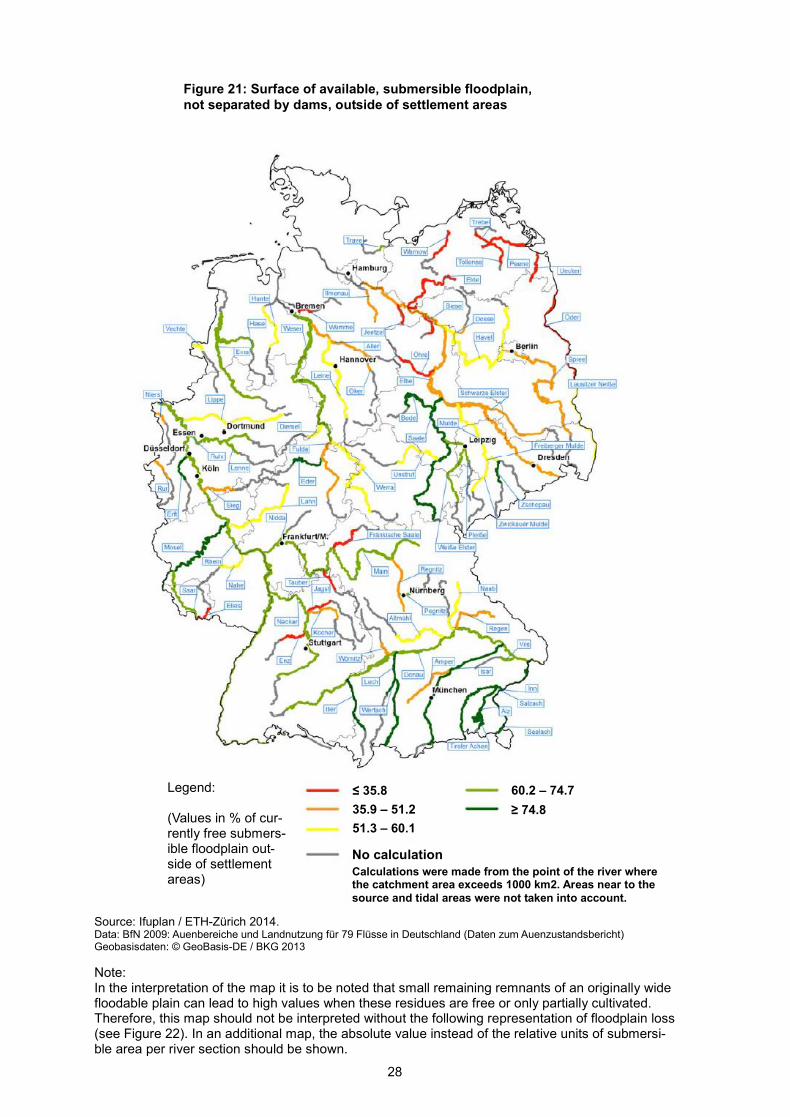
Note: In the interpretation of the map it is to be noted that small remaining remnants of an originally wide floodable plain can lead to high values when these residues are free or only partially cultivated. Therefore, this map should not be interpreted without the following representation of floodplain loss (see Figure 22). In an additional map, the absolute value instead of the relative units of submersi-ble area per river section should be shown.
Figure 21: Surface of available, submersible floodplain, not separated by dams, outside of settlement areas
Legend: (Values in % of cur-rently free submers-ible floodplain out-side of settlement areas)
≤ 35.8 35.9 – 51.2 51.3 – 60.1
60.2 – 74.7 ≥ 74.8
No calculation Calculations were made from the point of the river where the catchment area exceeds 1000 km2. Areas near to the source and tidal areas were not taken into account.
Source: Ifuplan / ETH-Zürich 2014. Data: BfN 2009: Auenbereiche und Landnutzung für 79 Flüsse in Deutschland (Daten zum Auenzustandsbericht) Geobasisdaten: © GeoBasis-DE / BKG 2013
28
Figure 22: Loss of floodplain water retention / retention potential
Legend: Cutaway The width of the strips along the rivers corre-sponds to the retention function of the mor-phological floodplain.
≤ 0.2 > 0.2 – 0.4 > 0.4 – 0.6 > 0.6 – 0.8 > 0.8
Loss of floodplain retention (loss of surface and roughness compared to morphological floodplain)
very low low distinct high very high
rivers and canals lakes large cities
Source: Scholz et al. 2012; Geobasisdaten: © GeoBasis-DE / BKG 2009, elevation model: srtm.csi.cgiar.org
29
2.2.5 Pollination and biological pest control – natural and semi-natural areas and structures in agricultural landscapes
In addition to their contribution to soil erosion reduction (see 2.2.3) and their recreational function (see 2.3), small structures such as hedgerows, copses and field margins provide habitat for pollinator populations and play an important role in the context of natural pest con-trol.
► The proportion of natural and semi-natural areas and small structures in the agriculturallandscape
is determined in Germany at the federal and state levels as part of the registration of natural and semi-natural habitats in the agricultural landscape (High Nature Value (HNV) Farmland) for arable land and grassland using representative samples. Due to the sample size, spatial-ly explicit values are only available for the state level.
A methodologically different representation of small structures takes place in Figure 24 “Den-sity of small structures in arable lands” (Julius Kühn-Institut). This assessment is targeted to arable land only. Forest edges are included. Communities in this assessment that lie below a target value for small structural units have an interest and the possibility of registering the small structures which were not detected with the relevant methodology. The published re-sults of the small-scale structure proportions are therefore not fully comparable between are-as of high and low small structure proportions. Due to different methodology, the inclusion of forest edges, and limited to cropland areas there are significant differences compared with the results for HNV-farmland mapping. Similar to self-cleaning potential of water, additional knowledge regarding the importance of the pollination service of small structures can be ob-tained when compared with the demand indicator
► Proportion of pollination-dependent agricultural products
and determined separately for high and low demand situations. For this purpose, the propor-tion of pollination-dependent agricultural products must be shown on an even smaller scale than in Figure 25.
30
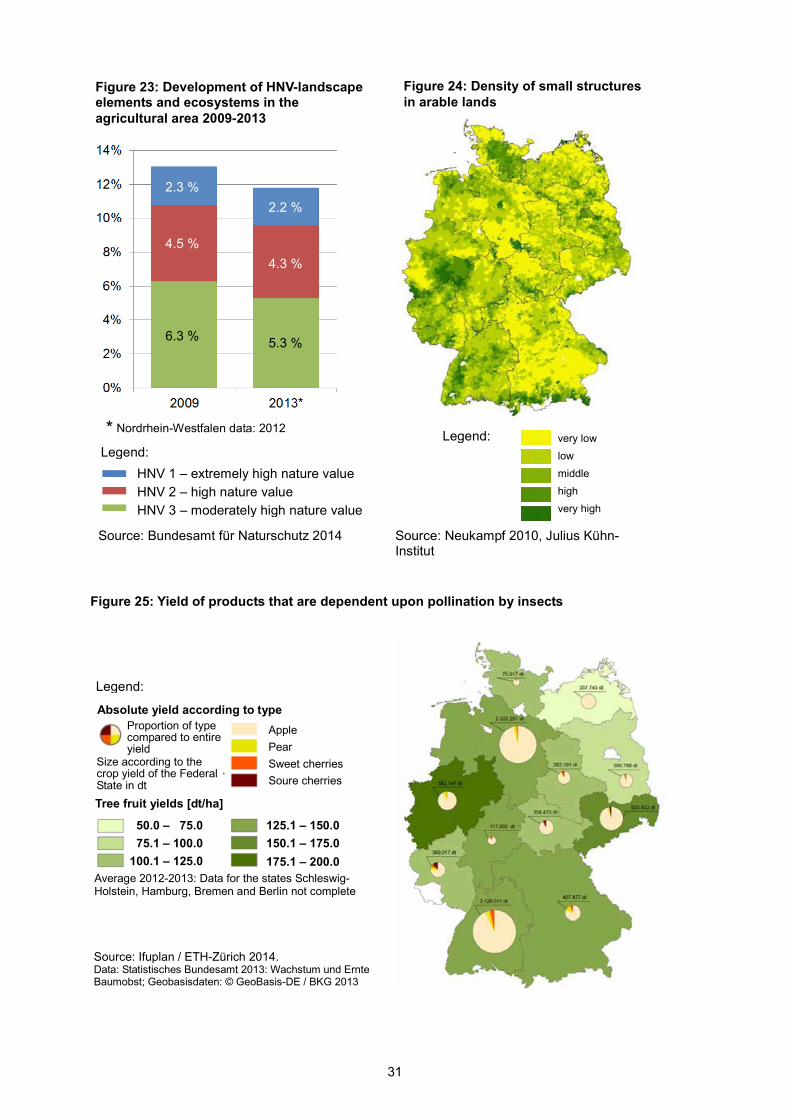
Figure 24: Density of small structures in arable lands
Legend:
Source: Neukampf 2010, Julius Kühn-Institut
very low low middle high very high
Figure 23: Development of HNV-landscape elements and ecosystems in the agricultural area 2009-2013
Legend: HNV 1 – extremely high nature value HNV 2 – high nature value HNV 3 – moderately high nature value
* Nordrhein-Westfalen data: 2012
2.3 %
4.5 %
6.3 %
2.2 %
4.3 %
5.3 %
Source: Bundesamt für Naturschutz 2014
Figure 25: Yield of products that are dependent upon pollination by insects
Legend:
50.0 – 75.0 75.1 – 100.0 100.1 – 125.0
125.1 – 150.0 150.1 – 175.0 175.1 – 200.0
Absolute yield according to type Proportion of type compared to entire yield
Size according to the crop yield of the Federal State in dt Tree fruit yields [dt/ha]
Apple Pear Sweet cherries Soure cherries
Average 2012-2013: Data for the states Schleswig-Holstein, Hamburg, Bremen and Berlin not complete
Source: Ifuplan / ETH-Zürich 2014. Data: Statistisches Bundesamt 2013: Wachstum und Ernte Baumobst; Geobasisdaten: © GeoBasis-DE / BKG 2013
31
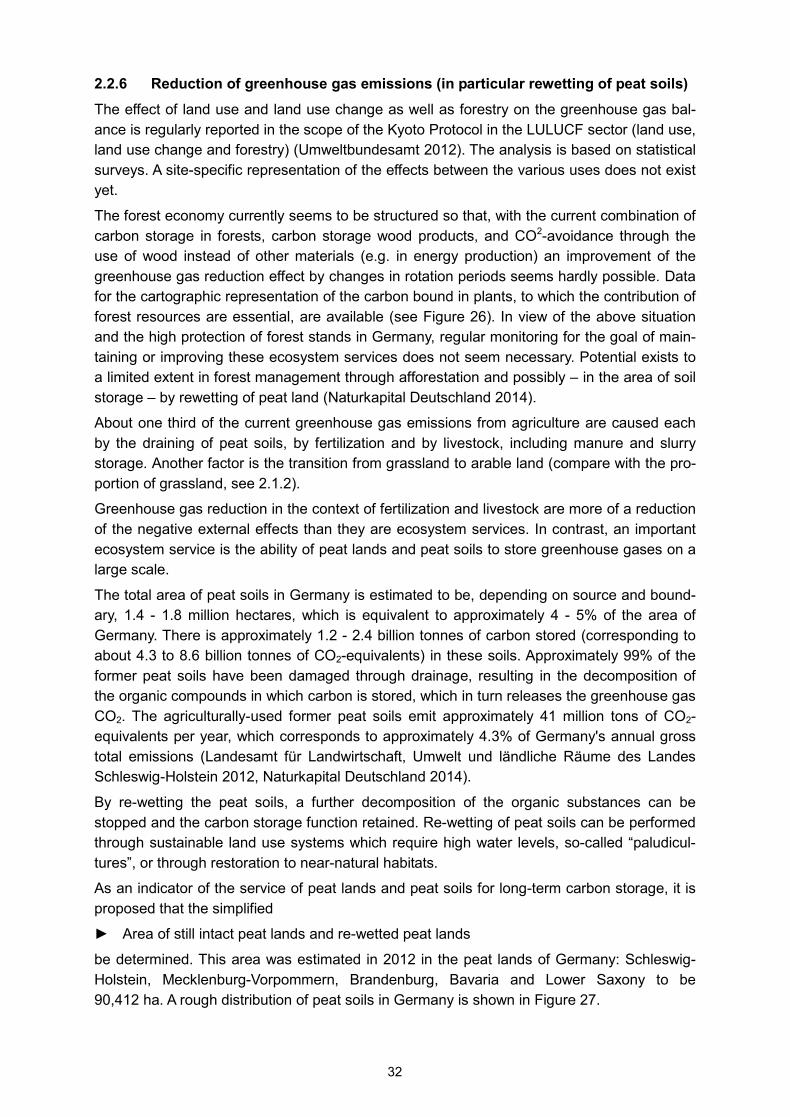
2.2.6 Reduction of greenhouse gas emissions (in particular rewetting of peat soils)
The effect of land use and land use change as well as forestry on the greenhouse gas bal-ance is regularly reported in the scope of the Kyoto Protocol in the LULUCF sector (land use, land use change and forestry) (Umweltbundesamt 2012). The analysis is based on statistical surveys. A site-specific representation of the effects between the various uses does not exist yet.
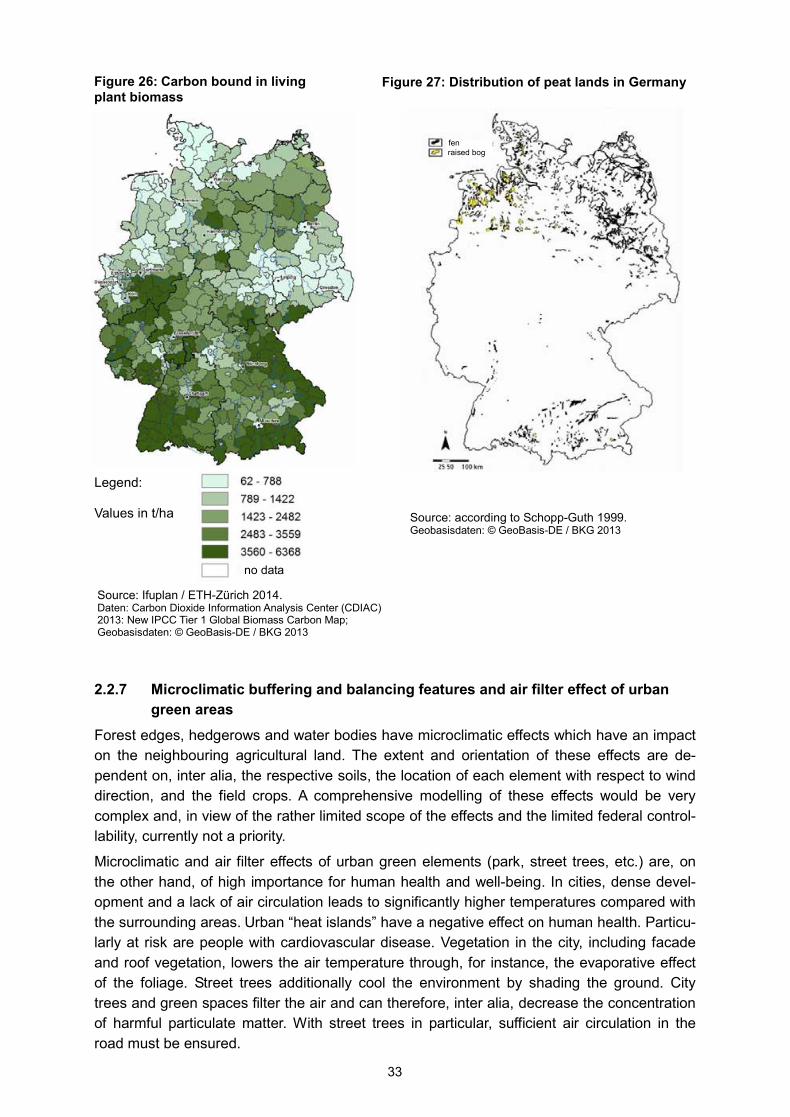
The forest economy currently seems to be structured so that, with the current combination of carbon storage in forests, carbon storage wood products, and CO2-avoidance through the use of wood instead of other materials (e.g. in energy production) an improvement of the greenhouse gas reduction effect by changes in rotation periods seems hardly possible. Data for the cartographic representation of the carbon bound in plants, to which the contribution of forest resources are essential, are available (see Figure 26). In view of the above situation and the high protection of forest stands in Germany, regular monitoring for the goal of main-taining or improving these ecosystem services does not seem necessary. Potential exists to a limited extent in forest management through afforestation and possibly – in the area of soil storage – by rewetting of peat land (Naturkapital Deutschland 2014).
About one third of the current greenhouse gas emissions from agriculture are caused each by the draining of peat soils, by fertilization and by livestock, including manure and slurry storage. Another factor is the transition from grassland to arable land (compare with the pro-portion of grassland, see 2.1.2).
Greenhouse gas reduction in the context of fertilization and livestock are more of a reduction of the negative external effects than they are ecosystem services. In contrast, an important ecosystem service is the ability of peat lands and peat soils to store greenhouse gases on a large scale.
The total area of peat soils in Germany is estimated to be, depending on source and bound-ary, 1.4 - 1.8 million hectares, which is equivalent to approximately 4 - 5% of the area of Germany. There is approximately 1.2 - 2.4 billion tonnes of carbon stored (corresponding to about 4.3 to 8.6 billion tonnes of CO2-equivalents) in these soils. Approximately 99% of the former peat soils have been damaged through drainage, resulting in the decomposition of the organic compounds in which carbon is stored, which in turn releases the greenhouse gas CO2. The agriculturally-used former peat soils emit approximately 41 million tons of CO2-equivalents per year, which corresponds to approximately 4.3% of Germany's annual gross total emissions (Landesamt für Landwirtschaft, Umwelt und ländliche Räume des Landes Schleswig-Holstein 2012, Naturkapital Deutschland 2014).
By re-wetting the peat soils, a further decomposition of the organic substances can be stopped and the carbon storage function retained. Re-wetting of peat soils can be performed through sustainable land use systems which require high water levels, so-called “paludicul-tures”, or through restoration to near-natural habitats.
As an indicator of the service of peat lands and peat soils for long-term carbon storage, it is proposed that the simplified
► Area of still intact peat lands and re-wetted peat lands
be determined. This area was estimated in 2012 in the peat lands of Germany: Schleswig-Holstein, Mecklenburg-Vorpommern, Brandenburg, Bavaria and Lower Saxony to be 90,412 ha. A rough distribution of peat soils in Germany is shown in Figure 27.
32
2.2.7 Microclimatic buffering and balancing features and air filter effect of urban green areas
Forest edges, hedgerows and water bodies have microclimatic effects which have an impact on the neighbouring agricultural land. The extent and orientation of these effects are de-pendent on, inter alia, the respective soils, the location of each element with respect to wind direction, and the field crops. A comprehensive modelling of these effects would be very complex and, in view of the rather limited scope of the effects and the limited federal control-lability, currently not a priority.
Microclimatic and air filter effects of urban green elements (park, street trees, etc.) are, on the other hand, of high importance for human health and well-being. In cities, dense devel-opment and a lack of air circulation leads to significantly higher temperatures compared with the surrounding areas. Urban “heat islands” have a negative effect on human health. Particu-larly at risk are people with cardiovascular disease. Vegetation in the city, including facade and roof vegetation, lowers the air temperature through, for instance, the evaporative effect of the foliage. Street trees additionally cool the environment by shading the ground. City trees and green spaces filter the air and can therefore, inter alia, decrease the concentration of harmful particulate matter. With street trees in particular, sufficient air circulation in the road must be ensured.
Figure 26: Carbon bound in living plant biomass
Legend: Values in t/ha
no data
Source: Ifuplan / ETH-Zürich 2014. Daten: Carbon Dioxide Information Analysis Center (CDIAC) 2013: New IPCC Tier 1 Global Biomass Carbon Map; Geobasisdaten: © GeoBasis-DE / BKG 2013
Figure 27: Distribution of peat lands in Germany
fen raised bog
Source: according to Schopp-Guth 1999. Geobasisdaten: © GeoBasis-DE / BKG 2013
33
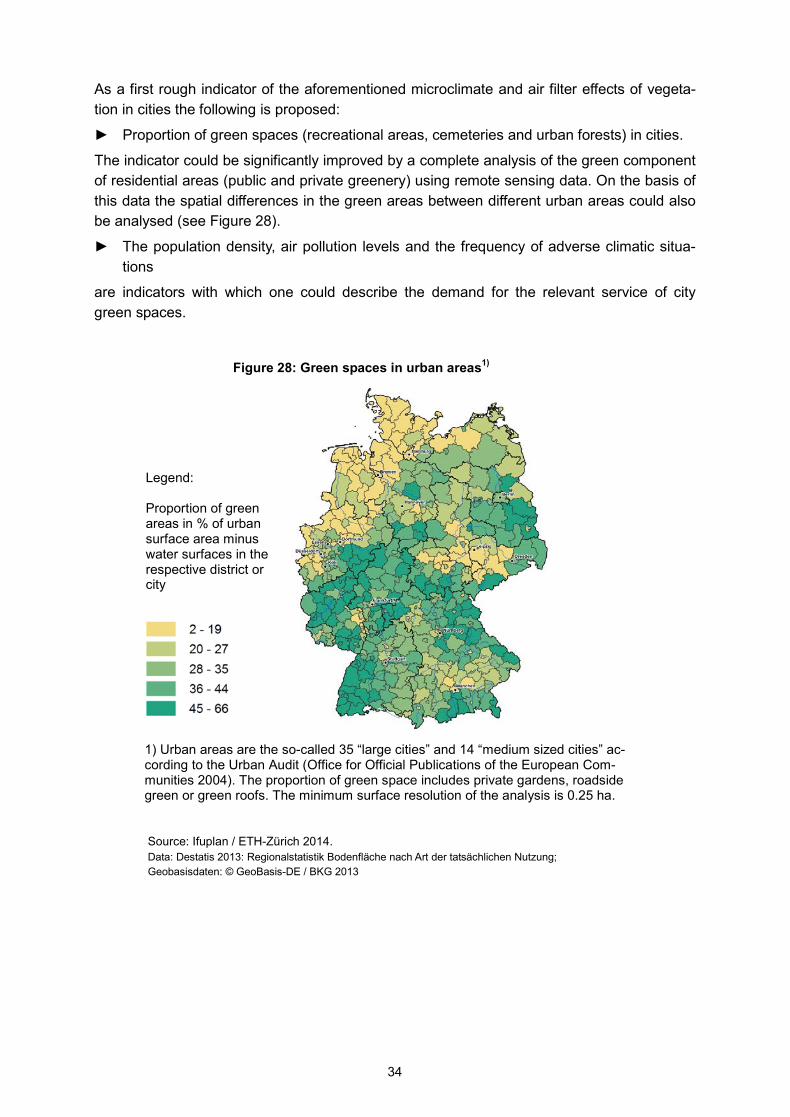
As a first rough indicator of the aforementioned microclimate and air filter effects of vegeta-tion in cities the following is proposed:
► Proportion of green spaces (recreational areas, cemeteries and urban forests) in cities.
The indicator could be significantly improved by a complete analysis of the green component of residential areas (public and private greenery) using remote sensing data. On the basis of this data the spatial differences in the green areas between different urban areas could also be analysed (see Figure 28).
► The population density, air pollution levels and the frequency of adverse climatic situa-tions
are indicators with which one could describe the demand for the relevant service of city green spaces.
Figure 28: Green spaces in urban areas1)
Legend:
Proportion of green areas in % of urban surface area minus water surfaces in the respective district or city
1) Urban areas are the so-called 35 “large cities” and 14 “medium sized cities” ac-cording to the Urban Audit (Office for Official Publications of the European Com-munities 2004). The proportion of green space includes private gardens, roadside green or green roofs. The minimum surface resolution of the analysis is 0.25 ha.
Source: Ifuplan / ETH-Zürich 2014. Data: Destatis 2013: Regionalstatistik Bodenfläche nach Art der tatsächlichen Nutzung; Geobasisdaten: © GeoBasis-DE / BKG 2013
34
2.3 Indicators of cultural ecosystem services
In the area of cultural ecosystem services, according to the international classification of ecosystem services “CICES”, distinctions between the following sub-services are made: the nature experience, recreational activities, scientific significance, importance to education and training, natural heritage / cultural significance, use for entertainment purposes, natural aes-thetics, symbolic significance of nature, spiritual and religious significance of natural ele-ments, intrinsic value of nature (existence value), value of nature as a legacy (bequest) for future generations (see Table 2).
Problems related to a lack of common definitions
The conservation of cultural and natural heritage has been integrated into German nature conservation law, inter alia, under the protection of “historically evolved cultural landscapes”. When establishing nature reserve boundaries, conservation of cultural landscapes is fre-quently only a single criterion used amongst others.
One could display all protected areas in Germany which were also designated for the protec-tion of cultural and natural heritage. The total area of these protected areas would account for a relatively large proportion of the Federal Republic. Due to the jurisdiction of the states it is unclear whether the designation criteria are directly comparable. In addition, a comparison of different time points would primarily measure the success of the designation of protected areas. Whether this also connects additional ecosystem services is uncertain. To date, no sufficiently operationalized definition for the function of landscapes in the conservation of natural and cultural heritage has been nation-wide accepted, making it impossible to create a map corresponding to the landscapes of Germany using uniform criteria.
Related to the cultural significance of landscapes is their function as part of the home-identity. Here, too, the registration and evaluation criteria are insufficiently developed to allow for mapping to be performed.
The criterion of missing or incomplete definitions for a cartographic delimitation also applies to the functioning of ecosystems for science and education (data exists here for, among oth-ers, biosphere reservations), for the symbolic meaning of nature and for their use or usability for entertainment purposes.
For the evaluation of the intrinsic value of nature, which is in practice almost impossible to separate from the value of the natural heritage which is to be passed on to future genera-tions, a variety of monetary assessments have been done in Germany. These analyses are based on conservation programs, specific land use types (e.g. conservation of grassland), the creation of habitats (e.g. for the beaver) or the conservation of certain types of land-scapes (e.g. richly textured cultural landscapes) (see the compilation in Bundesamt für Na-turschutz 2012, Meyerhoff et al. 2012).
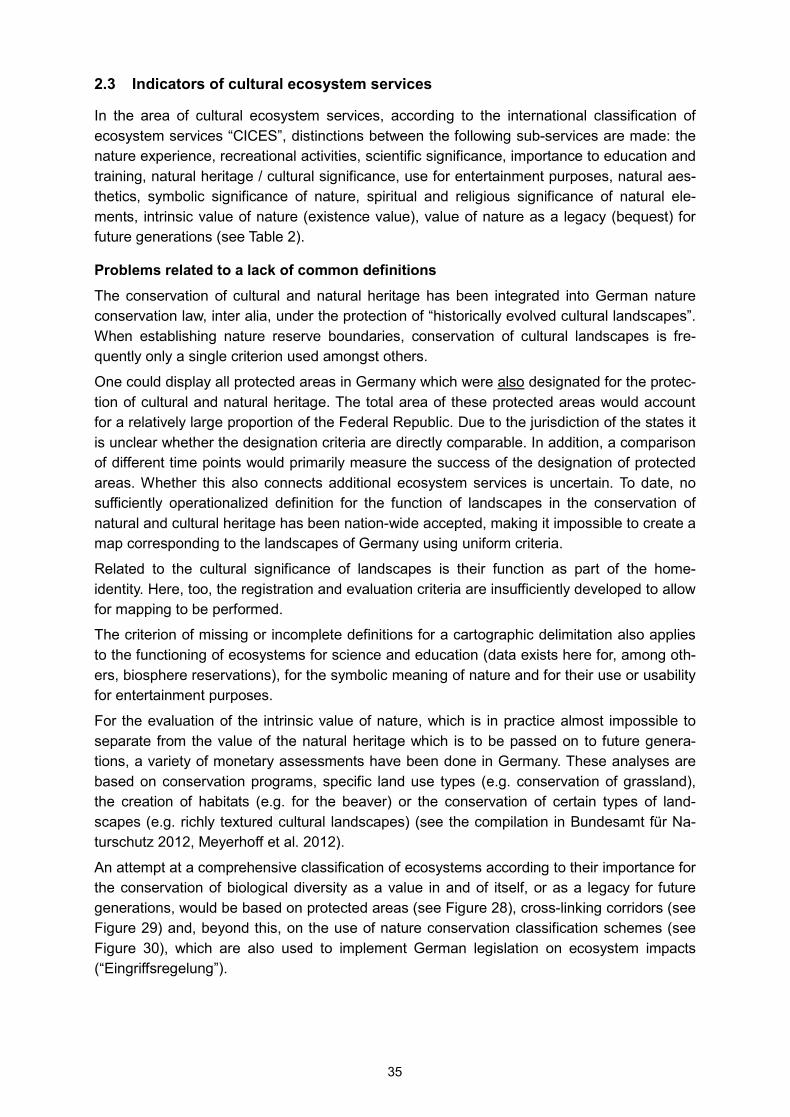
An attempt at a comprehensive classification of ecosystems according to their importance for the conservation of biological diversity as a value in and of itself, or as a legacy for future generations, would be based on protected areas (see Figure 28), cross-linking corridors (see Figure 29) and, beyond this, on the use of nature conservation classification schemes (see Figure 30), which are also used to implement German legislation on ecosystem impacts (“Eingriffsregelung”).
35
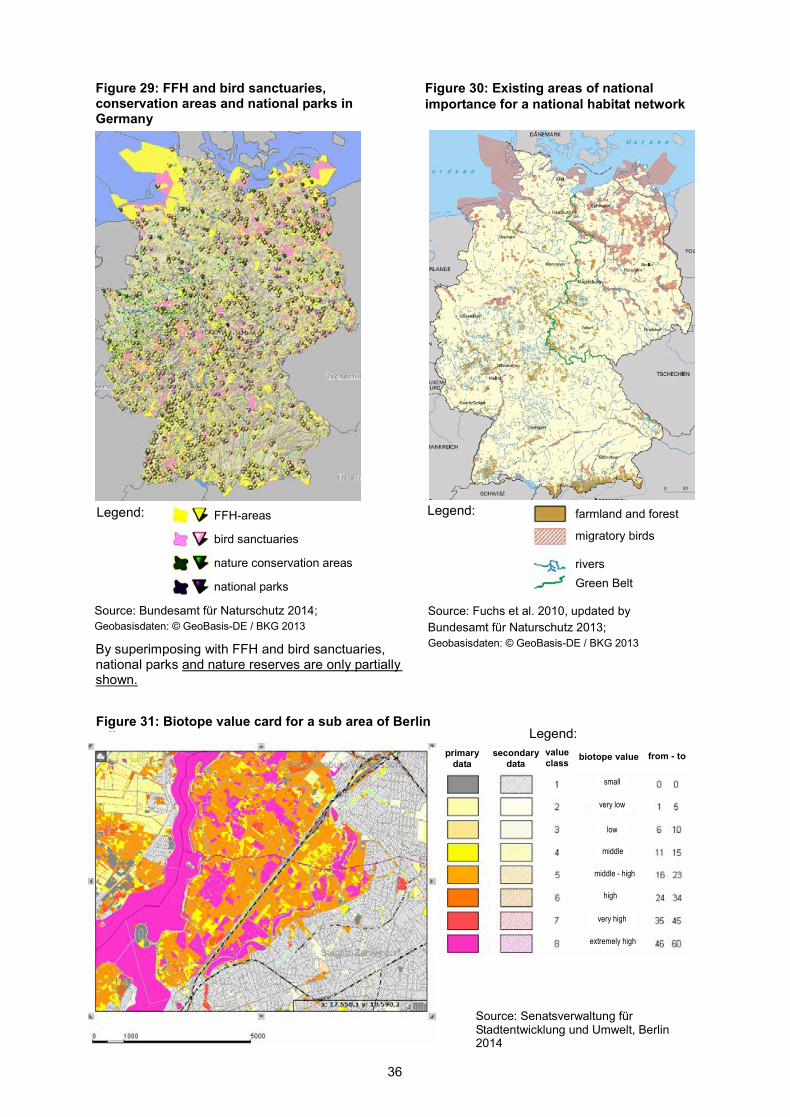
Figure 30: Existing areas of national importance for a national habitat network
Legend: farmland and forest
migratory birds
rivers Green Belt
Source: Fuchs et al. 2010, updated by Bundesamt für Naturschutz 2013; Geobasisdaten: © GeoBasis-DE / BKG 2013
Figure 31: Biotope value card for a sub area of Berlin li Legend:
primary data
secondary data
value class
biotope value
from - to
small
very low
low
middle
middle - high
high
very high
extremely high
Source: Senatsverwaltung für Stadtentwicklung und Umwelt, Berlin 2014
Figure 29: FFH and bird sanctuaries, conservation areas and national parks in Germany
Legend:
By superimposing with FFH and bird sanctuaries, national parks and nature reserves are only partially shown.
FFH-areas
bird sanctuaries
nature conservation areas
national parks
Source: Bundesamt für Naturschutz 2014; Geobasisdaten: © GeoBasis-DE / BKG 2013
36
As it is unclear whether such a conservation-oriented assessment falls under the intention of the evaluation of ecosystem services under Action 5, a proposal of an appropriate indicator is omitted for the time being.
Initial focus on recreation combined with nature experience and aesthetics
Due to the definition problems discussed above, it is recommended to initially assess the na-ture experience, recreational activities and aesthetics functions of nature.
The recreational needs of the individual vary with respect to the nature experience, specific recreational activities and aesthetics. For this reason, the chosen route for assessing the recreation function is to simultaneously consider the above mentioned aspects, instead of considering each aspect, for instance the aesthetic function of nature, separately.
In addition to the suitability of ecosystems, human interferences such as noise and visual disturbance effects of residential areas, roads and other infrastructures (e.g. power lines) are also to be considered in the assessment for recreational services.
Because of the different behavioural patterns and needs associated with each, a differentia-tion should be also made between “after-work recreation” in close proximity to the city, “weekend and day recreation” within a maximum of 30-60 km around the city – the exact dis-tances based on technical literature and surveys are still to be defined - and "vacation recre-ation" with destinations which are more or less independent of the distance from home.
Daily and weekly recreational areas can be – when easy accessibility is to be ensured – par-ticularly scarce in regions that are characterized by intensive agriculture. “After work recrea-tion” is bound to the immediate surroundings of the home, as destinations which are further away are impractical due to the limited time available after work.
Despite its dense population, Germany offers a number of attractive sites for vacation lei-sure. Nevertheless, despite the self-interest of their respective communities in the preserva-tion of the scenic attractiveness of their own landscapes, external drivers such as changes in agricultural production structures (e.g. abandonment of marginal areas in uplands, amplifica-tion of maize production) lead also to a deterioration in the supply of recreation-related eco-system services.
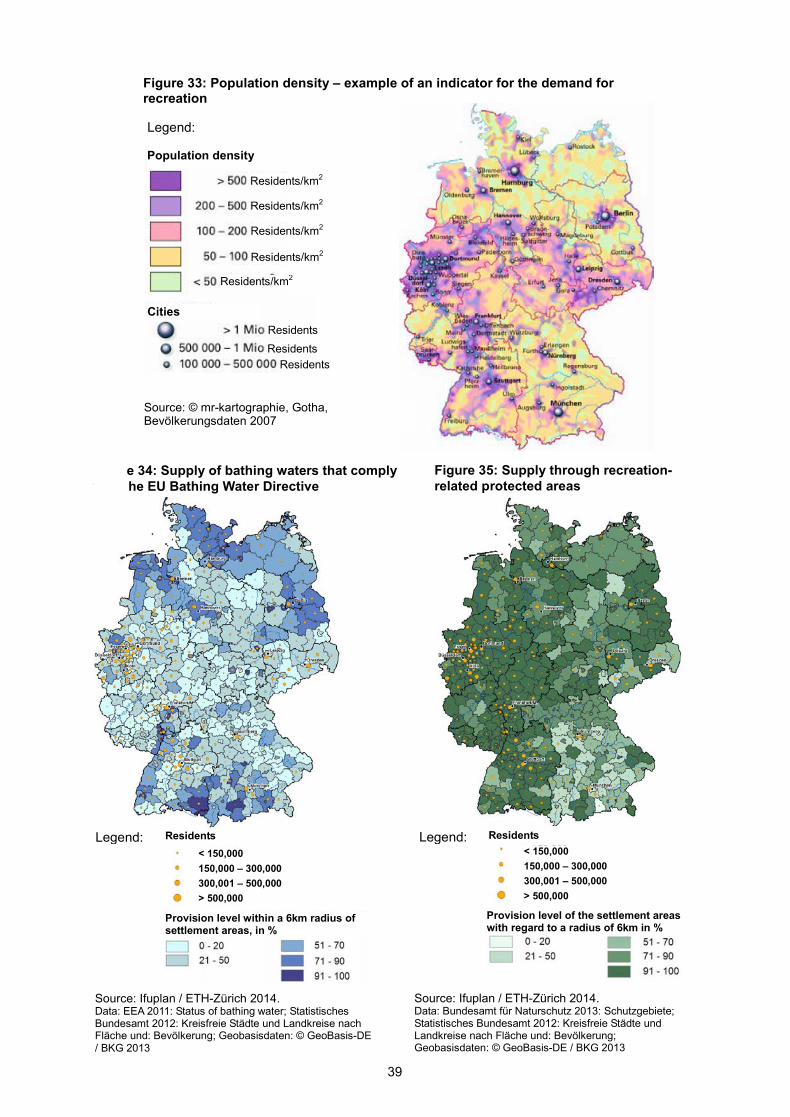
2.3.1 Suitability of the countryside for recreation The range of recreational activities in the countryside and the variety of recreational areas available to those seeking relaxation depends not only on natural conditions, but to a con-siderable degree also on socio-economic factors such as, for example, the population densi-ty, the recreational infrastructure including transport connection, the notoriety of communities as attractive recreation areas, etc. Still, those natural conditions which cannot be, or can only to a limited extent be, influenced by humans, such as the presence of water bodies (lakes, seas) and mountains (low mountain ranges, Alps) are to a large degree significant for the selection of landscapes for recreation.
Ecosystem parameters suitable for recreation which can be influenced include the quality of flowing and still waters and the nature and diversity of the various land uses (arable, grass-land, forest, mixing ratio of said use types, structuring landscape elements, etc.). In addition, the fact that the positive effects of landscape features, ecosystems and landscapes can be made partially ineffective by anthropogenic stress factors, including transport infrastructure and settlements should also be taken into account.
So that indicators for ecosystem services in the area of recreation do not become too com-plex, and can be formulated in a politically-relevant manner, it should be examined whether
37
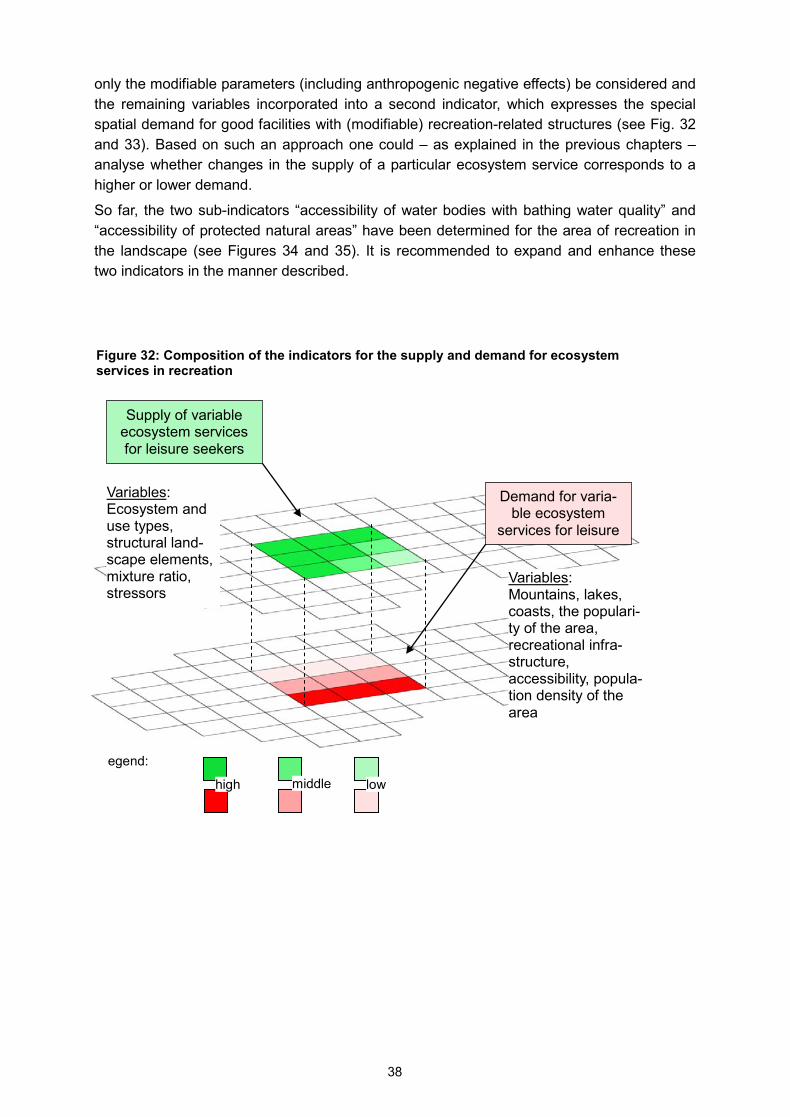
only the modifiable parameters (including anthropogenic negative effects) be considered and the remaining variables incorporated into a second indicator, which expresses the special spatial demand for good facilities with (modifiable) recreation-related structures (see Fig. 32 and 33). Based on such an approach one could – as explained in the previous chapters – analyse whether changes in the supply of a particular ecosystem service corresponds to a higher or lower demand.
So far, the two sub-indicators “accessibility of water bodies with bathing water quality” and “accessibility of protected natural areas” have been determined for the area of recreation in the landscape (see Figures 34 and 35). It is recommended to expand and enhance these two indicators in the manner described.
L
Supply of variable ecosystem services for leisure seekers
Demand for varia-ble ecosystem
services for leisure
Variables: Ecosystem and use types, structural land-scape elements, mixture ratio, stressors
Variables: Mountains, lakes, coasts, the populari-ty of the area, recreational infra-structure, accessibility, popula-tion density of the area
egend:
high middle low
Figure 32: Composition of the indicators for the supply and demand for ecosystem services in recreation
38
Figurwith t
Figure 35: Supply through recreation-related protected areas
Legend: < 150,000 150,000 – 300,000 300,001 – 500,000 > 500,000
Residents
Figure 33: Population density – example of an indicator for the demand for recreation
Legend:
Population density
Cities
Residents/km2
Residents/km2
Residents/km2
Residents/km2
Residents/km2
Residents Residents
Residents
Source: © mr-kartographie, Gotha, Bevölkerungsdaten 2007
e 34: Supply of bathing waters that comply he EU Bathing Water Directive
Legend: < 150,000 150,000 – 300,000 300,001 – 500,000 > 500,000
Residents
Provision level within a 6km radius of settlement areas, in %
Source: Ifuplan / ETH-Zürich 2014. Data: EEA 2011: Status of bathing water; Statistisches Bundesamt 2012: Kreisfreie Städte und Landkreise nach Fläche und: Bevölkerung; Geobasisdaten: © GeoBasis-DE / BKG 2013
Source: Ifuplan / ETH-Zürich 2014. Data: Bundesamt für Naturschutz 2013: Schutzgebiete; Statistisches Bundesamt 2012: Kreisfreie Städte und Landkreise nach Fläche und: Bevölkerung; Geobasisdaten: © GeoBasis-DE / BKG 2013
Provision level of the settlement areas with regard to a radius of 6km in %
39
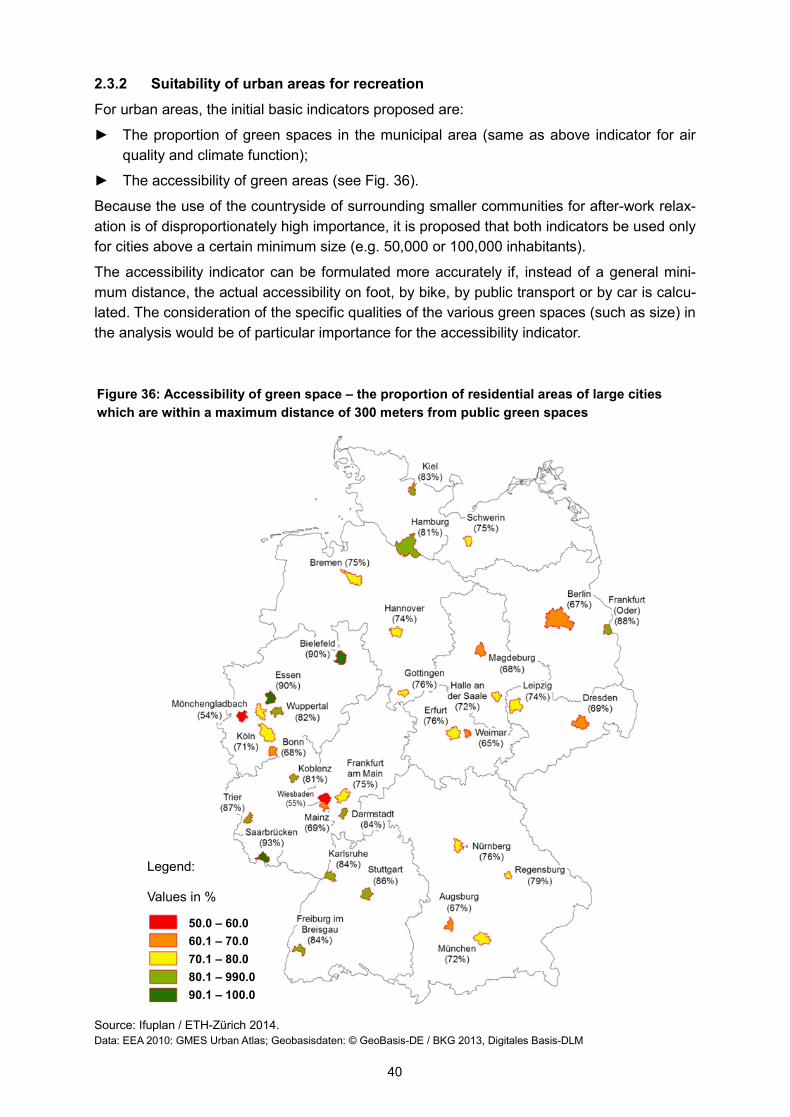
2.3.2 Suitability of urban areas for recreation
For urban areas, the initial basic indicators proposed are:
► The proportion of green spaces in the municipal area (same as above indicator for air quality and climate function);
► The accessibility of green areas (see Fig. 36).
Because the use of the countryside of surrounding smaller communities for after-work relax-ation is of disproportionately high importance, it is proposed that both indicators be used only for cities above a certain minimum size (e.g. 50,000 or 100,000 inhabitants).
The accessibility indicator can be formulated more accurately if, instead of a general mini-mum distance, the actual accessibility on foot, by bike, by public transport or by car is calcu-lated. The consideration of the specific qualities of the various green spaces (such as size) in the analysis would be of particular importance for the accessibility indicator.
Legend: Values in %
Figure 36: Accessibility of green space – the proportion of residential areas of large cities which are within a maximum distance of 300 meters from public green spaces
50.0 – 60.0 60.1 – 70.0 70.1 – 80.0 80.1 – 990.0 90.1 – 100.0
Source: Ifuplan / ETH-Zürich 2014. Data: EEA 2010: GMES Urban Atlas; Geobasisdaten: © GeoBasis-DE / BKG 2013, Digitales Basis-DLM
40
Supplement through a representative sample set for supply and demand of recreational areas Indicators emanating from recreation suitability of ecosystems have the disadvantage that use and needs aspects are only taken into account as auxiliary variables (e.g. population density, as above). A more accurate assessment of the provision of the German population with ecosystem services for after work and weekend leisure could be based on a representa-tive sample of residential locations and the subsequent GIS-based analysis of the recrea-tional facilities at different distances from the respective place of residence. Detailed usage and demand data could be also collected, which would include the recreational-relevant an-thropogenic infrastructure (e.g. biking trails, opportunities for recreational sports, etc.).
3. Notes on selected questions – information regarding the further development of indicators
3.1 Requirements on the accuracy of collection and analysis: warning system or contribution to a welfare index
Indicators for ecosystem services can be understood as being a type of warning system which has the function of identifying potential problems in advance. Should continuing nega-tive trends appear or should warning thresholds be exceeded, detailed follow-up studies could be used to determine whether or not present or future welfare losses are to be ex-pected by a decline in ecosystem services and how severe these problems will be. Such warning indicators would provide only the minimum requirements for accuracy of the detec-tion and evaluation. The indicators proposed above should meet the requirements of an ap-propriate objective for the subject area.
On the other hand, indicators with more stringent accuracy requirements are those that cor-relate closely enough with current or future welfare losses or gains to be able to support de-cisions as to where the highest need for counter measures appear. Such indicators would have to be, for example, suitable for comparing different spatial characteristics with each other. The proposed set of indicators should meet the corresponding requirements in at least some cases.
The highest requirements for collection and evaluation exist if indicators demonstrate welfare changes through loss or gain of ecosystem services in such a way that they can be com-pared with each other and also with welfare changes on the product market. The above-mentioned indicators do not fulfil this requirement in their present formulation. They could, however, potentially provide important input information for appropriate indicators.
Action 5 requires, in addition to the detection and assessment of the ecosystem services, the assessment of the condition of the ecosystems themselves. Once national site-specific data are available, it should be assessed whether consideration of this additional data improves the informative accuracy of the assessment of the ecosystem services.
41
3.2 Indicators for conditions and/or development opportunities of ecosystem services
Often, environmental indicators focus on describing the current environmental conditions; in the present case, this would be the current performance and potential of the ecosystems. The goal here is to initiate targeted counter measures should negative trends appear or sus-tained loads be present. A perspective based only on the current conditions is not sufficient, particularly for ecosystem services.
Indicators for ecosystem services should not only illustrate the dependence of man on nature but also have the function of allowing society to keep an eye on the possibilities that nature offers. The objective, therefore, is the long-term and sustainable use and protection of nature and ecosystems to the benefit of present and future generations, without destroying it/them. To this end it, the current performance of ecosystems, as well as the development opportuni-ties, should be considered. If, for example, floodplains have largely lost their function for wa-ter retention through the building of narrow dikes, it is not enough to focus on the prevention of a further narrowing of the river, but also consider the possibilities offered by restoring natu-ral floodplains for flood protection and other ecosystem services. The same applies to the function of wetland restoration for climate protection. Indicators for ecosystem services should therefore be designed, whenever possible, to identify not only losses, but also fa-vourable, so far unused development opportunities.
The illustration of development potential also offers additional opportunities for demonstrat-ing synergies between the protection and development of ecosystem services and the de-velopment of favourable conditions for the development of biological diversity.
3.3 Consideration of supply and demand
Currently available data on some ecosystem services are insufficient to generate reliable in-dicators for the actual use of the ecosystem service. Examples are the effect of water reten-tion on flood damage, the effect of pollination, plant protection and erosion protection func-tions of small structures in the agricultural landscape on agricultural production and the con-tribution of ecosystems to the actual recreational use.
The recreational uses of landscapes must, for example, not necessarily be high there where the landscape is particularly diverse and attractive. Less attractive landscapes can also be important for relaxation, when they are near densely populated areas where a higher need for relaxation exists. A similar relationship exists for water retention and flood damage pre-vention. A relatively small volume of additional water retention can be very important in par-ticular hydrological and geographical situations for society if it prevents particularly costly flood damage. In such cases where the spatially specific supply of ecosystem services is matched by a spatially specific demand, it is proposed that, in addition to the indicator for the supply of ecosystem services (or for the suitability of an ecosystem for a specific use), a second indicator which reflects the specific demand for the ecosystem service at this location be used.
This method would make it possible to draw conclusions about which changes in the supply of ecosystem services have taken place in areas of high, and which in areas of low demand, which can be essential for a societal evaluation.
Alternatively, one could also try to model the relationship between supply and demand and build a complex indicator for the value of the services actually used. Such an approach is
42
only helpful if the modelling is sufficiently scientifically validated and the resulting complex indicator remains easy to understand.
It should be examined, in which of these areas progress can be achieved in the future.
3.4 Current, future or potential services
Ecosystem services are, according to the prevailing definition, goods and services provided by nature that contribute to individual and social welfare. According to this definition, it is not a priori determined whether it describes solely the current use or also the future contribution or – even further reaching – to the acquisition of future usability (potential) in terms of a so-called option value.
As a rule, long-term effects are crucial for public decisions. In order to estimate these it is necessary to, inter alia, predict future changes in the supply and demand for ecosystem ser-vices. On this basis it is possible to design alternative scenarios which can support long-term decisions better than a simple assessment of the current situation. It is necessary to exam-ine in which areas these scenarios will be of particularly importance in the future.
An easily implementable recommendation that arises from the uncertainty of future develop-ment is to always consider, in addition to the currently used services, the (present and future) services available as well as – to use related terms – the performance of their potential or capacity. Such an approach is also in line with the German Nature Conservation Act for the preservation of the capacity of the natural environment. In addition, it also meets the re-quirements for a full national account. A national account includes, in addition to the so-called “income account” which contains the current transactions of the last economic period, a so-called “capital account” as well. In the capital account, the scope and the changes in the various capitals are reproduced. If a high consumption is achieved through the reduction of capital, this usually means less potential for earning income in the future periods. Such rela-tionships also apply to the current use and the future supply of ecosystem services.
In the proposed set of indicators, the supply of ecosystem services is, as a rule, always rep-resented.
3.5 Differentiating between ecosystem service and product
Ecosystem services are involved in the generation of a variety of products, from the produc-tion of the drinking water that is supplied to each household to agriculture, forestry, fishing products. Often the quantity of the products produced is used as an indicator of ecosystem service (these quantities are regularly statistically recorded). This can be problematic.
Reduced soil fertility caused by erosion or loss of arable land through settlement activity can be compensated by increasing the input in the same or another place. An indicator that de-tects only the amount of product would insufficiently or not at all reflect the loss of soil fertility.
Better suited for the representation of ecosystem services are, therefore, indicators which do not measure the level of production, but rather nature's contribution to the production of the products within a broader production function, which also takes into account other anthropo-genic contributions.
One such indicator is the Muencheberg Soil Quality Rating, which is tied historically and conceptually to the land valuation of the so called “Reichsbodenschätzung” which began in 1935. This method mathematically links soil characteristics to other performance-critical site conditions, resulting in a total value which correlates with the soil quality for farming of the
43

respective location. This indicates, in the case of a score of 40 and a score of 80, that the crop produced on the 80-scored soil will normally be twice the size as the crop produced on a 40-scored soil. It is possible that the values calculated are not completely independent of changes through human use, as it is perhaps economically optimal to vary the input depend-ing on the soil fertility. At a minimum, the use of an indicator based on natural conditions pre-vents misinterpretation, if yield changes are attributable to changes in human input.
It should be noted in this context that in the economic analysis, the value of the contribution of soil or areas to production is seen, as a general rule, only in the so-called ground rent, which is expressed as lease price. The ground rent includes only a part of the product price. Even in economic terms, the value of the ecosystem service is not the total value of the product but makes up only a part of the product price.
3.6 Intermediate and final ecosystem services – avoid double counting
Another frequently discussed aspect is the difference between intermediate and final ecosys-tem services. Hedges and copses in agricultural landscapes can reduce water and wind ero-sion, thereby maintaining the contribution of soils to crop production as well as soil fertility. One of the indicators for the future development of fertility of soils in erosion-prone land-scapes is therefore endowment of erosion mitigation landscape features. The fertility of soils and their development can also be measured directly, for example through soil sample measurements.
The contribution of landscape elements to the mitigation of soil erosion is an intermediate ecosystem service. Soil fertility and the contribution of soils to crop production would, in this case, be the final service. If both intermediate and final services are measured, the possibil-ity that some double counting can occur must be considered.
The proposed indicator “natural fertility of arable soils” does not present this risk, as the Muencheberg Soil Quality rating is based on pedological data that does not reflect current changes in the soil conditions. The values are, as it were, “fixed”. The indicator value only changes when agricultural soils are re-zoned, for instance, for residential and traffic use.
An estimation of erosion processes is therefore suitable for providing additional information about the further development of soil fertility which is not shown by the data of the Soil Quali-ty Rating.
A contrasting problem can occur when a single indicator represents different services. The proportion of small structures in the agricultural landscape represents pollination, pest con-trol, prevention of wind and soil erosion and recreational suitability. The proportion of public green spaces in urban areas is proposed as a (very) rough indicator of the recreational benefits of urban green areas and also as an indicator of air filtration and microclimatic ef-fects that have positive effects on health. This variety of services must be taken into account in the interpretation of the indicator values and their changes.
3.7 Use of simple or complex data modelling
Modelling will only be used for a few of the proposed set of indicators. Only the Muencheberger Soil Quality Rating, the indicator for the relative protection of groundwater resources through soil and geological layers and the estimation of soil loss due to water ero-sion provides a modelling of ecological cause and effect relationships. In the other cases on-ly “basic” data is shown.
44
A modelling of ecological links or supply-demand relationships (see above) can help to im-prove the assessment of services. Examples are:
- Flood modeling depending on the capacity for water retention - Modeling of pollination as a function of the distance between loading pollinator population
and acreage of different crops - Modeling of erosion reduction through linear structures as a function of slope, crop and
orientation of the structure - Comprehensive modeling of the nitrate content in groundwater - Effect of urban green areas on maximum temperatures - Modeling of the visitation of recreational areas as a function of recreational suitability, ac-
cessibility and population density - Etc.
Sufficient data bases, appropriate use of modelling and sufficiently reliable modeling ap-proaches that are recognized both by expert as well as by non-experts and that lead to re-sults that are easily interpreted are prerequisite for the successful use of modeling for better informed policy decisions.
These requirements were assumed as being fulfilled for the three complex indicators men-tioned above. If the requirements for the additional, above proposed models are met is not clear, at least in terms of nationwide applicability.
In order to further develop the indicators, modelling approaches which are suitable for the production of greater significant results must be examined.
3.8 Previously unrecognized ecosystem services
The indicators presented above cover, directly and indirectly, a large fraction of the ecosys-tem services specified in the CICES catalogue (see Table 2).
The remaining gaps (see Table 3) are explained mainly by the fact that:
- Some ecosystem services are currently insufficiently defined (e.g. many cultural benefits, see 2.3 above);
- Certain ecosystem services in Germany are not at risk or their use is already regulated to the extent that further need for government intervention is doubtful (e.g. game species; biomass stored in living plant biomass, see Chapter 2.2.5 and Figure 26; the quantitative water supply, due to the high supply and falling demand, see Chapter 2.1);
- Some ecosystem services have such low importance for Germany that incorporation into a national indicator set does not make sense (e.g. commercial fishing in inland waters);
- In some cases, the evaluation of ecosystem services deliver results that are very similar to an evaluation of biodiversity carried out for the same area. In these cases such ecosys-tem services are not regarded in this paper.
Previously, only a relatively small group of experts have participated in the selection of rele-vant ecosystem services. The list should therefore be reviewed once again by a broader panel of experts.
The ecosystem services specific to seas and coasts have not been considered in the drafting of the proposed set of indicators. This must be performed in a subsequent step.
45
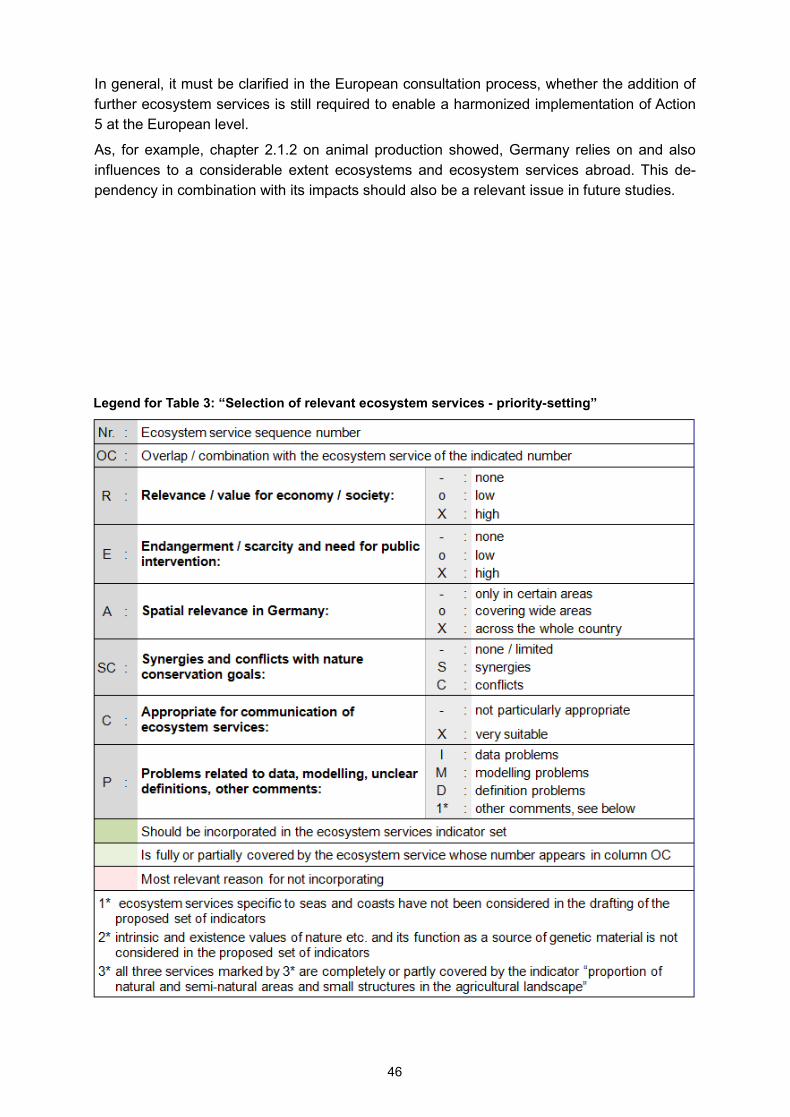
In general, it must be clarified in the European consultation process, whether the addition of further ecosystem services is still required to enable a harmonized implementation of Action 5 at the European level.
As, for example, chapter 2.1.2 on animal production showed, Germany relies on and also influences to a considerable extent ecosystems and ecosystem services abroad. This de-pendency in combination with its impacts should also be a relevant issue in future studies.
Legend for Table 3: “Selection of relevant ecosystem services - priority-setting”
46
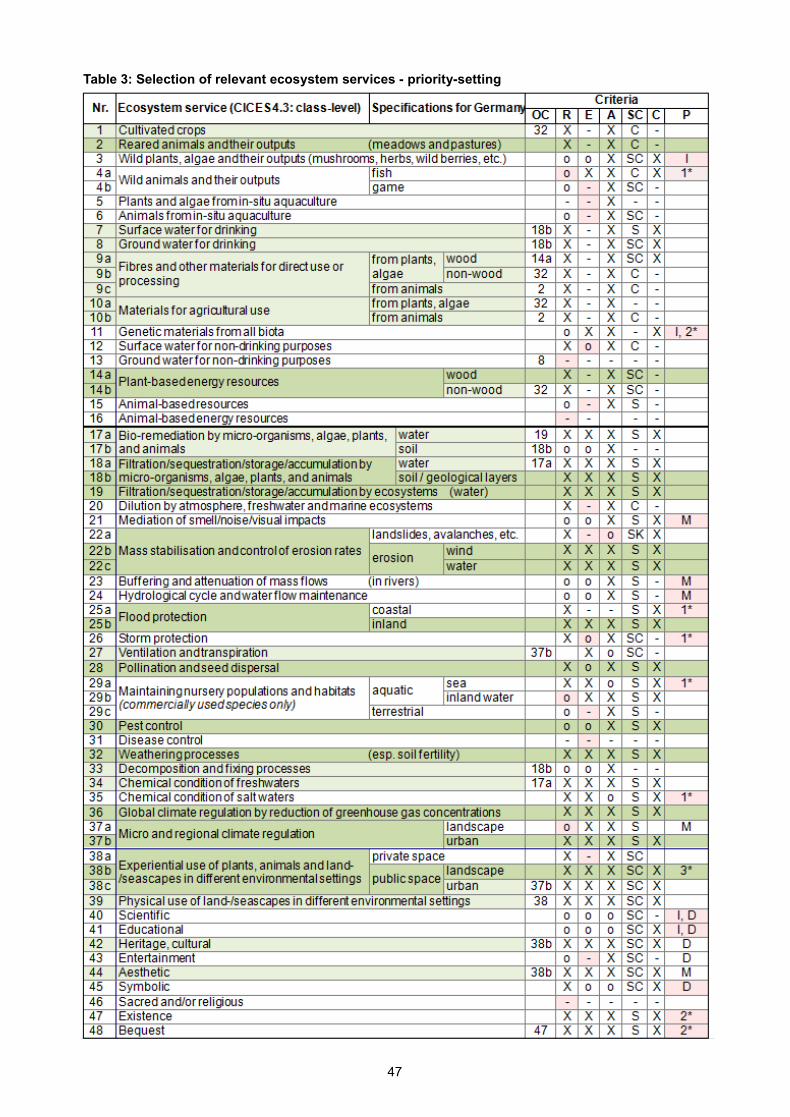
Table 3: Selection of relevant ecosystem services - priority-setting
47
Literature / Sources
Arle, J.; Blondzik, K; Claussen U.; Duffek, A.; Grimm, S.; Hilliges, F.; Hoffmann, A.; Leujak, W.; Mohaupt, V.; Naumann, S.; Pirntke, U.; Richter, S.: Schilling, P.; Schroeter-Kermani, C.; Ullrich, A.; Wellmitz, J.; Werner, S.; Wolter R.: (2013): Wasserwirtschaft in Deutschland, Teil 2 – Gewässergüte. Herausgeber: Bundesministerium für Umwelt, Naturschutz und Reaktorsicherheit, Berlin.
Burkhard, B.; Kandziora, M.; Hou, Y.; Müller, F. (2014): Ecosystem Service Potentials, Flows and Demands – Concepts for Spatial Localisation, Indication and Quantification. Landscape Online 34:1-32 (2014).
BDEW (Bundesverband der Energie- und Wasserwirtschaft e.V.) 2013: Wasserfakten im Überblick. http://abwasser-online.de/internet.nsf/id / http://www.bdew.de/internet.nsf/id (Abfrage: 11.03.2014)
BMEL (Bundesministerium für Ernährung und Landwirtschaft und Verbraucherschutz): Bundeswaldinventur. https://www.bundeswaldinventur.de/index.php?id=2.html sowie https://bwi.info/, Download 22.07.2015
BMELV (Bundesministerium für Ernährung, Landwirtschaft und Verbraucherschutz) (Hrsg.) (2013): Statistisches Jahrbuch über Ernährung, Landwirtschaft und Forsten 2012. Münster-Hiltrup (Landwirtschaftsverlag).
BMUB (Bundesministerium für Umwelt, Naturschutz, Bau und Reaktorsicherheit) (2013): Gemeinsam für die biologische Vielfalt. Rechenschaftsbericht 2013. http://www.bmub.bund.de/service/publikationen/downloads/details/artikel/bmu-hintergrundpapier/?tx_ttnews%5BbackPid%5D=289
BMU und BMELV (Bundesministerium für Umwelt, Naturschutz und Reaktorsicherheit und Bundesministerium für Ernährung, Landwirtschaft und Verbraucherschutz) (Hrsg.) (2012): Nitratbericht 2012. Gemeinsamer Bericht der Bundesministerien für Umwelt, Naturschutz und Reaktorsicherheit sowie für Ernährung, Landwirtschaft und Verbraucherschutz, S. 37/38) http://www.bmu.de/fileadmin/bmu-import/files/pdfs/allgemein/application/pdf/nitratbericht_2012_bf.pdf
BNatSchG: Bundesnaturschutzgesetz vom 29. Juli 2009 (BGBl. I S. 2542), zuletzt geändert durch Artikel 4 Absatz 100 des Gesetzes vom 7. August 2013 (BGBl. I S. 3154).
Bormann, K.; Dieter, M.; Englert, H.; Küppers, J.-G.; und Rosin, A. (2006): Die Waldgesamtrechnung als Teil einer integrierten ökologischen und ökonomischen Berichterstattung. Hamburg (Bundesforschungsanstalt für Forst- und Holzwirtschaft Hamburg – Institut für Ökonomie) und Wiesbaden (Statistisches Bundesamt). https://www.destatis.de/DE/Publikationen/Thematisch/UmweltoekonomischeGesamtrechnungen/Waldgesamtrechnung.html
Bundesamt für Naturschutz (Hrsg.) (2008): Daten zur Natur 2008.Münster, Landwirtschaftsverlag.
Bundesamt für Naturschutz (2014): Kartendienst. http://www.geodienste.bfn.de/schutzgebiete/ Download 14.07.2014
Bundesamt für Naturschutz (2014): High Nature Value Farmland-Indikator - Ein Indikator für Landwirtschaftsflächen mit hohem Naturwert in Deutschland. http://www.bfn.de/0315_hnv.html, Download 30.07.2014
Bundesanstalt für Geowissenschaften und Rohstoffe: Ackerbauliches Ertragspotential der Böden in Deutschland. http://www.bgr.bund.de/DE/Themen/Boden/Ressourcenbewertung-management/Ertragspotential/Ertragspotential_node.html, Download: 13.06.2014.
Bundesanstalt für Geowissenschaften und Rohstoffe: Potentielle Erosionsgefährdung durch Wasser. http://www.bgr.bund.de/DE/Themen/Boden/Ressourcenbewertung-management/Bodenerosion/Wasser/Karte_Erosionsgefahr_node.html, Download 13.06.2013
48
CBD 2010: Strategic Plan for Biodiversity 2011-2020, including Aichi Biodiversity Targets. http://www.cbd.int/sp/targets/.
CICES see: Haines-Young and Potschin 2013. Deutsches Biomasseforschungszentrum gGmbH (Hrsg.) (2013): Stromerzeugung aus
Biomasse, 03MAP250, Zwischenbericht. Projektleitung: M. Scheftelowitz, Projektbearbeitung: J. Daniel-Gromke et al. https://www.dbfz.de/web/fileadmin/user_upload/Referenzen/Berichte/biomassemonitoring_zwischenbericht_bf.pdf, Download: 13.06.2014
Europäische Kommission (2011a): Mitteilung der Kommission an das Europäische Parlament, den Rat, den Europäischen Wirtschafts- und Sozialausschuss und den Ausschuss der Regionen: Ressourcenschonendes Europa – eine Leitinitiative innerhalb der Strategie Europa 2020 Brüssel, den 26.01.2011, KOM(2011) 21, ec. http://ec.europa.eu/resource-efficient-europe/index_de.htm
Europäische Kommission (2011b): Mitteilung der Kommission an das Europäische Parlament, den Rat, den Europäischen Wirtschafts- und Sozialausschuss und den Ausschuss der Regionen: Lebensversicherung und Naturkapital: Eine Biodiversitätsstrategie der EU für das Jahr 2020, Brüssel, den 25.10.2011, KOM(2011) 244 endgültig/2. http://ec.europa.eu/environment/nature/biodiversity/comm2006/2020.htm
Fachagentur für nachwachsende Rohstoffe: Anbaufläche für nachwachsende Rohstoffe. http://mediathek.fnr.de/grafiken/pressegrafiken.html, Download: 13.06.2014
Fuchs, D., Hänel, K., Lipski, A., Reich, M., Finck, P., Riecken, U. (2010): Länder-übergreifender Biotopverbund in Deutschland. Grundlagen und Fachkonzept. Ergebnisse aus den Forschungs- und Entwicklungsvorhaben „Länderübergreifende Achsen des Biotopverbunds“ (FKZ 804 85 005) und „Biotopverbundachsen im europäischen Kontext“ (FKZ 08 85 0400) im Auftrag des Bundesamtes für Naturschutz, Naturschutz und Biologische Vielfalt 96, 191 S. Updated Map, Bundesamt für Naturschutz 2013: http://www.bfn.de/0311_karte_nat_biotopverbund.html, Download: 14.06.2014
Götzl, M.; Schwaiger, E.; Sonderegger, G.; Süßenbacher, E. (2011): Ökosystemleistungen und Landwirtschaft. Erstellung eines Inventars für Österreich. Wien (Umweltbundesamt) Report REP-0355.
Graßl, H. (1997): Brisante Mischung – Böden und globaler Wandel. In: Kümmerer, K./ Schneider, M./ Held, M. (Hrsg.): Bodenlos – Zum nachhaltigen Umgang mit Böden. Politische Ökologie 15, Sonderheft 10. München (ökom-Verlag), S. 12-16.
Haines-Young, R. and Potschin, M. (2013): Common International Classification of Ecosystem Services (CICES): Consultation on Version 4, August-December 2012. EEA Framework Contract No EEA/IEA/09/003. http://www.cices.eu and spread sheet, Download: 13.06.2014
Ifuplan, ETH-Zürich, Universität Bayreuth (2014): TEEB-Deutschland Übersichtsstudie, Teil A: Bilanzierung von Ökosystemleistungen.F+E Vorhaben 3510 81 0500, TEEB-Deutschland Übersichtsstudie Teil A: Bilanzierung von Ökosystemleistungen Forschungsbericht, F+E Vorhaben 3510 81 0500 im Auftrag des Bundesamtes für Naturschutz. Ifuplan Institut für Umweltplanung, München (Ifuplan); ETH-Zürich, Institut für Raum und Landschaftentwicklung; Universität Bayreuth – Lehrstuhl für Ökosystemleistungen.
Julius Kühn Institut (Bundesforschungsinstitut für Kulturpflanzen): Kleinstrukturen in der Ag-rarlandschaft. http://www.jki.bund.de/no_cache/de/startseite/fachinformationen/pflanzenschutz/pflanzenschutzverfahren/kleinstrukturen.html, Download: 13.06.2014
Keller, R.; Schweppe-Kraft, B. und Schwarzl, B. (2014): Perspektiven des Ökosystemleis-tungsansatzes – Ergebnisse aus Deutschland, Österreich und der Schweiz. Natur und Landschaft 89 (2014): 03.
49
Landesamt für Landwirtschaft, Umwelt und ländliche Räume des Landes Schleswig-Holstein (Endredaktion und Herausgabe) (2012): Eine Vision für Moore in Deutschland. Poten-tiale und Ziele zum Moor- und Klimaschutz. Gemeinsame Erklärung der Naturschutz-behörden. Flintbek (Landesamt für Landwirtschaft, Umwelt und ländliche Räume des Landes Schleswig-Holstein). https://www.umweltdaten.landsh.de/nuis/upool/gesamt/moore/moorresolution.pdf
MA – Millenium Ecosystem Assessment (2005): Ecosystems and Human Well-Being – Synthesis. Washington, D. C. http://www.maweb.org/documents/document.356.aspx.pdf
Maes, J. et al. (2013): Mapping and Assessment of Ecosystems and their Services. An ana-lytical framework for ecosystem assessments under action 5 of the EU biodiversity strategy to 2020. Publications office of the European Union, Luxembourg. http://ec.europa.eu/environment/nature/knowledge/ecosystem_assessment/pdf/MAESWorkingPaper2013.pdf
Maes, J. et al. (2014): Mapping and Assessment of Ecosystems and their Services. Indica-tors for ecosystem assessments under Action 5 of the EU Biodiversity Strategy to 2020. 2nd Report – Final, February 2014. European Commission, Publications Office, Technical Report 2014 – 080. http://ec.europa.eu/environment/nature/knowledge/ecosystem_assessment/pdf/2ndMAESWorkingPaper.pdf
Meyerhoff, J., Angeli, D., Hartje, V. (2012): Valuing the benefits of implementing a national strategy on biological diversity - the case of Germany. Environmental Science & Poli-cy 23, 109-119.
Mueller, L.; Schindler, U.; Behrendt, A. Eulenstein, F.; Dannowski, R. (2007): The Muencheberg Soil Quality Rating (SQR). Field manual for Detecting and Assessing Properties and Limitations for Cropping and Grazing. Muencheberg, Leibniz-Zentrum fuer Agrarlandschaftsforschung (ZALF). https:// www.zalf.de/forschung/institute/lwh/mitarbeiter/lmueller/Documents/field_mueller.pdf
Naturkapital Deutschland – TEEB DE (2014): Naturkapital und Klimapolitik – Synergien und Konflikte. Kurzbericht für Entscheidungsträger. Technische Universität Berlin, Helm-holtz-Zentrum für Umweltforschung – UFZ, Leipzig. http://www.naturkapital-teeb.de/publikationen/projekteigene-publikationen.html
Nedkov, S. und Burkhard B. (2012): Flood regulating ecosystem services - Mapping supply and demand, in the Etropole municipality, Bulgaria. - Ecological Indicators 21: 67-79
Neukampf, R. (Julius Kühn Institut, Braunschweig 2010): Monitoring von Kleinstrukturen – Berechnung des Anteils von Wiedererholungsflächen auf der Basis von Atkis. Vortrag zum 2. Dresdner Flächennutzungssymposium 17./18. Juni 2010. http://www.ioer-monitor.de/fileadmin/Dokumente/Symposium_2010/ NEUKAMPF_Wiedererholungsflaechen.pdf
PAN, IFAB & INL (2011): Umsetzung des High Nature Value Farmland-Indikators in Deutsch-land – Ergebnisse eines Forschungsvorhabens (UFOPLAN FKZ 3508 89 0400) im Auftrag des Bundesamtes für Naturschutz (Bearbeitung durch: PAN Planungsbüro für angewandten Naturschutz, Institut für Agrarökologie und Biodiversität und Institut für Landschaftsökologie und Naturschutz).- München, Mannheim und Singen: 54 S. https://www.bfn.de/fileadmin/MDB/documents/themen/monitoring/Projektbericht_HNV_Maerz2011.pdf
Senatsverwaltung für Stadtentwicklung und Umwelt: Umweltatlas Berlin, Map: 05.08 Bio-toptypen: Biotopwerte. http://fbinter.stadt-berlin.de/fb/index.jsp Listenabschnitt „Um-weltatlas“ Map: „Biotoptypen: Biotopwerte“, Download 27.08.2014.
Scholz, M.; Mehl, D.; Schulz-Zunkel, C.; Kasperidus, H.D.; Born, W. und Henle, K. (2012): Ökosystemfunktionen von Flussauen - Analyse und Bewertung von Hochwasserre-tention, Nährstoffrückhalt, Kohlenstoffvorrat, Treibhausgasemissionen und Habitat-funktion. Naturschutz und Biologische Vielfalt 124: 257 S.
50
Schweppe-Kraft, B. (2013): Europäische Biodiversitätsstrategie, Ziel 2 - Maßnahme 5: Neue Impulse für die Landschaftsplanung. BBN-Mitteilungen 2013, Bundesverband Berufli-cher Naturschutz e.V., Bonn.
Statistische Ämter des Bundes und der Länder: Atlas Agrarstatistik. http://www.statistik-portal.de/Statistik-Portal/GenesisUebersicht.asp, http://www.atlas-agrarstatistik.nrw.de/, Download: 13.06.2014
Schopp-Guth, A. (1999): Renaturierung von Moorlandschaften. In BfN-Schriftenreihe für Landschaftspflege und Naturschutz, Heft 57, 219 S.
Statistisches Bundesamt 2015: Wald und Holz. www.destatis.de/DE/ZahlenFakten/Wirtschaftsbereiche/LandForstwirtschaftFischerei/WaldundHolz/Aktuell.html, Download: 14.07.2015
Staub, C.; Ott, W. et al. (2011): Indikatoren für Ökosystemleistungen: Systematik, Methodik und Umsetzungsempfehlungen für eine wohlfahrtsbezogene Umweltberichterstat-tung. Bundesamt für Umwelt, Bern. Umwelt-Wissen Nr. 1102: 106 S.
TEEB (2010): Die Ökonomie von Ökosystemen und Biodiversität: Die ökonomische Bedeu-tung der Natur in Entscheidungsprozesse integrieren. Ansatz, Schlussfolgerungen und Empfehlungen von TEEB – eine Synthese. http://www.teebweb.org/Portals/25/TEEB%20Synthesis/TEEB_Synthesis_german_web%5B1%5D.pdf
Umweltbundesamt (2010): Die Böden Deutschlands. Ein Reiseführer - Sehen, Erkunden, Verstehen. http://www.umweltdaten.de/publikationen/fpdf-l/4161.pdf, Download: 28.01.2013
Umweltbundesamt (2012): Berichterstattung unter der Klimarahmenkonvention der Vereinten Nationen und dem Kyoto-Protokoll 2012. Nationaler Inventarbericht zum Deutschen Treibhausgasinventar 1990 – 2010. Dessau-Roßlau (Umweltbundesamt), Climate Change 08/2012. http://www.umweltbundesamt.de/publikationen/berichterstattung-unter-klimarahmenkonvention-1
Von Haaren, C.; Albert, C.; Barkmann, J.; de Groot, R. S.; Spangenberg, H. J.; Schröter-Schlaack, C.; Hansjürgens, B. (2014) From Explanation to Application: Introducing a Practice-Oriented Ecosystem Services Evaluation (PRESET) Model Adapted to the Context of Landscape Planning and Management. Landscape Ecology, Vol. 29, pp 1335-1346.
Wurbs, D. und Steininger, M. (2011): Wirkungen der Klimaänderungen auf die Böden – Un-tersuchungen zu Auswirkungen des Klimawandels auf die Bodenerosion durch Was-ser. UBA-Texte, 16/2011. Dessau-Roßlau.
51