Embed Size (px)
Citation preview

Development of ORBIT Data Generation and Exploration Routines
G. ShelburneK. Indireshkumar
E. Feibush

Outline● Overview of ORBIT● Our Goals over the Summer● Methods Used, and Accomplishments● Conclusion● Future Work

What is ORBIT?
ORBIT is a program written in Fortran that numerically integrates the Hamiltonian equations of guiding center motion in axisymmetric magnetically confined plasmas.
Developed by R.B. White

Issues● ORBIT Data
– ORBIT in its previous form produced a single data file, readable only by NCAR
– In some instances, depending on user discretion, it produced minimal ASCII data
● NCAR
– outdated graphics software
– little or no interaction with data
– requires the use of ctrans to convert the metafile
– limited capabilities

Goals● Save ORBIT computed data
– Easily understandable conventions
– Flexible for use with any option
– Portable netCDF format● Replace the NCAR graphics software
– SM (formerly SuperMongo)
– ElVis

The NCAR graphics package
● Until recent developments, NCAR was the main visualization device used in conjunction with ORBIT.
● SM was also used, however the use of SM required data files.

Graphical Limitations
● NCAR does not directly view data● Poor visualization devices
● NCAR X windows are essentially "pictures"● Data cannot easily be compared to one another● Data cannot be explored● This would require: changes to NCAR protocols● re-compiling, and re-running the program for each change

ORBIT DataInitially, the little data being produced were only being
produced in select sets and for select modes of operation.
Data were going directly to NCAR, then to the metafile.

Solution:Bypass NCAR graphics calls, instead write the data in portable
binary format. We use netCDF format for writing our data.
Data can then be accessed by multiple users, and allows easy comparison across ORBIT configurations. Can be publicly viewed.
Object oriented, scientific data standard.
Next Step: Find out how data is being used.

How data in ORBIT is being used:
Orbsub
sets initial equilibrium values stores information in C files
retrieves particle scatter information (gyro-kinetic values)
creates post-scatter particle plots and histograms
accesses spline interface (MHD values)
creates field equilibrium plots

Program Structure
● Data are computed and passed through various subroutines within the ORBIT program structure.
● Data are sent from these routines into NCAR graphics calls.● There are no central locations storing the initial data values and
the final data values.
– We must retrieve these values according to where they are calculated
– We should therefore “intercept” data going to NCAR

Method
● Bypass NCAR graphics calls● Originally placed CDF write routines within the code.
– This soon became too cumbersome
– We decided to make one subroutine within ORBIT

Why insert another subroutine in ORBIT?
● ORBIT is literally a work in progress.– Spline calculations are not in the final stage
– New and better methods are being developed● So, we want adaptability.
– Much easier to simply call a subroutine
– Can easily be moved to an entirely new program

What we need to write a CDF file:
● Rank 1 arrays● variable name (weight, pitch, helicity,...)● variable value (xx, aa, rr,...)● long description (equilibrium helicity, density,...)● units (m, keV, MA/m^2,...)● array size ● value type (real, complex, logical,...)
● Rank 2 arrays● same as rank 1 with another dimension

Data Generating Subroutine
● Takes in data that would otherwise go to an NCAR call● Uses the Ezcdf library
✗ user friendly✗ no arrays larger than 3 ranks
● Separates 1-D and 2-D variables into 1-D and 2-D arrays.● Writes the arrays into a large binary file that can be easily accessed by any user.● Labels the arrays so as to keep track of them later.
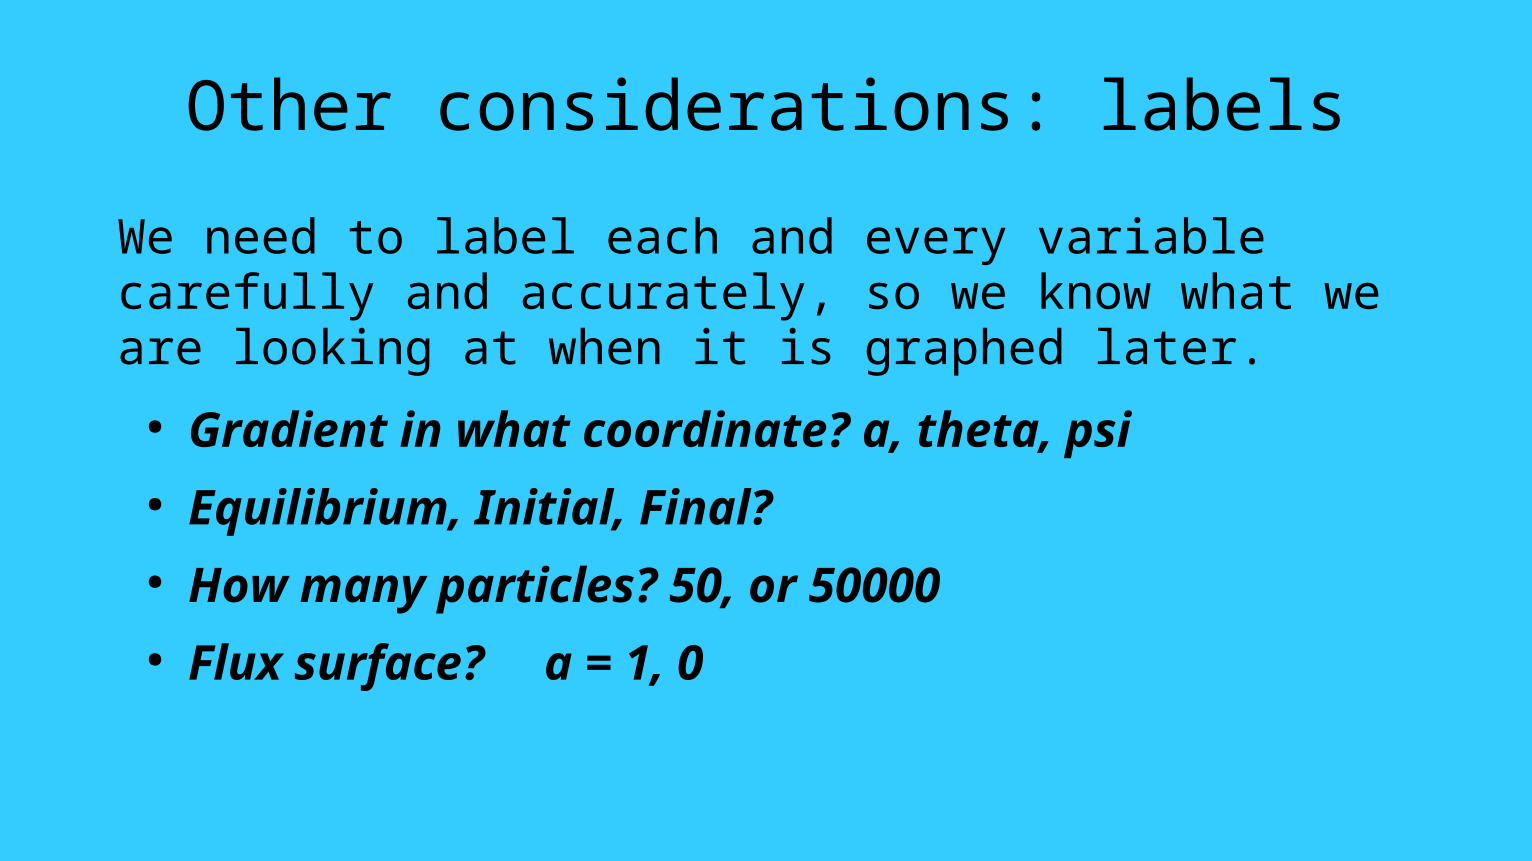
Other considerations: labels
We need to label each and every variable carefully and accurately, so we know what we are looking at when it is graphed later.
● Gradient in what coordinate? a, theta, psi● Equilibrium, Initial, Final?● How many particles? 50, or 50000● Flux surface? a = 1, 0
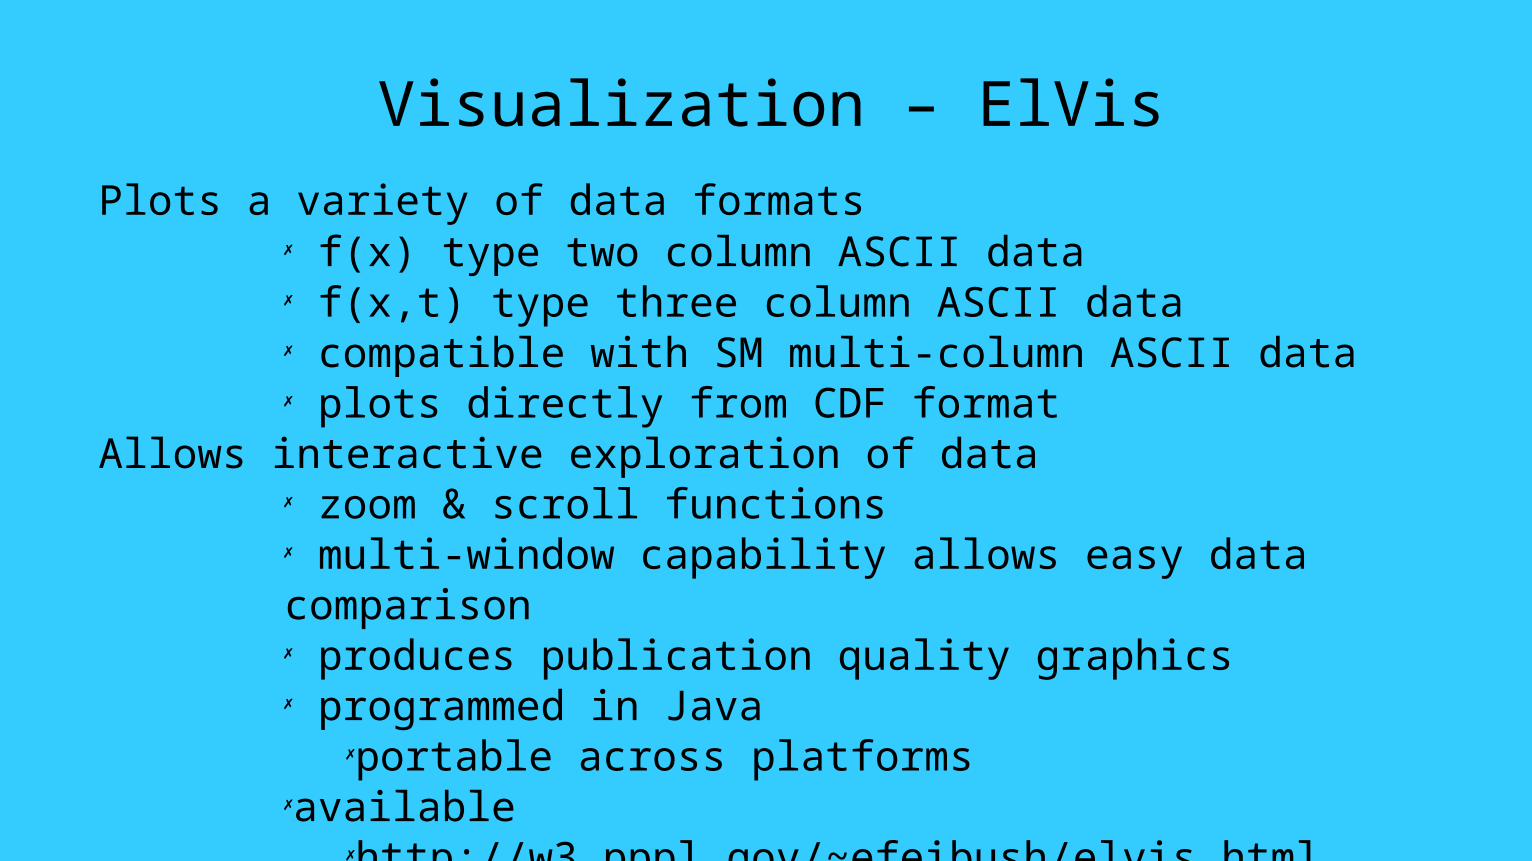
Plots a variety of data formats✗ f(x) type two column ASCII data✗ f(x,t) type three column ASCII data✗ compatible with SM multi-column ASCII data✗ plots directly from CDF format
Allows interactive exploration of data✗ zoom & scroll functions✗ multi-window capability allows easy data comparison✗ produces publication quality graphics✗ programmed in Java
✗portable across platforms✗available
✗http://w3.pppl.gov/~efeibush/elvis.html
Visualization – ElVis


Example

End Game?
● "I prefer SM," "Will it work with Gnuplot?"– Conversion program reads binary CDF files and writes multi-
column text data
– Allows the user to:● Specify which variables to write● What format to write the data to● What to title it
– Simple, independent of ORBIT


Conclusions
● ORBIT now writing portable, data files for all options.● Subroutine is flexible enough to be adapted to future
changes.● CDF data can be plotted directly with ElVis, entirely
portable.● Binary data can be converted to user-specific text format

Future Work
● Send data to ElVis directly● Upgrade output file format to HDF5

Thanks.
I would like to thank:
K. Indireshkumar (Kumar), and E. Feibush for their support and help.
S. Ethier for the occasional advice
R. White for allowing me to play with his code