Embed Size (px)
Citation preview

DEVELOPMENT OF PASSENGER TRAIN SERVICE QUALITY MODEL FOR SPECIAL OCCASION THROUGH NEURAL NETWORKS AND FUZZY
INFERENCE SYSTEM
by
D M GHIUS MALIK
MASTER OF SCIENCE IN CIVIL ENGINEERING
(CIVIL & TRANSPORTATION)
DEPARTMENT OF CIVIL ENGINEERING
BANGLADESH UNIVERSITY OF ENGINEERING AND TECHNOLOGY
DHAKA, BANGLADESH
November, 2017

DEVELOPMENT OF PASSENGER TRAIN SERVICE QUALITY MODEL FOR SPECIAL OCCASION THROUGH NEURAL NETWORKS AND FUZZY
INFERENCE SYSTEM
by
D. M. Ghius Malik
Student No: 1014042401
A THESIS SUBMITTED TO THE DEPARTMENT OF CIVIL ENGINEERING IN
PARTIAL FULFILLMENT OF THE REQUIREMENTS FOR THE DEGREE OF
MASTERS OF SCIENCE IN CIVIL ENGINEERING
(CIVIL AND TRANSPORTATION)
DEPARTMENT OF CIVIL ENGINEERING BANGLADESH UNIVERSITY OF ENGINEERING AND TECHNOLOGY (BUET)
Dhaka-1000, Bangladesh November, 2017

DEDICATED
TO MY
PARENTS AND TEACHERS


v
ACKNOWLEDGEMENTS
All praise is due to the Almighty, the most merciful and the most beneficent.
I would like to express deepest gratitude and indebtedness to my previous supervisor, Dr.
Md. Hadiuzzaman, Associate Professor, Department of Civil Engineering, BUET, Dhaka,
Bangladesh and current supervisor Dr. Mizanur Rahman, Professor, Department of Civil
Engineering, BUET, Dhaka, Bangladesh for their guidance, encouragement and
continuous support throughout the progress of the work.
Sincere appreciation goes to the members of my M.Sc. defense committee: Dr. Md.
Hasib Mohammad Ahsan, Dr. Ahsanul Kabir and Dr. Farzana Rahman for their
thoughtful questions, valuable comments and suggestions.
I would like to acknowledge the research grant received for this study from the
Committee for Advanced Studies and Research (CASR) of BUET, Dhaka, Bangladesh.
I am also thankful to Irfan Uddin Ahmed, Research Assistant, Department of Civil
Engineering, BUET for his extensive support and help.
I am indebted to my family and friends for their support and encouragements. Special
Thanks to Saurav Barua, Lecturer, Department of Civil Engineering, University of
Information Technology and Science (UITS), Dhaka, Bangladesh. His active interest in
this topic and valuable advice were the source where I got deep inspiration.
Finally and most importantly, I am grateful to my parents for their love, concern, care and
faith without which this study would have been impossible.
vi
ABSTRACT
The Adaptive Neuro-Fuzzy Inference System (ANFIS) and an Artificial Neural Network
(ANN) namely Probabilistic Neural Network (PNN) techniques were used in this thesis
to model intercity train passengers’ perception on its service quality (SQ). A stated
preference survey was carried out with 6 skilled enumerators of intercity train users at
Kamlapur Railway Station, Dhaka on the month of July, 2016. There are three sections in
the survey questionnaire. The first section aims to get demographic and socio-economic
information (age, gender, occupation etc.) of commuters and the reason for using
intercity trains. The second section focuses on 18 attributes that are accountable for the
evaluation of intercity train SQ. The third section organized to get priority ranking of the
attributes from the respondents. These attributes were in a close ended arrangement with
relevant multiple choices. The respondents were asked to assess the present situation of
the service by marking the checkboxes from their point of view against each attribute.
The multiple-choice check boxes are numbered by 1 to 5 where “5” corresponds to
excellent quality and “1” corresponds to very poor quality.
After survey, incomplete data sets were screened out from collected data. Finally, 1037
and 553 user’s data were used to calibrate the ANFIS and PNN structures for intercity
train SQ estimation during regular days and special days, separately. The training and
forecasting sets contained 80% of whole sample (830 samples for regular days, and 443
samples for special days) and 20% of whole sample (207 samples for regular days, and
110 samples for special days) observations, respectively. MATLAB 2014b is used for the
development of these models. The proposed ANFIS structures with eighteen attributes
showed 54.1% and 60.2% accuracy and PNN structure showed 50.7% and 57.3%
accuracy in predicting train SQ for regular days and special days, respectively. Finally, a
stepwise approach was followed for ranking the intercity train SQ attributes influencing
its overall SQ and the results were compared with that of the empirical observations
(public opinions). Study found that besides waiting place condition, attributes related to
physical conditions and service features of intercity train are important determinants of
its perceived SQ for regular days and special days, respectively. Beside waiting place

vii
condition, ‘Toilet cleanliness’, ‘Fitness of car’, ‘Air ventilation system’, ‘Convenience of
online ticketing system’, ‘Seat comfort’, ‘Ease at entry and exit’, were the most
significant physical attribute those influence the users’ decision-making process on
regular days. In contrast, on special days, ‘Travel cost’, ‘Air ventilation system’,
‘Convenience of online ticketing system’, ‘Car arrangement’, and ‘Travel delay’ were the
most significant service attribute which influence the users’ decision making process.

viii
TABLE OF CONTENTS
ACKNOWLEDGEMENTS………………………………………………………….…..iii
ABSTRACT……………………………………....………………………………….......vi
TABLE OF CONTENTS……………………………………………………………….viii
LIST OF FIGURES……………………………………………………………………….x
LIST OF TABLES……………………………………………………………………….xii
CHAPTER 1: INTRUDUCTION…………………………………………………………2
1.1 Background of the study………………………………………………………...2
1.2 Passenger Train Services in Bangladesh………………………………………...3
1.3 Research Objectives……………………………………………………………..7
1.4 Scope of Work…………………………………………………………………...7
1.5 Organization of the Thesis………………………………………………………8
CHAPTER 2: LITERATURE REVIEW……………………………………………..…...9
2.1 General…………………………………………………………………………..9
2.2 Definition of Service Quality (SQ) of Transportation Modes…………………...9
2.3 Past Studies and Limitations…………………………………………………….9
2.4 Artificial Neural Network (ANN)……………………………………………...13
2.4.1 Probabilistic Neural Network (PNN)…………………………………14
2.5 Fuzzy Logic……………………………………………………………………15
2.5.1 Adaptive neuro-fuzzy inference system (ANFIS)…………………….16
2.6 Summary……………………………………………………………………….19
CHAPTER 3: STUDY METHODOLOGY AND DATA COLLECTION…………...…21
3.1 General…………………………………………………………………………21
3.2 Selection of SQ Attributes……………………………………………………..21
3.3 Procedure of Stated Preference (SP) Questionnaire Survey…………………...23
3.4 Details of study locations………………………………………………………25
3.5 Data Collection………………………………………………………………...30

ix
3.6 Model Development (Training)………………………………………………..30
3.7 Summary……………………………………………………………………….32
CHAPTER 4: SURVEY DETAIL DATA ANALYSIS AND RESULTS……………....33
4.1 General…………………………………………………………………………33
4.2 Characteristics of Intercity Train User…………………………………………33
4.3 Users’ Satisfaction Ratings about Intercity Train……………………………...34
4.3.1 Overall service quality of intercity train……………………………..34
4.4 Summery of Users’ Perception about Intercity Train Service…………………52
4.5 Summary……………………………………………………………………….54
CHAPTER 5: ANALYSIS RESULTS AND DISCUSSION……………………...…….55
5.1 General…………………………………………………………………………55
5.2 Model Evaluation………………………………………………………………55
5.2.1 Correlation Coefficient ........................................................................ 58
5.2.2 Root Mean Square Error (RMSE) ....................................................... 59
5.2.3 Stepwise Approach .............................................................................. 60
5.3 Attribute Ranking………………………………………………………………62
5.4 Summary……………………………………………………………………….66
CHAPTER 6: CONCLUSION & RECOMMENDATIONS……………...……………..67
6.1 General…………………………………………………………………………67
6.2 Major Findings…………………………………………………………………67
6.3 Recommendations……………………………………………………………...69
6.4 Further Research……………………………………………………………….70
REFERENCES…………………………………………………………………………..73
APPENDIX A……………………………………………………………………………81
APPENDIX B……………………………………………………………………………88
APPENDIX C……………………………………………………………………………91
APPENDIX D…………………………………………………………………………..103

x
LIST OF FIGURES
Figure 1.1 Kamlapur Railway Station, Dhaka, Bangladesh ........................................ 6
Figure 2.1 Architecture of PNN ................................................................................... 14
Figure 2.2 (a) Structure of ANFIS; and (b) ANFIS framework shown in MATLAB inference. ..................................................................................................... 19
Figure 3.1 Framework for SQ Attributes Selection ..................................................... 22
Figure 3.2 Survey location (Source: Google maps) ..................................................... 26
Figure 3.3 Divisions of Bangladesh (Source: Banglapidia) ......................................... 27
Figure 3.4 Transport Network of Bangladesh (Source: Banglapidia) .......................... 28
Figure 3.5 Intercity Railway Network in Bangladesh (Source: Banglapidia) .............. 29
Figure 4.1 User Perception about prevailing intercity train’s overall service quality .. 35
Figure 4.2 User Perception about on-time performance level of intercity train service ......................................................................................................... 36
Figure 4.3 User Perception about travel delay of intercity train service ...................... 37
Figure 4.4 User Perception about the Convenience of online ticketing system of intercity train service................................................................................... 38
Figure 4.5 User Perception about the Convenience of ticket purchasing at counter of intercity train service................................................................................... 39
Figure 4.6 User Perception about travel cost of intercity train service ........................ 40
Figure 4.7 User Perception about car arrangement of intercity train service ............... 40
Figure 4.8 User Perception about seat comfort of intercity train service ..................... 41
Figure 4.9 Seat condition of intercity train ................................................................... 41
Figure 4.10 User Perception about ease at entry and exists of intercity train service .... 42
Figure 4.11 Entry Exit pathway of Intercity Train (Tista) ............................................. 42
Figure 4.12 User Perception about overall security of intercity train service ................ 43
Figure 4.13 User Perception about air ventilation system of intercity train service ...... 44
Figure 4.14 Air ventilation system of Intercity Train .................................................... 44
Figure 4.15 User Perception about waiting place condition of intercity train service ... 45
Figure 4.16 Waiting place condition, (a) Regular days, and (b) Special days ............... 46

xi
Figure 4.17 User Perception about meal service of intercity train service ..................... 46
Figure 4.18 User Perception about toilet cleanliness of intercity train service .............. 47
Figure 4.19 User Perception about female harassment of intercity train service ........... 48
Figure 4.20 User Perception about courtesy of employees of intercity train service ..... 48
Figure 4.21 User Perception about fitness of car of intercity train service .................... 49
Figure 4.22 Car fitness of Intercity Train ....................................................................... 50
Figure 4.23 User Perception about car cleanness of intercity train service ................... 51
Figure 4.24 User Perception about noise insulation in cars of intercity train service .... 51
Figure 5.1 Confusion matrices for ANFIS of, (a) trained model for regular days; (b) tested model for regular days; (c) trained model for special days; and (d) tested model for special days. ............................................................... 56
Figure 5.2 Confusion matrices for PNN of, (e) trained model for regular days; (f) tested model for regular days; (g) trained model for special days; and (h) tested model for special days. ............................................................... 57

xii
LIST OF TABLES
Table 1.1 Train name, starting location and its destination .............................................. 3
Table 3.1 Selected Attributes of Intercity Trains ............................................................ 22
Table 3.2 Available Intercity Train routes in Bangladesh .............................................. 23
Table 3.3 Questionnaire Survey Schedule ...................................................................... 25
Table 3.4 Parameters Related to Probabilistic Neural Network (PNN) and Adaptive Neuro-Fuzzy Interface System (ANFIS) for Intercity Train SQ Prediction Models ............................................................................................................ 31
Table 4.1 General characteristics of the Intercity Train Users ....................................... 33
Table 4.2 Overall Service quality of Intercity Train....................................................... 35
Table 4.3 Summary of Users’ Perception about Intercity Train Service ........................ 53
Table 5.1 ANFIS and PNN model accuracy in predicting Service Quality (SQ) ........... 58
Table 5.2 Attributes ranking comparison among ANFIS, PNN and Public Opinion under different scenarios. .......................................................................................... 65

xiii
LIST OF ABBREVIATIONS
ACRONYM DEFINITION
ADA Americans with Disabilities Act
AI Artificial Intelligence
ANFIS Adaptive Neuro-fuzzy Inference System
ANN Artificial Neural Network
ANOVA Analysis of Variance
BR Bangladesh Railway
CEN European Committee for Standardization
CI Central Intelligence
CIA Central Intelligence Agency
DOT Department of Transport
FFNN Radial basis Function Network
FIS Fuzzy Inference System
FL Fuzzy Logic
GRNN Generalized Regression Neural Network
MF Membership Functions
ML Multinomial Logit
MLFN Multi-layer Feed Forward Neural Network
MPN Multilayer Perception Network
MRT Mass Rapid Transport
MV Motorized Vehicle
NCHRP National Cooperative highway Research Program
NN Neural Network

xiv
LIST OF ABBREVIATIONS
ACRONYM DEFINITION
PDF Probability Density Functions
PNN Probabilistic Neural Network
PRNN Pattern Recognition Neural Network
PT Public Transport
R Coefficient of Correlation
RFN Radial Basis Function Network
RMSE Root Mean Square Error
RNN Recurrent Neural Network
SEM Structural Equation Model
SOM Self-organizing Map
SP Stated Preference
SQ Service Quality
TRB Transport Research Board
TRCP Transit Cooperative Research Program
UK United Kingdom
US United States
USA United States of America

Chapter 1
INTRUDUCTION
1.1 Background of the study In a Transportation system of a country, passenger train acts like an arterial system of a
body. Especially, in the country like Bangladesh with colossal population of about 166
million and high density of about 1237 persons per sq km (Population Report 2016, CIA,
USA) train has extra-ordinary role to make in the field of transportation. Due to financial
and land constraints, the existing highway facilities will be struggling to meet the
expected traffic demand. Therefore, the traffic congestion will be a day-to-day plight in
many highways. In this context, the traffic burden on highways can be reduced if a
considerable number of travelers switch to an alternative mode of transportation. In this
situation, train could be an efficient and economic mode of transportation to meet this
long-distance travel demand. It has higher capacity than any other mode of transportation.
With promising capacity extension options, it is one of the most reliable solutions for
exponentially increasing transportation demand. Furthermore, the capacity of the train
can be changed according to the demand. Changing car numbers and types (e.g. single-
decker or double-decker), it is possible to meet the travel demand to a great extent.
However, like any other mode of public transport (PT), ridership of train also largely
depends on the passengers’ satisfaction of its services. Hence, train service quality (SQ)
is an issue of major concern. To attract people and to retain current users, SQ of train
should be under satisfactory level. To improve service quality of train and bring that into
satisfactory level, the specific problem and its extent is very important to know.
Transportation researchers and practitioners are concerned about adapting appropriate
modern technologies and introducing innovations into the train performance.
The notion of service quality (SQ) is well recognized as a performance measurement tool
in traffic and transportation engineering operations. To retain attractiveness of public
transport (PT) among travelers and boost ridership, operators need to continuously

2
monitor its performance and service quality. Several studies (Hu and Jen 2006; Pham and
Simpson 2006; Pérez et al. 2007) have highlighted the importance of the service quality
of public transport. Measurements of SQ enable the train operators to decide upon the
organizational goals and make crucial decisions regarding future investments. Models of
SQ attributes of transport services provide the opportunity to gain an insight into the
attributes related to SQ and thus provide a guideline for amelioration. However, modeling
service quality has posed considerable challenge to researchers due to the complexity of
the concept, uncertainties regarding the attributes to be used, perception heterogeneity of
passengers, imprecise and subjective nature of the survey data. Thus, researchers have
resorted to a wide variety of tools for modeling service quality.
Modeling of the complex information in this regard from collective data sets have
become popular in recent times. Statistical and/or empirical models are most commonly
used for modeling transportation data (Transportation Committee 2005, UK). These kinds
of model have become more in demand to address complex transportation problems.
Artificial Neural Network (ANN) and Adaptive Neuro-Fuzzy Interface System (ANFIS)
are now a day a popular form of Empirical models. Although ANN have been
successfully used in various complex transportation problems such as real-time highway
traffic state estimation (Karlafis et. al. 2011), travel mode choice modeling (Niu et. al.
2011), road accident prediction (Zhao et. al. 2010), traffic flow prediction model
(Hosseinpour et. al. 2013) etc., very few studies have been performed on service quality
(SQ) of train of developing countries like Bangladesh (Bao-Ping et. al. 2009, J. Chen et.
al. 2007, Wang Zhuo et. al. 2005, Zhang et. al. 2005). Among different ANN models,
Probabilistic Neural Network (PNN) is a well classifier and faster and accurate than
Multilayer Perception Network (MPN) in prediction of SQ in heterogeneous data.
Moreover, passengers’ opinions about SQ of any public transportation mode on regular
days are significantly different than that for special days. In general, SQ data of special
days are more heterogeneous. Thus, this study explores a relationship between train SQ
attributes and passenger satisfactions based on perceptions gained from experience. To
this end, a stated preference (SP) questionnaire survey was designed to collect data on
users’ perception about intercity train SQ under different scenarios. A mathematical

3
(Table 1.1 Continues to next page)
(Table 1.1 Continues to next page)
(Table 1.1 Continues to next page)
framework of ANFIS was calibrated using those data to see how models fit the field
collected train SQ data. ANFIS is a Fuzzy-Logic Inference System (FIS) based ANN
tool, which is robust and convenient to inherent properties of storing empirical
knowledge. It is fast and accurate in prediction of SQ of heterogeneous data. ANFIS has
been successfully implemented in different complex transportation problems, such as—
mode choice modeling, accident prediction, real time traffic state estimation, and travel
behavior modeling.
However, few researches have been performed Adaptive Neuro-Fuzzy Interface (ANFIS)
on service quality (SQ) of train. Moreover, to the authors’ best knowledge no comparison
study was found on modeling train SQ using ANN and ANFIS. Furthermore, no studies
have been found which investigated the influence of membership functions (MF) and
epochs to calibrate ANFIS by utilizing the train SQ dataset. Therefore, in this study,
ANN namely Probabilistic Neural Network (PNN) and ANFIS has been used to develop
SQ prediction models of train for special occasions and regular time using questionnaire
dataset. The calibrated models were used to rank the most significant SQ attributes and
the results were compared with the empirical observations.
1.2 Passenger Train Services in Bangladesh In Bangladesh, there are around 30 intercity train service provided by Bangladesh
Railway (BR) from Kamlapur Railway Station, Dhaka. There are several types of
services like first class cabin AC, first class chair AC, first class cabin non-AC, first class
chair non-AC, second class chair, shovon chair and local standing transportation service.
These trains connect the whole country with capital city Dhaka. Train’s name and its
travelling details are given in the Table 1.1 below.
Table 1.1 Train name, starting location and its destination Serial No. Train Name Starting Location Destination
01 Shuborna Express Kamlapur Railway Station, Dhaka Chittagong Division
02 Sonar Bangla Express Kamlapur Railway Station, Dhaka Chittagong Division
03 Mohanagar Provati Kamlapur Railway Station, Dhaka Chittagong Division
04 Turna Kamlapur Railway Station, Dhaka Chittagong Division
05 Mohanagar Express Kamlapur Railway Station, Chittagong Division
4
(Table 1.1 Continues to next page)
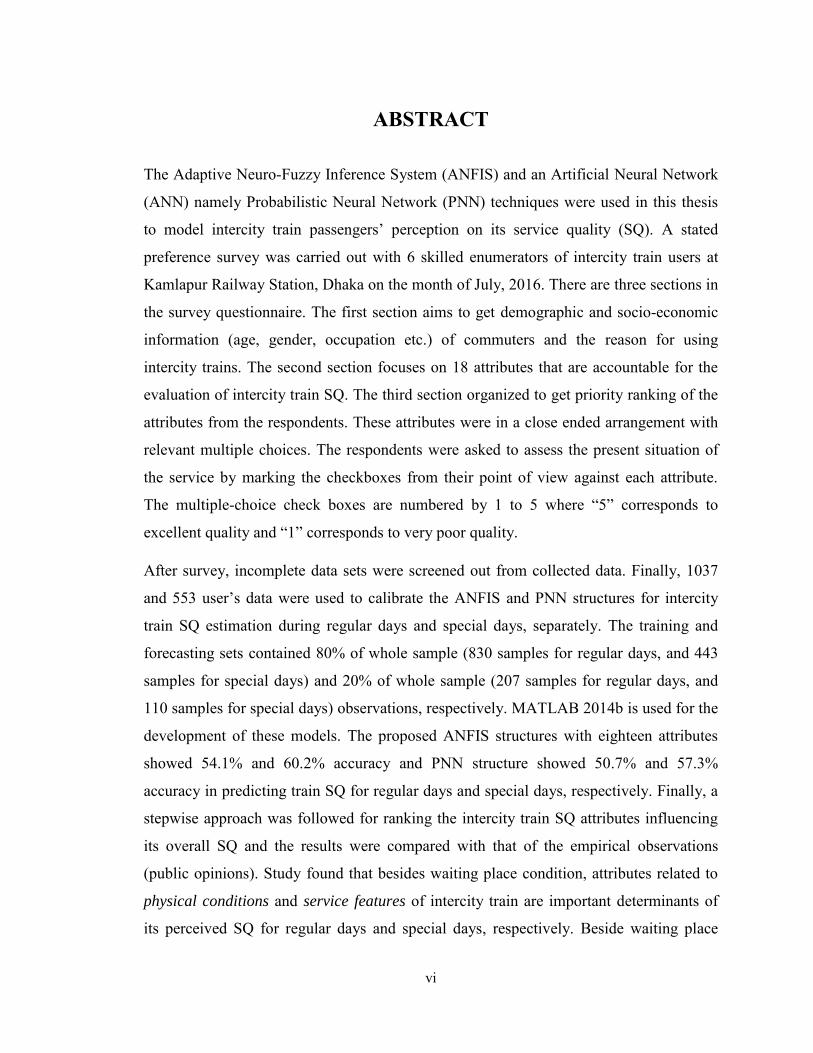
(Table 1.1 Continues from previous page)
Serial No. Train Name Starting Location Destination Dhaka
06 Chotla Express Kamlapur Railway Station, Dhaka Chittagong Division
07 Upakul Express Kamlapur Railway Station, Dhaka Sylhet Division
08 Parabat Express Kamlapur Railway Station, Dhaka Sylhet Division
09 Jayantika Express Kamlapur Railway Station, Dhaka Sylhet Division
10 Kalni Express Kamlapur Railway Station, Dhaka Sylhet Division
11 Silk City Express Kamlapur Railway Station, Dhaka Khulna Division
12 Padma Express Kamlapur Railway Station, Dhaka Khulna Division
13 Egaro Shindhu (Provati) Kamlapur Railway Station, Dhaka Khulna Division
14 Egaro Shindhu (Godhuli) Kamlapur Railway Station, Dhaka Khulna Division
15 Kishorganj Express Kamlapur Railway Station, Dhaka Mymanshing Division
16 Jamuna Express Kamlapur Railway Station, Dhaka Mymanshing Division
17 Brahmaputra Express Kamlapur Railway Station, Dhaka Mymanshing Division
18 Haura Express Kamlapur Railway Station, Dhaka Mymanshing Division
19 Tista Express Kamlapur Railway Station, Dhaka Mymanshing Division
20 Agnibina Kamlapur Railway Station, Dhaka Mymanshing Division
21 Dewanganj Express Kamlapur Railway Station, Dhaka Mymanshing Division
22 Rangpur Express Kamlapur Railway Station, Dhaka Rajshahi Division
23 Lalmoni Express Kamlapur Railway Station, Dhaka Rajshahi Division
24 Parbartipur Eid Express Kamlapur Railway Station, Dhaka Rajshahi Division
25 Ekata Express Kamlapur Railway Station, Dhaka Rajshahi Division
26 Drutojan Express Kamlapur Railway Station, Dhaka Rajshahi Division
27 Neelshagor Kamlapur Railway Station, Dhaka Rajshahi Division
28 Chitra Express Kamlapur Railway Station, Dhaka Rajshahi Division
29 Shundorban Express Kamlapur Railway Station, Dhaka Rajshahi Division
30 Khulna Express Kamlapur Railway Station, Dhaka Rajshahi Division

5
Source: Google Maps
(a)
(b)

6
(c)
(d)
Figure 1.1 Kamlapur Railway Station, Dhaka, Bangladesh

7
1.3 Research Objectives The study is concentrated with the train service quality (SQ) analysis depending on a
number of attributes in different routes of Bangladesh. The specific objectives of this
study include:
a. To develop ANN and ANFIS-based empirical models for the
estimation/prediction of SQ of trains in Bangladesh in special occasion and
regular time.
b. To identify and rank the significant attributes influencing SQ of train of special
occasion and regular time depending on neuron’s connection weights as well as
the results obtained from step-wise approach.
1.4 Scope of Work This study is highlighted the determination of problems in intercity train service and to
know the users’ satisfaction about intercity train. The determination of problems and
users’ perception is collected from study sites and a stated preference (SP) questionnaire
survey was conducted with intercity train users’ including a set of questions related with
the service quality, sitting arrangements, availability, security, ticketing system, sound
level, air circulation etc.
Artificial Intelligence (AI) paradigms is used in this study as they have gained popularity
by modeling the complex information from collective data sets over the years (Niu S. et.
al. 2011, Zhao et. al. 2010, Mussa et. al. 2006). Artificial Neural Network (ANN) and
Adaptive Neuro-Fuzzy Inference System (ANFIS) are very generic, accurate and
convenient Computational Intelligence (CI) based models due to their inherent propensity
for storing empirical knowledge. ANN and ANFIS have been successfully used in
various complex transportation problems, i.e. real-time highway traffic state estimation
(Niu S. et. al. 2011), travel mode choice modeling (Zhao et. al. 2010), road accident
prediction (Hosseinpour et. al. 2013), traffic flow prediction model (Bao-ping et. al.
2009), car following model (Khodayari et. al. 2010), travel behavior modeling (Přibyl
et. al. 2003) etc.

8
However, few researches have been performed several empirical framework on service
quality (SQ) of train (e.g. Nathanail et.al. 2008). Therefore, this research intended to
compare train SQ prediction model using ANN and ANFIS. In the process, the influence
of membership functions (MF) and epochs during calibration of ANFIS model using
train SQ dataset are investigated. ANN namely Probabilistic Neural Network (PNN) and
ANFIS have been used to develop SQ prediction models of train for special occasions
and regular time using questionnaire dataset. Afterwards, PNN and calibrated ANFIS
model were used to rank the most significant SQ attributes and the results were
compared with the empirical observations.
1.5 Organization of the Thesis There are six chapters in this thesis paper including this introduction.
Chapter 1 states the background and objectives of this research work. The scope of this
study is also presented in this chapter.
Chapter 2 represents the past studies about Service Quality (SQ) that helps to understand
the contributing attributes that affects the quality of service of intercity train.
Chapter 3 addresses the study methodology that divided into three parts. These three
parts contains detail information of survey procedure, description of survey location and
development of two models, i.e., PNN and ANFIS.
Chapter 4 investigates and analyses the survey data. The analyses are shown in tabulated
and graphical form. This chapter also describes the summery of users’ perception of
intercity train service quality in Bangladesh.
Chapter 5 compares the performance of the proposed PNN model with that of ANFIS,
using the intercity passenger train SQ dataset. It also presents the significant attributes
which affect the SQ of intercity trains.
Chapter 6 summarizes the major findings that are obtained from the analyses of
chapter5. This chapter also presents the conclusion, recommendations and prospects of
this study.

Chapter 2
LITERATURE REVIEW
2.1 General This chapter presents previous studies and reports about train service quality issues. To
complete our objective of this study, this literature review will help to identify the scope
of work of this thesis work. Again, this chapter presents a historical overview of a rich
variety of modeling approaches developed so far and in use today.
2.2 Definition of Service Quality (SQ) of Transportation Modes The term service quality (SQ) in the transport literature context has long been
investigated and has been defined in many forms. European Committee for
Standardization, CEN (2002) defined service quality (SQ) as the accurate measures for
which the providers are responsible to provide. Lai et. al. and Dell’Olio et. al. (2010)
defined SQ as the measurement process of how the SQ level delivered matches the
customer satisfaction. Tyrinopoulos et. al. (2008) defined SQ as the measurements that
reflects users` perceptions towards the service. Eboli et. al. (2011) and Hensher et. al.
(2002) defined SQ as the pre-defined standard of service attributes relative to the actual
service quality. But the most common and internationally accepted SQ definition has
been given by Transportation Research Board (TRB) defined SQ on TRCP Report 47
(1999) as the measuring of customer expectation on a constant service standard. These
definitions have opened the door for further in-depth analysis of the quality process in
the context of intercity train service.
2.3 Past Studies and Limitations Service quality (SQ) is defined as a measure of users’ perceptions grained from public
transport’s overall service, e.g., performance, comfortability etc. SQ is vital in attracting
and retaining new users, therefore, researchers and policy makers are concerned about its
influence on different public transportation modes.

10
Early research work by Parasuraman et al. (1985, 1988) developed SERVQUAL service
quality model, where they identified five dimensions—reliability, assurance, tangibles,
empathy and responsiveness to measure service quality through questionnaires. Several
researches such as—Gronroos (1984), Brady and Cronin (2001), Karatepe et al. (2005)
performed extensive SQ assessment in context of user’s perception. Later, the
techniques of SQ were widely implemented in several fields of market research
including performance evaluation of public transportation including bus, train and so on.
Several authors introduced different quality measuring methods and parameters to assess
railway passenger service quality. The organization named Steer Davies Gleave
conducted a study between December 1999 to June 2000 to assess the importance of rail
passengers into improvement of the range and quality of facilities and service on stations
and in trains in the city of London (Gleave 2000). Wardman (2004) used demand
elasticity to estimate influence of travel time, fuel cost, car ownership, population on
railway service quality. Fu and Xin (2007) investigated the relationship between rail
passenger satisfaction and service attributes in the urban area of Cossenza of Italy. They
conducted factor analysis and regression analysis to estimate relationship among
attributes. Cavana et al. (2007) presented SERVQUAL method using regression analysis
to evaluate passenger rail service quality by incorporating comfort, connection, and
convenience. They revealed that reliability, responsiveness and empathy had significant
effects on overall service quality. Nathanail (2008) developed framework for assessing
the SQ of railway from questionnaire survey of passengers and grouped attributes into
six criteria. Those were—itinerary accuracy, system safety, cleanness, passenger
comfort, servicing and passenger information among which itinerary accuracy and
system safety have been found most important attributes. Cantwell et al. (2009)
developed a Multinomial Logit (ML) model and revealed that improvement in service,
reliability and a reduction of crowding were related to passengers’ satisfaction. Brons et
al. (2009) assessed the importance of access to the station with overall satisfaction of
railway journey through a regression analysis. Geetika (2010) evaluated the factors that
determine user satisfaction with the SQ provided on railway platforms. Determinants
found from factor analysis were availability, safety and security, quality of refreshments,
effectiveness of information systems, behavior of railway staff, basic amenities provided
11
on platforms. Refreshments and behavioral factors were considered the most significant
by passengers.
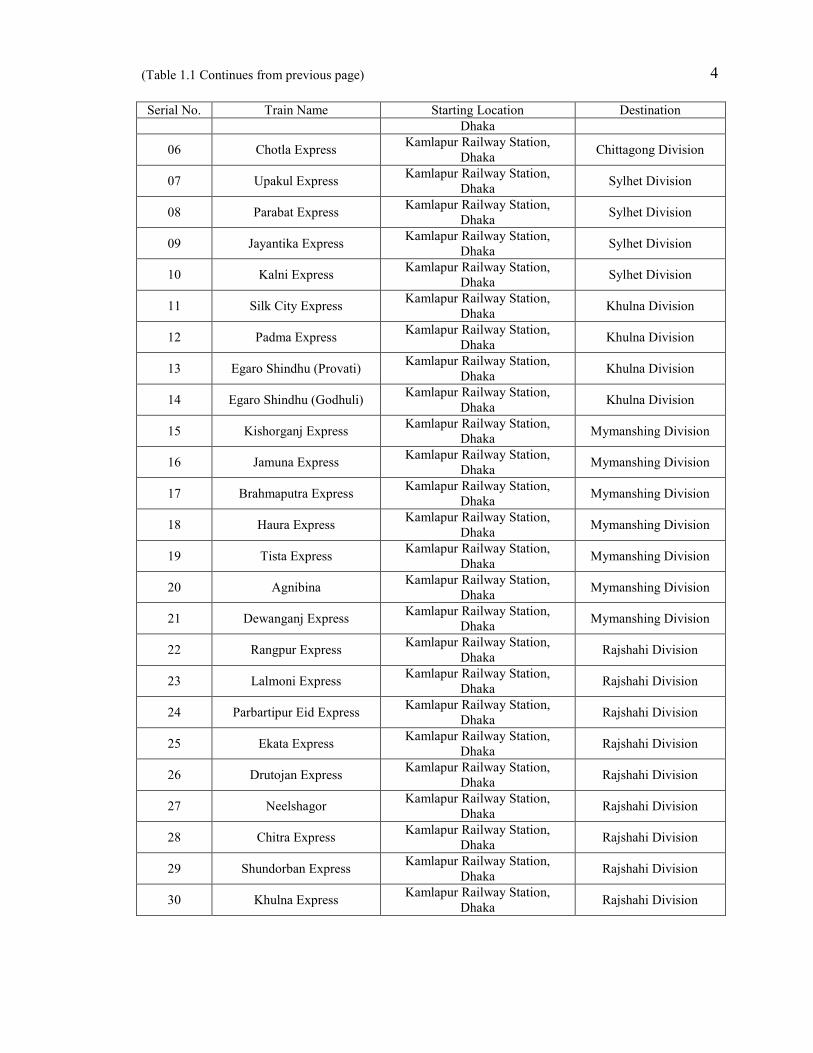
Prasad and Shekhar (2010) identified the quality of a rail service by SERVQUAL model
incorporating assurance, empathy, reliability, responsiveness, tangibles, service product,
social responsibility and service delivery. Among which service delivery was found as
the most important factor. Agunloye and Oduwaye (2011) investigated the relationships
among arrival time of train, smoothness of ride, and cleanliness of the coaches. The
research proposed that the arrival time of trains at stations and trip frequency have
significant relationship with SQ of train. Chou et al. (2011) incorporated the quality
satisfaction-loyalty relationship into a Passenger Satisfaction Index (PSI) calculation to
evaluate the SQ of high speed rail. The study concluded that level of access to a station
and personal spaces on the train were the most important quality indicators to improve
customer satisfaction. Irfan et al. (2012) evaluated passengers’ perceptions about the SQ
of a rail system through a modified SERVQUAL and service qualities are— empathy,
assurance, tangibles, timeliness, responsiveness, information system, food, safety and
security. The study showed that there is a positive relationship among the SQ attributes.
Most significant correlation was found among tangibles and empathy.
Conventional models have underlined assumptions and determined fundamental
relationships between users’ satisfaction and SQ attributes. Modeling non-linear
relationship between users’ satisfaction and attributes were widely adopted over last few
decades. In these methods, SQ attributes were considered as independent variables and
users’ satisfaction was taken as dependent variables. Then coefficients were estimated
by relating SQ attributes with users’ satisfaction. Chou et al. (2014) proposed SEM
model to test relationship among service quality, customer satisfaction and customer
loyalty on high speed rail service in Taiwan. The study showed that most significant
attributes were—cleanness of train, attitude and appearance of employee, comfort of air
condition, on time performance of the train. De Oña et al. (2014) focused on the factors
affecting the SQ of railway in Northern Italy using the decision tree approach. The
research found that courtesy and competence in station, workability of windows and
doors, regularity of train frequency were the major factors for SQ of railway. Aydin et

12
al. (2015) proposed a combined fuzzy hierarchy process to assess customer satisfaction
levels of rail transit. The study provided operational deficiencies related to rail transit
through customer satisfaction surveys.
Non-parametric models of Artificial Intelligence (AI) such as ANFIS can provide
advantages over other statistical regression models like linear regression, logistic
regression, ridge regression, lasso regression etc, in analyzing large datasets. They can
model non-linear relationships with progressive capability and have scope for model
validation as well. Recently, these models are applied widely in the field of science,
engineering and market researches. Non-linear relationships in many transportation
problems can be solved accurately by using Fuzzy logic based approach (Teodorovic
and Vukadinovic, 1998). Yen and Langari (1999), Passino and Yurkovich (1998), and
Lewis (1997) have performed extensive study on fuzzy logic and Fuzzy Inference
System (FIS). Later, Neural Network (NN) based learning was incorporated into FIS to
solve many transportation problems. Teodorovic and Vukadinovic (1998) presented
potential applications of fuzzy logic and NNs in solving transportation problems. Park
(2002) forecasted freeway traffic volume by hybrid network-based fuzzy system. Pribyl
and Goulias (2003) developed ANFIS for travel behavior study. Andrade et al. (2006)
utilized an adaptive network based fuzzy logic for transport choice modeling.
Mucsi et al. (2011) utilized ANFIS technique to estimate queue length precisely and
applied it for queue management at signalized intersections. They adopted trapezoidal
MF for computational simplicity and to capture the similarity with the inputs of
simulation model. Islam et al. (2016) adopted PNN, Generalized Regression Neural
Network (GRNN) and Pattern Recognition Neural Network (PRNN) to assess the
significant attributes which influence the SQ for Dhaka city bus transit. In another study,
Islam et al. (2016) used PNN and ANFIS to construct and compare the prediction
models for bus SQ of Dhaka city. They ranked the SQ attributes according to their effect
and identify the significant attributes. The study revealed that ANFIS performed better
than PNN for the evaluation of bus transit SQ.
Inspired by the most recent studies, this thesis paper depicts the application of the
ANFIS and PNN in the development of a new fuzzy logic-based and neural network

13
based approach for exploring the relationship among attributes of intercity train’s SQ
with passengers’ satisfaction level. Particularly, previous studies showed that the ANFIS
based SQ assessment seems to be a feasible approach for any mode of public transport.
Dataset were trained and tested using ANN to check the fitness of the calibrated FIS for
estimating the parameters of observed attributes or variables of railway SQ under regular
days and special day scenarios. Despite uncertainties and nonlinearities, ANFIS
represents a mathematical framework that can model the relationship among observed
variables, hidden layers and output variables quite remarkably.
On the other hand, ANN models can provide more accurate and realistic study on the SQ
and are yet to be introduced in a larger scale for the study and analysis of intercity train
SQ with input layer, pattern layer, summation layer and output layer. To the authors’
best knowledge, this research is the first of its kind to use PNN and ANFIS to predict
user based SQ of intercity train. The next two immediate sections depict the architecture
of PNN and ANFIS accompanied by some broad information about these methods.
2.4 Artificial Neural Network (ANN) The learning aptitude of human in making decision and applying it on changing situations
can be simulated by Artificial Neural Networks (ANN). ANN recognizes the
characteristics from the defined variables based on existing data, although irregularity is
present (Kasabov et. al. 1996). They can buffer the irregularity existed in data and resolve
a decision nearly to the actual situation. As a result, no predefined model is mandatory to
decide on various situations. ANN consists of processing units analogous to neurons of
human brain. They are organized into some interconnected layers. Each neuron has an
activation function and some local parameters. Adjustment on local parameter changes
the node function.
Neural Network (NN) may be of single or multiple layers. Network composed of input
neurons followed by output neurons is called single layer neural network. Multiple layers
consist of one or more hidden layers along with an input and an output layer. Artificial
Neural Networks (ANN) are of several types such as Radial basis Function Network
(RFN), Feed Forward Neural Network (FFNN), Recurrent Neural Network (RNN), and
Self-organizing Map (SOM). Among them FFNN and a variant of RNN are used to carry

14
out the research, and in this study Probabilistic Neural Network (PNN) is used for
modeling the result.
2.4.1 Probabilistic Neural Network (PNN) Probabilistic Neural Network (PNN) can map any input pattern to any number of
classifications. It is a four-layered neural network which operates by minimizing the
‘expected risk’ function (Specht et al. 1990). It is based on well-established statistical
principles derived from Bayes’ decision strategy and non-parametric kernel based
estimators of Probability Density Functions (PDFs). Parzen et al. (1962) introduced a
smooth and continuous class of estimators that asymptotically approach the real density.
Later, Specht et al. (1990) used it in the PNN design. PNN uses the information during
testing which were stored at the time of training the network. This implies that for each
input data there is a node in the hidden layer. PNN is also an adaptation of radial basis
network that is used for classification problems. It has a radial basis portion as activation
function and a competitive portion. The four layers of PNN architecture are: input layer,
pattern layer, summation layer and output layer. Figure 1 shows a PNN architecture that
recognizes classes to determine intercity train SQ by means of a set of user attributes. The
first layer shows the input pattern consists of 18 user attributes.
Figure 2.1 Architecture of PNN
The number of nodes in the pattern layer is equal to the number of training instances. The
number of nodes in the summation layer is equal to the number of classes in the training
instances. The input layer is fully connected to the pattern layer. The input layer does not

15
perform any computation and simply distributes the values of user attributes to the
neurons in the pattern layer. The pattern layer is semi-connected to the summation layer.
Each group of training instances corresponding to each class is just connected to one
node in the summation layer. In other words, the summation units simply sum the inputs
from the pattern units that correspond to the category from which the training pattern was
selected. Finally, output layer shows the estimated class extracted from summation layer.
PNNs are found to be the best neural classifiers among all other ANNs due to their design
architecture (Jang et al. 1993). Training in PNN is relatively fast as each input is shown
to the network only once. Unlike the traditional neural networks, no learning rule is
required to train a PNN and no predefined criterions are needed.
To build the network, at first, the products of the example vector and the input vector are
summed. For each class node, these activations are summed. The pattern node activation
(h) shown in the following equation, is simply the product of the two vectors (E is the
example vector, and F is the input feature vector).
i ih E F
The class output activations (SQ) are then defined as:
( 1)2
1
hi
N
i
j
eC
N
Where,
jC = output class; N = sample size; i
h = hidden-node activation; γ =smoothing factor.
2.5 Fuzzy Logic Fuzzy Logic (FL) is based on the idea that humans are capable of highly adaptive control,
even though the inputs used are not always precise. In an attempt to mimic the human
decision-making process, FL was developed to make decisions on the basis of noisy and
imprecise information inputs. Kaehler explains, “FL provides a simple way to arrive at a
definite conclusion based upon vague, ambiguous, imprecise, noisy, or missing input
information” (Jang et al. 1993). Typically, fuzzy systems rely on a set of if–then rules
Eqn (1)
Eqn (2)

16
paired with membership functions used to describe input and output variables. In short,
the fuzzy rules work to fuzzify and aggregate the input values, convert them into terms of
output variables, and finally defuzzify the values of the output functions (Basser et al.
2014).
2.5.1 Adaptive neuro-fuzzy inference system (ANFIS) In Service Quality (SQ) evaluation, the complex relationships among all observed
attributes create an environment that is difficult to define intuitively. A neuro-fuzzy
approach which can learn from the training data was used accordingly. Artificial Neural
Network (ANN) creates a computational structure which functionally can perform like
human brain. It interconnects neurons or nodes those use input data and Membership
Functions (MFs) to process and transmit outputs. Jang et al. (1993) adopted the network
learning algorithm to Fuzzy-Logic Inference System (FIS) and named the structure as
ANFIS. It combines the FIS and ANN. A like human brain, ANFIS can process train data
to grain experience and create a fuzzy-logic based network with complex algorithm. The
algorithm works stepwise. The FIS was used to model non-linear relationship and the NN
was used to calibrate the parameters of input and output MFs. The ANFIS tool in
MATLAB 2014a was used in this research to predict train’s overall SQ. This tool offers
both Sugeno-type and Mamdani-type inference system. As Sugeno-type is a more
compact and computationally efficient representation than a Mamdani system, it gives
itself to the use of adaptive techniques for constructing fuzzy models (see, Sugeno 1985).
Hence, the current study chooses the Sugeno-type model in FIS to capture the non-linear
relationship between intercity train SQ and its attributes. The objective function of ANN
training optimizes the weights for a specific set of inputs and outputs. The output
calculated by the network was compared with the corresponding training data. Then the
randomly set parameters were adjusted in order to reduce the errors of output. The
optimization process ends when the error reaches expected value. To calibrate
parameters, back propagation or a combination of least-squares and back propagation
gradient descent method is used in ANFIS structure.
The calibration of MF was performed by using input data (i.e. observed attributes) and
output data (i.e. overall passenger’s satisfaction) through the learning process. The

17
process consists of two main steps, the collection of learning data and FIS generation.
Data collection consisted of gathering sufficient relevant training data describing the
relationship between observed variables or attributes and the corresponding overall
passengers’ satisfaction level by using numerical ranking. For every individual test, a
training database with 1037 respondents for regular days and 553 respondents for special
days were collected from Stated Preferences (SP) survey. The structure of the FIS was
constrained to allow 181 MFs for input attributes and the shapes of the input MFs were
selected for both regular days and special days. The numbers of rules depend on the
number of MFs and input variables. However, rule outputs have different strength. The
rule outputs were combined to provide a single output. The questionnaire survey data was
used to perform the calculations required by the ANFIS. During the learning process,
ANFIS modifies the input and output MF parameters with the objective of minimizing
the error. The error is the sum of the squared differences between the observed and
modeled value.
The structure of ANFIS comprises of five-layers, those are—(i) fuzzification; (ii) fuzzy
AND; (iii) normalization; (iv) defuzzification; and (v) output layer as shown in Figure 2
(a). Each of these layers is connected through direct links and nodes. Nodes are process
units which consist of adaptive and fixed parameters. By setting learning rules, adaptive
parameters can be altered and the membership functions are reformed. In the structure of
ANFIS, the first layer consists of attributes or observed variables of train SQ. Second
layer comprises of MF of each input. Different rules are organized in the third layer. Each
rule represents output MF in the fourth layer. Final output or overall SQ satisfaction is
calculated by the weighted average method in the fifth layer.
The first step of ANFIS is identification of the input and output variables. It uses first-
order Sugeno fuzzy model and two typical if-then fuzzy rules with a set of two input
variables (x, y) and one output (f) is considered. a and b are the coefficient of the input
variables and c is the constant term.
Rule 1: If x is P1 and y is Q1, then f1 = a1x+b1y+c1 ……………………………..Eqn (3)
Rule 2: If x is P2 and y is Q2, then f2 = a2x+b2y+c2 ……………………………. Eqn (4)

18
All nodes in first layer i.e. fuzzy layer are adaptive. It is also known as input layer. The
relationship between the output and input MFs of this layer is as follows:
= (i); m= 1, 2 …………………………………………………...…….…. Eqn (5)
= (j); n= 1, 2 ………………………………………………………………..Eqn (6)
Here, x and y are the input of nodes Pm and Qn respectively. Pm and Qn are the
linguistic labels used in the fuzzy theory for dividing the MFs. The second layer is
labeled as M. The layer is also known as input MF. All nodes are fixed in this layer and
perform as simple multiplier. The outputs of this layer are firing strengths represented as:
=wi = (j); m, n = 1, 2 …………………………………………………Eqn (7)
The third layer is labeled as N. The layer is known as rule. Nodes are also fixed nodes
and perform as a regularizer to the firing strengths from the previous layer. The outputs
of this layer are regularized firing strengths and given by:
= wavg = ; m = 1, 2 ……………………………………………………….Eqn (8)
All nodes are adaptive in the fourth layer. The layer is also known as output MF. The
output of each node in this layer is the product of the regularized firing strength and a
first order polynomial. The outputs of the layer are as follows:
= wavgfm= wavg (a1x+b1y+c1); m= 1,2 …………………………………………Eqn (9)
Only one single fixed node performs the summation of all incoming signals in the fifth
layer and it is labeled as Σ. Therefore, the overall output of the model in the fifth layer
represented as:
= = ; m = 1, 2 ……………………………………….. Eqn (10)

19
(a)
(b)
Figure 2.2 (a) Structure of ANFIS; and (b) ANFIS framework shown in MATLAB
inference.
2.6 Summary This chapter provided an overview on the previous studies on Service Quality (SQ)
assessment. Again this chapter described two Artificial Intelligence (AI) models namely
Probabilistic Neural Network (PNN) and Adaptive Neuro-Fuzzy Inference System
(ANFIS). The models were reviewed with respect to their categories in terms of level of
detail, scale of independent variables, nature of independent variables and model

20
representations. There were a very limited work on predicting of SQ using PNN and
ANFIS. Hence, this research work aims at introducing two models based on intercity
train users’ data which is expected to show the SQ of intercity train including most
important attributes which is needed to improve for users’ satisfaction.

Chapter 3
STUDY METHODOLOGY AND DATA COLLECTION
3.1 General This chapter gives a detailed overview of the study methodology as well as the data
collection in the study location. The methodology section of this chapter is composed of
three subsections: Selection of SQ attributes, Data collection, and Model development.
A Stated Preference (SP) questionnaire survey is conducted to collect the intercity train
users’ opinion. Collected data are then studied with the help of analyzing tools. This
section also contains the location map of selected survey routes and information about
survey location.
The research procedure is chronologically outlined below.
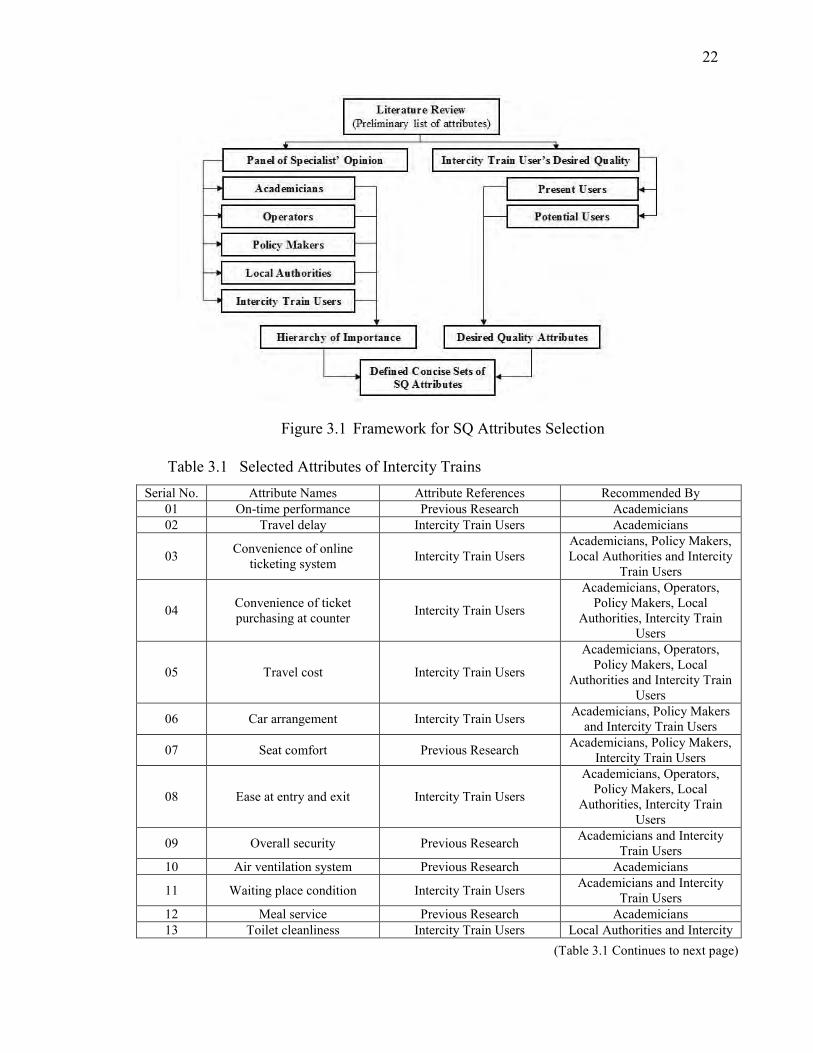
3.2 Selection of SQ Attributes The first component addresses Service Quality (SQ) attributes selection process to
perform a purpose-built questionnaire survey. This process mainly consists of two steps.
Firstly, the analysis of the intercity trains users’ view. Secondly, the analysis of public
transport specialists’ view towards SQ indicators. Primarily, all the SQ attributes are
noted from the focus group discussions for both present and potential users. Another list
is prepared from the consultations of public transport experts and recommendations of
previous researches (Pandit et. al. 2013, Eboli et. al. 2009, Dell’Olio et. al. 2010 and
NCHRP Report, 2008). Finally, a concise set of 18 SQ attributes is selected to carry out
the research work. The list of selected 18 attributes is given in Table 3.1.
22
(Table 3.1 Continues to next page)
Figure 3.1 Framework for SQ Attributes Selection
Table 3.1 Selected Attributes of Intercity Trains Serial No. Attribute Names Attribute References Recommended By
01 On-time performance Previous Research Academicians 02 Travel delay Intercity Train Users Academicians
03 Convenience of online ticketing system Intercity Train Users
Academicians, Policy Makers, Local Authorities and Intercity
Train Users
04 Convenience of ticket purchasing at counter Intercity Train Users
Academicians, Operators, Policy Makers, Local
Authorities, Intercity Train Users
05 Travel cost Intercity Train Users
Academicians, Operators, Policy Makers, Local
Authorities and Intercity Train Users
06 Car arrangement Intercity Train Users Academicians, Policy Makers and Intercity Train Users
07 Seat comfort Previous Research Academicians, Policy Makers, Intercity Train Users
08 Ease at entry and exit Intercity Train Users
Academicians, Operators, Policy Makers, Local
Authorities, Intercity Train Users
09 Overall security Previous Research Academicians and Intercity Train Users
10 Air ventilation system Previous Research Academicians
11 Waiting place condition Intercity Train Users Academicians and Intercity Train Users
12 Meal service Previous Research Academicians 13 Toilet cleanliness Intercity Train Users Local Authorities and Intercity

23
(Table 3.1 Continues from previous page)
(Table 3.2 Continues to next page)
Serial No. Attribute Names Attribute References Recommended By Train Users
14 Female harassment Previous Research Academicians 15 Courtesy of employees Previous Research Academicians 16 Fitness of car Previous Research Academicians 17 Car cleanness Previous Research Academicians 18 Noise insulation in car Previous Research Academicians
3.3 Procedure of Stated Preference (SP) Questionnaire Survey Stated Preference (SP) surveys, also called self-stated preferences for market products or
services, have been widely applied in the areas of marketing and travel demand
modeling, separately or jointly with Revealed Preference (RP) surveys with observed
choices of product purchase or service use. It is an efficient method to analyze
consumers’ evaluation of multi-attributed products and services, especially when there
are hypothetical choice alternatives and new attributes.
In the case of intercity train’s service quality of Bangladesh, there are no Revealed
Preference (RP) data for the proposed intercity train services. Therefore, a Stated
Preference (SP) survey is well designed and implemented for the thesis objectives.
A copy of questionnaire data sheet is attached in Appendix-A.
Survey location has been selected based on concentration of intercity train routes in
Bangladesh. Maximum intercity train routes converge in Kamlapur Railway Station.
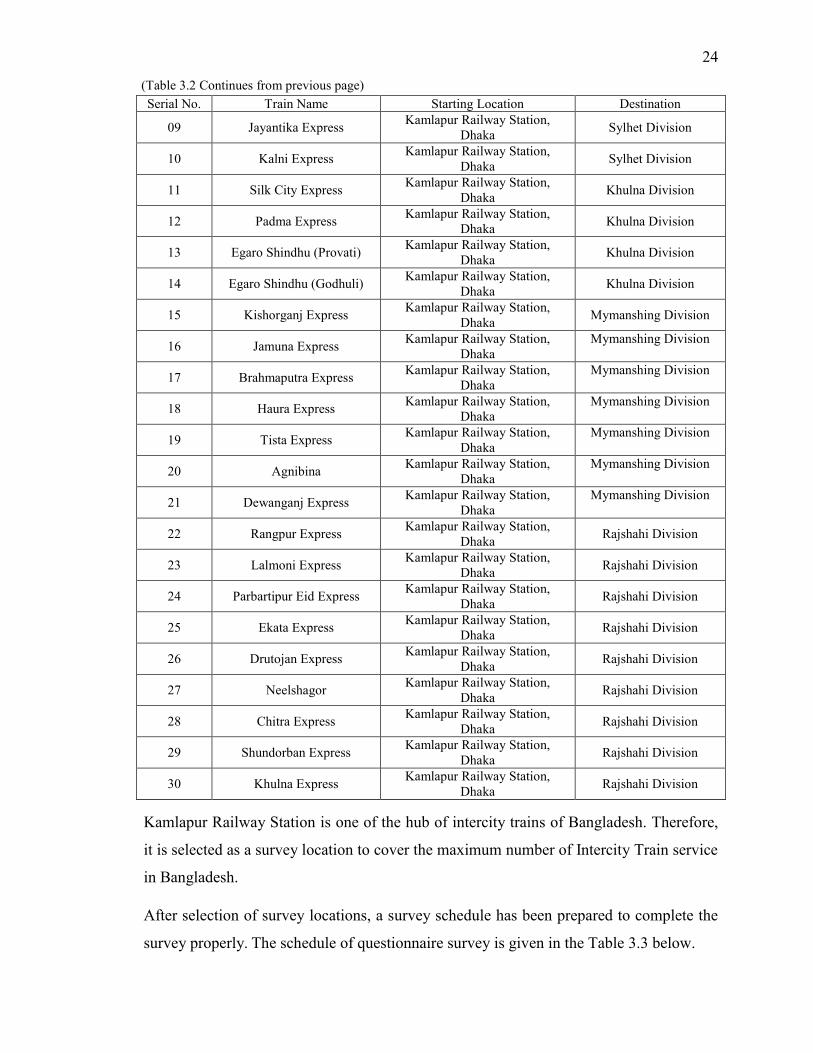
Detail of train routes are given in the Table 3.2 below.
Table 3.2 Available Intercity Train routes in Bangladesh Serial No. Train Name Starting Location Destination
01 Shuborna Express Kamlapur Railway Station, Dhaka Chittagong Division
02 Sonar Bangla Express Kamlapur Railway Station, Dhaka Chittagong Division
03 Mohanagar Provati Kamlapur Railway Station, Dhaka Chittagong Division
04 Turna Kamlapur Railway Station, Dhaka Chittagong Division
05 Mohanagar Express Kamlapur Railway Station, Dhaka Chittagong Division
06 Chotla Express Kamlapur Railway Station, Dhaka Chittagong Division
07 Upakul Express Kamlapur Railway Station, Dhaka Sylhet Division
08 Parabat Express Kamlapur Railway Station, Dhaka Sylhet Division
24
(Table 3.2 Continues from previous page) Serial No. Train Name Starting Location Destination
09 Jayantika Express Kamlapur Railway Station, Dhaka Sylhet Division
10 Kalni Express Kamlapur Railway Station, Dhaka Sylhet Division
11 Silk City Express Kamlapur Railway Station, Dhaka Khulna Division
12 Padma Express Kamlapur Railway Station, Dhaka Khulna Division
13 Egaro Shindhu (Provati) Kamlapur Railway Station, Dhaka Khulna Division
14 Egaro Shindhu (Godhuli) Kamlapur Railway Station, Dhaka Khulna Division
15 Kishorganj Express Kamlapur Railway Station, Dhaka Mymanshing Division
16 Jamuna Express Kamlapur Railway Station, Dhaka
Mymanshing Division
17 Brahmaputra Express Kamlapur Railway Station, Dhaka
Mymanshing Division
18 Haura Express Kamlapur Railway Station, Dhaka
Mymanshing Division
19 Tista Express Kamlapur Railway Station, Dhaka
Mymanshing Division
20 Agnibina Kamlapur Railway Station, Dhaka
Mymanshing Division
21 Dewanganj Express Kamlapur Railway Station, Dhaka
Mymanshing Division
22 Rangpur Express Kamlapur Railway Station, Dhaka Rajshahi Division
23 Lalmoni Express Kamlapur Railway Station, Dhaka Rajshahi Division
24 Parbartipur Eid Express Kamlapur Railway Station, Dhaka Rajshahi Division
25 Ekata Express Kamlapur Railway Station, Dhaka Rajshahi Division
26 Drutojan Express Kamlapur Railway Station, Dhaka Rajshahi Division
27 Neelshagor Kamlapur Railway Station, Dhaka Rajshahi Division
28 Chitra Express Kamlapur Railway Station, Dhaka Rajshahi Division
29 Shundorban Express Kamlapur Railway Station, Dhaka Rajshahi Division
30 Khulna Express Kamlapur Railway Station, Dhaka Rajshahi Division
Kamlapur Railway Station is one of the hub of intercity trains of Bangladesh. Therefore,
it is selected as a survey location to cover the maximum number of Intercity Train service
in Bangladesh.
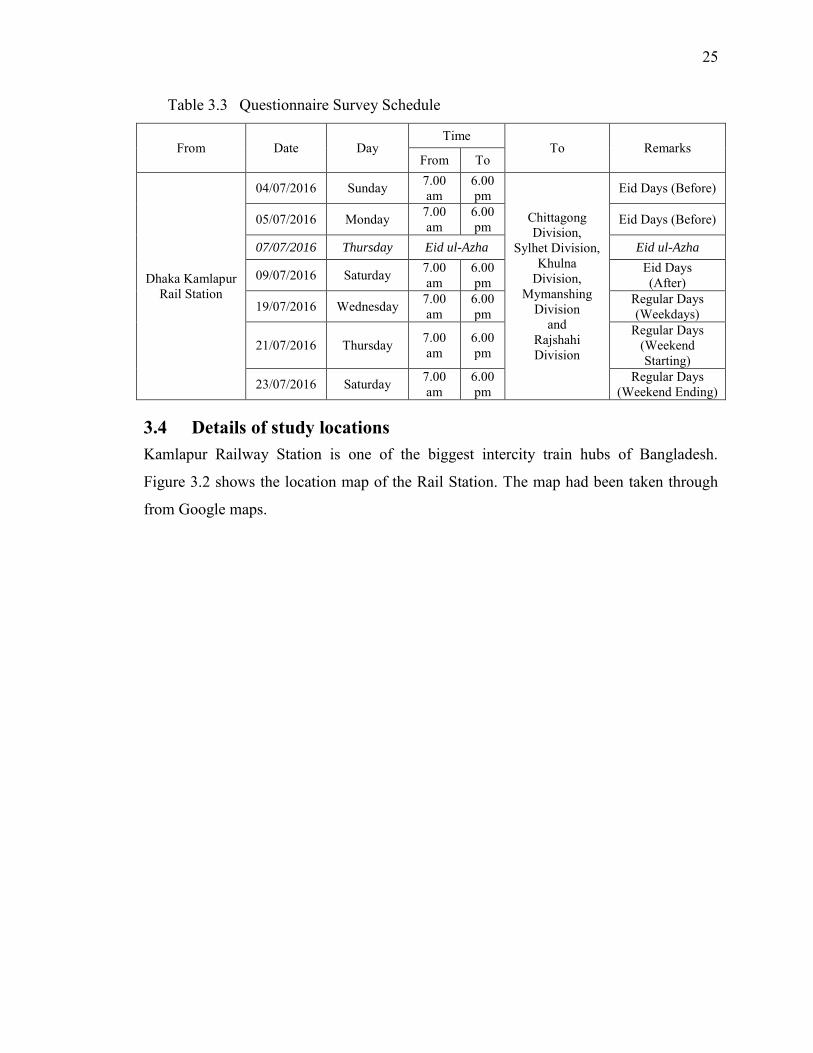
After selection of survey locations, a survey schedule has been prepared to complete the
survey properly. The schedule of questionnaire survey is given in the Table 3.3 below.
25
Table 3.3 Questionnaire Survey Schedule
From Date Day Time
To Remarks From To
Dhaka Kamlapur Rail Station
04/07/2016 Sunday 7.00 am
6.00 pm
Chittagong Division,
Sylhet Division, Khulna
Division, Mymanshing
Division and
Rajshahi Division
Eid Days (Before)
05/07/2016 Monday 7.00 am
6.00 pm Eid Days (Before)
07/07/2016 Thursday Eid ul-Azha Eid ul-Azha
09/07/2016 Saturday 7.00 am
6.00 pm
Eid Days (After)
19/07/2016 Wednesday 7.00 am
6.00 pm
Regular Days (Weekdays)
21/07/2016 Thursday 7.00 am
6.00 pm
Regular Days (Weekend Starting)
23/07/2016 Saturday 7.00 am
6.00 pm
Regular Days (Weekend Ending)
3.4 Details of study locations Kamlapur Railway Station is one of the biggest intercity train hubs of Bangladesh.
Figure 3.2 shows the location map of the Rail Station. The map had been taken through
from Google maps.

26
Figure 3.2 Survey location (Source: Google maps)

27
Figure 3.3 Divisions of Bangladesh (Source: Banglapidia)

28
Figure 3.4 Transport Network of Bangladesh (Source: Banglapidia)

29
Figure 3.5 Intercity Railway Network in Bangladesh (Source: Banglapidia)

30
3.5 Data Collection Face-to-face interviews were carried out with 6 skilled enumerators of intercity train at
Kamlapur Railway Station on the month of July, 2016. There are three sections in the
survey questionnaire. The first section aims to get personal and socioeconomic
information (age, gender, occupation etc.) of commuters and the reason for using
intercity trains. The second section focuses on 18 attributes that are accountable for the
evaluation of intercity train SQ. The third section organized to get priority ranking of the
attributes from the respondents. These attributes are in a close ended arrangement with
relevant multiple choices. The respondents are asked to assess the present situation of the
service by marking the checkboxes from their point of view against each attribute. The
multiple-choice check boxes are numbered by 1 to 5 where “5” corresponds to excellent
quality and “1” corresponds to very poor quality.
Data collection was set forth with an initial target of 2000 samples. However, reluctance
to participate from the users, rush hour movements, and other unexpected situations
restricted the random data samples to 1800. After filtering the anomalies, outputs from
1590 data (Regular day’s 1037 data and special day’s 553 data) samples are used in this
research work.
3.6 Model Development (Training) In this research, Probabilistic Neural Network (PNN) and Adaptive Neuro-Fuzzy
Interface System (ANFIS) are introduced and the out-of-sample forecasting technique is
applied to examine the predictive power of those models. The accuracy of a prediction
model is tested by comparing its predicted outputs with corresponding observed targets.
The training and forecasting sets contained 80% of whole sample (830 samples for
regular days, and 443 samples for special days) and 20% of whole sample (207 samples
for regular days, and 110 samples for special days) observations, respectively. MATLAB
2014b is used for the development of these models. To get the best performance, the
parameters (e.g. neuron number, learning rate, momentum factor, smoothing factor,
transfer functions) of the models are randomly altered by trial-and-error technique. The
parameters of PNN and ANFIS models are shown in Table 3.4.

31
Table 3.4 Parameters Related to Probabilistic Neural Network (PNN) and Adaptive
Neuro-Fuzzy Interface System (ANFIS) for Intercity Train SQ Prediction Models
PNN ANFIS Number of input variables
18 Number of input variables
18
Number of layers 4 Number of layers 5 Initial function initlay Number of membership
function 181
Performance function mse MF type Gaussian Performance parameter normalization Transfer function of
hidden layer tansigmoid
Scaling method normalization Scaling method normalization Training algorithm Radial basis Transfer function of
output layer linear
Training algorithm Back-propagation
Training cycles, epochs 10 Training goal 0.01
Four layered neural networks are created by using the Probabilistic Neural Network
(PNN) whereas in Adaptive Neuro-Fuzzy Interface System (ANFIS) there are five
layered neural networks. Every network has an input layer and an output layer. The SQ
attributes are applied as input variable and the intercity train SQs as output. Some
properties have to be defined to build the models to get best performances which are
shown in above Table 3.4. Adaptive Neuro-Fuzzy Interface System (ANFIS) is defined
with two hidden layers, membership functions and tansigmoid transfer function of hidden
layer, linear transfer function of output layer, normalization as scaling method, 0.01 as
training goal and training cycle is 10. The training algorithm of PNN performs their
training by following radial basis algorithm.
On the other hand, PNN is defined with four layers in which there is one pattern layer and
one summation layer, initlay as initial function and mse as performance function.
Both PNN and ANFIS use normalization technique as scaling method. The training
algorithm of ANFIS is back-propagation, whereas PNN perform their training by
following radial basis algorithm.

32
3.7 Summary This chapter aims at developing the PNN and ANFIS model for the prediction of intercity
train service quality of Bangladesh. This analysis prerequisites high-quality and high-
volume data sets. In this context, an attribute selection process has been developed as a
flow chart giving priorities to academicians, transportation researchers, previous research
works, concern authorities and intercity train users. After finalizing attributes, the study
location with time scheduling is planned to conduct the stated preference (SP) survey.
Then, survey sheet and collected data arrangement and sorting are briefly presented.
Finally, at the end to the chapter, a section briefly discussed the development of PNN and
ANFIS model.

(Table 4.1 Continues to next page)
Chapter 4
SURVEY DETAIL DATA ANALYSIS AND RESULTS
4.1 General This Chapter contains the characteristics of intercity train users, details description of
users’ perception for each question of survey and the details of model development.
4.2 Characteristics of Intercity Train User 1037 respondents in regular days and 553 respondents in special days were selected
randomly from kamlapur rail station, intercity train hub of Bangladesh. Trains depart and
arrive in kamlapur rail station from different locations of Bangladesh. Table 4.1
illustrates the general characteristics of the respondents collected from the questionnaire
survey.
Table 4.1 General characteristics of the Intercity Train Users
Characteristics Statistics Occasional Days Regular Days
No. of Respondents Percentage No. of
Respondents Percentage
Gender Male 407 73.68 % 804 77.54 %
Female 156 26.32 % 233 22.45 %
Age
11 ~ 20 Years old
121 21.88 % 169 16.28 %
21 ~ 30 Years old
292 52.80 % 557 53.74 %
31 ~ 40 Years old
92 16.64 % 211 20.31 %
41 ~ 50 Years old
42 7.59 % 79 07.66 %
51 ~ 60 Years old
5 0.90 % 16 01.53%
> 60 Years old
1 0.18 % 5 0.48%
Occupation
Service Holder
158 28.62 % 315 30.39%
Business 281 20.65 % 211 20.33%
Student 143 25.91 % 282 27.23%

34
(Table 4.1 Continues from previous page)
Characteristics Statistics Occasional Days Regular Days
No. of Respondents Percentage No. of
Respondents Percentage
Worker 97 17.57 % 180 17.35%
Housewife 40 7.25 % 49 4.70%
Motivation of
Choosing
Intercity Train
Captive Rider
23 4.24% 23 2.23 %
Economical 60 10.89% 137 13.20 %
Comfortable 138 24.91% 308 29.71 %
Safer 315 56.83% 550 53.01 %
Other 17 3.14% 19 1.82 %
Will choose
Alternative
Mode if Delay
1hr+ 34 6.12% 115 11.08 %
2hr+ 123 22.32% 351 33.85 %
3hr+ 252 45.57% 388 37.38 %
4hr+ 100 18.04% 123 11.85 %
5hr+ 44 7.95% 61 5.85 %
4.3 Users’ Satisfaction Ratings about Intercity Train 4.3.1 Overall service quality of intercity train
Question: What is your view on overall service quality of intercity train?
The overall service quality of intercity train from user’s perspective has reflected by this
question.
In special days and regular days, overall service quality has given in detail in the
following Table 4.2.
35
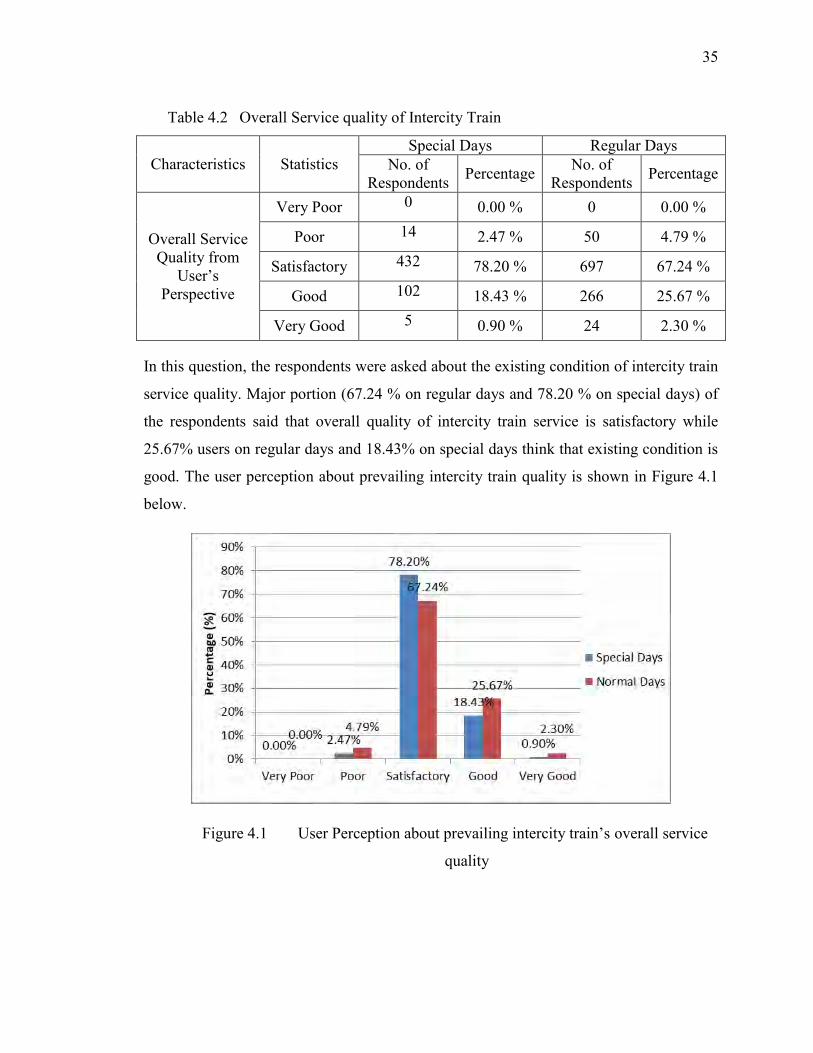
Table 4.2 Overall Service quality of Intercity Train
Characteristics Statistics Special Days Regular Days
No. of Respondents Percentage No. of
Respondents Percentage
Overall Service Quality from
User’s Perspective
Very Poor 0 0.00 % 0 0.00 %
Poor 14 2.47 % 50 4.79 %
Satisfactory 432 78.20 % 697 67.24 %
Good 102 18.43 % 266 25.67 %
Very Good 5 0.90 % 24 2.30 %
In this question, the respondents were asked about the existing condition of intercity train
service quality. Major portion (67.24 % on regular days and 78.20 % on special days) of
the respondents said that overall quality of intercity train service is satisfactory while
25.67% users on regular days and 18.43% on special days think that existing condition is
good. The user perception about prevailing intercity train quality is shown in Figure 4.1
below.
Figure 4.1 User Perception about prevailing intercity train’s overall service
quality
36
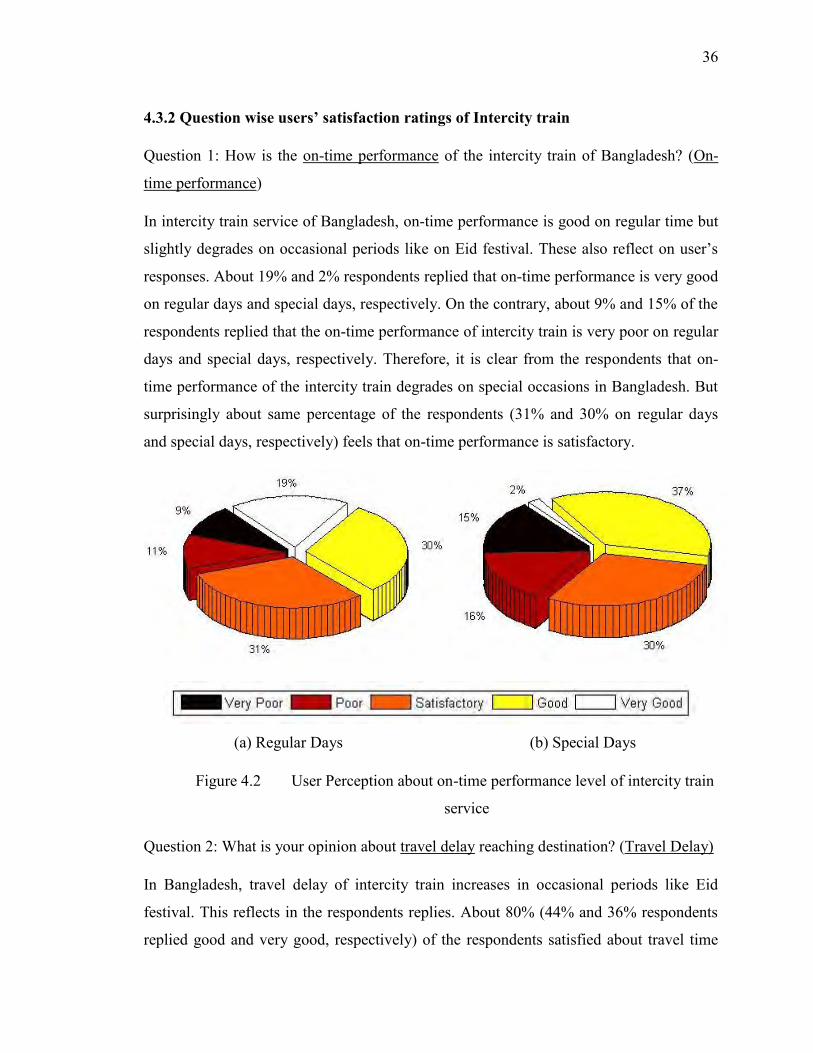
4.3.2 Question wise users’ satisfaction ratings of Intercity train
Question 1: How is the on-time performance of the intercity train of Bangladesh? (On-
time performance)
In intercity train service of Bangladesh, on-time performance is good on regular time but
slightly degrades on occasional periods like on Eid festival. These also reflect on user’s
responses. About 19% and 2% respondents replied that on-time performance is very good
on regular days and special days, respectively. On the contrary, about 9% and 15% of the
respondents replied that the on-time performance of intercity train is very poor on regular
days and special days, respectively. Therefore, it is clear from the respondents that on-
time performance of the intercity train degrades on special occasions in Bangladesh. But
surprisingly about same percentage of the respondents (31% and 30% on regular days
and special days, respectively) feels that on-time performance is satisfactory.
(a) Regular Days (b) Special Days
Figure 4.2 User Perception about on-time performance level of intercity train
service
Question 2: What is your opinion about travel delay reaching destination? (Travel Delay)
In Bangladesh, travel delay of intercity train increases in occasional periods like Eid
festival. This reflects in the respondents replies. About 80% (44% and 36% respondents
replied good and very good, respectively) of the respondents satisfied about travel time

37
and marked above Satisfactory as their satisfactory level on regular days. On the other
hand, on the special days this decreases to 62%. But surprisingly on the both occasions
respondents replied in same percentages on very poor and poor of about 1% and 3%.
(a) Regular Days (b) Special Days
Figure 4.3 User Perception about travel delay of intercity train service
Question 3 How convenient is the online ticketing system? (Convenience of online
ticketing system)
Although Online ticketing system is a revolutionary step in the intercity train service,
most of the people in developing countries couldn’t avail the full benefit of the system.
This is due to cause of the availability of the internet connectivity. This fact also reflected
in the user’s responses of this study. Respondents of about 91% of regular days and 89%
of special days, responded positively and given opinion ‘Satisfactory’ and above
satisfactory, i.e., ‘Good’ and ‘Very Good’ to the online ticketing system. On the contrary,
about 9% and 11% of regular days and special days replied poor and very poor because
of the unavailability of ticket and internet connectivity.
38
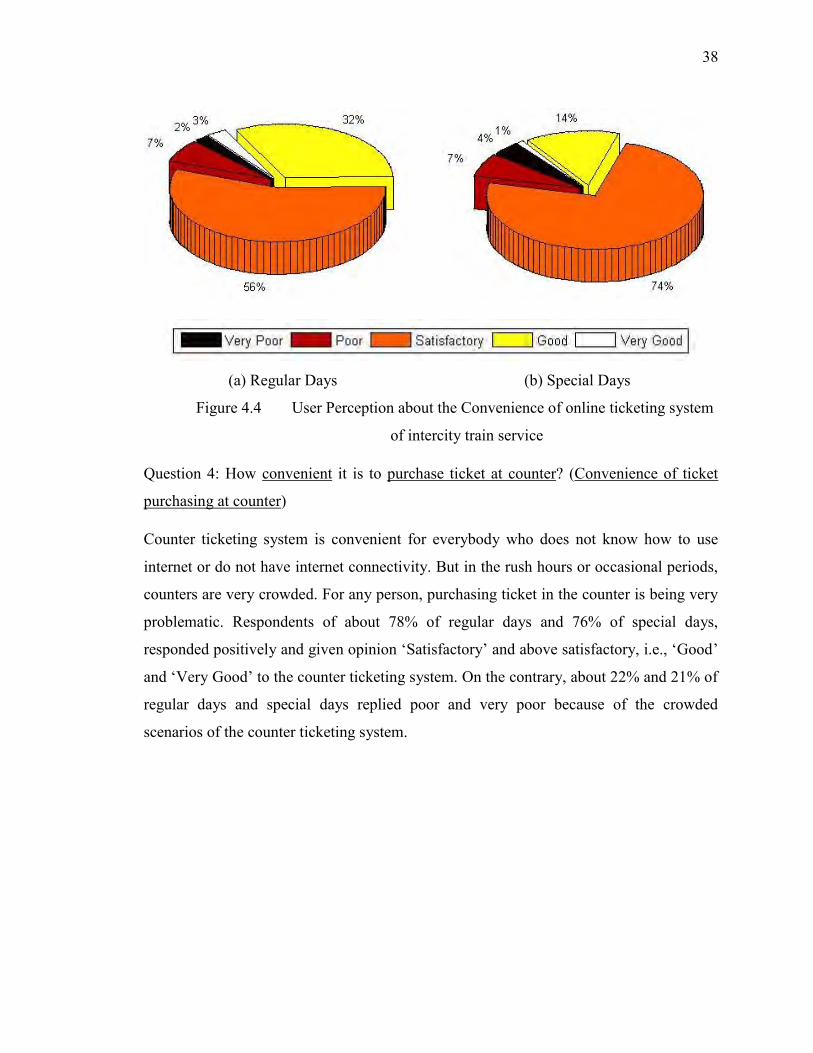
(a) Regular Days (b) Special Days
Figure 4.4 User Perception about the Convenience of online ticketing system
of intercity train service
Question 4: How convenient it is to purchase ticket at counter? (Convenience of ticket
purchasing at counter)
Counter ticketing system is convenient for everybody who does not know how to use
internet or do not have internet connectivity. But in the rush hours or occasional periods,
counters are very crowded. For any person, purchasing ticket in the counter is being very
problematic. Respondents of about 78% of regular days and 76% of special days,
responded positively and given opinion ‘Satisfactory’ and above satisfactory, i.e., ‘Good’
and ‘Very Good’ to the counter ticketing system. On the contrary, about 22% and 21% of
regular days and special days replied poor and very poor because of the crowded
scenarios of the counter ticketing system.

39
(a) Regular Days (b) Special Days
Figure 4.5 User Perception about the Convenience of ticket purchasing at
counter of intercity train service
Question 5: What is your idea about travelling cost of intercity train? (Travel cost)
On regular days, travel cost of intercity train is low comparing with other mode of
transport in developing countries. But as the demand does not meet with the capacity, on
occasional time intercity train ticket price increases unofficially as people intended to
profit unethically by syndicating ticket price. Respondents of about 85% of regular days
and 83% of special days, responded positively and given opinion ‘Satisfactory’ and
above satisfactory, i.e., ‘Good’ and ‘Very Good’ to the counter ticketing system. On the
contrary, about 15% and 17% of regular days and special days replied poor and very poor
because of the crowded scenarios of the counter ticketing system.
40
(a) Regular Days (b) Special Days
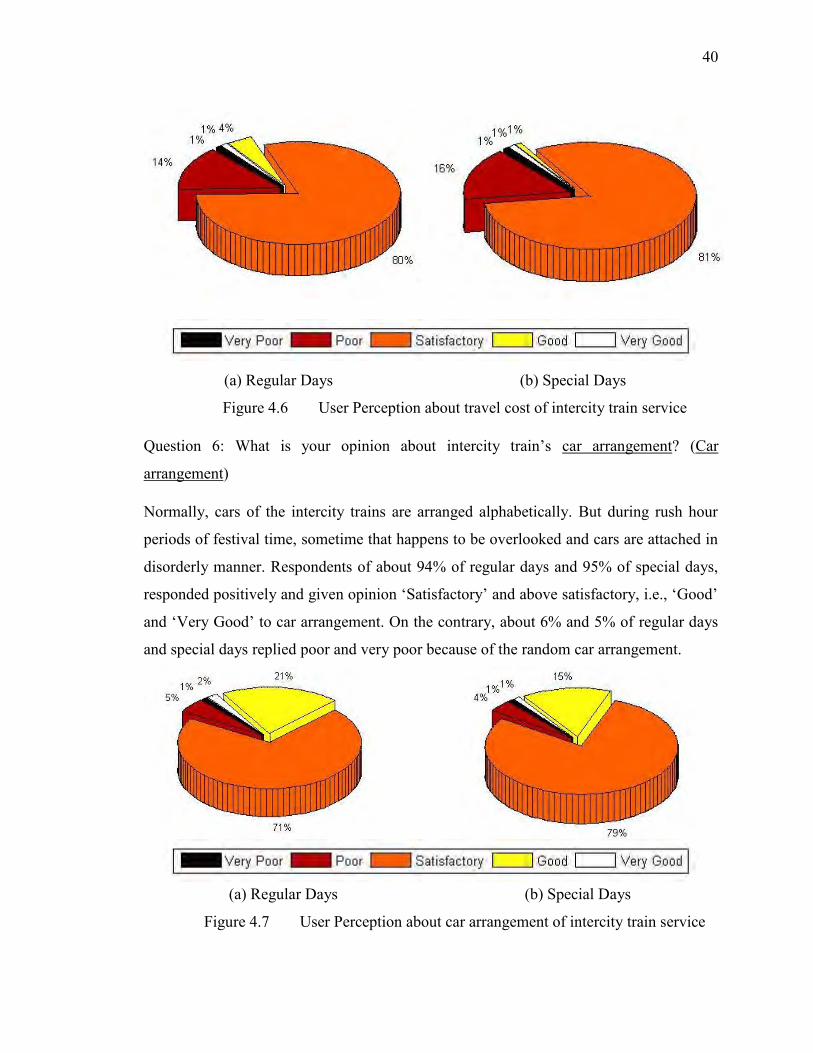
Figure 4.6 User Perception about travel cost of intercity train service
Question 6: What is your opinion about intercity train’s car arrangement? (Car
arrangement)
Normally, cars of the intercity trains are arranged alphabetically. But during rush hour
periods of festival time, sometime that happens to be overlooked and cars are attached in
disorderly manner. Respondents of about 94% of regular days and 95% of special days,
responded positively and given opinion ‘Satisfactory’ and above satisfactory, i.e., ‘Good’
and ‘Very Good’ to car arrangement. On the contrary, about 6% and 5% of regular days
and special days replied poor and very poor because of the random car arrangement.
(a) Regular Days (b) Special Days
Figure 4.7 User Perception about car arrangement of intercity train service

41
Question 7: How comfortable is the seat of the intercity train? (Seat comfort)
In long journey, seat comfort is a big issue for intercity train. Respondents of about 77%
of regular days and 83% of special days, responded positively and given opinion
‘Satisfactory’ and above satisfactory, i.e., ‘Good’ and ‘Very Good’ to seat comfort. On
the contrary, about 23% and 17% of regular days and special days replied poor and very
poor because of some poor quality seat about seat comfort.
(a) Regular Days (b) Special Days
Figure 4.8 User Perception about seat comfort of intercity train service
Figure 4.9 Seat condition of intercity train

42
Question 8: What is your opinion about ease of entry-exit in intercity train? (Ease at entry
and exit)
Bangladesh railway cars are way above the platform. That’s why it is very troublesome to
step in the cars. Respondents of about 86% of regular days and 95% of special days,
responded positively and given opinion ‘Satisfactory’ and above satisfactory, i.e., ‘Good’
and ‘Very Good’ to ease of entry and exit. On the contrary, about 14% and 5% of regular
days and special days replied poor and very poor because of vertical stair and its height
about ease of entry and exit.
(a) Regular Days (b) Special Days
Figure 4.10 User Perception about ease at entry and exists of intercity train service
Figure 4.11 Entry Exit pathway of Intercity Train (Tista)

43
Question 9: What is your opinion about overall security in intercity train? (Overall
security)
In most of the developing countries, security is a very important issue. This reflects in the
respondents replies. Respondents of about 90% of regular days and 88% of special days,
responded positively and given opinion ‘Satisfactory’ and above satisfactory, i.e., ‘Good’
and ‘Very Good’ to overall security. On the contrary, about 10% and 12% of regular days
and special days replied poor and very poor about overall security.
(a) Regular Days (b) Special Days
Figure 4.12 User Perception about overall security of intercity train service
Question 10: What is your opinion about air ventilation system of intercity train of
Bangladesh? (Air ventilation system)
Air ventilation system of Bangladesh railway cars are mainly doors, windows and car top
fans. In air-conditioned cabin, AC is the main air ventilation system. From user’s
responses, it was obtained that air ventilation system of intercity train is better in regular
days than special days. Respondents of about 94% of regular days and 90% of special
days, responded positively and given opinion ‘Satisfactory’ and above satisfactory, i.e.,
‘Good’ and ‘Very Good’ to air ventilation system. On the contrary, about 6% and 10% of
regular days and special days replied poor and very poor about overall security.

44
(a) Regular Days (b) Special Days
Figure 4.13 User Perception about air ventilation system of intercity train
service
Figure 4.14 Air ventilation system of Intercity Train
Question 11: What do you think about waiting place condition of intercity train service of
Bangladesh? (Waiting place condition)
Waiting place condition of intercity train station is a vital factor. As in some cases, many
people had to wait for long time for train in railway station. As crowed increases, quality
of waiting place becomes very important for the positive perception of intercity train

45
users. Respondents of about 96% of regular days and 90% of special days, responded
positively and given opinion ‘Satisfactory’ and above satisfactory, i.e., ‘Good’ and ‘Very
Good’ to waiting place condition. On the contrary, about 4% and 10% of regular days
and special days replied poor and very poor because of long waiting period on railway
station about waiting place condition.
(a) Regular Days (b) Special Days
Figure 4.15 User Perception about waiting place condition of intercity train service
(a)

46
(b)
Figure 4.16 Waiting place condition, (a) Regular days, and (b) Special days
Question 12: What is your idea about meal service of intercity train of Bangladesh?
(Meal service)
In long journey, users takes meals in different periods. Respondents of about 90% of
regular days and 94% of special days, responded positively and given opinion
‘Satisfactory’ and above satisfactory, i.e., ‘Good’ and ‘Very Good’ to meal service. On
the contrary, about 10% and 6% of regular days and special days replied poor and very
poor about meal service
(a) Regular Days (b) Special Days
Figure 4.17 User Perception about meal service of intercity train service

47
Question 13: What is your comment about toilet cleanliness of intercity train of
Bangladesh? (Toilet cleanliness)
Like all long distance traveling transportation modes, toilet is an essential part of an
intercity train car. Respondents of about 95% of regular days and 98% of special days,
responded positively and given opinion ‘Satisfactory’ and above satisfactory, i.e., ‘Good’
and ‘Very Good’ to toilet cleanliness. On the contrary, about 5% and 2% of regular days
and special days replied poor and very poor about toilet cleanliness.
(a) Regular Days (b) Special Days
Figure 4.18 User Perception about toilet cleanliness of intercity train service
Question 14: In your point of view, what is the condition of Security for female
(harassment) in intercity train service of Bangladesh? (Female harassment)
Female harassment is very sensitive issue. In some cases, even victim do not want to
complain or disclose the issue. That is why it is very difficult to collect data. In this
research study, Respondents of about 91% of both regular days and special days,
responded positively and given opinion ‘Satisfactory’ and above satisfactory, i.e., ‘Good’
and ‘Very Good’ to female harassment. On the contrary, about 10% and 6% of regular
days and special days replied poor and very poor about female harassment.

48
(a) Regular Days (b) Special Days
Figure 4.19 User Perception about female harassment of intercity train service
Question 15: What is your opinion about courtesy of employees of intercity train?
(Courtesy of employees)
Courtesy of the employees are very important to retain existing users and attract new
users. Respondents of about 97% of regular days and 98% of special days, responded
positively and given opinion ‘Satisfactory’ and above satisfactory, i.e., ‘Good’ and ‘Very
Good’ to courtesy of employees. On the contrary, about 3% and 2% of regular days and
special days replied poor and very poor about courtesy of employees.
(a) Regular Days (b) Special Days
Figure 4.20 User Perception about courtesy of employees of intercity train
service

49
Question 16: What is your idea about fitness of the car of intercity train? (Fitness of car)
Car fitness is a prerequisite of comfort and safety of intercity train. Respondents of about
93% of regular days and 96% of special days, responded positively and given opinion
‘Satisfactory’ and above satisfactory, i.e., ‘Good’ and ‘Very Good’ to car fitness. On the
contrary, about 7% and 4% of regular days and special days replied poor and very poor
about car fitness.
(a) Regular Days (b) Special Days
Figure 4.21 User Perception about fitness of car of intercity train service
(a)

50
(b)
Figure 4.22 Car fitness of Intercity Train
Question 17: What do you think about car cleanness of intercity train? (Car cleanness)
Car cleanness is a prerequisite of retaining existing users and attract new users.
Respondents of about 84% of regular days and 91% of special days, responded positively
and given opinion ‘Satisfactory’ and above satisfactory, i.e., ‘Good’ and ‘Very Good’ to
car cleanness. On the contrary, about 16% and 9% of regular days and special days
replied poor and very poor about car cleanness.

51
(a) Regular Days (b) Special Days
Figure 4.23 User Perception about car cleanness of intercity train service
Question 18: What is your opinion about noise insulation in the car of intercity trains?
(Noise insulation in car)
Noise insulation in cars is a vital requirement for comfort intercity train ride.
Respondents of about 36% of both regular days and special days responded positively
and given opinion ‘Satisfactory’ and above satisfactory, i.e., ‘Good’ and ‘Very Good’ to
noise insulation in the cars. On the contrary, about 64% of both regular days and special
days replied poor and very poor about noise insulation in cars.
(a) Regular Days (b) Special Days
Figure 4.24 User Perception about noise insulation in cars of intercity train service

52
These are the rating percentages given by respondents during questionnaire survey.
According to these survey results it is found that people are using intercity train services
mainly because of comfort and safety of intercity train. There are some problems in the
service also such as, waiting place condition of intercity train service, travel cost, noise
level during the service, lighting facilities, ease of entry-exit system, travel time during
special days and security of the passenger.
4.4 Summery of Users’ Perception about Intercity Train Service
Nineteen (19) questions (among them 18 used as intercity train attributes and one used
for gathering information about the overall quality of intercity train) were used in this
study to know the users’ perception about intercity train service. Respondents were asked
to provide a rating which reflects their opinion about different features of intercity train.
They rated the questions as “Very Good”, “Good”, “Satisfactory”, “Poor” or “Very
Poor”. Table 4.3 represents the summery of overall users’ perception ratting for different
factors of intercity train service in Bangladesh.
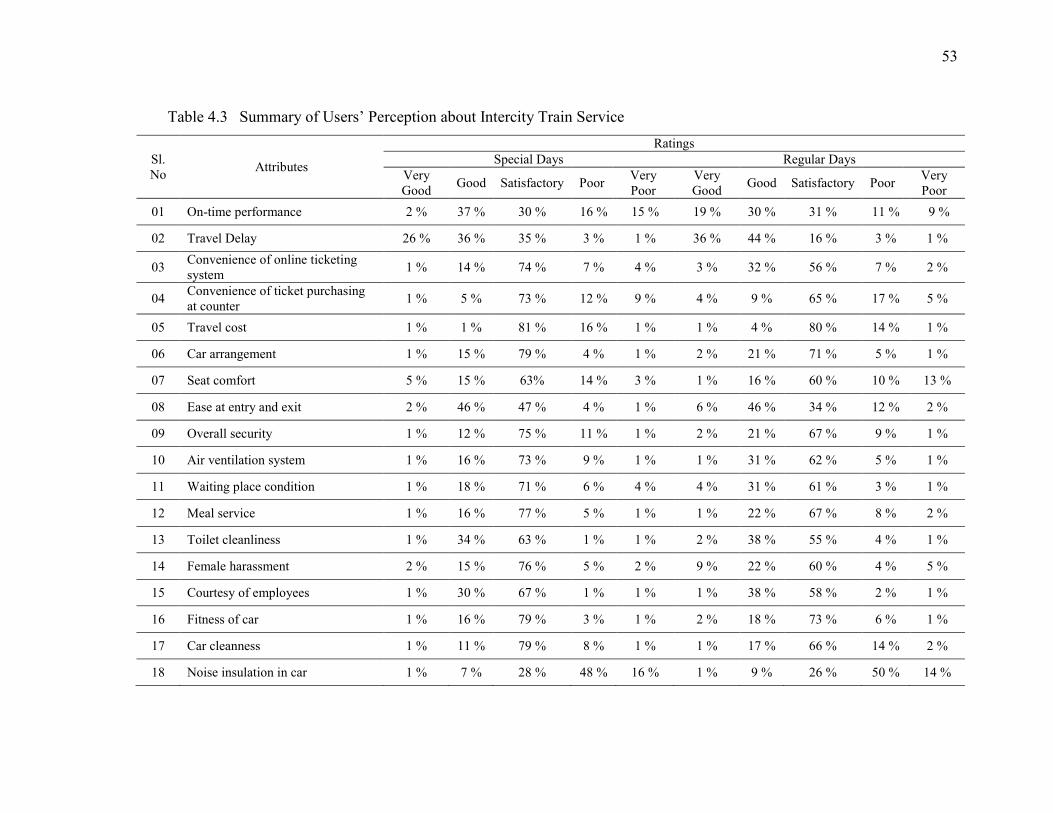
53
Table 4.3 Summary of Users’ Perception about Intercity Train Service
Sl. No Attributes
Ratings Special Days Regular Days
Very Good Good Satisfactory Poor Very
Poor Very Good Good Satisfactory Poor Very
Poor 01 On-time performance 2 % 37 % 30 % 16 % 15 % 19 % 30 % 31 % 11 % 9 %
02 Travel Delay 26 % 36 % 35 % 3 % 1 % 36 % 44 % 16 % 3 % 1 %
03 Convenience of online ticketing system 1 % 14 % 74 % 7 % 4 % 3 % 32 % 56 % 7 % 2 %
04 Convenience of ticket purchasing at counter 1 % 5 % 73 % 12 % 9 % 4 % 9 % 65 % 17 % 5 %
05 Travel cost 1 % 1 % 81 % 16 % 1 % 1 % 4 % 80 % 14 % 1 %
06 Car arrangement 1 % 15 % 79 % 4 % 1 % 2 % 21 % 71 % 5 % 1 %
07 Seat comfort 5 % 15 % 63% 14 % 3 % 1 % 16 % 60 % 10 % 13 %
08 Ease at entry and exit 2 % 46 % 47 % 4 % 1 % 6 % 46 % 34 % 12 % 2 %
09 Overall security 1 % 12 % 75 % 11 % 1 % 2 % 21 % 67 % 9 % 1 %
10 Air ventilation system 1 % 16 % 73 % 9 % 1 % 1 % 31 % 62 % 5 % 1 %
11 Waiting place condition 1 % 18 % 71 % 6 % 4 % 4 % 31 % 61 % 3 % 1 %
12 Meal service 1 % 16 % 77 % 5 % 1 % 1 % 22 % 67 % 8 % 2 %
13 Toilet cleanliness 1 % 34 % 63 % 1 % 1 % 2 % 38 % 55 % 4 % 1 %
14 Female harassment 2 % 15 % 76 % 5 % 2 % 9 % 22 % 60 % 4 % 5 %
15 Courtesy of employees 1 % 30 % 67 % 1 % 1 % 1 % 38 % 58 % 2 % 1 %
16 Fitness of car 1 % 16 % 79 % 3 % 1 % 2 % 18 % 73 % 6 % 1 %
17 Car cleanness 1 % 11 % 79 % 8 % 1 % 1 % 17 % 66 % 14 % 2 %
18 Noise insulation in car 1 % 7 % 28 % 48 % 16 % 1 % 9 % 26 % 50 % 14 %

54
From questionnaire survey, opinions from intercity train user were found about quality of
transport, service quality, service reliability, safety and security of the service etc. From
Table 4.3, the idea of actual condition of the perception of intercity train user on
individual attribute which affects the quality of service of intercity train was obtained.
Existing condition of intercity train service found satisfactory for – i) Convenience of
online ticketing system, ii) Convenience of ticket purchasing at counter, iii) Travel cost,
iv) Car arrangement, v) Seat comfort, vi) Overall security, vii) Air ventilation system,
viii) Waiting place condition, ix) Meal service, x) Toilet cleanliness, xi) Female
harassment, xii) Courtesy of employees, xiii) Fitness of car, and xiv) Car cleanness. Two
parameters were found in good condition during survey which are- i) On-time
performance, ii) Travel Delay and iii) Ease at entry and exit. There are some parameters
that found poor in condition like - Noise insulation in car.
4.5 Summary
This chapter analyses the demographic data and respondent’s responses data collected
through stated preference survey for intercity train service. Demographic data analysis
presented in the table 4.1. Overall service quality data analysis presented in table 4.2 and
all the respondent’s responses analyzed accordingly under section 4. Finally, a summary
of the intercity train users’ perception is presented in the table 4.3. Moreover, a
concluding summary of the analysis of the SP survey data is also given after the table 4.3.
Furthermore, this chapter provides a clear idea about existing condition of Intercity Train
by the perception of Intercity Train user.

Chapter 5
ANALYSIS RESULTS AND DISCUSSION
5.1 General This Chapter shows the model performance of PNN and ANFIS for Intercity Train
Service Quality (SQ). It also reveals the attribute ranking and finds the significant
attributes for improving SQ of intercity train.
The details are chronologically outlined below.
5.2 Model Evaluation There are several ways to evaluate the model performance. However, the performance
evaluation techniques will be used in this study are: confusion matrix, root-mean-square
error (RMSE) and correlation co-efficient (R). Confusion matrix will be used to check the
one-to-one matching between output classes of predicted Service Quality (SQ) and target
classes of actual SQ. Whereas, R and RMSE values will show the correlation and error
between actual SQ and predicted SQ of intercity train.
Confusion matrix is used to check the one-to-one matching between output classes
(1 to 5) and target classes (1 to 5). The diagonal green boxes in Figure 4 illustrate the
amounts and percentages that are identical in both output and corresponding target
classes. The red boxes illustrate the amounts of misclassifications. The right-bottom blue
box represents the total correct classifications (green) and misclassifications (red) in
percent (%).

56
(a) (b)
(c) (d)
Figure 5.1 Confusion matrices for ANFIS of, (a) trained model for regular days; (b)
tested model for regular days; (c) trained model for special days; and (d) tested model for special days.

57
(e) (f)
(g) (h)
Figure 5.2 Confusion matrices for PNN of, (e) trained model for regular days;
(f) tested model for regular days; (g) trained model for special days; and (h) tested model for special days.

58
The predicted classifications of developed ANFIS and PNN models are shown in
Figure 5.1 and Figure 5.2 by means of confusion matrix.
It is observed that, ANFIS and PNN have different accuracy in prediction given in Table
5.1 below.
Table 5.1 ANFIS and PNN model accuracy in predicting Service Quality (SQ)
Regular Days Special Days Training Period Testing Period Training Period Testing Period
ANFIS 83.10% (690 out of 830)
54.10% (112 out of 207)
93.30% (413 out of 443)
60.20% (66 out of 110)
PNN 99.40% (825 out of 830)
50.70% (105 out of 207)
99.50% (441 out of 443)
57.30% (63 out of 110)
In quantitative term, ANFIS has shown accuracy in predictions 112 out of 207 and 66 out
of 110 on regular days and special days, which implies that 112 and 66 predictions match
with the actual SQ value, respectively. However, PNN has shown accuracy in predictions
105 out of 207 and 63 out of 110 on regular days and special days, which implies that
105 and 63 predictions match with the actual SQ value, respectively. Therefore, it is clear
that the ANFIS is more efficient than PNN in predicting SQ in both regular and special
days.
5.2.1 Correlation Coefficient
Correlation often measured as a correlation coefficient which indicates the strength and
direction of a linear relationship between two variables (for example model output and
observed values). A number of different coefficients are used for different situations. The
best known is the Pearson product-moment correlation coefficient (also called Pearson
correlation coefficient or the sample correlation coefficient), which is obtained by
dividing the covariance of the two variables by the product of their standard deviations. If
we have a series n observations and n model values, then the Pearson product-moment
correlation coefficient can be used to estimate the correlation between model and
observations.

59
Correlation co-efficient(R) is defined as:
n
i i
n
i i
n
i ii
yyxx
yyxxR
12
12
1
)()(
)()(
Where,
x̄= mean of target classes; . = mean of predicted classes;
xi = ith target class; and yi = ith predicted class.
The correlation is +1 in the case of a perfect increasing linear relationship, and -1 in case
of a decreasing linear relationship, and the values in between indicates the degree of
linear relationship between for example model and observations. A correlation coefficient
of 0 means the there is no linear relationship between the variables. The square of the
Pearson correlation coefficient (r2), known as the coefficient of determination, describes
how much of the variance between the two variables is described by the linear fit.
5.2.2 Root Mean Square Error (RMSE)
Root Mean Square Error (RMSE) (also called the Root Mean Square Deviation, RMSD)
is a frequently used measure of the difference between values predicted by a model and
the values actually observed from the environment that is being modeled. These
individual differences are also called residuals, and the RMSE serves to aggregate them
into a single measure of predictive power. However, the RMSE values can be used to
distinguish model performance in a calibration period with that of a validation period as
well as to compare the individual model performance to that of other predictive models.
The RMSE of a model prediction with respect to the estimated variable Xmodel is defined
as the square root of the mean squared error:
Root-mean-square error is defined as:
n
XXRMSE
n
i idelmoiobs
12
,, )(
Where, Xobs is observed values and Xmodel is modeled values at time/place i.
Eqn (12)
(Eqn 11)

60
The RMSE is the square root of the variance of the residuals. It indicates the absolute fit
of the model to the data–how close the observed data points are to the model’s predicted
values. Whereas R-squared is a relative measure of fit, RMSE is an absolute measure of
fit. As the square root of a variance, RMSE can be interpreted as the standard deviation of
the unexplained variance, and has the useful property of being in the same units as the
response variable. Lower values of RMSE indicate better fit. RMSE is a good measure of
how accurately the model predicts the response, and is the most important criterion for fit
if the main purpose of the model is prediction.
Comments can be made on the model performances based on the RMSE values between
the predicted and actual SQ of the forecasting sample (207 and 110 data of regular days
and special days, respectively). The RMSE values for those models for regular days and
special days were 0.085759 and 0.067187 with ANFIS, respectively. And the RMSE
values for those models for regular days and special days were 1.3744 and 0.8766 with
PNN, respectively. RMSE value of ANFIS model was smaller than PNN model. It
showed that based on user stated preferences, ANFIS performs better than PNN in SQ
prediction of intercity train. This study used 18 attributes in ANFIS and PNN models to
estimate the intercity train SQ. As the relationship between input variables (SQ attributes)
and the output variable is indistinct, ranking of these SQ attributes can be performed by
analytical techniques. Cross-correlation, principal component analysis (PCA), stepwise
approach and connection weights are some of the techniques for attribute ranking.
However, in this study, stepwise approach is followed for ranking the significant intercity
train attributes which is shown in following section.
5.2.3 Stepwise Approach
The Stepwise approach is a simple, standardized and popular method for evaluating and
validating the model. In stepwise approach, various cases are developed by subsequently
introducing every attributes from input variable matrix. Isolated networks are trained with
the ‘training sample’ for every new case. After that there is an estimation of the
predictions of these networks for the ‘forecasting sample’. Then, performances for each
model are evaluated. Model performance can also be measured by inspecting the
dissimilarity between actual and predicted results through average percentage error,

61
coefficient of determination (R2) and root-mean-square error (RMSE). However, in this
study the last method is used to assess the effects of attributes. These measures are
compared for both PNN and ANFIS models in Table 5.2. Here, value of ‘RMSE’, the
corresponding attribute is more significant and vice versa. As an example, in case of the
model developed with ‘waiting place condition’, the prediction is most inaccurate.
Because, among all the other models, this model has the lowest RMSE value. It means,
this variable has significant control on the intercity train SQ determination. Conversely,
‘on-time performance’ is less important due to the corresponding RMSE values.
The sequences of relative significance within first ten of the SQ attributes revealed by the
models are important for SQ of intercity train. However, slight variations in the relative
importance of the attributes are found in different models. These may occur due to the
model behavior on intercity train attributes. Table 5.2 shows the ranking of the attributes
based on their effect on the SQ prediction.
Beside waiting place condition attribute physical conditions on regular days and service
features on special days are found to be the most concerning factor to the users while
deciding whether a service is satisfactory or not. As physical conditions-toilet cleanliness,
fitness of the car, air ventilation system, convenience of online ticketing system and seat
comfort are the most influential factor for users in determining SQ on regular days. As
service features-travel cost, air ventilation system, convenience of online ticketing
system, car arrangement and travel delay are the most influential factor for users in
determining SQ on special days.
Among other influencing attributes, overall security, ease of entry and exit, courtesy of
employees, female harassment, convenience of ticket purchasing at counter, noise
insulation in car, meal service, car cleanness and on-time performance. One of the
surprising findings from this research work is the on-time performance of intercity train
least influences the user’s perception of SQ. That might be the fact that, very few people
uses intercity train in their day to day life and business purposes. And they take train
service with considerable safe time on hand.

62
5.3 Attribute Ranking In this study, eighteen attributes were used to calibrate ANFIS models and PNN model
and estimate the train SQ. Since the relationship between input attributes and the overall
SQ assessment is indistinct, analytical methods were adopted to rank these SQ attributes.
Some of the statistical tools for attributes rankings are—cross-correlation, principal
component analysis (PCA) stepwise approach and connection weightage. However,
stepwise approach was followed in this study to rank the train service quality attributes.
In this approach, a single attribute from all the attributes was considered separately to
develop ANFIS and PNN network. For each case, the isolated network was trained with
the training sample whereas; forecasting sample was used to estimate the SQ. After that,
performance of each model was evaluated by checking the differences between actual
and predicted SQ using RMSE.
The orders of relative significance of the SQ attributes found in the models are essential
for assessing SQ of train. Moreover, the variations in the relative significance of those
attributes under different scenarios need to be identified. This indicates the perceptions,
needs and demands on intercity train under different scenarios. Table 5.2 shows the
ranking of the attributes based on their effect on the SQ prediction. From the Table 5.2, it
can be seen that waiting place condition is the most significant factor for both regular
days and special days. It is logical since the train schedules for the specific survey
location are not maintained properly. Passengers need to wait for a prolonged time to
board a train. Consequently, waiting place condition influences the most in their
perceived SQ. However, the RMSE value in case of special days is less compared to that
of regular days as can be found in Table 5.2. Specifically, the weightage of this attribute
is 42% more in case of special days. Besides, toilet cleanliness, fitness of car, and air
ventilation systems are also important attributes for regular days. In contrast, travel cost,
air ventilation system and convenience of online ticketing system are found to be the
important factors for special days. It indicates that attributes related to physical
conditions and service features of train are important determinants of perceived SQ for
regular days and special days, respectively.

63
The second most significant attribute is travel cost for special days. This is because a
large number of people leave city to enjoy long vacation during special occasions. It
increases travel demand by many folds. Due to the limited number of train tickets,
oftentimes, its price is hiked unofficially. People are compelled to buy tickets at a higher
price. However, the travel cost is ranked as less significant during regular days. As the
ticket price remains same, people do not mark this attribute as an important one for
regular days. Air ventilation system is noticed as third and fourth most significant
attribute for special days and regular days, respectively. Train cars become crammed,
overcrowded and large number of standing tickets are sold officially during special days.
Hence, people feel that air ventilation system is one of the important factors for train SQ
and the rank of this attribute is changed by one unit upward in special days compared to
regular days. Convenience of online ticketing system is one of the important attribute for
both regular days and special days. However, the RMSE of this attribute is much lower;
thus, ranked higher for special days compare to regular days. People wait in a long queue
to purchase tickets from train stations during special occasions. Many of them want to
avoid this hassle and emphasize on the convenience of online ticketing system. In
addition, ANFIS models for both regular days and special days show that car cleanness,
on time performance and meal services are less important due to corresponding high
RMSE values.
As mentioned earlier, in the fourth section of the questionnaire, the respondents were
asked to tick 10 most important attributes out of 18 attributes. The percentages of the
attributes ticked by most of the respondents were ranked in an ascending order for both
regular days and special days. It has been found from the analysis shown in Table 5.2 that
the ANFIS and PNN model outputs and public opinions of top most 6 attributes of
regular days and top most 4 attributes of special days were a direct match. From 7th
attributes of regular days and 5th attributes of special days, there were randomly matched.
Finally, in the last few attributes there were also random matching in the both regular
days and special days.
The above research findings match with the real world scenario quite remarkably which
indicates the novelty of the proposed ANFIS and PNN models. Note that the public

64
opinion data (obtained from fourth section of the questionnaire) are independent of the
data used for ANFIS and PNN models development (obtained from second section of the
questionnaire) and finding attributes ranking. Thus, it can be interpreted that the
respondents were very much precise in answering questions of different sections of the
designed questionnaire showing the data accuracy and validity.

65
Table 5.2 Attributes ranking comparison among ANFIS, PNN and Public Opinion under different scenarios.
Attributes
ANFIS model with regular day
dataset
PNN model with regular day
dataset
Public opinions
for regular
days
ANFIS model with special day
dataset
PNN model with Special day
dataset
Public opinions
for Special
days RMSE RANK RMSE RANK RMSE RANK RMSE RANK
Waiting place condition 1.1428 1 0.6099 1 1 0.6577 1 0.7515 1 1 Toilet cleanliness 1.1615 2 0.6880 2 2 0.6622 7 0.7757 6 7 Fitness of car 1.1633 3 0.7453 4 3 0.6699 14 0.8277 13 15 Air ventilation system 1.1752 4 0.7518 5 4 0.6594 3 0.7637 3 3 Convenience of online ticketing system 1.1793 5 0.7053 3 5 0.6603 4 0.7698 5 4 Seat comfort 1.1821 6 0.7677 6 6 0.6797 18 0.8443 16 18 Overall security 1.1831 7 0.8311 9 8 0.6729 15 0.8221 12 14 Travel delay 1.1924 8 0.8653 11 7 0.662 6 0.7817 7 5 Ease at entry and exit 1.1996 9 0.8982 7 9 0.6697 13 0.8108 11 13 Courtesy of employees 1.2003 10 0.9299 12 11 0.6623 8 0.7876 9 8 Travel cost 1.2022 11 0.9555 8 10 0.6577 2 0.7515 2 2 Female harassment 1.2041 12 1.000 10 14 0.6644 10 0.7817 8 9 Convenience of ticket purchasing at counter 1.2143 13 1.0517 14 16 0.6695 12 0.8333 14 12 Noise insulation in car 1.2299 14 1.0586 13 12 0.6625 9 0.8050 10 10 Car arrangement 1.2348 15 1.1207 15 18 0.6618 5 0.7698 4 6 Meal service 1.2385 16 1.2491 17 13 0.6669 11 0.8766 18 11 Car cleanness 1.2672 17 1.2834 18 15 0.6755 17 0.8498 17 16 On-time performance 1.4004 18 1.3743 16 17 0.6742 16 0.8333 15 17

66
5.4 Summary This chapter compared the performance of the proposed PNN model with an ANFIS,
using the intercity train data. Based on the performance of the two models and the
comparison analysis presented above, it can be concluded that the prediction of service
quality from the PNN model is better than that from ANFIS model. Also, by analyzing
the two models (PNN and ANFIS), this chapter found some most suitable attributes that
have significant impact on SQ of intercity train. The major finding from the analysis of
this chapter is the important influencing determinants of the user’s perception about
intercity train SQ besides waiting place condition, relates with physical conditions and
service features on regular days and special days, accordingly.

Chapter 6
CONCLUSION & RECOMMENDATIONS
6.1 General This research study was conducted to understand the users’ perception of intercity train in
Bangladesh. Moreover, in this research work two models were developed which can
predict the SQ of intercity train in any context using the base data. The major findings of
this study are summarized in the following sections. Recommendations and future
research scopes are stated in this chapter for further research work.
6.2 Major Findings In this study the research findings were divided into two categories, first were from
questionnaire data sets and second were based on modeling technique.
In this research work, eighteen (18) questions regarding intercity train service quality
were asked to the intercity train user in this study to know the actual condition of its
service in Bangladesh. Kamlapur Railway Station, Dhaka is one of the biggest hubs of
intercity train of Bangladesh was selected as the survey location. Passengers from around
30 intercity trains were surveyed to conduct this research. The subjective assessment was
made using a rating scale of very good, good, satisfactory, poor, and very poor.
Nowadays, a lot of people travel by intercity train. But service is not advanced according
to the expectations of the user. Therefore, the respondents were asked to give their rating
according to their travelling experience on intercity trains recently made.
There are some limitations present in the existing system and authority should improve
these limitations to keep the ridership and attract new user. From the first section which
was based on users rating, it was found that majority of the intercity train users
complained that the following factors are the main limitations of intercity train service:
1. Waiting place condition
2. Toilet cleanliness

68
3. Fitness of car
4. Air ventilation system
5. Convenience of online ticketing system
6. Seat comfort
7. Overall security
8. Travel delay
9. Ease at entry and exit
10. Travel cost
11. Female harassment
12. Convenience of ticket purchasing at counter
13. Noise insulation in car
14. Car arrangement
15. Car cleanness
16. On-time performance
Predicting service quality based on users’ perception is a non-linear process. At this
point, Artificial Intelligence (AI) can be a dependable tool in case of non-linear
relationship. So, in the second stage, this study was conducted with two main objectives:
(1) Comparison of prediction capability of ANFIS and PNN, and
(2) Evaluation of intercity train SQ attributes according to their importance. Two
of the most advanced and popular techniques of AI: ANFIS and PNN had been
implemented in this research work to predict intercity train service quality based on
selected SQ attributes.
To reach the goals, two models were developed using ANFIS and PNN structures
involving all the 18 attributes. From the results, it was found that ANFIS outperforms
PNN in SQ prediction capability with 54.10% (on regular days) and 60.20% (on special
days) accurate prediction, whereas PNN shows 50.70% (on regular days) and 57.30% (on
special days). ANFIS predicted superior to PNN in prediction cases because, ANFIS
executes neuro-fuzzy neural network algorithm, which is well classifier and accurate in
predicting heterogeneous data than PNN models.

69
Using RMSE values, most prominent attributes are ranked from 1 to 18 using the
architectures. According to both ANFIS and PNN, ‘Waiting place condition’, ‘Toilet
cleanliness’, ‘Fitness of car’, ‘Air ventilation system’, ‘Convenience of online ticketing
system’, ‘Seat comfort’, ‘overall security’, ‘Travel Delay’, ‘Ease at entry and exit’,
‘Travel cost’ are ten of the most significant attribute those influence the users’ decision
making process on regular days. And on special days, ‘Waiting place condition’, ‘Travel
cost’, ‘Air ventilation system’, ‘Convenience of online ticketing system’, ‘Car
arrangement’, and ‘Travel delay’ are the most significant attribute which influence the
users’ decision making process. To improve the service quality the authority can take a
note from this research study and start from improving the most significant attribute first,
and then concentrating on the others in the series.
6.3 Recommendations
In a Transportation system of a country, passenger train acts like an arterial system of a
body. Especially, in the country like Bangladesh with colossal population of about 166
million and high density of about 1237 persons per sq km train has extra-ordinary role to
make in the field of transportation. It is contributing a striking percent of traffic flow
during occasional festival periods. However, due to the meteoric increase in travelling
population, the existing intercity train service is incapacitating to meet the increasing
travel demand. Therefore, day by day traffic are shifting towards roadway alternative low
capacity transportation system like bus, car etc. These gradually increase traffic
congestion in highways and causing huge national. At this point, transport authorities and
policy makers need to make serious game changing decisions toward sustainable
transportation system putting commuter preferences in front.
But frustratingly, commuter preferences are hardly taken into account by decision makers
in most of the developing nation during introduction of new policies or adding
infrastructures in the existing transportation systems. There are ways, however, for
policy-makers getting closer to popular views. The stated preference approach used in
this study has shown its potential in modeling peoples’ attitudes, thus planning and
policy-making can be done from peoples’ preferences for more sustainability and
meeting the desires of the society. Service Quality (SQ) experiments also help us to

70
investigate the propensity of the commuters to change their perceptions in relation to the
SQ of the mode for regular days and special days.
The study analyzed the users’ perceptions towards the existing service of intercity train
and compared the service and preferences on their responses. This study reached two of
its goals in (1) identifying travelers’ perceptions towards the existing service of intercity
train; and (2) assessing the influence of different attributes on service quality of the
existing intercity train. This research work can be used to identify the influencing
attributes of service quality of intercity train in order to prioritization and improving
them. Moreover, in allocating development fund policy makers and practitioners will
have specific directions for both regular days and special days. Furthermore, the Study
found that besides waiting place condition, attributes related to physical conditions and
service features are important determinants of perceived SQ for regular days and special
days, respectively. Therefore, from this study, policy makers and practitioners will have
proper direction in prioritizing and improving service quality of intercity train more
effectively.
One of the significant contributions of this research work was to propose the two models
that outperformed regression analysis, multinomial logit model. Also, this study helped to
substantiate weaknesses of the existing models.
6.4 Further Research Railway is an important long distance public transportation mode. It can carry huge
number of passengers due to its ridership potentiality and reduce pressure on road
transportation. Due to increase in traffic congestion in highways, the railway service can
be sustainable solution to meet the increasing travel demand. This study provides a clear
perception about understanding and improving the overall train SQ. Specifically, it
relates user’s demand and overall train SQ. Furthermore, Physical conditions and Service
features are found the most important attributes for regular days and special days,
respectively. This result carries key information to the planners and transport
practitioners in improving railway SQ.

71
Considering the complexity in human decision making process, ANN can be a suitable
tool to model service quality of train. ANFIS and PNN are an advanced and popular
technique of this genre which was implemented to predict train SQ based on eighteen
attributes. This research focuses on evaluation of train SQ attributes according to their
importance during regular days and special days, separately. Results showed that ANFIS
models have 83.1% and 93.3% accuracy and PNN models have 99.4% and 99.5%
accuracy in training SQ dataset for regular days and special days, respectively. In
contrast, the ANFIS models showed 54.1% and 60.2% accuracy and PNN models have
50.7% and 57.3% accuracy in forecasting SQ for those days, respectively. It demonstrates
that the calibrated models execute NN algorithm into FIS, which is faster and accurate in
predicting heterogeneous data.
Although User have been studied for more than half a century in the developed world,
research on this topic in Bangladesh as well as in other south-east Asian countries is
extremely scarce and challenging. This is mainly due to the complexity of data collection
and processing and the wide variations of user population and train’s travelling facilities.
In this section some recommendations are provided for future research following the
studies carried out in this dissertation. These are listed below.
1. The data set used in this research work represents the intercity train user group
of intercity train hub Kamlapur rail station of Dhaka city, capital of
Bangladesh. Although the sample size in this research work is sufficient, a
further research can be done with a larger data set which will more
confidently represent the intercity train users. Researches targeting particular
user groups (i.e. female, student, senior citizens, people with lower monthly
income etc.) may lead to other significant findings which will provide
valuable insight into the Intercity train SQ.
2. Particular attention could be given in future to overcome the limitations of this
research work. These limitations include,
a) Lack of information about the income variables for the respondents,
72
b) Lack of information about infrastructure parameters such as track
quality, signaling system, safety features and correlation among these
variables.
3. Two models have been checked for finding SQ of Intercity train, so for better
results others modeling technique such as Structured Equation Modeling
(SEM) and SERVQUAL method may be compared in predicting SQ of this
service.
4. The prediction capabilities of ANFIS and PNN found in this research work are
expected to encourage practitioners around the world to apply these tools for
SQ studies of other PT systems (intercity bus, train, ferries etc.)

REFERENCES
Agunloye, O.O., Oduwaye, L. (2011). Factors influencing the quality of rail transport services in metropolitan Lagos. Journal of Geography and Regional Planning, 4(2), pp. 98–103, Article No: 779512540778
Andrade, K., Uchida, K., Kagaya, S. (2006). Development of transport mode choice model by using adaptive neuro-fuzzy inference system. Transportation Research Record, pp. 8-16, doi: 10.3141/1977-04
Andaleeb, S.S., Haq, M., and Ahmed, R. I. (2007). Reforming inner-city bus transportation in a developing country: a passenger-driven Model. Journal of Public Transportation, Vol. 10, no. 1, pp. 1-25, doi: 10.5038/2375-0901.10.1.1
Aydin, N., Celik, E., Gumus, A. T. (2015). A hierarchical customer satisfaction framework for evaluating rail transit systems of Istanbul. Transportation Research Part A, 77, pp. 61-81, doi: 10.1016/j.tra.2015.03.029
Bao-ping, C., and Zeng-Qiang, M. (2009). Short-term traffic flow prediction based on ANFIS. In International Conference on Communication Software and Networks (ICCSN), pp. 791-793, doi: 10.1109/ICCSN.2009.140
Basser, H., Shamshirband, S., Karami, H., Petković, D., Akib, S., and Jahangirzadeh, A. (2014). Adaptive neuro-fuzzy selection of the optimal parameters of protective spur dike. Natural Hazards, Vol. 73, no.3, pp. 1393-1404, doi: 10.1007/s11069-014-1140-5
Brady, M.K. and Cronin Jr, J.J. (2001). Some new thoughts on conceptualizing perceived service quality: a hierarchical approach. Journal of marketing, 65(3), pp. 34-49, doi: 10.1509/jmkg.65.3.34.18334
Brons, M., Givoni, M., Rietveld, P. (2009). Access to railway stations and its potential in increasing rail use. Transportation Research Part A, 43, pp.136–149, doi: 10.1016/j.tra.2008.08.002
Gronroos, C. (1984). A service quality model and its marketing implications. European Journal of Marketing, 4, pp. 36-44, doi: 10.1108/EUM0000000004784

Cantwell M., Caulfield B., O’Mahony M. (2009). Examining the factors that impact public transport commuting satisfaction. Journal of Public Transportation, 12(2), pp. 1–21,doi:10.5038/2375-0901.12.2.1
Cavana R.Y., Corbett L.M., Lo Y.L. (2007). Developing zones of tolerance for managing passenger rail service quality. International Journal of Quality and Reliability Management, 24(1), pp. 7–31, doi: 10.1108/02656710710720303
Cervero, R. (1998). Induced travel demand: Research design, empirical evidence, and normative policies. Journal of Planning Literature, Vol. 17, no. 1, pp. 3-20, doi: 10.1177/088122017001001
Chou, J.S., Kim, C., Kuo, Y.C. and Ou, N.C. (2011). Deploying effective service strategy in the operations stage of high-speed rail. Transportation Research Part E: Logistics and Transportation Review, 47(4), pp. 507-519. doi: 10.1016/j.tre.2010.12.004
Chou, P.F., Lu, C.S., Chang, Y.H. (2014). Effects of service quality and customer satisfaction on customer loyalty in high-speed rail services in Taiwan. Transportmetrica A: Transport Science, 10(10), pp. 917-945. doi: 10.1080/23249935.2014.915247
Cullinane, S. (2000). The Relationship between Car Ownership and Public Transport Provision: A Case Study of Hong Kong. Transport Policy, Vol. 9, no. 1, pp. 29-39. doi: 10.1016/S0967-070X(01)00028-2
De Oña R., Eboli. L.,Mazzula, G. (2014). Key factors affecting rail service quality in the Northern Italy: a decision tree approach. Transport, 29(1), pp. 75-83. doi: 10.3846/16484142.2014.898216
DeOña, J., de Oña, R., Eboli, L., and Mazzulla, G. (2013). Perceived service quality in bus transit service: a structural equation approach. Transport Policy, Vol. 29, pp. 219-226. doi: 10.1016/j.tranpol.2013.07.001
Dell’Olio, L., Ibeas, A., Cecin. P. (2010). Modelling user perception of bus transit quality. Transport Policy, Vol. (17), 388–397. doi: 10.1016/j.tranpol.2010.04.006
Dell'Olio, L., Ibeas, A., and Cecin, P. (2011). The Quality of Service desired by Public Transport Users. Transport Policy, Vol. 18, no. 1, pp. 217-227. doi:10.1016/j.tranpol.2010.08.005
75
DeOña, J., de Oña, R., and Calvo, F.J. (2012). A classification tree approach to identify key factors of transit service quality. Expert Systems with Applications, Vol. 39, no. 12, pp. 11164-11171. doi: 10.1016/j.eswa.2012.03.037
DLLAJ (Traffic and Road Transport Agency). West Java, Bandung (2001). The Guide of Passenger Public Transportation Price Calculation with Fixed Routes in Urban Areas.
Dutta, U. (1985). Development of a Bus Maintenance Planning Model1, Ph.D. Dissertation, School of Civil and Environmental Science, Univ. of Oklahoma, USA.
Eboli, L., and Muzzula, G. (2007). Service Quality Attributes Affecting Customer Satisfaction for Bus Transit. Journal of Public Transportation, Vol. 10, no. 3, pp. 21-34. doi: 10.5038/2375-0901.10.3.2
Eboli, L., and Mazzulla, G. (2009). A new customer satisfaction index for evaluating transit service quality. Journal of Public Transportation, Vol. 12, no. 3, pp. 21 – 37. doi: 10.5038/2375-0901.12.3.2
Eboli, L., Mazzulla, G. (2011). A methodology for evaluating transit service quality based on subjective and objective measures from the passenger’s point of view. Transport Policy, Vol. (18), 172–181. doi: 10.1016/j.tranpol.2010.07.007
Friman, M., and Gärling, T. (2001). Satisfaction with public transport related to service performance. Travel Behavior Research, The Leading Edge, ed. D. Hensher. International Association for Travel Behavior Research. Oxford: Pergamon, Elsevier Science, Ltd., pp. 845. ORCID ID: 0000-0002-7475-680X
Fu, L. and Xin, Y. (2007). A new performance index for evaluating transit quality of service. Journal of public transportation, 10(3), pp. 47-69. doi: 10.5038/2375-0901.10.3.4
Gan, C., Limsombunchai, V., and Weng, M. A. (2005). Consumer choice prediction: Artificial neural networks versus logistic models. Lincoln University. Commerce Division. Chicago. Research Archive: 10182/329
Geetika S.N. (2010). Determinants of customer satisfaction on service quality: A study of railway platforms in India. Journal of Public Transportation, 13(1), pp. 97–113. doi: 10.5038/2375-0901.13.1.6

76
Gleave, S.D. (2000). Rail passenger quality of service valuation. Indian Journal of Service Management, 8(2), pp. 107-111.
Hensher, D.A., and Brewer, (2001). A.M. Transport: An Economics and Management Perspective. Oxford University Press, New York. ISBN: 9780198776413
Hensher, D.A., Prioni, P. (2002). A Service Quality Index for Area-wide Contract Performance Assessment. Journal of Transport Economics and Policy, Vol. (36), Part 1, 93-113. ISSN: 0022-5258
Hosseinpour, M., Yahaya, A. S., Ghadiri, S. M., and Prasetijo,J. (2013). Application of Adaptive Neuro-fuzzy Inference System for road accident prediction. KSCE Journal of Civil Engineering, Vol. 17, no.7, pp. 1761-1772. doi: 10.1007/s12205-013-0036-3
Hu, K. C., and Jen, W. (2006). Passengers’ perceived service quality of city buses in Taipei: scale development and measurement. Transport Reviews, 26(5), pp. 645-662. doi: 10.1080/01441640600679482
Irfan S.M., Kee D.M.H., Shahbaz S. (2012). Service quality and rail transport in pakistan: a passenger perspective. World Applied Sciences Journal, 18(3), pp. 361–369. doi: 10.1.1.389.5152
Islam, M.R., Hadiuzzaman, M., Banik, R., Hasnat, M.M., Musabbir, S.R., and Hossain, S. (2016a). Bus service quality prediction and attribute ranking: a neural network approach. Public Transport, 8(2), pp. 295-313. doi: 10.1007/s12469-016-0124-0
Islam, M.R., Musabbir, S. R., Ahmed, I., Hadiuzzaman, M., Hasnat, M. M., and Hossain, S. (2016b). Bus service quality prediction and attribute ranking using probabilistic neural network and adaptive neuro fuzzy inference system. Canadian Journal of Civil Engineering, 43(9), pp. 822-829. doi: 10.1139/cjce-2016-0119
Jang, J. S. R. (1993). ANFIS: adaptive-network-based fuzzy inference system. IEEE Transactions on Man and Cybernetics, 23(3), pp. 665–685.
Joewono, T.B., and Kuboota H (2005). The Characteristics of Paratransit and Non-Motorized transport in Bandung, Indonesia. Journal of the Eastern Asia Society for Transportation Studies, Vol. 6, pp. 262 – 277. doi:

77
Kadiyali, L.R. (2008). Traffic Engineering and Transport Planning, 7th edn. Second Reprint Khanna Publishers, NaiSarak, Delhi.
Kaltheier, R. M. (2002). Urban transport and poverty in developing countries. Analysis and options for transport policy and planning. Division 44 Environmental Management, Water, Energy, Transport. Deutsche Gesellschaftfür Technische Zusammenarbeit (GTZ) GmbH. Eschborn.
Karatepe, O.M., Yavas, U. and Babakus, E. (2005). Measuring service quality of banks: Scale development and validation. Journal of Retailing and Consumer Services, 12(5), pp. 373-383. doi: 10.1016/j.jretconser.2005.01.001
Kasabov NK. (1996). Foundations of Neural networks, Fuzzy Systems, and Knowledge Engineering. Marcel Alencar. MIT Press.
Khodayari, A., Ghaffari, A., Kazemi, R., and Manavizadeh,N. (2010). ANFIS based modeling and prediction car following behavior in real traffic flow based on instantaneous reaction delay. In 13th International IEEE Conference on Intelligent Transportation Systems (ITSC), pp. 599-604. doi: 10.1109/ITSC.2010.5625130
Kim, N., Lee, C., Kim, J., and Kwon, Y. (2005). Critical measures of transit service quality in various city types. Proceedings of Eastern Asia Society for Transportation Studies, Vol. 5, pp. 414–427.
Koushki, P. A., Al-Saleh, O. I., and Al-Lumaia, M. (2003). On management’s awareness of transit passenger needs. Transport Policy, Vol. 10, no. 1, pp. 17–26. doi: 10.1016/S0967-070X(02)00025-2
Lai, W.T., Chen, C.F. (2010). Behavioural intentions of public transit passengers - The roles of service quality, perceived value, satisfaction and involvement, Transport Policy, Vol. (18), Issue 2, 318-325. doi: 10.1016/j.tranpol.2010.09.003
Lewis, H.W. (1997). The foundations of fuzzy control. Plenum Press, New York.
Lyndon, H., and Todd, A. L. (2006). Evaluating New Start Transit Program Performance: Comparing Rail and Bus, Victoria Transport Policy Institute, Canada.

78
Mucsi, K., Khan, A.M. and Ahmadi, M. (2011). An Adaptive Neuro-Fuzzy Inference System for estimating the number of vehicles for queue management at signalized intersections. Transportation Research Part C: Emerging Technologies, 19(6), pp. 1033-1047. doi: 10.1016/j.trc.2011.05.016
Mussa, R., Kwigizile, V., and Selekwa,M. (2006). Probabilistic neural networks application for vehicle classification. Journal of transportation engineering, Vol. 132, no. 4, pp. 293-302. doi: 10.1061/(ASCE)0733-947X(2006)132:4(293)
Nathanail, E. (2008). Measuring the quality of service for passengers on the Hellenic Railways. Transportation Research Part A, 42, pp. 48–66. doi: 10.1016/j.tra.2007.06.006
National Research Council (US) (2012). Artificial Intelligence Applications of Critical Transportation Issues. Transportation Research Board, Artificial Intelligence and Advanced Computing Committee.
NCHRP- National Cooperative highway Research Program (2008). Multimodal Level of Service Analysis for Urban Streets. Report No. 616, pp. 72-81.
Niu S., and Liu, H. (2011). Probabilistic neural networks for the identification of traffic state. Proceedings of 14th International IEEE Conference on Intelligent Transportation Systems (ITSC), Washington DC, USA, pp. 754-759.
Pandit, D., and Das, S. (2013). A framework for determining commuter preference along a proposed bus rapid transit corridor. Procedia-Social and Behavioral Sciences, Vol. 104, pp. 894-903. doi: 10.1016/j.sbspro.2013.11.184
Parasuraman, A., Zeithaml, V., Berry, L. (1985). A conceptual model of service quality and its implications for the future research. Journal of Marketing, 49, pp. 41–50. doi: 10.2307/1251430
Parasuraman, A., V.A. Zeithaml, and L.L.Berry. (1988). RAILQUAL: A multiple-item scale for measuring consumer perceptions of service quality. Journal of Retailing, 64, pp.12-40. doi: 10.1107/S0567740878008559
Park, B. (2002). Hybrid neuro-fuzzy application in short-term freeway traffic volume forecasting. Transportation Research Record, 1802, pp. 190-196. doi: 10.3141/1802-21
Passino, K.M., Yurkovich, S. (1998). Fuzzy Control. Addison Wesley Longman Inc.

79
Pham, K. V., and Simpson, M. (2006). The impact of frequency of use on service quality expectations an empirical study of Trans-Atlantic airline passengers. The Journal of the American Academy of Business, 10(1), pp.1-6.
Parzen, E. (1962). Estimation of a Probability Density Function and Mode. Annals of Mathematical Statistics, Vol. 33, no. 3, pp. 1065-1076.
Prasad M.D., Shekhar B.R. (2010). Impact of Service Quality Management (SQM) practices on Indian railways—A study of South Central Railways. International Journal of Business and Management, 5(9), pp. 139–146.
Pérez, S.M., Carlos Gázquez Abad, J., MaríaMarín Carrillo, G., and Sánchez Fernández, R. (2007). Effects of service quality dimensions on behavioural purchase intentions: A study in public-sector transport. Managing Service Quality: An International Journal, 17(2), pp. 134-151. doi: 10.1108/09604520710735164
Přibyl, O., and Goulias, K. (2003a). Application of adaptive neuro-fuzzy inference system to analysis of travel behavior. Transportation Research Record: Journal of the Transportation Research Board, No. 1854, Transportation Research Board of the National Academies, Washington, D.C., pp. 180-188. doi: 10.3141/1854-20
Pribyl, A., Goulias K.G. (2003b). Application of Adaptive Neuro-Fuzzy Inference System to Analysis of travel behaviour. Transportation Research Record, 1854, pp.180-188. doi: 10.3141/1854-20
Rahman, F., Das, T., and Hadiuzzaman, M. (2015). Perceived Service Quality of Paratransit in Developing Countries: A Structural Equation Approach. Journal of Transportation Science, pp. 1: 211-219. doi: 10.1016/j.tra.2016.08.008
Shimazaki,T.A.,and Rahman, M.M. (2002). Physical characteristics of paratransit in developing country of Asia, Department of Civil Engineering, College of Science and Technology, Nihon University,1-8, Kanda Surugadai, Chiyodaku, Tokyo, Japan.
Shiftan, Y., and Sharaby, N. (2012). The impact of fare integration on travel behavior and transit ridership. Transport Policy, pp. 63-70. doi: 10.1016/j.tranpol.2012.01.015

80
Simona, S. (2010). Quality of public transportation services in urban area of Oradea. Annals of Faculty of Economics, Vol. 1, no. 2, pp. 469-474. BUET Research Achieve Keyword: AN MFS: 65287303
Specht, D. F. (1990). Probabilistic Neural Networks and the Polynomial Adaline as Complementary Techniques for Classification. IEEE Transactions on Neural Networks, Vol. 1, no.1, pp 111-121. doi: 10.1109/72.80210
Stein, (1978). D. M. Scheduling Dial-A-Ride Transportation Systems. Transportation Science, Vol. 12, No. 3, pp. 232-249. doi: 10.1287/trsc.12.3.232
Sugeno, M., (1985). Industrial applications of fuzzy control, Elsevier Science Pub. Co.
Teodorovic, D., Vukadinovic, K. (1998). Traffic control and transport planning: A fuzzy sets and neural networks approach. Springer Science & Business Media, 13. doi: 10.1007/978-94-011-4403-2
Transportation Research Board (TRB) (1990). A handbook for measuring customer satisfaction and service quality, TRCP Report 47, Library of Congress, Catalog No. 99-71030. doi: 10.1108/08876040210433248
TRB- Transport Research Board (2010). Highway Capacity manual (HCM). Transport Research Board, National Research Council, Washington D. C. USA.
Tyrinopoulos, Y., Antoniou, C. (2008). Public transit user satisfaction: Variability and policy implications, Transport Policy, Vol. (15), 260–272. doi: 10.1016/j.tranpol.2008.06.002
Wardman, M. (2004). Public transport values of time. Transport policy, 11(4), pp. 363-377. doi: 10.1016/j.tranpol.2004.05.001
Yen, J., Langari, R. (1999). Fuzzy Logic, Intelligence, Control, and Information. Prentice Hall, pp. 68.
Zhao, D., Shao, C., Li. Jaun, C., and Liu, Y. (2010). Travel Mode Choice Modeling Based on Improved Probabilistic Neural Network. In Traffic and Transportation Studies, ASCE, pp. 685-695. doi: 10.1061/41123(383)65

Appendix A
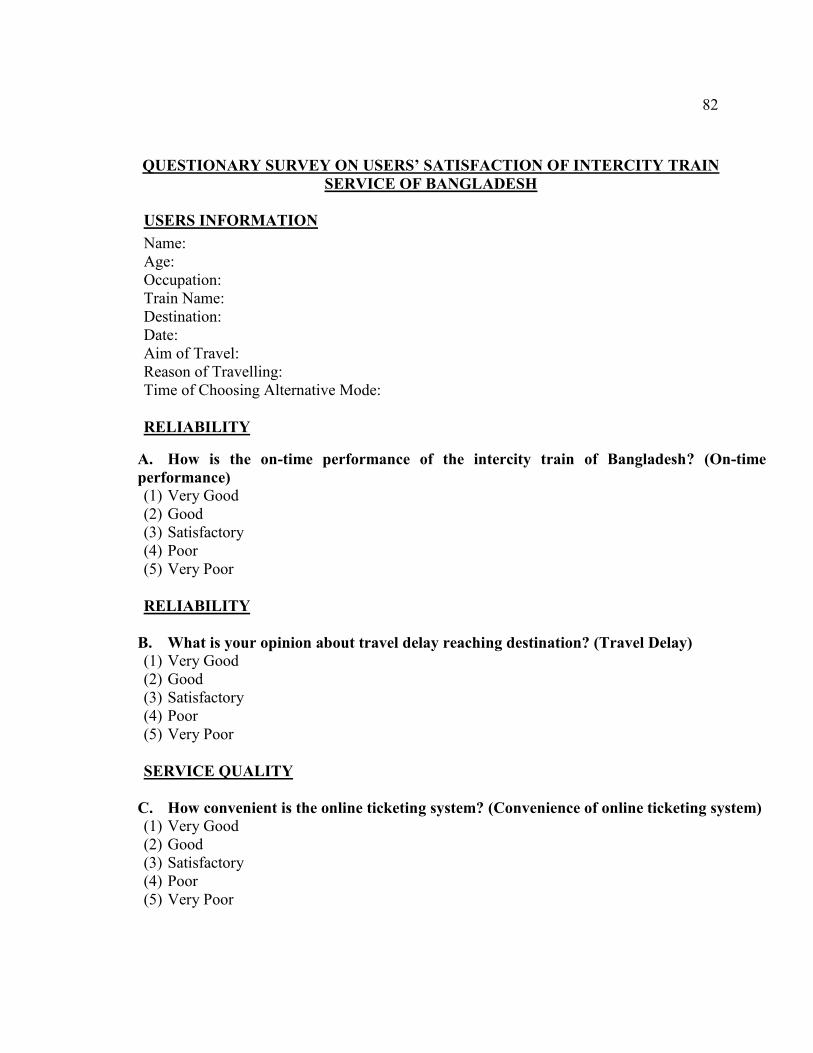
82
QUESTIONARY SURVEY ON USERS’ SATISFACTION OF INTERCITY TRAIN SERVICE OF BANGLADESH
USERS INFORMATION
Name: Age: Occupation: Train Name: Destination: Date: Aim of Travel: Reason of Travelling: Time of Choosing Alternative Mode: RELIABILITY
A. How is the on-time performance of the intercity train of Bangladesh? (On-time performance) (1) Very Good (2) Good (3) Satisfactory (4) Poor (5) Very Poor
RELIABILITY
B. What is your opinion about travel delay reaching destination? (Travel Delay) (1) Very Good (2) Good (3) Satisfactory (4) Poor (5) Very Poor SERVICE QUALITY
C. How convenient is the online ticketing system? (Convenience of online ticketing system) (1) Very Good (2) Good (3) Satisfactory (4) Poor (5) Very Poor

83
SERVICE QUALITY
D. How convenient it is to purchase ticket at counter? (Convenience of ticket purchasing at counter) (1) Very Good (2) Good (3) Satisfactory (4) Poor (5) Very Poor
ECONOMY
E. What is your idea about travelling cost of intercity train? (Travel cost) (1) Very Good (2) Good (3) Satisfactory (4) Poor (5) Very Poor
SERVICE QUALITY
F. What is your opinion about intercity train’s car arrangement? (Car arrangement) (1) Very Good (2) Good (3) Satisfactory (4) Poor (5) Very Poor
QUALITY OF TRANSPORT
G. How comfortable is the seat of the intercity train? (Seat comfort) (1) Very Good (2) Good (3) Satisfactory (4) Poor (5) Very Poor
QUALITY OF TRANSPORT
H. What is your opinion about ease of entry-exit in intercity train? (Ease at entry and exit) (1) Very Good

84
(2) Good (3) Satisfactory (4) Poor (5) Very Poor
SERVICE QUALITY
I. What is your opinion about overall security in intercity train? (Overall security) (1) Very Good (2) Good (3) Satisfactory (4) Poor (5) Very Poor
QUALITY OF TRANSPORT
J. What is your opinion about air ventilation system of intercity train of Bangladesh? (Air ventilation system) (1) Very Good (2) Good (3) Satisfactory (4) Poor (5) Very Poor
SERVICE QUALITY
K. What do you think about waiting place condition of intercity train service of Bangladesh? (Waiting place condition) (1) Very Good (2) Good (3) Satisfactory (4) Poor (5) Very Poor
SERVICE QUALITY
L. What is your idea about meal service of intercity train of Bangladesh? (Meal service) (1) Very Good (2) Good (3) Satisfactory (4) Poor (5) Very Poor

85
QUALITY OF TRANSPORT
M. What is your comment about toilet cleanliness of intercity train of Bangladesh? (Toilet cleanliness) (1) Very Good (2) Good (3) Satisfactory (4) Poor (5) Very Poor
SAFETY & SECURITY
N. In your point of view, what is the condition of Security for female (harassment) in intercity train service of Bangladesh? (Female harassment) (1) Very Good (2) Good (3) Satisfactory (4) Poor (5) Very Poor
SERVICE QUALITY
O. What is your opinion about courtesy of employees of intercity train? (Courtesy of employees) (1) Very Good (2) Good (3) Satisfactory (4) Poor (5) Very Poor
QUALITY OF TRANSPORT
P. What is your idea about fitness of the car of intercity train? (Fitness of car) (1) Very Good (2) Good (3) Satisfactory (4) Poor (5) Very Poor QUALITY OF TRANSPORT
Q. What do you think about car cleanness of intercity train? (Car cleanness) (1) Very Good

86
(2) Good (3) Satisfactory (4) Poor (5) Very Poor
QUALITY OF TRANSPORT
R. What is your opinion about noise insulation in the car of intercity trains? (Noise insulation in car) (1) Very Good (2) Good (3) Satisfactory (4) Poor (5) Very Poor
S. What rating point will you give as Overall Service Quality of the Train you have traveled recently? (Overall Service Quality) (1) Very Good (2) Good (3) Satisfactory (4) Poor (5) Very Poor

87
Rank 15 most important features of Service Quality you will mention from the train journey you have experienced recently from table below.
Serial No Rank
01 On-time performance 1 2 3 4 5 6 7 8 9 10 11 12 13 14 15
02 Travel Delay 1 2 3 4 5 6 7 8 9 10 11 12 13 14 15
03 Convenience of online ticketing system
1 2 3 4 5 6 7 8 9 10 11 12 13 14 15
04 Convenience of ticket purchasing at counter
1 2 3 4 5 6 7 8 9 10 11 12 13 14 15
05 Travel cost 1 2 3 4 5 6 7 8 9 10 11 12 13 14 15
06 Car arrangement 1 2 3 4 5 6 7 8 9 10 11 12 13 14 15
07 Seat comfort 1 2 3 4 5 6 7 8 9 10 11 12 13 14 15
08 Ease at entry and exit 1 2 3 4 5 6 7 8 9 10 11 12 13 14 15
09 Overall security 1 2 3 4 5 6 7 8 9 10 11 12 13 14 15
10 Air ventilation system 1 2 3 4 5 6 7 8 9 10 11 12 13 14 15
11 Waiting place condition 1 2 3 4 5 6 7 8 9 10 11 12 13 14 15
12 Meal service 1 2 3 4 5 6 7 8 9 10 11 12 13 14 15
13 Toilet cleanliness 1 2 3 4 5 6 7 8 9 10 11 12 13 14 15
14 Female harassment 1 2 3 4 5 6 7 8 9 10 11 12 13 14 15
15 Courtesy of employees 1 2 3 4 5 6 7 8 9 10 11 12 13 14 15
16 Fitness of car 1 2 3 4 5 6 7 8 9 10 11 12 13 14 15
17 Car cleanness 1 2 3 4 5 6 7 8 9 10 11 12 13 14 15
18 Noise insulation in car 1 2 3 4 5 6 7 8 9 10 11 12 13 14 15

Appendix B

89
Probabilistic Neural Network (PNN) Matlab Coding
load NSQTr.prn; load NSQTs.prn;
SQ1 = NSQTr';SQ2 = NSQTs'; Y1 = ind2vec (SQ1);Y2 = ind2vec (SQ2);
load N18NAttDTr.prn;load N18NAttDTs.prn; load N17NAttDTr.prn;load N17NAttDTs.prn; load N16NAttDTr.prn;load N16NAttDTs.prn; load N15NAttDTr.prn;load N15NAttDTs.prn; load N14NAttDTr.prn;load N14NAttDTs.prn; load N13NAttDTr.prn;load N13NAttDTs.prn; load N12NAttDTr.prn;load N12NAttDTs.prn; load N11NAttDTr.prn;load N11NAttDTs.prn; load N10NAttDTr.prn;load N10NAttDTs.prn; load N09NAttDTr.prn;load N09NAttDTs.prn; load N08NAttDTr.prn;load N08NAttDTs.prn; load N07NAttDTr.prn;load N07NAttDTs.prn; load N06NAttDTr.prn;load N06NAttDTs.prn; load N05NAttDTr.prn;load N05NAttDTs.prn; load N04NAttDTr.prn;load N04NAttDTs.prn; load N03NAttDTr.prn;load N03NAttDTs.prn; load N02NAttDTr.prn;load N02NAttDTs.prn; load N01NAttDTr.prn;load N01NAttDTs.prn;
P18 = N18NAttDTr';T18 = N18NAttDTs'; P17 = N17NAttDTr';T17 = N17NAttDTs'; P16 = N16NAttDTr';T16 = N16NAttDTs'; P15 = N15NAttDTr';T15 = N15NAttDTs'; P14 = N14NAttDTr';T14 = N14NAttDTs'; P13 = N13NAttDTr';T13 = N13NAttDTs'; P12 = N12NAttDTr';T12 = N12NAttDTs'; P11 = N11NAttDTr';T11 = N11NAttDTs'; P10 = N10NAttDTr';T10 = N10NAttDTs'; P09 = N09NAttDTr';T09 = N09NAttDTs'; P08 = N08NAttDTr';T08 = N08NAttDTs'; P07 = N07NAttDTr';T07 = N07NAttDTs'; P06 = N06NAttDTr';T06 = N06NAttDTs'; P05 = N05NAttDTr';T05 = N05NAttDTs'; P04 = N04NAttDTr';T04 = N04NAttDTs'; P03 = N03NAttDTr';T03 = N03NAttDTs'; P02 = N02NAttDTr';T02 = N02NAttDTs'; P01 = N01NAttDTr';T01 = N01NAttDTs';
NN18 = newpnn(P18,Y1);O18 = sim(NN18,T18); NN17 = newpnn(P17,Y1);O17 = sim(NN17,T17); NN16 = newpnn(P16,Y1);O16 = sim(NN16,T16); NN15 = newpnn(P15,Y1);O15 = sim(NN15,T15); NN14 = newpnn(P14,Y1);O14 = sim(NN14,T14); NN13 = newpnn(P13,Y1);O13 = sim(NN13,T13);

90
NN12 = newpnn(P12,Y1);O12 = sim(NN12,T12); NN11 = newpnn(P11,Y1);O11 = sim(NN11,T11); NN10 = newpnn(P10,Y1);O10 = sim(NN10,T10); NN09 = newpnn(P09,Y1);O09 = sim(NN09,T09); NN08 = newpnn(P08,Y1);O08 = sim(NN08,T08); NN07 = newpnn(P07,Y1);O07 = sim(NN07,T07); NN06 = newpnn(P06,Y1);O06 = sim(NN06,T06); NN05 = newpnn(P05,Y1);O05 = sim(NN05,T05); NN04 = newpnn(P04,Y1);O04 = sim(NN04,T04); NN03 = newpnn(P03,Y1);O03 = sim(NN03,T03); NN02 = newpnn(P02,Y1);O02 = sim(NN02,T02); NN01 = newpnn(P01,Y1);O01 = sim(NN01,T01);
OI18 = (vec2ind (O18))'; OI17 = (vec2ind (O17))'; OI16 = (vec2ind (O16))'; OI15 = (vec2ind (O15))'; OI14 = (vec2ind (O14))'; OI13 = (vec2ind (O13))'; OI12 = (vec2ind (O12))'; OI11 = (vec2ind (O11))'; OI10 = (vec2ind (O10))'; OI09 = (vec2ind (O09))'; OI08 = (vec2ind (O08))'; OI07 = (vec2ind (O07))'; OI06 = (vec2ind (O06))'; OI05 = (vec2ind (O05))'; OI04 = (vec2ind (O04))'; OI03 = (vec2ind (O03))'; OI02 = (vec2ind (O02))'; OI01 = (vec2ind (O01))';

Appendix C

92
Adaptive Neuro-fuzzy Inference System (ANFIS) Coding
tic; initime = cputime; time1 = clock; pause (1.0);
load EidTrain; load EidTest; load EidTarget; load RegularTrain; load RegularTest; load RegularTarget;
EidTestFull=[EidTest,EidTarget]; RegularTestFull=[RegularTest,RegularTarget];
EidTrainAttr=EidTrain(1:end,1:18); EidTrainSQ=EidTrain(1:end,19);
tD=EidTrainAttr'; tS=EidTrainSQ;
EidTestAttr=EidTest; EidTestSQ=EidTarget;
cD=EidTestAttr; cS=EidTestSQ;
trndata=[tS,tS]; chkdata=[cD,cS];
%fismat_1=genfis1(data,numMFs,inmftypes,outmftype); %fismat_1=genfis3(Xin,Xout,type,cluster_n,fcmoptions);
fismat_1=genfis1(trndata,181,'psigmf','linear') %fismat_3=genfis3(tD,tS,'mamdani',3)
elapsed = toc;
fintime = cputime; time2 = clock;
fprintf('TIC TOC: %g\n', elapsed); fprintf('CPUtime: %g\n', fintime - initime); fprintf('Clock: %g\n', etime(time2,time1));

93
Fuzzy Logic Toolbox
Version 2.2.19 (R2014a) 27-Dec-2013
GUI editors
anfisedit - ANFIS training and testing UI tool.
findcluster - Clustering UI tool.
fuzzy - Basic FIS editor.
mfedit - Membership function editor.
ruleedit - Rule editor and parser.
ruleview - Rule viewer and fuzzy inference diagram.
surfview - Output surface viewer.
Membership functions
dsigmf - Difference of two sigmoid membership functions.
gauss2mf - Two-sided Gaussian curve membership function.
gaussmf - Gaussian curve membership function.
gbellmf - Generalized bell curve membership function.
pimf - Pi-shaped curve membership function.
psigmf - Product of two sigmoid membership functions.
smf - S-shaped curve membership function.
sigmf - Sigmoid curve membership function.
trapmf - Trapezoidal membership function.
trimf - Triangular membership function.
zmf - Z-shaped curve membership function.
Command line FIS functions
addmf - Add membership function to FIS
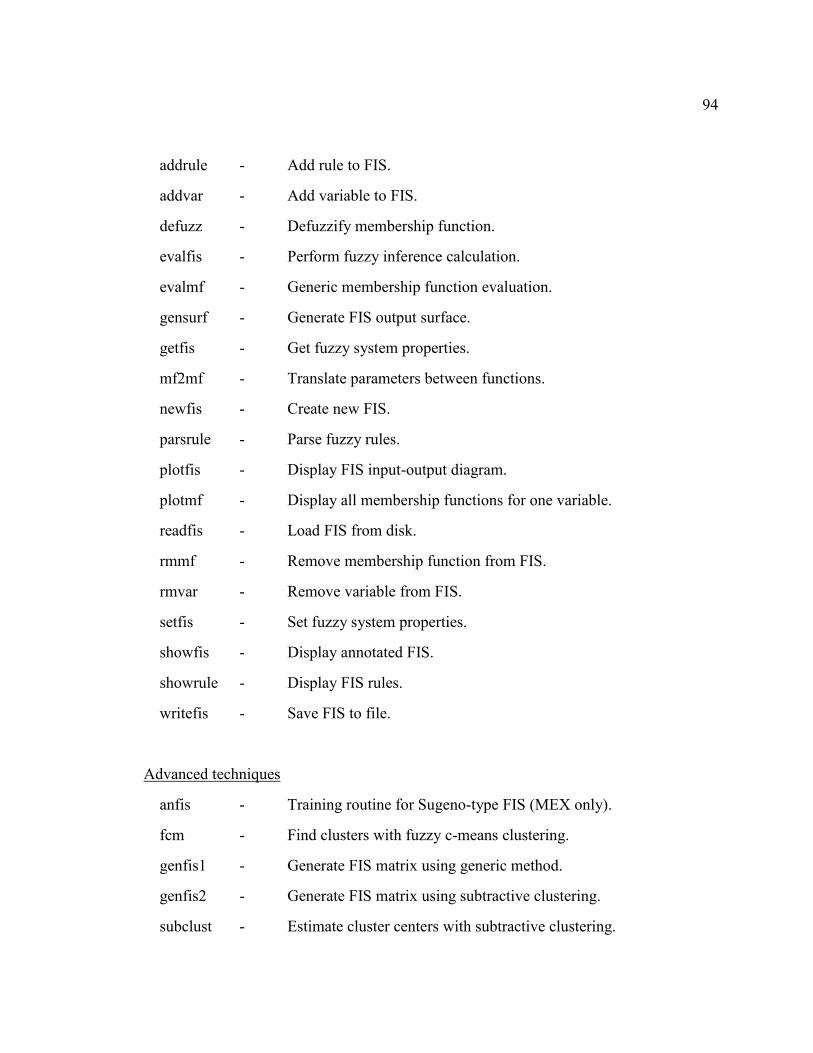
94
addrule - Add rule to FIS.
addvar - Add variable to FIS.
defuzz - Defuzzify membership function.
evalfis - Perform fuzzy inference calculation.
evalmf - Generic membership function evaluation.
gensurf - Generate FIS output surface.
getfis - Get fuzzy system properties.
mf2mf - Translate parameters between functions.
newfis - Create new FIS.
parsrule - Parse fuzzy rules.
plotfis - Display FIS input-output diagram.
plotmf - Display all membership functions for one variable.
readfis - Load FIS from disk.
rmmf - Remove membership function from FIS.
rmvar - Remove variable from FIS.
setfis - Set fuzzy system properties.
showfis - Display annotated FIS.
showrule - Display FIS rules.
writefis - Save FIS to file.
Advanced techniques
anfis - Training routine for Sugeno-type FIS (MEX only).
fcm - Find clusters with fuzzy c-means clustering.
genfis1 - Generate FIS matrix using generic method.
genfis2 - Generate FIS matrix using subtractive clustering.
subclust - Estimate cluster centers with subtractive clustering.

95
Miscellaneous functions
convertfis - Convert v1.0 fuzzy matrix to v2.0 fuzzy structure.
discfis - Discretize a fuzzy inference system.
evalmmf - For multiple membership functions evaluation.
fstrvcat - Concatenate matrices of varying size.
fuzarith - Fuzzy arithmatic function.
findrow - Find the rows of a matrix that match the input string.
genparam - Generates initial premise parameters for ANFIS learning.
probor - Probabilistic OR.
sugmax - Maximum output range for a Sugeno system.
GUI helper files
cmfdlg - Add customized membership function dialog.
cmthdlg - Add customized inference method dialog.
fisgui - Generic GUI handling for the Fuzzy Logic Toolbox
gfmfdlg - Generate fis using grid partition method dialog.
mfdlg - Add membership function dialog.
mfdrag - Drag membership functions using mouse.
popundo - Pull the last change off the undo stack.
pushundo - Push the current FIS data onto the undo stack.
savedlg - Save before closing dialog.
statmsg - Display messages in a status field.
updtfis - Update Fuzzy Logic Toolbox GUI tools.
wsdlg - Open from/save to workspace dialog.

96
ANFIS Matlab 2014a Graphics User’s Interface (GUI)

97
Genfis1 Coding
function fis = genfis1(data, numMFs, inmftype, outmftype) %GENFIS1 Generates an initial Sugeno-type FIS for ANFIS training using
a grid % partition. % % FIS = GENFIS1(DATA) generates a single-output Sugeno-type fuzzy
inference % system (FIS) using a grid partition on the data (no clustering).
FIS is % used to provide initial conditions for ANFIS training. DATA is a
matrix with % N+1 columns where the first N columns contain data for each FIS
input, and % the last column contains the output data. By default, GENFIS1 uses
two % 'gbellmf' type membership functions for each input. Each rule
generated by % GENFIS1 has one output membership function, which is of type
'linear' by % default. % % FIS = GENFIS1(DATA, NUMMFS, INPUTMF, OUTPUTMF) explicitly
specifies: % * NUMMFS number of membership functions per input. A scalar
value, % specifies the same number for all inputs and a vector
value % specifies the number for each input individually. % * INPUTMF type of membership function for each input. A single
string % specifies the same type for all inputs, a string array % specifies the type for each input individually. % * OUTPUTMF output membership function type, either 'linear' or
'constant' % % Example % data = [rand(10,1) 10*rand(10,1)-5 rand(10,1)]; % fis = genfis1(data,[3 7],char('pimf','trimf')); % [x,mf] = plotmf(fis,'input',1); % subplot(2,1,1), plot(x,mf); % xlabel('input 1 (pimf)'); % [x,mf] = plotmf(fis,'input',2); % subplot(2,1,2), plot(x,mf); % xlabel('input 2 (trimf)'); % % See also GENFIS2, ANFIS.
% Change this to have different default values
default_mf_n = 2;

98
default_mf_type = 'gbellmf'; default_output_type = 'linear';
if nargin <= 3, outmftype = default_output_type; end if nargin <= 2, inmftype = default_mf_type; end if nargin <= 1, numMFs = default_mf_n; end
% get dimension info data_n = size(data, 1); in_n = size(data, 2) - 1;
% error checking if length(numMFs)==1, numMFs=numMFs*ones(1, in_n); end
% Check arguments defining system inputs if length(numMFs) ~= in_n | (size(inmftype, 1) ~=1 & size(inmftype, 1)
~= in_n), error('Wrong size(s) of argument(s) defining system input(s)!'); end % Check argument defining system output if size(outmftype,1) ~= 1 error('Argument data entered may only have one output!'); end if (strcmp(outmftype,'linear') | strcmp(outmftype,'constant')) ~= 1 error('Output membership function type must be either linear or
constant!'); end
if size(inmftype, 1) ==1 & in_n>1 for i=2:in_n inmftype(i,:)=inmftype(1,:); end end
rule_n = prod(numMFs);
fis.name = 'anfis'; fis.type = 'sugeno';
fis.andMethod = 'prod'; fis.orMethod = 'max'; fis.defuzzMethod = 'wtaver'; fis.impMethod = 'prod';

99
fis.aggMethod = 'max';
range = [min(data,[],1)' max(data,[],1)']; in_mf_param = genparam(data, numMFs, inmftype); k=1; for i = 1:in_n, fis.input(i).name = ['input' num2str(i)]; fis.input(i).range=range(i,:); for j=1:numMFs(i) MFType = deblank(inmftype(i, :)); fis.input(i).mf(j).name = ['in' num2str(i) 'mf' num2str(j)]; fis.input(i).mf(j).type = MFType; if strcmp(MFType,'gaussmf') | strcmp(MFType,'sigmf') ... | strcmp(MFType,'smf'), fis.input(i).mf(j).params= in_mf_param(k,1:2); elseif strcmp(MFType,'trimf') | strcmp(MFType,'gbellmf'), fis.input(i).mf(j).params= in_mf_param(k,1:3); else fis.input(i).mf(j).params= in_mf_param(k,1:4); end k=k+1; end end
fis.output(1).name='output';
fis.output(1).range=range(end,:); for i = 1:rule_n, fis.output(1).mf(i).name=['out1mf', num2str(i)]; fis.output(1).mf(i).type=outmftype; if strcmp(outmftype, 'linear') fis.output(1).mf(i).params=zeros(1, in_n+1); else fis.output(1).mf(i).params=[0]; end end
rule_list = zeros(rule_n, length(numMFs)); for i = 0:rule_n-1, tmp = i; for j = length(numMFs):-1:1, rule_list(i+1, j) = rem(tmp, numMFs(j))+1; tmp = fix(tmp/numMFs(j)); end end rule_list = [rule_list (1:rule_n)' ones(rule_n, 1) ones(rule_n, 1)]; fis.rule=[]; fis=setfis(fis, 'rulelist', rule_list);
if length(fis.rule)> 250

100
wmsg = sprintf('genfis1 has created a large rulebase in the FIS.
\nMATLAB may run out of memory if this FIS is tuned using ANFIS.\n'); warning(wmsg); end

101
Genfis3
Genfis3
Generate Fuzzy Inference System structure from data using FCM clustering
Syntax
fismat = genfis3(Xin,Xout)
fismat = genfis3(Xin,Xout,type)
fismat = genfis3(Xin,Xout,type,cluster_n)
fismat = genfis3(Xin,Xout,type,cluster_n,fcmoptions)
Description
genfis3 generates a FIS using fuzzy c-means (FCM) clustering by extracting a set of rules that models the data behavior. The function requires separate sets of input and output data as input arguments. When there is only one output, you can use genfis3 to generate an initial FIS for anfis training. The rule extraction method first uses the fcm function to determine the number of rules and membership functions for the antecedents and consequents.
fismat = genfis3(Xin,Xout), generates a Sugeno-type FIS structure (fismat) given input data Xin and output data Xout. The matrices Xin and Xout have one column per FIS input and output, respectively.
fismat = genfis3(Xin,Xout,type), generates a FIS structure of the specified type, where type is either 'mamdani' or 'sugeno'.
fismat = genfis3(Xin,Xout,type,cluster_n), generates a FIS structure of the specified type and allows you to specify the number of clusters (cluster_n) to be generated by FCM.
The number of clusters determines the number of rules and membership functions in the generated FIS. cluster_n must be an integer or 'auto'. When cluster_n is 'auto', the function uses the subclust algorithm with a radii of 0.5 and the minimum and maximum values of Xin and Xout as xBounds to find the number of clusters. See subclust for more information.
fismat = genfis3(Xin,Xout,type,cluster_n,fcmoptions), generates a FIS structure of the specified type and number of clusters and uses the specified fcm options for the FCM algorithm. If you omit fcm options, the function uses the default FCM values. See fcm for information about these parameters.

102
The input membership function type is 'gaussmf'. By default, the output membership function type is 'linear'. However, if you specify type as 'mamdani', then the output membership function type is 'gaussmf'.
The following table summarizes the default inference methods
Inference Method Default AND prod OR probor
Implication prod Aggregation sum
Defuzzification wtaver

Appendix D

104
Related Publications
Here a list of publications resulted from this M.Sc. Thesis is written.
Publications in international journals
Md Hadiuzzaman, D M Ghius Malik, Saurav Barua, Dr. Tony Z. Qiu and Dr. Amy Kim, “Modeling Passengers’ Perceptions of Intercity Train Service Quality for Regular and Special Days”, Submitted and Currently Under Review for publication in the journal “Public Transport” of springer publisher. Md Hadiuzzaman, Hahid Parvez Farazi, Sanjana Hossain, D M Ghius Malik, “An Exploratory Analysis of Observed and Latent Variables Affecting Intercity Train Service Quality in Developing Countries”, Published in the journal “Transportation” of springer publisher on December, 2017. doi: 10.1007/s11116-017-9843-6

Dedicated to,
My Parents: Father: Engr. Md. Abdul Hye Civil Engineer, BUET (Graduated 1982) Additional Chief Engineer (ACE) Bangladesh Water Development Board (BWDB) Mother: Mosa. Rowshan Ara Talukder House Wife Youngest Child of Late. Abed Ali Talukder
Teachers:
Supervisor: Dr. Md. Mizanur Rahman Professor, Department of Civil Engineering, BUET
Pervious Supervisor: Dr. Md. Hadiuzzaman Associate Professor, Department of Civil Engineering, BUET
Deepest Gratitude to, Thesis Committee Members:
Dr. Ahsanul Kabir Professor and Head, Department of Civil Engineering, BUET
Dr. Hasib Mohammed Ahsan Professor, Department of Civil Engineering, BUET
Dr. Farzana Rahman Professor, Department of Civil Engineering, UAP
Whole-hearted Respect to,
Uncle (Maternal): Dr. M. A. Mazid Talukdar
Ex-General Manager, Latif Bawany Jute Mills Ltd. Chairman, MN Sweaters Ltd.
Teachers: Dr. Md. Habibur Rahman
Professor, Department of Civil Engineering, BUET Dr. Abu Siddique
Professor, Department of Civil Engineering, BUET Dr. Pran Kanai Saha
Professor, Department of Electrical and Electronic Engineering, BUET


![Passenger Assistd3cez36w5wymxj.cloudfront.net/migrated/Passenger Assist... · 2016-04-06 · “Passenger Assist [staff] need some further training – train/station staff [are] brilliant!”](https://img.pdfslide.net/doc/110x75/5e9f48764535fd17ee00b419/passenger-assist-2016-04-06-aoepassenger-assist-staff-need-some-further.jpg)