Embed Size (px)
Citation preview
TECHBRIEF
Research, Development, and Technology
Turner-Fairbank Highway Research Center
6300 Georgetown Pike
McLean, VA 22101-2296
www.fhwa.dot.gov/research
Development of Phased-Array Ultrasonic Testing Acceptability Criteria (Phase II)
FHWA Publication No.: HRT-14-075
NTIS Accession No. of the report covered in this TechBrief: PB2014-108874
FHWA Contact: Hamid Ghasemi, HRDI-60, (202) 493-3042, [email protected].
This document is a technical summary of the unpublished Federal Highway Administration (FHWA) report Development of Phased-Array Ultrasonic Testing Acceptability Criteria (Phase II), available through the National Technical Information Service (NTIS) at www.ntis.gov.
Introduction
The preliminary technical approach and scan plans developed during phase I of this research was implemented on testing four butt-weld specimens. The ray path analysis carried out to develop the scan plans and the preliminary data analysis indi-cated the need to carry out a minimum of two scans at different index points to enable complete volume coverage of the weld, particularly for thick weld specimens. The results also indicated the presence of defects (mainly lack of fusion, porosity, and cracks) in each of the four test specimens. The analysis of each defect to determine the size using the 6 dB drop method has been pursued in phase II of this research, and the results have been compared with the quality assurance/quality control (con-ventional ultrasonic testing (UT) and radiographic testing (RT) results provided by the fabricators. In addition, the inspections were carried out using 5 and 2.25 MHz phased-array ultrasonic testing (PAUT) probes. This report details the work carried out in phase II, which involved the fabrication of additional transition butt-weld specimens that will be used in phase III of this study.
Variables in Test Setup
The pulse-echo (PE) technique was used to carry out these tests. This process uses a transducer to both transmit and receive the ultrasonic pulse. The received ultrasonic pulses are separated
2
by the time it takes the sound to reach the dif-ferent surfaces from which it is reflected. The size (amplitude) of a reflection is related to the size of the reflecting surface. The PE ultrasonic response pattern is analyzed on the basis of sig-nal amplitude and separation. In the first phase of this work, scan plans were developed for four butt-weld specimens. The strategy in developing these scan plans was to take into consideration the detailed specific attributes of each specimen based on the thickness of the specimen, weld center line, and weld width. The scan plans were developed using the Eclipse Scientific BeamTool software. Various combinations of the beam index points were used to determine the ideal location for probe placement. The scan plans demonstrate the various refracted angles to be used during the examination. The complete coverage of the weld and the heat affected zone (HAZ) was an important aspect in developing the scan plans. The scan plan was to use the S-scans to optimize coverage to fully examine the weld and the HAZ. An unfocused sound beam was used to develop the approach. The scan plans indicated that a minimum of two index points should be used to ensure complete coverage of the volume of the weld. In addition to the two index points, two more index point from the opposite side of the weld were used in the test to validate the results from the two sides. The scan plans developed for the flat complete joint penetration (CJP) butt welds were discussed in the phase I report of this study.
The following variables were incorporated into the test setting to increase the number of data points available to infer the capabilities of the PAUT system in locating and sizing the flaws:
• The primary variables included the two different types of welding processes used for fabricating the specimen (namely electro-slag welding (ESW) and sub-merged arc welding (SAW). These were incorporated in the test setup to evaluate the influence of the microstructure on the PAUT system.
• The second variable was the inspection frequency. Typically, 2.25 MHz inspection frequency is used to inspect steel welds. In our study, the inspections were carried out using 2.25 and 5 MHz PAUT probes.
• Two index points from one side of weld centerline were used to compare the data from the first leg with that from the second leg and the influence of ultrasonic attenuation on the amplitude of the flaw signal.
• In addition, the test specimens were also inspected from the opposite side of the weld centerline to determine the influence of orientation of the flaw and its effect on sizing.
• The data were also acquired on the opposite inspection surfaces on the flat CJP butt-weld specimens. These data were included to validate the effective-ness of the use of the first and second leg data. The first leg data acquired from the top surfaces of the test specimens are equivalent to the second leg data acquired from the bottom surfaces of the test specimens. These data address the flaw orientation and ultrasonic attenuation effects and its influence on flaw sizing.
A total of eight index points (two from each side of the weld line and from the top and bottom surface of the test specimen) ensured a large number of data points for inferring the accu-racy of flaw location and sizing capability of the system.
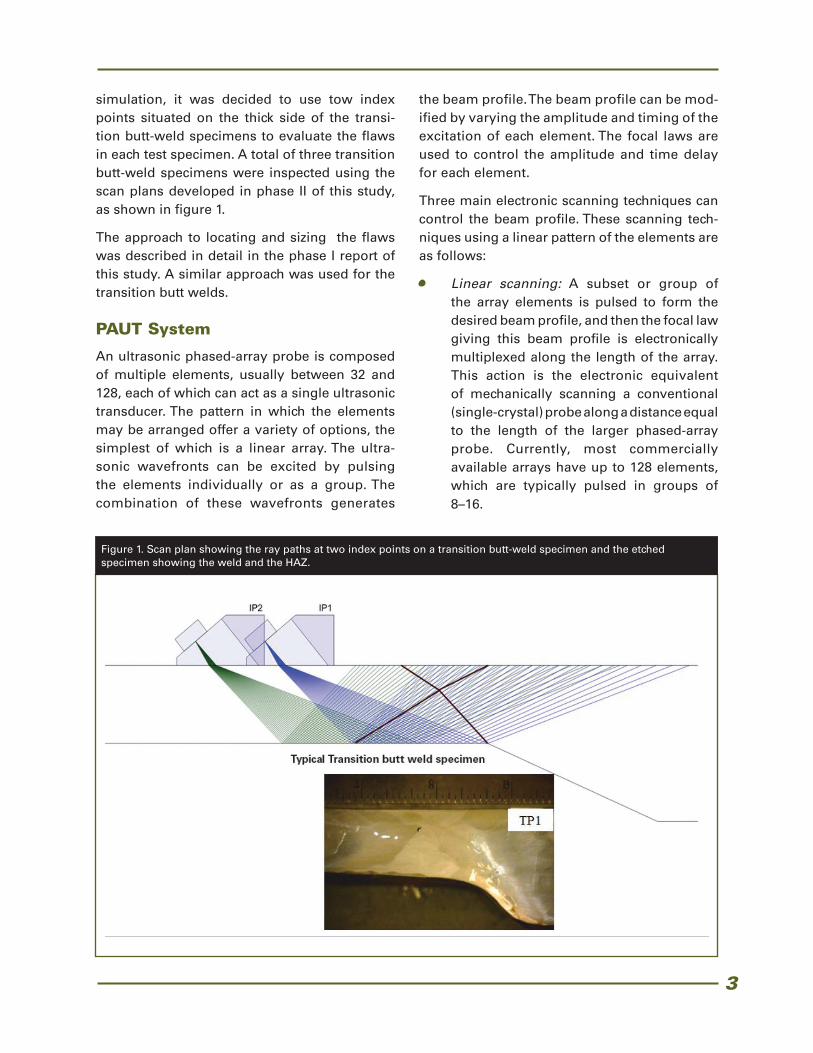
A similar scan plan was developed for transition butt-weld specimens. However, AWS mandates the inspection of the transition butt-weld speci-mens from the thick side of the specimen. This inspection ensures the complete coverage of the volume of the weld with the least number of index points. The beam simulations using the Eclipse Scientific BeamTool software validated this criterion. Based on the results of beam
3
simulation, it was decided to use tow index points situated on the thick side of the transi-tion butt-weld specimens to evaluate the flaws in each test specimen. A total of three transition butt-weld specimens were inspected using the scan plans developed in phase II of this study, as shown in figure 1.
The approach to locating and sizing the flaws was described in detail in the phase I report of this study. A similar approach was used for the transition butt welds.
PAUT System
An ultrasonic phased-array probe is composed of multiple elements, usually between 32 and 128, each of which can act as a single ultrasonic transducer. The pattern in which the elements may be arranged offer a variety of options, the simplest of which is a linear array. The ultra-sonic wavefronts can be excited by pulsing the elements individually or as a group. The combination of these wavefronts generates
the beam profile. The beam profile can be mod-ified by varying the amplitude and timing of the excitation of each element. The focal laws are used to control the amplitude and time delay for each element.
Three main electronic scanning techniques can control the beam profile. These scanning tech-niques using a linear pattern of the elements are as follows:
• Linear scanning: A subset or group of the array elements is pulsed to form the desired beam profile, and then the focal law giving this beam profile is electronically multiplexed along the length of the array. This action is the electronic equivalent of mechanically scanning a conventional (single-crystal) probe along a distance equal to the length of the larger phased-array probe. Currently, most commercially available arrays have up to 128 elements, which are typically pulsed in groups of 8–16.
Figure 1. Scan plan showing the ray paths at two index points on a transition butt-weld specimen and the etched specimen showing the weld and the HAZ.
4
• Dynamic depth focusing: By varying the focal laws, the focal point is electronically moved with the additional angle of focus along the nominal beam axis.
• Swept angular (sectorial or azimuthal) scanning: Focal laws are chosen to electronically steer the beam to a fixed angle of incidence or sweep the beam through a wide angular range.
Locating and Sizing Flaws
Each test specimen was inspected using the conventional single element ultrasonic system and followed by inspections using the phased-array ultrasonic system. Based on the current AWS guidelines for conventional ultrasonic test-ing, the defects are classified as follows:
• Class A (large discontinuity): Any indication in this category shall be rejected regardless of length.
• Class B (medium discontinuity): Any indication in this category having a length greater than 3/4 inch shall be rejected.
• Class C (small discontinuity): Any indication in this category having a length greater than 2 inches shall be rejected.
• Class D (minor discontinuity): Any indication in this category shall be accepted regardless of length or location in the weld.
Comparison of Conventional UT, RT, AND PAUT
The results from conventional UT were com-pared with those from PAUT. The conventional UT was able to locate most of the flaws; how-ever, some flaws were not detected using con-ventional UT, primarily because of the nature of the raster scanning approach. Flaws that are located close to each other or at different depths can often be difficult to discern using the ras-ter scan approach, particularly when scanning large specimens. (Note that most of the test specimens were about 40–48 inches in length.) A
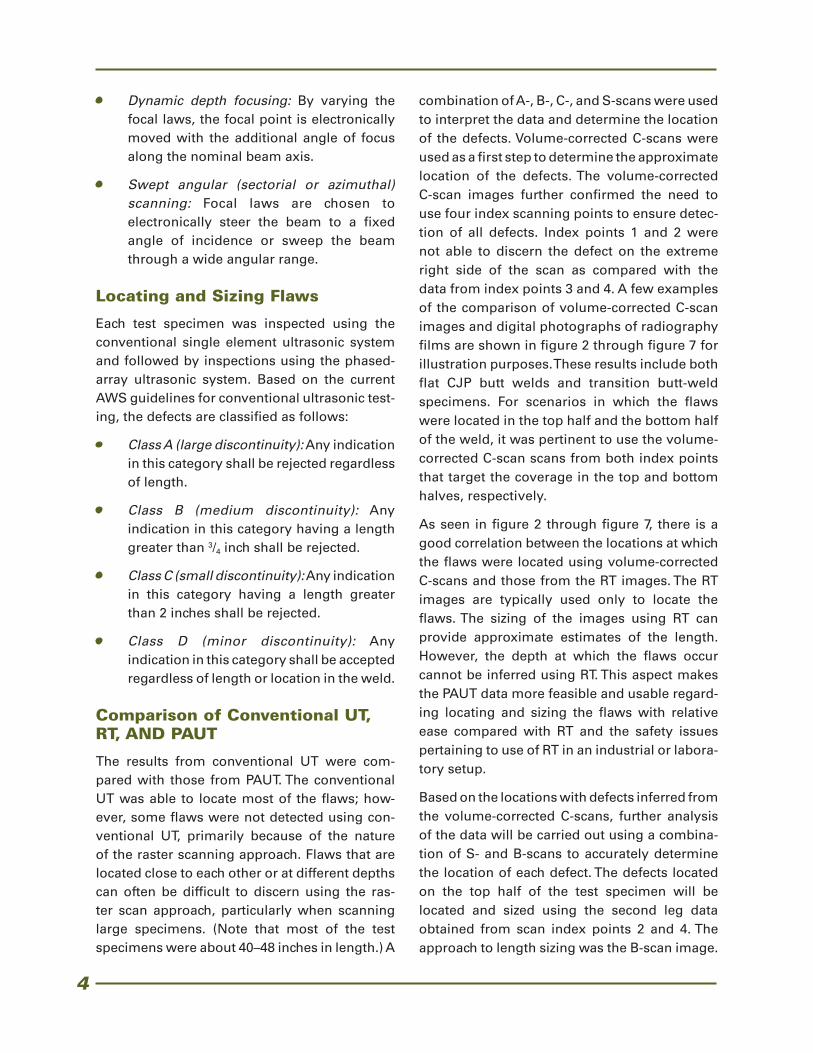
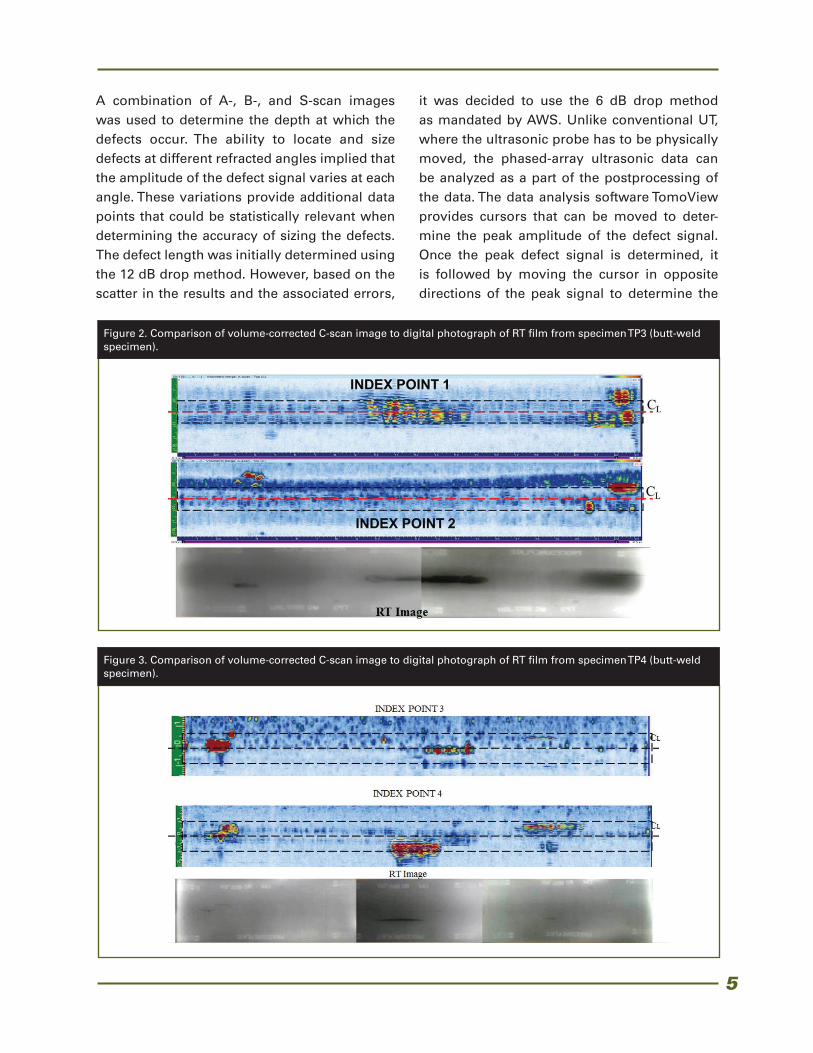
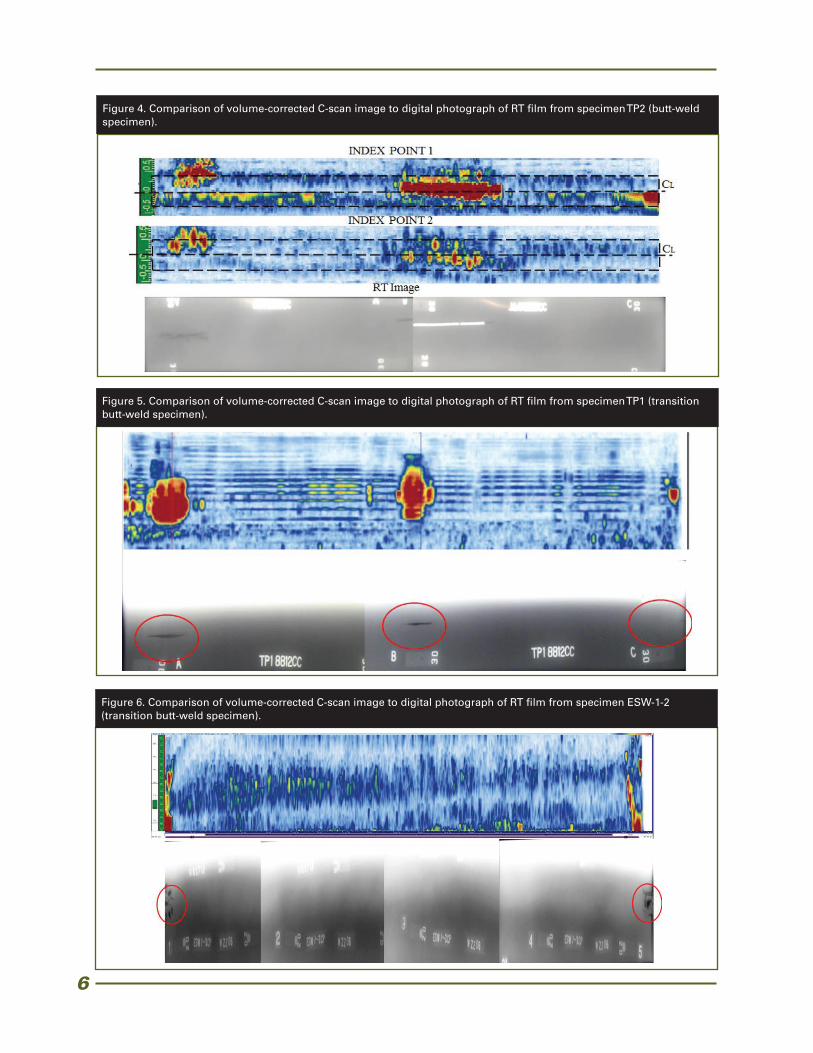
combination of A-, B-, C-, and S-scans were used to interpret the data and determine the location of the defects. Volume-corrected C-scans were used as a first step to determine the approximate location of the defects. The volume-corrected C-scan images further confirmed the need to use four index scanning points to ensure detec-tion of all defects. Index points 1 and 2 were not able to discern the defect on the extreme right side of the scan as compared with the data from index points 3 and 4. A few examples of the comparison of volume-corrected C-scan images and digital photographs of radiography films are shown in figure 2 through figure 7 for illustration purposes. These results include both flat CJP butt welds and transition butt-weld specimens. For scenarios in which the flaws were located in the top half and the bottom half of the weld, it was pertinent to use the volume-corrected C-scan scans from both index points that target the coverage in the top and bottom halves, respectively.
As seen in figure 2 through figure 7, there is a good correlation between the locations at which the flaws were located using volume-corrected C-scans and those from the RT images. The RT images are typically used only to locate the flaws. The sizing of the images using RT can provide approximate estimates of the length. However, the depth at which the flaws occur cannot be inferred using RT. This aspect makes the PAUT data more feasible and usable regard-ing locating and sizing the flaws with relative ease compared with RT and the safety issues pertaining to use of RT in an industrial or labora-tory setup.
Based on the locations with defects inferred from the volume-corrected C-scans, further analysis of the data will be carried out using a combina-tion of S- and B-scans to accurately determine the location of each defect. The defects located on the top half of the test specimen will be located and sized using the second leg data obtained from scan index points 2 and 4. The approach to length sizing was the B-scan image.
5
A combination of A-, B-, and S-scan images was used to determine the depth at which the defects occur. The ability to locate and size defects at different refracted angles implied that the amplitude of the defect signal varies at each angle. These variations provide additional data points that could be statistically relevant when determining the accuracy of sizing the defects. The defect length was initially determined using the 12 dB drop method. However, based on the scatter in the results and the associated errors,
it was decided to use the 6 dB drop method as mandated by AWS. Unlike conventional UT, where the ultrasonic probe has to be physically moved, the phased-array ultrasonic data can be analyzed as a part of the postprocessing of the data. The data analysis software TomoView provides cursors that can be moved to deter-mine the peak amplitude of the defect signal. Once the peak defect signal is determined, it is followed by moving the cursor in opposite directions of the peak signal to determine the
Figure 2. Comparison of volume-corrected C-scan image to digital photograph of RT film from specimen TP3 (butt-weld specimen).
Figure 3. Comparison of volume-corrected C-scan image to digital photograph of RT film from specimen TP4 (butt-weld specimen).
6
Figure 4. Comparison of volume-corrected C-scan image to digital photograph of RT film from specimen TP2 (butt-weld specimen).
Figure 5. Comparison of volume-corrected C-scan image to digital photograph of RT film from specimen TP1 (transition butt-weld specimen).
Figure 6. Comparison of volume-corrected C-scan image to digital photograph of RT film from specimen ESW-1-2 (transition butt-weld specimen).
7
Figure 7. Comparison of volume-corrected C-scan image to digital photograph of RT film from specimen SAW-1-2 (transition butt-weld specimen).
decrease in amplitude by 6 db. The extents of the cursors provide the length estimated for each defect. The data have currently been acquired on four butt-weld specimens. There was good cor-relation between the volume-corrected C-scan images obtained from PAUT and RT images. These images are primarily used to locate the flaws in a given specimen.
Data Analysis
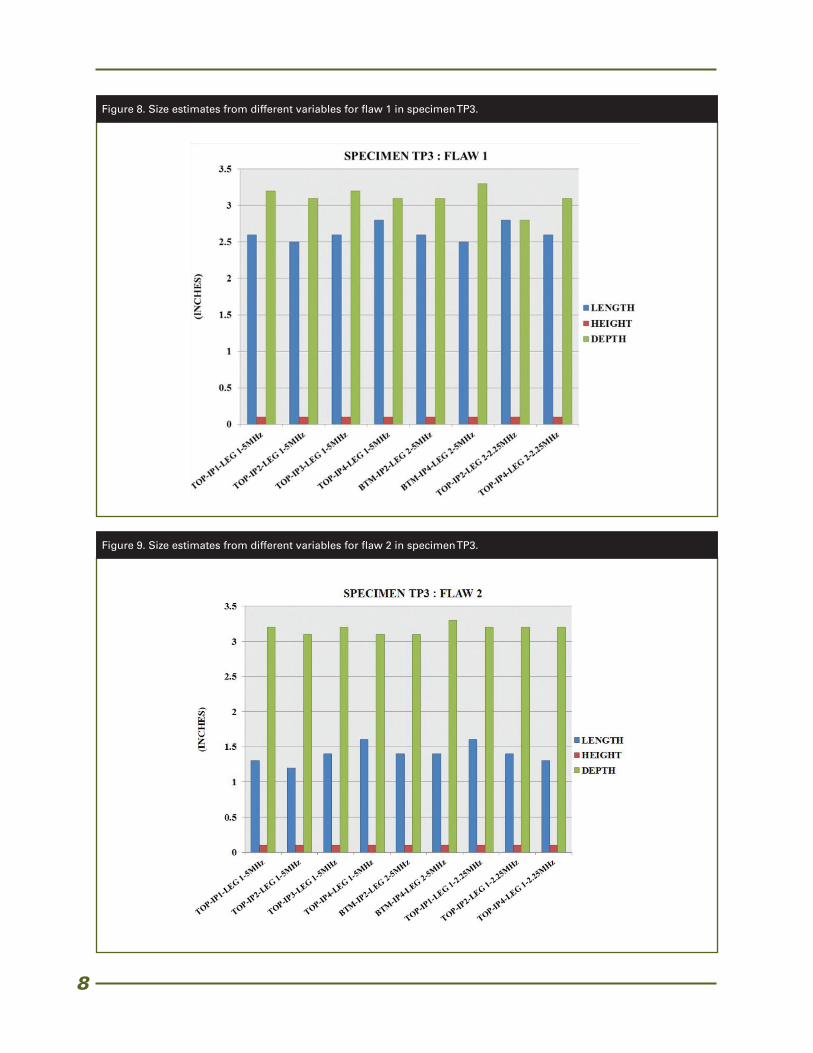
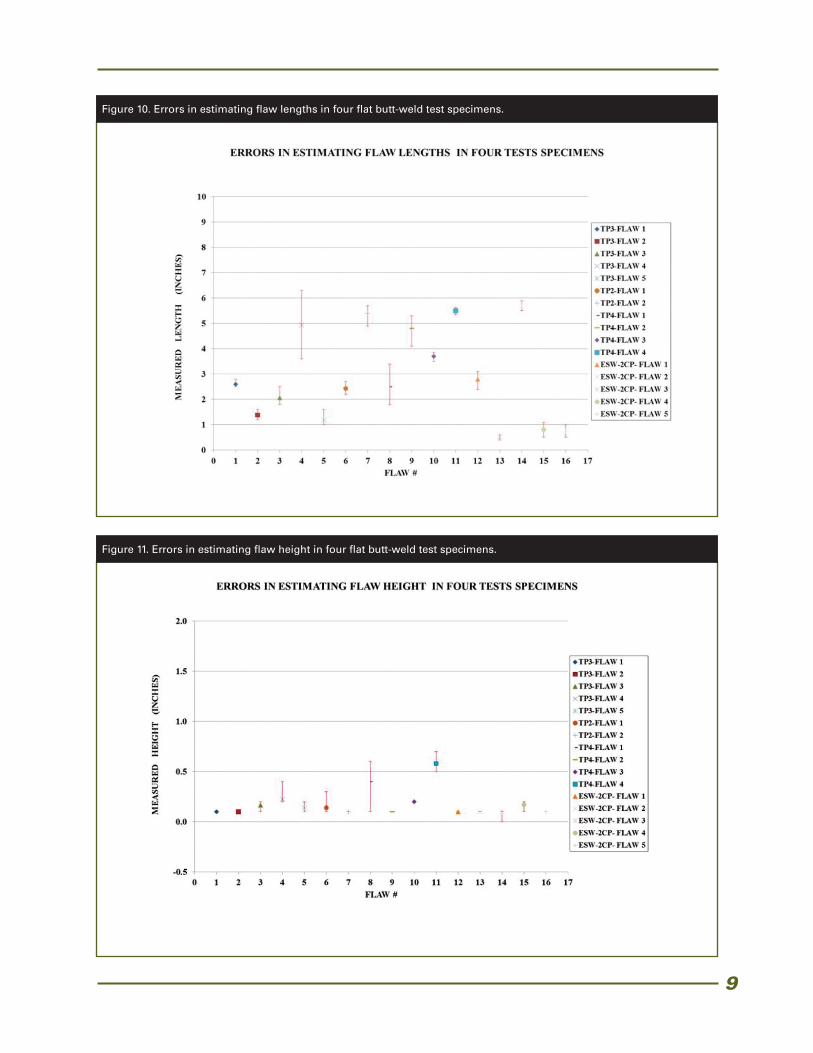
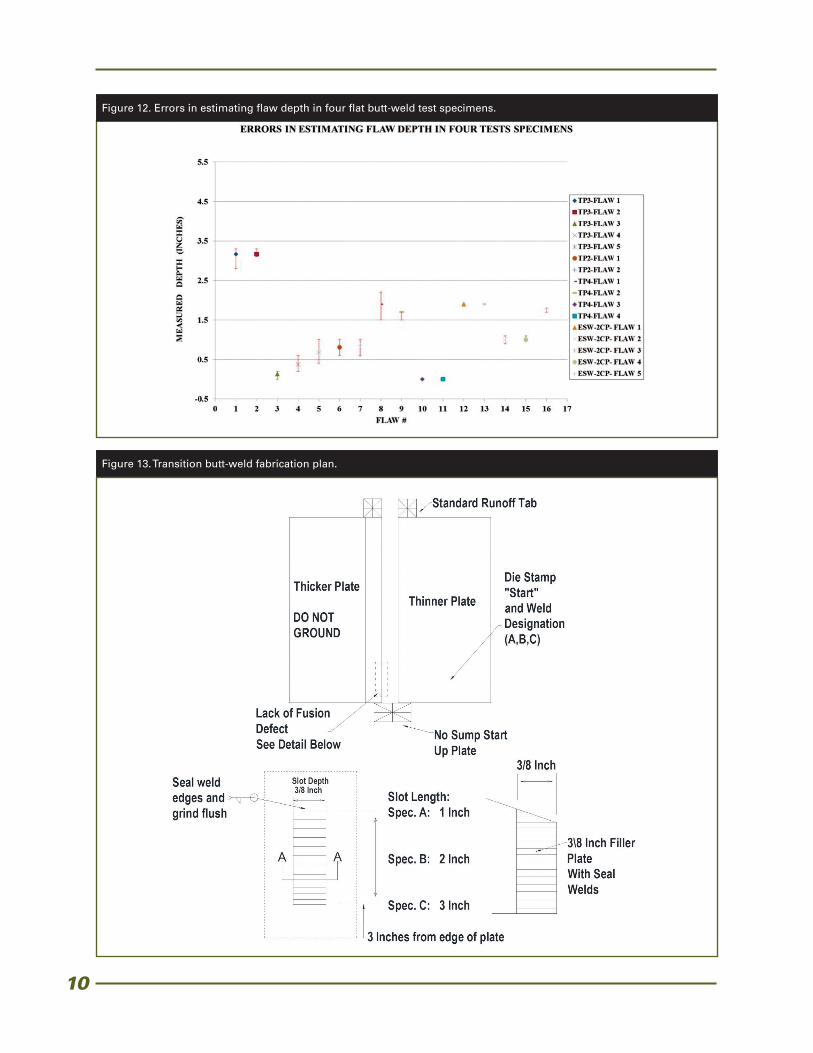
The information extracted from the various scans provided the estimates of the location, length, height, and depth of each flaw. Considering the different variables in the test setup and the inherent changes in the microstructure, siz-ing errors associated with each variable for any given flaw can be plotted as shown in figure 8. The errors associated with sizing the length, height, and depth of the flaw were not significant. However, the influence of attenua-tion and orientation is evident in figure 8 and figure 9. The sizing errors were +/- 0.3 inches for depth and length. The sizing errors were less significant for height of the flaw and were +/- 0.1 inches. The sizing errors across four butt-weld specimens, taking all the variables into account, are plotted in figure 10 through figure 12. The errors were very significant for
flaws representing a cluster of slag or porosity. When a cluster of slag or porosity is inspected from different angles, it is left to the interpreta-tion of the analyst to make a call on the ampli-tude of the flaw signal and its relevance to the angle being used for analysis.
Similar sizing errors will be determined from the data on transition butt-weld specimens. Currently, only two transition butt welds were available for testing. Additional transition butt-weld specimens were fabricated as part of the study in phase II. These additional transition butt-weld specimens will be tested in phase III of this study, and a statistically relevant conclusion on the accuracy of sizing using PAUT data will be determined in this next phase.
Additional Test Specimens for Future Tests
As a part of phase II, three additional transi-tion butt-weld specimens were fabricated using the ESW process. The fabrication plan was developed in collaboration with the steel weld fabricator as shown in figure 13. The intent in fabricating these additional test specimens is to implant fusion line cracking and transverse cracks using ESW.
8
Figure 8. Size estimates from different variables for flaw 1 in specimen TP3.
Figure 9. Size estimates from different variables for flaw 2 in specimen TP3.
9
Figure 10. Errors in estimating flaw lengths in four flat butt-weld test specimens.
Figure 11. Errors in estimating flaw height in four flat butt-weld test specimens.
10
Figure 13. Transition butt-weld fabrication plan.
Figure 12. Errors in estimating flaw depth in four flat butt-weld test specimens.
11
Summary
The preliminary technical approach and scan plans developed during phase I of this research were implemented on testing four butt-weld specimens and two transition butt-weld speci-mens. The ray path analysis carried out to develop the scan plans and the preliminary data analysis indicated the need to carry out a mini-mum of two scans at different index points to enable complete volume coverage of the weld, particularly for thick weld specimens. The results also indicate the presence of defects (mainly lack of fusion, porosity, and cracks) in each of the test specimens. Future work on develop-ing similar scan plans for transition butt welds and also investigating time of flight diffraction (TOFD) and combined TOFD-PE approaches will be pursued in phase III of this research effort. In addition, discussion with other federal and private sector experts on using a TOFD approach has generated a mixed response. The U.S. Navy has successfully used the TOFD approach on inspections of thick steel pipes. It will be benefi-cial to further explore this option by testing all of the test specimens using TOFD and making a quantitative comparison of the results as a part of the proposed phase III study.
The AWS committee members are yet to be convinced on the use of PAUT for inspection of welds generated using ESW. Their skepticism is primarily on account of the large grain structure that is observed in the HAZ in ESW welds. The inspection data acquired at the Turner-Fairbank Highway Research Center does not indicate any influence of the microstructure on the propaga-tion of ultrasonic waves in these specimens. However, only two ESW test specimens have been used in this study. The three additional transition butt-weld specimens fabricated dur-ing phase II will provide a larger set of ESW specimens and aid in establishing statistically relevant conclusions.
As a part of the future work scope, it would be imperative to consider a detailed metallo-graphic study on at least one or two speci-mens to validate the results from PAUT and RT.
Metallographic study can provide insight on the macrostructure and microstructure of the test specimen that is of interest regarding ESW test specimens, and the exercise can also validate the location and size of defects located through nondestructive evaluation technologies. Phase III of the study should also explore the possibility of having a round-robin study using all the test specimens currently available as a part of this study. However, this round-robin study should be developed with caution to ensure that the participants understand the basic principles of PAUT and have experience in developing scan plans. The technicians should have a minimum of level II certification in UT with additional train-ing and experience in using PAUT equipment.
References
1. Ahmed S. et al., Innovative Approaches to Automating QA/QC of Fuel Particle Production Using On-Line Nondestructive Methods for Higher Reliability, PNNL-15668, Pacific Northwest National Laboratory, Richland, Washington, 2006.
2. Ciorau, P., “A Contribution to Phased Array Ultrasonic Inspection of Welds Part 1: Data Plotting for S- and B-Scan Displays,” NDT.net, Vol. 12, No. 6, June 2007; Canadian Institute for Nondestructive Evaluation, Vol. 28, No. 5, Sep/Oct 2007.
3. EPRI Nondestructive Evaluation Center, Assessment of the Intergranular Stress Corrosion Cracking Training and Qualification Program: Interim Report, EPRI NP-5658, Project 1570-2, 1988.
4. Wooldridge A.B., and G.S. Woodcock, “Reliability of Radiography for Detection of Planar Manufacturing Defects in Thick-Section Welds,” Insight (UK) 39(3), pp. 139–147, 1997.
5. Cataldo, G., and R. Legori, “Advanced Ultrasonic Techniques in Pipeline Girth Welds Examination,” ASME Pressure Vessels and Piping, 456, pp. 49, 2003.
12
OCTOBER 2014 FHWA-HRT-14-075
HRDI-60/10-14(50)
Researchers—This study was initiated by Engineering and Software Consultants, Inc., Chantilly, VA, Contract No. DTFH61-08-D-000014.
Distribution—The report covered in this TechBrief is being distributed through the National Technical Information Service at www.ntis.gov.
Availability—This TechBrief may be obtained from the FHWA Product Distribution Center by email to [email protected], fax to (814) 239-2156, phone to (814) 239-1160, or online at http://www.fhwa.dot.gov/research.
Key Words—Corrosion, section loss, nondestructive evaluation, phased-array ultrasonic, pulsed radi-ography, steel bridge.
Notice—This document is disseminated under the sponsorship of the U.S. Department of Transportation in the interest of information exchange. The U.S. Government assumes no liability for the use of the information contained in this document. The U.S. Government does not endorse prod-ucts or manufacturers. Trademarks or manufacturers’ names appear in this TechBrief only because they are considered essential to the objective of the document.
Quality Assurance Statement—The Federal Highway Administration provides high-quality informa-tion to serve Government, industry, and the public in a manner that promotes public understanding. Standards and policies are used to ensure and maximize the quality, objectivity, utility, and integrity of its information. FHWA periodically reviews quality issues and adjusts its programs and processes to ensure continuous quality improvement.
6. Lozev, M., “Validation of Current Approaches for Girth Weld Defect Sizing Accuracy by Pulse-Echo, Time-Of-Flight Diffraction and Phased Array Mechanized Ultrasonic Testing Methods,” EWI Project No. 45066CAP, 2002.
7. Ginzel, E., Thompson, R., and Ginzel, R., A Qualification Process for Phased-Array UT using DNV RP-F118 Guidelines, 2011.
8. White, P., Spencer, R., and Porter, N., Enhanced Defect Detection and Sizing Accuracy Using Matrix Phased Array Ultrasonic’s Tools, EWI Field Trial Report, pp. 58, 2009.
9. Silk, M.G., “The use of diffraction-based time-of-flight measurements to locate and size defects,” British Journal of Non-Destructive Testing, 26, pp. 208–213, 1984.