Embed Size (px)
Citation preview

EERI Seminar on Next Generation Attenuation Models
Development of Risk-Targeted Earthquake Ground Motions
for use in ASCE 7
Nicolas Luco, Research Structural Engineer
USGS, Golden, Colorado
National Earthquake Hazards Reduction Program (NEHRP) Advisory Committee (ACEHR) Meeting

EERI Seminar on Next Generation Attenuation Models
Acknowledgements• USGS Hazard Mapping Project, particularly …
– Mark Petersen (Project Chief)– Steve Harmsen (Modeler)– Ken Rukstales (GIS)
• FEMA-Funded BSSC Project ‘07– Charlie Kircher (Chair)– See seminar presentation by Kircher for member list
• ASCE 7 SSC Ad-Hoc Ground Motion Committee– Charlie Kircher (Chair)– John Hooper (SSC Chair)
– Eric Martinez (Web)– Greg Smoczyk (DB)– Sean McGowan (QA)
– C.B. Crouse (TC1 Chair)– Jim Harris (ASCE 7 MC)
NEHRP Advisory Committee on Earthquake Hazards Reduction (ACEHR) Meeting
“Development of Risk-Targeted Earthquake Ground Motions for use in ASCE 7,” N. Luco, USGS March 11, 2011

EERI Seminar on Next Generation Attenuation Models
New ASCE 7-10 “Design Maps”
FIGURE 22-1 RISK-TARGETED MAXIMUM CONSIDERED EARTHQUAKE (MCER) GROUND MOTION OF 0.2 SEC SPECTRAL RESPONSE ACCELERATION, SITE CLASS B
NEHRP Advisory Committee on Earthquake Hazards Reduction (ACEHR) Meeting
“Development of Risk-Targeted Earthquake Ground Motions for use in ASCE 7,” N. Luco, USGS March 11, 2011

Google “EERI NGA Seminar Presentations” for Videoor email [email protected] for just PowerPoint

EERI Seminar on Next Generation Attenuation Models
Outline of Presentation
• Preparation of new design maps using … – Seismic hazard computed by USGS
• Probabilistic hazard curves• Deterministic median ground motions
– Procedures developed by Project ‘07• Stipulated in site-specific procedures (Ch. 21) of
ASCE 7-10 & 2009 NEHRP Provisions
• Design maps web application and other associated products prepared by USGS
NEHRP Advisory Committee on Earthquake Hazards Reduction (ACEHR) Meeting
“Development of Risk-Targeted Earthquake Ground Motions for use in ASCE 7,” N. Luco, USGS March 11, 2011

EERI Seminar on Next Generation Attenuation Models
Preparation of New Design Maps• Consistent with site-specific procedures
(Ch. 21) of ASCE 7-10 & 2009 NEHRP … – Probabilistic ground motion
• Method 1: Uniform-hazard GM x Risk Coefficient• Method 2: Risk-targeted probabilistic GM directly
– Deterministic ground motion• 84th-%ile GM, but not < 1.5Fa or 0.6Fv / T
– MCER GM = min( Prob. GM, Det. GM)– All GMs are max-direction spectral accel.’s
• Ground motions computed by USGSNEHRP Advisory Committee on Earthquake Hazards Reduction (ACEHR) Meeting
“Development of Risk-Targeted Earthquake Ground Motions for use in ASCE 7,” N. Luco, USGS March 11, 2011

EERI Seminar on Next Generation Attenuation Models
New MCER GMs
Preparation of New Design MapsDeterministic GMsProbabilistic GMs
(Risk-Targeted)
─ In ASCE 7-10─ In 2009 NEHRP
Risk CoefficientsUniform-Hazard GMs
X
To relate back to conventional uniform-hazard (2500-yr) GMs …
NEHRP Advisory Committee on Earthquake Hazards Reduction (ACEHR) Meeting
“Development of Risk-Targeted Earthquake Ground Motions for use in ASCE 7,” N. Luco, USGS March 11, 2011

EERI Seminar on Next Generation Attenuation Models
Probabilistic Ground MotionsFrom site-specific procedures (Chapter 21) of ASCE 7-10 & 2009 NEHRP Provisions …
21.2.1, Probabilistic Ground Motion: The probabilistic spectral responseaccelerations shall be taken as the spectral response accelerations in the direction ofmaximum horizontal response represented by a 5 percent damped accelerationresponse spectrum that is expected to achieve a 1 percent probability of collapsewithin a 50-yr. period.
21.2.1.2, Method 2: At each spectral response period for which the acceleration is computed,ordinates of the probabilistic ground motion response spectrum shall be determined from iterativeintegration of a site-specific hazard curve with a lognormal probability density functionrepresenting the collapse fragility (i.e., probability of collapse as a function of spectral responseacceleration). The ordinate of the probabilistic ground-motion response spectrum at each periodshall achieve a 1 percent probability of collapse within a 50-yr. period for a collapse fragilityhaving (i) a 10 percent probability of collapse at said ordinate of the probabilistic ground-motionresponse spectrum and (ii) a logarithmic standard deviation values of 0.6.
Probabilistic Ground Motion = Risk-Targeted GM
NEHRP Advisory Committee on Earthquake Hazards Reduction (ACEHR) Meeting
“Development of Risk-Targeted Earthquake Ground Motions for use in ASCE 7,” N. Luco, USGS March 11, 2011

EERI Seminar on Next Generation Attenuation Models
Calculated iteratively by combining …
… via “Risk Integral” (e.g. ATC 3-06), i.e., …
Risk-Targeted Ground Motions
Risk Targetdefined by Project ‘07
Prob. of Collapsein 50 yrs = 1%
GM Hazard Curves(e.g., from USGS)
Building Fragility Curvesdefined by Project ‘07
NEHRP Advisory Committee on Earthquake Hazards Reduction (ACEHR) Meeting
“Development of Risk-Targeted Earthquake Ground Motions for use in ASCE 7,” N. Luco, USGS March 11, 2011
EERI Seminar on Next Generation Attenuation Models
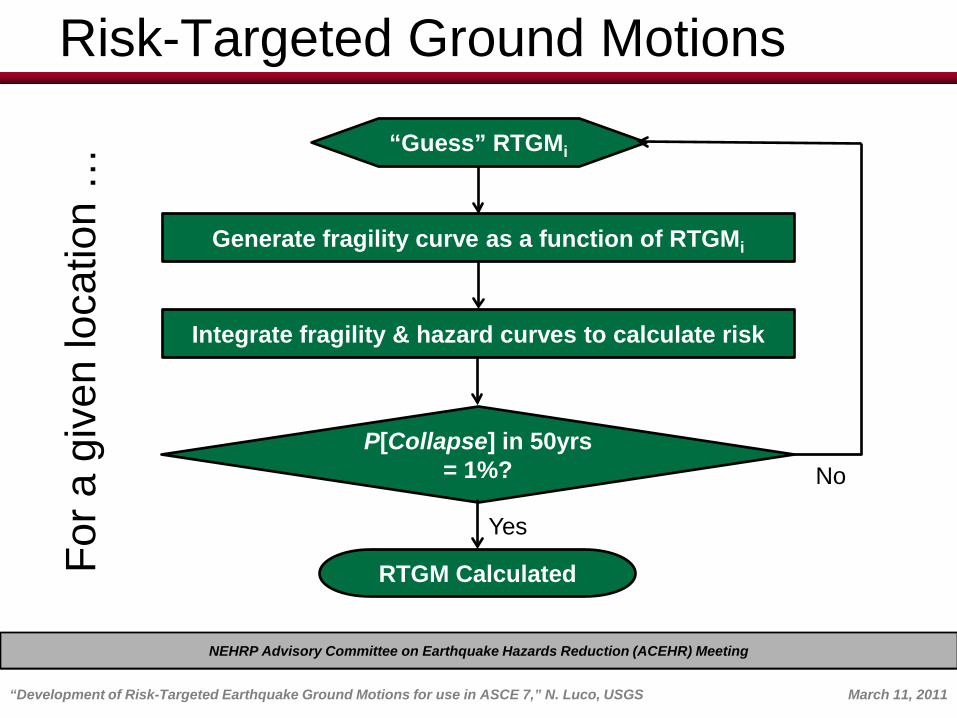
Risk-Targeted Ground Motions
“Guess” RTGMi
P[Collapse] in 50yrs= 1%?
Generate fragility curve as a function of RTGMi
Integrate fragility & hazard curves to calculate risk
RTGM CalculatedFor a
giv
en lo
catio
n …
Yes
No
NEHRP Advisory Committee on Earthquake Hazards Reduction (ACEHR) Meeting
“Development of Risk-Targeted Earthquake Ground Motions for use in ASCE 7,” N. Luco, USGS March 11, 2011

EERI Seminar on Next Generation Attenuation Models
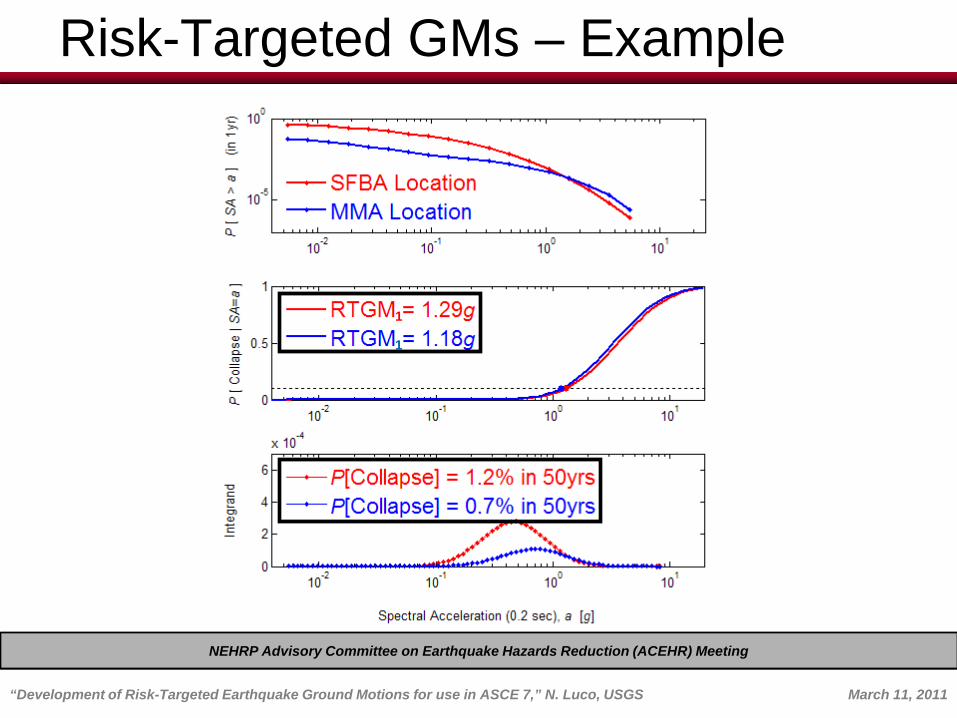
Risk-Targeted GMs – Example
GM hazard curves from USGS …
Notes:
The SA values from USGS have been factored by 1.1 for 0.2s or 1.3 for 1.0s to convert (approximately) to max direction.
Conventional “2500-yr” GMs are interpolated from such hazard curves.
NEHRP Advisory Committee on Earthquake Hazards Reduction (ACEHR) Meeting
“Development of Risk-Targeted Earthquake Ground Motions for use in ASCE 7,” N. Luco, USGS March 11, 2011

EERI Seminar on Next Generation Attenuation Models
Generic fragility curves assuming, for our 1st iteration, that RTGMs = 2500-yr GMs …
1
1
1
1
Risk-Targeted GMs – Example
Generic fragility curve equation:
where
NEHRP Advisory Committee on Earthquake Hazards Reduction (ACEHR) Meeting
“Development of Risk-Targeted Earthquake Ground Motions for use in ASCE 7,” N. Luco, USGS March 11, 2011
EERI Seminar on Next Generation Attenuation Models
Risk-Targeted GMs – Example
Risk Integration:
HazardRisk Fragility
1
1
NEHRP Advisory Committee on Earthquake Hazards Reduction (ACEHR) Meeting
“Development of Risk-Targeted Earthquake Ground Motions for use in ASCE 7,” N. Luco, USGS March 11, 2011

EERI Seminar on Next Generation Attenuation Models
2
2
Risk-Targeted GMs – Example
Ris
k In
tegr
atio
n:
Haz
ard
Ris
kFr
agili
ty
NEHRP Advisory Committee on Earthquake Hazards Reduction (ACEHR) Meeting
“Development of Risk-Targeted Earthquake Ground Motions for use in ASCE 7,” N. Luco, USGS March 11, 2011

EERI Seminar on Next Generation Attenuation Models
Risk-Targeted GM (RTGM) Maps
Reminder: These RTGM maps are coupled with deter-ministic maps to produce the MCER maps in ASCE 7-10
NEHRP Advisory Committee on Earthquake Hazards Reduction (ACEHR) Meeting
“Development of Risk-Targeted Earthquake Ground Motions for use in ASCE 7,” N. Luco, USGS March 11, 2011

EERI Seminar on Next Generation Attenuation Models
Risk-Targeted Ground MotionsFrom site-specific procedures (Chapter 21) of ASCE 7-10 & 2009 NEHRP Provisions …
21.2.1, Probabilistic Ground Motion: The probabilistic spectral responseaccelerations shall be taken as the spectral response accelerations in the direction ofmaximum horizontal response represented by a 5 percent damped accelerationresponse spectrum that is expected to achieve a 1 percent probability of collapsewithin a 50-yr. period.
21.2.1.1, Method 1: At each spectral response period for which the acceleration iscomputed, ordinates of the probabilistic ground motion response spectrum shall bedetermined as the product of the risk coefficient, CR, and the spectral responseacceleration from a 5 percent damped acceleration response spectrum having a 2percent probability of exceedance within a 50-yr. period. The value of the riskcoefficient, CR, shall be determined using values of CRS and CR1 from Figs. 22-3 and22-4, respectively. …
Risk-Targeted GM = Uniform-Hazard (2500-yr) GM
x Risk Coefficient
Probabilistic Ground Motion = Risk-Targeted GM
NEHRP Advisory Committee on Earthquake Hazards Reduction (ACEHR) Meeting
“Development of Risk-Targeted Earthquake Ground Motions for use in ASCE 7,” N. Luco, USGS March 11, 2011

EERI Seminar on Next Generation Attenuation Models
Risk Coefficients (CR’s)• Conventional uniform-hazard (2500-yr)
GMs interpolated from hazard curves
• CR’s =
• e.g., SFBA Location MMA LocationRisk-Targeted GM 1.38g 0.96gUniform-Hazard GM 1.29g 1.18gRisk Coefficient (CR) 1.07 0.82
Risk-Targeted GMsUniform-Hazard GMs
NEHRP Advisory Committee on Earthquake Hazards Reduction (ACEHR) Meeting
“Development of Risk-Targeted Earthquake Ground Motions for use in ASCE 7,” N. Luco, USGS March 11, 2011
EERI Seminar on Next Generation Attenuation Models
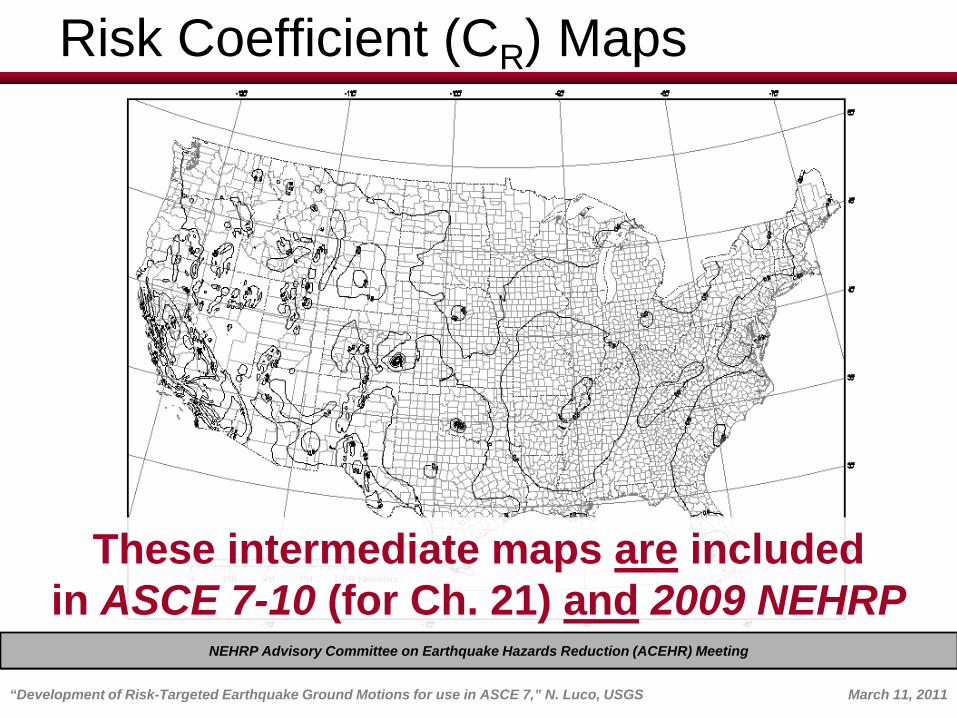
Risk Coefficient (CR) Maps
These intermediate maps are includedin ASCE 7-10 (for Ch. 21) and 2009 NEHRP
NEHRP Advisory Committee on Earthquake Hazards Reduction (ACEHR) Meeting
“Development of Risk-Targeted Earthquake Ground Motions for use in ASCE 7,” N. Luco, USGS March 11, 2011

EERI Seminar on Next Generation Attenuation Models
Risk Coefficient (CR) Maps
125 ° W 120 ° W 115° W 110 ° W 105° W 100° W 95° W 90° W 85° W 80° W 75
° W 70° W 65
° W
25 ° N
30 ° N
35 ° N
40 ° N
45 ° N
50 ° N
0.7 0.8 0.9 1 1.1 1.2 1.3 1.4 1.5 1.6
< 0.85
NEHRP Advisory Committee on Earthquake Hazards Reduction (ACEHR) Meeting
“Development of Risk-Targeted Earthquake Ground Motions for use in ASCE 7,” N. Luco, USGS March 11, 2011

EERI Seminar on Next Generation Attenuation Models
Risk Coefficient (CR) Maps
125 ° W 120 ° W 115° W 110 ° W 105° W 100° W 95° W 90° W 85° W 80° W 75
° W 70° W 65
° W
25 ° N
30 ° N
35 ° N
40 ° N
45 ° N
50 ° N
0.7 0.8 0.9 1 1.1 1.2 1.3 1.4 1.5 1.6
> 1.15
NEHRP Advisory Committee on Earthquake Hazards Reduction (ACEHR) Meeting
“Development of Risk-Targeted Earthquake Ground Motions for use in ASCE 7,” N. Luco, USGS March 11, 2011

EERI Seminar on Next Generation Attenuation Models
Summary: Probabilistic GMs• Probabilistic GMs = Risk-Targeted GMs• Risk-Targeted GMs calculated from …
– GM hazard curves (from USGS)– Building fragility curves (def. by Project ’07)– Risk target (defined by Project ‘07)
• Risk Coefficients =
• Risk Coeff. Maps included in ASCE 7-10for combination with site-specific UHGMs
Risk-Targeted GMsUniform-Hazard GMs
NEHRP Advisory Committee on Earthquake Hazards Reduction (ACEHR) Meeting
“Development of Risk-Targeted Earthquake Ground Motions for use in ASCE 7,” N. Luco, USGS March 11, 2011

EERI Seminar on Next Generation Attenuation Models
Comparison of Seismic Design Values• 34 City Sites in the Continental United States
– Selection of regions most at risk:• High seismic regions (Nor Cal, So Cal, PNW)• High population areas of high/moderate/low
seismic regions (Intermountain and CEUS)– Selection of City sites:
• Major city of regional county or metropolitan area • Nearest USGS hazard grid point to center of city
• Average Regional or National values:– Weight seismic design value of associated county or
metropolitan area population• Assume Default Soil Type (Site Class D)
From “Project 07 - Reassessment of Seismic Design Procedures … for Building Codes,” C. Kircher et al September, 2009

EERI Seminar on Next Generation Attenuation Models
Map showing selected United States city sites (34) used to compare ground motions (WUS faults shown with red lines)
From “Project 07 - Reassessment of Seismic Design Procedures … for Building Codes,” C. Kircher et al September, 2009

EERI Seminar on Next Generation Attenuation Models
Map showing selected Central and Eastern United states (CEUS) city sites (5) used to compare ground motions
St. Louis City Site
New York City Site
Charleston City Site
Chicago City Site
Memphis City Site
From “Project 07 - Reassessment of Seismic Design Procedures … for Building Codes,” C. Kircher et al September, 2009

EERI Seminar on Next Generation Attenuation Models
Central and Eastern United States city sitesLocation and associated county population data(and total population for all United States counties)
Name Latitude Longitude Name Population
St. Louis 38.60 -90.20 St. Louis MSA (16) 2,786,728
Memphis 35.15 -90.05 Memphis MSA (8) 1,269,108
Charleston 32.80 -79.95 Charleston MSA (3) 603,178
Chicago 41.85 -87.65 Chicago MSA (7) 9,505,748
New York 40.75 -74.00 New York MSA (23) 18,747,320
48,340,918 Total Pop - 57 Counties 32,912,082
101,407,080 Total County Population All Regions 71,381,030
Metropolitan Statistical Area
Total State Population All Regions
Total Pop - MO/TN/SC/IL/NY
City and Location of Site
From “Project 07 - Reassessment of Seismic Design Procedures … for Building Codes,” C. Kircher et al September, 2009

EERI Seminar on Next Generation Attenuation Models
Central and Eastern United States City SitesComparison of short-period design values (SDS) and MCE parameters for Site Class D, return periods and 50-year collapse risk probabilities
Design
S D1 (g) F v S 1UH (g) C R1 S 1D (g)
St. Louis 0.24 2.13 0.20 0.83 0.60 1,717 1.0%
Memphis 0.40 1.70 0.44 0.80 0.60 1,706 1.0%
Charleston 0.41 1.67 0.45 0.81 0.91 1,865 1.0%
Chicago 0.10 2.40 0.07 0.87 0.60 1,850 1.0%
New York 0.11 2.40 0.08 0.91 0.60 2,129 1.0%
CEUS Average 0.14 2.34 0.11 0.88 0.61 1,992 1.0%
CEUS City (Site Location)
MCE (2009 NEHRP Provisions ) Return Period (years)
50-Year Collapse
Prob.
From “Project 07 - Reassessment of Seismic Design Procedures … for Building Codes,” C. Kircher et al September, 2009
0.42
0.74
0.80
0.14
0.29 1.58
1.60
1.04
1.10
1.45
0.32
0.15
1.46
1.24
0.51
0.87
0.92
0.79
0.81
0.87
1.50
1.50
2.99
1.50
1.50
1.0%
1.0%
1.0%
1.0%
1.0%1,838
1,680
1,747
2,155
2,058
0.29 1.54 0.34 0.88 1.53 1.0%2,047
SDS (g) Fa SSUH (g) CRS SSD (g)

EERI Seminar on Next Generation Attenuation Models
Central and Eastern United States City SitesComparison of short-period design ground motions (SDS) with prior (ASCE 7-05) values and older Code Values (Site Class D)
2.75*Z Ca
1994 UBC 1997 UBC ASCE 7-98 ASCE 7-05 ASCE 7-10
St. Louis 0.41 0.55 0.53 0.52 0.42
Memphis 0.83 0.90 0.92 0.93 0.74
Charleston 0.41 0.55 0.95 1.01 0.80
Chicago 0.00 0.00 0.20 0.18 0.14
New York 0.41 0.55 0.41 0.37 0.29
CEUS Average 0.31 0.40 0.39 0.36 0.29
City (Site Location)
SDS - ASCE 7
From “Project 07 - Reassessment of Seismic Design Procedures … for Building Codes,” C. Kircher et al September, 2009

EERI Seminar on Next Generation Attenuation Models
Comparison of Short-Period Design Ground MotionsComparison of average values of current (ASCE 7-10) and prior (ASCE 7-05) ground motions, and older Codes for each region and all 34 selected sites in the continental United States
2.75*Z Ca
1994 UBC 1997 UBC 7-98(7-02) 7-05 7-10
Southern CA 1.10 1.25 1.06 1.16 1.22
Northern CA 1.06 1.18 1.01 1.00 1.08
Pacific NW 0.83 0.90 0.90 0.84 0.83
Intermountain 0.68 0.80 0.72 0.70 0.65
CEUS 0.31 0.40 0.39 0.36 0.29
All Regions 0.69 0.80 0.72 0.73 0.72
United States Region
SDS - ASCE 7
From “Project 07 - Reassessment of Seismic Design Procedures … for Building Codes,” C. Kircher et al September, 2009
(+5%)
(+8%)
(-1%)
(-7%)
(-19%)
(-1%)

EERI Seminar on Next Generation Attenuation Models
Comparison of 1-Second Design Ground MotionsComparison of average values of current (ASCE 7-10) and prior (ASCE 7-05) ground motions, and older Codes for each region and all 34 selected sites in the continental United States
1.25(1.5)Z Cv
1994 UBC 1997 UBC 7-98 (7-02) 7-05 7-10
Southern CA 0.75 0.83 0.63 0.65 0.70
Northern CA 0.73 0.81 0.64 0.61 0.65
Pacific NW 0.56 0.54 0.46 0.44 0.49
Intermountain 0.47 0.46 0.41 0.39 0.34
CEUS 0.21 0.24 0.16 0.14 0.14
All Regions 0.47 0.52 0.39 0.38 0.40
United States Region
SD1 - ASCE 7
From “Project 07 - Reassessment of Seismic Design Procedures … for Building Codes,” C. Kircher et al September, 2009
(+8%)
(+7%)
(+11%)
(-13%)
(0%)
(+5%)

EERI Seminar on Next Generation Attenuation Models
Summary
• Previous uniform-hazard (2%-in-50yr) probabilistic ground motions …
– Resulted in spatially-variable collapse risk, due to variations in hazard curve shapes
– Considered only a single selected point (2%-in-50yr) on hazard curves
– Were similar in value in Memphis Metro Area and San Francisco Bay Area
• New risk-targeted probabilistic ground motions address these issues
NEHRP Advisory Committee on Earthquake Hazards Reduction (ACEHR) Meeting
“Development of Risk-Targeted Earthquake Ground Motions for use in ASCE 7,” N. Luco, USGS March 11, 2011

EERI Seminar on Next Generation Attenuation Models
Summary (continued)• New risk-targeted probabilistic ground motions
(RTGMs) …
– Explicitly & uniformly target 1% probability of collapse in a building’s lifetime, ~50 years
– Consider all points on & spatial variations in shapes of hazard curves
– Require a generic fragility that depends on RTGM & effectively considers shapes of hazard curves
– Changes uniform-hazard (2%-in-50yr) ground motions by factor of 0.85-1.15 generally, but as low as 0.70 near New Madrid and Charleston
NEHRP Advisory Committee on Earthquake Hazards Reduction (ACEHR) Meeting
“Development of Risk-Targeted Earthquake Ground Motions for use in ASCE 7,” N. Luco, USGS March 11, 2011