Embed Size (px)
Citation preview

Instructions for use
Title Development of the Nonlinear Bond Stress-Slip Model of Fiber Reinforced Plastics Sheet-Concrete Interfaces with aSimple Method
Author(s) Dai, Jianguo; Ueda, Tamon; Sato, Yasuhiko
Citation Journal of Composites for Construction, 9(1): 52-62
Issue Date 2005
Doc URL http://hdl.handle.net/2115/5921
Type article (author version)
Note It is the author's manuscript version and not the published version
File Information JCC9-1.pdf
Hokkaido University Collection of Scholarly and Academic Papers : HUSCAP

Manuscript number: CC/2003/022424, Journal of Composites for Construction, ASCE
Development of the Nonlinear Bond Stress-Slip Model of Fiber Reinforced
Plastics Sheet-concrete Interfaces with a Simple Method
By Jianguo Dai1, Tamon Ueda2 and Yasuhiko Sato3
Abstract In this paper, a new analytical method for defining the nonlinear bond stress-slip models of Fiber
Reinforced Plastics (FRP) sheet-concrete interfaces through pullout bond test is proposed. With this method, it is not
necessary to attach many strain gages on the FRP sheets for obtaining the strain distributions in FRP as well as the
local bond stresses and slips. Instead, the local interfacial bond stress-slip models can be simply derived from the
relationships between the pullout forces and loaded end slips. Based on a series of pullout tests, the bond stress-slip
models of FRP sheet-concrete interfaces, in which different FRP stiffness, FRP materials (Carbon FRP, Aramid FRP,
Glass FRP), and adhesives are used, have been derived. Only two parameters, the interfacial fracture energy and
interfacial ductility index, which can take into account the effects of all interfacial components, are necessary in
these models. Comparisons between analytical results and experimental ones show good accordance, indicating the
reliability of the proposed method and the proposed bond stress-slip models.
Keywords: Fiber Reinforced Plastics, Concrete, Adhesives, Interface shear, Bond Stress, Slip, Fracture Mechanics
INTRODUCTION
Bonding FRP sheets externally to strengthen the existing deficient reinforced concrete (RC) structures has become a
popular technology in the past decade. With the rapid development of this new technology, many issues related to the
structural performances of FRP strengthened RC elements have been studied. Among them the study on the
interfacial bond between the externally bonded FRP sheets and concrete may be the most fundamental one because it
plays a key role on the composite performances and the durability of RC structures after being strengthened. In order
1 Post-doctoral Fellow, Division of Structural and Geotechnical Engineering, Hokkaido University, Sapporo,
060-8628, Japan, Email: [email protected] 2 Assoc. Prof., Division of Structural and Geotechnical Engineering, Hokkaido University, Sapporo, 060-8628, Japan,
Email: [email protected] 3 Research Associate, Division of Structural and Geotechnical Engineering, Hokkaido University, Sapporo, 060-8628,
Japan, Email: [email protected]
1

to evaluate the interfacial bond mechanisms quantitatively and carry out numerical simulation for FRP sheets
strengthened RC structures, defining an accurate bond stress-slip (τ~s) relationship has become a main task among
the bond issues studied in the past. The conventional way of finding a τ~s relationship for FRP sheets bonded to
concrete depends on the strain distributions of FRP and local bond stresses measured by many strain gages mounted
on FRP sheets. However, it is difficult for us to apply this way for FRP sheet-concrete interfaces because of the
difficulty in arranging many gages in a short effective load transfer length. The highly scatter nature of local τ~s
relationships is another difficulty we face. Particularly, local bending of FRP sheets whose bending stiffness is small
introduces significant bending strains in FRP and coarse aggregates in a concrete surface layer are causes of the
scatter. Therefore, the objectives of this study are as follows:
1. To develop a simple but rigorous analytical way to derive the local τ~s relationship based on the
relationship between the pullout loads and slips at the loaded end in a pullout test rather than the
observations on the strain distributions of FRP sheets and local bond stress behaviors.
2. To propose the nonlinear interfacial τ~s relationships for FRP sheet-concrete interfaces based on the
experimental studies and the proposed method, in which the effects of all interfacial materials including
concrete, FRP, and adhesive layer can be taken into account.
LITERATURE REVIEW
A fairly large amount of bond tests for the FRP sheet-concrete interfaces under shear have been carried out in the
past. Test methods include single lap pullout test method (Chajes et al. 1996, Täljsten et al. 1997, Bizindavyi et al.
1999), double lap pull-out bond tests (Nakaba et al. 2001, Yoshizawa et al. 2000, Sato et al. 2000, Brosens and
Gemert 1997, Sato et al. 1997), shear bending tests (Leung 2001, Lorenzis et al. 2001), and bond tests for the critical
strain energy release rate (Karbhari and Engineer 1996, Fukuzawa et al. 1997). Through those experimental studies,
the bond mechanisms of FRP sheet-concrete interfaces have been clarified in the following aspects:
(a) Bond strength: The bond strength of FRP sheet-concrete interfaces has been studied most intensively. The FRP
sheet-concrete interface fails mostly at a thin layer beneath the concrete surface. As a result, the concrete surface
condition and strength are critical factors affecting the interfacial bond strength. The concrete surface treatment
methods have been studied experimentally (Chajes et al. 1996) and quantified in details by using 3D profile method
to evaluate the concrete surface roughness index (Mitsui et al. 2000). At present sandblasting is the most common
2

surface treating method that is being adopted in many researches and accepted in practical sites. Chajes et al. (1996),
Horiguchi (1997) and Sato et al. (2000) studied the effects of concrete strength fc’ and concluded that the average
interface bond strengths, which are the ultimate pull-out forces divided by bond areas between FRP sheets and
concrete, are linearly proportional to fc’1/2, fc’2/3, and fc’1/5respectively.
Besides the concrete property, the FRP and adhesive properties affect the interface bond strength as well. In general,
using higher FRP stiffness (Brosens and Gemert 1997, Bizindavyi et al. 1999, Yoshizawa et al. 2000, Lorenzis et al.
2001, Nakaba et al. 2001) and softer adhesives (Nishida et al. 1999, Dai et al. 2002) can increase the average bond
strength. Chen and Teng (2001) reviewed the current models for predicting the bond strength of FRP sheet-concrete
interface with different bond lengths. They classified all the models into three categories: empirical models based
directly on the regression of test data, model based on fracture mechanics, and models meant directly for design
purpose, which generally make use of some simple assumptions.
(b) Interfacial fracture energy: The interfacial fracture energy Gf, which is the area underneath the interfacial bond
stress-slip curve, is an important parameter for the bond characteristics. Based on different types of interfacial bond
stress-slip relationships, Yuan et al. (2001) proved that the maximum interfacial bond force can be expressed as a
function of the Gf and FRP stiffness (elastic modulus×thickness). Due to the clear physical meaning of the Gf, it is
very useful to apply it in numerical analysis for deriving bond strength and anchorage length models as well as for
clarifying the debonding failure mechanisms of FRP sheet-concrete interfaces in more comprehensive ways (Yin and
Wu 1999, Wu and Yin 2002). The Gf is usually expressed as a function of concrete tensile strength (Brosens and
Gemert 1999). However, the effects of adhesive layer on the Gf have been hardly reported.
(c) Effective bond length: There exists an active bonding zone named as the effective bond length Le, along which
most of the interfacial load is transferred between FRP sheets and concrete. When the bond length of FRP
sheet-concrete interfaces exceeds the Le, the bond strength will not increase significantly any longer. With a few
exceptions (Maeda et al. 1997), it was reported that the effective bond length increases with the stiffness of FRP
sheets. Nevertheless, due to the different definitions given by different researchers and the different materials used in
their tests, the effective bond length was reported in a fairly big range, such as 45 mm (Sato et al. 1997), 75 mm
(Miller and Nanni 1999), 93 mm (Lorenzis et al. 2001), 100 mm (Ueda et al. 1999), 63.5~134.5 mm (Nakaba et al.
2001), and 275 mm (Brosens and Gemert 1997). Yuan et al. (2001) gave a theoretical expression for the effective
bond length (defined as the bond length undertaking the 97% of whole interfacial load) based on the assumed
3

interfacial fracture energy and interfacial bilinear τ~s relationship.
(d) Bond stress~slip (τ~s) relationship: As the most fundamental constitutive laws that characterize the bond of FRP
sheet-concrete interfaces, several empirical τ~s relationships have been proposed as follows:
1. Elasto-plastic model by Sato et al. (1997) and Lorenzis et al. (2001);
2. Bilinear model based on the interfacial fracture energy Gf (Yoshizawa et al. 2000).
3. Model based on Popovic’s expression by Nakaba et al. (2001).
4. Shear softening model by Sato et al. (2000).
Above-mentioned models configure the shapes of the τ~s relationships in different ways (see the comparison in
Fig. 1). The concrete strength is assumed as a constant value 35MPa for all models shown in Fig. 1 for the
comparing purpose. Although the elastic modulus of the adhesives in those studies for model developing are
similar, it can be seen that fairly big differences exist among those models. Those differences may be due to the
dissimilar interfacial material properties (e.g. FRP stiffness) or the bonding skills (the deviations of concrete
surface conditions or the adhesive’s thickness) applied in different studies. Besides that, the fairly big scattering
among the experimentally observed bond stress-slip relationships at different interfacial locations (to be shown
in the next section) may be another factor, which affects the decisions on the shapes of the τ~s relationships and
the calibration of the needed empirical parameters. The FRP sheet-concrete interface is composed of FRP sheets,
adhesive layer, and concrete, each one of which affects the interfacial mechanical properties. To consider these
effects, calibrating many empirical parameters in an unknown τ~s relationship without consideration of their
corresponding physical meanings is a very complex task. Up to now it can be said that the interfacial bond
mechanisms between FRP sheets and concrete have been clarified qualitatively in some extent. However, in
order to carry out accurate quantitative simulation for the FRP sheet-concrete interfaces, the way of determining
a τ~s relationship should be further improved.
EXPERIMENTAL OUTLINE
A single-lap pullout test setup (see Fig. 2) including: a thick steel basement fixed to strong floor through four
prestressed high strength bolts, a steel box connected to the steel basement through two lines of steel bolts, concrete
block with the size of 400×200×400 mm, FRP sheets externally bonded to the concrete block, and connectors
between the end of the FRP sheets and actuator, was applied in the study. In the concrete block, four plastic pipes
4

with diameter of 30 mm were pre-set vertically, so that the concrete block could be fixed on the steel box
symmetrically and stably through four steel bolts. The connectors between the FRP sheets and the actuator contain
two directional hinges, ensuring that the end of the FRP sheets can be rotated freely to avoid bending or torsion
effect.
The width of FRP sheets is 100 mm. In order to exert uniform tensile forces to the FRP sheets, two steel plates were
adhered to both sides of FRP sheets. Two additional bolts were used to enhance the bond between FRP sheets and
steel plates to avoid the bond failure in FRP sheet-steel plate interfaces ahead of that in FRP sheet-concrete interfaces.
The attached area of FRP sheets to steel plates is 100×100 mm. In order to avoid local damage of the concrete block,
an un-bonded length (50 mm) was set by using vinylon tape to separate the concrete surface from the FRP sheets. It
is very important to keep the midline of the FRP sheets vertically, on which the center of actuator is located. To
achieve this purpose, the location of the concrete block was carefully adjusted on the steel box.
During the pullout test procedures, the displacement control loading system was applied. LVDT transducers were set
at both the loaded and free ends of the bond area to obtain the relative slips between the FRP sheets and concrete.
The load cell and the transducers were connected to the data logger then the load and slip signals were recorded
simultaneously by a computer.
Four types of adhesives (including one type of primer) and three types of FRP sheets were applied in the study. The
mechanical properties of adhesives and FRP sheets and the information of manufacturers are shown in Table 1 and
Table 2 respectively. Due to the obvious non-linearity when the adhesive becomes softer (see the tensile stress-strain
relationships of adhesives in Fig. 3), the initial elastic modulus adhesives is defined as the average secant modulus
while the strain lies between 0.0005 and 0.0025 (JIS 1995). Both the elasticity modulus and thickness of bond layer
affect the interfacial bond properties (Lee et al. 1999, Tripi et al. 2000, Dai et al. 2002). Therefore, the property of
bond layer can be quantified using its shear stiffness (shear modulus/thickness) as follows:
padadp
adp
a
a
tGtGGG
tG
+
⋅= ,
)1(2 p
pp
EG
γ+= ,
)1(2 ad
adad
EG
γ+= (1)
where: Ga is the shear modulus of adhesive layer; ta is the thickness of adhesive layer; EP , Ead ; tp , tad and γp, γad
are the elasticity modulus, thickness and Poisson ratio of primer and adhesive layer respectively. As indicated in Eq.1,
the shear stiffness of bond layer is that of a combined layer of primer and adhesive.
To obtain the accurate geometrical information about the adhesive layer, the FRP sheets attached with failed concrete
5
were processed after the pullout tests. Then the thickness of every bonding layer (primer and adhesive layer) was
measured under a microscope (see Fig. 4). After that the shear stiffness of adhesives could be calculated through
Eq.1 (see the values in Table 3). Ready-mixed concrete with the tested compressive strength of 35 MPa was prepared
in order to keep a same strength for all specimens. Moreover, in order to observe the whole peeling-off procedures,
the bond length of 330 mm was applied.
Wet-lay-up bonding system was applied in the study. However, to avoid the decreasing of the tensile strength of FRP
sheets induced by the resin matrix with low elasticity modulus (e.g. CN-100), the resins used in FRP layers and the
adhesive layers were different (see Fig. 4 ). Adhesive FR-E3P, which is commercially used as the resin matrix and
the bonding adhesive of carbon fiber sheets, was applied as the resin matrix of FRP in all specimens. The primer
FP-NS was used in the bonding procedures of all specimens. After the adhesive bond layer was cured for 24 hours,
resin FR-E3P was used to form FRP layers as shown in Fig. 4. The details of the specimens can be found in Table 3.
ANALYSIS ON TEST RESULTS
Description of the Methodology
Generally, in order to obtain the local bond stress-slip relationships of FRP sheet-concrete interfaces from the direct
pullout bond test, many strain gages should be attached with a small interval (10 mm~20 mm) on the surfaces of FRP
sheets (JCI TC952 1998). As a result, the strain distribution of FRP sheets along the interfaces corresponding to
every step load can be obtained. Fig. 5 shows the sketch of a single lap pullout bond test setup. Supposed that the
interval of gages is a constant value Δx, the local bond stress can be obtained using the following expression:
xtE iiff
i Δ
−= − )( 1εε
τ (2)
where τi is the average interfacial bond stress in the section i; εi and εi-1 are the strain values of the i th and i-1 th
gages arranged on a FRP sheets respectively; Ef and tf are the elastic modulus and thickness of the FRP sheets
respectively.
The local slip is caused by the strain difference between FRP sheets and concrete. The strain of concrete can be
neglected and the free end slip can be regarded approximately as zero in the case of using a long bond length. So the
local slip can be expressed as:
6

)2(2
1
10 i
i
jji
xs εεε ++Δ
= ∑−
=
(3)
where si is the local slip between FRP sheets and concrete at the section i; ε0 is the strain of FRP sheets at the free
end of bond area. εj (j=1,i) is the strain value of the j th gage arranged on the FRP sheets.
Fig. 6 is a paradigm of obtained strain distributions of specimen CR1L1 (with adhesive FR-E3P and one layer of
FRP sheet) in the authors’ previous study (Dai et al. 2002). Upon Eq.2 and Eq.3, the local τ~s relationships at
different locations from the loaded point in a pullout test can be derived as shown in Fig. 7. Obviously, fairly big
irregular differences among those τ~s relationships are observed at different interfacial locations. The similar
experimental observations can be found in other literatures (Yoshizawa et al. 2000, Nakaba et al. 2001, Sato et al.
2000). This fairly big variation probably is the main reason why different shapes of bond stress-slip relationships
were proposed or why researchers prefer a simplified bilinear bond stress-slip model even though numerous of
pullout bond tests for FRP sheets-concrete interfaces have indicated that more reasonable configurations are needed.
All the factors such as the distribution of fine and coarse aggregates along the concrete surface, the concrete volume
attached to FRP sheets after the initial damage of concrete, and the local bending of FRP sheets or the local
mixed-mode failure of concrete can contribute to the final scattering. It is not convincing to pick up one of these
local τ~s relationships to represent the overall one. In order to clarify the local interfacial bond mechanisms exactly,
simulating the bonding among coarse aggregates, mortars, adhesives and FRP sheets at a microscopic level may be a
more precise way. However, it is much more difficult to get the microscopic-level constitutive model of the interface.
The authors (Dai and Ueda 2003) proposed a back calculation method, which tried to minimize the differences
between the experimentally observed strain distributions and the analytical ones, to calibrate the unknown
parameters needed for an assumed bond-stress slip curve optimally. Nevertheless, the analytical results on the
unknown parameters rely much on the selected shape of the τ~s relationships. In the following part, an improved
method on how to obtain interfacial τ~s relationships without the necessity to record the strain distributions of FRP
sheets is to be discussed.
At any location of an FRP sheet-concrete bond interface under the boundary condition of zero free end slip, which
can be approximately attained using a longer bond length, there exists a unique τ~s relationship and a unique
relationship between the strain of FRP sheets and interfacial slip (Shima et al. 1987). The latter can be expressed as
follows:
7

)(sf=ε (4)
where ε is the strain of FRP sheets at any location; s is the corresponding slip at that location.
A first order differential calculus of ε to x yields the following equation:
)()()()( sfds
sdfds
sdfdxds
dssdf
dxd
⋅=⋅=⋅= εε (5)
Therefore, for FRP sheet-concrete interfaces, the interfacial bond stress can be expressed as:
)()( sfds
sdftEdxdtE ffff ⋅⋅=⋅=ετ (6)
where Eftf is the stiffness of FRP sheets (elastic modulus×thickness).
It can be seen from Eq.4 to Eq.6 that the bond stress-slip relationship can be determined if the relationship between
local strain of FRP sheets and local slip is defined. During the pullout test, the pullout forces and the slips at the
loaded end can be measured accurately through load cell and displacement transducer. As a result, the relationship
between the strains of FRP sheets and the slips at the loaded end, in other word, the function of f(s) can be obtained
directly from the simple pullout tests.
Fig. 8.a to Fig. 8.e are the experimentally observed relationships between the strains of FRP sheets and the interfacial
slips at the loaded ends of FRP sheet-concrete interfaces, which include cases of different FRP stiffnesses, different
adhesive types and different types of FRP materials. It is found that the exponential expression (see Eq.7) can fit the
experimental results very well (the values of correlative factors R2 between the strains in FRP sheets and the slips at
loaded ends lie between 0.975 and 0.997 for all specimens as shown in Table 3).
))exp(1()( BsAsf −−==ε (7)
where A and B are experimental parameters (the values for each specimen are given in Table 3).
Therefore:
)exp(/)( BsABdssdf −= (8)
Once Eq.7 and Eq.8 are substituted into Eq.6, the bond stress-slip relationship can be obtained as follows:
))exp(1)(exp(2 BsBstBEA ff −−−=τ (9)
The interfacial fracture energy Gf is defined as:
8

∫∞
=0
dsG f τ (10)
By substituting Eq.9 into Eq.10, the following equations can be obtained:
fff tEAG 2
21
= (11)
Then the following expression for A is obtained:
ff
f
tEG
A2
= (12)
For FRP sheets bonded to concrete under pullout load, the theoretical maximum interfacial pullout force can be
expressed as follows:
AtEbBsAtEbtEbP fffsffffff =−−==∞→
))exp(1(limmaxmax ε (13)
where bf is the bond width of FRP sheets with concrete; and εmax is the maximum strain of FRP sheets corresponding
to the maximum pullout force.
The comparisons between the calculated maximum pullout forces based on the regressed A (see Eq.13) and the
experimental ones are shown in Fig. 9. It can be seen that good agreement can be reached. The agreement implies
that the theoretical maximum interfacial pullout force predicted based on the assumption of zero end slip boundary
condition can be reached through using the bond length of 330mm in the experiment
With the substitution of Eq.12, Eq.13 can become:
fffffff GtEbAtEbP 2max == (14)
Based on energy method or force equilibrium method, Eq.14 was derived by many researchers (Täljsten et al. 1997,
Yuan et al. 2001) and now is applied widely in predicting the ultimate bond forces of FRP sheet-concrete interfaces.
And also, through experimental study, the authors found that Eq.14 is applicable for all types of FRP materials
regardless of the differences in their elastic modulus (Dai et al. 2002, Dai and Ueda 2003).
The shear stress flows can spread to the concrete in the vicinity of both sides of FRP sheets if the FRP sheets are
attached to concrete whose width is wider than theirs. That makes the effective interfacial contact areas wider than
the real ones. The authors observed the effects of bond width of FRP sheets (from 1 cm to 20 cm) on the average
bond strength in the previous studies (Sato et al. 2000). The experimentally obtained bond force per unit width of
9

FRP sheets (Pmax/bf) is generally high when the width of FRP sheets used in the tests is narrow. When the bond width
exceeds 10 cm, the value of Pmax/bf becomes almost constant. An additional width 2Δbf (Δbf is taken as 3.7 mm) can
be added to the original bond width bf for calculating the interfacial bond strength and quantifying the bond width’s
effects ( Sato et al., 2000). Here a same 2Δbf is introduced into Eq.14. Through that the back-calculated Gf from
obtained Pmax will not depend on the FRP sheet’ width used in the test. Therefore, Eq.14 can be modified as follows:
fffff GtEbbP 2)2(max Δ+= (15)
From Eq.15 it can be known that the interfacial load carrying capacity is determined by the interfacial fracture
energy and FRP stiffness. Increasing both the fracture energy and FRP stiffness (by increasing either the amount or
elastic modulus of FRP materials) can improve the ultimate interfacial load carrying capacity. Similarly, the usable
strain (strength) of FRP sheets is determined by the interfacial fracture energy and the FRP stiffness as well (see
Eq.12). High interfacial fracture energy can increase the usable strength or strength efficiency of FRP sheets;
however, high FRP stiffness cannot. Therefore, in order to utilize the FRP materials more efficiently in consideration
of their decreasing but still higher costs, besides ensuring the concrete surface quality, more effects should be put on
to find optimum adhesive layer to improve the interfacial fracture energy.
Discussion on the Interfacial Fracture Energy and the Bond Stress-slip Relationships
With Eq.9 and Eq.12, the interfacial τ~s relationship can be rewritten as:
))2exp()(exp(2 BsBsBG f −−−=τ (16)
in which only two parameters, the interfacial fracture energy Gf and another interfacial material constant B are
needed for defining the bond stress-slip relationship.
Let,
0))2exp(2)(exp(2/ 2 =−−−−= BsBsGBdsd fτ (17)
The slip smax corresponding to the maximum bond stress τmax , at which dτ/ds=0, can be determined as follows:
BBs /693.0/2lnmax == (18)
By substituting Eq.18 into Eq.16, the maximum bond stress τmax can be obtained as well:
fBG5.0max =τ (19)
For every specimen in the present study, the material constant B and the interfacial fracture energy Gf can be
10

obtained according to the processes proposed in the previous section (see the results in Table 3). Then the values of
τmax and smax are calculated and shown in Table 3. For the normal adhesive (FRP-E3P), Nakaba et al. (2001)
observed experimentally that the values of smax lie between 0.052 and 0.087 mm, with which the analytical results
(0.053~0.077 mm) based on the present method show good agreement. Based on the above-mentioned process, all
the found bond stress-slip relationships derived from pullout tests are shown in Fig. 10. When the FRP fracture
failure happens, the obtained τ~s relationships are excluded because the peeling off process is interrupted and the
interfacial fracture energy cannot be calculated correctly. To get a unified τ~s model in consideration of the effects of
all interfacial materials, the following paragraphs give results of regression analysis for the two important parameters
Gf and B based on experimental results.
The interfacial fracture energy Gf is affected by the properties of concrete, adhesives and the FRP stiffness. It has
been mentioned that, in the case of long bond lengths, Gf can be calculated based on either the value of A obtained
from the regression analysis of the FRP sheet strain-slip curves at loaded ends (see Eq.11) or directly from the
ultimate pullout forces (see Eq.14). Therefore, the authors collected more experimental data of the ultimate pullout
forces published by other researchers (Nakaba et al. 2001, Yoshizawa et al. 2000) to evaluate the effects of concrete
strength and FRP stiffness on Gf based on more experimental databases. Only those data with bond lengths
exceeding 300mm has been selected. Through Eq.15 the effects of bond width on the Gf can be eliminated. Fig. 11.a,
Fig. 11.b and Fig. 11.c show the effects of concrete strength, FRP stiffness and adhesive properties on the Gf
respectively. Since the other researchers did not study the effects of adhesives, Fig. 11.c only shows the test results
of the present study. It can be found that the shear stiffness of adhesive layer affects the interfacial fracture energy
most (see Fig. 11.c). The effect of the concrete strength is much less than that of the adhesive (see Fig. 11.a) but
slightly greater than that of the FRP stiffness (see Fig. 11.b). The lower shear stiffness adhesives can improve the
interfacial fracture energy significantly due to their good toughness (Dai et al. 2002,Dai and Ueda 2003). Through
regressing, the expression for the interfacial fracture energy can be obtained as follows:
023.0236.0352.0 )()/(446.0 ffcaaf tEftGG −= (20)
The values of another interfacial parameter B are obtained from the regression analysis of the FRP sheet strain-slip
curves at the loaded end of each specimen in the present study. The effects of FRP stiffness and adhesives on B are
shown in Fig. 12.a and Fig. 12.b respectively. It can be seen that B increases insignificantly with the FRP stiffness
(see Fig. 12.a) whereas increases remarkably with the shear stiffness of adhesive layer (see Fig. 12.b). Through a
11

similar regressing way, the expression for B can be obtained as follows:
833.0108.0 )/()(846.6 aaff tGtEB = (21)
Therefore, the τ~s relationships of FRP sheet-concrete interfaces with different properties of FRP, adhesives and
concrete strength can be determined through the two calibrated parameters Gf (Eq.20) and B (Eq.21).
Fig. 13.a shows the effects of FRP stiffness on the τ~s relationships. It can be seen that both the initial stiffness of
the τ~s relationships and the maximum bond stresses increase slightly with the increasing of FRP stiffness. Similar
effects of FRP stiffness on the maximum bond stress were included in the models proposed by Sato et al. (2000) and
Lorenzis et al. (2001) in different extent. Tripi et al. (2000) also found that relative displacements between the FRP
sheets and concrete are slightly affected by the elastic modulus of the sheets in their moiré interferometric analysis.
The effects of FRP stiffness on the interfacial stiffness and maximum bond stress may be caused by the different
strain condition in the thin concrete layer next to the adhesives. In the case of using same adhesives, higher FRP
stiffness brings lower strain level in the concrete.
The dependency of Gf and B on the FRP stiffness exists but is rather small (see Fig. 11.b and Fig. 12.a). Therefore, in
the case of using common adhesives such as FR-E3P, the expressions Gf=0.514fc’0.236 and B=10.4mm-1 can be
obtained for the τ~s relationship (Eq.16) by averaging all experimental values without consideration of the FRP
stiffness’ effects and assuming that the shear stiffness of the adhesive is the same (see Fig. 10.a).
Fig. 13.b gives a group of τ~s relationships with different shear stiffness of adhesives but the same FRP stiffness
(50.6 kN/mm) and concrete strength (35MPa). The comparisons between the experimental τ~s relationships and
predicted ones in cases of using adhesives other than FR-E3P are shown in Fig. 10.b and Fig. 10.c. It is obvious that
the maximum interfacial bond stress increases with the shear stiffness of adhesives. When the FRP stiffness is same,
this increase is caused by high strain gradients in FRP sheets in the case of using high modulus adhesives (Nishida et
al. 1999, Dai et al. 2002). In the present model, the maximum bond stress decreases with the shear stiffness of
adhesive due to the significant decreasing B, although the interfacial fracture energy Gf can increase with the
decreasing of adhesives’ shear stiffness (see Eq.19).
In fact, the value B can be regarded as an index of ductility of the τ~s relationships, which is mainly affected by the
adhesive properties. Better ductility means slower softening after the peak bond stress. Smaller B means lower initial
interfacial stiffness but better interfacial ductility and vice versa. In other words, it is difficult to obtain higher
12

interfacial stiffness and ductility simultaneously. This shortcoming is caused by the inherent properties of adhesives.
However, it gives us a possibility to optimize the interface design according to the desirable structural performances.
Fig. 14 gives comparisons of the ultimate interfacial loads predicted by the present proposed τ~s model and the
experimental data selected from the pullout tests of FRP sheet-concrete interfaces with bond lengths exceeding 30cm
(Yoshizawa et al. 2000, Nakaba et al. 2001 and present study). The reasonable scattering of all data around the line of
Pana./Pexp.=1.0 indicates the good accuracy of the present models on predicting the bond capacity of FRP
sheet-concrete interfaces. As discussed above, the ultimate interfacial load is only related to FRP stiffness and the Gf
(the area under the τ~s relationship) regardless of the shape of the τ~s relationship. Therefore, it is a good choice to
use Gf, which can be back-calculated from many published ultimate interfacial loads, as a control parameter when
configuring any unknown τ~s relationship. The use of Gf at least can ensure the accuracy of predicting the ultimate
interface bond capacity in the case of long bond length. However, the issues of predicting the initial interfacial
peeling, evaluating the interfacial load-deformation behaviors or determining the effective anchorage length depend
on not only the use of Gf, but also the accurate configuration of τ~s relationship. Based on the present and other
researchers’ τ~s relationships as shown in Fig. 1, Fig. 15 gives an example of comparing the predicted strain-slip
relationships at the loaded end of a FRP sheet-concrete interface, of which the FRP stiffness, concrete strength and
adhesive stiffness are 50.6 kN/mm, 35 MPa and 1.14 GPa/mm (FR-E3P) respectively. It can be seen that the
present model and Nakaba’s model give good prediction on the whole period of pullout test (before and after initial
peeling). Nakaba’s model gives slight underestimation on the initial interfacial stiffness. Yoshizawa’s simplified
bilinear model gives a good prediction on the initial interfacial stiffness but shows a big deviation when the strain of
FRP becomes higher. Sato’s model gives a good prediction on the maximum strain but shows a big deviation during
initial ascending period. The assumption of elasto-plastic bilinear τ~s relationships (Sato (Yuichi) and Lorenzis)
shows comparatively less accuracy.
CONCLUSIONS:
Based on the experimental and analytical studies, the following conclusions can be drawn up:
1. A simple method to determine the local bond stress-slip relationships of FRP sheet-concrete interfaces is
developed. With this method, it is not necessary to put many gages on the surface of sheets as
conventional ways applied in previous studies or recommended in the present bond test specifications to
13

obtain the local bond stress-slip relationships. Instead, they can be simply derived from the pullout force ~
loaded end slip curves, which can be measured accurately during the pullout bond tests.
2. Based on the proposed method and the experimental studies, the bond stress-slip relationships for FRP
sheet-concrete interfaces are proposed. Only two parameters, which are the interfacial fracture energy Gf
and another constant called as interfacial ductility index B are needed in the models. The two parameters, Gf
and B affect the ultimate interfacial load carrying capacity and the configuration of the bond stress-slip
relationship respectively. With these two parameters, the effects of all interfacial materials can be taken into
account.
3. Experimental results show that the interfacial fracture energy is hardly affected by FRP stiffness, but
affected by the mechanical property of adhesives most and then by the concrete strength. With the
decreasing of the shear stiffness of adhesive, the interfacial fracture energy and the interfacial ductility can
be improved although the maximum interfacial bond stress decreases. That leads to the improvement of the
interfacial load transfer capacity. The FRP stiffness has a slight effect on the bond stress-slip relationships.
The maximum bond stress increases and the interfacial ductility decreases slightly with the increasing of the
FRP stiffness. However, in comparison with the effects of adhesives and concrete, the effects of FRP
stiffness on the bond stress-slip relationships are insignificant.
RECOMMENDATION FOR FUTURE STUDY
Concrete properties affect the interfacial bond behaviors by both its surface condition and strength. The dependency
of interfacial ductility factor B on the concrete strength needs to be observed in future study. In addition, concrete
surface treatment in laboratory may be different from that in the field. The problem on how the concrete surface
condition affects the interfacial parameters of Gf and B needs to be solved quantitatively based on more solid
databases.
ACKNOWLEDGEMENTS
The authors would like to express their sincere thanks to Mr. Makoto Saito and Mr. Akira Kobayashi of Nippon Steel
Composite Co. Ltd. for their kind offering of experimental materials.
14

REFERENCES
Bizindavyi, L. and Neale, K. W. (1999). “Transfer Length and Bond Strength for Composites Bonded to Concrete.”
Journal of Composites for Construction, ASCE, 3(4), 153-160.
Brosens, K. and Gemert, D. Van. (1997). “Anchorage Stresses between Concrete and Carbon Fiber Reinforced
Laminates.” Non-Metallic (FRP) Reinforcement for Concrete Structures, Proceedings of Third International
Symposium, Vol.1, 271-278.
Brosens, K. and Gemert, D. Van. (1999). “Anchorage Design for Externally Bonded Carbon Fiber Reinforced
Polymer Laminates.” ACI, SP 188-56, 635-641.
Chajes, M. J., Finch, William. W., Januszka, T. F. and Thomson, T. A. (1996). “Bond and Force Transfer of
Composite Material Plates Bonded to concrete.” ACI Structural Journal, 93(2), 208-217.
Chen, J.F. and Teng, J.G. (2001). “Anchorage Strength Models for FRP and Steel Plates Bonded to Concrete.”
Journal of Structural Engineering, Vol. 127, No.7, 784-791.
Dai, J.G., Sato, Y. and Ueda, T. (2002). “Improving the Load Transfer and Effective Bond Length for FRP
Composites Bonded to Concrete.” Proceedings of the Japan Concrete Institute, Vol.24, 1423-1428.
Dai, J.G. and Ueda, T. (2003). “Local Bond Stress Slip Relations for FRP Composites-concrete Interfaces.”
Proceedings of FRPRCS-6, Edited by Tan, K. H., Vol. l, 143-152.
Fukuzawa, K., Numao, T., Wu, Z., Yoshizawa, H., and Mitsui, M. (1997). “Critical Strain Energy Release Rate of
Interface Debonding Between Carbon Fiber Sheet and Mortar.” Non-Metallic (FRP) Reinforcement for Concrete
Structures, Proceedings of Third International Symposium, Vol.1, 295-301.
Horiguchi, T. (1997). “Effect of Test Methods and Quality of Concrete on bond strength of CFRP Sheet.”
Non-Metallic (FRP) Reinforcement for Concrete Structures, Proceedings of Third International Symposium, Vol.1,
265-270.
JCI TC 952 on Continuous Fiber Reinforced Concrete. (1998). “Technical Report on Continuous Fiber Reinforced
Concrete.” Japan Concrete Institute (JCI).
JIS K7113 (1995). “Testing Method for Tensile Properties of Plastics.”
Karbhari, V.M. and Engineer, M. (1996). “Investigation of Bond between Concrete and Composites: Use of a Peeling
Test.” Journal of Reinforced Plastics and Composites, Vol.15, 208-227.
15

Lee, Y. J., Boothby T. E., Bakis, C.E., and Nanni, A. (1999). “Slip Modulus of FRP Sheets Bonded to Concrete.”
Journal of Composites for Construction, ASCE, 3(4), 161-167.
Leung, C. K. Y. (2001). “Delamination Failure in Concrete Beams Retrofitted with a Bonded Plate.” Journal of
Materials in Civil Engineering, ASCE, 13(2), 106-113.
Lorenzis, L. De., Miller, B., and Nanni, A. (2001). “Bond of Fiber-Reinforced Polymer Laminates to Concrete.” ACI
Material Journal, 98(3), 256-264.
Maeda, T., Asano, Y., Sato, Y., Ueda, T., and Kakuta, Y. (1997). “A Study on Bond Mechanism of Carbon Fiber
Sheet.” Non-Metallic (FRP) Reinforcement for Concrete Structures, Proceedings of Third International Symposium,
Vol.1, 279-286.
Mitsui, M., Fukuzawa, K., Numao, T. and Fuda, I. (2000). “Relations between Surface Roughness Indexes and Bond
strength between CFRP sheets and Concrete.” Journal of Society Material Science. Japan, 49(6), 685-691 (In
Japanese).
Miller, B. and Nanni, A. (1999). “Bond between CFRP Sheets and Concrete.” Proc. of ASCE 5th Materials Congress,
Edited by L.C. Band, Cincinnati, OH, May 10-12, 240-247.
Nakaba, K., Kanakubo, T., Furuta, T., and Yoshizawa, H. (2001). “Bond Behavior between Fiber-Reinforced
Polymer Laminates and Concrete.” ACI Structural Journal, 98(3), 359-167.
Nishida, H., Simomura, T., Kamiharako, A., and Maruyama, K. (1999). “Bond Behaviors between the FRP Sheets
and concrete.” Proceedings of JCI, 21(3), 1507-1511 (in Japanese).
Sato, Y. (Yuichi), Kimura, K., and Kobatake, Y. (1997). “Bond Behaviors between CFRP Sheet and Concrete.”
Journal of Structural Construction Engineering, AIJ, No.500, 75-82 (in Japanese).
Sato, Y., Asano, Y., and Ueda, T. (2000). “Fundamental Study on Bond Mechanism of Carbon Fiber Sheet.” Concrete
Library International, JSCE, No.37, June 2001, 97-115.
Shima, H., Chou, L., and Okamura, H. (1987). “Bond stress-slip-strain relationship of deformed bars embedded in
massive concrete.” Concrete Library International, JSCE, No.10, 79-94.
Täljsten, B. (1996). “Strengthening of Concrete Prisms Using the Plate-bonding Technique.” International Journal of
Fracture, 82, 253-266.
Täljsten, B. (1997). “Defining anchor lengths of steel and CFRP plates bonded to concrete.” International Journal of
Adhesion and Adhesives, 17(4), 319-327.
16

Tripi, J. M., Bakis, C. E., Boothby, T. E., and Nanni, A. (2000). “Deformation in Concrete with Externally CFRP
Sheet Reinforcement.” Journal of Composites for Construction, Vol. 4, No.2, 85-94.
Ueda, T., Sato, Y., and Asano, Y. (1999). “Experimental Study on Bond strength of Continuous Carbon Fiber Sheet.”
ACI, SP 188-37, 407-413.
Wu, Z. and Yin, J. (2002). “Numerical Analysis on Interfacial Fracture Mechanism of Externally FRP-Strengthened
Structural Members.” Journal of Materials, Conc. Struct. Pavements, JSCE, No.704/V-55, 257-270.
Yoshizawa, H., Wu, Z., Yuan, H., and Kanakubo, T. (2000). “Study on FRP-Concrete Interface Bond Performance.”
Transactions of Japanese Society of Civil Engineering, No.662/V-49, 105-119.
Yin, J. and Wu, Z. (1999). “Interface Crack Propagation in Fiber Reinforced Polymer-strengthened Concrete
Structures Using Nonlinear Fracture Mechanics.” ACI, SP 188-87, 1035-1047.
Yuan, H., Wu, Z., and Yoshizawa, H. (2001). “Theoretical Solutions on Interfacial Stress Transfer of Externally
Bonded Steel/Composite Plates.” J. Structural. Mech.Earthquake Eng. JSCE, 18(1), 27-39.
17

FIGURES:
Note: the figures at final size with desired reduction are provided in another document
Fig. 1 (17.78cm wide, suggest 50% reduction)
0 .0 0 .1 0 .2 0 .3 0 .4 0 .5 0 .60
1
2
3
4
5
6
7
8
E ft f= 2 5 .3 k N /m m
E ft f= 5 0 .6 k N /m m
τ(M
Pa)
S (m m )
L o re n z is e t a l.(2 0 0 1 ) N a k a b a e t a l.(2 0 0 1 ) Y o s h iz a w a e t a l.(2 0 0 0 ) S a to e t a l.(2 0 0 0 )
E ft f fro m 2 5 .3 to 7 5 .9 k N /m m S a to (Y u c h i) e t a l.(1 9 9 7 )
E ft f= 7 5 .9 k N /m m
18

Fig. 2 (17.78cm wide, suggest 50% reduction)
C o n c r e t e b lo c k
F R P s h e e t s
L o a d c e l l
H in g e s
S t e e l p la t e s
19
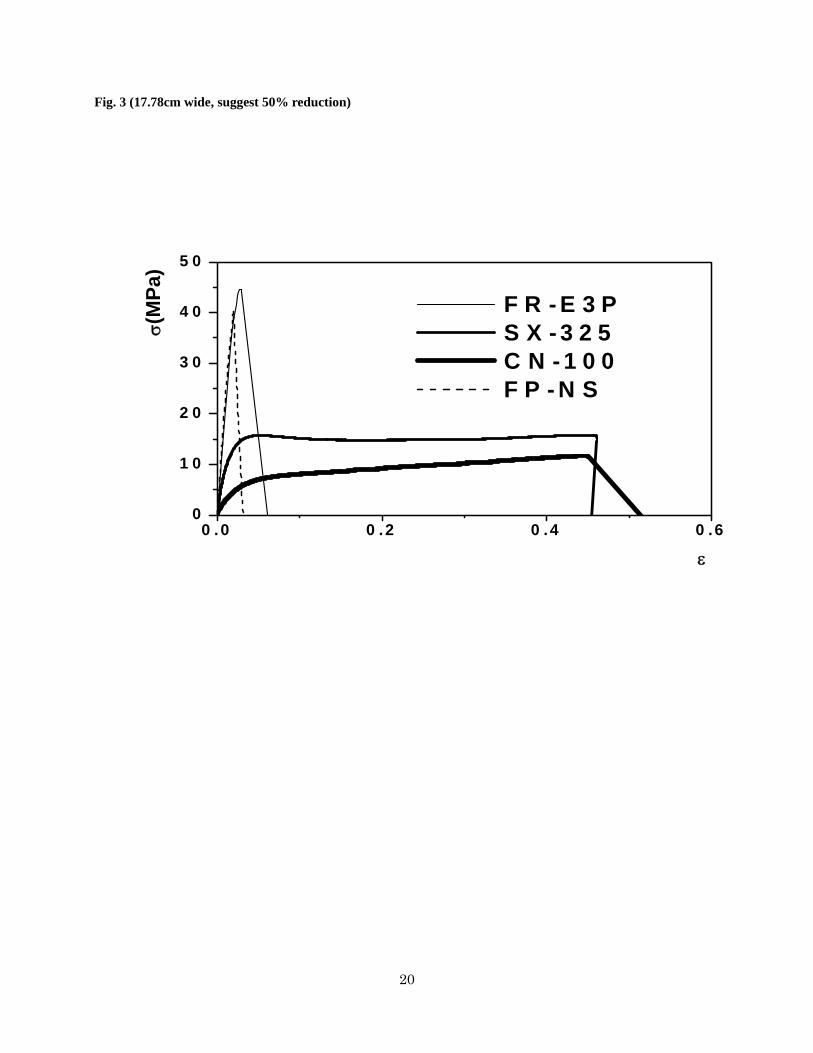
Fig. 3 (17.78cm wide, suggest 50% reduction)
0 .0 0 .2 0 .4 0 .60
1 0
2 0
3 0
4 0
5 0
F R - E 3 P S X - 3 2 5 C N - 1 0 0 F P - N S
σ(M
Pa)
ε
20

Fig. 4 (17.78cm wide, suggest 50% reduction)
Fiber layer
Resin matrix
Adhesive layer
Primer layer
Interlocking layer
Attached concrete
Bond layer
0.5m
m
21

Fig. 5 (17.78cm wide, suggest 50% reduction)
x
P
c o n c re te
L
P
0ε 1ε 2ε iε xΔ
22

Fig. 6 (17.78 wide, suggest 50% reduction)
0 50 100 150 200 250 300 350 4000
2000
4000
6000
8000
10000
Stra
in(1
0-6ε)
Location from loaded end(m m )
3 .6kN 6 .0kN 14 .4kN 19 .8kN 21 .0kN 23 .4kN 21 .0kN 24 .6kN
23

Fig. 7 (17.78cm wide, suggest 50% reduction)
0 .0 0 .2 0 .4 0 .6 0 .8 1 .00
5
10
15
20
25 0 .5cm fro m th e lo ad ed en d 1 .5cm 2 .5cm
3 .5cm 4 .5cm 5 .5cm 6 .5cm 7 .5cm 8 .5cm
9 .5cm 10 .5cm 11 .5cm
τ (M
Pa)
s (m m )
24
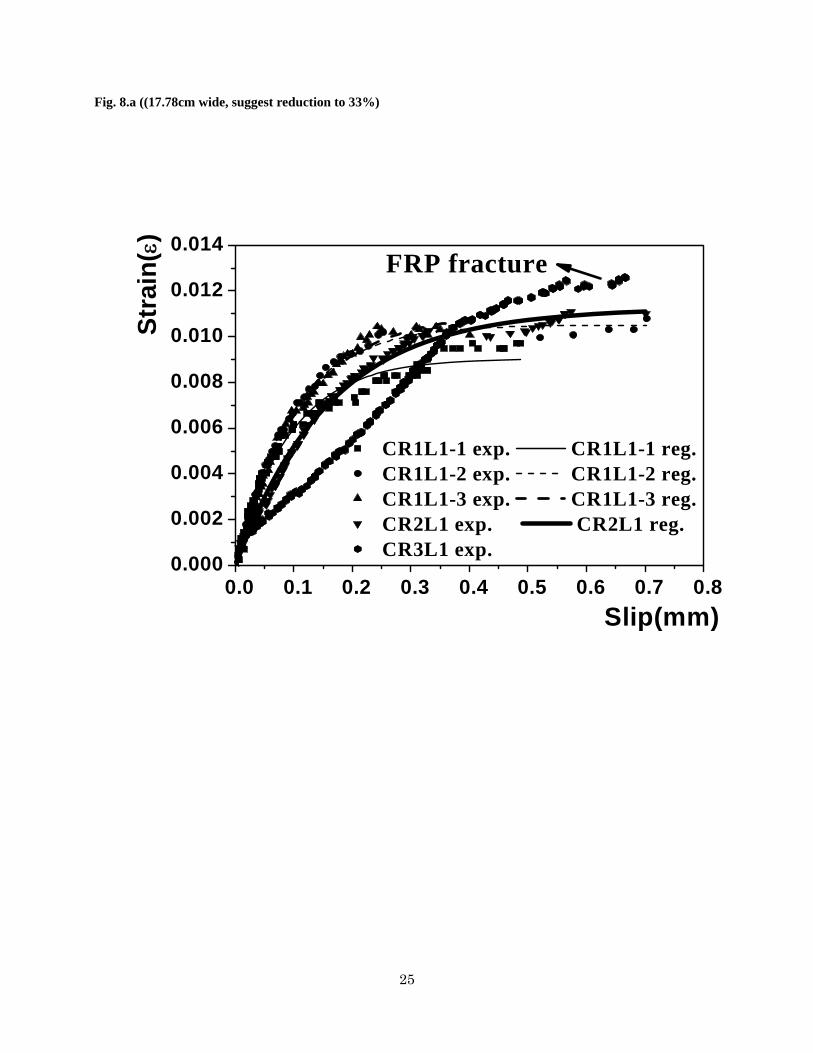
Fig. 8.a ((17.78cm wide, suggest reduction to 33%)
0.0 0.1 0.2 0.3 0.4 0.5 0.6 0.7 0.80.000
0.002
0.004
0.006
0.008
0.010
0.012
0.014
CR1L1-1 exp. CR1L1-1 reg.CR1L1-2 exp. CR1L1-2 reg.CR1L1-3 exp. CR1L1-3 reg.CR2L1 exp. CR2L1 reg.CR3L1 exp.
Stra
in(ε
)
Slip(mm)
FRP fracture
25

Fig. 8.b (17.78cm wide, suggest reduction to 33%)
0.0 0.1 0.2 0.3 0.4 0.5 0.6 0.7 0.8 0.9 1.00.0000.0010.0020.0030.0040.0050.0060.0070.0080.0090.010
CR1L2-1 exp. CR1L2-1 reg. CR1L2-2 exp. CR1L2-2 reg. CR1L2-3 exp. CR1L2-3 reg. CR2L2 exp. CR2L2 reg. CR3L2 exp. CR3L2 reg.
Stra
in(ε
)
Slip(mm)
26

Fig. 8.c ((17.78cm wide, suggest reduction to 33%)
0.0 0.2 0.4 0.6 0.8 1.0 1.2 1.4 1.6 1.80.000
0.001
0.002
0.003
0.004
0.005
0.006
0.007
0.008
CR1L3-1 exp. CR1L3-1 reg. CR1L3-2 exp. CR1L3-2 reg. CR1L3-3 exp. CR1L3-3 reg. CR2L3 exp. CR2L3 reg. CR3L3 exp. CR3L3 reg.
Stra
in(ε
)
Slip(mm)
27

Fig. 8.d(17.78cm wide, suggest reduction to 33%)
0.0 0.5 1.0 1.5 2.0 2.50.000
0.002
0.004
0.006
0.008
0.010
0.012
GR1L1 exp. GR1L3 exp. GR1L3 reg. GR1L5 exp. GR1L5 reg. GR2L3 exp. GR2L3 reg. GR3L3 exp.
Stra
in(ε
)
Slip(mm)
FRP fracture
28

Fig. 8.e(17.78cm wide, suggest reduction to 33%)
0.0 0.2 0.4 0.6 0.8 1.0 1.2 1.4 1.6 1.80.000
0.002
0.004
0.006
0.008
0.010
0.012
0.014
AR1L1 exp. AR1L1 reg. AR1L2 exp. AR1L2 reg. AR1L3 exp. AR1L3 reg. AR2L3 exp. AR2L3 reg. AR3L3 exp. AR3L3 reg.
Stra
in(ε
)
Slip(mm)
29

Fig. 9(17.78cm wide, suggest reduction to 50%)
10 20 30 40 50 60 70
10
20
30
40
50
60
70
P max
ana.
(kN
)
Pana.max/Pexp.
max=1.0
Pmaxexp.(kN)
30

Fig. 10.a (17.78cm wide, suggest reduction to 33%)
0.0 0.1 0.2 0.3 0.4 0.5 0.60
2
4
6
8 Average All founded curves from Exp.
Ga/ta=1.05GPa/mm(FR-E3P)
Gf=1.19N/m, B=10.4mm -1
τ(M
Pa)
s(mm)
31

Fig. 10.b (17.78cm wide, suggest reduction to 33%)
0.0 0.1 0.2 0.3 0.4 0.5 0.60
2
4
6
8
τ(M
Pa)
s(mm)
All found curves from exp. Present model Ga/ta=0.49GPa/mm(SX-325) Gf=1.54N/mm,B=5.77mm-1
32

Fig. 10.c (17.78cm wide, suggest reduction to 33%)
0.0 0.1 0.2 0.3 0.4 0.5 0.60
2
4
6
8
τ(M
Pa)
s(mm)
All found curves through exp. Present model
Ga/ta=0.20GPa/mm(CN-100)
Gf=2.10N/mm, B=2.74mm-1
33

Fig. 11.a (17.78cm wide, suggest reduction to 33%)
20 30 40 50 600.0
0.2
0.4
0.6
0.8
1.0
1.2
1.4
1.6
1.8
Yoshizawa et al.(2000)Present studyNakaba et al.(2001)
regressing line Gf=0.422 f'c0.236
Gf (N
/mm
)
fc'(MPa)
34

Fig. 11.b (17.78cm wide, suggest reduction to 33%)
10 20 30 40 50 60 70 80 90
0.2
0.4
0.6
0.8
1.0 Yoshizawa et al.(2000) Present Nakaba et al.(2001) regressing line Gf=0.388f'
c0.236(Eftf )
0.023Gf /f
' c0.23
6
Eftf (kN/mm)
35

Fig. 11.c (17.78cm wide, suggest reduction to 33%)
0.2 0.4 0.6 0.8 1.0 1.20.00.10.20.30.40.50.60.70.80.91.0
Present exp. Regressing line
Gf=0.446(Ga/ta)-0.352f'c0.236(Eftf)
0.023
Gf /f' c0.
236 /(E
ft f)0.02
3
Ga/ta(GPa/mm)
36

Fig. 12.a (17.78cm wide, suggest reduction to 33%)
10 20 30 40 50 60 70 800
2
4
6
8
10
12
14
Exp. regressing line
B=6.947(Eftf)0.108 R2=0.270
B(m
m-1
)
Eftf(kN/mm)
37

Fig. 12.b (17.78cm wide, suggest reduction to 33%)
0.0 0.2 0.4 0.6 0.8 1.0 1.2 1.4 1.60
2
4
6
8
10
Exp. Regressing line
B=6.846(Eftf)0.108(Ga/ta)
0.833
R2=0.937
B/(E
f t f )0.10
8 (mm
- 1)
Ga/ta(GPa/mm)
38
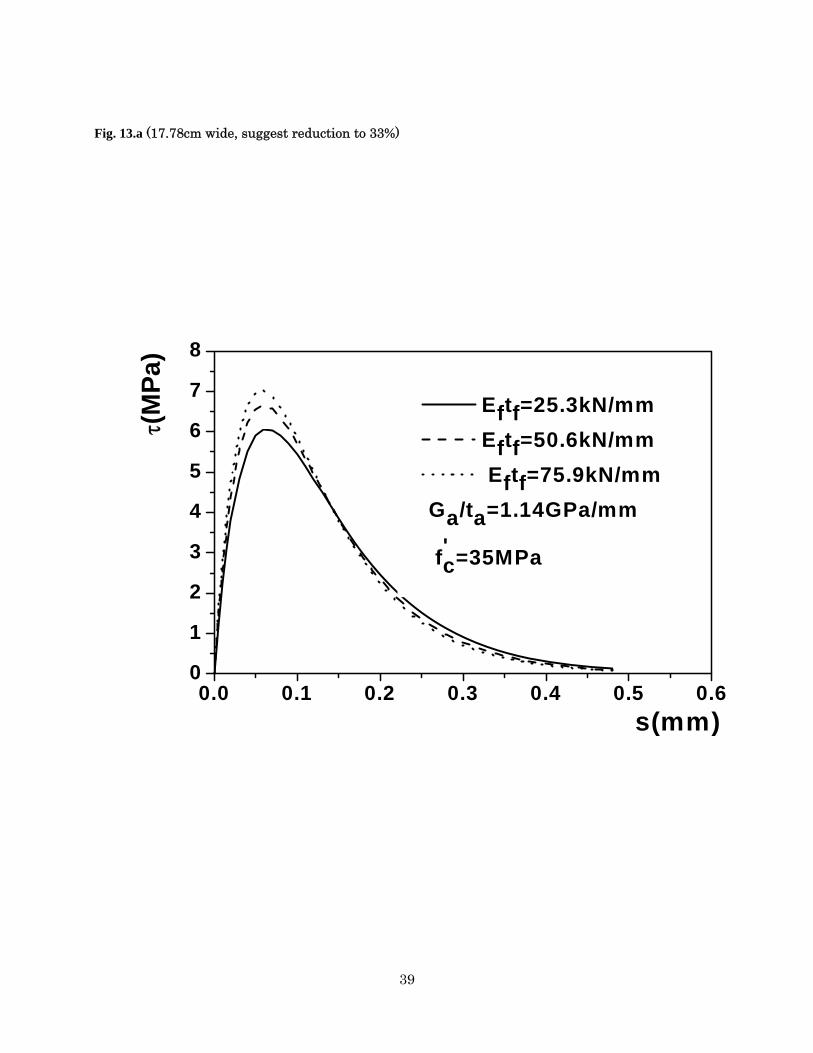
Fig. 13.a (17.78cm wide, suggest reduction to 33%)
0.0 0.1 0.2 0.3 0.4 0.5 0.60
1
2
3
4
5
6
7
8
τ(M
Pa)
s(mm)
Eftf=25.3kN/mm Eftf=50.6kN/mm Eftf=75.9kN/mm
Ga/ta=1.14GPa/mm
f'c=35MPa
39

Fig. 13.b (17.78cm wide, suggest reduction to 33%)
0.0 0.1 0.2 0.3 0.4 0.5 0.60
1
2
3
4
5
6
7
8Ga/ta=1.14GPa/mmGa/ta=0.49GPa/mmGa/ta=0.20GPa/mm
Eftf=50.6kN/mm ,
f'c=35MPa
τ (M
Pa)
s(mm)
40

Fig.14 ((17.78cm wide, suggest reduction to 50%)
0 1 0 2 0 3 0 4 0 5 0 6 0 7 00
1 0
2 0
3 0
4 0
5 0
6 0
7 0 N a k a b a e t a l . (2 0 0 1 ) Y o s h iz a w a e t a l . (2 0 0 0 ) P re s e n t P a n a .
m a x /P e x p .m a x = 1 .0
Pana.
max
(kN
)
P e x p .m a x (k N )
A v e ra g e = 1 .0C .O .V = 0 .1 1
41

Fig. 15 (17.78cm wide, suggest reduction to 50%)
0 .0 0 .1 0 .2 0 .3 0 .4 0 .5 0 .60 .0 0 0
0 .0 0 1
0 .0 0 2
0 .0 0 3
0 .0 0 4
0 .0 0 5
0 .0 0 6
0 .0 0 7
0 .0 0 8
E x p . p re s e n t m o d e l Y o s h iz a w a m o d e l N a k a b a m o d e l. S a to (Y u ic h i) m o d e l L o re n z is m o d e l S a to m o d e l
Stra
in(ε
)
S lip (m m )
42
Figure Captions:
Fig. 1 Previous bond stress-slip relationships of FRP sheet-concrete interfaces
Fig. 2 Pullout test setup
Fig. 3 Tensile stress-strain relations of adhesives
Fig. 4 Microscopic observation of FRP sheets after pullout test (CR3L1)
Fig. 5 Single lap pullout test
Fig. 6 Strain distribution of FRP sheets along bond interface (CR1L1)
Fig. 7 Calculated local bond stress-slip relationships at different locations from loaded end (CR1L1)
Fig. 8 Experimental and regressed strain-slip curves at loaded ends
(a) CFRP, Stiffness: 25.3 kN/mm
(b) CFRP, Stiffness: 50.6 kN/mm
(c) CFRP, Stiffness: 75.9 kN/mm
(d) AFRP, Stiffness: 18.6~73.6 kN/mm
(e) GFRP, Stiffness: 8.7~43.7 kN/mm
Fig. 9 Comparison between analytical and experimental maximum pullout loads
Fig. 10 Experimentally found bond stress-slip relationships
(a) Adhesive FR-E3P
(b) Adhesive SX-325
(c) Adhesive CN-100
Fig. 11 Effects of various parameters on interfacial fracture energy
(a) Concrete strength
(b) FRP stiffness
(c) Adhesive
Fig. 12 Effects of various parameters on B
(a) FRP stiffness
(b) Adhesive
Fig. 13 Proposed bond stress-slip relationships
(a) with different FRP stiffness
43

(b) with different adhesives
Fig. 14 Comparisons of predicted and experimental ultimate loads of interfaces
Fig. 15 Predicted strain-slip relationships at loading point by different models
44

Tables:
Table 1 Mechanical Properties of FRP Materials
Fiber Type ρ
(g/m3)
ft
(MPa)
Ef
(GPa)
tf
(mm)
uε
(%)
Carbon FTS-C1-20 200 3550 230 0.11 1.5
Aramid AT-90 530 3030 84 0.38 2.4
Glass FTS-GE-30 300 1500 74 0.12 2.1
Note: ρ = fiber density; ft = tensile strength; Ef = elastic modulus; tf = thickness;
εu = fiber fracturing strain; FTS-C1-20 and FTS-GE-30 sheets were offered by
Nippon Steel Composite Co. Ltd; AT-90 was offered by Nippon Aramid Co. Ltd.
45

Table 2 Material Properties of Adhesives
Types of
adhesives Density
(g/cm3) Resins/harden
er by weight Elastic
modulus
(GPa)
Poisson’s
ratio
Tensile
strength
(MPa)
Flexural
strength
(MPa)
Gel
time
(min)
Viscosity
(mPa⋅s/25 °C)
Setting time
(h/20°C)
CN-100 1.13 1:1 0.39 0.45 11.8 3.7 50 1800 7.5 SX-325 1.15 2:1 1.0 0.38 15.9 29.6 48 32000 12 FR-E3P 1.17 2:1 2.41 0.38 44.7 39.0 20 40000 18
FP-NS (Primer) 1.16 2:1 2.45 0.38 48.1 39.0 >20 <3000 28
Note: The tests for adhesives were carried out by Sho-bond Co. Ltd., Japan. FR-E3P and FP-NS were offered by Nippon Steel
Composite Co. Ltd; SX-325 was offered by Nippon Toho Earth-Tech. Co. Ltd; and CN-100 was offered by Nippon Toho Resin Chemical Co. Ltd.
46

Table 3 Details of Specimens and Pullout Bond Test Results
Specimen
codes
Ga/ta
(GPa/mm)
Eftf
(kN/mm)
A
(ε)
B
mm-1
Gf
(N/mm)
R2 τmax
(MPa)
smax
(mm)
Pmax
kN(Exp.)
Pmax
kN(Ana.)
Pmax
(Ana./Exp.)
Failure
mode*
CR1L1 0.97 25.3 0.00904 10.79 1.034 0.985 5.58 0.064 23.4 22.9 0.98 CF
CR1L1 1.14 25.3 0.01046 10.44 1.384 0.996 7.22 0.066 23.1 26.5 1.15 CF
CR1L1 1.14 25.3 0.00908 10.38 1.043 0.982 6.80 0.053 24.9 22.3 0.92 CF
CR1L2 0.97 50.6 0.00664 10.01 1.115 0.991 5.58 0.069 33.5 33.6 1.00 CF
CR1L2 1.14 50.6 0.00682 11.34 1.177 0.992 6.67 0.061 39.3 34.5 0.88 CF
CR1L2 1.14 50.6 0.00732 9.04 1.356 0.991 6.13 0.077 39.3 37.0 0.94 CF
CR1L3 0.97 75.9 0.00509 10.91 0.983 0.975 5.36 0.064 42.9 38.6 0.90 CF
CR1L3 1.14 75.9 0.00554 11.13 1.165 0.987 6.47 0.057 38.4 42.1 1.10 CF
CR1L3 1.14 75.9 0.00525 12.25 1.042 0.987 6.40 0.062 38.4 39.7 1.03 CF
CR1L3 1.14 75.9 0.00496 11.69 0.930 0.994 5.45 0.059 36.9 37.5 1.02 CF
AR1L1 0.99 18.6 0.01260 9.83 1.476 0.986 7.26 0.070 25.5 23.4 0.92 CF
AR1L2 0.97 31.8 0.00955 9.47 1.450 0.979 6.87 0.073 33.6 30.4 0.90 CF
AR1L3 0.97 73.6 0.00606 10.18 1.351 0.990 6.88 0.068 39.9 44.6 1.12 CF
GR1L1 0.97 8.7 0.01443 9.66 NA 0.989 NA 0.072 13.5 NA NA FF
GR1L3 0.97 32.0 0.00848 8.12 1.444 0.995 4.88 0.062 28.6 27.1 0.95 CF
GR1L5 0.97 43.7 0.00732 11.13 1.171 0.980 6.52 0.062 33.4 32.0 0.96 CF
CR2L1 0.49 25.3 0.01124 6.24 1.598 0.993 4.99 0.111 28.1 28.4 1.01 CF
CR2L2 0.49 50.6 0.00809 5.66 1.656 0.997 4.68 0.123 43.2 40.9 0.95 CF
CR2L3 0.49 75.6 0.00596 6.71 1.343 0.993 4.51 0.103 47.4 45.1 0.95 CF
AR2L3 0.49 73.6 0.00668 6.26 1.642 0.989 5.14 0.111 47.1 49.2 1.04 CF
GR2L3 0.49 32.0 0.00869 7.70 1.208 0.986 4.65 0.090 31.0 27.8 0.90 CF
CR3L1 0.20 25.3 0.01791 2.07 NA 0.984 NA 0.335 31.8 NA NA FF
CR3L2 0.20 50.6 0.00980 2.39 2.430 0.976 2.91 0.290 47.7 49.6 1.04 CF
CR3L3 0.20 75.6 0.00732 3.06 2.205 0.993 2.81 0.227 57.6 55.3 0.96 CF
AR3L3 0.20 73.6 0.00923 2.24 3.135 0.991 3.52 0.309 60.9 67.9 1.12 CF
GR3L3 0.20 26.2 0.01820 1.70 NA 0.996 NA 0.408 33.4 NA NA FF
ccCR∗L∗ The plies of FRP sheets
Adhesive type; 1,2 and 3 means FR-E3P, SX-325 and CN-100 respectively
2: CF-concrete failure; 3: FF- FRP fracture; C: CFRP; A: AFRP; G:GFRP
CR1L1
47

Note: Ga: Shear modulus of adhesive; ta: thickness of adhesive layer; Ef: Elastic modulus of FRP; tf: thickness of
FRP; A, B: two regressing parameters used for the relations between the strain of FRP sheet and slip at loaded end of
bond area; R2: regressing correlative factor; τmax: the maximum bond stress; smax: slip corresponding to the maximum
bond stress; NA: the data is not processed because the failure is caused not by the peeling but by the fracture of FRP
sheets.
48

![3,700 108,500 1.7 M...Analysis of Nonlinear Composite Members Including Bond-Slip Manal K. Zaki ... structuralmemberasinthecaseofstiffeningthetensionfibersofabeam. ... usingcommercialsoftwareANSYS,Kachlakevetal.[5],Lietal.[6].Yanetal.[7]developed](https://img.pdfslide.net/doc/110x75/6124f6f4701d43067d760dc8/3700-108500-17-m-analysis-of-nonlinear-composite-members-including-bond-slip.jpg)


![Experimental Investigation on Local Bond-Slip … INVESTIGATION ON LOCAL BOND-SLIP ... normal weight or light weight high strength concrete [2] ... knowledge of lightweight concrete](https://img.pdfslide.net/doc/110x75/5b02e31a7f8b9a3c378b5de0/experimental-investigation-on-local-bond-slip-investigation-on-local-bond-slip.jpg)