Embed Size (px)
Citation preview
DEVELOPMENTALCOMPREHENSIVE SCREENING
PROJECT
Does the implementation of avalidated developmental
screening tool make a difference?
byAmirah Ellis, MPH
Center for AppliedDemography &Survey ResearchUniversity of Delaware
May 2010

DEVELOPMENTAL COMPREHENSIVE SCREENING PROJECT
Does the implementation of a validated developmentalscreening tool make a difference?
prepared for
American Academy of Pediatrics - Delaware Chapterand
Advances in Management, Inc.
by
By Amirah Ellis, MPH
Center for Applied Demography & Survey Research
College of Education and Public Policy
University of Delaware
Newark, Delaware 19716
Tel: 302-831-6643
May 2010
ii
The University of Delaware is committed to assuring equal opportunity to all persons and doesnot discriminate on the basis of race, color, gender, religion, ancestry, national origin, sexualpreference, veteran status, age, or disability in its educational programs, activities, admissions, oremployment practices as required by Title IX of the Educational Amendments of 1972, Title VIof the Civil Rights Act of 1964, the Rehabilitation Act of 1973, the Americans with DisabilitiesAct, other applicable statutes, and University policy. Inquiries concerning these statutes andinformation regarding campus accessibility and Title VI should be referred to the AffirmativeAction Officer, 305 Hullihen Hall, 302/831-2835 (voice), 302/831-4552(TDD).

iii
TABLE OF CONTENTS
Page
List of Figures ...................................................................................................................................... iv
Summary ............................................................................................................................................... v
Introduction ........................................................................................................................................... 1
Methods.................................................................................................................................................. 5
Results ................................................................................................................................................... 8
Discussion ...........................................................................................................................................30
Appendix A .........................................................................................................................................32
Appendix B .........................................................................................................................................33
Appendix C .........................................................................................................................................35
Appendix D .........................................................................................................................................37
Appendix E .........................................................................................................................................38
Appendix F ..........................................................................................................................................40

iv
LIST OF FIGURES
Figure Page
1.1 Pre-Implementation – Month of Well-child Visit for Control Group .................................. 8
1.2 Post-Implementation – Month of Well-child Visit for Screening Group.............................. 9
1.3 Pre-Implementation Control Group Gender .......................................................................... 9
1.4 Post-Implementation Screening Group Gender ................................................................... 10
1.5 Pre-Implementation Control Group Insurance Type ........................................................... 11
1.6 Post-Implementation Screening Group Insurance Type....................................................... 11
1.7 Pre-Implementation Control Group Race ............................................................................. 12
1.8 Post-Implementation Screening Group Race ....................................................................... 13
1.9 Pre-Implementation Control Group Ethnicity of Patients ................................................... 14
1.10 Post-Implementation Screening Group Ethnicity of Patients ............................................. 14
2.1 Developmental or Behavioral Delay Concern Identified .................................................... 15
2.2 Formal Referral Made for a Developmental or Behavioral Concern .................................. 16
2.3 Number of Formal Referrals Made for a Developmental or Behavioral Concern.............. 17
2.4 Location of Formal Referral Made for a Developmental or Behavioral Concern .............. 18
3.1 Post-Implementation – Referrals Including Non Specific Referrals & other follow-up ... 19
3.2 Post-Implementation – Types of Follow-up ......................................................................... 20
3.3 Post-Implementation – Language of PEDS tool .................................................................. 21
3.4 Post-Implementation – What was the Screening Score? ..................................................... 22
3.5 Post-Implementation – Areas Where Patients Failed PEDS................................................ 23
3.6 Post-Implementation – What was the screening score by area of risk (Physical) .............. 25
3.7 Post-Implementation – What was the screening score by area of risk (Cognitive) ............ 26
3.8 Post-Implementation – What was the screening score by area of risk (Social/Emotional) 27
3.9 Post-Implementation – What was the screening score by area of risk (Communication).. 28
3.10 Post-Implementation – What was the screening score by area of risk (Self-Help) ............ 29
v
SUMMARY
In March 2009, the Delaware Chapter of the American Academy of Pediatrics (DE-AAP)
received a grant from the Blueprints for the Community Fund of Blue Cross Blue Shield of
Delaware. The DE-AAP contracted with Advances in Management, Inc. to administer a pilot
project with support from the Division of Public Health to expand the work of the Assuring Better
Child Health and Development (ABCD) Project in Delaware to address the developmental needs
of young children, birth to age three, within pediatric practices. The overall goal of the project
was to ensure that all children have comprehensive screening consistent with the policies of the
American Academy of Pediatrics- occurring at 9, 18, and 30 months.
The Center for Applied Demography & Survey Research (CADSR), University of
Delaware, conducted the project evaluation to determine if more children were identified with
possible developmental or behavioral delays with the use of a validated developmental screening
tool than without the use of such a tool. This report will analyze the identification of concerns for
developmental delays prior to and after the implementation of the validated developmental
screening tool and any referrals that resulted.
This report is divided into four sections. The first section provides a literature review that
will give the reader insight into the role of early intervention programs and developmental
screening tools as well as research that highlights some of the benefits of both. The second
section includes the methods section. This section details the process that was used to evaluate
the developmental screening program, the selection criteria for the patient population as well as
the pre implementation (control group) and post implementation (screening group) evaluation
process. The third section presents the results of the evaluation project. The results section
includes an overall demographic review of both the control group and the screening group,
comparisons between both groups and a detailed analysis of the screening group. A discussion
of the results and findings concludes the report.

1
INTRODUCTION
Developmental screening has garnered much interest in increasing the early identification
of youth who have developmental or behavioral delays. Research has shown that approximately
17 percent of children in the United States have a developmental or behavioral disability.1
According to current literature, detection of developmental disorders is lower than their actual
prevalence.2 Early childhood developmental delays are a strong indicator of possible later
developmental disabilities including mental retardation, cerebral palsy, speech disorders, autism
and learning disabilities later in childhood.3 Fewer than 30 percent of children with
developmental and behavioral disorders are identified before school entrance. One of the major
benefits of identifying developmental delays early is that intervention may improve or correct the
delays.
Early intervention is defined as a process of assessment and therapy provided to children
from birth to age three to facilitate normal cognitive and emotional development and prevent
developmental disability or delay. Early intervention programs consistently improve outcomes
for children when compared to children who did not have the benefit of participating in such
programs. Some of the benefits that early intervention programs have demonstrated include
improved school performance, a lower rate of criminality, and within families a reduction in child
abuse and neglect notifications, among others.4 For children who might have needed special
education services in the classroom, early intervention programs help reduce that need prior to
their entering school. Children who receive early intervention services are less likely to be held
back in school when compared to children who need but do not receive early intervention
services.
Research has demonstrated that intervention programs are cost-effective and have
lifelong benefits, and that developmental attainment is maximized when intervention begins
earlier in a child’s life.5 Current research has led the American Academy of Pediatrics (AAP) to
1 CDC Developmental Screening Fact Sheethttp://www.cdc.gov/ncbddd/actearly/pdf/parents_pdfs/DevelopmentalScreening.pdf2 Council on Children with Disabilities, Identifying Infants and Young Children with DevelopmentalDisorders in the Medical Home: An Algorithm for Developmental Surveillance and Screening. AmericanAcademy of Pediatrics Policy Statement, Pediatrics, Volume 118, Number 1, July 20063 Sices et al. How Do Primary Care Physicians Manage Children with Possible Developmental Delays? ANational Survey with an Experimental Design. Pediatrics Vol. 113 No. 2 February 20044 Fish, Ellen, Stronger Families Learning Exchange “The Benefits of Early Intervention, “ StrongerFamilies Learning Exchange Bulletin No. 2 Spring/Summer 2002 pp. 8-115 Rydz, et al. Screening for Developmental Delay in the Setting of a Community Pediatric Clinic: AProspective Assessment of Parent-Report Questionnaires. Pediatrics Volume 118, Number 4, October2006.
Developmental Comprehensive Screening Project 2009 INTRODUCTION
2
advocate for the identification of developmentally delayed children prior to age two.6 The AAP
currently recommends that developmental screening tests be administered regularly at the 9
month, 18 month and 30 month well-child visits.
The purpose of early identification of children at risk for developmental or behavioral
delays through the use of a validated screening tool is to identify children needing additional
clinical evaluations, and if indicated, involve them in early intervention programs. According to
the AAP, “developmental screening is the administration of a brief standardized tool aiding the
identification of children at risk of a developmental disorder.” Using validated screening tools
more accurately identifies these children when compared to simply asking general questions
about a child’s behavior or development.
Formalized screening tools are a way for physicians to have a standardized measure in
place to allow them to accurately screen children for the types of delays that potentially need
additional testing rather than relying on clinical judgment. Studies have shown that
“pediatricians’ use of their clinical judgment tended to under-identify developmental
impairments.”
An additional finding of concern in recent literature is that when a child is identified as
having a risk for a delay they are not always referred for further evaluation or early intervention
services. Caregivers surveyed in a study reported that there was a “relatively short period of time
between first concerns and first diagnosis (mean difference: 1.5 months). However, the mean
time difference between caregiver report of diagnosis and agency report of referral for early
intervention was more than five months.”7 One of the major findings identified in current
literature is once a physician identifies a child as having a risk or concern for developmental or
behavioral delay, a large proportion of the children are not referred to early intervention services.
Early intervention services are provided under Part C of IDEA (Individuals with
Disabilities Education Improvement Act of 2004 and reauthorization in 2007) to children from
birth to three years of age who have been identified as having a developmental or
social/emotional delay. The purpose of this program is to provide early identification of children
who have developmental or behavioral delays or those who are at risk for delays and to enroll
them in supports and services that help to address their needs before they enter primary school.
The conditions that qualify for early intervention eligibility under Part C of the IDEA in
Delaware fall under two categories. The first includes established medical conditions including,
6 Ibid.7 Bailey, Donald et al, First Experiences with Early Intervention: A National Perspective, Pediatrics Vol.113 No 4, April 2004.
Developmental Comprehensive Screening Project 2009 INTRODUCTION
3
for example, a variety of chromosomal and genetic disorders as well as other conditions ranging
from low birth weight to severe infectious diseases, which place a child at high risk for
developmental delay. The second category that qualifies children for Part C eligibility and early
intervention is based on developmental delays in any one or more of five skill areas. These areas
are communication, cognitive skills, fine and gross motor physical skills, adaptive and
independent living skills, and social/emotional skills The State of Delaware has an Interagency
Coordinating Council that has defined these guidelines for eligibility. The Delaware Department
of Health and Social Services uses a multidisciplinary team assessment to evaluate delays when
compared to age-expected levels of development. Infants and toddlers are determined eligible for
early intervention based on results from these evaluations, clinical observations, and other
medical information.
A validated screening tool allows the provider to make an objective decision with clear
markers to identify concerns for developmental or behavioral delays in each patient who visits the
practice for a well-child visit at 9, 18 and 24-30 months. Without the use of a validated screening
tool the identification of concern for developmental delay is subjective. The use of a validated
screening tool provides the primary care provider with clear objectives that allow for
identification of these concerns for developmental or behavioral delays in specific areas that
indicate a need for further evaluation or monitoring.
The validated screening tool used in this developmental screening project is the Parents’
Evaluation of Developmental Skills (PEDS). PEDS is designed for children between six months
and eight years of age. This tool is used to screen for developmental and behavioral problems
needing further evaluation.8 PEDS is considered an evidence-based surveillance screening tool.
A previous study found that providers screened more children for developmental and
behavioral delays with the usage of the PEDS screening tool than without the use of the tool.9 In
this same study, when compared to the same-aged children before screening and after screening,
more children were identified with behavioral concerns in the two-year-old age group and more
children with developmental concerns were identified in the three-year-old age group.10 Due to
the ease of use of the PEDS tool, the previous study identified it as particularly useful in an urban
primary care setting.
8 Ibid.9 Schonwald, et al. Routine Developmental Screening Implemented in Urban Primary Care Settings: MoreEvidence of Feasibility and Effectiveness. Pediatrics Volume 123, Number 2, February 200910 Ibid.
Developmental Comprehensive Screening Project 2009 INTRODUCTION
4
The PEDS validated screening tool is answered by parents and can be completed in less
than five minutes in the clinical setting.11 With regards to sensitivity (identification of children
with disabilities) and specificity (identification of children without disabilities), PEDS sensitivity
is 74% to 80% and specificity is 70% to 80%. To add to the ease of use for parents, the PEDS
tool is available in both English and Spanish and can be translated into multiple languages. The
tool is also written at a fifth grade level.
11 Ibid.
Developmental Comprehensive Screening Project 2009 METHODS
5
METHODS
The goal of this evaluation was to analyze the implementation of a developmental
screening pilot program and to determine if more children were screened and referred for early
intervention services before the implementation of a developmental/behavioral screening tool or
after the implementation of this tool. This pilot program implemented the Parents’ Evaluation of
Developmental Status (PEDS), a validated developmental screening tool, at four pediatric
practices in the three counties (New Castle, Kent and Sussex) in Delaware.
The targets of the pilot program were children who attended well-child visits at 9 months
(8-11 months), 18 months (17-20 months), 24 months (23-26 months) and 36 months (34-37
months) of age. The Center for Applied Demography & Survey Research, University of
Delaware (CADSR) performed a quantitative evaluation to measure the ratio of pediatric patients
that received a validated developmental screening, identification of delays and any resulting
referrals before and after the implementation of the PEDS tool at all four sites.
During the pilot program, a control group was first evaluated. This control group was
evaluated for the six months (March 15, 2009 to September 13, 2009) prior to the implementation
of the PEDS screening tool. During the project implementation period, the screening group
consisted of children from age groups matched to the control groups. The screening group
included all of the children who attended well-child visits within the designated age range after
the use of PEDS began. The project implementation period lasted for six months, from
September 14, 2009 to March 12, 2010 (see Appendix C).
Patient Population
The patient population for both the control and screening groups consisted of children
who were regular patients of the physician practice. Patients who were only seen at the hospital
immediately after birth, those who were not considered a regular patient of the physician, or
patients who were no shows to their appointment were excluded from the evaluation. Patients
who were identified as already being in the screening group were excluded from analysis in the
control group. Additional exclusion criteria included individuals who were previously diagnosed
with a behavioral or developmental delay and/or were already enrolled in early intervention
services. Missing data was also excluded from analysis. The age groups used for evaluative
purposes for both the control group and the screening group included children in the following
age ranges: 9 months (8-11 months), 18 months (17-20 months), 24 months (23-26 months) and
36 months (34-37 months) of age.
Developmental Comprehensive Screening Project 2009 METHODS
6
Pre Implementation
Each of the practice sites was evaluated separately as a case study due to the differing
demographic make-up of each physician practice. The selected practice sites each provided a
data set with no identifiable details for all of the children who were seen for 9 month, 18 month,
24 month and 36 month well-child appointments within the six months prior to the project
implementation period (March 15, 2009 to September 13, 2009). For the sampling process, a past
patient list, which included the newly generated identification number, gender and date of birth,
was provided from each site.
Advances in Management, Inc. (AIM), the primary contractor overseeing the project,
ensured that the PEDS tool was implemented in each practice. They were also responsible for
making sure that each practice site could be identified with a unique identifier number. AIM
assigned each patient on the patient list a unique identifier number from which the control group
was drawn. The unique identifier number was a different number than the child’s social security
number, date of birth, and the HIPAA identifier number. The unique identifier numbers that
identified patients who were in the group from which the control group was to be drawn were
then provided to CADSR. CADSR selected a random sample of approximately 125 unique
identifiers from the list of children who attended their well-child appointments at each of the
practices for an overall total of 500 charts to be reviewed. During the selection process of the
control group, additional samples had to be drawn to comply with our pre determined selection
criteria (see Appendix B). Due to the differing set-ups of each practice, additional detail on how
each practice structured their data collection method of patients in the six months prior to the
implementation to the PEDS tool is listed in Appendix B.
After the random samples were chosen, three nurse educators employed by AIM and
assigned to one of the four sites, were provided with the unique identifier numbers randomly
selected to comprise the control group. With assistance from staff at each practice, the nurse
educators then pulled the patient charts for review and completion of the pre implementation data
collection tool. CADSR provided to the nurse a data collection tool (identified with the
identification number) that was filled in for each selected patient with details on the
demographics of the patient and data identified as being related to developmental screening (see
Appendix D). Data was collected on the control group from March 15, 2009 to September 13,
2009, which was the time period immediately preceding the implementation of the PEDS tool.
Developmental Comprehensive Screening Project 2009 METHODS
7
Post-Implementation
The post-implementation evaluation included the number of referrals that were made for
behavioral or developmental delays after the introduction of the PEDS tool and what types of
delays were identified. Each of the three nurse educators assigned to one of the four practice sites
was responsible for having the post-implementation data collection survey filled out for every
patient who was present at their physician’s office well-child visit at 9 months (8-11 months), 18
months (17-20 months), 24 months (23-26 months) or 36 months (34-37 months) (see Appendix
C). The patients who attended their well-child appointments after the implementation of the
PEDS tool (September 14, 2009) consisted of the screening group. A unique identifier number
determined by the nurse educators was assigned to each of the data collection tools and clearly
identified the specific practice from which the data collection tools were completed. The post-
implementation data collection tool was identical to the pre-implementation data collection tool
with the exception of one additional section that listed questions that were specific to the PEDS
tool (see Appendix E). The data collection tools were collected monthly by AIM and provided to
CADSR. The post-implementation data collection tools were evaluated, and the results of the
data were analyzed to compare the pre-implementation data to the post-implementation data. The
post-implementation data collection period lasted from September 14, 2009 to March 12, 2010.
Developmental Comprehensive Screening Project 2009 RESULTS
8
RESULTS
Demographics
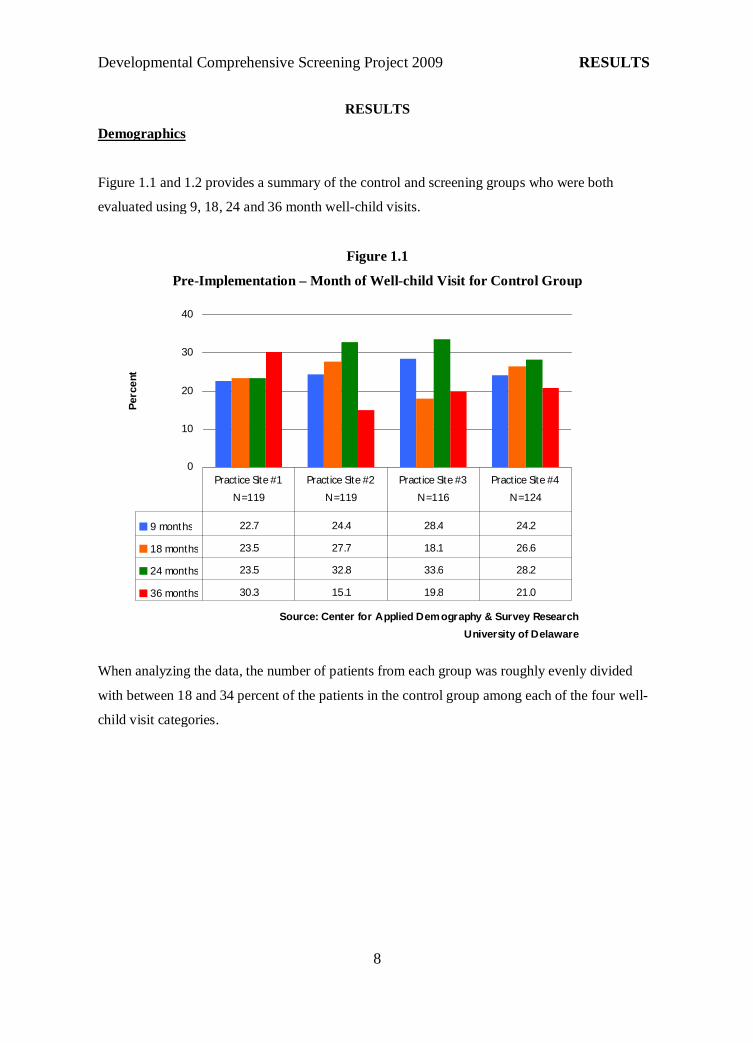
Figure 1.1 and 1.2 provides a summary of the control and screening groups who were both
evaluated using 9, 18, 24 and 36 month well-child visits.
Figure 1.1
Pre-Implementation – Month of Well-child Visit for Control Group
0
10
20
30
40
Source: Center for Applied Demography & Survey Research
University of Delaware
Perc
ent
9 months 22.7 24.4 28.4 24.2
18 months 23.5 27.7 18.1 26.6
24 months 23.5 32.8 33.6 28.2
36 months 30.3 15.1 19.8 21.0
Practice Site #1
N=119
Practice Site #2
N=119
Practice Site #3
N=116
Practice Site #4
N=124
When analyzing the data, the number of patients from each group was roughly evenly divided
with between 18 and 34 percent of the patients in the control group among each of the four well-
child visit categories.
Developmental Comprehensive Screening Project 2009 RESULTS
9
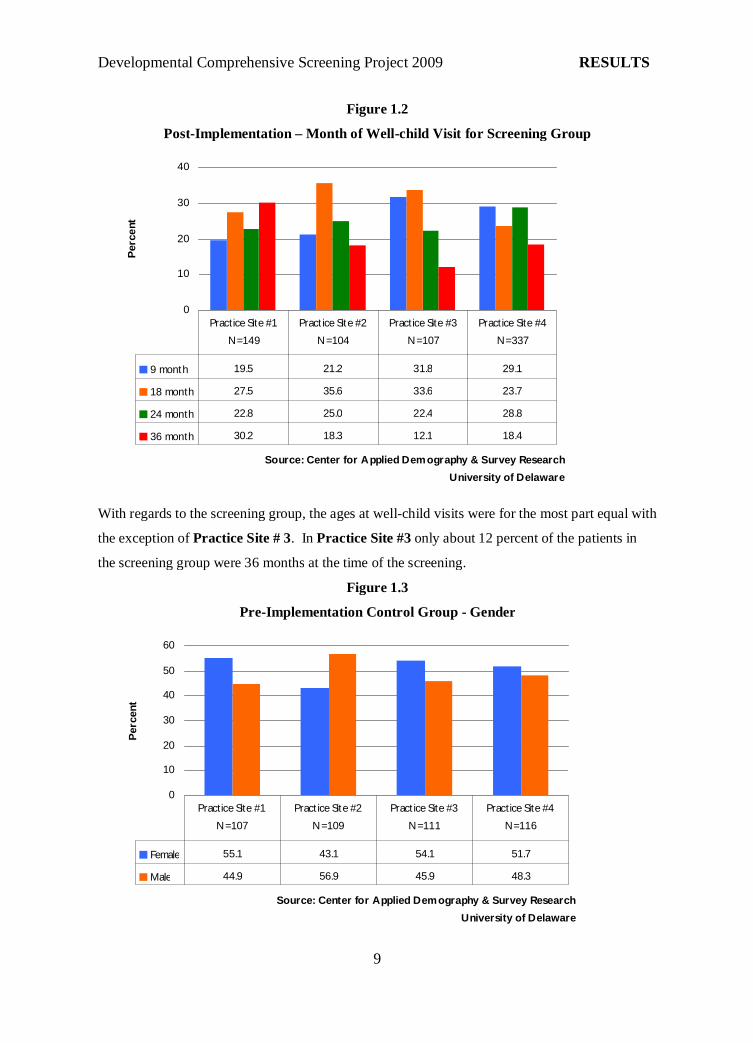
Figure 1.2
Post-Implementation – Month of Well-child Visit for Screening Group
0
10
20
30
40
Source: Center for Applied Demography & Survey Research
University of Delaware
Perc
ent
9 month 19.5 21.2 31.8 29.1
18 month 27.5 35.6 33.6 23.7
24 month 22.8 25.0 22.4 28.8
36 month 30.2 18.3 12.1 18.4
Practice Site #1
N=149
Practice Site #2
N=104
Practice Site #3
N=107
Practice Site #4
N=337
With regards to the screening group, the ages at well-child visits were for the most part equal with
the exception of Practice Site # 3. In Practice Site #3 only about 12 percent of the patients in
the screening group were 36 months at the time of the screening.
Figure 1.3
Pre-Implementation Control Group - Gender
0
10
20
30
40
50
60
Source: Center for Applied Demography & Survey Research
University of Delaware
Perc
en
t
Female 55.1 43.1 54.1 51.7
Male 44.9 56.9 45.9 48.3
Practice Site #1
N=107
Practice Site #2
N=109
Practice Site #3
N=111
Practice Site #4
N=116
Developmental Comprehensive Screening Project 2009 RESULTS
10
Figure 1.4
Post–Implementation Screening Group - Gender
0
10
20
30
40
50
60
Source: Center for Applied Demography & Survey Research
University of Delaware
Pe
rcen
t
Female 57.0 44.0 47.6 50.1
Male 43.0 56.0 52.4 49.9
Practice Site #1
N=149
Practice Site #2
N=100
Practice Site #3
N=103
Practice Site #4
N=337
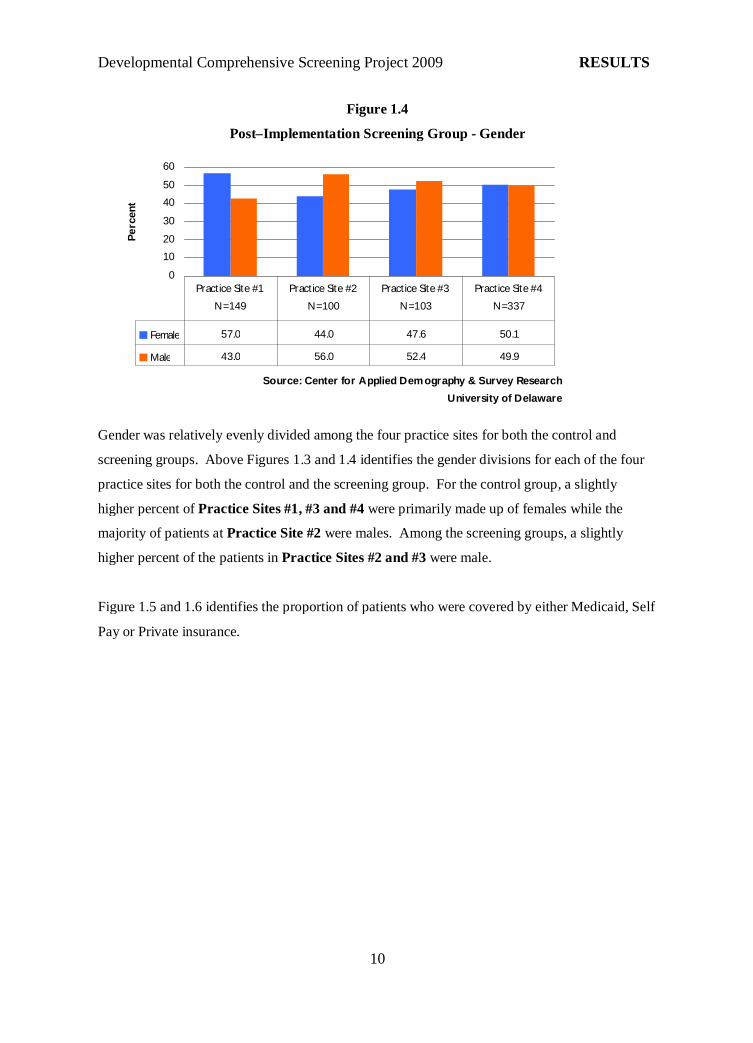
Gender was relatively evenly divided among the four practice sites for both the control and
screening groups. Above Figures 1.3 and 1.4 identifies the gender divisions for each of the four
practice sites for both the control and the screening group. For the control group, a slightly
higher percent of Practice Sites #1, #3 and #4 were primarily made up of females while the
majority of patients at Practice Site #2 were males. Among the screening groups, a slightly
higher percent of the patients in Practice Sites #2 and #3 were male.
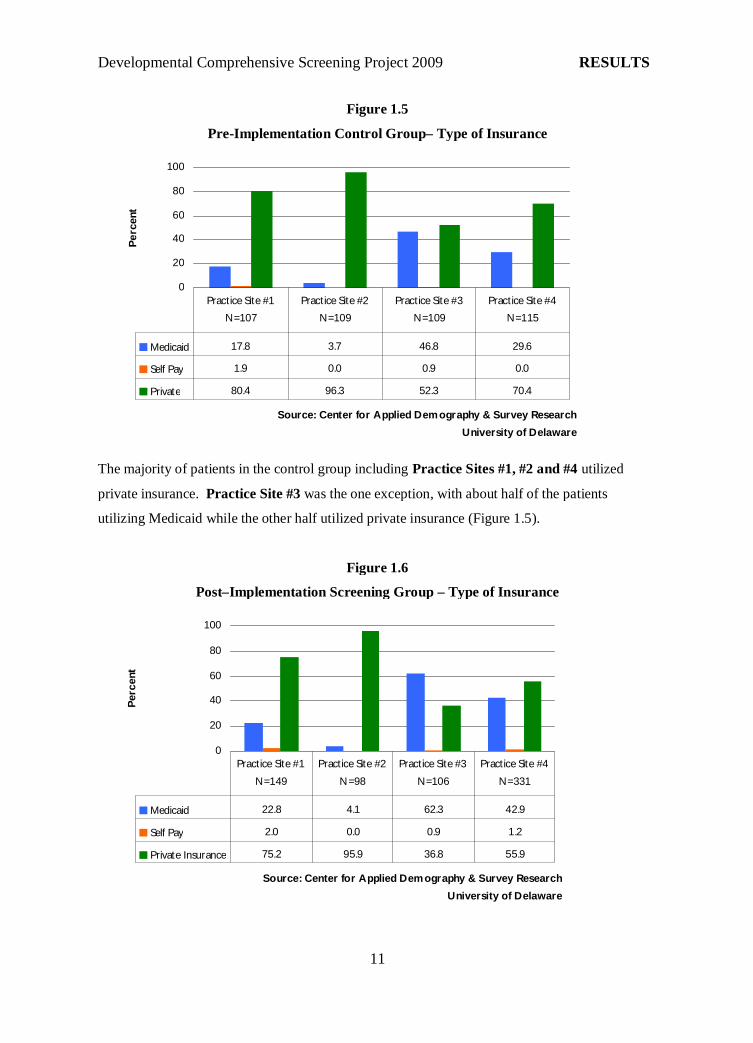
Figure 1.5 and 1.6 identifies the proportion of patients who were covered by either Medicaid, Self
Pay or Private insurance.
Developmental Comprehensive Screening Project 2009 RESULTS
11
Figure 1.5
Pre-Implementation Control Group– Type of Insurance
0
20
40
60
80
100
Source: Center for Applied Demography & Survey Research
University of Delaware
Pe
rcent
Medicaid 17.8 3.7 46.8 29.6
Self Pay 1.9 0.0 0.9 0.0
Private 80.4 96.3 52.3 70.4
Practice Site #1
N=107
Practice Site #2
N=109
Practice Site #3
N=109
Practice Site #4
N=115
The majority of patients in the control group including Practice Sites #1, #2 and #4 utilized
private insurance. Practice Site #3 was the one exception, with about half of the patients
utilizing Medicaid while the other half utilized private insurance (Figure 1.5).
Figure 1.6
Post–Implementation Screening Group – Type of Insurance
0
20
40
60
80
100
Source: Center for Applied Demography & Survey Research
University of Delaware
Perc
ent
Medicaid 22.8 4.1 62.3 42.9
Self Pay 2.0 0.0 0.9 1.2
Private Insurance 75.2 95.9 36.8 55.9
Practice Site #1
N=149
Practice Site #2
N=98
Practice Site #3
N=106
Practice Site #4
N=331
Developmental Comprehensive Screening Project 2009 RESULTS
12
The type of insurance utilized by the patients within each practice site in the screening group
varied. While the majority of the patients in Practice Site #1 and #2 utilized private insurance,
roughly 43% of patients in Practice Site # 4 and about 62% of Practice Site #3 were insured by
Medicaid (Figure 1.6).
Figure 1.7
Pre-Implementation Control Group – Race of Patient
0
20
40
60
80
100
Source: Center for Applied Demography & Survey Research
University of Delaware
Pe
rcent
African American 7.4 1.9 6.7 29.2
Caucasian 91.7 90.7 91.7 67.9
Other 0.9 7.5 1.7 2.8
Practice Site #1
N=108
Practice Site #2
N=107
Practice Site #3
N=60
Practice Site #4
N=106
Developmental Comprehensive Screening Project 2009 RESULTS
13
Figure 1.8
Post-Implementation Screening Group– Race of Patient
0
20
40
60
80
100
Source: Center for Applied Demography & Survey Research
University of Delaware
Pe
rcen
t
African American 9.4 3.1 13.0 25.3
Caucasian 90.6 90.8 87.0 66.1
Other 0.0 6.1 0.0 8.6
Practice Site #1
N=127
Practice Site #2
N=98
Practice Site #3
N=54
Practice Site #4
N=304
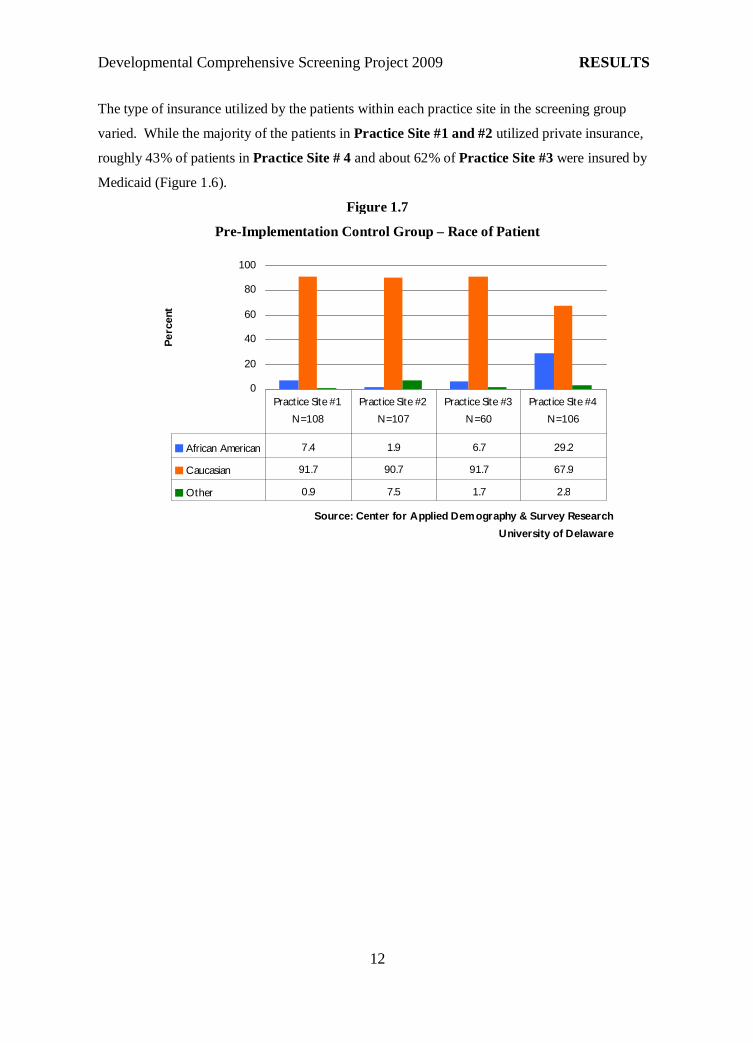
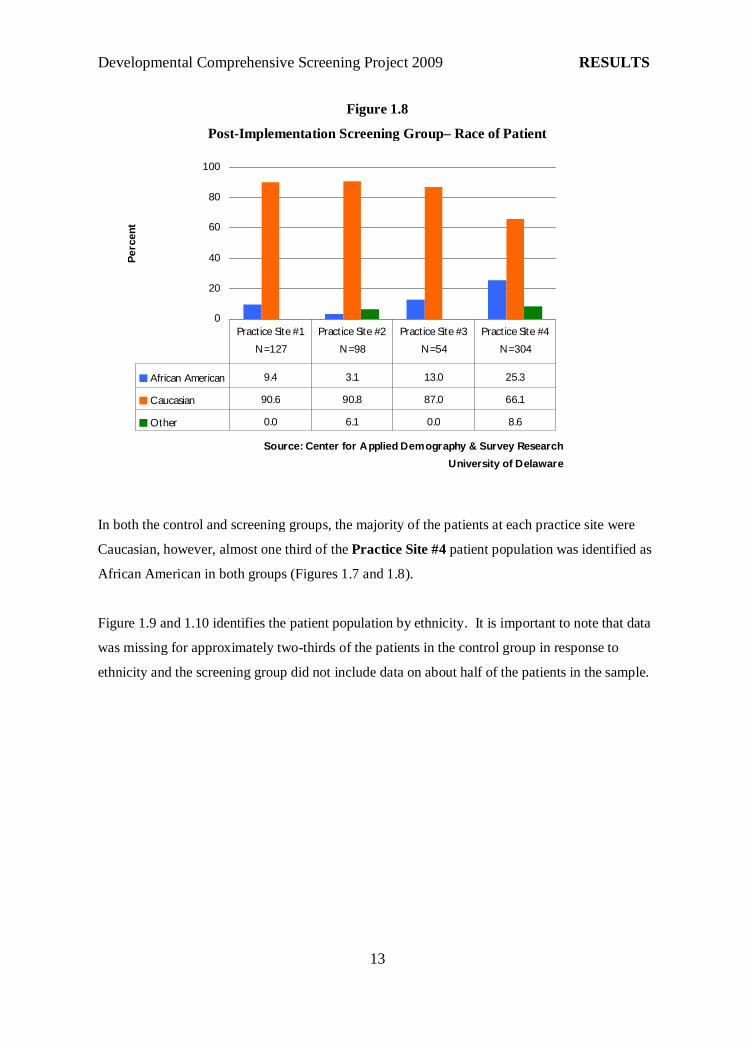
In both the control and screening groups, the majority of the patients at each practice site were
Caucasian, however, almost one third of the Practice Site #4 patient population was identified as
African American in both groups (Figures 1.7 and 1.8).
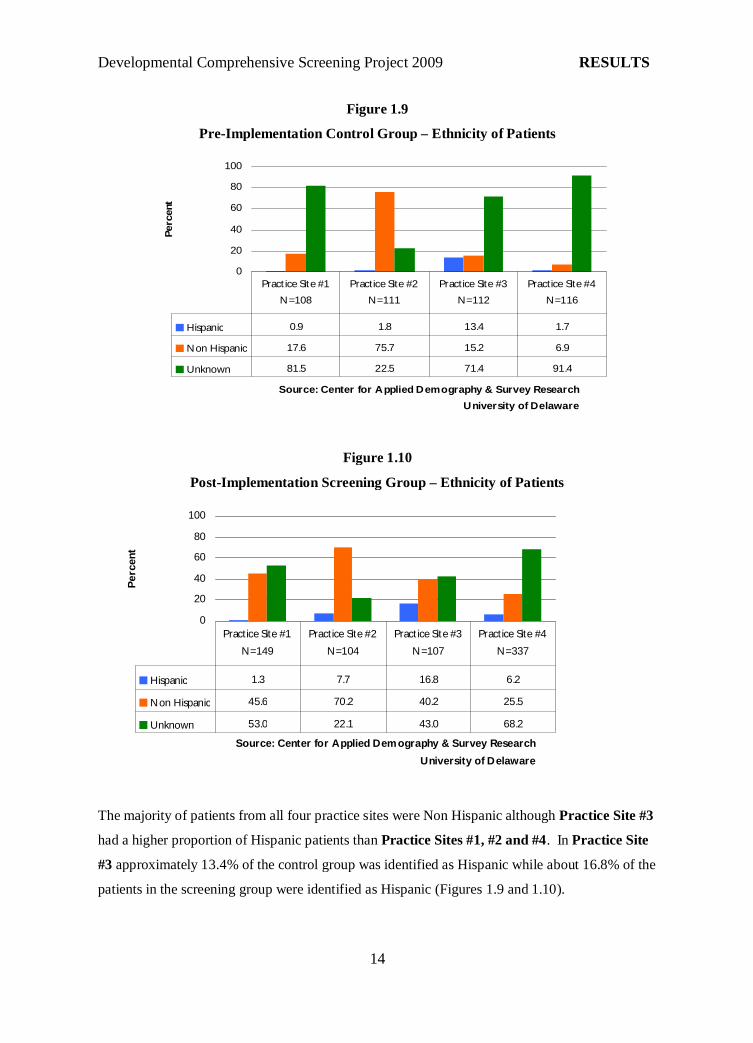
Figure 1.9 and 1.10 identifies the patient population by ethnicity. It is important to note that data
was missing for approximately two-thirds of the patients in the control group in response to
ethnicity and the screening group did not include data on about half of the patients in the sample.
Developmental Comprehensive Screening Project 2009 RESULTS
14
Figure 1.9
Pre-Implementation Control Group – Ethnicity of Patients
0
20
40
60
80
100
Source: Center for Applied Demography & Survey Research
University of Delaware
Perc
ent
Hispanic 0.9 1.8 13.4 1.7
Non Hispanic 17.6 75.7 15.2 6.9
Unknown 81.5 22.5 71.4 91.4
Practice Site #1
N=108
Practice Site #2
N=111
Practice Site #3
N=112
Practice Site #4
N=116
Figure 1.10
Post-Implementation Screening Group – Ethnicity of Patients
0
20
40
60
80
100
Source: Center for Applied Demography & Survey Research
University of Delaware
Pe
rcen
t
Hispanic 1.3 7.7 16.8 6.2
Non Hispanic 45.6 70.2 40.2 25.5
Unknown 53.0 22.1 43.0 68.2
Practice Site #1
N=149
Practice Site #2
N=104
Practice Site #3
N=107
Practice Site #4
N=337
The majority of patients from all four practice sites were Non Hispanic although Practice Site #3
had a higher proportion of Hispanic patients than Practice Sites #1, #2 and #4. In Practice Site
#3 approximately 13.4% of the control group was identified as Hispanic while about 16.8% of the
patients in the screening group were identified as Hispanic (Figures 1.9 and 1.10).
Developmental Comprehensive Screening Project 2009 RESULTS
15
Comparisons
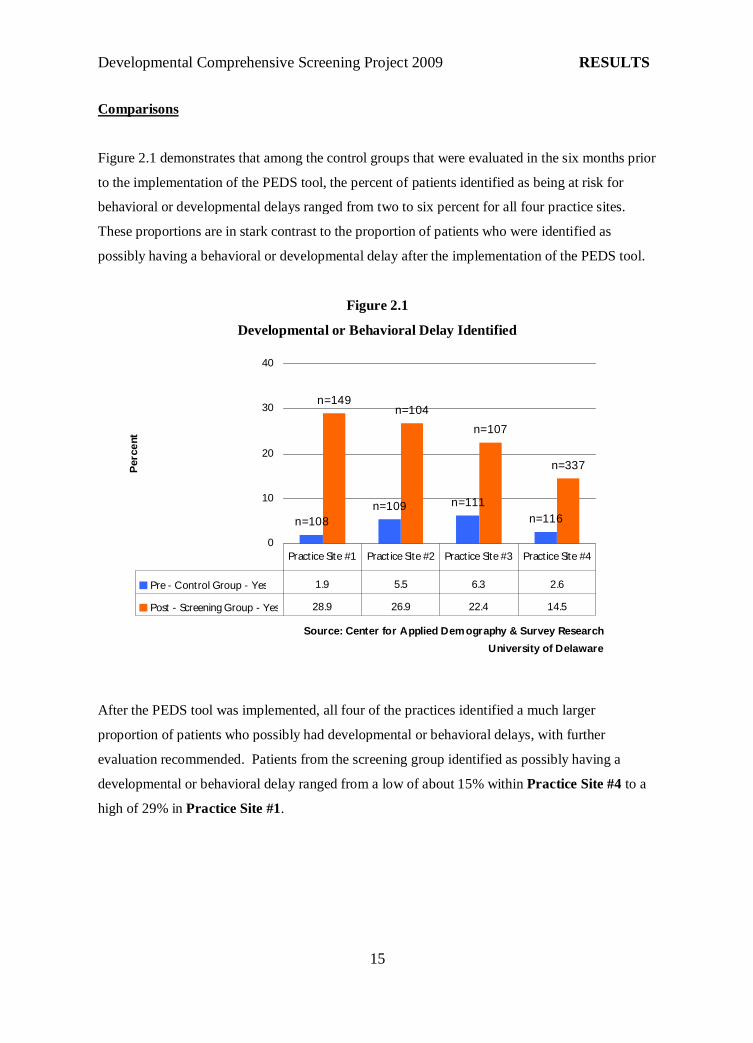
Figure 2.1 demonstrates that among the control groups that were evaluated in the six months prior
to the implementation of the PEDS tool, the percent of patients identified as being at risk for
behavioral or developmental delays ranged from two to six percent for all four practice sites.
These proportions are in stark contrast to the proportion of patients who were identified as
possibly having a behavioral or developmental delay after the implementation of the PEDS tool.
Figure 2.1
Developmental or Behavioral Delay Identified
n=116
n=111n=109
n=108
n=337
n=107
n=104n=149
0
10
20
30
40
Source: Center for Applied Demography & Survey Research
University of Delaware
Perc
ent
Pre - Control Group - Yes 1.9 5.5 6.3 2.6
Post - Screening Group - Yes 28.9 26.9 22.4 14.5
Practice Site #1 Practice Site #2 Practice Site #3 Practice Site #4
After the PEDS tool was implemented, all four of the practices identified a much larger
proportion of patients who possibly had developmental or behavioral delays, with further
evaluation recommended. Patients from the screening group identified as possibly having a
developmental or behavioral delay ranged from a low of about 15% within Practice Site #4 to a
high of 29% in Practice Site #1.
Developmental Comprehensive Screening Project 2009 RESULTS
16
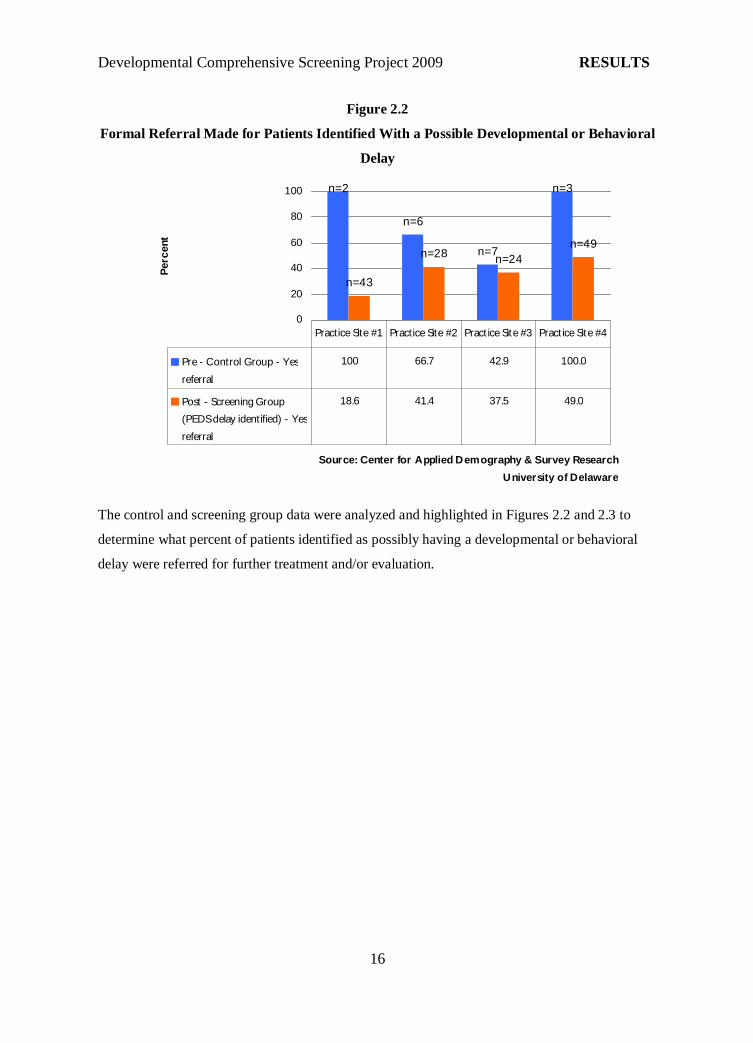
Figure 2.2
Formal Referral Made for Patients Identified With a Possible Developmental or Behavioral
Delay
n=3
n=7
n=6
n=2
n=49
n=24n=28
n=43
0
20
40
60
80
100
Source: Center for Applied Demography & Survey Research
University of Delaware
Perc
ent
Pre - Control Group - Yes
referral
100 66.7 42.9 100.0
Post - Screening Group
(PEDS delay identified) - Yes
referral
18.6 41.4 37.5 49.0
Practice Site #1 Practice Site #2 Practice Site #3 Practice Site #4
The control and screening group data were analyzed and highlighted in Figures 2.2 and 2.3 to
determine what percent of patients identified as possibly having a developmental or behavioral
delay were referred for further treatment and/or evaluation.
Developmental Comprehensive Screening Project 2009 RESULTS
17
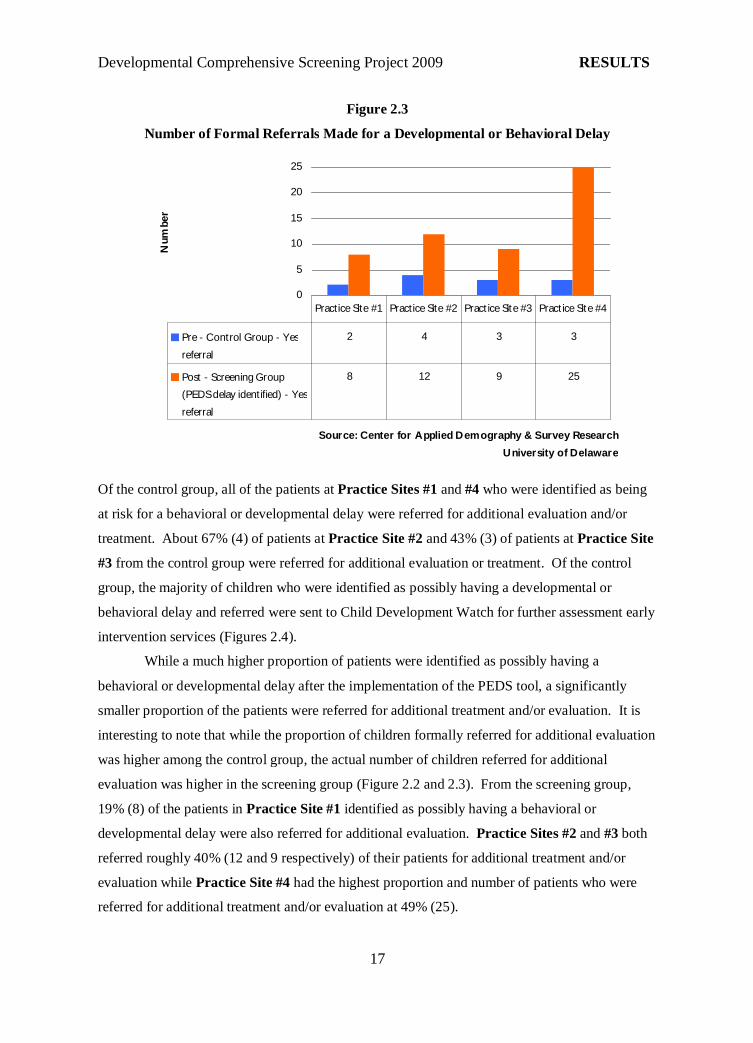
Figure 2.3
Number of Formal Referrals Made for a Developmental or Behavioral Delay
0
5
10
15
20
25
Source: Center for Applied Demography & Survey Research
University of Delaware
Num
ber
Pre - Control Group - Yes
referral
2 4 3 3
Post - Screening Group
(PEDS delay identified) - Yes
referral
8 12 9 25
Practice Site #1 Practice Site #2 Practice Site #3 Practice Site #4
Of the control group, all of the patients at Practice Sites #1 and #4 who were identified as being
at risk for a behavioral or developmental delay were referred for additional evaluation and/or
treatment. About 67% (4) of patients at Practice Site #2 and 43% (3) of patients at Practice Site
#3 from the control group were referred for additional evaluation or treatment. Of the control
group, the majority of children who were identified as possibly having a developmental or
behavioral delay and referred were sent to Child Development Watch for further assessment early
intervention services (Figures 2.4).
While a much higher proportion of patients were identified as possibly having a
behavioral or developmental delay after the implementation of the PEDS tool, a significantly
smaller proportion of the patients were referred for additional treatment and/or evaluation. It is
interesting to note that while the proportion of children formally referred for additional evaluation
was higher among the control group, the actual number of children referred for additional
evaluation was higher in the screening group (Figure 2.2 and 2.3). From the screening group,
19% (8) of the patients in Practice Site #1 identified as possibly having a behavioral or
developmental delay were also referred for additional evaluation. Practice Sites #2 and #3 both
referred roughly 40% (12 and 9 respectively) of their patients for additional treatment and/or
evaluation while Practice Site #4 had the highest proportion and number of patients who were
referred for additional treatment and/or evaluation at 49% (25).
Developmental Comprehensive Screening Project 2009 RESULTS
18
Figure 2.4
Location of Formal Referral made for a Developmental or Behavioral Delay
0
5
10
15
20
25
Source: Center for Applied Demography & Survey Research
University of Delaware
Num
ber
Child Development Watch 3 5 6 13
AI Dupont Hospital 0 1 0 4
Speech & Hearing 1 6 1 1
Pediatric Developmental &
Behavioral Health (Sussex
County)
2 0 0 0
School District 1 0 0 1
Other 1 0 2 6
Total 8 12 9 25
Practice Site
#1
Practice Site
#2
Practice Site
#3
Practice Site
#4
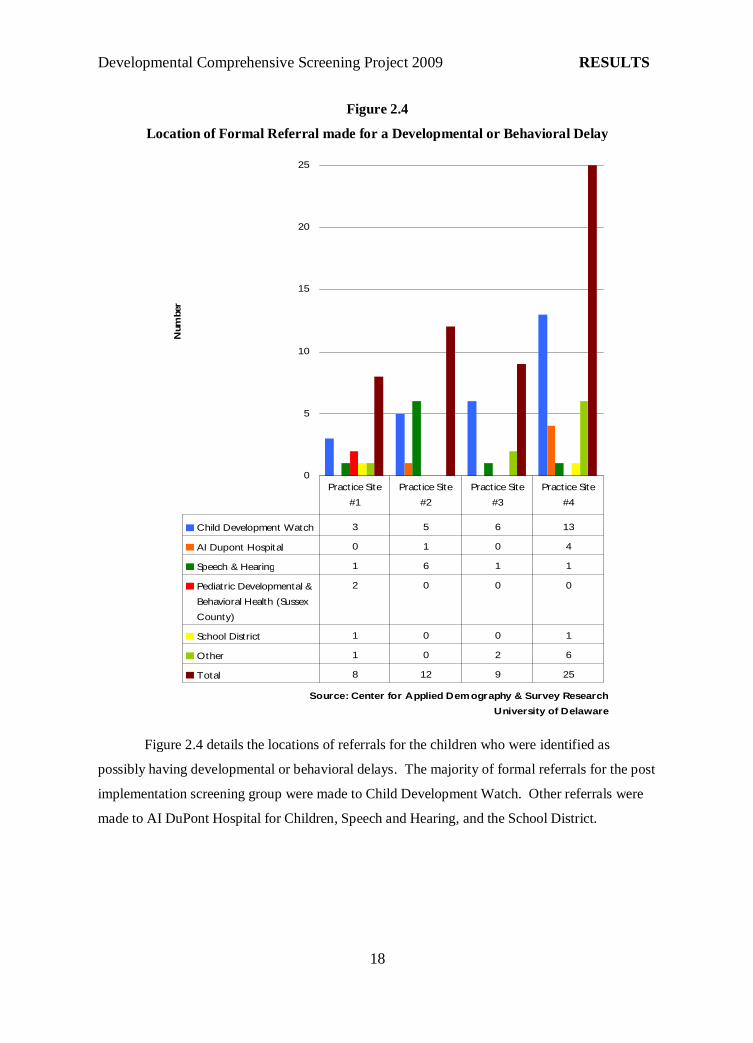
Figure 2.4 details the locations of referrals for the children who were identified as
possibly having developmental or behavioral delays. The majority of formal referrals for the post
implementation screening group were made to Child Development Watch. Other referrals were
made to AI DuPont Hospital for Children, Speech and Hearing, and the School District.
Developmental Comprehensive Screening Project 2009 RESULTS
19
Screening Group - PEDS Specific Analysis
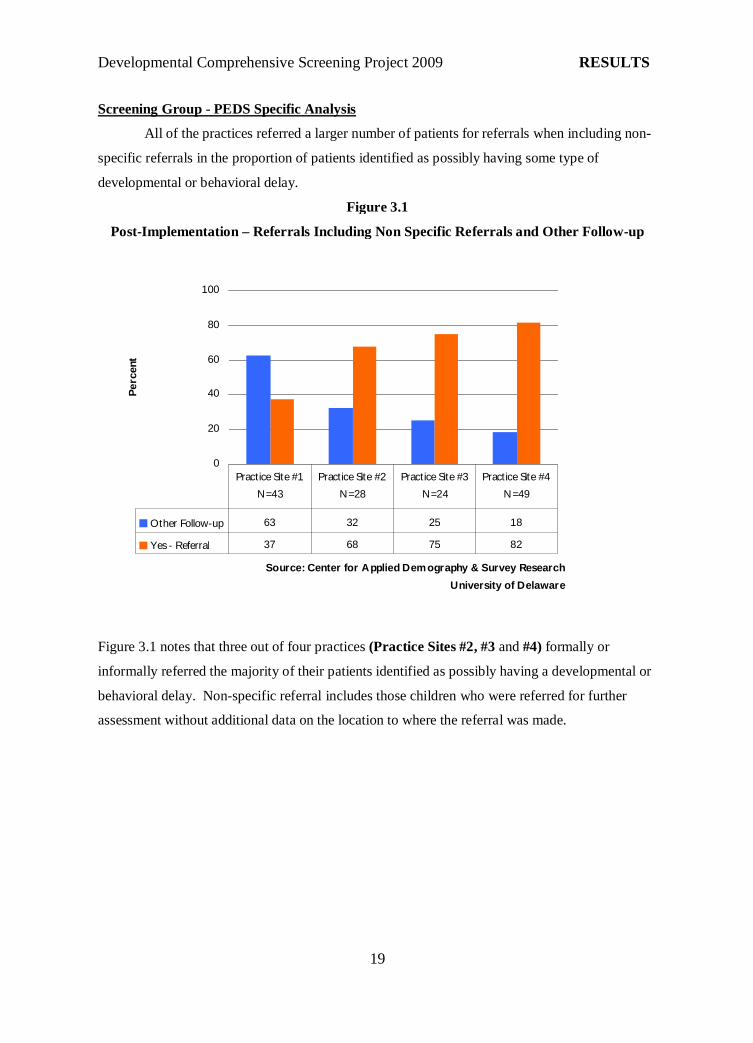
All of the practices referred a larger number of patients for referrals when including non-
specific referrals in the proportion of patients identified as possibly having some type of
developmental or behavioral delay.
Figure 3.1
Post-Implementation – Referrals Including Non Specific Referrals and Other Follow-up
0
20
40
60
80
100
Source: Center for Applied Demography & Survey Research
University of Delaware
Pe
rcent
Other Follow-up 63 32 25 18
Yes - Referral 37 68 75 82
Practice Site #1
N=43
Practice Site #2
N=28
Practice Site #3
N=24
Practice Site #4
N=49
Figure 3.1 notes that three out of four practices (Practice Sites #2, #3 and #4) formally or
informally referred the majority of their patients identified as possibly having a developmental or
behavioral delay. Non-specific referral includes those children who were referred for further
assessment without additional data on the location to where the referral was made.
Developmental Comprehensive Screening Project 2009 RESULTS
20
Figure 3.2
Post Implementation - Types of Follow-up
0
10
20
30
40
50
60
Source: Center for Applied Demography & Survey Research
University of Delaware
Perc
enta
ge
Child Referred for Further
Assessment
19 29 38 35
Parent was Counseled 70 39 33 41
Ongoing in office treatment
plan
7 0 13 0
Other 5 32 17 24
Practice Site#1
N=43
Practice Site#2
N=28
Practice Site#3
N=24
Practice Site#4
N=49
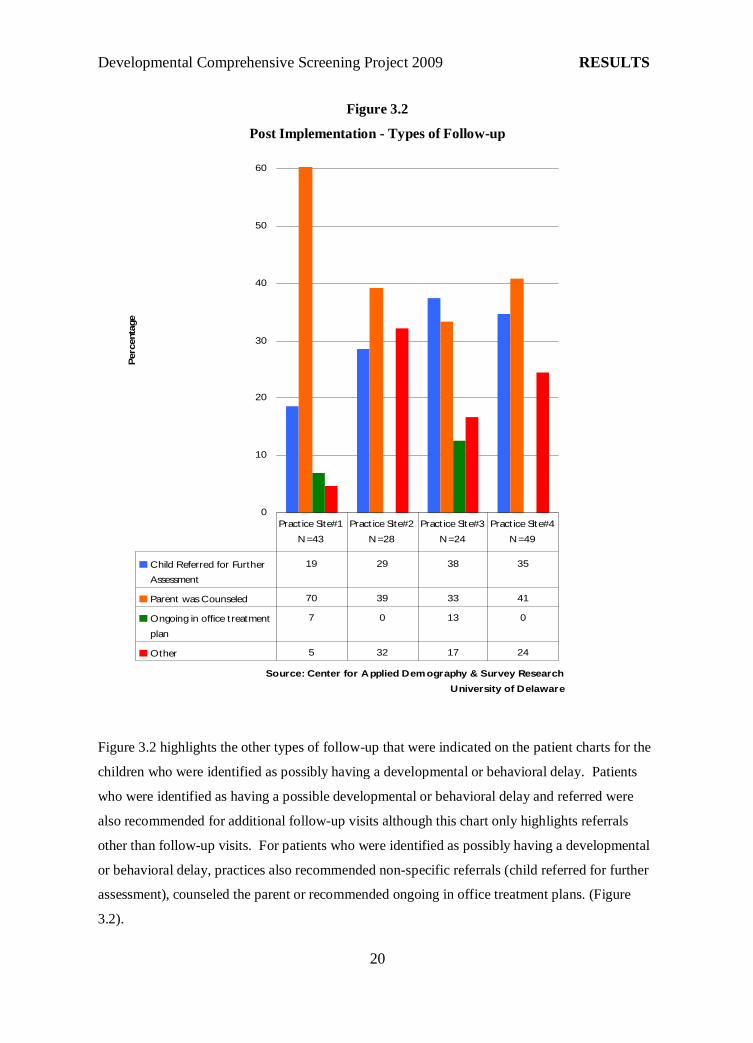
Figure 3.2 highlights the other types of follow-up that were indicated on the patient charts for the
children who were identified as possibly having a developmental or behavioral delay. Patients
who were identified as having a possible developmental or behavioral delay and referred were
also recommended for additional follow-up visits although this chart only highlights referrals
other than follow-up visits. For patients who were identified as possibly having a developmental
or behavioral delay, practices also recommended non-specific referrals (child referred for further
assessment), counseled the parent or recommended ongoing in office treatment plans. (Figure
3.2).
Developmental Comprehensive Screening Project 2009 RESULTS
21
Figure 3.3
Post-Implementation – Language of PEDS tool
0
20
40
60
80
100
Source: Center for Applied Demography & Survey Research
University of Delaware
Pe
rcen
t
English 98.6 100.0 88.2 100.0
Spanish 1.4 0.0 11.8 0.0
Practice Site #1
N=147
Practice Site #2
N=93
Practice Site #3
N=102
Practice Site #4
N=322
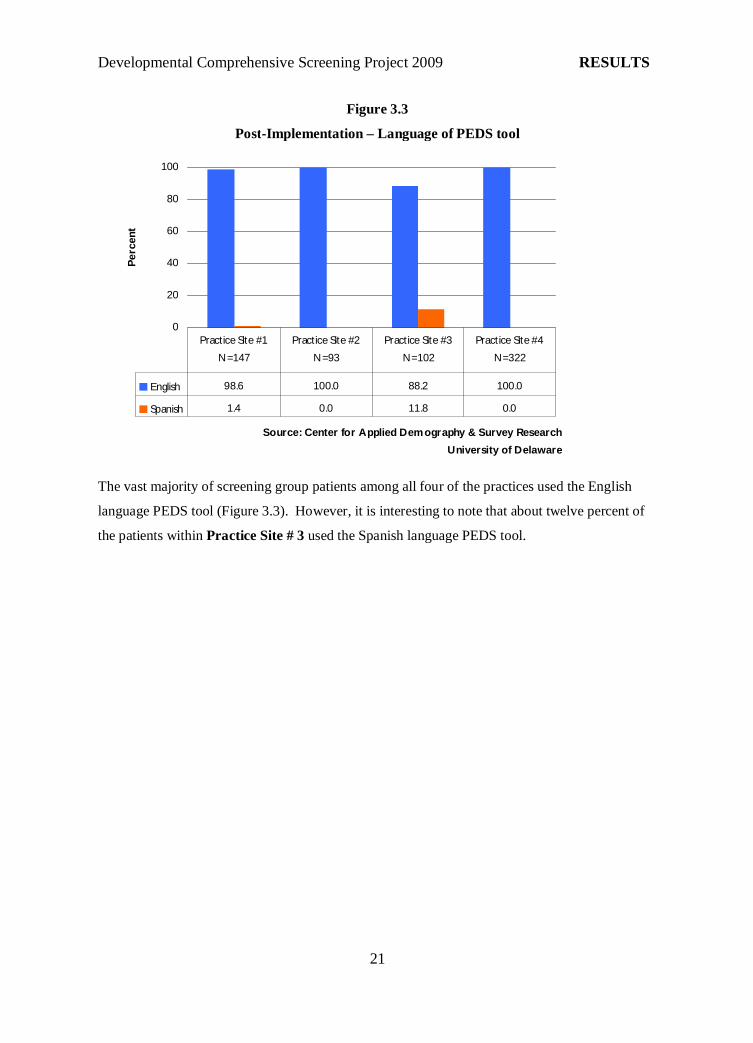
The vast majority of screening group patients among all four of the practices used the English
language PEDS tool (Figure 3.3). However, it is interesting to note that about twelve percent of
the patients within Practice Site # 3 used the Spanish language PEDS tool.
Developmental Comprehensive Screening Project 2009 RESULTS
22
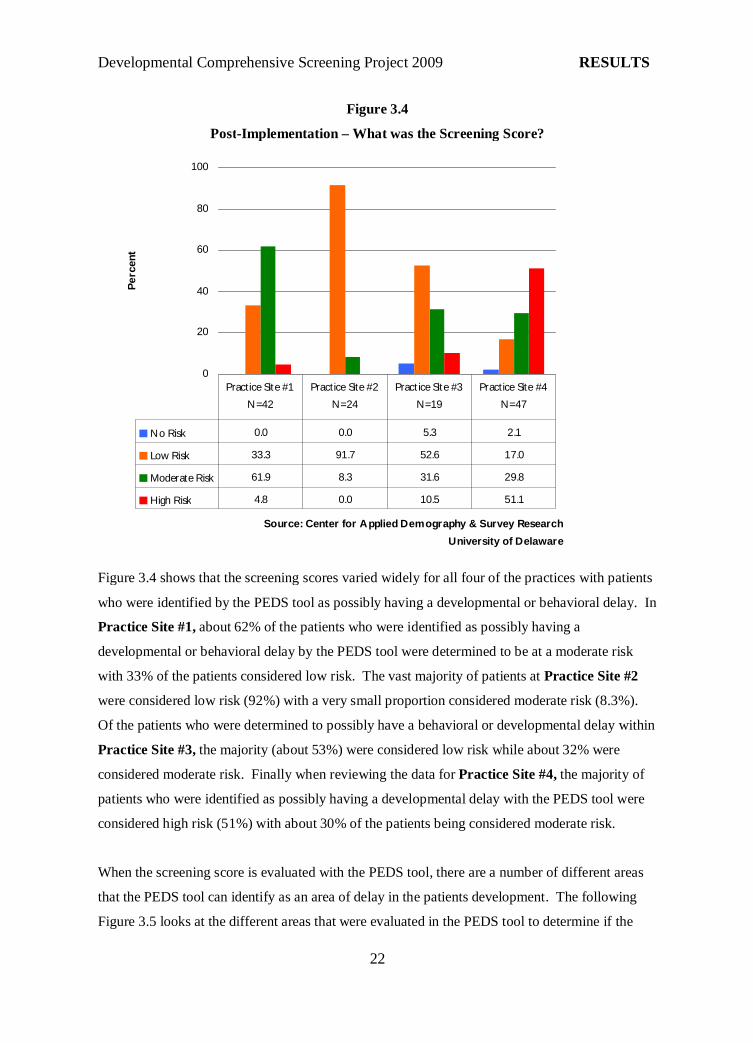
Figure 3.4
Post-Implementation – What was the Screening Score?
0
20
40
60
80
100
Source: Center for Applied Demography & Survey Research
University of Delaware
Pe
rcen
t
No Risk 0.0 0.0 5.3 2.1
Low Risk 33.3 91.7 52.6 17.0
Moderate Risk 61.9 8.3 31.6 29.8
High Risk 4.8 0.0 10.5 51.1
Practice Site #1
N=42
Practice Site #2
N=24
Practice Site #3
N=19
Practice Site #4
N=47
Figure 3.4 shows that the screening scores varied widely for all four of the practices with patients
who were identified by the PEDS tool as possibly having a developmental or behavioral delay. In
Practice Site #1, about 62% of the patients who were identified as possibly having a
developmental or behavioral delay by the PEDS tool were determined to be at a moderate risk
with 33% of the patients considered low risk. The vast majority of patients at Practice Site #2
were considered low risk (92%) with a very small proportion considered moderate risk (8.3%).
Of the patients who were determined to possibly have a behavioral or developmental delay within
Practice Site #3, the majority (about 53%) were considered low risk while about 32% were
considered moderate risk. Finally when reviewing the data for Practice Site #4, the majority of
patients who were identified as possibly having a developmental delay with the PEDS tool were
considered high risk (51%) with about 30% of the patients being considered moderate risk.
When the screening score is evaluated with the PEDS tool, there are a number of different areas
that the PEDS tool can identify as an area of delay in the patients development. The following
Figure 3.5 looks at the different areas that were evaluated in the PEDS tool to determine if the
Developmental Comprehensive Screening Project 2009 RESULTS
23
patient was at risk for a developmental or behavioral delay. The areas that the PEDS tool
identifies as areas of possible developmental or behavioral delay include: physical (gross and fine
motor), cognitive, social/emotional, communication and self-help. Some of the screening group
patients identified as having a delay with the PEDS tool were identified as possibly having a
behavioral or developmental delay in multiple areas.
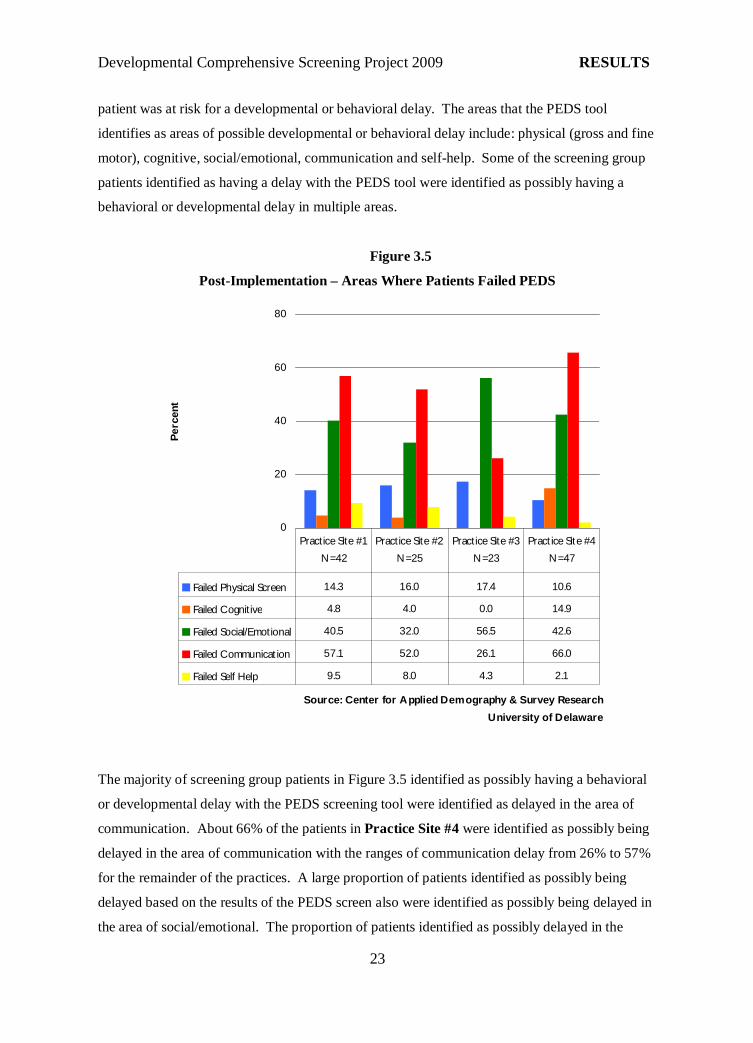
Figure 3.5
Post-Implementation – Areas Where Patients Failed PEDS
0
20
40
60
80
Source: Center for Applied Demography & Survey Research
University of Delaware
Pe
rcen
t
Failed Physical Screen 14.3 16.0 17.4 10.6
Failed Cognitive 4.8 4.0 0.0 14.9
Failed Social/Emotional 40.5 32.0 56.5 42.6
Failed Communication 57.1 52.0 26.1 66.0
Failed Self Help 9.5 8.0 4.3 2.1
Practice Site #1
N=42
Practice Site #2
N=25
Practice Site #3
N=23
Practice Site #4
N=47
The majority of screening group patients in Figure 3.5 identified as possibly having a behavioral
or developmental delay with the PEDS screening tool were identified as delayed in the area of
communication. About 66% of the patients in Practice Site #4 were identified as possibly being
delayed in the area of communication with the ranges of communication delay from 26% to 57%
for the remainder of the practices. A large proportion of patients identified as possibly being
delayed based on the results of the PEDS screen also were identified as possibly being delayed in
the area of social/emotional. The proportion of patients identified as possibly delayed in the
Developmental Comprehensive Screening Project 2009 RESULTS
24
social/emotional screen ranged from about 32% in Practice Site #2 to about 57% in Practice Site
#3. Of the patients identified as possibly having a developmental or behavioral delay with the
PEDS tool, the proportion identified as possibly delayed in physical abilities ranged from about
11% to 17% within all four practices. A significant proportion of the patients identified as
possibly being delayed within Practice Site #4 were delayed in cognitive development (15%).
Among the other three practices, the percent of patients identified as possibly delayed in
cognitive development ranged from zero to about five percent. Self help delays identified with
the PEDS tool was the area having the smallest percentage of patients identified as possibly
delayed. The range of patients identified as possibly delayed in self help development ranged
from about two percent to ten percent within all practices. The PEDS tool also captured some
children who were identified as potentially having developmental or behavioral delays in multiple
areas.
The PEDS tool allows for areas of developmental or behavioral delay to be evaluated by
level of risk and by type of delay. In Figures 3.6 to 3.10, we looked at level of risk by type of
developmental or behavioral delay. Some of the patients were identified as possibly having a
delay in multiple areas on the PEDS tool.
Developmental Comprehensive Screening Project 2009 RESULTS
25
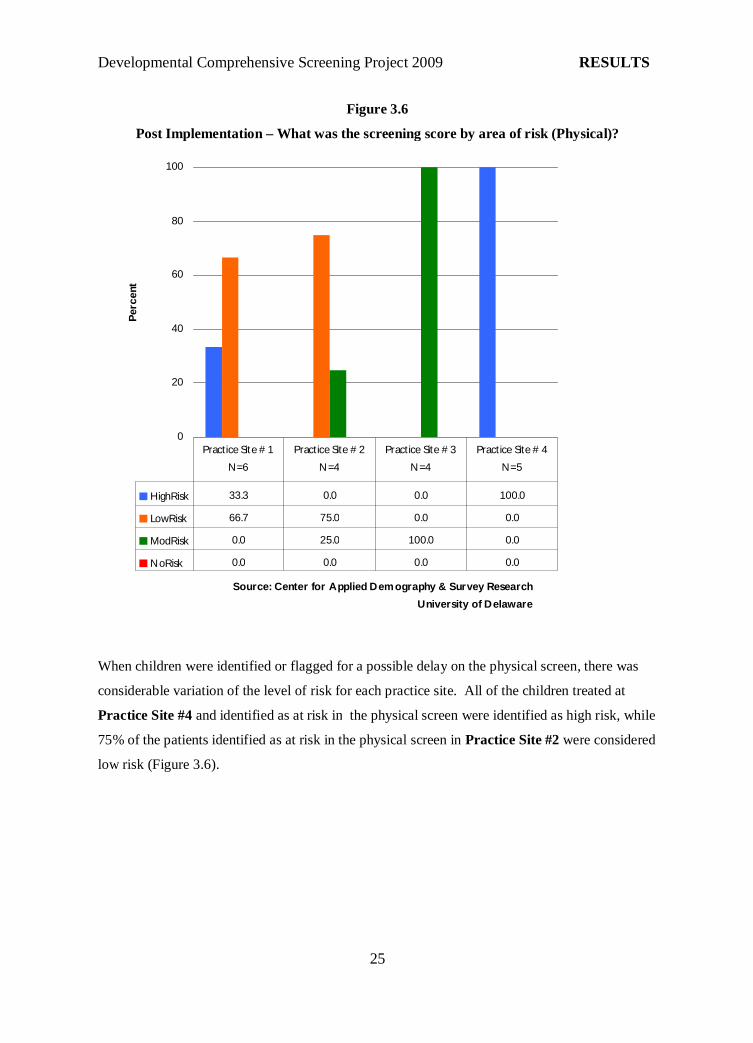
Figure 3.6
Post Implementation – What was the screening score by area of risk (Physical)?
0
20
40
60
80
100
Source: Center for Applied Demography & Survey Research
University of Delaware
Perc
ent
HighRisk 33.3 0.0 0.0 100.0
LowRisk 66.7 75.0 0.0 0.0
ModRisk 0.0 25.0 100.0 0.0
NoRisk 0.0 0.0 0.0 0.0
Practice Site # 1
N=6
Practice Site # 2
N=4
Practice Site # 3
N=4
Practice Site # 4
N=5
When children were identified or flagged for a possible delay on the physical screen, there was
considerable variation of the level of risk for each practice site. All of the children treated at
Practice Site #4 and identified as at risk in the physical screen were identified as high risk, while
75% of the patients identified as at risk in the physical screen in Practice Site #2 were considered
low risk (Figure 3.6).
Developmental Comprehensive Screening Project 2009 RESULTS
26
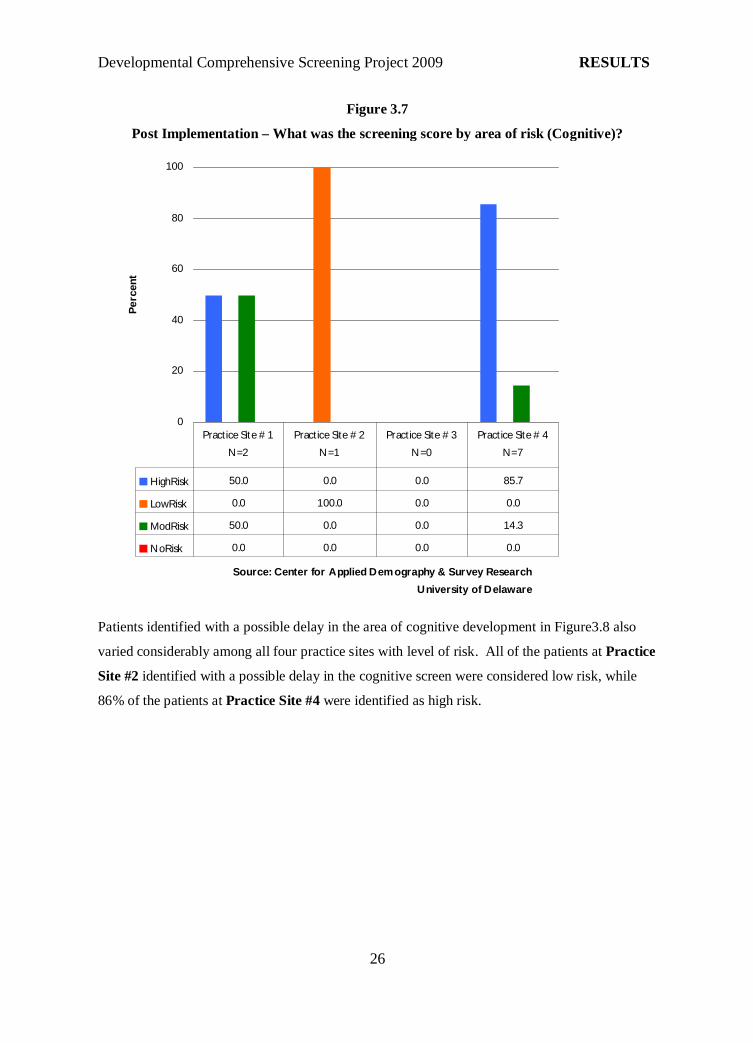
Figure 3.7
Post Implementation – What was the screening score by area of risk (Cognitive)?
0
20
40
60
80
100
Source: Center for Applied Demography & Survey Research
University of Delaware
Pe
rcen
t
HighRisk 50.0 0.0 0.0 85.7
LowRisk 0.0 100.0 0.0 0.0
ModRisk 50.0 0.0 0.0 14.3
NoRisk 0.0 0.0 0.0 0.0
Practice Site # 1
N=2
Practice Site # 2
N=1
Practice Site # 3
N=0
Practice Site # 4
N=7
Patients identified with a possible delay in the area of cognitive development in Figure3.8 also
varied considerably among all four practice sites with level of risk. All of the patients at Practice
Site #2 identified with a possible delay in the cognitive screen were considered low risk, while
86% of the patients at Practice Site #4 were identified as high risk.
Developmental Comprehensive Screening Project 2009 RESULTS
27
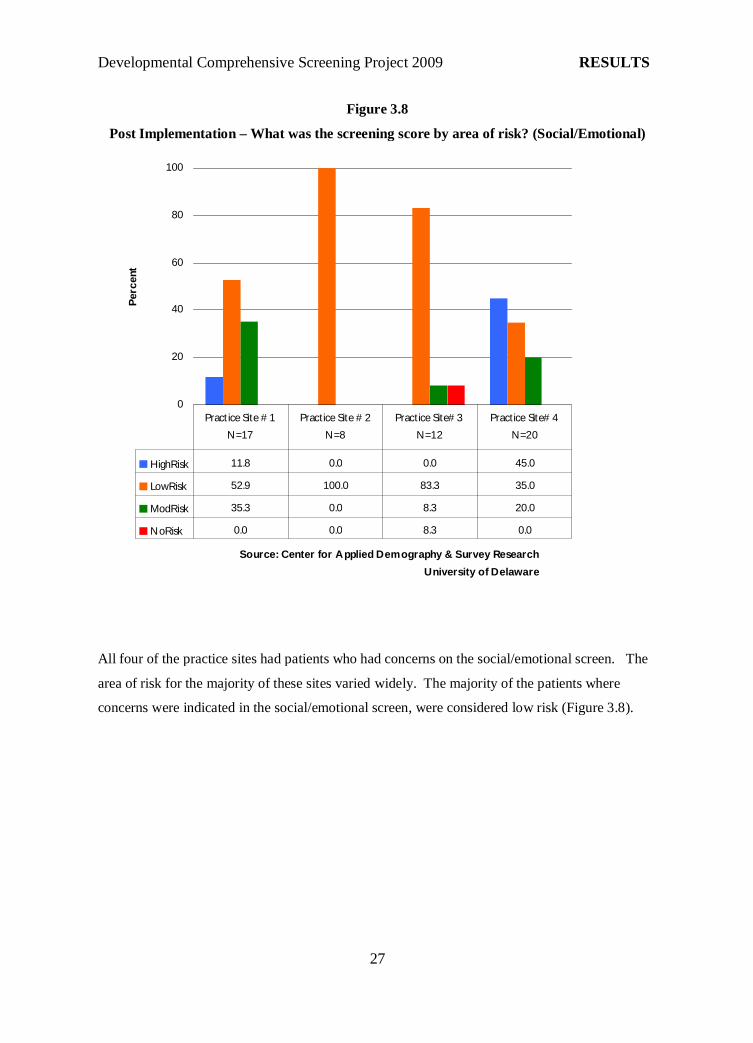
Figure 3.8
Post Implementation – What was the screening score by area of risk? (Social/Emotional)
0
20
40
60
80
100
Source: Center for Applied Demography & Survey Research
University of Delaware
Perc
ent
HighRisk 11.8 0.0 0.0 45.0
LowRisk 52.9 100.0 83.3 35.0
ModRisk 35.3 0.0 8.3 20.0
NoRisk 0.0 0.0 8.3 0.0
Practice Site # 1
N=17
Practice Site # 2
N=8
Practice Site# 3
N=12
Practice Site# 4
N=20
All four of the practice sites had patients who had concerns on the social/emotional screen. The
area of risk for the majority of these sites varied widely. The majority of the patients where
concerns were indicated in the social/emotional screen, were considered low risk (Figure 3.8).
Developmental Comprehensive Screening Project 2009 RESULTS
28
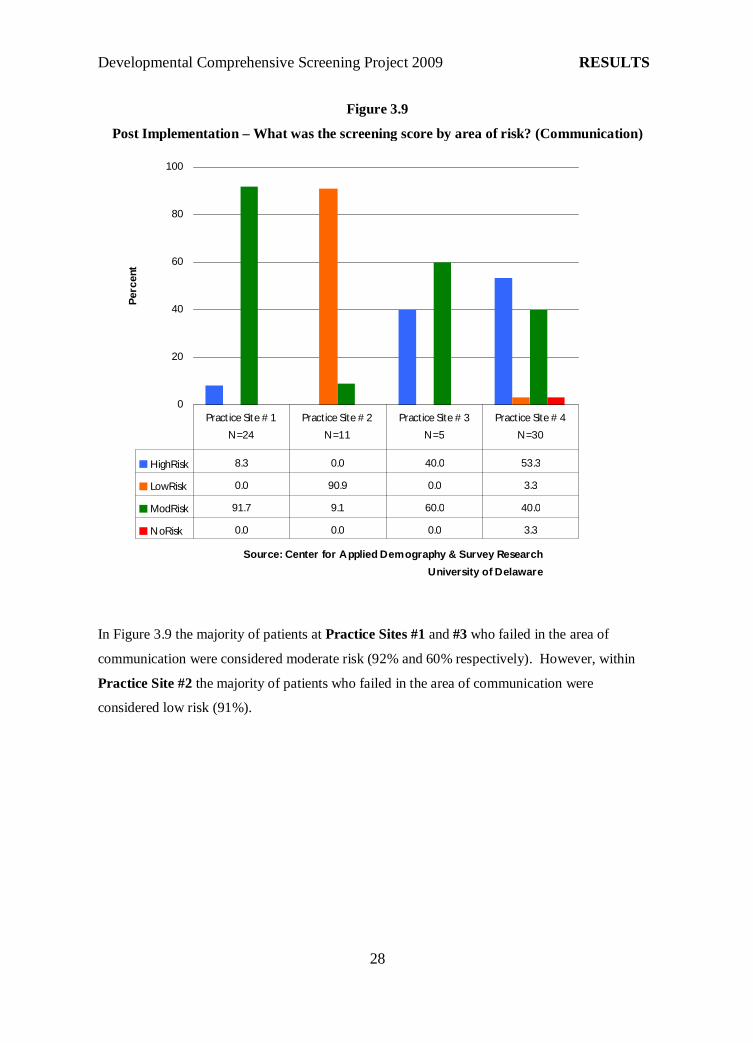
Figure 3.9
Post Implementation – What was the screening score by area of risk? (Communication)
0
20
40
60
80
100
Source: Center for Applied Demography & Survey Research
University of Delaware
Perc
ent
HighRisk 8.3 0.0 40.0 53.3
LowRisk 0.0 90.9 0.0 3.3
ModRisk 91.7 9.1 60.0 40.0
NoRisk 0.0 0.0 0.0 3.3
Practice Site # 1
N=24
Practice Site # 2
N=11
Practice Site # 3
N=5
Practice Site # 4
N=30
In Figure 3.9 the majority of patients at Practice Sites #1 and #3 who failed in the area of
communication were considered moderate risk (92% and 60% respectively). However, within
Practice Site #2 the majority of patients who failed in the area of communication were
considered low risk (91%).
Developmental Comprehensive Screening Project 2009 RESULTS
29
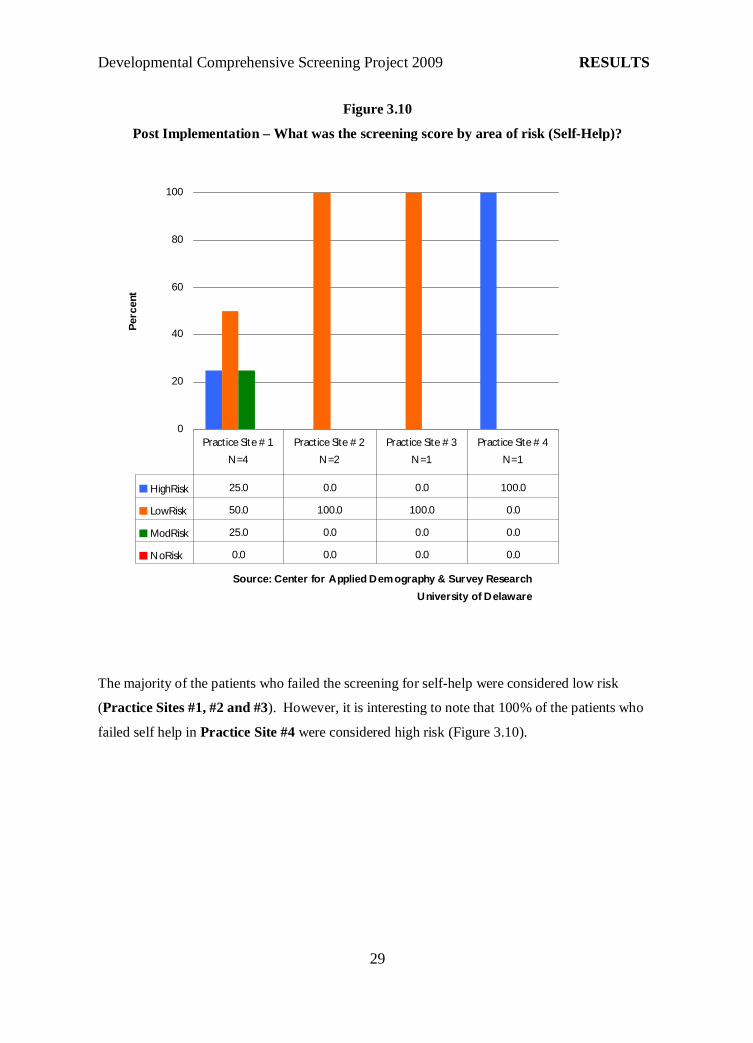
Figure 3.10
Post Implementation – What was the screening score by area of risk (Self-Help)?
0
20
40
60
80
100
Source: Center for Applied Demography & Survey Research
University of Delaware
Perc
ent
HighRisk 25.0 0.0 0.0 100.0
LowRisk 50.0 100.0 100.0 0.0
ModRisk 25.0 0.0 0.0 0.0
NoRisk 0.0 0.0 0.0 0.0
Practice Site # 1
N=4
Practice Site # 2
N=2
Practice Site # 3
N=1
Practice Site # 4
N=1
The majority of the patients who failed the screening for self-help were considered low risk
(Practice Sites #1, #2 and #3). However, it is interesting to note that 100% of the patients who
failed self help in Practice Site #4 were considered high risk (Figure 3.10).
Developmental Comprehensive Screening Project 2009 DISCUSSION
30
DISCUSSION
Because we could not assert that any of the data drawn from the four practices was
generalizable to the entire state of Delaware or by county, we provided detailed analysis of the
data aggregated by practice only and not by county or statewide analysis. Each of the records of
both the control group and the screening group were evaluated to determine the number of
children that were previously and newly diagnosed with a concern for a behavioral or
developmental delay. We evaluated the number of referrals that were made for behavioral and
developmental delays prior to and after the implementation of the PEDS tool and where the
referrals were made for the children that were determined to need some type of further evaluation
for an early intervention program.
Based on our analysis, we found that the use of the PEDS tool identified a higher
proportion of children with possible developmental and behavioral delays uniformly across
practices. During the project there were significant numbers of children who failed the
developmental screening test and were not formally referred to early intervention. Although the
majority of children who were not referred were in the low risk range, there were some children
who were considered moderate risk and high risk who were not referred. After accounting for
non-specific referrals (children who were referred for further assessment without specific data on
the location of the referral), the number of patients who were referred dramatically increased.
Other than referrals, additional follow-up included ongoing in office treatment or the parent was
counseled.
During the course of this research project, there was some initial difficulty recruiting
physician practices to participate in the implementation of the PEDS pilot program. The length of
time for the control and the screening year had to be reduced to six months from the original time
period of eight months due to the delay with recruiting and training the practices. While two
practices were initially recruited for the project, one of the first practices later declined to
participate; and the process to recruit the other physician practices needed for the pilot program
took additional time. Another challenge was the recruitment of practices and communication
with office staff during the summer months, when staff and physicians were often out of the
office on vacations.
Throughout the project, the implementation of the PEDS tool was a challenge for some of
the practices. There was considerable variability with the usage of the PEDS tool among all four
of the practices. Cumulative screening rates ranged from 73% to 99% during the six month post-
implementation study period. It took more time in some practices than others for the nurse
Developmental Comprehensive Screening Project 2009 DISCUSSION
31
educators to build relationships with the provider office staff and effectively integrate the
screening tool into each practice’s unique workflow.
There was a variety of reasons the practices had difficulty implementing the utilization of
the PEDS tool. Some of the challenges included the season during which the project took place.
The fall/winter months are customarily flu season and during the implementation of the PEDS
tool the H1N1 flu began to significantly affect pediatric practices. The advent of the both the flu
and H1N1 made it difficult for some of the practices to juggle conducting the developmental
screening and maintaining attention to the needs of patients during an increased number of sick
child visits.
Developmental Comprehensive Screening Project 2009 APPENDIX A
32
APPENDIX A
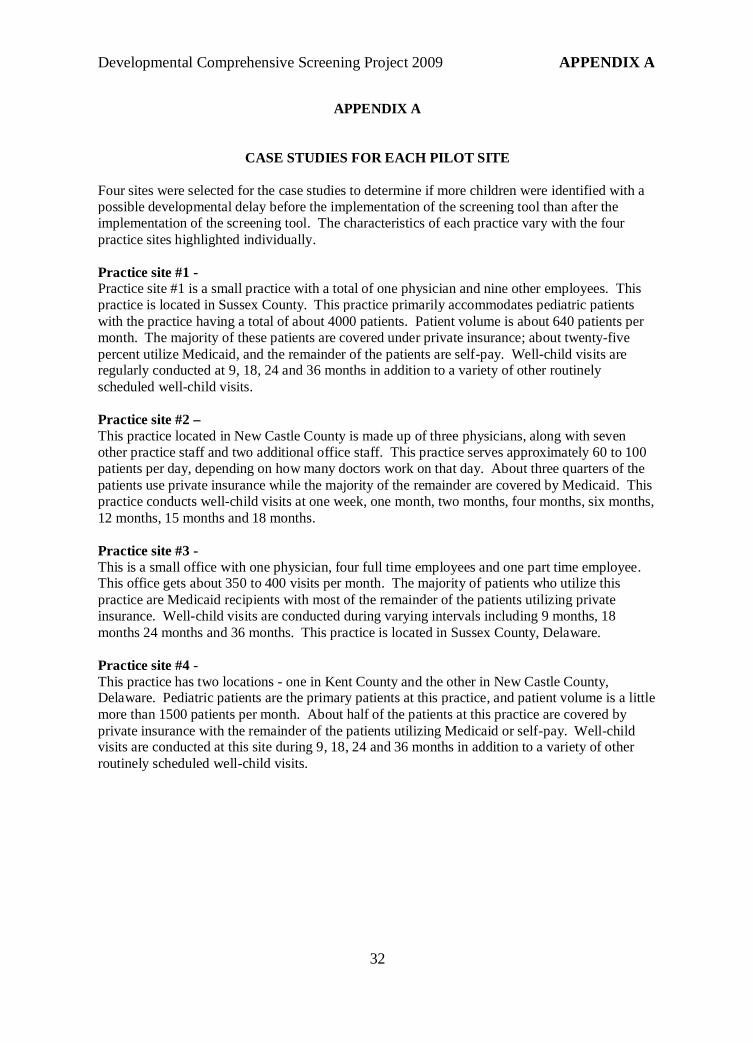
CASE STUDIES FOR EACH PILOT SITE
Four sites were selected for the case studies to determine if more children were identified with apossible developmental delay before the implementation of the screening tool than after theimplementation of the screening tool. The characteristics of each practice vary with the fourpractice sites highlighted individually.
Practice site #1 -Practice site #1 is a small practice with a total of one physician and nine other employees. Thispractice is located in Sussex County. This practice primarily accommodates pediatric patientswith the practice having a total of about 4000 patients. Patient volume is about 640 patients permonth. The majority of these patients are covered under private insurance; about twenty-fivepercent utilize Medicaid, and the remainder of the patients are self-pay. Well-child visits areregularly conducted at 9, 18, 24 and 36 months in addition to a variety of other routinelyscheduled well-child visits.
Practice site #2 –This practice located in New Castle County is made up of three physicians, along with sevenother practice staff and two additional office staff. This practice serves approximately 60 to 100patients per day, depending on how many doctors work on that day. About three quarters of thepatients use private insurance while the majority of the remainder are covered by Medicaid. Thispractice conducts well-child visits at one week, one month, two months, four months, six months,12 months, 15 months and 18 months.
Practice site #3 -This is a small office with one physician, four full time employees and one part time employee.This office gets about 350 to 400 visits per month. The majority of patients who utilize thispractice are Medicaid recipients with most of the remainder of the patients utilizing privateinsurance. Well-child visits are conducted during varying intervals including 9 months, 18months 24 months and 36 months. This practice is located in Sussex County, Delaware.
Practice site #4 -This practice has two locations - one in Kent County and the other in New Castle County,Delaware. Pediatric patients are the primary patients at this practice, and patient volume is a littlemore than 1500 patients per month. About half of the patients at this practice are covered byprivate insurance with the remainder of the patients utilizing Medicaid or self-pay. Well-childvisits are conducted at this site during 9, 18, 24 and 36 months in addition to a variety of otherroutinely scheduled well-child visits.
Developmental Comprehensive Screening Project 2009 APPENDIX B
33
APPENDIX B
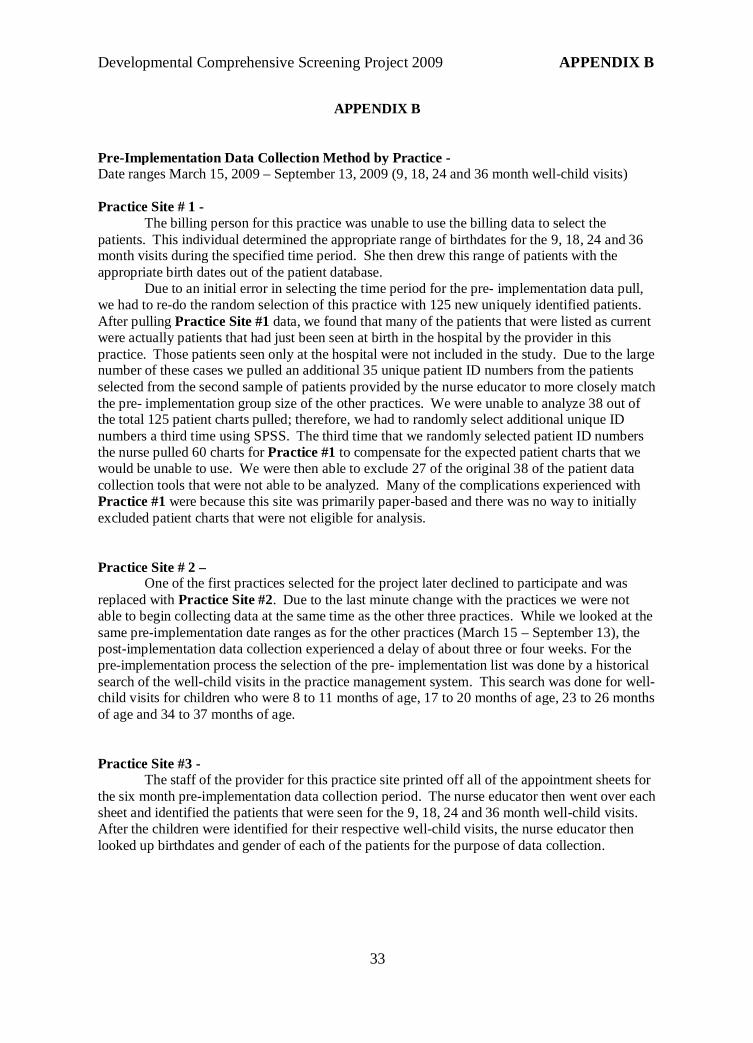
Pre-Implementation Data Collection Method by Practice -Date ranges March 15, 2009 – September 13, 2009 (9, 18, 24 and 36 month well-child visits)
Practice Site # 1 -The billing person for this practice was unable to use the billing data to select the
patients. This individual determined the appropriate range of birthdates for the 9, 18, 24 and 36month visits during the specified time period. She then drew this range of patients with theappropriate birth dates out of the patient database.
Due to an initial error in selecting the time period for the pre- implementation data pull,we had to re-do the random selection of this practice with 125 new uniquely identified patients.After pulling Practice Site #1 data, we found that many of the patients that were listed as currentwere actually patients that had just been seen at birth in the hospital by the provider in thispractice. Those patients seen only at the hospital were not included in the study. Due to the largenumber of these cases we pulled an additional 35 unique patient ID numbers from the patientsselected from the second sample of patients provided by the nurse educator to more closely matchthe pre- implementation group size of the other practices. We were unable to analyze 38 out ofthe total 125 patient charts pulled; therefore, we had to randomly select additional unique IDnumbers a third time using SPSS. The third time that we randomly selected patient ID numbersthe nurse pulled 60 charts for Practice #1 to compensate for the expected patient charts that wewould be unable to use. We were then able to exclude 27 of the original 38 of the patient datacollection tools that were not able to be analyzed. Many of the complications experienced withPractice #1 were because this site was primarily paper-based and there was no way to initiallyexcluded patient charts that were not eligible for analysis.
Practice Site # 2 –One of the first practices selected for the project later declined to participate and was
replaced with Practice Site #2. Due to the last minute change with the practices we were notable to begin collecting data at the same time as the other three practices. While we looked at thesame pre-implementation date ranges as for the other practices (March 15 – September 13), thepost-implementation data collection experienced a delay of about three or four weeks. For thepre-implementation process the selection of the pre- implementation list was done by a historicalsearch of the well-child visits in the practice management system. This search was done for well-child visits for children who were 8 to 11 months of age, 17 to 20 months of age, 23 to 26 monthsof age and 34 to 37 months of age.
Practice Site #3 -The staff of the provider for this practice site printed off all of the appointment sheets for
the six month pre-implementation data collection period. The nurse educator then went over eachsheet and identified the patients that were seen for the 9, 18, 24 and 36 month well-child visits.After the children were identified for their respective well-child visits, the nurse educator thenlooked up birthdates and gender of each of the patients for the purpose of data collection.
Developmental Comprehensive Screening Project 2009 APPENDIX B
34
Practice Site #4 –The pre-implementation process utilized an electronic method to gather the names of the
patients for the 9, 18, 24 and 36 month birth dates. The practice utilized this method to do anelectronic query of the patients seen during the March 15, 2009 – September 13 date range.
After analyzing the first 125 randomly selected patients, we determined that 24 of thepatients selected could not be used for analysis because they had either transferred out of thepractice or were no shows to their appointments. Due to this high number of missing patientdata, we had to randomly select additional patient ID numbers. In this case, we randomlyselected an additional 25 charts to compensate for the patient charts that could not be used foranalysis.
Developmental Comprehensive Screening Project 2009 APPENDIX C
35
APPENDIX C
Post-Implementation Data Collection Method by Practice -Date ranges September 14, 2009 – March 12, 2009 (9, 18, 24 and 36 month well-child visits)
Practice Site #1 -This practice kept a list of the patients who attended their 9, 18, 24 and 36 month well-
child patients for the week. The designated office staff in the practice then physically pulled eachchart of the children who attended the well-child visits and provided that chart to the nurseeducator to complete the data collection.
Practice Site #2 –Although post-implementation was supposed to begin in September, it was delayed with
this practice because it was selected to participate at a later date than the other participating sites.The actual implementation date of the PEDS tool was as late as October 22, 2009. The methodthat this practice used to identify the patients who attended the well-child visits prior to December7 was the following. The billing list was pulled by the nurse educator. The children who came tothe doctor for a well-child visit were listed with a double entry on the billing list as opposed to asingle entry for sick child visits. The billing list did not include any identifiers, such as birth date.
After December 7, the nurse educator was provided with a daily schedule that also listedthe well-child visits. This daily schedule included identifiers and also included the birth date ofthe child. The inclusion of the birth dates on the daily schedule meant that even if the nurse wasnot able to recover the chart, she was able to keep track of what patients she was not able to getchart information for that should have been included based on their birth dates.
As previously noted, prior to December 7 when the billing list was used, the nurseeducator did not have the patients’ birth dates. If a patient chart was not on the shelf beforeDecember 7, there was no way to keep track of whether or not a child should have been includedbased on their birth date. Once the daily schedule was provided, the problem of not being able tokeep track of the charts was resolved. When the daily schedule was not provided during somedays after December 7, some of the patients who should have been included could have beenmissed if the chart was not found in the files. Since their birth date was unknown, the nurseeducator would assume the chart was filed in a separate area for the older children.
In the first month of the project, the nurse educator for Practice Site #2 was justreceiving the completed PEDS tool from the provider. This meant that if there were children whocame in for their well-child visit and were not being screened, then they were not caught ashaving a missed screening during their well-child visit. This problem was discovered on October22 and should have no reflection on the presented data.
Practice Site #3 -The physician in this practice kept track of the patients by name based on which children
attended the well-child appointments for 9, 18, 24 and 36 months. This list of patients whoattended the well-child visits was provided to the nurse educator and she then pulled the patientcharts based on the names provided by the physician.
Practice Site #4 –The nurse educator reviewed the patient appointment log each day at the physician’s
practice and pulled the 9, 18, 24 and 36 month visit charts to gather the necessary information for
Developmental Comprehensive Screening Project 2009 APPENDIX C
36
the data collection tool. This practice experienced some difficulty with the implementation andconsisent usage of the PEDS tool. Some of the difficulties were likely because of staff turnoverduring the project period and the fact that H1N1 and the flu season took place during the sametime of this study’s implementation.

Developmental Comprehensive Screening Project 2009 APPENDIX D
37
APENDIX D
PEDS Project Chart ReviewDelaware Pilot Study (Pre Project Implementation)
ID # Month of Screening
Date of Abstraction__________________Provider___________________________
I. Demographic Information
Date of Birth: _______________________ Sex: Male Female
Date of Visit:_______________
Insurance Type:MedicaidPrivate InsurancePatient PayOther: Explain
Ethnicity: Hispanic Non-Hispanic
Race: White Black Other
II. Screening
1. Did a developmental screening take place for the month of screening identified above?Yes (proceed to question 2)No (stop)
2. Was a developmental or behavioral delay identified?Yes (proceed to question 3)No (Stop)
3. Was a referral made for a developmental or behavioral delay?YesNo
4. Where was the referral made to if a referral was made for a developmental orbehavioral delay?
Developmental Comprehensive Screening Project 2009 APPENDIX E
38
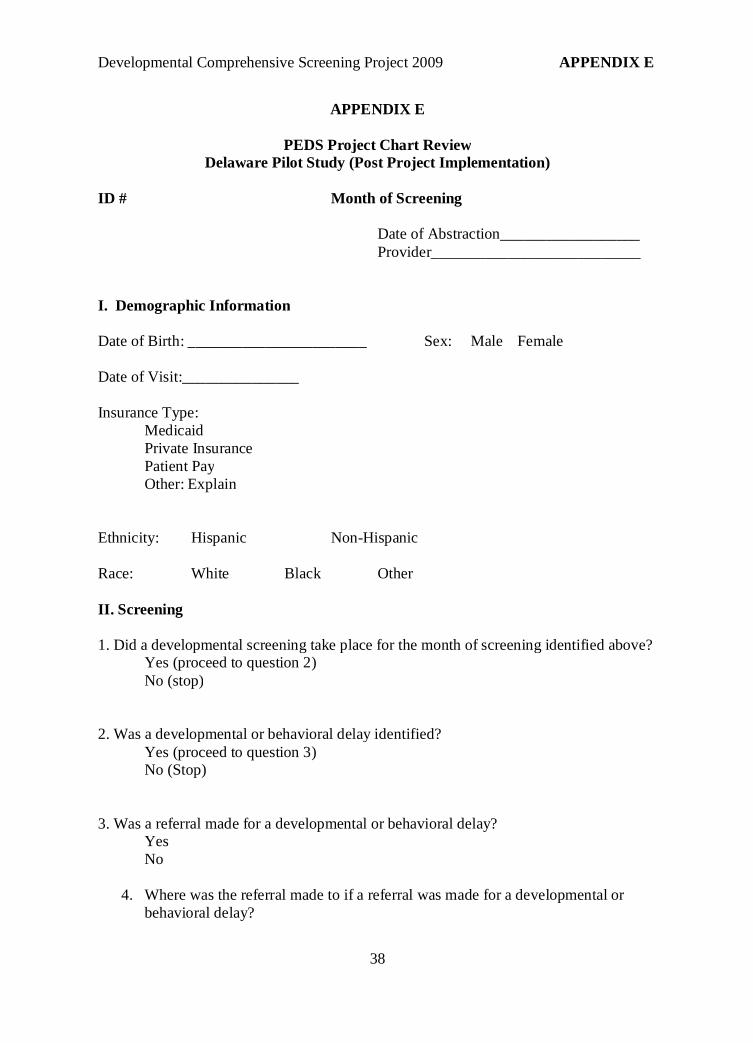
APPENDIX E
PEDS Project Chart ReviewDelaware Pilot Study (Post Project Implementation)
ID # Month of Screening
Date of Abstraction__________________Provider___________________________
I. Demographic Information
Date of Birth: _______________________ Sex: Male Female
Date of Visit:_______________
Insurance Type:MedicaidPrivate InsurancePatient PayOther: Explain
Ethnicity: Hispanic Non-Hispanic
Race: White Black Other
II. Screening
1. Did a developmental screening take place for the month of screening identified above?Yes (proceed to question 2)No (stop)
2. Was a developmental or behavioral delay identified?Yes (proceed to question 3)No (Stop)
3. Was a referral made for a developmental or behavioral delay?YesNo
4. Where was the referral made to if a referral was made for a developmental orbehavioral delay?

Developmental Comprehensive Screening Project 2009 APPENDIX E
39
PEDS Specific Questions
5. What was the screening score (circle one)?a. High riskb. Moderate Riskc. Low Riskd. No Risk(if missing go to 7b)
a. Area(s) failed: Physical (gross and fine motor) CognitiveSocial/Emotional Communication Self Help
(go to 6)
a. If missing, reason for missing score:
6. Please circle any of the following noted in the chart:
Scheduled follow-up visit Child referred for further assessment
Parent was counseled Child referred for treatment
The issue was addressed during the visit through the following:
Parent given activity sheets and/or brochures
Ongoing in-office treatment plan was devised
Other: Explain
None of the above: Explain
Developmental Comprehensive Screening Project 2009 APPENDIX F
40
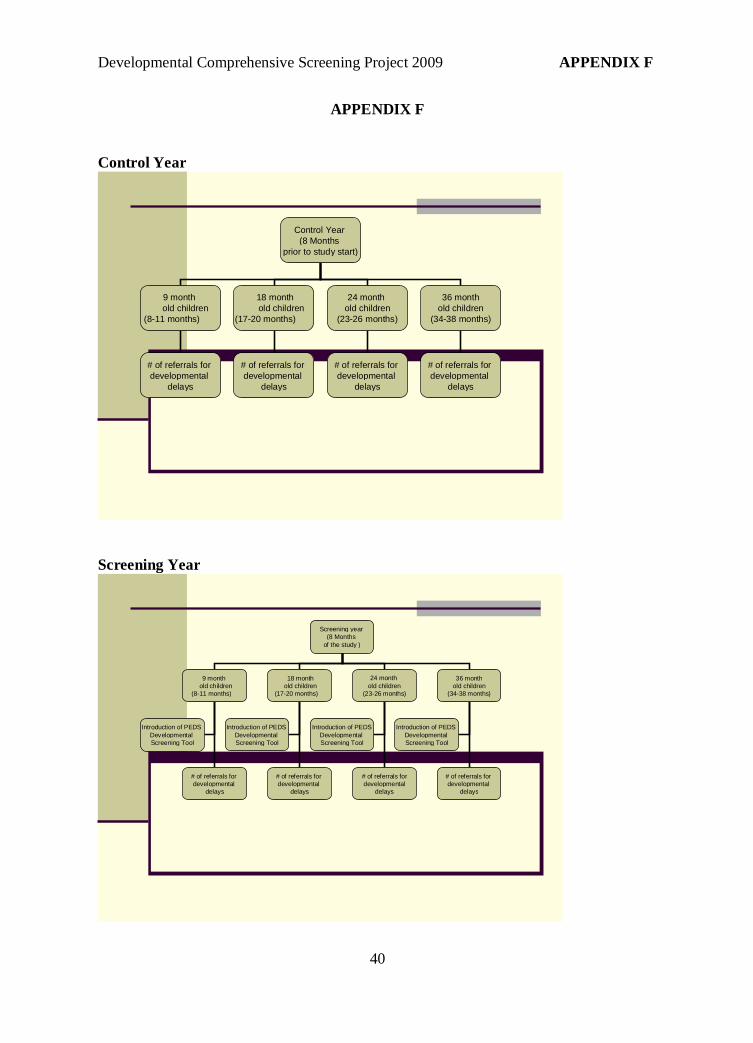
APPENDIX F
Control Year
Control Year(8 Months
prior to study start)
9 monthold children
(8-11 months)
18 monthold children
(17-20 months)
36 monthold children
(34-38 months)
# of referrals fordevelopmental
delays
# of referrals fordevelopmental
delays
# of referrals fordevelopmental
delays
24 monthold children
(23-26 months)
# of referrals fordevelopmental
delays
Screening Year
Screening year(8 Months
of the study )
9 monthold children
(8-11 months)
18 monthold children
(17-20 months)
36 monthold children
(34-38 months)
# of referrals fordevelopmental
delays
# of referrals fordevelopmental
delays
# of referrals fordevelopmental
delays
Introduction of PEDSDevelopmentalScreening Tool
Introduction of PEDSDevelopmentalScreening Tool
Introduction of PEDSDevelopmentalScreening Tool
24 monthold children
(23-26 months)
Introduction of PEDSDevelopmentalScreening Tool
# of referrals fordevelopmental
delays