Embed Size (px)
Citation preview
Developmental Strategy for a Bioinformatics Initiative
September 20, 2000Columbus, Ohio
Ernst & Young LLP Strategic Consulting for the Life Sciences
2
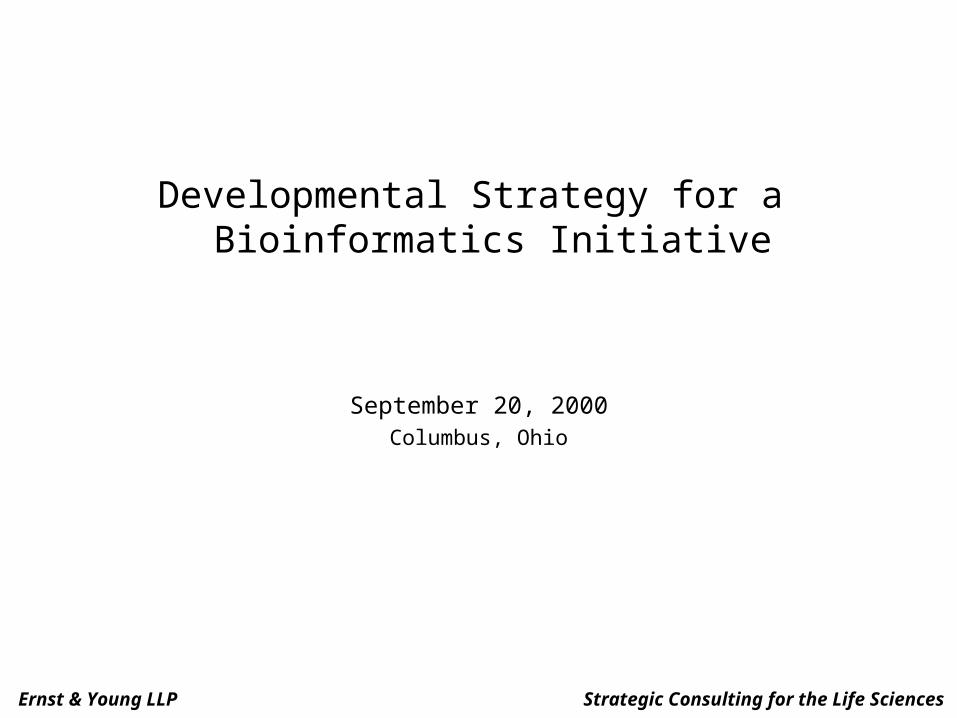
Introduction
A blue-ribbon panel of the NIH recently recommended supporting the formation of 20 bioinformatics centers with up to $20 MM for each center across the country. To obtain access to this funding through the establishment of a local Ohio center, the Edison BioTechnology Center (EBTC) is leading an assessment and business development project on behalf of the newly formed Ohio Information Technology Alliance, an organization funded by the Ohio Department of Development (ODOD). EBTC would like to determine whether the Ohio IT Alliance ought to establish a bioinformatics center and if so, the best means by which the Center may promote its educational , research, and technology development & commercialization objectives in the field of bioinformatics.
Commissioned by, and working closely with the EBTC, Ernst & Young LLP has conducted a study that provides the fundamental content for a strategic business plan. This study included an overview of the Bioinformatics field; an analysis of strengths and weaknesses in the Bioinformatics industry within the state of Ohio; a summary of focused interviews with academic and industrial leaders in Ohio; a roadmap to build-up a sustainable and differentiated Bioinformatics capability in Ohio through a statewide Bioinformatics initiative; and a five-year financial model forecasting the revenue, Costs and EBIT of the bioinformatics initiative, linked to a suit of Monte Carlo simulations run at several different input (demand) levels. These financial models were based upon a set of surveys coordinated by the EBTC that were sent to interview participants; their responses served as the backbone of the local market research.

What is Bioinformatics?

4
Bioinformatics
Bioinformatics Integrates Data from Many Sources
Source: C&EN News, Ernst & Young analysis
Gene discovery
• High-throughput genetic sequencing • Genetic algorithm searches • Genetic linkage studies • Genetic maps • Polymorphisms (SNPs)
Gene function
• Gene chips and microarrays • Gene expression profiles • Functional genomics • Proteomics • Metabolic pathways
Drug design
• Computer-aided drug design and molecular modeling • High-throughput screening • Structure-based drug design • Small-molecule-compound libraries • Virtual chemical libraries
Drug development
• Clinical trial data, efficacy data • Pharmacokinetics • Pharmacogenomics • Pharmacogenetics • Toxicology • Patient data and medical informatics
5
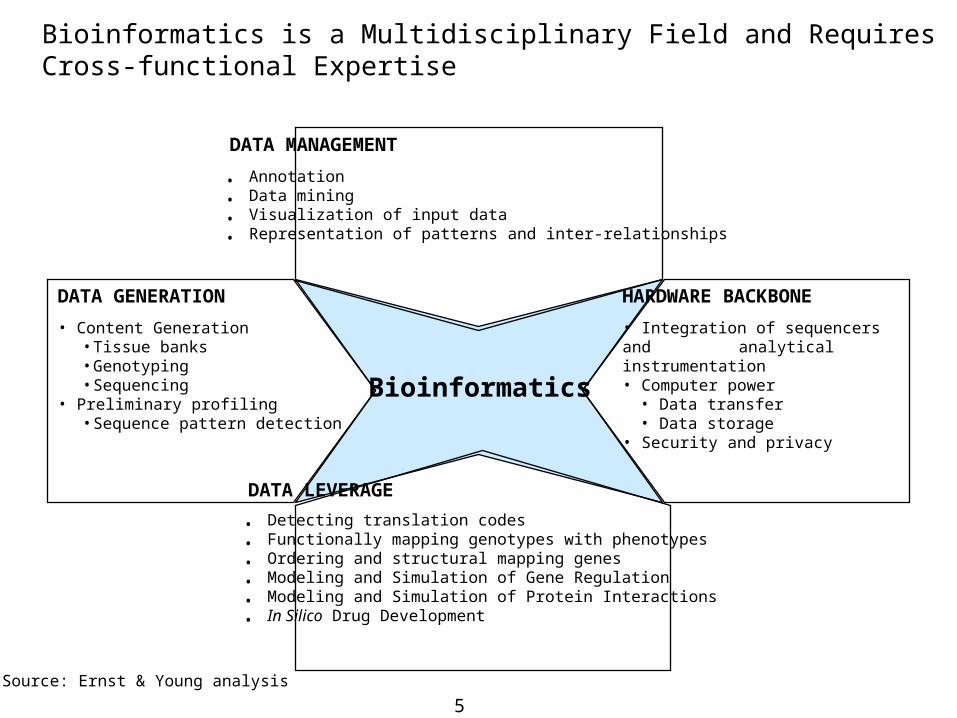
Bioinformatics is a Multidisciplinary Field and Requires Cross-functional Expertise
Source: Ernst & Young analysis
DATA GENERATION
• Content Generation• Tissue banks• Genotyping• Sequencing
• Preliminary profiling• Sequence pattern detection
HARDWARE BACKBONE
• Integration of sequencers and analytical instrumentation
• Computer power• Data transfer• Data storage
• Security and privacy
DATA MANAGEMENT
• Annotation• Data mining• Visualization of input data• Representation of patterns and inter-relationships
DATA LEVERAGE
• Detecting translation codes• Functionally mapping genotypes with phenotypes• Ordering and structural mapping genes• Modeling and Simulation of Gene Regulation• Modeling and Simulation of Protein Interactions• In Silico Drug Development
Bioinformatics
6
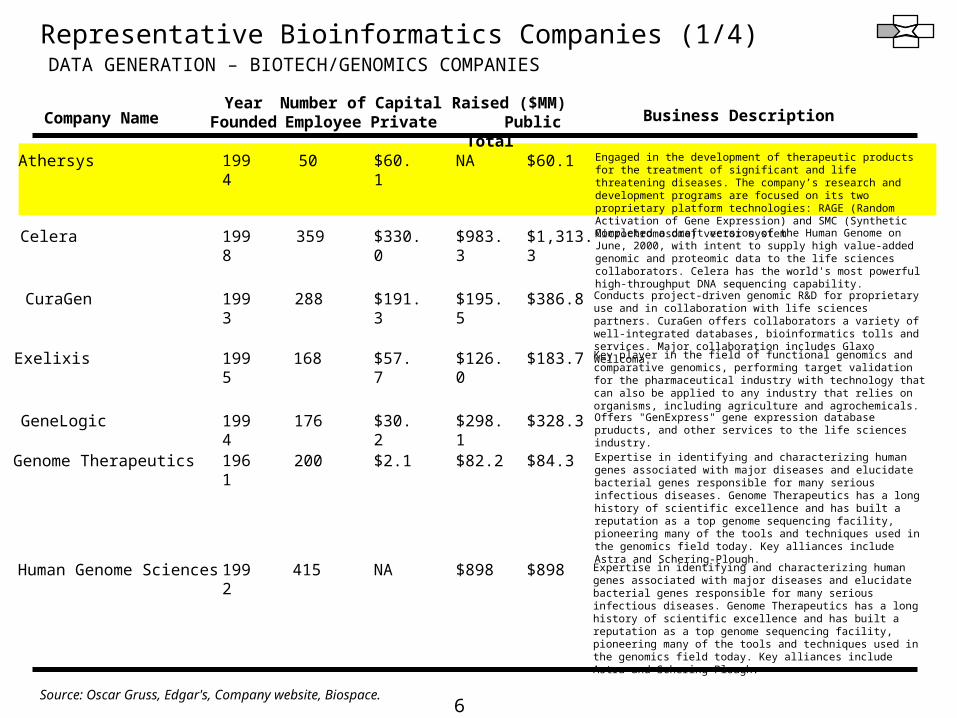
Representative Bioinformatics Companies (1/4)DATA GENERATION – BIOTECH/GENOMICS COMPANIES
Source: Oscar Gruss, Edgar's, Company website, Biospace.
Company NameYear
FoundedNumber of Employee
Capital Raised ($MM)Private Public Total Business Description
Athersys 1994 50 $60.1 NA $60.1 Engaged in the development of therapeutic products for the treatment of significant and life threatening diseases. The company’s research and development programs are focused on its two proprietary platform technologies: RAGE (Random Activation of Gene Expression) and SMC (Synthetic Microchromosome) vector system
Celera 1998 359 $330.0
$983.3 $1,313.3 Completed a draft version of the Human Genome on June, 2000, with intent to supply high value-added genomic and proteomic data to the life sciences collaborators. Celera has the world's most powerful high-throughput DNA sequencing capability.
CuraGen 1993 288 $191.3
$195.5 $386.8 Conducts project-driven genomic R&D for proprietary use and in collaboration with life sciences partners. CuraGen offers collaborators a variety of well-integrated databases, bioinformatics tolls and services. Major collaboration includes Glaxo Wellcoma.
Exelixis 1995 168 $57.7 $126.0 $183.7 Key player in the field of functional genomics and comparative genomics, performing target validation for the pharmaceutical industry with technology that can also be applied to any industry that relies on organisms, including agriculture and agrochemicals.
GeneLogic 1994 176 $30.2 $298.1 $328.3 Offers "GenExpress" gene expression database pruducts, and other services to the life sciences industry.
Genome Therapeutics 1961 200 $2.1 $82.2 $84.3 Expertise in identifying and characterizing human genes associated with major diseases and elucidate bacterial genes responsible for many serious infectious diseases. Genome Therapeutics has a long history of scientific excellence and has built a reputation as a top genome sequencing facility, pioneering many of the tools and techniques used in the genomics field today. Key alliances include Astra and Schering-Plough.
Human Genome Sciences 1992 415 NA $898 $898 Expertise in identifying and characterizing human genes associated with major diseases and elucidate bacterial genes responsible for many serious infectious diseases. Genome Therapeutics has a long history of scientific excellence and has built a reputation as a top genome sequencing facility, pioneering many of the tools and techniques used in the genomics field today. Key alliances include Astra and Schering-Plough.
7
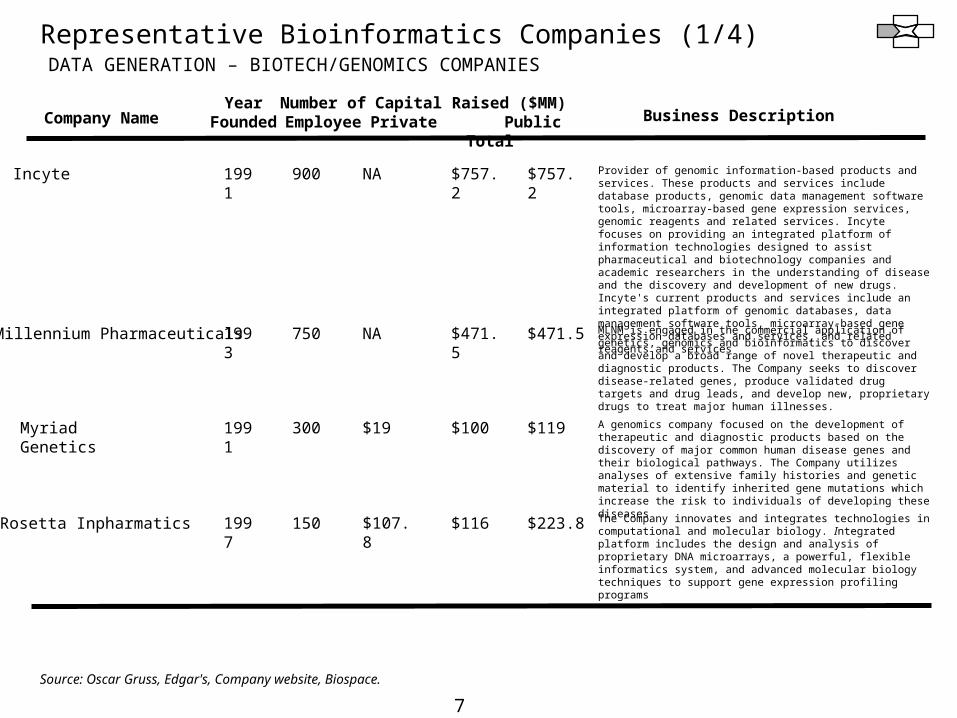
Representative Bioinformatics Companies (1/4)DATA GENERATION – BIOTECH/GENOMICS COMPANIES
Company NameYear
FoundedNumber of Employee
Capital Raised ($MM)Private Public Total Business Description
Incyte 1991 900 NA $757.2 $757.2 Provider of genomic information-based products and services. These products and services include database products, genomic data management software tools, microarray-based gene expression services, genomic reagents and related services. Incyte focuses on providing an integrated platform of information technologies designed to assist pharmaceutical and biotechnology companies and academic researchers in the understanding of disease and the discovery and development of new drugs. Incyte's current products and services include an integrated platform of genomic databases, data management software tools, microarray-based gene expression databases and services, and related reagents and services
Millennium Pharmaceuticals 1993 750 NA $471.5 $471.5 MLNM is engaged in the commercial application of genetics, genomics and bioinformatics to discover and develop a broad range of novel therapeutic and diagnostic products. The Company seeks to discover disease-related genes, produce validated drug targets and drug leads, and develop new, proprietary drugs to treat major human illnesses.
Myriad Genetics 1991 300 $19 $100 $119 A genomics company focused on the development of therapeutic and diagnostic products based on the discovery of major common human disease genes and their biological pathways. The Company utilizes analyses of extensive family histories and genetic material to identify inherited gene mutations which increase the risk to individuals of developing these diseases
Rosetta Inpharmatics 1997 150 $107.8 $116 $223.8 The Company innovates and integrates technologies in computational and molecular biology. Integrated platform includes the design and analysis of proprietary DNA microarrays, a powerful, flexible informatics system, and advanced molecular biology techniques to support gene expression profiling programs
Source: Oscar Gruss, Edgar's, Company website, Biospace.

8
Representative Bioinformatics Companies (2/4)
DATA MANAGEMENT – GENOMICS / INFORMATICS FOCUSED COMPANIES
Source: Oscar Gruss, Edgar's, Company website, Biospace.
Company NameYear
FoundedNumber of Employee
Capital Raised ($MM)Private Public Total Business Description
Ohio based
Compugen 1993 120 $75.4 Private $75.4 Leveraging expertise in computer hardware/software designed to accelerate bioinformatics algorithms. Business model moving toward an internet portal concept, plus proprietary and collaborative gene discovery.
DoubleTwist.com 1993 NA $66 $86.2 $152.2 An integrated genomics portal that provides a secure and comprehensive technology platform to simplify and accelerate life science discovery. Its research agents provide easy, point-and-click bioinformatics capabilities and access to a wealth of data sources, including its own annotated human genomic data.
eBioinformatics 1998 NA $11.9 Private $11.9 A spin-off from the Australian National Genomic Information Services, eBioinformatics provides a variety of web-based bioinformatics tools and databases.
Genomica 1995 NA $36.1 $123.1 $159.2 Provides enterprise-wide bioinformatics systems and services. Partnerships include AstraZeneca, Glaxo Wellcome, Park Davis and PE biosystems.
Informax 1990 172 NA $75 $75 Desktop and enterprise-wide bioinformatics products. Customer base includes 60 pharmaceutical companies, 250 biotechnology companies and 500 universities.
LabBook 1999 15 $10 Private NA Desktop based gene expression, sequencing and structural visualization software provider. Targeted customers include pharmaceutical and biotechnology companies, and universities.
Lion Bioscience 1997 210 $100 $178.6 $278.6 Provides enterprise-wide bioinformatics systems and services. $100 million proprietary R&D collabarition with Bayer AG, largest bioinformatics deal to date.
Netgenics 1996 $47.1 $47.1 Provides entreprise-wide bioinformatics systems and services. Partnerships include Pfizer, Abbott, Wyeth Ayerst and IBM.
Silicon Genetics 1998 NA NA Tools for gene expression analysis and visualization with additional capability in data mining applications.
NA
5 Private
Private

9
Representative Bioinformatics Companies (2/4)
DATA MANAGEMENT – GENOMICS / INFORMATICS FOCUSED COMPANIES
Source: Oscar Gruss, Edgar's, Company website, Biospace.
Company NameYear
FoundedNumber of Employee
Capital Raised ($MM)Private Public Total Business Description
Ohio based
SpotFire 1996 NA $25 Private $25 Leading provider of decision analytics software solutions -- speeding the discovery, development, manufacture, and marketing of products across the extended enterprise. Product offerings increase the productivity and decision making of individuals, and connect decision-making communities across all stages of the product life cycle.
Structural Bioinformatics 1996 34 $46.8 Private $46.8 Bioinformatics tools and databases with a special focus on protein structural information, critical to rational drug design.
Timelogic 1981 NA NA Private NA Specialized computer hardware/software designed to accelerate bioinformatics algorithms. Confirgurable hardware architecture offers competitive advantadge in some cases. Relationship with key academic and industrial research groups, including Stanford University, Roche, Bristol-Myers and Novartis.
Viakon 1999 NA $3.7 Private $3.7 Viaken Systems is the premier full service ASP (Application Service Provider) for the life sciences, offering solutions for biotechnology, pharmaceutical, and agricultural companies. Viaken hosts third-party research informatics application solutions and e-commerce services in the areas of genome informatics, chem informatics, and pharmaco informatics at its tier one data center and delivers these services via the Internet. The company’s unique ASP platform enables companies of all sizes to utilize the same state-of-the-art research information technology (IT) as implemented by top-tier organizations.
LeadScope 1997 NA $9.4 Private $9.4 The company develops and markets decision support tools for use by life scientists engaged in drug discovery. The products use proprietary algorithms to correlate structures with computed and experimental data and to help scientists find relationships hidden in the vast quantities of data being generated. Additionally, LeadScope Inc.can provide organizations with scientific expertise and knowledge of informatics tools to assist with the analysis of proprietary data from several phases of research including combinatorial chemistry and high throughput screening.
10
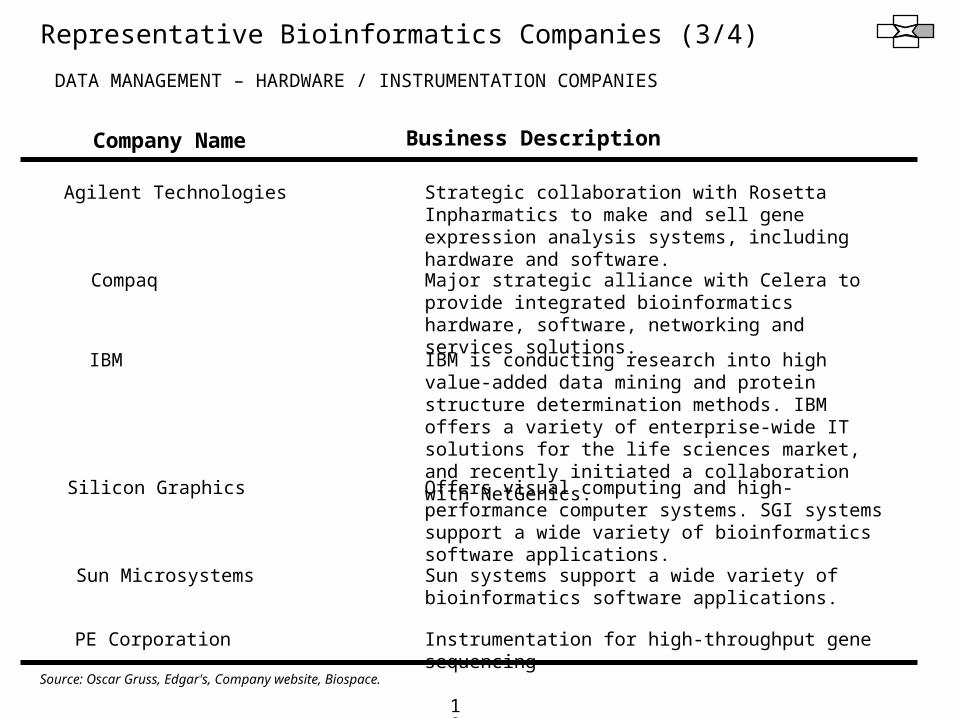
Representative Bioinformatics Companies (3/4)
DATA MANAGEMENT – HARDWARE / INSTRUMENTATION COMPANIES
Company Name Business Description
Agilent Technologies Strategic collaboration with Rosetta Inpharmatics to make and sell gene expression analysis systems, including hardware and software.
Major strategic alliance with Celera to provide integrated bioinformatics hardware, software, networking and services solutions.
Compaq
IBM is conducting research into high value-added data mining and protein structure determination methods. IBM offers a variety of enterprise-wide IT solutions for the life sciences market, and recently initiated a collaboration with NetGenics.
Offers visual computing and high-performance computer systems. SGI systems support a wide variety of bioinformatics software applications.
Sun systems support a wide variety of bioinformatics software applications.
Instrumentation for high-throughput gene sequencing
IBM
Silicon Graphics
Sun Microsystems
Source: Oscar Gruss, Edgar's, Company website, Biospace.
PE Corporation
11
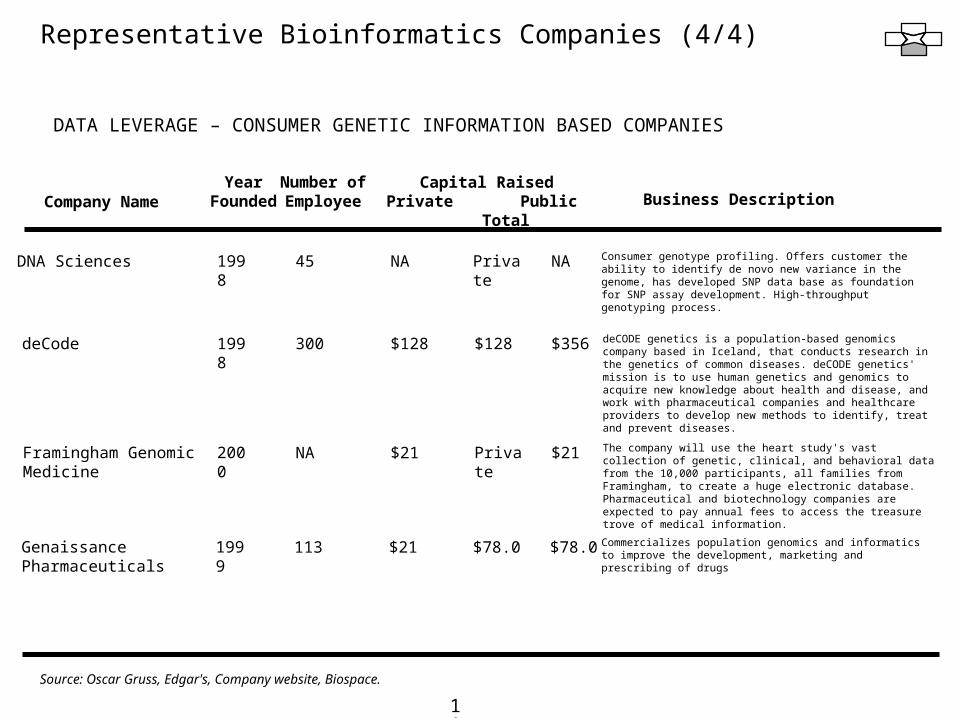
Representative Bioinformatics Companies (4/4)
DATA LEVERAGE – CONSUMER GENETIC INFORMATION BASED COMPANIES
Company NameYear
FoundedNumber of Employee
Capital RaisedPrivate Public Total Business Description
Source: Oscar Gruss, Edgar's, Company website, Biospace.
DNA Sciences 1998 45 NA Private NA Consumer genotype profiling. Offers customer the ability to identify de novo new variance in the genome, has developed SNP data base as foundation for SNP assay development. High-throughput genotyping process.
deCode 1998 300 $128 $128 $356 deCODE genetics is a population-based genomics company based in Iceland, that conducts research in the genetics of common diseases. deCODE genetics' mission is to use human genetics and genomics to acquire new knowledge about health and disease, and work with pharmaceutical companies and healthcare providers to develop new methods to identify, treat and prevent diseases.
Framingham Genomic Medicine
2000 NA $21 Private $21 The company will use the heart study's vast collection of genetic, clinical, and behavioral data from the 10,000 participants, all families from Framingham, to create a huge electronic database. Pharmaceutical and biotechnology companies are expected to pay annual fees to access the treasure trove of medical information.
Genaissance Pharmaceuticals
1999 113 $21 $78.0 $78.0 Commercializes population genomics and informatics to improve the development, marketing and prescribing of drugs
Why Invest in Bioinformatics?
Precedents for Potential Returns for Public and Private Investment
13
1 2 3 5 10 16 24 35 49 72 101 157217
385652
1,160
2,009
3,841
0
500
1,000
1,500
2,000
2,500
3,000
3,500
4,000
Millions
82 83 84 85 86 87 88 89 90 91 92 93 94 95 96 97 98 99
1 2 4 6 10 15 21 29 40 56 79 143 215556
1,021
1,766
2,838
4,865
0
500
1000
1500
2000
2500
3000
3500
4000
4500
5000
('000)
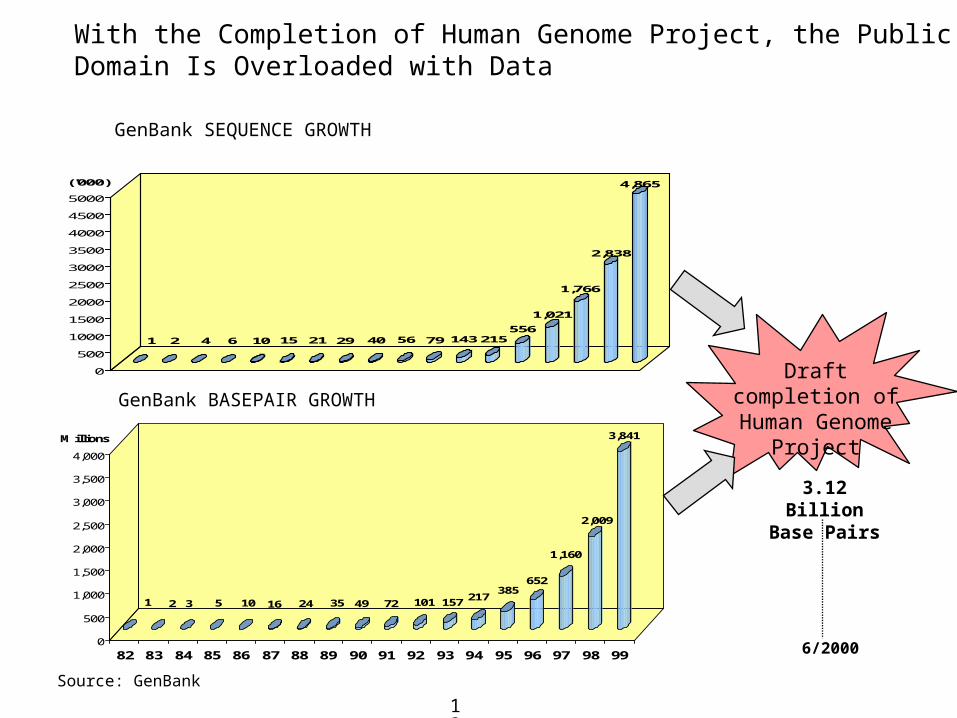
Draft completion of Human
Genome Project
6/2000
With the Completion of Human Genome Project, the Public Domain Is Overloaded with Data
GenBank SEQUENCE GROWTH
GenBank BASEPAIR GROWTH
Source: GenBank
3.12 Billion Base Pairs

14
The Biotechnology Sector has Raised $11 Billion in Equity Financing in the First Quarter of 2000, and is Well Positioned to Leverage this Information Revolution
Source: Biospace
IPOs Follow-ons Venture CapitalFinancing
Public CompanyPrivate Financing
ConvertibleFinancing
Total
1,124
3,754659
3,545
1,815 10,896
BIOTECHNOLOGY EQUITY FINANCING IN Q1, 2000$ Millions
15
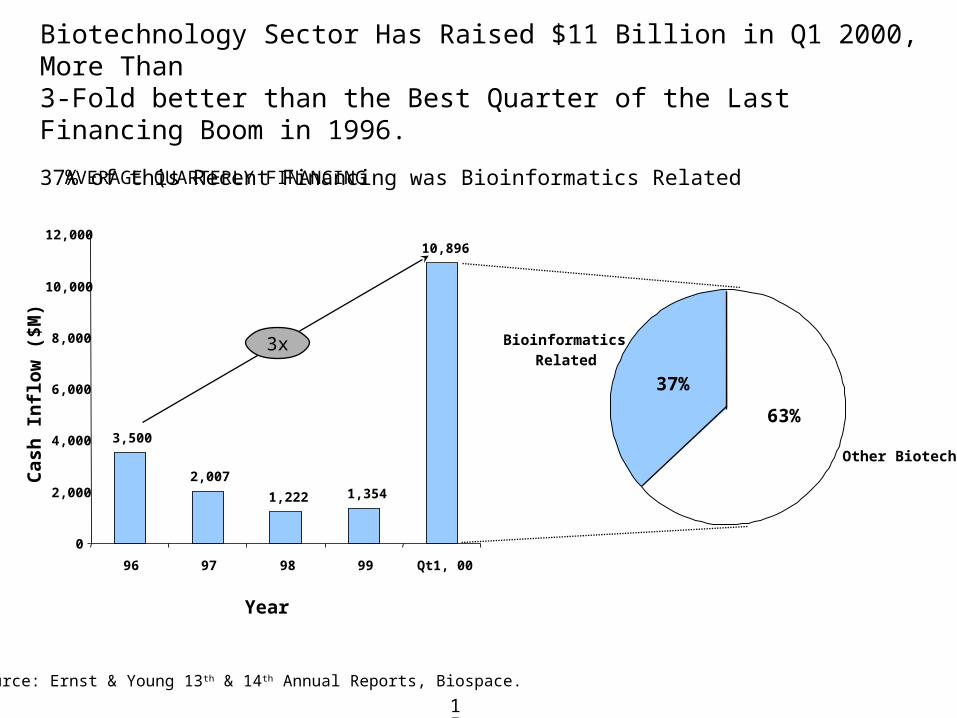
Biotechnology Sector Has Raised $11 Billion in Q1 2000, More Than 3-Fold better than the Best Quarter of the Last Financing Boom in 1996.
37% of this Recent Financing was Bioinformatics Related
Source: Ernst & Young 13th & 14th Annual Reports, Biospace.
3,500
2,007
1,222 1,354
10,896
0
2,000
4,000
6,000
8,000
10,000
12,000
96 97 98 99 Qt1, 00
Cas
h I
nfl
ow
($M
)
3x Bioinformatics
Related
Other Biotech
37%
63%
AVERAGE QUARTERLY FINANCING
Year
16
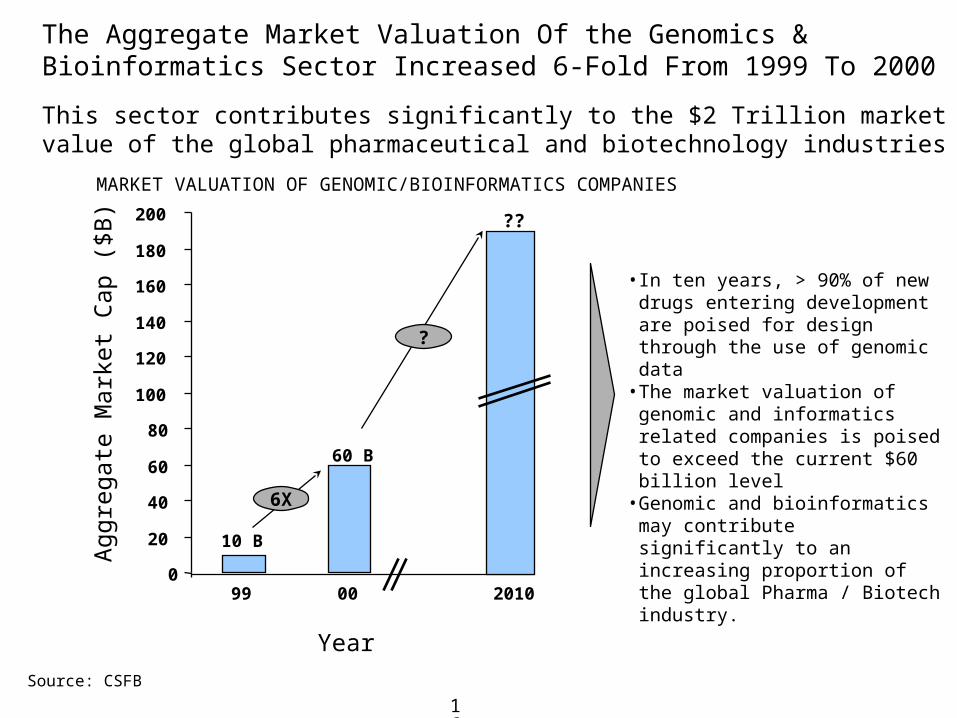
The Aggregate Market Valuation Of the Genomics & Bioinformatics Sector Increased 6-Fold From 1999 To 2000
This sector contributes significantly to the $2 Trillion market value of the global pharmaceutical and biotechnology industries
Source: CSFB
10 B
60 B
0
20
40
60
80
100
120
140
160
180
200
99 00 2010
MARKET VALUATION OF GENOMIC/BIOINFORMATICS COMPANIES
6X
?
??
• In ten years, > 90% of new drugs entering development are poised for design through the use of genomic data
• The market valuation of genomic and informatics related companies is poised to exceed the current $60 billion level
• Genomic and bioinformatics may contribute significantly to an increasing proportion of the global Pharma / Biotech industry.
Year
Agg
rega
te M
arke
t C
ap (
$B)
Opportunities and Strengths for Bioinformatics in Ohio
18
Ohio has the potential to build a substantial presence in bioinformatics
Academic presence
• OSU has completed the functional annotation of human chromosome 22• The James Cancer Center tissue bank can provide a unique set of genetic content• The Cleveland Clinic is a leader in cardiovascular genetic research• The University of Cincinnati Children’s Hospital Medical Center and OSU are among the first academic
institutions that have formed a partnership with bioinformatics leader Celera• The supercomputer center within Ohio is among the best in the country
Industrial presence
• Existing life science companies can provide the leadership and experience to support the growth of the bioinformatics industry in Ohio, including
– Battelle– Cardinal Health– Chemical Abstracts– Digineer– Gliatech– Proctor & Gamble– YSI Inc– Integrex
• There are several vibrant start-up bioinformatics-related companies growing within Ohio, including– Athersys– LabBook– LeadScope – NetGenix
Government presence
• Wright-Patterson Air Force Base harbors an extensive research capability in computer graphics, simulation• NASA Lewis
19
Academic Institution
Medical / Clinical
Industrial Supplier
Reagent Supplier
Contract R&D
Contract Manufacturing
Industrial Services
Professional Services
Medical Devices
BiotechnologyBioinformatics
15
17
7
11
11
116
40
23
8 3
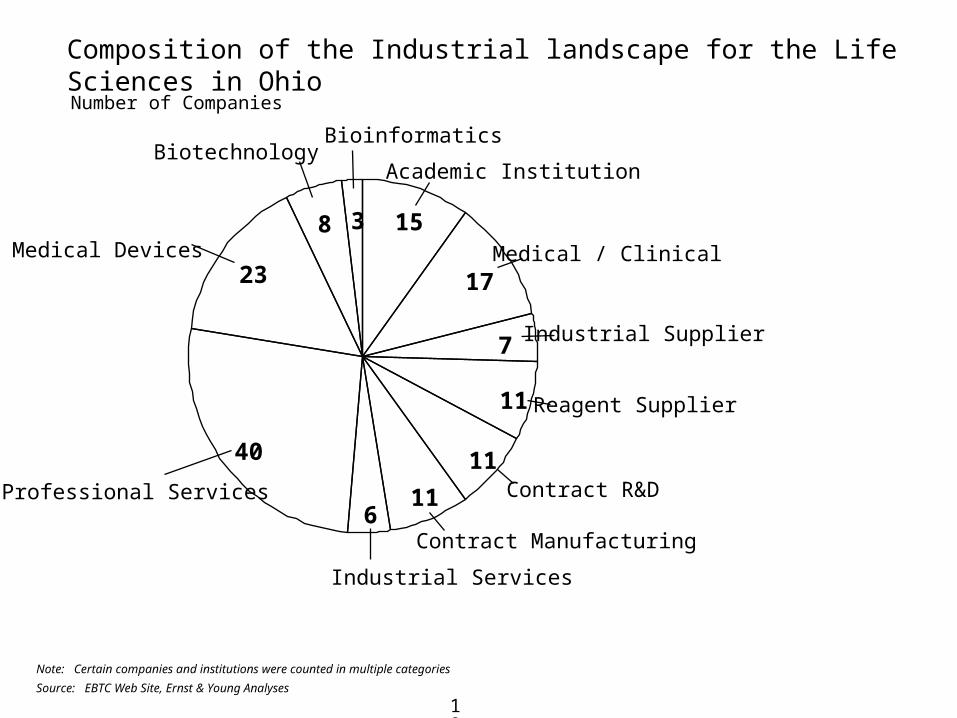
Composition of the Industrial landscape for the Life Sciences in Ohio
Number of Companies
Note: Certain companies and institutions were counted in multiple categories
Source: EBTC Web Site, Ernst & Young Analyses

20
Composition of the Industrial landscape for the Life Sciences in Ohio
Emerging Infrastructure to Support the Growth of a Bioinformatics Initiative includes:
• Edison Program IncubatorsAkron Cincinnati Columbus ClevelandDayton Mansfield Toledo Youngstown
• Edison Centers of ExcellenceOhio Information Technology AllianceEdison Biotechnology Center
• Research ParksBioPark, Cleveland Science and Technology Center at the Ohio State University
• Seed capital funds at various stages in developmentTechnology Action FundColumbusAppleseed Fund, ClevelandBioVentures, Cincinnati
21
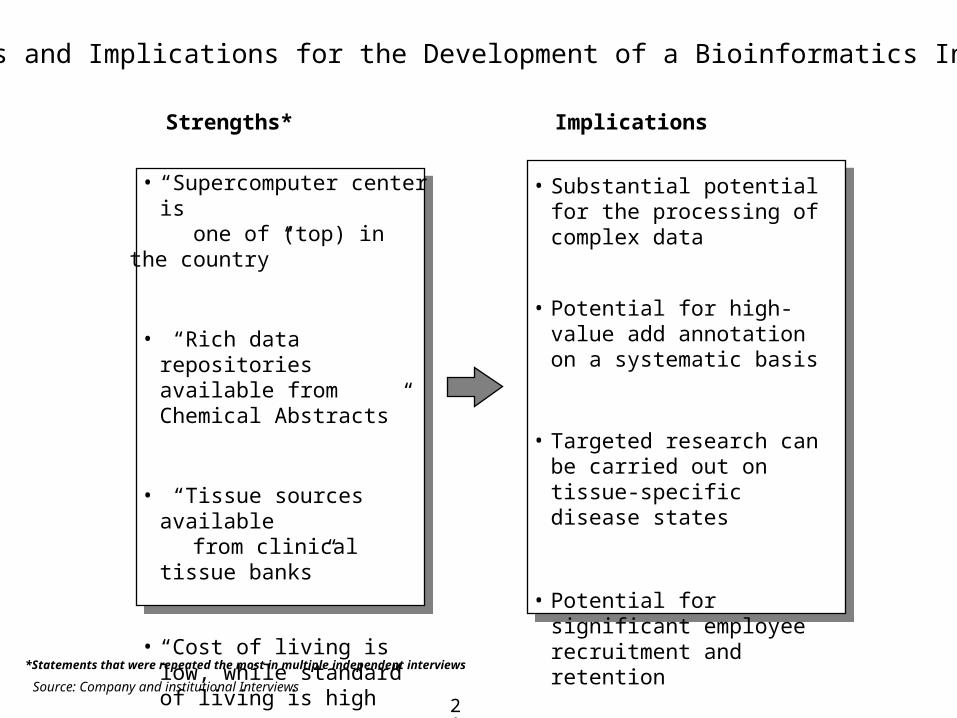
• “Supercomputer center is one of (top) in the country”
• “Rich data repositories available from Chemical Abstracts”
• “Tissue sources available from clinical tissue banks”
• “Cost of living is low, while standard of living is high”
• Substantial potential for the processing of complex data
• Potential for high-value add annotation on a systematic basis
• Targeted research can be carried out on tissue-specific disease states
• Potential for significant employee recruitment and retention
Strengths and Implications for the Development of a Bioinformatics Initiative
Strengths* Implications
Source: Company and institutional Interviews
*Statements that were repeated the most in multiple independent interviews

22
Weaknesses and Challenges for Bioinformatics in Ohio
23
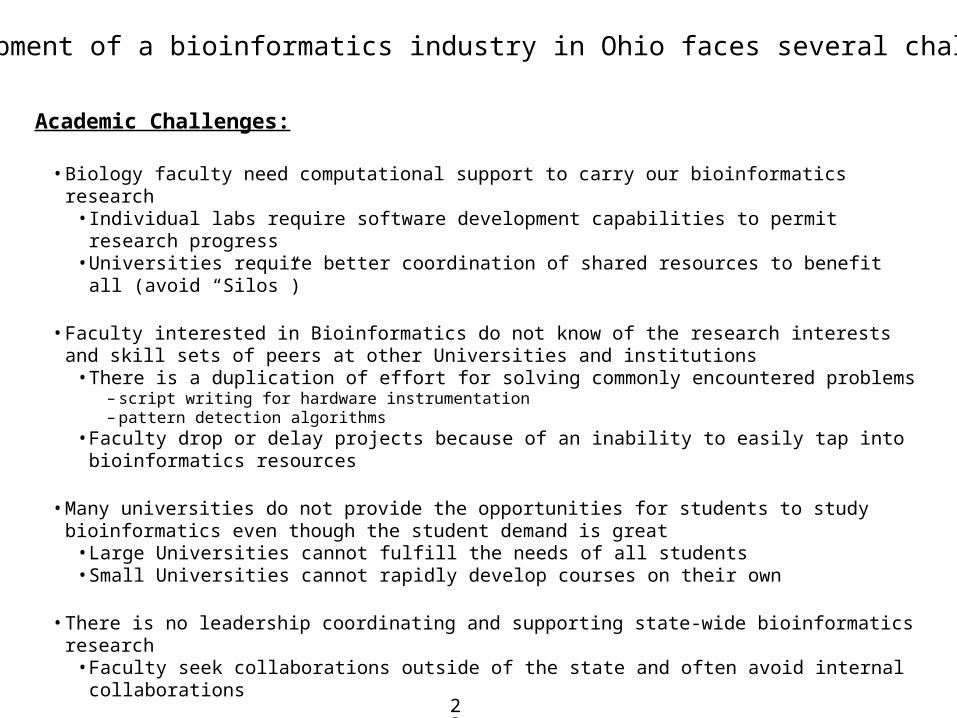
Academic Challenges:
• Biology faculty need computational support to carry our bioinformatics research• Individual labs require software development capabilities to permit research progress • Universities require better coordination of shared resources to benefit all (avoid “Silos”)
• Faculty interested in Bioinformatics do not know of the research interests and skill sets of peers at other Universities and institutions
• There is a duplication of effort for solving commonly encountered problems– script writing for hardware instrumentation– pattern detection algorithms
• Faculty drop or delay projects because of an inability to easily tap into bioinformatics resources
• Many universities do not provide the opportunities for students to study bioinformatics even though the student demand is great
• Large Universities cannot fulfill the needs of all students• Small Universities cannot rapidly develop courses on their own
• There is no leadership coordinating and supporting state-wide bioinformatics research• Faculty seek collaborations outside of the state and often avoid internal collaborations
Development of a bioinformatics industry in Ohio faces several challenges
24
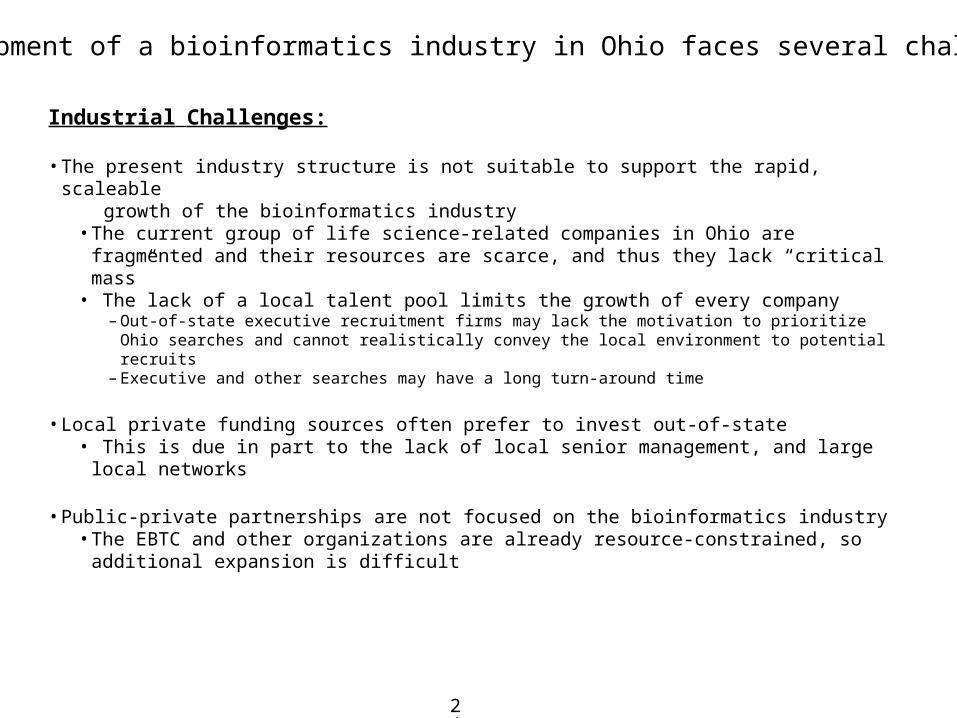
Industrial Challenges:
• The present industry structure is not suitable to support the rapid, scaleable growth of the bioinformatics industry
• The current group of life science-related companies in Ohio are fragmented and their resources are scarce, and thus they lack “critical mass”
• The lack of a local talent pool limits the growth of every company– Out-of-state executive recruitment firms may lack the motivation to prioritize Ohio searches and cannot
realistically convey the local environment to potential recruits– Executive and other searches may have a long turn-around time
• Local private funding sources often prefer to invest out-of-state• This is due in part to the lack of local senior management, and large local networks
• Public-private partnerships are not focused on the bioinformatics industry• The EBTC and other organizations are already resource-constrained, so additional expansion is
difficult
Development of a bioinformatics industry in Ohio faces several challenges
25
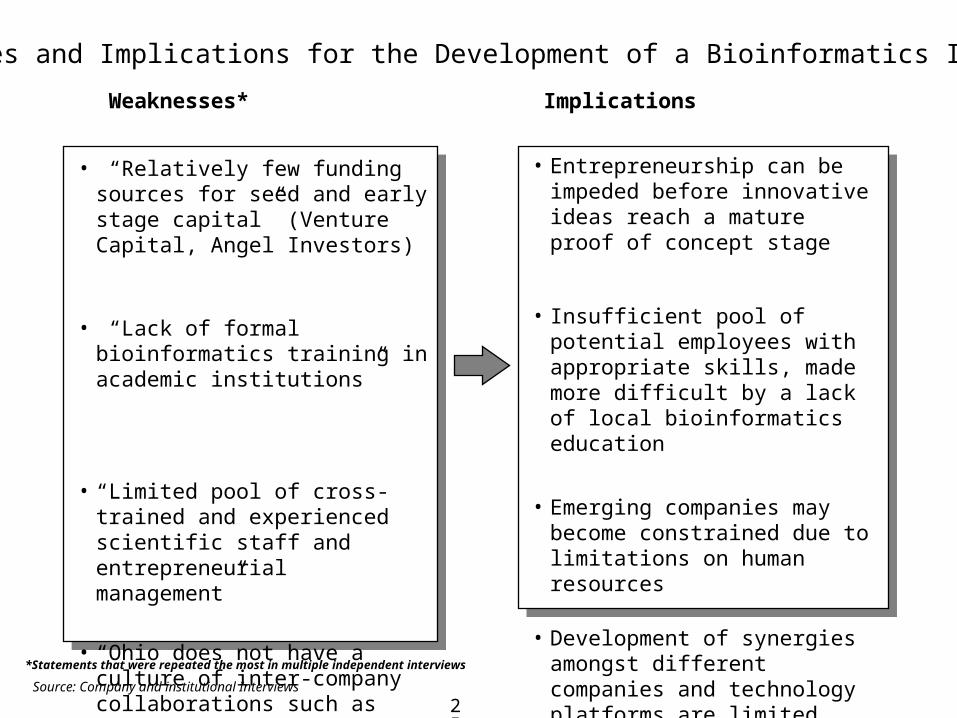
• “Relatively few funding sources for seed and early stage capital” (Venture Capital, Angel Investors)
• “Lack of formal bioinformatics training in academic institutions”
• “Limited pool of cross-trained and experienced scientific staff and entrepreneurial management”
• “Ohio does not have a culture of inter-company collaborations such as strategic alliances, and is often insular in business dealings”
Weaknesses and Implications for the Development of a Bioinformatics Initiative
Weaknesses* Implications
• Entrepreneurship can be impeded before innovative ideas reach a mature proof of concept stage
• Insufficient pool of potential employees with appropriate skills, made more difficult by a lack of local bioinformatics education
• Emerging companies may become
constrained due to limitations on human resources
• Development of synergies amongst different companies and technology platforms are limited
Source: Company and institutional Interviews
*Statements that were repeated the most in multiple independent interviews

26
Approaches for FosteringBioinformatics in Ohio
27
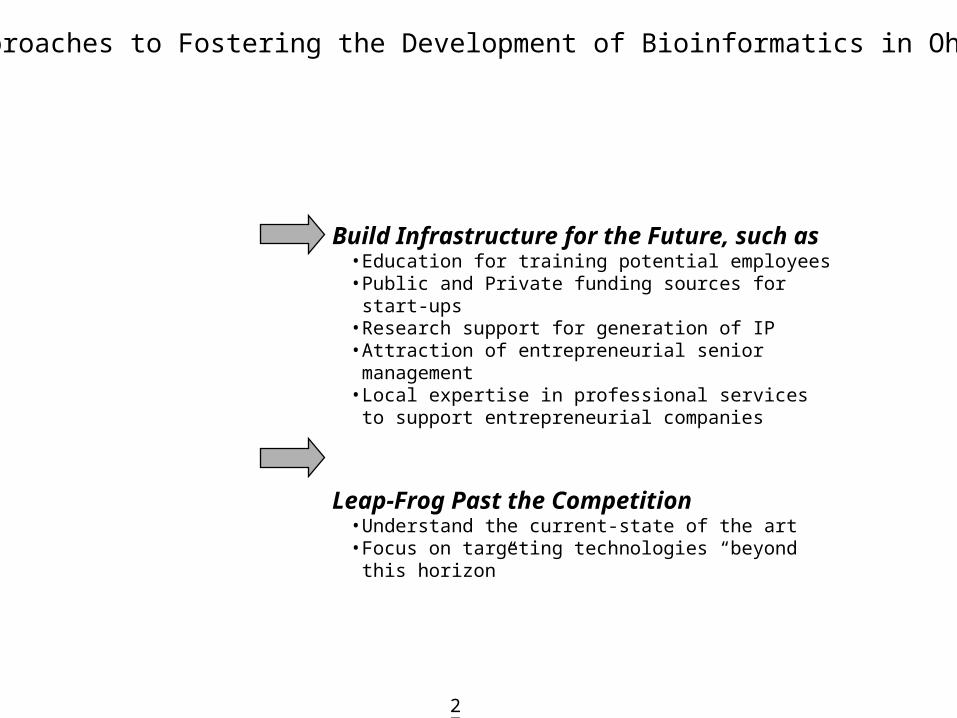
Approaches to Fostering the Development of Bioinformatics in Ohio
Build Infrastructure for the Future, such as • Education for training potential employees• Public and Private funding sources for start-ups• Research support for generation of IP• Attraction of entrepreneurial senior management• Local expertise in professional services to support
entrepreneurial companies
Leap-Frog Past the Competition• Understand the current-state of the art• Focus on targeting technologies “beyond this horizon”
28
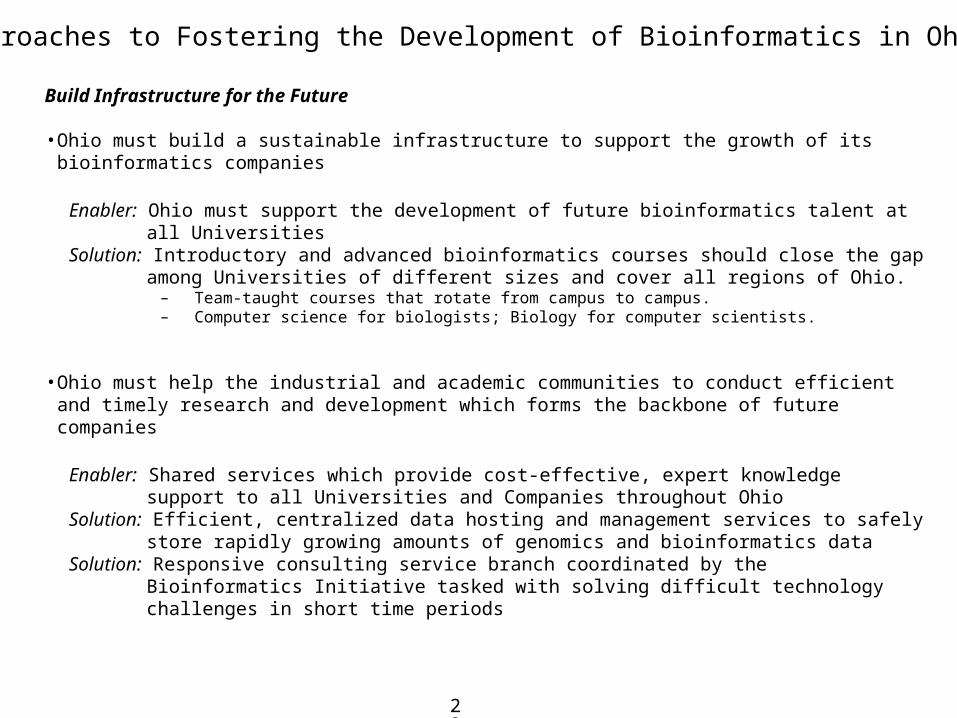
Approaches to Fostering the Development of Bioinformatics in Ohio
Build Infrastructure for the Future
• Ohio must build a sustainable infrastructure to support the growth of its bioinformatics companies
Enabler: Ohio must support the development of future bioinformatics talent at all Universities Solution: Introductory and advanced bioinformatics courses should close the gap among Universities of
different sizes and cover all regions of Ohio.– Team-taught courses that rotate from campus to campus.– Computer science for biologists; Biology for computer scientists.
• Ohio must help the industrial and academic communities to conduct efficient and timely research and development which forms the backbone of future companies
Enabler: Shared services which provide cost-effective, expert knowledge support to all Universities and Companies throughout Ohio
Solution: Efficient, centralized data hosting and management services to safely store rapidly growing amounts of genomics and bioinformatics data
Solution: Responsive consulting service branch coordinated by the Bioinformatics Initiative tasked with solving difficult technology challenges in short time periods
29
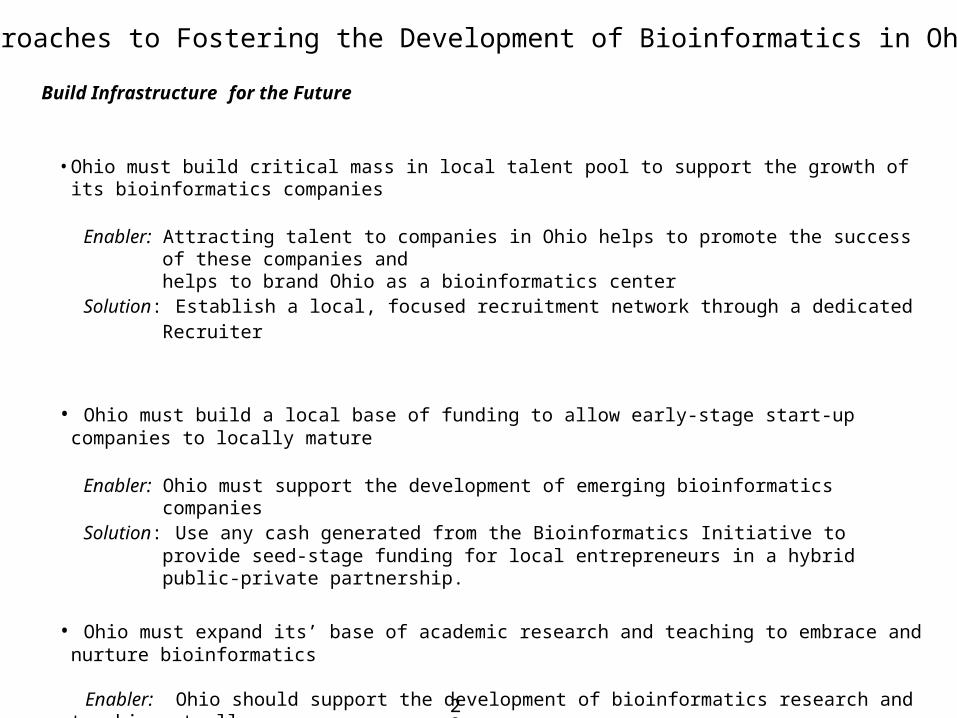
Build Infrastructure for the Future
• Ohio must build critical mass in local talent pool to support the growth of its bioinformatics companies
Enabler: Attracting talent to companies in Ohio helps to promote the success of these companies andhelps to brand Ohio as a bioinformatics center
Solution: Establish a local, focused recruitment network through a dedicated Recruiter
• Ohio must build a local base of funding to allow early-stage start-up companies to locally mature
Enabler: Ohio must support the development of emerging bioinformatics companies Solution: Use any cash generated from the Bioinformatics Initiative to provide seed-stage funding for
local entrepreneurs in a hybrid public-private partnership.
• Ohio must expand its’ base of academic research and teaching to embrace and nurture bioinformatics
Enabler: Ohio should support the development of bioinformatics research and teaching at all Universities
Solution: The State of Ohio should provide competitive levels of financial support for academic research to fill gaps in Federal funding, and to support the expansion of University-level
teaching related to bioinformatics course content
Approaches to Fostering the Development of Bioinformatics in Ohio

30
Leap-Frog Past the Competition
The business strategy and research goals of entrepreneurial companies must be leap-frog beyond the current state-of-the-art to avoid playing a doomed game of catch-up
• Focus on next-generation technology platforms:
– Functional annotation integrated with complex physiological data
– Functional annotation of the genomes of agricultural crops and other plants, for which Ohio already has a leadership position in agricultural research
– Pattern detection and computational analyses of “polygenic” diseases (i.e. diseases for which several genes together cause illness - cancer, diabetes, cardiovascular disease,…)
– Pharmacogenomics - the tuning of drug dosages and combinations to individual physiology
– Drug discovery based on the phenotyping of functional genomic content
– Diagnostic devices based upon genetic and genomic information
– Data-mining of patient records from longitudinal studies of chronic disease (i.e. cancer)
– Data-mining of plant genomes to identify targets for agro-biotechnology products (i.e. insect and pesticide resistance, adaptation to environmental stress, nutritional content)
Approaches to Fostering the Development of Bioinformatics in Ohio

31
How to Build a Bioinformatics Infrastructure in Ohio?

32
Overview of Proposed Approach: Five Parallel Bioinformatics Initiatives
Rotating Courses
Consulting Services
Retained Search
Data Hosting
Entrepreneurship
Academic
Professional
Academic
Industrial
Academic
Industrial
Private-Public
EnhanceBioinformatics-basedEconomic Development for the State of Ohio
Private-Public

33
Overview of the Rotational Courses Program
• Bioinformatics is an interdisciplinary field which requires expertise both in Biology and in Computer Science.
• Current curriculum in Biology has little or no computer training, and Computer Science students have little Biology.
• A Biology course for Computer Science students and a Computer Science course focused in programming for Biology students will provide the required knowledge for these two groups of students to do joint Bioinformatics research
• Start with 10-faculty team: 8 academic 2 industrial
• 4 or more locations within the state of Ohio, such as:
Columbus Cleveland Cincinnati TBD
• 1 course per location
• 30 - 40 students per course
• Concurrent short training courses for professionals already in the work force
• Make it a significant honor for faculty to participate
• Stimulate inter-departmental, inter-institutional and academic-industry collaborations
• Increased capability in attracting federal grants
• Create statewide uniform Bioinformatics curriculum standard
• Produce high quality Bioinformatics research talent and skilled workforce
• Establish academic reputation in Bioinformatics and attract world class Bioinformatics faculty and entrepreneurs
• Improved course quality
HowWhat Impact
34
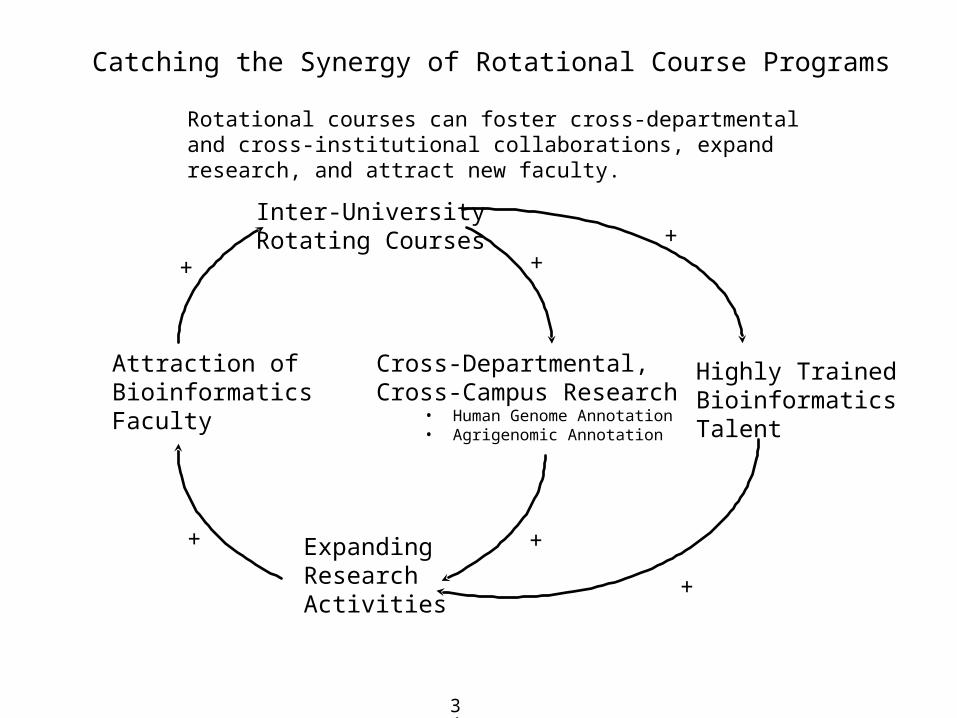
Cross-Departmental,Cross-Campus Research
• Human Genome Annotation• Agrigenomic Annotation
Expanding Research Activities
Inter-UniversityRotating Courses
Attraction of BioinformaticsFaculty
+
+
+
+
Catching the Synergy of Rotational Course Programs
Highly Trained Bioinformatics Talent
+
+
Rotational courses can foster cross-departmental and cross-institutional collaborations, expand research, and attract new faculty.
35
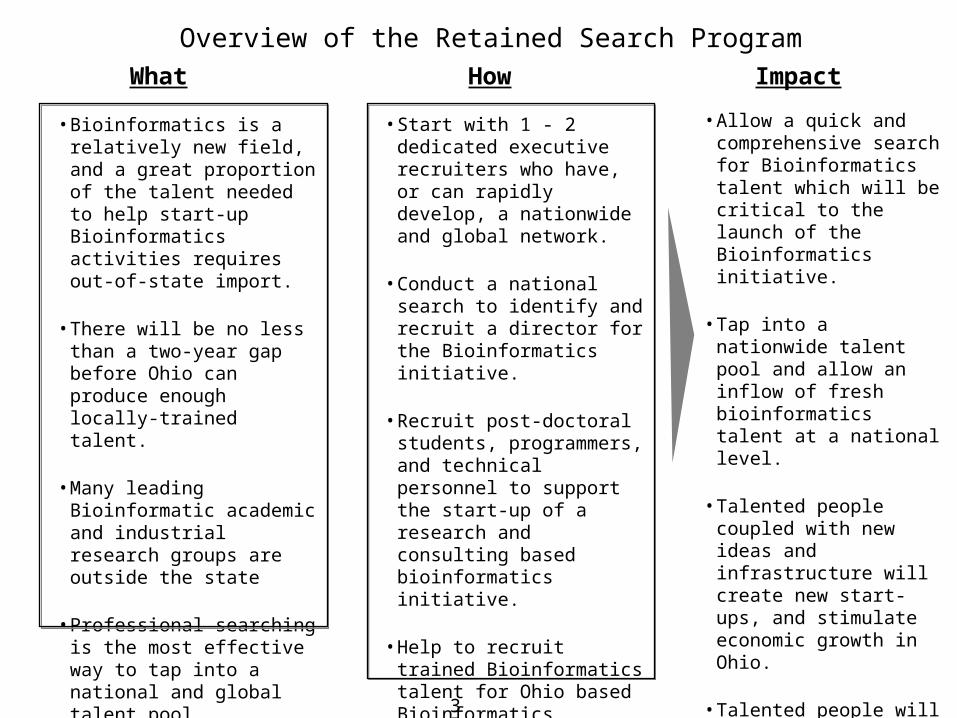
Overview of the Retained Search Program
• Bioinformatics is a relatively new field, and a great proportion of the talent needed to help start-up Bioinformatics activities requires out-of-state import.
• There will be no less than a two-year gap before Ohio can produce enough locally-trained talent.
• Many leading Bioinformatic academic and industrial research groups are outside the state
• Professional searching is the most effective way to tap into a national and global talent pool.
• Start with 1 - 2 dedicated executive recruiters who have, or can rapidly develop, a nationwide and global network.
• Conduct a national search to identify and recruit a director for the Bioinformatics initiative.
• Recruit post-doctoral students, programmers, and technical personnel to support the start-up of a research and consulting based bioinformatics initiative.
• Help to recruit trained Bioinformatics talent for Ohio based Bioinformatics companies from out-of-state.
• Executive recruiters are compensated based on the number and level of talent they recruited.
• Allow a quick and comprehensive search for Bioinformatics talent which will be critical to the launch of the Bioinformatics initiative.
• Tap into a nationwide talent pool and allow an inflow of fresh bioinformatics talent at a national level.
• Talented people coupled with new ideas and infrastructure will create new start-ups, and stimulate economic growth in Ohio.
• Talented people will conduct cutting edge research and create start-up opportunities, which will attract more Bioinformatics talent from outside Ohio.
HowWhat Impact
36
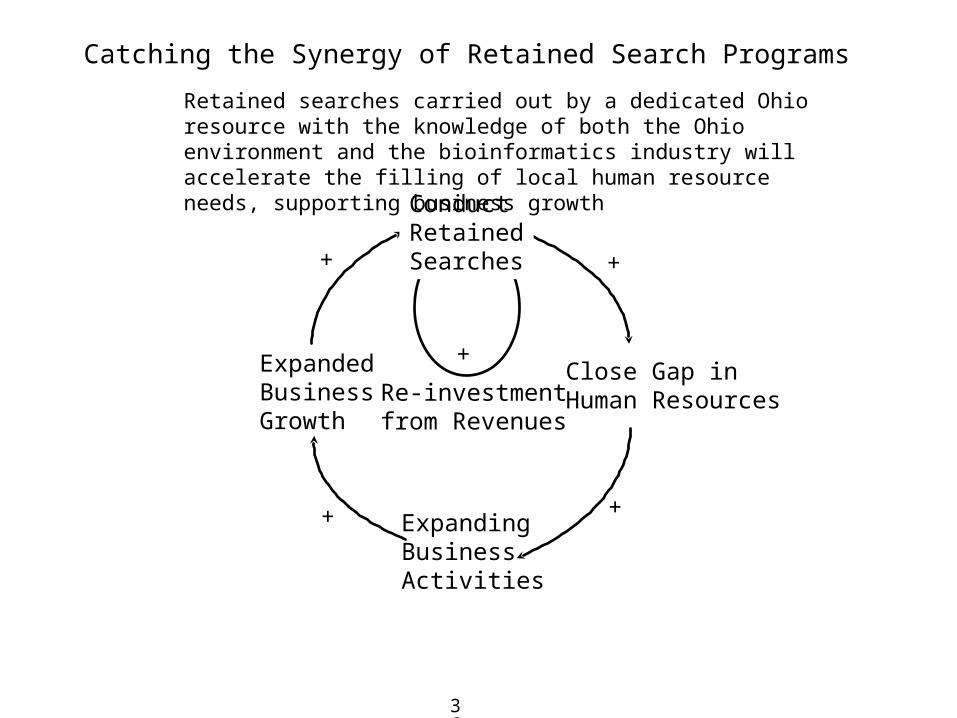
Close Gap in Human Resources
Expanding BusinessActivities
+
+
+
Catching the Synergy of Retained Search Programs
+
Expanded Business Growth
Re-investmentfrom Revenues
+
Conduct RetainedSearches
Retained searches carried out by a dedicated Ohio resource with the knowledge of both the Ohio environment and the bioinformatics industry will accelerate the filling of local human resource needs, supporting business growth
37
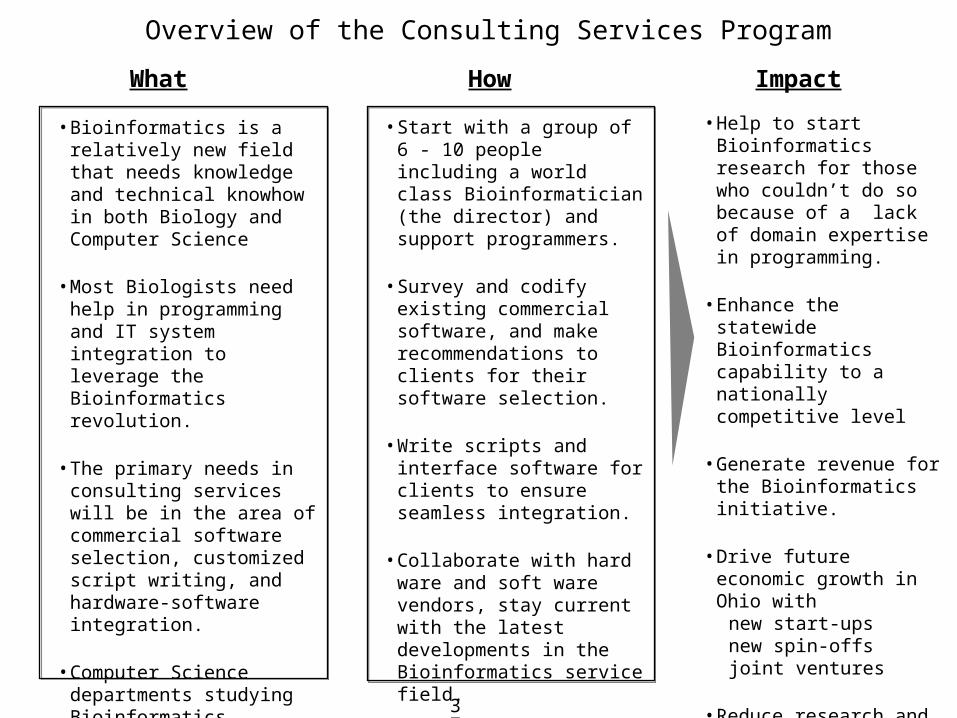
Overview of the Consulting Services Program
• Bioinformatics is a relatively new field that needs knowledge and technical knowhow in both Biology and Computer Science
• Most Biologists need help in programming and IT system integration to leverage the Bioinformatics revolution.
• The primary needs in consulting services will be in the area of commercial software selection, customized script writing, and hardware-software integration.
• Computer Science departments studying Bioinformatics problems will need high level Bioinformaticians to define & solve these problems.
• Start with a group of 6 - 10 people including a world class Bioinformatician (the director) and support programmers.
• Survey and codify existing commercial software, and make recommendations to clients for their software selection.
• Write scripts and interface software for clients to ensure seamless integration.
• Collaborate with hard ware and soft ware vendors, stay current with the latest developments in the Bioinformatics service field.
• Generate group purchasing power (e.g. for software and hardware) over time.
• Help to start Bioinformatics research for those who couldn’t do so because of a lack of domain expertise in programming.
• Enhance the statewide Bioinformatics capability to a nationally competitive level
• Generate revenue for the Bioinformatics initiative.
• Drive future economic growth in Ohio with
new start-ups new spin-offs joint ventures
• Reduce research and development costs for academics and companies through group purchasing power.
HowWhat Impact
38
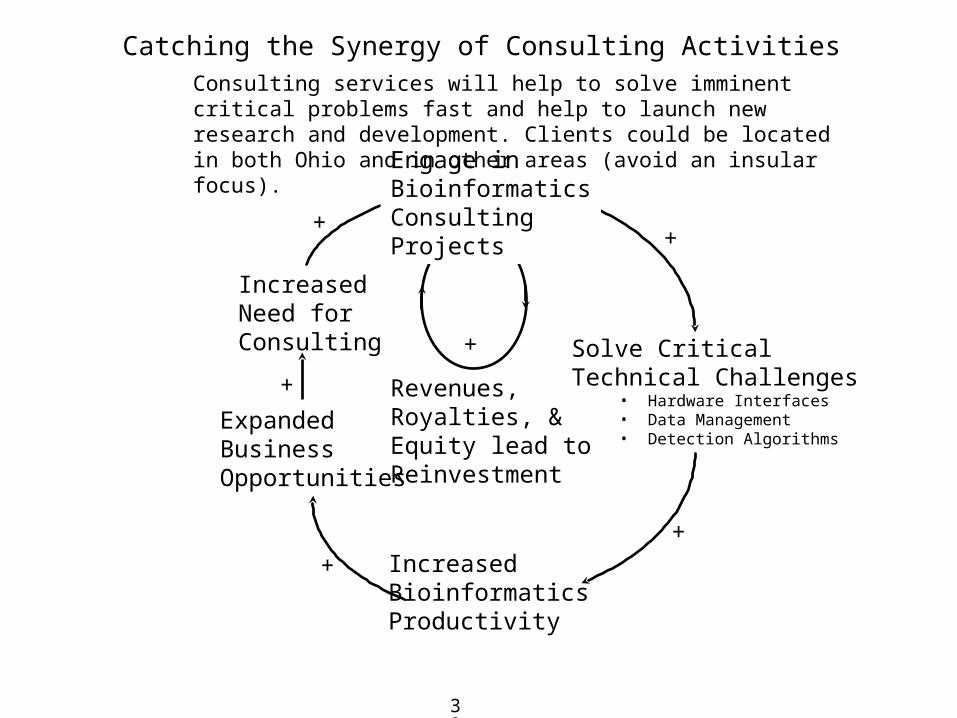
Solve Critical Technical Challenges
• Hardware Interfaces• Data Management• Detection Algorithms
IncreasedBioinformatics Productivity
Expanded Business Opportunities
+
+
+
+
Catching the Synergy of Consulting Activities
Engage in BioinformaticsConsulting Projects
Revenues,Royalties, & Equity lead toReinvestment
+
IncreasedNeed for Consulting
+
Consulting services will help to solve imminent critical problems fast and help to launch new research and development. Clients could be located in both Ohio and in other areas (avoid an insular focus).
39
Approach to Financial Modeling
• Participants in the original interviews carried out for this project were asked to answer to a set of survey questions by email related to the financial modeling
• In particular, respondents were asked to estimate their potential use of • rotational courses (students interested in courses, courses per location)• consulting services (hours to be purchased, acceptable billing rates)• data hosting (data storage needs, data transfer needs)
• The answers to these questions were tabulated and averaged and the averagesused as line item inputs into the financial models which are described in the appendix
• The financial models showed cash-flow positive results from Year One.
• While this cash flow may be unusual for start-up businesses in Ohio, these values follow directly from participants specific responses. Further, the framework for the financial modeling is itself conservative and based on industry precedents.
40
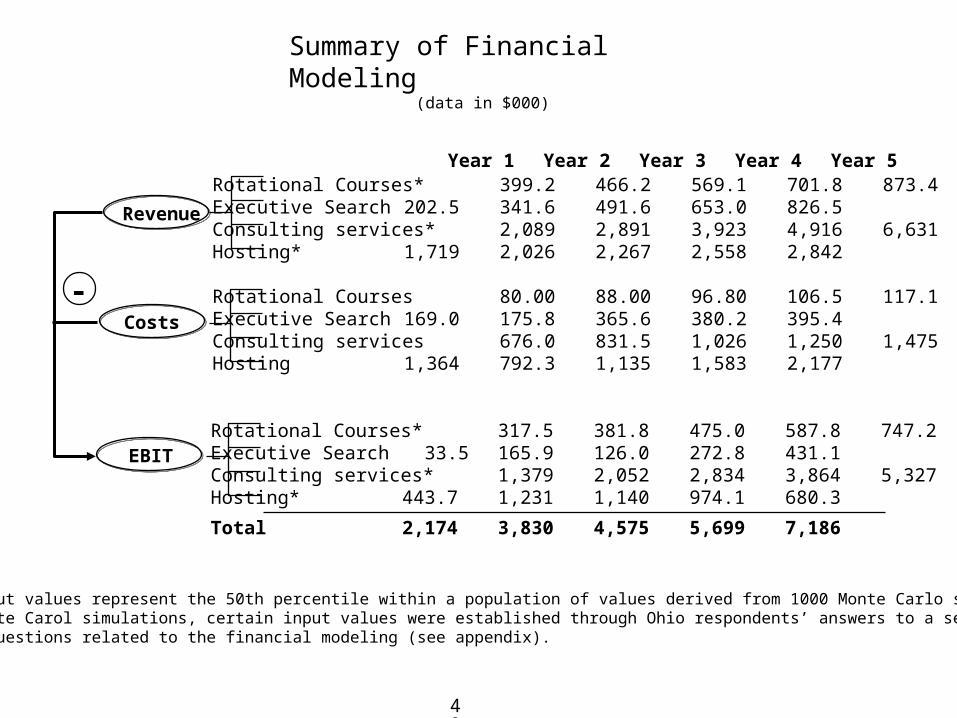
Summary of Financial Modeling(data in $000)
Revenue
Costs
Rotational Courses* 317.5 381.8 475.0 587.8 747.2Executive Search 33.5 165.9 126.0 272.8 431.1Consulting services* 1,379 2,052 2,834 3,864 5,327Hosting* 443.7 1,231 1,140 974.1 680.3
Total 2,174 3,830 4,575 5,699 7,186
EBIT
- Rotational Courses 80.00 88.00 96.80 106.5 117.1Executive Search 169.0 175.8 365.6 380.2 395.4Consulting services 676.0 831.5 1,026 1,250 1,475Hosting 1,364 792.3 1,135 1,583 2,177
Rotational Courses* 399.2 466.2 569.1 701.8 873.4Executive Search 202.5 341.6 491.6 653.0 826.5Consulting services* 2,089 2,891 3,923 4,916 6,631Hosting* 1,719 2,026 2,267 2,558 2,842
*These output values represent the 50th percentile within a population of values derived from 1000 Monte Carlo simulations.For the Monte Carol simulations, certain input values were established through Ohio respondents’ answers to a set of survey questions related to the financial modeling (see appendix).
Year 1 Year 2 Year 3 Year 4 Year 5

41
Steps to Building a Bioinformatics Infrastructure in Ohio
42
Potential Pit-Falls to Fostering the Development of Bioinformatics in OhioFocusing Soley on Short-Term Gain
• Bioinformatics is an inherently complex area and requires substantial support from multiple scientific fields
• Time is required to build critical mass, focus on long-term growth
Focusing on Current Competitors
• Companies in other regions (i.e. Celera in MD, Incyte in CA) have enormous head-starts and several hundred million dollars of funding supported by ample infrastructure and talented staff.
• Companies in Ohio cannot compete with Celera and Incyte in a head-to-head contest: Do not try to emulate these companies without a distinct and sustainable competitive advantage
Seeking Out Artificial Deals
• Partnerships cannot be forced between private companies without clear value to all parties; people need to get to know each other and appreciate their mutual value to one another
• Academic and Industrial labs have different priorities and work at different time scales
Constraining Strategy to Historical Trends
• Leadership and vision require looking beyond past and current business models
• Incremental changes yield incremental results.
• Boldness requires the acceptance of risk.
43
• Given scarce resources and a limited time to establish credibility, need a targeted and highly focused approach to any bioinformatics initiative
• Given the need to build a brand based on core strengths, need to identify areas where Ohio could make a distinctive and potentially unique contribution
• Clear, defensible roadmap with no false starts and stops, leading to a one- way migration towards the building of a statewide bioinformatics initiative
• Accepted and defined metrics for success to monitor progress and detect nascent blockages
• Need a common view of collaborative and shared service issues, based on both open discussions, both internal and external
• A “big project” with high visibility success might pull people together and improve both the internal and external perception of the State of Ohio regarding bioinformatics
• Highly articulated roles and responsibilities of different institutions and companies within different regions of Ohio
Considerations for a Strategic Roadmap for the Bioinformatics Initiative

44
Strategic Roadmap for the Bioinformatics InitiativeYear One Year Two Year Three Year Four Year Five
BioinformaticsInitiative
Hire total headcount of 7:- One Director- One Business Development
Associate- Two Post-doctoral Students- Two Programmers- One Support Staff
Win One Grant Recruit 30 Members
Increase headcount byhiring:- One Additional Business
Development Associate- One Additional Post-doctoral
Student
Win Two Grants Recruit 6 Additional Members
Increase headcount byhiring:- One Additional Post-doctoral
Student- One Additional Programmer
Win Three Grants Recruit 16 Additional
Members
Increase headcount byhiring:- One Additional Business
Development Associate- One Additional Post-doctoral
Student- One Additional Support Staff
Win Four Grants Recruit 16 Additional
Members
Increase headcount byhiring:- One Additional Post-doctoral
Student- One Additional Programmer
Win Five Grants Recruit 22 Additional
Members
ConsultingServices
Acquire a total of 12academic & 5 industrialclients; use 3 consultants* Serve each academic
client with 28 hours peryear
Serve each industrialclient with 613 hours peryear
Acquire an Additional Set of 4academic & 2 industrial clients;use 4 consultants Serve each academic client
with 30 hours per year Serve each industrial client
with 674 hours per year
Acquire an Additional Set of4 academic & 1 industrialclients; use 6 consultants Serve each academic client
with 33 hours per year Serve each industrial client
with 741 hours per year
Acquire an AdditionalSet of 6 academic & 3industrial clients; use 9consultants Serve each academic
client with 37 hours peryear
Serve each industrialclient with 815 hours peryear
Acquire an AdditionalSet of 8 academic & 3industrial clients; use 13consultants Serve each academic
client with 40 hours peryear
Serve each industrialclient with 897 hoursper year
Data Hosting Build Data Server Center- Build T-1 Access- Buy 48 Servers- Hire One Support Staff Host 12 clients data,
with 1500 GB per client
Buy 21 Additional Servers Hire One Additional Support
Staff Host 16 clients data, with 1650
GB per client
Buy 77 Additional Servers Hire One Additional Support
Staff Host 20 clients data, with
1815 GB per client
Buy 63 Additional Servers Hire One Additional
Support Staff Host 26 clients data, with
1997 GB per client
Buy Additional 138Servers
Hire One AdditionalSupport Staff
Host 34 clients data, with2196 GB per client
RotationalCourses
Recruit 10 faculty Host 8 rotating courses
with 35 students percourse, in four locations
Host 2 ProfessionalCourses
Recruit 10 faculty Host 8 rotating courses with
37 students per course, infour locations
Host 2 Professional Courses
Recruit 10 faculty Host 10 rotating courses with
38 students per course, infive locations
Host 2 Professional Courses
Recruit 10 faculty Host 10 rotating courses
with 40 students percourse, in five locations
Host 2 ProfessionalCourses
Recruit 10 faculty Host 10 rotating courses
with 41 students percourse, in five locations
Host 2 ProfessionalCourses
SearchProgram
Hire One ExecutiveRecruiter and OneSupport Staff
Recruit Two Executives Recruit Five Ph.D. Staff Recruit Five Post-docs
Bioinformatics Center Recruit Four Executives Recruit Seven Ph.D. Staff Recruit Seven Post-docs
Hire One AdditionalExecutive Recruiter andOne Support Staff
Recruit Six Executives Recruit Nine Ph.D. Staff Recruit Nine Post-docs
Bioinformatics Center Recruit Eight Executives Recruit Eleven Ph.D. Staff Recruit Eleven Post-docs
Bioinformatics Center Recruit Ten Executives Recruit Eleven Ph.D.
Staff Recruit Thirteen Post-
docsVentureActivities
Host Two ProfessionalValuation andInvestment workshops
Provide seed funding to start-up bioinofmatics ventures
Apply for DARPA, ATO-NIST,
Provide seed funding tostart-up bioinofmaticsventures
Provide seed funding tostart-up bioinofmaticsventures
Provide seed funding tostart-up bioinofmaticsventures
*Consulting staff will be drawn as appropriate from the group of post-doctoral associates.

45
OSC
Overview of Proposed Organizational StructureYear One
ODOD
Director of Bioinformatics
Initiative
Advisory Board
Business Development Associate (1)
Post-Doctoral Associates (2)
Software Developers*
(2)
Administrative Staff (1)
Electable
Out-sourced Legal and Consulting
*Joint appointment with OSC

46
Overview of Proposed Organizational StructureYear Two
ODOD
Director of Bioinformatics
Initiative
Advisory Board
Business Development Associate (2)
Post-Doctoral Associates (3)
Software Developers
(2)
Administrative Staff (1)
Electable
Out-sourced Legal and Consulting
OSC
*Joint appointment with OSC
47
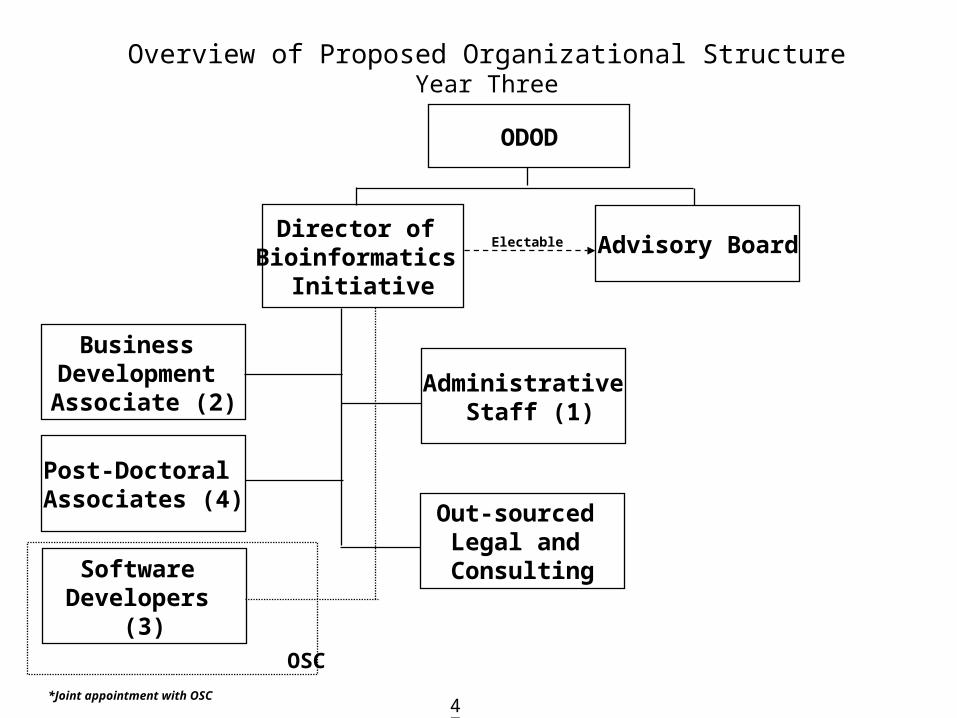
Overview of Proposed Organizational StructureYear Three
ODOD
Director of Bioinformatics
Initiative
Advisory Board
Business Development Associate (2)
Post-Doctoral Associates (4)
Software Developers
(3)
Administrative Staff (1)
Electable
Out-sourced Legal and Consulting
OSC
*Joint appointment with OSC

48
Overview of Proposed Organizational StructureYear Four
ODOD
Director of Bioinformatics
Initiative
Advisory Board
Business Development Associate (3)
Post-Doctoral Associates (5)
Software Developers
(3)
Administrative Staff (2)
Electable
Out-sourced Legal and Consulting
OSC
*Joint appointment with OSC

49
Overview of Proposed Organizational StructureYear Five
ODOD
Director of Bioinformatics
Initiative
Advisory Board
Business Development Associate (3)
Post-Doctoral Associates (6)
Software Developers
(4)
Administrative Staff (2)
Electable
Out-sourced Legal and Consulting
OSC
*Joint appointment with OSC
50
Defining Success for a Bioinformatics Initiative in Ohio
51
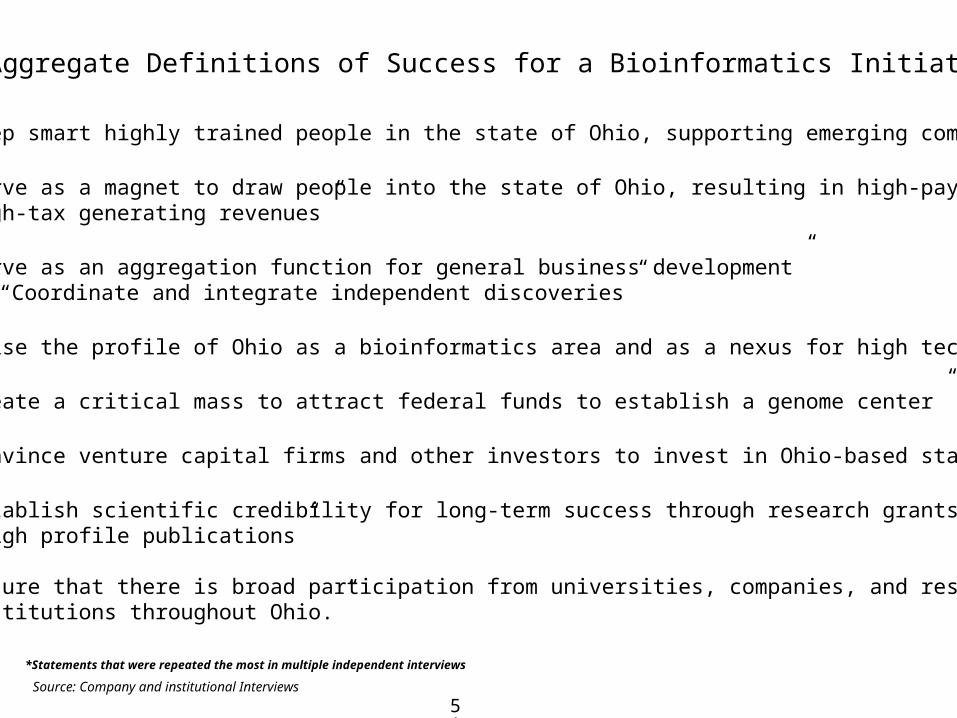
• “Keep smart highly trained people in the state of Ohio, supporting emerging companies”
• “Serve as a magnet to draw people into the state of Ohio, resulting in high-paying, high-tax generating revenues”
• “Serve as an aggregation function for general business development”• “Coordinate and integrate independent discoveries”
• “Raise the profile of Ohio as a bioinformatics area and as a nexus for high technology”
• “Create a critical mass to attract federal funds to establish a genome center”
• “Convince venture capital firms and other investors to invest in Ohio-based start-ups”
• “Establish scientific credibility for long-term success through research grants and high profile publications”
• “Ensure that there is broad participation from universities, companies, and research institutions throughout Ohio.”
Aggregate Definitions of Success for a Bioinformatics Initiative*
Source: Company and institutional Interviews
*Statements that were repeated the most in multiple independent interviews
52
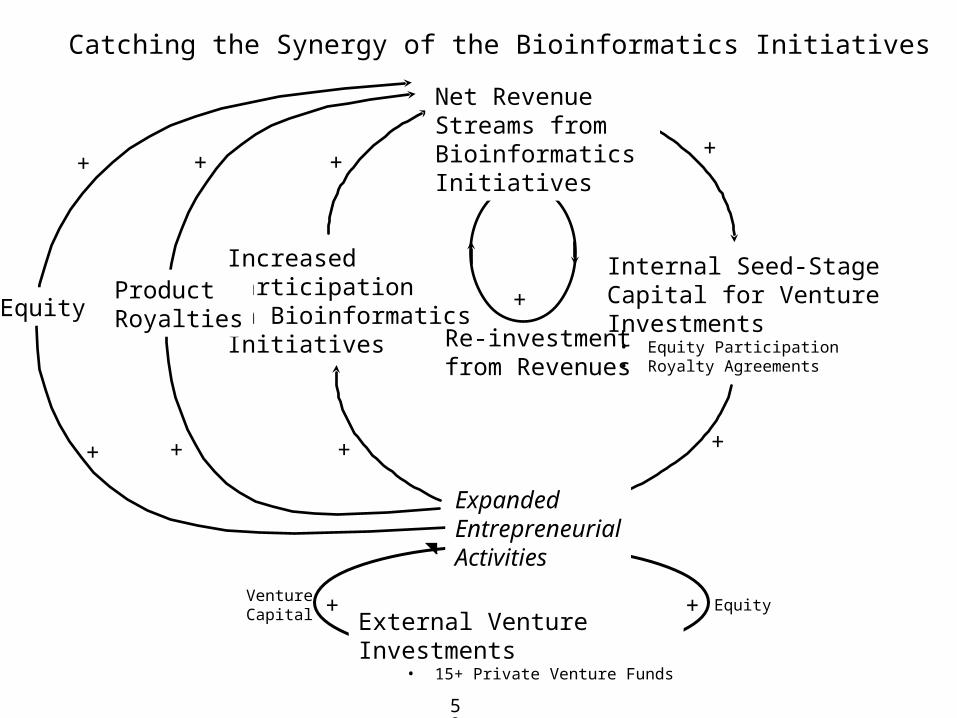
Internal Seed-Stage Capital for Venture Investments
• Equity Participation• Royalty Agreements
Increased Participation in Bioinformatics Initiatives
+
+
+
+
Catching the Synergy of the Bioinformatics Initiatives
Net Revenue Streams from Bioinformatics Initiatives
Re-investmentfrom Revenues
ProductRoyalties
+
+
+
Venture Capital
Equity
+
++
ExpandedEntrepreneurialActivities
+
Equity
External Venture Investments
• 15+ Private Venture Funds

53
Implications of Success for the Public-Private Partnerships
Private investment can lead to public returns:
• Job Creation - Higher employment levels stimulate further economic growth
• Tax Base - Increases in tax revenues can fund further economic development programs
• Further Attraction of Investors - Success breeds success, increasing investor interest
Public investment can lead to private returns:
• Incubators and Technology Support Centers - can catalyze entrepreneurship
• Tax Savings Programs - can attract new business to Ohio
• Educational System Enhancements - provide graduates with critical talent to companies
54
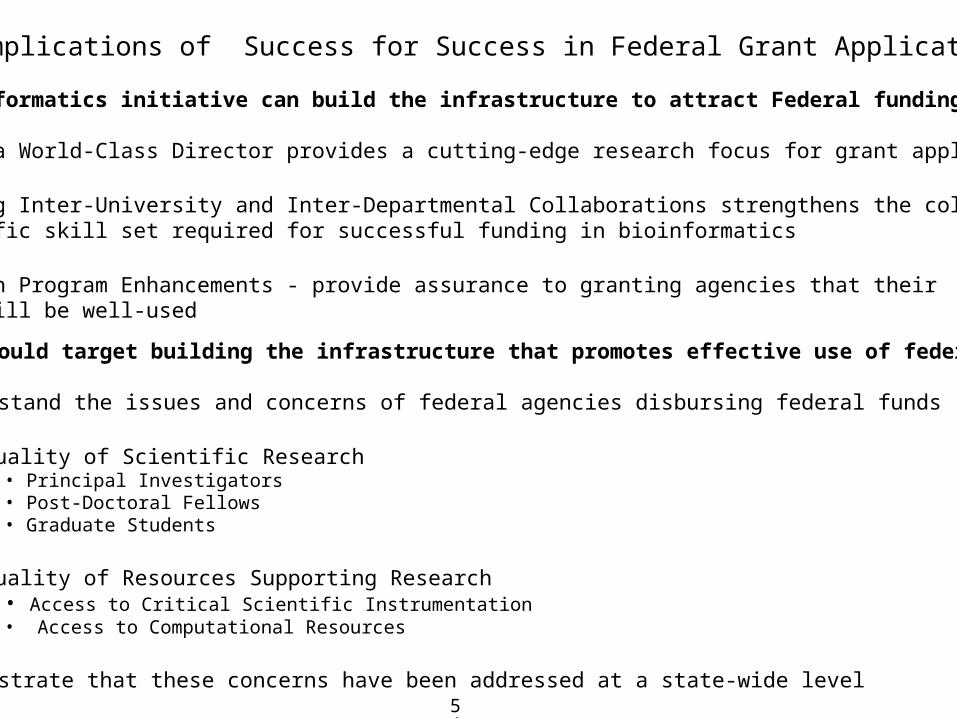
Implications of Success for Success in Federal Grant Applications
The bioinformatics initiative can build the infrastructure to attract Federal funding:
• Hiring a World-Class Director provides a cutting-edge research focus for grant applications
• Building Inter-University and Inter-Departmental Collaborations strengthens the collective scientific skill set required for successful funding in bioinformatics
• Research Program Enhancements - provide assurance to granting agencies that their funds will be well-used
Ohio should target building the infrastructure that promotes effective use of federal funds:
• Understand the issues and concerns of federal agencies disbursing federal funds
• Quality of Scientific Research• Principal Investigators• Post-Doctoral Fellows• Graduate Students
• Quality of Resources Supporting Research• Access to Critical Scientific Instrumentation• Access to Computational Resources
• Demonstrate that these concerns have been addressed at a state-wide level

55
ODOD
Ohio Board of Regents
Corporations$$
Universities
Federal Institutions
Education
Work-Force Development
Research Economic Development
Importing Capital
Attracting Companies
EducationalMission
BioinformaticsCoursework
ChemAbstracts
NetGenics
LabBook
LeadScope
DigineerBattelle
NIHSponsoredResearch
NSFSponsored Research
Implications of Success for the Stakeholders of the Bioinformatics Initiative
SuccessSuccess
Ohio Supercomputer
Center

56
Appendices
Bioinformatics Business Models
Representative Cases
58
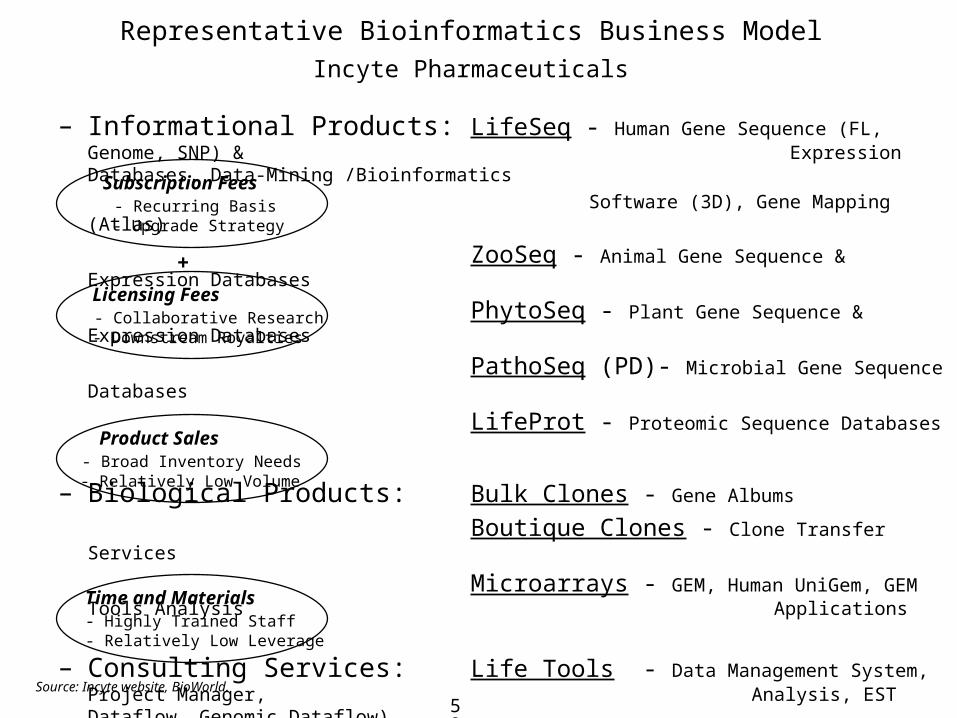
Representative Bioinformatics Business Model
Incyte Pharmaceuticals
– Informational Products: LifeSeq - Human Gene Sequence (FL, Genome, SNP) & Expression Databases, Data-Mining
/Bioinformatics
Software (3D), Gene Mapping (Atlas)
ZooSeq - Animal Gene Sequence & Expression Databases
PhytoSeq - Plant Gene Sequence & Expression Databases
PathoSeq (PD)- Microbial Gene Sequence Databases
LifeProt - Proteomic Sequence Databases
– Biological Products: Bulk Clones - Gene Albums
Boutique Clones - Clone Transfer Services
Microarrays - GEM, Human UniGem, GEM Tools Analysis Applications
– Consulting Services: Life Tools - Data Management System, Project Manager, Analysis, EST Dataflow, Genomic
Dataflow)
Customized Services from Genome Systems - sequencing, robotics, DNA preparation, knockouts, &
Fluorescence In Situ Hybridization (FISH).
Subscription Fees - Recurring Basis - Upgrade Strategy
Product Sales - Broad Inventory Needs - Relatively Low Volume
Time and Materials- Highly Trained Staff - Relatively Low Leverage
Licensing Fees - Collaborative Research - Downstream Royalties
+
Source: Incyte website, BioWorld.

59
Bioinformatics Companies Use Different Business Model To Sell Both Tools And Solutions To End UsersBUSINESS MODEL FOR BIOINFORMATICS COMPANIES
•Celera charges $5 - $15 million per year to companies who want access to its database
•Gene Logic offers a subscription to its large-scale GeneExpress database on a multiple year basis and charges between $3 and $5 million annually
•Geneva Bioinformatics offers Internet access of SIB’s Swiss-Prot protein database and charges either a few thousands dollars per user or up to $90,000 per year for unlimited usage
Source: Ernst & Young analysis; C&EN News, Company Websites
SubscriptionFees
•Small packages, such as Silicon Genetics’ GeneSpring software are sold for $20,000 per copy
•Large software packages are sold for hundred of thousands dollars per user seat•Customized software is sold for millions of dollars
Software Licensing
Fees
InternetbasedASPs
•eBioinformatics offers a pay-as-you-use model through the Internet. Individual user is charged by eBio units at 50 cents per unit, and an active user can use 1,000 units per year
•Double Twist operates an Internet-based research portal and offers three level of access. Bronze provides limited access for free, silver and gold level access provides additional tools and a proprietary database. Low-demand users spend $500 for certain analyses, and heavy users might pay a few thousands dollar per “seat” per analysis.

60
Questionnaires
61
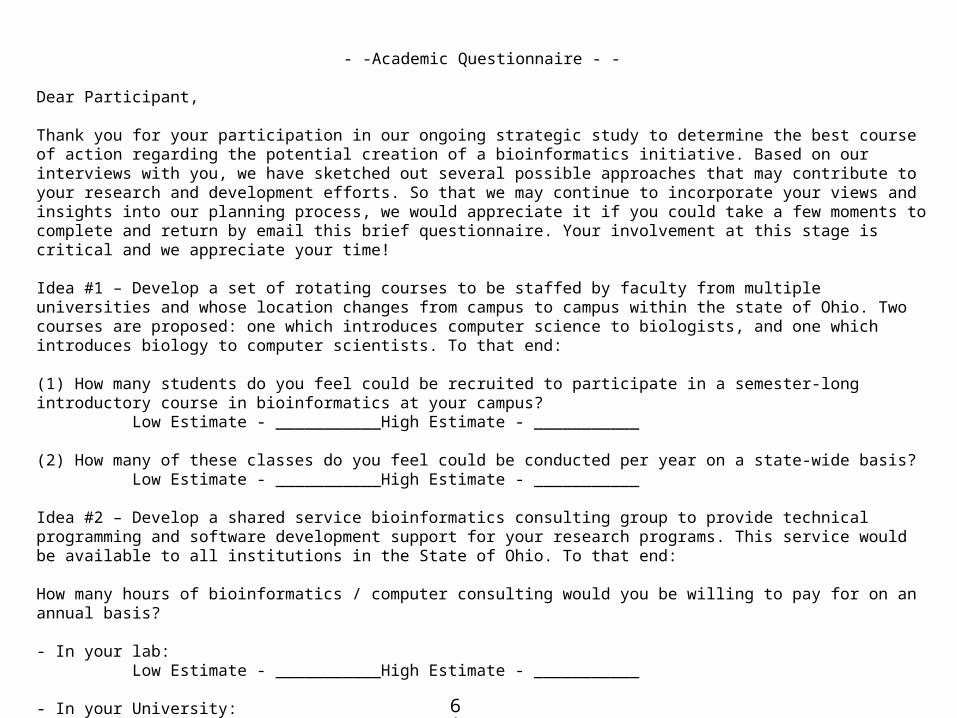
- -Academic Questionnaire - -
Dear Participant,
Thank you for your participation in our ongoing strategic study to determine the best course of action regarding the potential creation of a bioinformatics initiative. Based on our interviews with you, we have sketched out several possible approaches that may contribute to your research and development efforts. So that we may continue to incorporate your views and insights into our planning process, we would appreciate it if you could take a few moments to complete and return by email this brief questionnaire. Your involvement at this stage is critical and we appreciate your time!
Idea #1 – Develop a set of rotating courses to be staffed by faculty from multiple universities and whose location changes from campus to campus within the state of Ohio. Two courses are proposed: one which introduces computer science to biologists, and one which introduces biology to computer scientists. To that end:
(1) How many students do you feel could be recruited to participate in a semester-long introductory course in bioinformatics at your campus?
Low Estimate - ___________High Estimate - ___________
(2) How many of these classes do you feel could be conducted per year on a state-wide basis?Low Estimate - ___________High Estimate - ___________
Idea #2 – Develop a shared service bioinformatics consulting group to provide technical programming and software development support for your research programs. This service would be available to all institutions in the State of Ohio. To that end:
How many hours of bioinformatics / computer consulting would you be willing to pay for on an annual basis?
- In your lab:Low Estimate - ___________High Estimate - ___________
- In your University:Low Estimate - ___________High Estimate - ___________

62
- -Academic Questionnaire - -
What price would you be able to afford for premier consulting services on-site and customized to your needs? (Note: Professional service firms traditionally charge between 125 and 600 $ per hour)
75$ / hour? Yes or No100$ / hour? Yes or No125$ / hour? Yes or NoOther Rate? Yes or No Rate ($/hour) _______
Idea #3 – We are considering the utility of establishing a data storage and management service for you. As bioinformatics data increases in volume, this might assist in the coordination of data to serve your research needs. To that end:
How many gigabytes of data per year would you consider storing on a safe, secure host server?
- In your lab:Low Estimate - ___________High Estimate - ___________
- In your University:Low Estimate - ___________High Estimate - ___________
How much bandwidth (Gigabytes / day) would you estimate you would require on a daily basis to manage this amount of data? This would include transferring data to and from the host server.
- In your lab:Low Estimate - ___________High Estimate - ___________
- In your University:Low Estimate - ___________High Estimate - ___________
Thank you for your participation! We appreciate your interest in this initiative and we will keep you updated!
63
- - Industry Questionnaire - -
Dear Participant,
Thank you for your participation in our ongoing strategic study to determine the best course of action regarding the potential creation of a bioinformatics initiative. Based on our interviews with you, we have sketched out several possible approaches that may contribute to your research and business development efforts. So that we may continue to incorporate your views and insights into our planning process, we would appreciate it if you could take a few moments to complete and return by email this brief questionnaire. Your involvement at this stage is critical and we appreciate your time!
Idea #1 – Develop a set of rotating courses to be staffed by faculty from multiple universities and whose location changes from campus to campus within the state of Ohio. Two courses are proposed: one which introduces computer science to biologists, and one which introduces biology to computer scientists. To that end:
Would you support the development of this course through having your scientific staff give a guest lecture?
Yes or No
Idea #2 – Develop a shared service bioinformatics consulting group to provide technical programming and software development support for your business. This service would be available to all businesses and academic institutions in the State of Ohio. To that end:
How many hours of bioinformatics / computer consulting would you be willing to pay for on an annual basis?
Low Estimate - ___________High Estimate - ___________
What price would you be able to afford for premier consulting services on-site and customized to your needs? (Note: Professional service firms traditionally charge between 125 and 600 $ per hour)
75$ / hour? Yes or No100$ / hour? Yes or No125$ / hour? Yes or NoOther Rate? Yes or No Rate ($/hour) _______
64
- - Industry Questionnaire - -
Idea #3 – We are considering the utility of establishing a data storage and management service for you. As bioinformatics data increases in volume, this might assist in the coordination of data to serve your research needs. To that end:
How many gigabytes of data per year would you consider storing on a safe, secure host server?
- In your lab:Low Estimate - ___________High Estimate - ___________
- In your University:Low Estimate - ___________High Estimate - ___________
How much bandwidth (Gigabytes / day) would you estimate you would require on a daily basis to manage this amount of data? This would include transferring data to and from the host server.
- In your lab:Low Estimate - ___________High Estimate - ___________
- In your University:Low Estimate - ___________High Estimate - ___________
Thank you for your participation! We appreciate your interest in this initiative and we will keep you updated!

65
Financial Models

66
Rotational course
2001 2002 2003 2004 2005REVENUE 344,000$ 411,648$ 528,955$ 637,949$ 878,759$ COSTS 80,000$ 88,000$ 96,800$ 106,480$ 117,128$
EBIT 264,000$ 323,648$ 432,155$ 531,469$ 761,631$
REVENUECourses
TuitionStudent Course
CS for Biologists# students per location - LOW 20 22 24 27 29# students per location - AVE 35 37 38 40 41# students per location - HIGH 50 55 61 67 73# Locations - LOW 3 3 4 4 4# Locations - AVE 6 6 7 7 8# Locations - HIGH 8 9 10 11 12# Courses per Location 1 1 1 1 1Fee Per Course per student 1,000$ 1,040$ 1,082$ 1,125$ 1,170$
Inflation factor 4% 4% 4% 4% 4%
Expansion factor 10% 10% 10% 10% 10%
Total Fees for CS for Biologists 261,159.66 257,619.35 252,194.05 396,372.65 452,994.29 Biology for CS# students per location - LOW 20 22 24 27 29# students per location - AVE 35 37 38 40 41# students per location - HIGH 50 55 61 67 73# Locations - LOW 3 3 4 4 4# Locations - AVE 6 6 7 7 8# Locations - HIGH 8 9 10 11 12# Courses per Location 1 1 1 1 1Fee Per Course per student 1,000$ 1,040$ 1,082$ 1,125$ 1,170$
Inflation factor 4% 4% 4% 4% 4%
Expansion factor 10% 10% 10% 10% 10%
Total Fees for Biology for CSTotal student course fees 129,090.09 174,237.69 256,842.00 292,666.75 452,256.26
Professional Course# students per location 30 30 35 40 50# Locations 2 2 2 2 2# Courses per Location 1 1 1 1 1Fee Per Course per student 1,000$ 1,100$ 1,210$ 1,331$ 1,464$
Total professional course fees 60,000$ 66,000$ 84,700$ 106,480$ 146,410$ Total course fees 189,090$ 240,238$ 341,542$ 399,147$ 598,666$
MaterialsStudent course
CS for BiologistsFee Per Course per student 100$ 110$ 121$ 133$ 146$
Total Fees for CS for Biologists 27,660.19 27,555.05 33,865.14 42,578.53 39,266.86 Biology for CSFee Per Course per student 100$ 110$ 121$ 133$ 146$
Total Fees for Biology for CS 18,249.33 23,955.42 19,843.19 47,151.80 72,454.85 Total student material fees 45,910$ 51,510$ 53,708$ 89,730$ 111,722$
Professional CourseFee Per Course per student 150$ 165$ 182$ 200$ 220$
Total professional material fees 9,000$ 9,900$ 12,705$ 15,972$ 21,962$ Total material fees 54,910$ 61,410$ 66,413$ 105,702$ 133,683$
GrantsCurriculum development grant 100,000$ 110,000$ 121,000$ 133,100$ 146,410$
Total revenue 344,000$ 411,648$ 528,955$ 637,949$ 878,759$
COSTS
Labor
COSTS
Labor# Faculty 10 10 10 10 10Academic 8 8 8 8 8Industrial 2 2 2 2 2
Percentage of Academic 80% 80% 80% 80% 80%
# Lectures per person 20 20 20 20 20Average salary per lecture per person 400$ 440$ 484$ 532$ 586$
Total labor cost 64,000$ 70,400$ 77,440$ 85,184$ 93,702$ Burden
Burden rate (overhead+materials) 25% 25% 25% 25% 25%
Fully burdened labor cost 80,000$ 88,000$ 96,800$ 106,480$ 117,128$
EBIT340,265$ 315,148$ 397,263$ 627,887$ 812,386$
Note: Aggregated results from the preceding questionnaires were used to set the lower, average, and upper boundaries
for Monte Carlo simulations of this financial model.
67
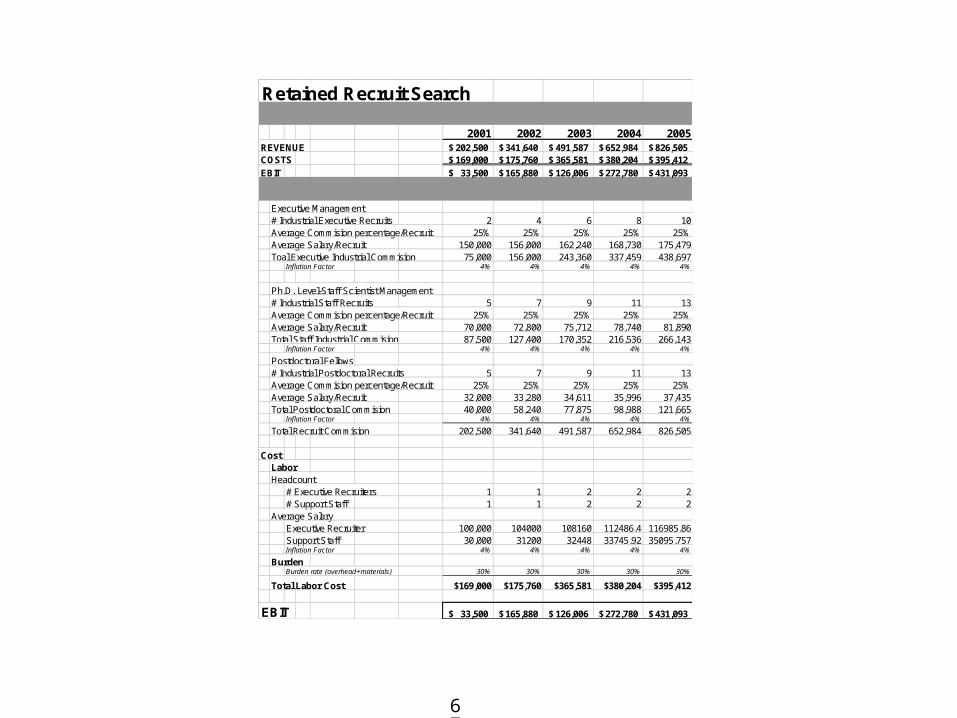
Retained Recruit Search
2001 2002 2003 2004 2005REVENUE 202,500$ 341,640$ 491,587$ 652,984$ 826,505$ COSTS 169,000$ 175,760$ 365,581$ 380,204$ 395,412$
EBIT 33,500$ 165,880$ 126,006$ 272,780$ 431,093$
Executive Management# Industrial Executive Recruits 2 4 6 8 10Average Commision percentage/Recruit 25% 25% 25% 25% 25%Average Salary/Recruit 150,000 156,000 162,240 168,730 175,479Toal Executive Industrial Commision 75,000 156,000 243,360 337,459 438,697
Inflation Factor 4% 4% 4% 4% 4%
Ph.D. Level-Staff Scientist Management# Industrial Staff Recruits 5 7 9 11 13Average Commision percentage/Recruit 25% 25% 25% 25% 25%Average Salary/Recruit 70,000 72,800 75,712 78,740 81,890Total Staff Industrial Commision 87,500 127,400 170,352 216,536 266,143
Inflation Factor 4% 4% 4% 4% 4%
Postdoctoral Fellows# Industrial Postdoctoral Recruits 5 7 9 11 13Average Commision percentage/Recruit 25% 25% 25% 25% 25%Average Salary/Recruit 32,000 33,280 34,611 35,996 37,435Total Postdoctoral Commision 40,000 58,240 77,875 98,988 121,665
Inflation Factor 4% 4% 4% 4% 4%
Total Recruit Commision 202,500 341,640 491,587 652,984 826,505
CostLaborHeadcount
# Executive Recruiters 1 1 2 2 2# Support Staff 1 1 2 2 2
Average SalaryExecutive Recruiter 100,000 104000 108160 112486.4 116985.86Support Staff 30,000 31200 32448 33745.92 35095.757Inflation Factor 4% 4% 4% 4% 4%
BurdenBurden rate (overhead+materials) 30% 30% 30% 30% 30%
Total Labor Cost $169,000 $175,760 $365,581 $380,204 $395,412
EBIT 33,500$ 165,880$ 126,006$ 272,780$ 431,093$

68
# Academic Clients 12 14 16 18 21# Industrial Clients 5 6 7 8 9Per hour Academic Billing Rate - LOW 75 78 81 84 88Per hour Academic Billing Rate - AVE 88 91 95 98 102Per hour Academic Billing Rate - HIGH 100 104 108 112 117Per hour Industrial Billing Rate - LOW 125 130 135 141 146Per hour Industrial Billing Rate - AVE 613 637 662 689 717Per hour Industrial Billing Rate - High 1,100 1,144 1,190 1,237 1,287# Consultants 3 4 5 6 8Utilization Rate - Adademic Consulting 5% 10% 15% 20% 25%Utilization Rate - Industrial Consulting 10% 15% 20% 25% 30%Annual Billable Hours Per Client - Academic Consulting - LOW 10 11 12 13 15Annual Billable Hours Per Client- Academic Consulting - AVE 25 28 30 33 37Annual Billable Hours Per Client - Academic Consulting - HIGH 40 44 48 53 59Annual Billable Hours Per Client - Industrial Consulting - LOW 125 138 151 166 183Annual Billable Hours Per Client - Industrial Consulting - AVE 613 674 741 815 897Annual Billable Hours Per Client - Industrial Consulting - HIGH 1100 1210 1331 1464 1611Annual Academic Consulting Revenues 38,807$ 39,660$ 21,192$ 99,896$ 117,442$ Annual Industrial Consulting Revenues 1,693,071$ 687,243$ 1,566,577$ 6,290,791$ 6,724,560$ Total Annual Consulting Revenues 1,731,879$ 726,903$ 1,587,769$ 6,390,686$ 6,842,002$ Inflation factor 4% 4% 4% 4% 4%Expansion factor 10% 10% 10% 10% 10%
Membership
# Premium 5 6 7 8 10
# Silver 15 20 25 30 30
# Basic 10 10 20 30 50
Total Members 30 36 52 68 90
Per Member Fee
Premium 5,000$ 5,200$ 5,408$ 5,624$ 5,849$ Silver 500$ 520$ 541$ 562$ 585$ Basic 100$ 104$ 108$ 112$ 117$ Inflation factor 4% 4% 4% 4% 4%
Membership FeesPremium 25,000$ 31,200$ 37,856$ 44,995$ 58,493$ Silver 7,500$ 10,400$ 13,520$ 16,873$ 17,548$ Basic 1,000$ 1,040$ 2,163$ 3,375$ 5,849$
Total Membership Fees 33,500$ 42,640$ 53,539$ 65,242$ 81,890$ Workshops
# Workshops Per Year 2 2 2 2 2# Participants Per Workshop 15$ 17$ 19$ 20$ 22$ Fee Per Participant 3,000$ 3,120$ 3,245$ 3,375$ 3,510$
Total Workshop Fees 90,000$ 106,080$ 123,302$ 134,984$ 154,421$
Total Revenue 2,055,379$ 1,275,623$ 2,364,611$ 7,390,912$ 8,178,313$
COSTSLabor
Headcount 7 9 11 14 16# Directors 1 1 1 1 1# BD Associates 1 2 2 3 3# PostDocs 2 3 4 5 6# Programers 2 2 3 3 4# Support Staff 1 1 1 2 2
Average SalaryInflation Factor 4% 4% 4% 4% 4%
Director 200,000$ 208,000$ 216,320$ 224,973$ 233,972$ BD Associate 60,000$ 62,400$ 64,896$ 67,492$ 70,192$ PostDoc 35,000$ 36,400$ 37,856$ 39,370$ 40,945$ Programer 80,000$ 83,200$ 86,528$ 89,989$ 93,589$ Support Staff 30,000$ 31,200$ 32,448$ 33,746$ 35,096$
Salary Total 520,000$ 639,600$ 789,568$ 961,759$ 1,134,763$ Burden
Burden rate (overhead+materials) 30% 30% 30% 30% 30%
Total labor cost 676,000$ 831,480$ 1,026,438$ 1,250,286$ 1,475,192$
EBIT 1,379,379$ 444,143$ 1,338,173$ 6,140,626$ 6,703,122$
Note: Aggregated results from the preceding questionnaires were used to set the lower, average, and upper boundaries for Monte Carlo simulations of this
financial model.
69
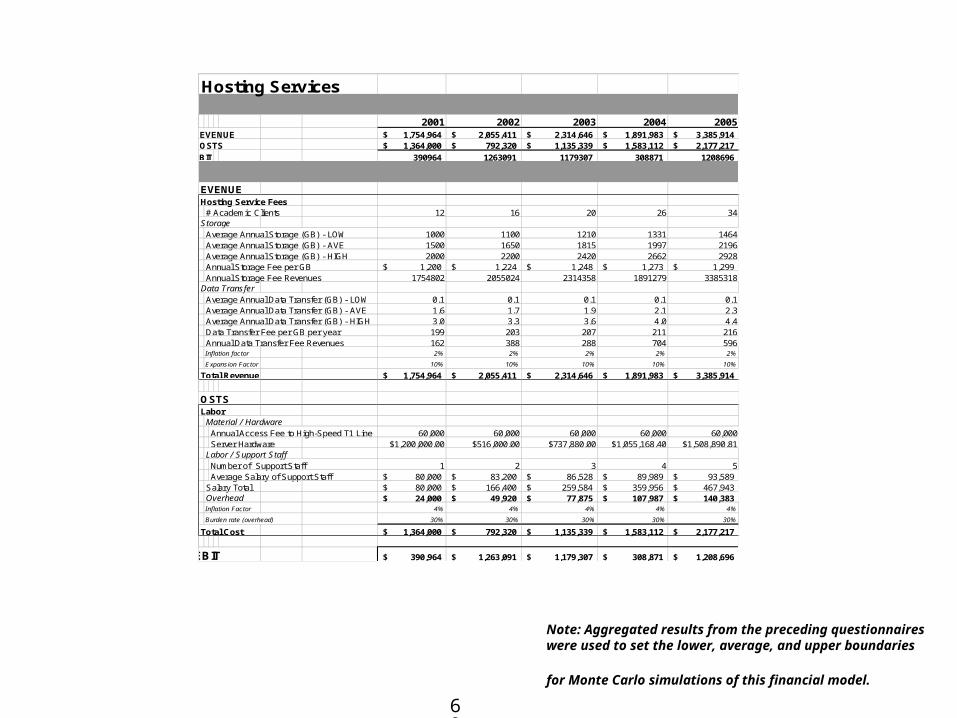
Hosting Services
2001 2002 2003 2004 2005REVENUE 1,754,964$ 2,055,411$ 2,314,646$ 1,891,983$ 3,385,914$ COSTS 1,364,000$ 792,320$ 1,135,339$ 1,583,112$ 2,177,217$
EBIT 390964 1263091 1179307 308871 1208696
REVENUEHosting Service Fees
# Academic Clients 12 16 20 26 34Storage
Average Annual Storage (GB) - LOW 1000 1100 1210 1331 1464Average Annual Storage (GB) - AVE 1500 1650 1815 1997 2196Average Annual Storage (GB) - HIGH 2000 2200 2420 2662 2928Annual Storage Fee per GB 1,200$ 1,224$ 1,248$ 1,273$ 1,299$ Annual Storage Fee Revenues 1754802 2055024 2314358 1891279 3385318
Data TransferAverage Annual Data Transfer (GB) - LOW 0.1 0.1 0.1 0.1 0.1Average Annual Data Transfer (GB) - AVE 1.6 1.7 1.9 2.1 2.3Average Annual Data Transfer (GB) - HIGH 3.0 3.3 3.6 4.0 4.4Data Transfer Fee per GB per year 199 203 207 211 216Annual Data Transfer Fee Revenues 162 388 288 704 596Inflation factor 2% 2% 2% 2% 2%
Expansion Factor 10% 10% 10% 10% 10%
Total Revenue 1,754,964$ 2,055,411$ 2,314,646$ 1,891,983$ 3,385,914$
COSTSLabor
Material / HardwareAnnual Access Fee to High-Speed T1 Line 60,000 60,000 60,000 60,000 60,000Server Hardware $1,200,000.00 $516,000.00 $737,880.00 $1,055,168.40 $1,508,890.81
Labor / Support StaffNumber of Support Staff 1 2 3 4 5Average Salary of Support Staff 80,000$ 83,200$ 86,528$ 89,989$ 93,589$
Salary Total 80,000$ 166,400$ 259,584$ 359,956$ 467,943$ Overhead 24,000$ 49,920$ 77,875$ 107,987$ 140,383$ Inflation Factor 4% 4% 4% 4% 4%
Burden rate (overhead) 30% 30% 30% 30% 30%
Total Cost 1,364,000$ 792,320$ 1,135,339$ 1,583,112$ 2,177,217$
EBIT 390,964$ 1,263,091$ 1,179,307$ 308,871$ 1,208,696$
Note: Aggregated results from the preceding questionnaires were used to set the lower, average, and upper boundaries
for Monte Carlo simulations of this financial model.
70
0%
20%
40%
60%
80%
100%
120%
$0 $1,000,000 $2,000,000 $3,000,000 $4,000,000 $5,000,000
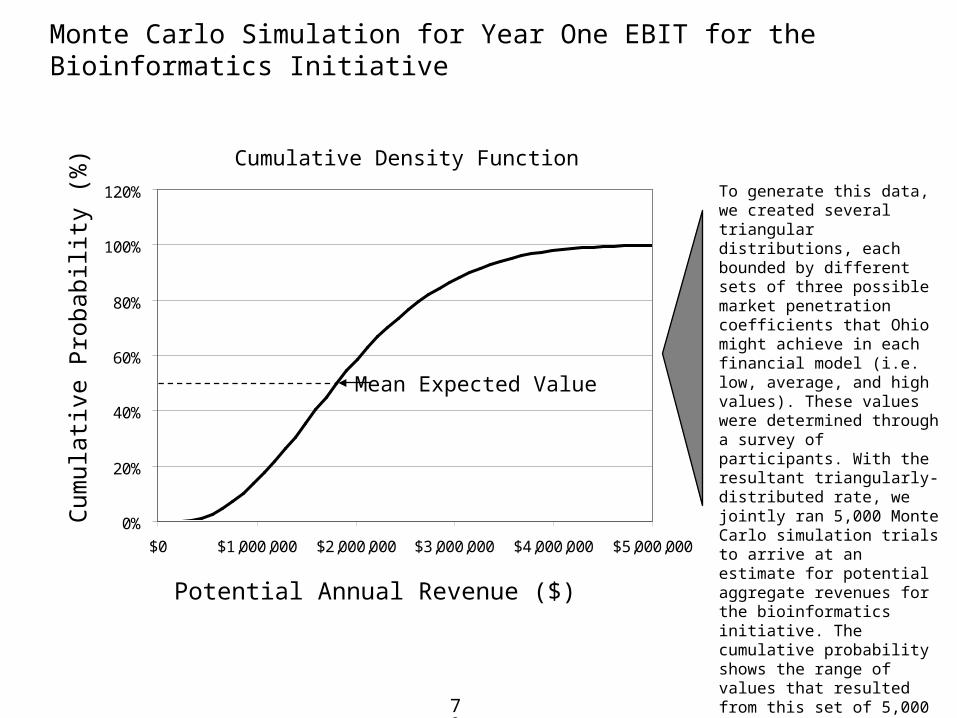
Monte Carlo Simulation for Year One EBIT for the Bioinformatics Initiative
Cumulative Density Function
Cum
ulat
ive
Pro
babi
lity
(%)
Potential Annual Revenue ($)
To generate this data, we created several triangular distributions, each bounded by different sets of three possible market penetration coefficients that Ohio might achieve in each financial model (i.e. low, average, and high values). These values were determined through a survey of participants. With the resultant triangularly-distributed rate, we jointly ran 5,000 Monte Carlo simulation trials to arrive at an estimate for potential aggregate revenues for the bioinformatics initiative. The cumulative probability shows the range of values that resulted from this set of 5,000 simulation trials.
Mean Expected Value
71
0%
20%
40%
60%
80%
100%
120%
$0 $2,000,000 $4,000,000 $6,000,000 $8,000,000 $10,000,000 $12,000,000 $14,000,000
EBIT Year One
EBIT Year Tw o
EBIT Year Three
EBIT Year Four
EBIT Year Five
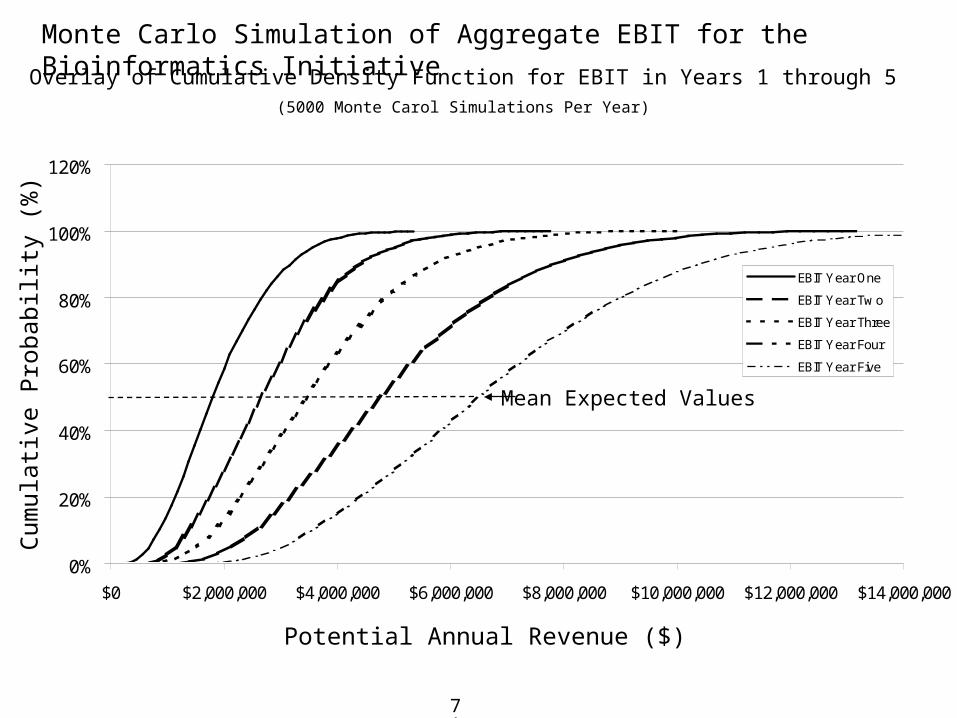
Monte Carlo Simulation of Aggregate EBIT for the Bioinformatics Initiative
Overlay of Cumulative Density Function for EBIT in Years 1 through 5(5000 Monte Carol Simulations Per Year)
Cum
ulat
ive
Pro
babi
lity
(%)
Potential Annual Revenue ($)
Mean Expected Values
72
0%
5%
10%
15%
20%
25%
30%
35%
40%
45%
$1,041,355 $2,848,400 $4,655,445 $6,462,490 $8,269,536 $10,076,581 $11,883,626 $13,690,671 $15,497,716 $17,304,762
EBIT Year Five
EBIT Year Four
EBIT Year Three
EBIT Year Tw o
EBIT Year One
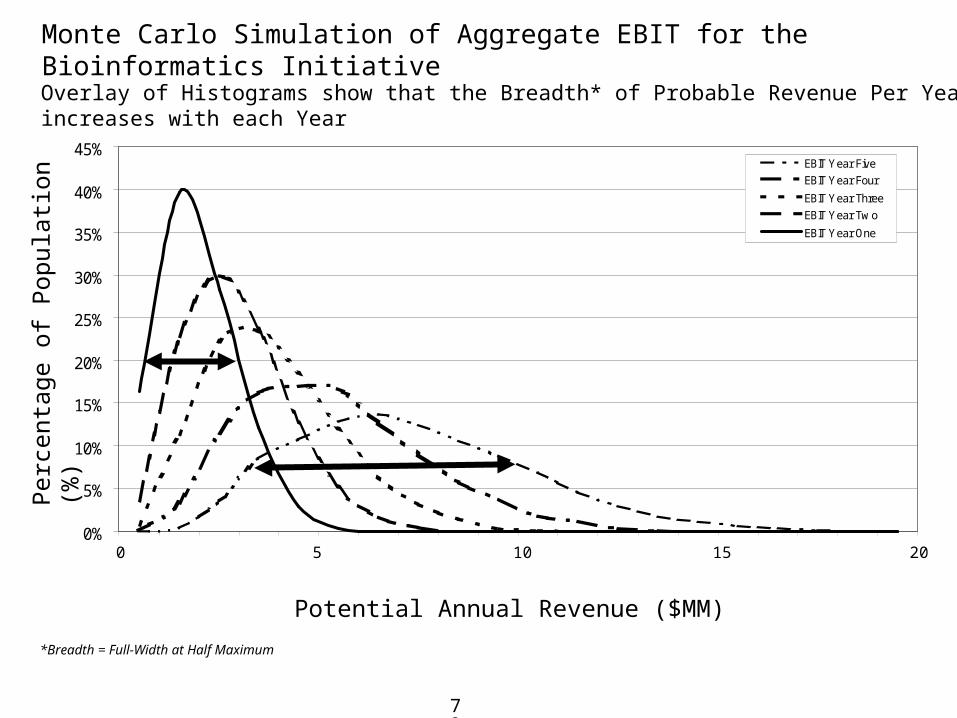
Monte Carlo Simulation of Aggregate EBIT for the Bioinformatics Initiative
Overlay of Histograms show that the Breadth* of Probable Revenue Per Year increases with each Year
Per
cent
age
of P
opul
atio
n (%
)
Potential Annual Revenue ($MM)
10 200 5 15
*Breadth = Full-Width at Half Maximum

73
$0
$2,000,000
$4,000,000
$6,000,000
$8,000,000
$10,000,000
$12,000,000
$14,000,000
EBIT YearOne
EBIT YearTwo
EBIT YearThree
EBIT YearFour
EBIT YearFive
95%
Mean
5%
Monte Carlo Simulation of Aggregate EBIT for the Bioinformatics Initiative
The Time Series of Revenue Probability RangesShows that the Probability of Postitive EBIT is High for most of the Simulation Range (5 to 95%)
Pot
entia
l Ann
ual R
even
ue (
$)

74
Bench Marks
75
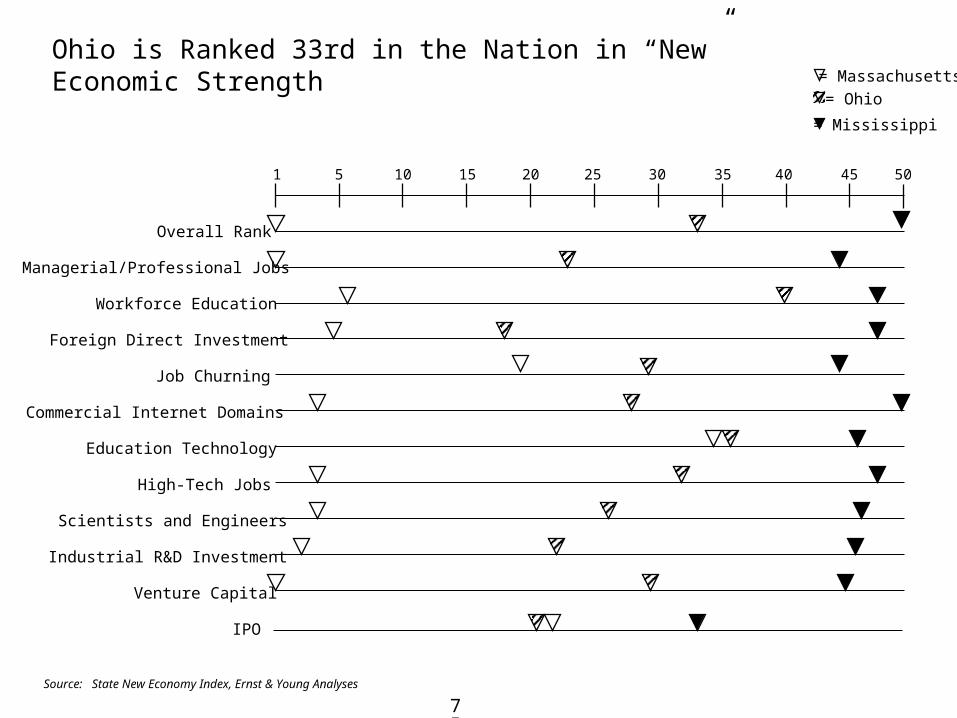
Ohio is Ranked 33rd in the Nation in “New” Economic Strength
1 5 10 15 20 25 30 35 40 45 50
= Ohio
= Massachusetts
= Mississippi
Overall Rank
Managerial/Professional Jobs
Workforce Education
Foreign Direct Investment
Job Churning
Commercial Internet Domains
Education Technology
High-Tech Jobs
Scientists and Engineers
Industrial R&D Investment
Venture Capital
IPO
Source: State New Economy Index, Ernst & Young Analyses
76
Strategic Consulting for the Life Sciences Industry
Our management consulting practice provides a full range of entrepreneurial services for life sciences companies at every stage of their business evolution, allowing entrepreneurial companies to focus on key strategic issues while leveraging leading practices. Consulting services include:
Strategic Planning From the formulation of business models to merger and acquisition transactions, we can provide a wide range of strategic consulting services. We can assist with scenario planning, competitive strategy, licensing strategy, strategic partnering, financial modeling and research and development portfolio management.
Market Research and Assessment We can provide a detailed investigation and systematic analyses of competitive products, firms, markets, and industries. We can assist with product definition, market sizing, and product positioning to drive robust product development and strategic planning.
New Product Development Our new product development team assists organizations in selecting the optimal mix of potential new products and services while effectively targeting niche markets. Further, we can efficiently drive the development process to result in high-impact products or services that are rapidly brought to market.
Product Launch Our product launch services guide the development of a cohesive and integrated product launch strategy, coordinating the build-up of manufacturing, distribution, sales and marketing capabilities to optimize market entry. We can provide launch readiness assessments to determine risk factors and interdependencies related to an upcoming launch.
Supply Chain Optimization We can improve the efficiency and effectiveness of the supply chain through cutting-edge business process, information flow and materials management, and optimize each step in the supply chain according to industry best practices and benchmarks.
Activity-Based Cost & Performance Management Our solution team assists organizations in achieving optimal performance and execution of business strategies through the development and deployment of performance measures. We can also utilize cost management techniques to provide information for key business decisions, including the development of activity-based cost models and the rollout of enterprise-wide performance scorecards.