Embed Size (px)
Citation preview
Developments in modelling of backward erosion piping
V. M. VAN BEEK�, H. M. VAN ESSEN†, K. VANDENBOER‡ and A. BEZUIJEN§
One of the failure mechanisms that can affect the safety of a dyke or another water-retaining structure isbackward erosion piping, a phenomenon that results in the formation of shallow pipes at the interface of asandyor silty foundation and a cohesive cover layer. Themodels available for predicting the critical head atwhich the pipe progresses to the upstream side have beenvalidated and adapted on the basis of experimentswith two-dimensional (2D) configurations. However, the experimental base for backward erosion inthree-dimensional (3D) configurations in which the flow concentrates towards one point, a situation thatis commonly encountered in the field, is limited. This paper presents additional 3D configurationexperiments at two scales with a range of sand types. The critical gradients, the formed pipes and theerosion mechanism were analysed for the available experiments, indicating that the erosion mechanism ismore complex than previously assumed, as both erosion at the tip of the pipe (primary erosion) and in thepipe (secondary erosion) are relevant. In addition, a 3D configuration was found to result in significantlylower critical gradients than those predicted by an accepted calculation model calibrated on the basis of2D experiments, a finding that is essential for the application of the model in the field.
KEYWORDS: design; embankments; erosion
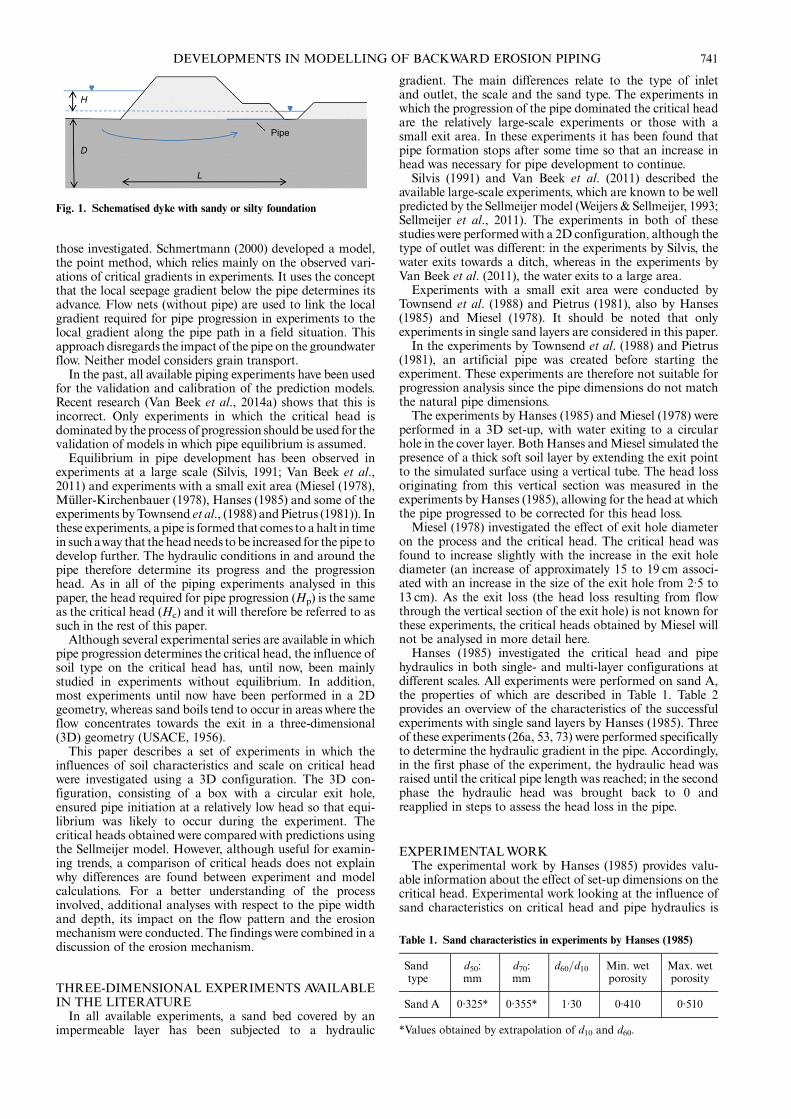
INTRODUCTIONBackward erosion piping is an internal erosion mechanismthat can result in a loss of stability in water-retaining struc-tures. This paper focuses specifically on the type of backwarderosion piping that occurs in the granular foundation of damsand dykes consisting of uniform silts and sands, and coveredby a cohesive layer. The head loss across the structure resultsin a flow through the aquifer, and the convergence of flowlines near the downstream exit causes the sand bed to fluidiselocally (Van Beek et al., 2014a). Subsequent erosion leadsto the development of shallow pipes at the interface of theaquifer and the cohesive top layer. After the full developmentof the pipe to the upstream water level, the increased flowcauses the deepening and widening of the pipe, underminingthe structure.
The specific conditions described are often met on rivers,where sand boils have been observed downstream of the dykeswhen water levels are high (see, e.g. Mansur et al., 2000;Vrijling et al., 2010). Sand boils often occur at locationswherethe flow concentrates towards the surface (USACE, 1956).Several dyke failures have been attributed to backwarderosion piping, examples being the failures near Zalk,Nieuwkuijk and Tholen in the Netherlands earlylast century (Vrijling et al., 2010), one of the failures in thelevee system of New Orleans as a result of Katrina (Vrijlinget al., 2010), and several cases in China on the Yangtze andNenjiang rivers as a result of the 1998 flood (Yao et al., 2009).
The earliest design and prediction models date back toearly last century (Bligh, 1910; Lane, 1935) and, despite thecriticisms levelled at them, they are still used. On the basis
of data derived from specific cases of piping, empiricalrelationships were established to determine the critical head(Hc), which is defined as the head across the structure atwhich the piping process results in ongoing erosion, finallyleading to failure. These empirical rules linked the criticalhead to the seepage length L and the soil properties. Theseepage length is defined here as the distance that the pipemust cover between the upstream level and downstream level,as illustrated in Fig. 1.More recent attempts to describe the process look at either
pipe initiation or pipe progression. Pipe initiation, whichis marked by the transition from an intact sand bed to asand bed with a short pipe caused by the initiation of sandtransport, can be described by the flow conditions in the sandbed near the exit, and it has been investigated in Richards &Reddy (2012) and Van Beek et al. (2014a). Once the pipe hasinitiated, equilibrium can be observed in pipe formation,requiring the increase in head difference H to make the pipeprogress. Modelling the progression of the pipe thereforerequires combining the analysis of pipe flow, groundwaterflow and criteria for erosion in and around the pipe.Several attempts have been made to describe or model
these processes in whole or in part. Hanses (1985), Sellmeijer(1988), Sellmeijer et al. (2011) and Schmertmann (2000)have published models, which are briefly described by VanBeek et al. (2014a). Hanses (1985) assumed that ‘primaryerosion’ – erosion at the tip of the pipe – causes pipe leng-thening. He simulated the flow pattern in the experimentsand included the impact of the pipe on groundwater flow usingthe pipe gradients measured during the experiments. TheSellmeijer model is the only backward erosion model thatexplicitly includes the pipe hydraulics and the equilibrium offorces on the particles at the bottom of the pipe just beforeerosion starts (Sellmeijer, 1988). In this two-dimensional (2D)model, secondary erosion – defined as erosion that results inthe widening or deepening of the pipe – is assumed to be themain mechanism of pipe development. Recently, the modelwas adapted to account for the influence of soil characteristicsin the light of experimental results (Sellmeijer et al., 2011),making it more empirical in nature. The lack of a properexplanation for this entirely empirical adaptation is unsatis-factory and limits its practical use to sand types similar to
� Unit Geo-Engineering, Deltares, Delft, the Netherlands; Facultyof Civil Engineering and Geosciences, Delft University ofTechnology, Delft, the Netherlands.† Unit Geo-Engineering, Deltares, Delft, the Netherlands.‡ Department Civil Engineering, Ghent University, Ghent,Belgium.§ Department Civil Engineering, Ghent University, Ghent,Belgium; Unit Geo-Engineering, Deltares, Delft, the Netherlands.
Manuscript received 29 June 2014; revised manuscript accepted23 April 2015. Published online ahead of print 22 July 2015.Discussion on this paper closes on 1 February 2016, for furtherdetails see p. ii.
Van Beek, V. M. et al. (2015). Géotechnique 65, No. 9, 740–754 [http://dx.doi.org/10.1680/geot.14.P.119]
740
those investigated. Schmertmann (2000) developed a model,the point method, which relies mainly on the observed vari-ations of critical gradients in experiments. It uses the conceptthat the local seepage gradient below the pipe determines itsadvance. Flow nets (without pipe) are used to link the localgradient required for pipe progression in experiments to thelocal gradient along the pipe path in a field situation. Thisapproach disregards the impact of the pipe on the groundwaterflow. Neither model considers grain transport.In the past, all available piping experiments have been used
for the validation and calibration of the prediction models.Recent research (Van Beek et al., 2014a) shows that this isincorrect. Only experiments in which the critical head isdominated by the process of progression shouldbe used for thevalidation of models in which pipe equilibrium is assumed.Equilibrium in pipe development has been observed in
experiments at a large scale (Silvis, 1991; Van Beek et al.,2011) and experiments with a small exit area (Miesel (1978),Müller-Kirchenbauer (1978), Hanses (1985) and some of theexperiments byTownsend et al., (1988) and Pietrus (1981)). Inthese experiments, a pipe is formed that comes to a halt in timein such away that the head needs to be increased for the pipe todevelop further. The hydraulic conditions in and around thepipe therefore determine its progress and the progressionhead. As in all of the piping experiments analysed in thispaper, the head required for pipe progression (Hp) is the sameas the critical head (Hc) and it will therefore be referred to assuch in the rest of this paper.Although several experimental series are available in which
pipe progression determines the critical head, the influence ofsoil type on the critical head has, until now, been mainlystudied in experiments without equilibrium. In addition,most experiments until now have been performed in a 2Dgeometry, whereas sand boils tend to occur in areas where theflow concentrates towards the exit in a three-dimensional(3D) geometry (USACE, 1956).This paper describes a set of experiments in which the
influences of soil characteristics and scale on critical headwere investigated using a 3D configuration. The 3D con-figuration, consisting of a box with a circular exit hole,ensured pipe initiation at a relatively low head so that equi-librium was likely to occur during the experiment. Thecritical heads obtained were comparedwith predictions usingthe Sellmeijer model. However, although useful for examin-ing trends, a comparison of critical heads does not explainwhy differences are found between experiment and modelcalculations. For a better understanding of the processinvolved, additional analyses with respect to the pipe widthand depth, its impact on the flow pattern and the erosionmechanism were conducted. The findings were combined in adiscussion of the erosion mechanism.
THREE-DIMENSIONAL EXPERIMENTS AVAILABLEIN THE LITERATUREIn all available experiments, a sand bed covered by an
impermeable layer has been subjected to a hydraulic
gradient. The main differences relate to the type of inletand outlet, the scale and the sand type. The experiments inwhich the progression of the pipe dominated the critical headare the relatively large-scale experiments or those with asmall exit area. In these experiments it has been found thatpipe formation stops after some time so that an increase inhead was necessary for pipe development to continue.Silvis (1991) and Van Beek et al. (2011) described the
available large-scale experiments, which are known to be wellpredicted by the Sellmeijer model (Weijers & Sellmeijer, 1993;Sellmeijer et al., 2011). The experiments in both of thesestudieswere performedwith a 2D configuration, although thetype of outlet was different: in the experiments by Silvis, thewater exits towards a ditch, whereas in the experiments byVan Beek et al. (2011), the water exits to a large area.Experiments with a small exit area were conducted by
Townsend et al. (1988) and Pietrus (1981), also by Hanses(1985) and Miesel (1978). It should be noted that onlyexperiments in single sand layers are considered in this paper.In the experiments by Townsend et al. (1988) and Pietrus
(1981), an artificial pipe was created before starting theexperiment. These experiments are therefore not suitable forprogression analysis since the pipe dimensions do not matchthe natural pipe dimensions.The experiments by Hanses (1985) and Miesel (1978) were
performed in a 3D set-up, with water exiting to a circularhole in the cover layer. Both Hanses andMiesel simulated thepresence of a thick soft soil layer by extending the exit pointto the simulated surface using a vertical tube. The head lossoriginating from this vertical section was measured in theexperiments byHanses (1985), allowing for the head at whichthe pipe progressed to be corrected for this head loss.Miesel (1978) investigated the effect of exit hole diameter
on the process and the critical head. The critical head wasfound to increase slightly with the increase in the exit holediameter (an increase of approximately 15 to 19 cm associ-ated with an increase in the size of the exit hole from 2·5 to13 cm). As the exit loss (the head loss resulting from flowthrough the vertical section of the exit hole) is not known forthese experiments, the critical heads obtained by Miesel willnot be analysed in more detail here.Hanses (1985) investigated the critical head and pipe
hydraulics in both single- and multi-layer configurations atdifferent scales. All experiments were performed on sand A,the properties of which are described in Table 1. Table 2provides an overview of the characteristics of the successfulexperiments with single sand layers by Hanses (1985). Threeof these experiments (26a, 53, 73) were performed specificallyto determine the hydraulic gradient in the pipe. Accordingly,in the first phase of the experiment, the hydraulic head wasraised until the critical pipe length was reached; in the secondphase the hydraulic head was brought back to 0 andreapplied in steps to assess the head loss in the pipe.
EXPERIMENTALWORKThe experimental work by Hanses (1985) provides valu-
able information about the effect of set-up dimensions on thecritical head. Experimental work looking at the influence ofsand characteristics on critical head and pipe hydraulics is
H
D
L
Pipe
Fig. 1. Schematised dyke with sandy or silty foundation
Table 1. Sand characteristics in experiments by Hanses (1985)
Sandtype
d50:mm
d70:mm
d60=d10 Min. wetporosity
Max. wetporosity
Sand A 0·325* 0·355* 1·30 0·410 0·510
*Values obtained by extrapolation of d10 and d60.
DEVELOPMENTS IN MODELLING OF BACKWARD EROSION PIPING 741
limited. Additional experiments were therefore conducted toinvestigate the influence of sand type on the role of criticalhead in pipe progression. Several experiments have alsoallowed for the investigation of pipe dimensions, pipehydraulics and the erosion mechanism.
Experimental set-upThe experiments with an exit hole simulated the case where
a confining upper layer is locally punctured such that flowfrom the aquifer concentrates towards one point. Threetypes of experiments were performed. They can be describedas small-scale experiments, medium-scale experiments andvisualisation experiments. In these experiments, a confinedsand sample was subjected to a head drop, simulating theflow of water through an aquifer beneath an impermeablewater-retaining structure. All experiments were performedusing a small circular exit in the top of the box. The high flowvelocity near the exit ensured pipe initiation at a relativelylow head drop, allowing the process of pipe progression to beinvestigated.
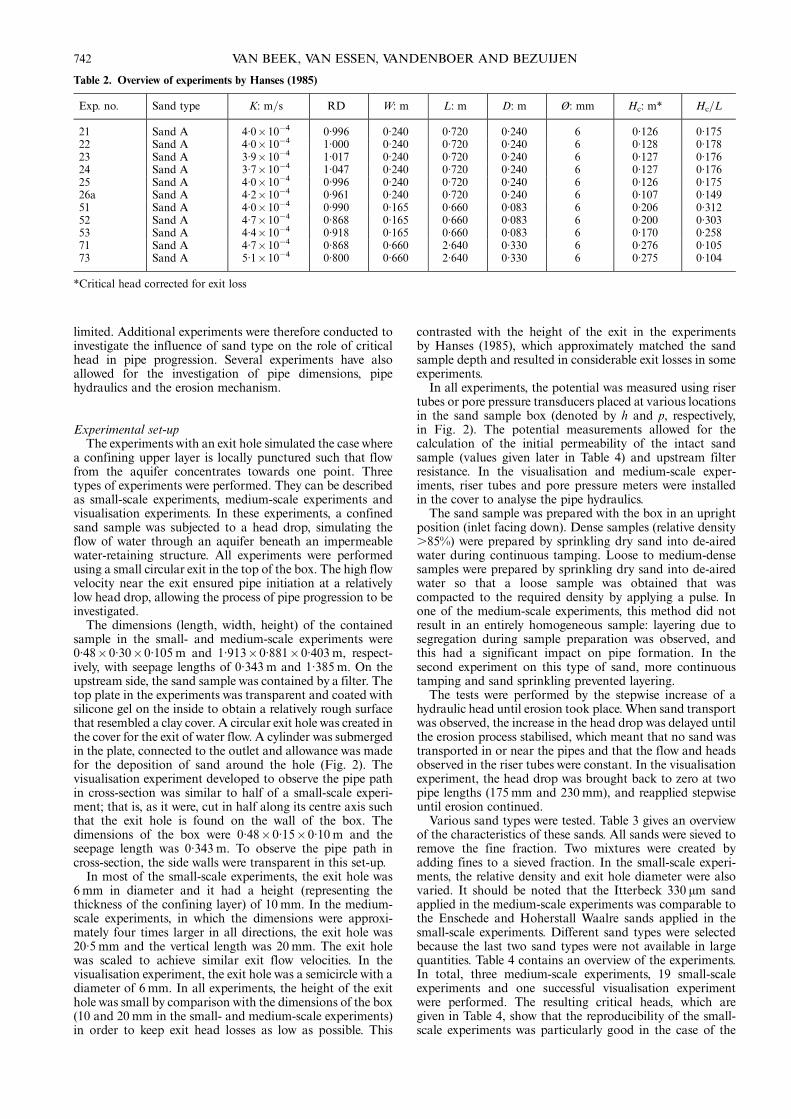
The dimensions (length, width, height) of the containedsample in the small- and medium-scale experiments were0·48�0·30�0·105 m and 1·913�0·881�0·403 m, respect-ively, with seepage lengths of 0·343 m and 1·385 m. On theupstream side, the sand sample was contained by a filter. Thetop plate in the experiments was transparent and coated withsilicone gel on the inside to obtain a relatively rough surfacethat resembled a clay cover. A circular exit hole was created inthe cover for the exit of water flow. A cylinder was submergedin the plate, connected to the outlet and allowance was madefor the deposition of sand around the hole (Fig. 2). Thevisualisation experiment developed to observe the pipe pathin cross-section was similar to half of a small-scale experi-ment; that is, as it were, cut in half along its centre axis suchthat the exit hole is found on the wall of the box. Thedimensions of the box were 0·48�0·15�0·10 m and theseepage length was 0·343 m. To observe the pipe path incross-section, the side walls were transparent in this set-up.
In most of the small-scale experiments, the exit hole was6 mm in diameter and it had a height (representing thethickness of the confining layer) of 10 mm. In the medium-scale experiments, in which the dimensions were approxi-mately four times larger in all directions, the exit hole was20·5 mm and the vertical length was 20 mm. The exit holewas scaled to achieve similar exit flow velocities. In thevisualisation experiment, the exit hole was a semicircle with adiameter of 6 mm. In all experiments, the height of the exithole was small by comparison with the dimensions of the box(10 and 20 mm in the small- and medium-scale experiments)in order to keep exit head losses as low as possible. This
contrasted with the height of the exit in the experimentsby Hanses (1985), which approximately matched the sandsample depth and resulted in considerable exit losses in someexperiments.In all experiments, the potential was measured using riser
tubes or pore pressure transducers placed at various locationsin the sand sample box (denoted by h and p, respectively,in Fig. 2). The potential measurements allowed for thecalculation of the initial permeability of the intact sandsample (values given later in Table 4) and upstream filterresistance. In the visualisation and medium-scale exper-iments, riser tubes and pore pressure meters were installedin the cover to analyse the pipe hydraulics.The sand sample was prepared with the box in an upright
position (inlet facing down). Dense samples (relative density.85%) were prepared by sprinkling dry sand into de-airedwater during continuous tamping. Loose to medium-densesamples were prepared by sprinkling dry sand into de-airedwater so that a loose sample was obtained that wascompacted to the required density by applying a pulse. Inone of the medium-scale experiments, this method did notresult in an entirely homogeneous sample: layering due tosegregation during sample preparation was observed, andthis had a significant impact on pipe formation. In thesecond experiment on this type of sand, more continuoustamping and sand sprinkling prevented layering.The tests were performed by the stepwise increase of a
hydraulic head until erosion took place. When sand transportwas observed, the increase in the head drop was delayed untilthe erosion process stabilised, which meant that no sand wastransported in or near the pipes and that the flow and headsobserved in the riser tubes were constant. In the visualisationexperiment, the head drop was brought back to zero at twopipe lengths (175 mm and 230 mm), and reapplied stepwiseuntil erosion continued.Various sand types were tested. Table 3 gives an overview
of the characteristics of these sands. All sands were sieved toremove the fine fraction. Two mixtures were created byadding fines to a sieved fraction. In the small-scale experi-ments, the relative density and exit hole diameter were alsovaried. It should be noted that the Itterbeck 330 μm sandapplied in the medium-scale experiments was comparable tothe Enschede and Hoherstall Waalre sands applied in thesmall-scale experiments. Different sand types were selectedbecause the last two sand types were not available in largequantities. Table 4 contains an overview of the experiments.In total, three medium-scale experiments, 19 small-scaleexperiments and one successful visualisation experimentwere performed. The resulting critical heads, which aregiven in Table 4, show that the reproducibility of the small-scale experiments was particularly good in the case of the
Table 2. Overview of experiments by Hanses (1985)
Exp. no. Sand type K: m=s RD W: m L: m D: m Ø: mm Hc: m* Hc=L
21 Sand A 4·0�10�4 0·996 0·240 0·720 0·240 6 0·126 0·17522 Sand A 4·0�10�4 1·000 0·240 0·720 0·240 6 0·128 0·17823 Sand A 3·9�10�4 1·017 0·240 0·720 0·240 6 0·127 0·17624 Sand A 3·7�10�4 1·047 0·240 0·720 0·240 6 0·127 0·17625 Sand A 4·0�10�4 0·996 0·240 0·720 0·240 6 0·126 0·17526a Sand A 4·2�10�4 0·961 0·240 0·720 0·240 6 0·107 0·14951 Sand A 4·0�10�4 0·990 0·165 0·660 0·083 6 0·206 0·31252 Sand A 4·7�10�4 0·868 0·165 0·660 0·083 6 0·200 0·30353 Sand A 4·4�10�4 0·918 0·165 0·660 0·083 6 0·170 0·25871 Sand A 4·7�10�4 0·868 0·660 2·640 0·330 6 0·276 0·10573 Sand A 5·1�10�4 0·800 0·660 2·640 0·330 6 0·275 0·104
*Critical head corrected for exit loss
VAN BEEK, VAN ESSEN, VANDENBOER AND BEZUIJEN742
Outlet
Cylinder
Acrylatecover
Upstreamfilter
InletSeepage length L
(a)
(b)
Circularexit ∅
∅ = 6–12 mm
∅ = 6 mm
∅ = 20·5 mm
d = 10 mm
d = 10 mm
d = 20 mm
W= 0·3
0m
W= 0·8
8m
Widt
h, W
L = 0·34 m
L = 0·34 m
L = 1·385 m
Ls= 0·48 m
D=
0·1
mD
=0·
1m
D=
0·40
m
Ls= 0·48 m
Ls= 1·91 m
(c)
(d)
h1 h2 h3
h2 h1h3h4h5
h1 h2 h3 h4
h5h6p9 p8 p7
p13
p12 p10
p11p6 p5
h6h7
Fig. 2. (a) Schematic diagram of the general experimental set-up; the specific configurations for the (b) small-scale, (c) visualisation and (d)medium-scale experiments, showing the set-up dimensions and locations of the riser tubes and pore pressure transducers
Table 3. Sand characteristics in additional experiments
Sand type d50: mm d70: mm d60=d10 Min. wet porosity* Max. wet porosity*
Baskarp 1 0·132 0·154 1·54 0·340 0·469Baskarp 2 0·132 0·152 1·50 0·367 0·477Enschede sand 0·380 0·431 1·60 0·320 0·411Hoherstall Waalre 0·341 0·400 1·58 0·350 0·450Oostelijke rivierenzand 0·233 0·307 2·06 0·322 0·423Itterbeck 330 μm 0·342 0·410 1·60 0·337 0·434Itterbeck 125–250 μm 0·219 0·278 1·71 0·345 0·465Itterbeck mixture 1 0·162 0·223 2·43 0·333 0·450Itterbeck mixture 2 0·143 0·203 3·17 0·319 0·440Sterksel 0·228 0·300 2·25 0·357 0·474
*Minimum and maximum porosity are obtained using a column with the same preparation method as that described in the ‘Experimentalset-up’ subsection.
DEVELOPMENTS IN MODELLING OF BACKWARD EROSION PIPING 743
experiments with Baskarp sand and reasonable in the case ofthe other experiments.
RESULTS AND ANALYSISThe results of the experiments have been interpreted at
different levels. At the macro-scale, the critical head wasobtained in each experiment, making comparisons possiblewith the adjusted and original Sellmeijer models to verify theeffects of scale and sand characteristics. Observations andhydraulic head measurements allowed for the analysis of pipedimensions and hydraulics. Information about the erosionmechanism was obtained at the grain scale.
Processes observedThe sequence of processes in small-scale experiments
with a small circular exit has been described by Müller-Kirchenbauer (1978) and Miesel (1978). They investigatedthe backward erosion phenomena in a small-scale (seepagelength is 0·72 m) set-up with a circular exit, simulating asandy layer with a considerable blanket layer. Müller-Kirchenbauer (1978) described the process in four steps.
(a) Fluidisation phase: fluidisation of the sand occurs nearthe exit.
(b) Transport phase: sand is transported through and out ofthe vertical section and a lens is formed in the sandaround the exit. The process stops at a given moment.
(c) Backward erosion: pipes are formed that grow towardsthe upstream side. The process stops and a furtherincrease in head drop is necessary to keep the pipegrowing.
(d) After a further increase in the head, a critical level isexceeded and the pipe grows until breach.
Miesel (1978) investigated how the diameter of the exithole affects the backward erosion process, and found that theprocesses are similar to the observations by Müller-Kirchenbauer (1978) but depend on the exit size. Theheads required for fluidisation and grain ejection increasewith exit diameter, the latter coinciding with the critical headfor exit diameters larger than 13 mm, such that equilibriumin pipe formation is not observed after grain ejection. Exitdiameter has hardly any effect on the critical head.The observations in the small- and medium-scale exper-
iments presented here resemble those of Müller-Kirchenbauer (1978) and Miesel (1978) for a small exitdiameter. An important difference in the set-up is the verticallength of the circular exit, which was considerably smaller inthe new experiments. Fluidisation of the sand bed occurred ata head drop of approximately 0·02–0·03 m in the small-scaleexperiments. The circular hole was gradually filled with sand,and sand was transported and deposited around the holeonce the entire vertical section was filled with sand at a headdifference of approximately 0·03–0·06 m. In the medium-scale experiments with an exit hole diameter of 20·5 mm andin the small-scale experiments with an exit hole diameter of12 mm, only part of the sand surface boiled.The transparent cover allowed for an analysis of the
process of pipe formation. Initially pipes formed in everydirection. However, after an incremental increase in the head,one or two pipes developed towards the upstream side. Forthe pipe to continue developing, several increases in the headwere necessary, indicating that the final critical head isdominated by the process of pipe progression.The width of the pipe tip appeared to be independent of
scale and pipe length. However, the widths of the pipe tips inthe relatively coarse sand types appeared to be larger thanthose in finer sands. The pipe width is discussed in moredetail in the section on pipe analysis. Upon lengthening,secondary erosion caused the pipe to widen downstream of
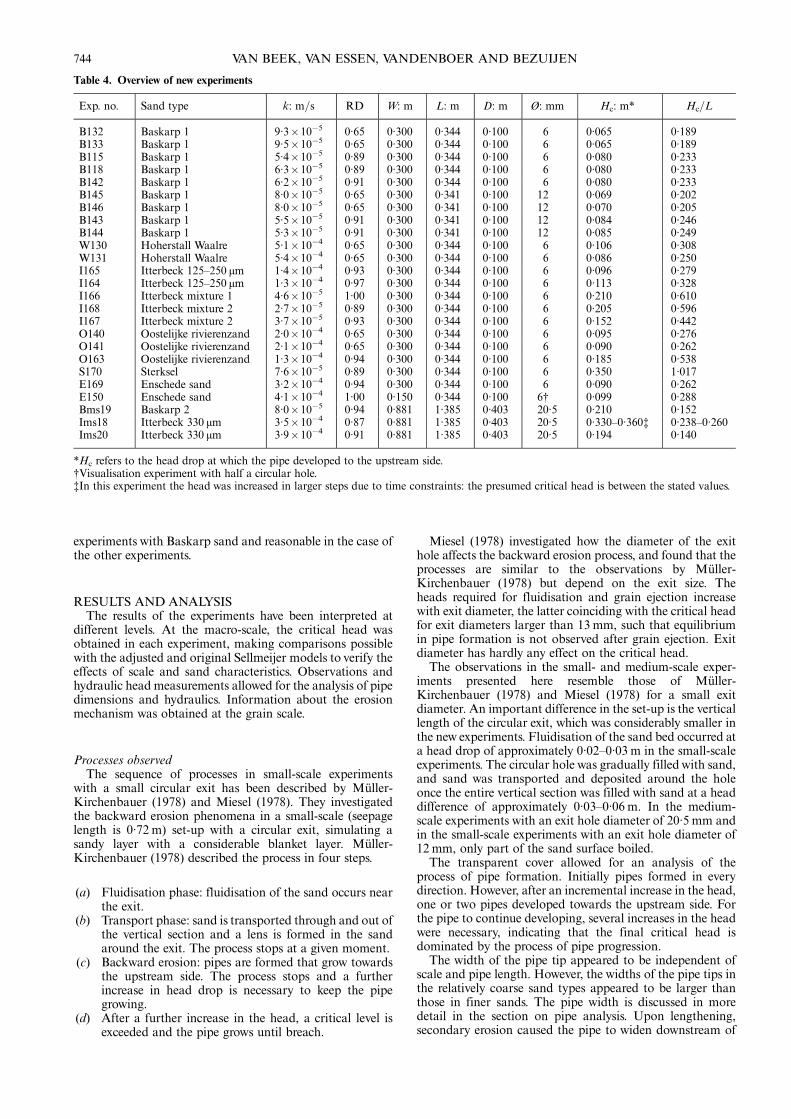
Table 4. Overview of new experiments
Exp. no. Sand type k: m=s RD W: m L: m D: m Ø: mm Hc: m* Hc=L
B132 Baskarp 1 9·3�10�5 0·65 0·300 0·344 0·100 6 0·065 0·189B133 Baskarp 1 9·5�10�5 0·65 0·300 0·344 0·100 6 0·065 0·189B115 Baskarp 1 5·4�10�5 0·89 0·300 0·344 0·100 6 0·080 0·233B118 Baskarp 1 6·3�10�5 0·89 0·300 0·344 0·100 6 0·080 0·233B142 Baskarp 1 6·2�10�5 0·91 0·300 0·344 0·100 6 0·080 0·233B145 Baskarp 1 8·0�10�5 0·65 0·300 0·341 0·100 12 0·069 0·202B146 Baskarp 1 8·0�10�5 0·65 0·300 0·341 0·100 12 0·070 0·205B143 Baskarp 1 5·5�10�5 0·91 0·300 0·341 0·100 12 0·084 0·246B144 Baskarp 1 5·3�10�5 0·91 0·300 0·341 0·100 12 0·085 0·249W130 Hoherstall Waalre 5·1�10�4 0·65 0·300 0·344 0·100 6 0·106 0·308W131 Hoherstall Waalre 5·4�10�4 0·65 0·300 0·344 0·100 6 0·086 0·250I165 Itterbeck 125–250 μm 1·4�10�4 0·93 0·300 0·344 0·100 6 0·096 0·279I164 Itterbeck 125–250 μm 1·3�10�4 0·97 0·300 0·344 0·100 6 0·113 0·328I166 Itterbeck mixture 1 4·6�10�5 1·00 0·300 0·344 0·100 6 0·210 0·610I168 Itterbeck mixture 2 2·7�10�5 0·89 0·300 0·344 0·100 6 0·205 0·596I167 Itterbeck mixture 2 3·7�10�5 0·93 0·300 0·344 0·100 6 0·152 0·442O140 Oostelijke rivierenzand 2·0�10�4 0·65 0·300 0·344 0·100 6 0·095 0·276O141 Oostelijke rivierenzand 2·1�10�4 0·65 0·300 0·344 0·100 6 0·090 0·262O163 Oostelijke rivierenzand 1·3�10�4 0·94 0·300 0·344 0·100 6 0·185 0·538S170 Sterksel 7·6�10�5 0·89 0·300 0·344 0·100 6 0·350 1·017E169 Enschede sand 3·2�10�4 0·94 0·300 0·344 0·100 6 0·090 0·262E150 Enschede sand 4·1�10�4 1·00 0·150 0·344 0·100 6† 0·099 0·288Bms19 Baskarp 2 8·0�10�5 0·94 0·881 1·385 0·403 20·5 0·210 0·152Ims18 Itterbeck 330 μm 3·5�10�4 0·87 0·881 1·385 0·403 20·5 0·330–0·360‡ 0·238–0·260Ims20 Itterbeck 330 μm 3·9�10�4 0·91 0·881 1·385 0·403 20·5 0·194 0·140
*Hc refers to the head drop at which the pipe developed to the upstream side.†Visualisation experiment with half a circular hole.‡In this experiment the head was increased in larger steps due to time constraints: the presumed critical head is between the stated values.
VAN BEEK, VAN ESSEN, VANDENBOER AND BEZUIJEN744
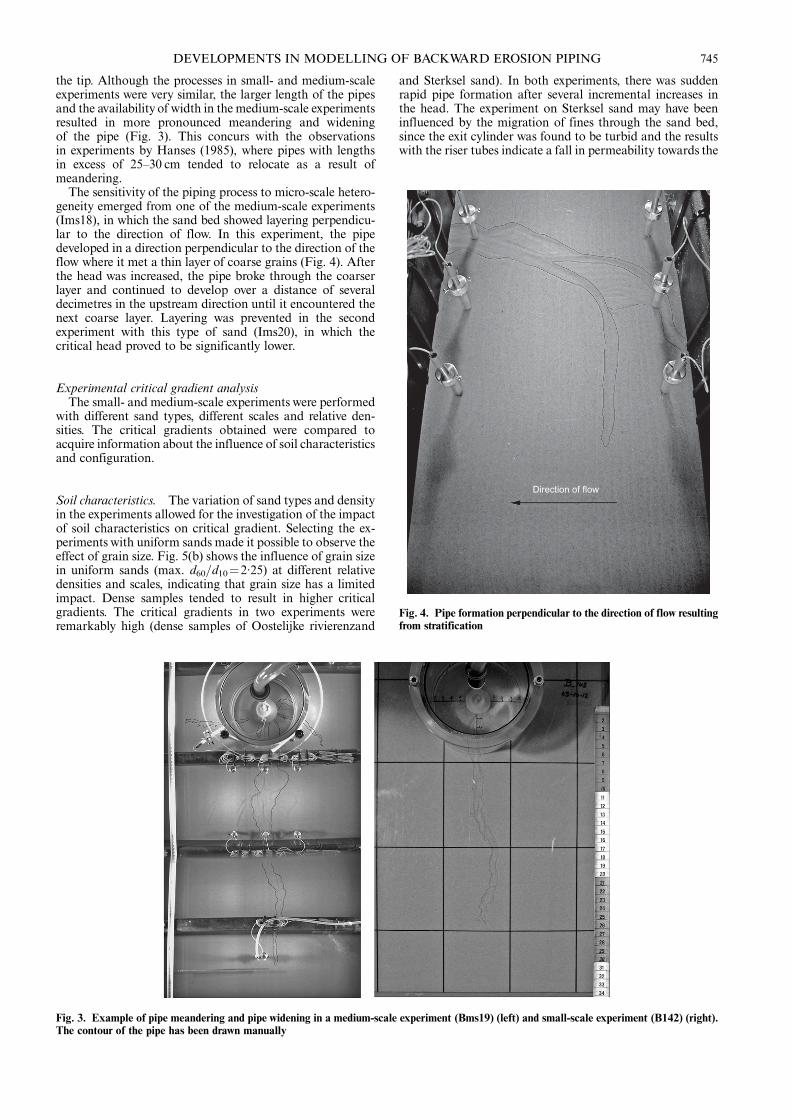
the tip. Although the processes in small- and medium-scaleexperiments were very similar, the larger length of the pipesand the availability of width in the medium-scale experimentsresulted in more pronounced meandering and wideningof the pipe (Fig. 3). This concurs with the observationsin experiments by Hanses (1985), where pipes with lengthsin excess of 25–30 cm tended to relocate as a result ofmeandering.The sensitivity of the piping process to micro-scale hetero-
geneity emerged from one of the medium-scale experiments(Ims18), in which the sand bed showed layering perpendicu-lar to the direction of flow. In this experiment, the pipedeveloped in a direction perpendicular to the direction of theflow where it met a thin layer of coarse grains (Fig. 4). Afterthe head was increased, the pipe broke through the coarserlayer and continued to develop over a distance of severaldecimetres in the upstream direction until it encountered thenext coarse layer. Layering was prevented in the secondexperiment with this type of sand (Ims20), in which thecritical head proved to be significantly lower.
Experimental critical gradient analysisThe small- and medium-scale experiments were performed
with different sand types, different scales and relative den-sities. The critical gradients obtained were compared toacquire information about the influence of soil characteristicsand configuration.
Soil characteristics. The variation of sand types and densityin the experiments allowed for the investigation of the impactof soil characteristics on critical gradient. Selecting the ex-periments with uniform sands made it possible to observe theeffect of grain size. Fig. 5(b) shows the influence of grain sizein uniform sands (max. d60=d10¼2·25) at different relativedensities and scales, indicating that grain size has a limitedimpact. Dense samples tended to result in higher criticalgradients. The critical gradients in two experiments wereremarkably high (dense samples of Oostelijke rivierenzand
and Sterksel sand). In both experiments, there was suddenrapid pipe formation after several incremental increases inthe head. The experiment on Sterksel sand may have beeninfluenced by the migration of fines through the sand bed,since the exit cylinder was found to be turbid and the resultswith the riser tubes indicate a fall in permeability towards the
Fig. 3. Example of pipe meandering and pipe widening in a medium-scale experiment (Bms19) (left) and small-scale experiment (B142) (right).The contour of the pipe has been drawn manually
Direction of flow
Fig. 4. Pipe formation perpendicular to the direction of flow resultingfrom stratification
DEVELOPMENTS IN MODELLING OF BACKWARD EROSION PIPING 745
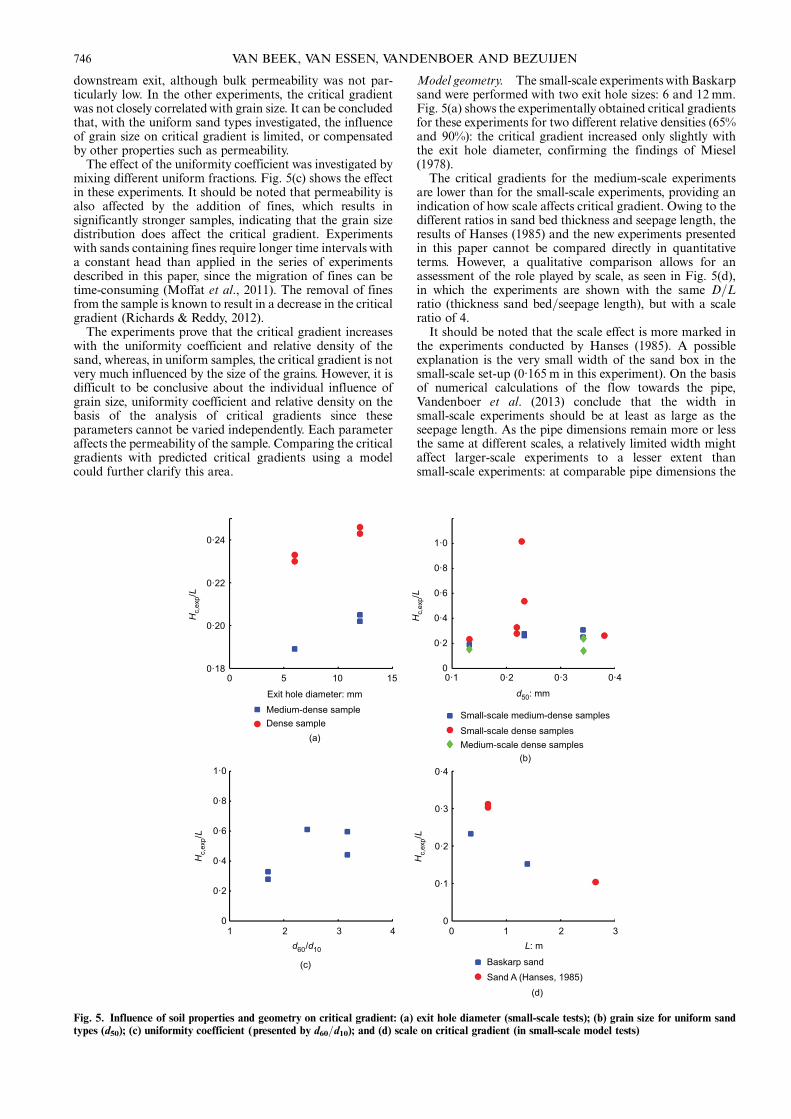
downstream exit, although bulk permeability was not par-ticularly low. In the other experiments, the critical gradientwas not closely correlatedwith grain size. It can be concludedthat, with the uniform sand types investigated, the influenceof grain size on critical gradient is limited, or compensatedby other properties such as permeability.
The effect of the uniformity coefficient was investigated bymixing different uniform fractions. Fig. 5(c) shows the effectin these experiments. It should be noted that permeability isalso affected by the addition of fines, which results insignificantly stronger samples, indicating that the grain sizedistribution does affect the critical gradient. Experimentswith sands containing fines require longer time intervals witha constant head than applied in the series of experimentsdescribed in this paper, since the migration of fines can betime-consuming (Moffat et al., 2011). The removal of finesfrom the sample is known to result in a decrease in the criticalgradient (Richards & Reddy, 2012).
The experiments prove that the critical gradient increaseswith the uniformity coefficient and relative density of thesand, whereas, in uniform samples, the critical gradient is notvery much influenced by the size of the grains. However, it isdifficult to be conclusive about the individual influence ofgrain size, uniformity coefficient and relative density on thebasis of the analysis of critical gradients since theseparameters cannot be varied independently. Each parameteraffects the permeability of the sample. Comparing the criticalgradients with predicted critical gradients using a modelcould further clarify this area.
Model geometry. The small-scale experiments with Baskarpsand were performed with two exit hole sizes: 6 and 12 mm.Fig. 5(a) shows the experimentally obtained critical gradientsfor these experiments for two different relative densities (65%and 90%): the critical gradient increased only slightly withthe exit hole diameter, confirming the findings of Miesel(1978).The critical gradients for the medium-scale experiments
are lower than for the small-scale experiments, providing anindication of how scale affects critical gradient. Owing to thedifferent ratios in sand bed thickness and seepage length, theresults of Hanses (1985) and the new experiments presentedin this paper cannot be compared directly in quantitativeterms. However, a qualitative comparison allows for anassessment of the role played by scale, as seen in Fig. 5(d),in which the experiments are shown with the same D=Lratio (thickness sand bed=seepage length), but with a scaleratio of 4.It should be noted that the scale effect is more marked in
the experiments conducted by Hanses (1985). A possibleexplanation is the very small width of the sand box in thesmall-scale set-up (0·165 m in this experiment). On the basisof numerical calculations of the flow towards the pipe,Vandenboer et al. (2013) conclude that the width insmall-scale experiments should be at least as large as theseepage length. As the pipe dimensions remain more or lessthe same at different scales, a relatively limited width mightaffect larger-scale experiments to a lesser extent thansmall-scale experiments: at comparable pipe dimensions the
0·24 1·0
0·8
0·6
0·4
0·2
00·1 0·2 0·3 0·4
0·22
0·20
Hc,
exp/
L
Hc,
exp/
L
Exit hole diameter: mm d50: mm
1·0
0·8
0·6
0·4
0·2
0
0·4
0·2
0·1
0·3
01 2 3 10 2 34
Baskarp sandSand A (Hanses, 1985)
Hc,
exp/
L
Hc,
exp/
L
d60/d10 L: m
0·180 5
Medium-dense sample Small-scale medium-dense samples
Small-scale dense samplesMedium-scale dense samples
Dense sample(a)
(c)
(d)
(b)
10 15
Fig. 5. Influence of soil properties and geometry on critical gradient: (a) exit hole diameter (small-scale tests); (b) grain size for uniform sandtypes (d50); (c) uniformity coefficient (presented by d60=d10); and (d) scale on critical gradient (in small-scale model tests)
VAN BEEK, VAN ESSEN, VANDENBOER AND BEZUIJEN746
limited width restricts the flow towards the pipe relativelymore in the case of a small box than in the case of a large box.Another explanation could be that, in the experiments byHanses (1985), the exit hole is not scaled in line with thedimensions of the set-up. Given the conclusion stated abovethat the hole size has a limited effect on the critical gradient,this is not likely to be the main cause of the anomaly.
Comparison of experimental critical gradients with SellmeijermodelAs all the experiments presented here involved equilibrium
in pipe development, they can be used as a basis for com-parison with models predicting pipe progression such asSellmeijer’s model (Sellmeijer, 1988).Sellmeijer’s model was implemented in a 2D numerical
groundwater model to account for different configurations(Sellmeijer, 2006) and used to derive a calculation rule fora ‘standard levee’ located on top of a homogeneous confinedaquifer. The original and adjusted rules are described inSellmeijer et al. (2011). The Sellmeijer model is known toresult in good predictions for large-scale experiments with2D configurations, such as the IJkdijk experiments(Sellmeijer et al., 2011) and the Delta Flume experiments(Weijers & Sellmeijer, 1993). The original and adjusted rulesare given in equations (1) and (2)
Hc
L¼ FRFSFG
FR ¼ ηγ0p
γw tan ϑ
FS ¼ d70ffiffiffiffiffiffiκL3
p
FG ¼ 0�91 DL
� � 0�28= D=Lð Þ2�8�1½ �f gþ0�04
ð1Þ
where RD denotes relative density, KAS denotes roundnessof particles and subscript m denotes the mean value of theparameter in selected experiments (Sellmeijer et al., 2011).As pipe formation itself is a 3D phenomenon (irrespectiveof whether the configuration is 2D or 3D), it was assumedthat the model could also be applied to 3D configurations,which are common in practice. Prior to the present study, thisassumption had not been verified experimentally.The calculation rule, which is suited for a standard dyke
geometry, was used to ‘postdict’ the experiments described inthe present study. As the rule is fitted to the results of thenumerical model, the outcomes of the rule and the numericalcalculation are the same for the standard dyke geometry.When a configuration is used with an exit that deviates fromthe standard dyke geometry, the difference between theoutcomes of the model and the rule should be examined. Thepresent experiment was therefore numerically simulated intwo dimensions, with the exit hole being represented by agap of infinite length and width equal to the exit holediameter. It is not yet possible to assess the influence of a 3Dconfiguration on critical gradient.
Figure 6 shows the expected influence of the exit holediameter on the calculated critical head using the 2Dnumerical model for one of the experiments. As the influenceof diameter on critical head is relatively small in the studiedrange, it is considered acceptable to use the rule rather thanthe 2D numerical model to ‘postdict’ the experiments. Itshould be noted that KAS (grain angularity) is a very minorfactor and this parameter was therefore not taken intoaccount. The difference in the angularity of the tested sandtypes is also relatively small.Figure 7 shows both the experimental and calculated
critical gradients for all experiments using the original andadjusted calculation rules. It is immediately clear that thecalculated critical gradients are approximately two timeslarger than the experimentally obtained values. Apparently,the 3D configuration results in considerably lower criticalgradients than a 2D configuration, for which the model hasbeen validated. The 2Dmodel cannot predict the 3D ground-water flow conditions, which apparently play a major role.Despite this, the comparison with the model is useful as away of identifying the effect of other properties.Figure 8 displays the results of those experiments in which
the soil type and relative density were varied. The predictedcritical gradients obtained with the original and adjustedrules were comparable in Baskarp sand experiments; vari-ations were found mainly with coarser sands. The graphsshow that the variation was more or less the same for allBaskarp experiments, indicating that the model accounts wellfor the influence of permeability and scale. The comparisonof experiments with the Sellmeijer models did not establish aclear trend with respect to grain size.Like the experiments with Oostelijke rivierenzand and
Sterksel sand, the experiments in which fines were addedindicated relatively high critical gradients by comparisonwith the uniform sands. The Sellmeijer model does
0·60
0·58
0·56
0·54
0·52
0·50101
Numerical calculationCalculation rule
102
Hc,
calc
/L
Exit hole diameter: mm
Fig. 6. Calculated critical gradients for different hole diameterscomparing the outcome of the 2D numerical calculation and thecalculation rule (using experiment B115 as an example)
Hc
L¼ FRFSFG
FR ¼ ηγ′pγw
tan ϑRDRDm
� �0�35 UUm
� �0�13 KASKASm
� ��0�02
FS ¼ d70ffiffiffiffiffiffiffiκ L3
p d70md70
� �0�6
FG ¼ 0�91 DL
� � 0�28= D=Lð Þ2�8�1½ �f gþ 0�04
ð2Þ
DEVELOPMENTS IN MODELLING OF BACKWARD EROSION PIPING 747
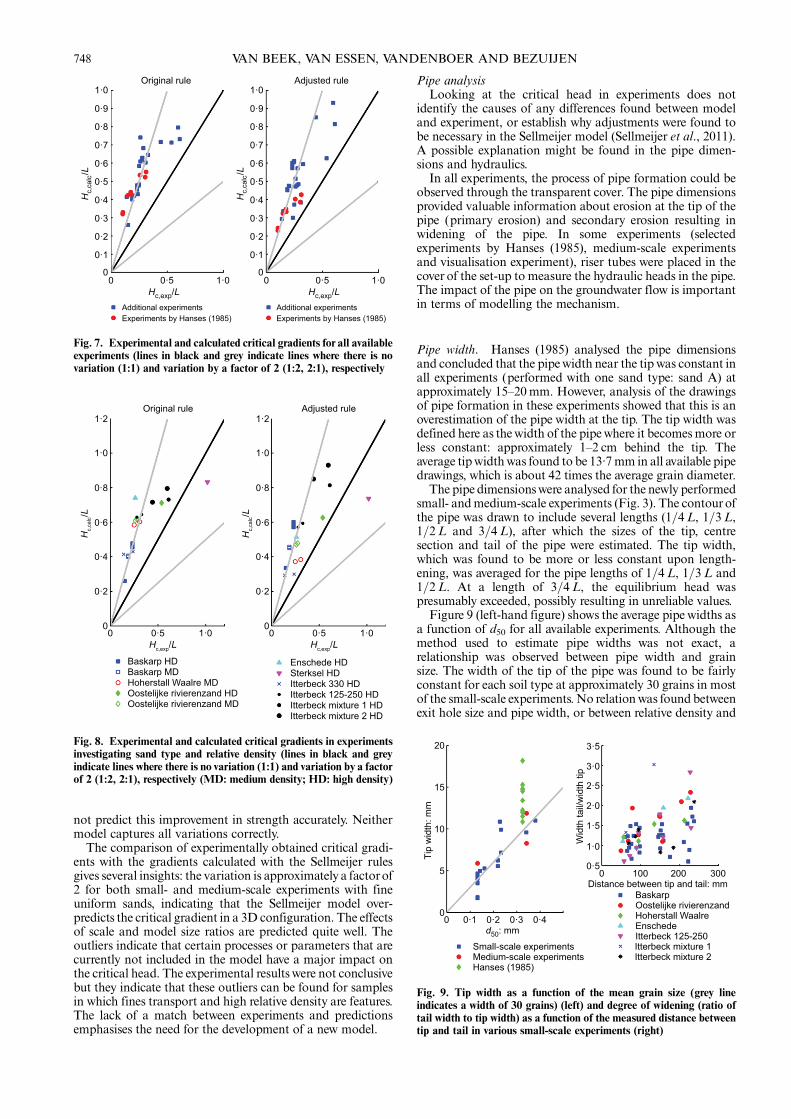
not predict this improvement in strength accurately. Neithermodel captures all variations correctly.
The comparison of experimentally obtained critical gradi-ents with the gradients calculated with the Sellmeijer rulesgives several insights: the variation is approximately a factorof2 for both small- and medium-scale experiments with fineuniform sands, indicating that the Sellmeijer model over-predicts the critical gradient in a 3D configuration. The effectsof scale and model size ratios are predicted quite well. Theoutliers indicate that certain processes or parameters that arecurrently not included in the model have a major impact onthe critical head. The experimental results were not conclusivebut they indicate that these outliers can be found for samplesin which fines transport and high relative density are features.The lack of a match between experiments and predictionsemphasises the need for the development of a new model.
Pipe analysisLooking at the critical head in experiments does not
identify the causes of any differences found between modeland experiment, or establish why adjustments were found tobe necessary in the Sellmeijer model (Sellmeijer et al., 2011).A possible explanation might be found in the pipe dimen-sions and hydraulics.In all experiments, the process of pipe formation could be
observed through the transparent cover. The pipe dimensionsprovided valuable information about erosion at the tip of thepipe (primary erosion) and secondary erosion resulting inwidening of the pipe. In some experiments (selectedexperiments by Hanses (1985), medium-scale experimentsand visualisation experiment), riser tubes were placed in thecover of the set-up to measure the hydraulic heads in the pipe.The impact of the pipe on the groundwater flow is importantin terms of modelling the mechanism.
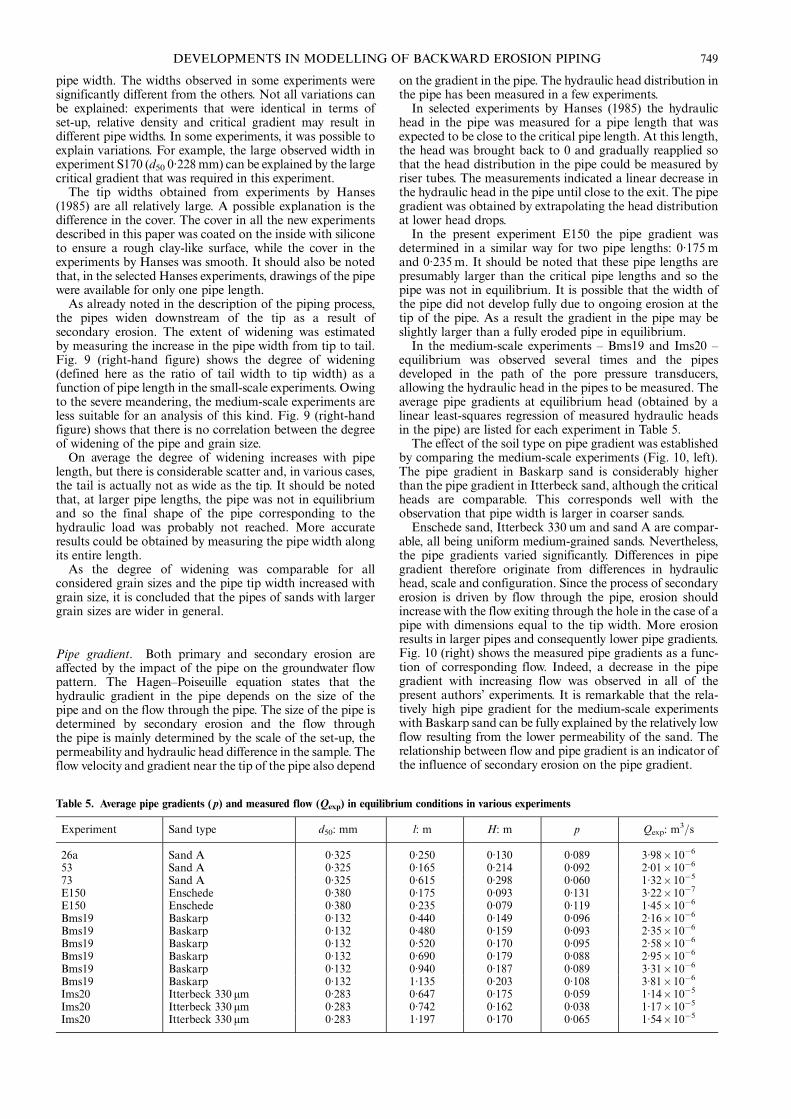
Pipe width. Hanses (1985) analysed the pipe dimensionsand concluded that the pipewidth near the tip was constant inall experiments (performed with one sand type: sand A) atapproximately 15–20mm. However, analysis of the drawingsof pipe formation in these experiments showed that this is anoverestimation of the pipe width at the tip. The tip width wasdefined here as thewidth of the pipewhere it becomes more orless constant: approximately 1–2 cm behind the tip. Theaverage tipwidthwas found to be 13·7mm in all available pipedrawings, which is about 42 times the average grain diameter.The pipe dimensionswere analysed for the newly performed
small- andmedium-scale experiments (Fig. 3). The contourofthe pipe was drawn to include several lengths (1=4L, 1=3L,1=2L and 3=4L), after which the sizes of the tip, centresection and tail of the pipe were estimated. The tip width,which was found to be more or less constant upon length-ening, was averaged for the pipe lengths of 1=4L, 1=3L and1=2L. At a length of 3=4L, the equilibrium head waspresumably exceeded, possibly resulting in unreliable values.Figure 9 (left-hand figure) shows the average pipe widths as
a function of d50 for all available experiments. Although themethod used to estimate pipe widths was not exact, arelationship was observed between pipe width and grainsize. The width of the tip of the pipe was found to be fairlyconstant for each soil type at approximately 30 grains in mostof the small-scale experiments. No relationwas found betweenexit hole size and pipe width, or between relative density and
Hc,
calc/L
Hc,exp/L Hc,exp/L0 0·5
Baskarp HD Enschede HDSterksel HDItterbeck 330 HDItterbeck 125-250 HDItterbeck mixture 1 HDItterbeck mixture 2 HD
Baskarp MDHoherstall Waalre MDOostelijke rivierenzand HDOostelijke rivierenzand MD
Original rule Adjusted rule
1·0 00
0·2
0·4
0·6
0·8
1·0
1·2
Hc,
calc/L
0
0·2
0·4
0·6
0·8
1·0
1·2
0·5 1·0
Fig. 8. Experimental and calculated critical gradients in experimentsinvestigating sand type and relative density (lines in black and greyindicate lines where there is no variation (1:1) and variation by a factorof 2 (1:2, 2:1), respectively (MD: medium density; HD: high density)
00
5
10
15
3·5
2·5
3·0
2·0
1·5
1·0
0·5
20
0·1 0·2 0·3 0·4d50: mm
Distance between tip and tail: mm0 100
BaskarpOostelijke rivierenzandHoherstall WaalreEnschedeItterbeck 125-250Itterbeck mixture 1Itterbeck mixture 2
Small-scale experimentsMedium-scale experimentsHanses (1985)
200 300
Wid
th ta
il/w
idth
tip
Tip
wid
th: m
m
Fig. 9. Tip width as a function of the mean grain size (grey lineindicates a width of 30 grains) (left) and degree of widening (ratio oftail width to tip width) as a function of the measured distance betweentip and tail in various small-scale experiments (right)
Hc,
calc
/L
Hc,exp/L Hc,exp/L
Original rule1·0
0·9
0·8
0·7
0·6
0·5
0·4
0·3
0·2
0·1
0
Hc,
calc
/L
1·0
0·9
0·8
0·7
0·6
0·5
0·4
0·3
0·2
0·1
00
Additional experimentsExperiments by Hanses (1985)
Additional experimentsExperiments by Hanses (1985)
0·5 1·0 0 0·5 1·0
Adjusted rule
Fig. 7. Experimental and calculated critical gradients for all availableexperiments (lines in black and grey indicate lines where there is novariation (1:1) and variation by a factor of 2 (1:2, 2:1), respectively
VAN BEEK, VAN ESSEN, VANDENBOER AND BEZUIJEN748
pipe width. The widths observed in some experiments weresignificantly different from the others. Not all variations canbe explained: experiments that were identical in terms ofset-up, relative density and critical gradient may result indifferent pipe widths. In some experiments, it was possible toexplain variations. For example, the large observed width inexperiment S170 (d50 0·228mm) can be explained by the largecritical gradient that was required in this experiment.The tip widths obtained from experiments by Hanses
(1985) are all relatively large. A possible explanation is thedifference in the cover. The cover in all the new experimentsdescribed in this paper was coated on the inside with siliconeto ensure a rough clay-like surface, while the cover in theexperiments by Hanses was smooth. It should also be notedthat, in the selected Hanses experiments, drawings of the pipewere available for only one pipe length.As already noted in the description of the piping process,
the pipes widen downstream of the tip as a result ofsecondary erosion. The extent of widening was estimatedby measuring the increase in the pipe width from tip to tail.Fig. 9 (right-hand figure) shows the degree of widening(defined here as the ratio of tail width to tip width) as afunction of pipe length in the small-scale experiments. Owingto the severe meandering, the medium-scale experiments areless suitable for an analysis of this kind. Fig. 9 (right-handfigure) shows that there is no correlation between the degreeof widening of the pipe and grain size.On average the degree of widening increases with pipe
length, but there is considerable scatter and, in various cases,the tail is actually not as wide as the tip. It should be notedthat, at larger pipe lengths, the pipe was not in equilibriumand so the final shape of the pipe corresponding to thehydraulic load was probably not reached. More accurateresults could be obtained by measuring the pipe width alongits entire length.As the degree of widening was comparable for all
considered grain sizes and the pipe tip width increased withgrain size, it is concluded that the pipes of sands with largergrain sizes are wider in general.
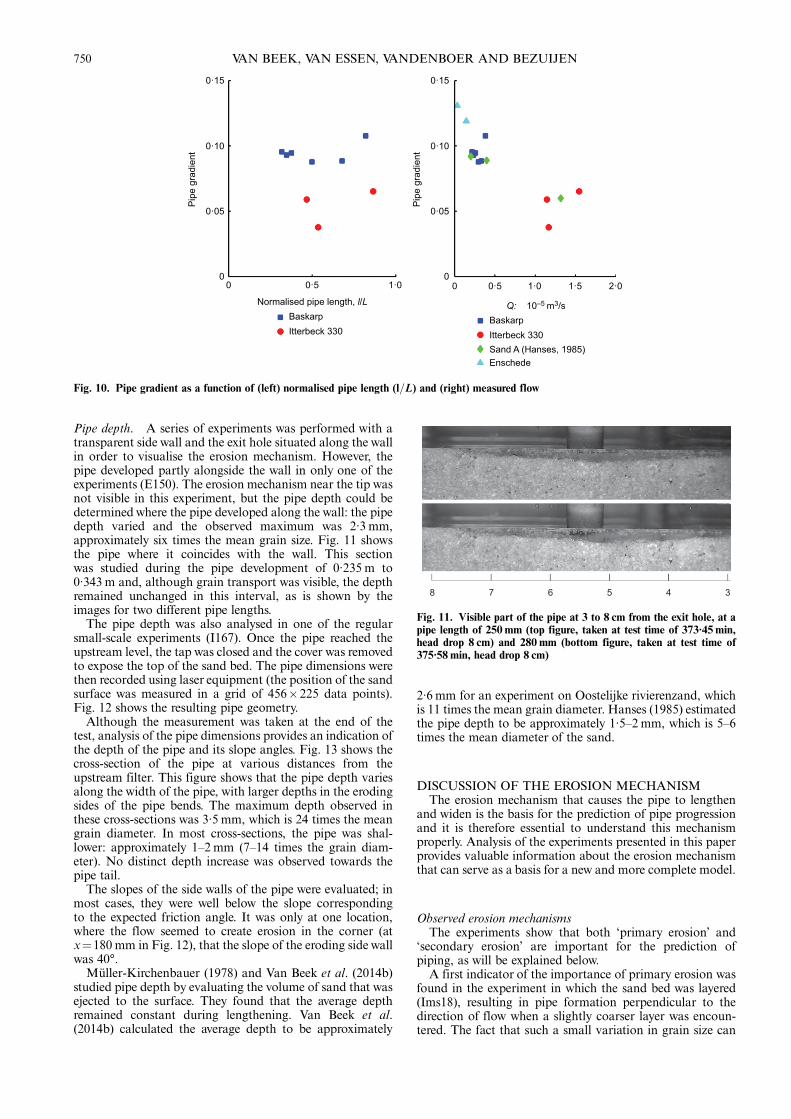
Pipe gradient. Both primary and secondary erosion areaffected by the impact of the pipe on the groundwater flowpattern. The Hagen–Poiseuille equation states that thehydraulic gradient in the pipe depends on the size of thepipe and on the flow through the pipe. The size of the pipe isdetermined by secondary erosion and the flow throughthe pipe is mainly determined by the scale of the set-up, thepermeability and hydraulic head difference in the sample. Theflow velocity and gradient near the tip of the pipe also depend
on the gradient in the pipe. The hydraulic head distribution inthe pipe has been measured in a few experiments.In selected experiments by Hanses (1985) the hydraulic
head in the pipe was measured for a pipe length that wasexpected to be close to the critical pipe length. At this length,the head was brought back to 0 and gradually reapplied sothat the head distribution in the pipe could be measured byriser tubes. The measurements indicated a linear decrease inthe hydraulic head in the pipe until close to the exit. The pipegradient was obtained by extrapolating the head distributionat lower head drops.In the present experiment E150 the pipe gradient was
determined in a similar way for two pipe lengths: 0·175 mand 0·235 m. It should be noted that these pipe lengths arepresumably larger than the critical pipe lengths and so thepipe was not in equilibrium. It is possible that the width ofthe pipe did not develop fully due to ongoing erosion at thetip of the pipe. As a result the gradient in the pipe may beslightly larger than a fully eroded pipe in equilibrium.In the medium-scale experiments – Bms19 and Ims20 –
equilibrium was observed several times and the pipesdeveloped in the path of the pore pressure transducers,allowing the hydraulic head in the pipes to be measured. Theaverage pipe gradients at equilibrium head (obtained by alinear least-squares regression of measured hydraulic headsin the pipe) are listed for each experiment in Table 5.The effect of the soil type on pipe gradient was established
by comparing the medium-scale experiments (Fig. 10, left).The pipe gradient in Baskarp sand is considerably higherthan the pipe gradient in Itterbeck sand, although the criticalheads are comparable. This corresponds well with theobservation that pipe width is larger in coarser sands.Enschede sand, Itterbeck 330 um and sand A are compar-
able, all being uniform medium-grained sands. Nevertheless,the pipe gradients varied significantly. Differences in pipegradient therefore originate from differences in hydraulichead, scale and configuration. Since the process of secondaryerosion is driven by flow through the pipe, erosion shouldincrease with the flow exiting through the hole in the case of apipe with dimensions equal to the tip width. More erosionresults in larger pipes and consequently lower pipe gradients.Fig. 10 (right) shows the measured pipe gradients as a func-tion of corresponding flow. Indeed, a decrease in the pipegradient with increasing flow was observed in all of thepresent authors’ experiments. It is remarkable that the rela-tively high pipe gradient for the medium-scale experimentswith Baskarp sand can be fully explained by the relatively lowflow resulting from the lower permeability of the sand. Therelationship between flow and pipe gradient is an indicator ofthe influence of secondary erosion on the pipe gradient.
Table 5. Average pipe gradients (p) and measured flow (Qexp) in equilibrium conditions in various experiments
Experiment Sand type d50: mm l: m H: m p Qexp: m3=s
26a Sand A 0·325 0·250 0·130 0·089 3·98�10�6
53 Sand A 0·325 0·165 0·214 0·092 2·01�10�6
73 Sand A 0·325 0·615 0·298 0·060 1·32�10�5
E150 Enschede 0·380 0·175 0·093 0·131 3·22�10�7
E150 Enschede 0·380 0·235 0·079 0·119 1·45�10�6
Bms19 Baskarp 0·132 0·440 0·149 0·096 2·16�10�6
Bms19 Baskarp 0·132 0·480 0·159 0·093 2·35�10�6
Bms19 Baskarp 0·132 0·520 0·170 0·095 2·58�10�6
Bms19 Baskarp 0·132 0·690 0·179 0·088 2·95�10�6
Bms19 Baskarp 0·132 0·940 0·187 0·089 3·31�10�6
Bms19 Baskarp 0·132 1·135 0·203 0·108 3·81�10�6
Ims20 Itterbeck 330 μm 0·283 0·647 0·175 0·059 1·14�10�5
Ims20 Itterbeck 330 μm 0·283 0·742 0·162 0·038 1·17�10�5
Ims20 Itterbeck 330 μm 0·283 1·197 0·170 0·065 1·54�10�5
DEVELOPMENTS IN MODELLING OF BACKWARD EROSION PIPING 749
Pipe depth. A series of experiments was performed with atransparent side wall and the exit hole situated along the wallin order to visualise the erosion mechanism. However, thepipe developed partly alongside the wall in only one of theexperiments (E150). The erosion mechanism near the tip wasnot visible in this experiment, but the pipe depth could bedetermined where the pipe developed along the wall: the pipedepth varied and the observed maximum was 2·3 mm,approximately six times the mean grain size. Fig. 11 showsthe pipe where it coincides with the wall. This sectionwas studied during the pipe development of 0·235 m to0·343 m and, although grain transport was visible, the depthremained unchanged in this interval, as is shown by theimages for two different pipe lengths.
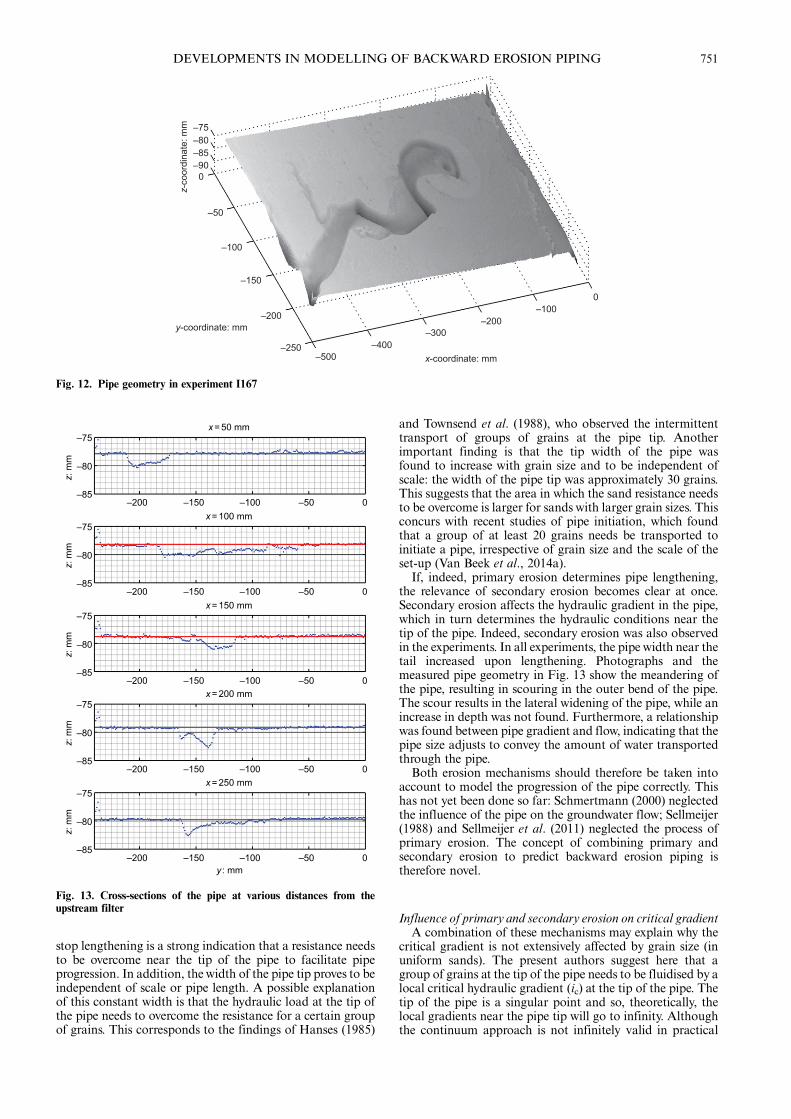
The pipe depth was also analysed in one of the regularsmall-scale experiments (I167). Once the pipe reached theupstream level, the tap was closed and the cover was removedto expose the top of the sand bed. The pipe dimensions werethen recorded using laser equipment (the position of the sandsurface was measured in a grid of 456�225 data points).Fig. 12 shows the resulting pipe geometry.
Although the measurement was taken at the end of thetest, analysis of the pipe dimensions provides an indication ofthe depth of the pipe and its slope angles. Fig. 13 shows thecross-section of the pipe at various distances from theupstream filter. This figure shows that the pipe depth variesalong the width of the pipe, with larger depths in the erodingsides of the pipe bends. The maximum depth observed inthese cross-sections was 3·5 mm, which is 24 times the meangrain diameter. In most cross-sections, the pipe was shal-lower: approximately 1–2mm (7–14 times the grain diam-eter). No distinct depth increase was observed towards thepipe tail.
The slopes of the side walls of the pipe were evaluated; inmost cases, they were well below the slope correspondingto the expected friction angle. It was only at one location,where the flow seemed to create erosion in the corner (atx¼180 mm in Fig. 12), that the slope of the eroding side wallwas 40°.
Müller-Kirchenbauer (1978) and Van Beek et al. (2014b)studied pipe depth by evaluating the volume of sand that wasejected to the surface. They found that the average depthremained constant during lengthening. Van Beek et al.(2014b) calculated the average depth to be approximately
2·6 mm for an experiment on Oostelijke rivierenzand, whichis 11 times the mean grain diameter. Hanses (1985) estimatedthe pipe depth to be approximately 1·5–2mm, which is 5–6times the mean diameter of the sand.
DISCUSSION OF THE EROSION MECHANISMThe erosion mechanism that causes the pipe to lengthen
and widen is the basis for the prediction of pipe progressionand it is therefore essential to understand this mechanismproperly. Analysis of the experiments presented in this paperprovides valuable information about the erosion mechanismthat can serve as a basis for a new and more complete model.
Observed erosion mechanismsThe experiments show that both ‘primary erosion’ and
‘secondary erosion’ are important for the prediction ofpiping, as will be explained below.A first indicator of the importance of primary erosion was
found in the experiment in which the sand bed was layered(Ims18), resulting in pipe formation perpendicular to thedirection of flow when a slightly coarser layer was encoun-tered. The fact that such a small variation in grain size can
0·15
0·10
0·05
Pip
e gr
adie
nt
Normalised pipe length, l/L Q: × 10–5 m3/s
0
0·15
0·10
0·05
Pip
e gr
adie
nt
00 0·5 0
BaskarpItterbeck 330
Baskarp
Sand A (Hanses, 1985)Enschede
Itterbeck 330
0·5 1·0 1·5 2·01·0
Fig. 10. Pipe gradient as a function of (left) normalised pipe length (l=L) and (right) measured flow
8 7 6 5 4 3
Fig. 11. Visible part of the pipe at 3 to 8 cm from the exit hole, at apipe length of 250 mm (top figure, taken at test time of 373·45 min,head drop 8 cm) and 280 mm (bottom figure, taken at test time of375·58 min, head drop 8 cm)
VAN BEEK, VAN ESSEN, VANDENBOER AND BEZUIJEN750
stop lengthening is a strong indication that a resistance needsto be overcome near the tip of the pipe to facilitate pipeprogression. In addition, the width of the pipe tip proves to beindependent of scale or pipe length. A possible explanationof this constant width is that the hydraulic load at the tip ofthe pipe needs to overcome the resistance for a certain groupof grains. This corresponds to the findings of Hanses (1985)
and Townsend et al. (1988), who observed the intermittenttransport of groups of grains at the pipe tip. Anotherimportant finding is that the tip width of the pipe wasfound to increase with grain size and to be independent ofscale: the width of the pipe tip was approximately 30 grains.This suggests that the area in which the sand resistance needsto be overcome is larger for sands with larger grain sizes. Thisconcurs with recent studies of pipe initiation, which foundthat a group of at least 20 grains needs be transported toinitiate a pipe, irrespective of grain size and the scale of theset-up (Van Beek et al., 2014a).If, indeed, primary erosion determines pipe lengthening,
the relevance of secondary erosion becomes clear at once.Secondary erosion affects the hydraulic gradient in the pipe,which in turn determines the hydraulic conditions near thetip of the pipe. Indeed, secondary erosion was also observedin the experiments. In all experiments, the pipe width near thetail increased upon lengthening. Photographs and themeasured pipe geometry in Fig. 13 show the meandering ofthe pipe, resulting in scouring in the outer bend of the pipe.The scour results in the lateral widening of the pipe, while anincrease in depth was not found. Furthermore, a relationshipwas found between pipe gradient and flow, indicating that thepipe size adjusts to convey the amount of water transportedthrough the pipe.Both erosion mechanisms should therefore be taken into
account to model the progression of the pipe correctly. Thishas not yet been done so far: Schmertmann (2000) neglectedthe influence of the pipe on the groundwater flow; Sellmeijer(1988) and Sellmeijer et al. (2011) neglected the process ofprimary erosion. The concept of combining primary andsecondary erosion to predict backward erosion piping istherefore novel.
Influence of primary and secondary erosion on critical gradientA combination of these mechanisms may explain why the
critical gradient is not extensively affected by grain size (inuniform sands). The present authors suggest here that agroup of grains at the tip of the pipe needs to be fluidised by alocal critical hydraulic gradient (ic) at the tip of the pipe. Thetip of the pipe is a singular point and so, theoretically, thelocal gradients near the pipe tip will go to infinity. Althoughthe continuum approach is not infinitely valid in practical
–75–80–85–90
z-co
ordi
nate
: mm
y-coordinate: mm
x-coordinate: mm
0
–50
–100
–150
–200
–250–500
–400–300
–200–100
0
Fig. 12. Pipe geometry in experiment I167
–75x = 50 mm
–80
z: m
m
–85–200 –150 –100 –50 0
–75x = 100 mm
–80
z: m
m
–85–200 –150 –100 –50 0
–75x = 150 mm
–80
z: m
m
–85–200 –150 –100 –50 0
–75x = 200 mm
–80
z: m
m
–85–200 –150 –100 –50 0
–75x = 250 mm
–80
z: m
m
y : mm
–85–200 –150 –100 –50 0
Fig. 13. Cross-sections of the pipe at various distances from theupstream filter
DEVELOPMENTS IN MODELLING OF BACKWARD EROSION PIPING 751
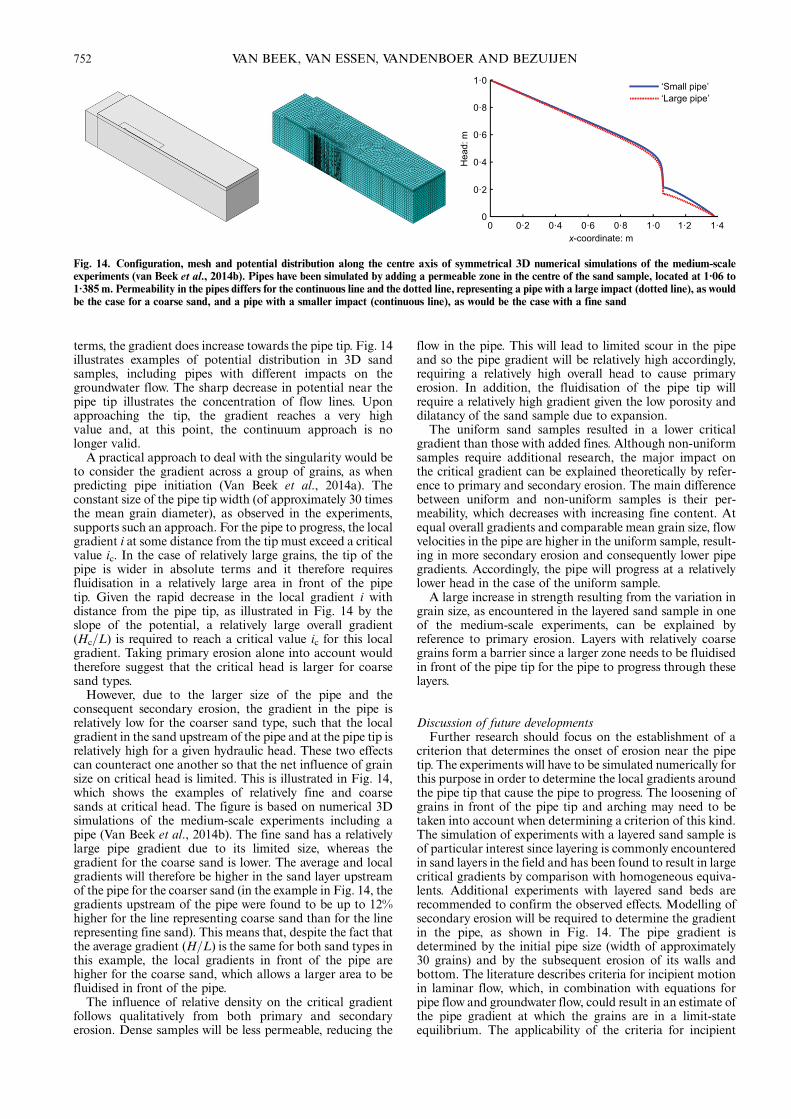
terms, the gradient does increase towards the pipe tip. Fig. 14illustrates examples of potential distribution in 3D sandsamples, including pipes with different impacts on thegroundwater flow. The sharp decrease in potential near thepipe tip illustrates the concentration of flow lines. Uponapproaching the tip, the gradient reaches a very highvalue and, at this point, the continuum approach is nolonger valid.
A practical approach to deal with the singularity would beto consider the gradient across a group of grains, as whenpredicting pipe initiation (Van Beek et al., 2014a). Theconstant size of the pipe tip width (of approximately 30 timesthe mean grain diameter), as observed in the experiments,supports such an approach. For the pipe to progress, the localgradient i at some distance from the tip must exceed a criticalvalue ic. In the case of relatively large grains, the tip of thepipe is wider in absolute terms and it therefore requiresfluidisation in a relatively large area in front of the pipetip. Given the rapid decrease in the local gradient i withdistance from the pipe tip, as illustrated in Fig. 14 by theslope of the potential, a relatively large overall gradient(Hc=L) is required to reach a critical value ic for this localgradient. Taking primary erosion alone into account wouldtherefore suggest that the critical head is larger for coarsesand types.
However, due to the larger size of the pipe and theconsequent secondary erosion, the gradient in the pipe isrelatively low for the coarser sand type, such that the localgradient in the sand upstream of the pipe and at the pipe tip isrelatively high for a given hydraulic head. These two effectscan counteract one another so that the net influence of grainsize on critical head is limited. This is illustrated in Fig. 14,which shows the examples of relatively fine and coarsesands at critical head. The figure is based on numerical 3Dsimulations of the medium-scale experiments including apipe (Van Beek et al., 2014b). The fine sand has a relativelylarge pipe gradient due to its limited size, whereas thegradient for the coarse sand is lower. The average and localgradients will therefore be higher in the sand layer upstreamof the pipe for the coarser sand (in the example in Fig. 14, thegradients upstream of the pipe were found to be up to 12%higher for the line representing coarse sand than for the linerepresenting fine sand). This means that, despite the fact thatthe average gradient (H=L) is the same for both sand types inthis example, the local gradients in front of the pipe arehigher for the coarse sand, which allows a larger area to befluidised in front of the pipe.
The influence of relative density on the critical gradientfollows qualitatively from both primary and secondaryerosion. Dense samples will be less permeable, reducing the
flow in the pipe. This will lead to limited scour in the pipeand so the pipe gradient will be relatively high accordingly,requiring a relatively high overall head to cause primaryerosion. In addition, the fluidisation of the pipe tip willrequire a relatively high gradient given the low porosity anddilatancy of the sand sample due to expansion.The uniform sand samples resulted in a lower critical
gradient than those with added fines. Although non-uniformsamples require additional research, the major impact onthe critical gradient can be explained theoretically by refer-ence to primary and secondary erosion. The main differencebetween uniform and non-uniform samples is their per-meability, which decreases with increasing fine content. Atequal overall gradients and comparable mean grain size, flowvelocities in the pipe are higher in the uniform sample, result-ing in more secondary erosion and consequently lower pipegradients. Accordingly, the pipe will progress at a relativelylower head in the case of the uniform sample.A large increase in strength resulting from the variation in
grain size, as encountered in the layered sand sample in oneof the medium-scale experiments, can be explained byreference to primary erosion. Layers with relatively coarsegrains form a barrier since a larger zone needs to be fluidisedin front of the pipe tip for the pipe to progress through theselayers.
Discussion of future developmentsFurther research should focus on the establishment of a
criterion that determines the onset of erosion near the pipetip. The experiments will have to be simulated numerically forthis purpose in order to determine the local gradients aroundthe pipe tip that cause the pipe to progress. The loosening ofgrains in front of the pipe tip and arching may need to betaken into account when determining a criterion of this kind.The simulation of experiments with a layered sand sample isof particular interest since layering is commonly encounteredin sand layers in the field and has been found to result in largecritical gradients by comparison with homogeneous equiva-lents. Additional experiments with layered sand beds arerecommended to confirm the observed effects. Modelling ofsecondary erosion will be required to determine the gradientin the pipe, as shown in Fig. 14. The pipe gradient isdetermined by the initial pipe size (width of approximately30 grains) and by the subsequent erosion of its walls andbottom. The literature describes criteria for incipient motionin laminar flow, which, in combination with equations forpipe flow and groundwater flow, could result in an estimate ofthe pipe gradient at which the grains are in a limit-stateequilibrium. The applicability of the criteria for incipient
1·0‘Small pipe’‘Large pipe’
0·8
0·6
0·4
0·2
01·0 1·2 1·40·80·6
x-coordinate: m
Hea
d: m
0·40·20
Fig. 14. Configuration, mesh and potential distribution along the centre axis of symmetrical 3D numerical simulations of the medium-scaleexperiments (van Beek et al., 2014b). Pipes have been simulated by adding a permeable zone in the centre of the sand sample, located at 1·06 to1·385 m. Permeability in the pipes differs for the continuous line and the dotted line, representing a pipe with a large impact (dotted line), as wouldbe the case for a coarse sand, and a pipe with a smaller impact (continuous line), as would be the case with a fine sand
VAN BEEK, VAN ESSEN, VANDENBOER AND BEZUIJEN752
motion to erosion pipes should be investigated. The criteriaimplemented currently for bed erosion may not fully explainthe erosion of the walls of the pipe that results in lateralwidening.The combination of these two mechanisms will lead to a
novel model that can take into account the influence of scaleand sand properties and heterogeneity in the path of the pipe.It has the potential to explain the influence of coarse-grained‘barriers’ on critical head, which is essential for the pre-diction of piping in practice. A model of this kind would alsomake possible the development of more practical rules forspecific configurations.
CONCLUSIONSSmall- and medium-scale experiments were performed and
analysed to study the progression of the pipe. A circular exitled to pipe initiation at a relatively low head by comparisonwith experiments with other exit configurations (Van Beeket al., 2014a) and equilibrium in pipe formation wasobserved, requiring an increase in head for pipe progressionso that this process could be studied.The critical heads obtained in the experiments, as well as
those obtained from literature, were compared with theresults of the Sellmeijer model (Sellmeijer et al., 2011), whichwas developed to predict the critical head for pipe pro-gression. Although the adapted Sellmeijer model predictscritical gradients well for 2D large-scale experiments withfine- to medium-grained sands, the present authors foundthat 3D configurations with flow towards a single point resultin significantly smaller critical gradients than those predictedby the model. Although, in practice, the exit type may nothave such a strong influence, due to the formation of multiplepipes and seepage through the cover layer and towardsthe hinterland, the worst-case scenario of the developmentof a single pipe in a configuration similar to that in thelaboratory should be taken into account. In both the small-and medium-scale experiments, the model overestimatesthe critical head in the experiments by a factor of approxi-mately 2.In order to find a possible explanation for the observed
variations, the pipe width, depth and gradient were analysedin detail. The findings illustrate the importance of bothprimary and secondary erosion. Primary erosion, which is theerosion at the tip causing the lengthening of the pipe,determines its progress, as illustrated by one of the exper-iments in which the pipe developed perpendicular to the flowdirection when a slightly coarser layer was encountered. Thefinding that the width of the pipe tip increases linearly withgrain size, and that it is approximately 30 times the meangrain diameter irrespective of scale or uniformity coefficient(within the studied range) supports the idea that a group ofgrains at the pipe tip needs to be fluidised for the pipe toprogress. Secondary erosion is of importance as well: itdetermines the pipe gradient, which was found to be differentfor different sand types. The observation that flow throughthe pipes caused the pipe to widen towards its tail, causinglateral widening, is the main evidence underlying thisconclusion. The relation between flow and pipe gradient(Fig. 10, right) further supports this idea.A novel model should be developed that takes primary and
secondary erosion into account. Further research shouldfocus on the 3D analysis of the pipe, taking a local criticalgradient upstream of the pipe tip into consideration as anadditional requirement for pipe progression. The process ofsecondary erosion should be studied in more detail because itwas found that the pipe widens, whereas deepening was notobserved.
ACKNOWLEDGEMENTSThe research is part of the programme ‘Research and
development of flood defense assessment tools WTI2017’funded by Rijkswaterstaat – Centre for Water Management –on behalf of the Dutch Ministry of Infrastructure and theEnvironment.
NOTATIOND sand sample thicknessd height, representing the thickness of the confining layerdx grain diameter at which x% of sample (by weight) is finerFG geometrical shape factorFR resistance factorFS scale factorH head drop across sand sample or embankmentHc critical head drop across sand sample or embankment, at
which ongoing erosion occursHi minimum head drop across sand sample or embankment at
which pipe initiatesHp minimum head drop across sand sample or embankment at
which pipe progresses, assuming the presence of a shortpipe
k permeability coefficientKAS parameter describing the roundness of particles
KASm mean value of KAS in selected experiments (49·8)L length of seepagel pipe lengthp pipe gradientQ flow
RD relative densityRDm mean value of RD in selected experiments (72·5%)
U uniformity coefficient (d60=d10)Um mean value of U in selected experiments (1·81)W sand sample widthγp′ buoyant unit weight of particlesγw unit weight of waterη White’s constantθ bedding angle of sandκ intrinsic permeabilityμ dynamic viscosityØ exit hole diameter
REFERENCESBligh, W. G. (1910). Dams barrages and weirs on porous foun-
dations. Engng News 64, No. 26, 708–710.Hanses, U. (1985). Zur Mechanik der Entwicklung von
Erosionskanälen in geschichtetem Untergrund unterStauanlagen. Dissertation, Grundbauinstitut der TechnischenUniversität Berlin, Berlin, Germany (in German).
Lane, E. W. (1935). Security from under-seepage masonry dams onearth foundations. Trans. Am. Soc. Civ. Engrs 100, No. 1,929–966.
Mansur, C. I., Postol, G. & Salley, J. R. (2000). Performance of reliefwell systems along Mississippi river levees. J. Geotech.Geoenviron. Engng 126, No. 8, 727–738.
Miesel, D. (1978). Rückschreitende Erosion unter bindigerDeckschicht. In Baugrundtagung, pp. 599–626. Essen,Germany: Deutschen Gesellschaft für Erd- und Grundbau e.V.(in German).
Moffat, R., Fannin, J. & Garner, S. J. (2011). Spatial and temporalprogression of internal erosion in cohesionless soil. Can.Geotech. J. 48, No. 3, 399–412.
Müller-Kirchenbauer, H. (1978). Zum zeitlichen Verlauf derrückschreitenden Erosion in geschichtetem Untergrund unterDämmen und Stauanlagen. Verfahren der Talsperrensymposium,Munich, Germany (in German).
Pietrus, T. J. (1981). An experimental investigation of hydraulic pipingin sand. Masters thesis, Department of Civil Engineering,University of Florida, Gainesville, FL, USA.
Richards, K. S. & Reddy, K. R. (2012). Experimental investigationof initiation of backward erosion piping in soils. Géotechnique62, No. 10, 933–942, http:==dx.doi.org=10.1680=geot.11.P.058.
DEVELOPMENTS IN MODELLING OF BACKWARD EROSION PIPING 753
Schmertmann, J. H. (2000). The non-filter factor of safety againstpiping through sands. In Judgment and innovation (eds F. Silvaand E. Kavazanjian), geotechnical special publication no. 111,pp. 65–132. Reston, VA, USA: American Society of CivilEngineers.
Sellmeijer, J. B. (1988). On the mechanism of piping under imperviousstructures. Doctoral dissertation, Technische Universiteit Delft,Delft, the Netherlands.
Sellmeijer, J. B. (2006). Numerical computation of seepage erosionbelow dams (piping). In Proceedings of the 3rd internationalconference on scour and erosion, pp. 596–601. Gouda, theNetherlands: CURNET.
Sellmeijer, J. B., Lopéz de la Cruz, J., Van Beek, V. M. & Knoeff, J.G. (2011). Fine-tuning of the piping model through small-scale,medium-scale and IJkdijk experiments. Eur. J. Environ. Civ.Engng 15, No. 8, 1139–1154.
Silvis, F. (1991) Verificatie piping model: Proeven in de Deltagoot.Delft, the Netherlands: Grondmechanica Delft.
Townsend, F. C. D., Bloomquist, D., Shiau, J. M., Martinez, R. &Rubin, H. (1988). Evaluation of filter criteria and thickness formitigating piping in sand. Gainesville, FL, USA: Department ofCivil Engineering, University of Florida.
USACE (US Army Corps of Engineers) (1956). Investigation ofunderseepage and its control – Lower Mississippi river levees,technical memorandum no. 3-424, vol 1. Vicksburg, MS, USA:Waterways Experiment Station, USACE.
Van Beek, V. M., Knoeff, J. G. & Sellmeijer, J. B. (2011).Observations on the process of backward piping by under-seepage in cohesionless soils in small-, medium- andfull-scale experiments. Eur. J. Environ. Civ. Engng 15, No. 8,1115–1137.
Van Beek, V. M., Bezuijen, A. & Sellmeijer, H. (2013). Backwarderosion piping. In Erosion in geomechanics applied to dams andlevees (ed. S. Bonelli), pp. 193–269. London, UK: ISTE;Hoboken, NJ, USA: Wiley.
Van Beek, V. M., Bezuijen, A., Sellmeijer, J. B. & Barends, F. B. J.(2014a). Initiation of backward erosion piping in uniform sands.Géotechnique 64, No. 12, 927–941, http:==dx.doi.org=10.1680=geot.13.P.210.
Van Beek, V. M., Vandenboer, K. & Bezuijen, A. (2014b).Investigation of the backward erosion mechanism in smallscale experiments. In Physical modelling in geotechnics (edsC. Gaudin and D. White), pp. 855–861. London, UK: Taylor &Francis Group.
Vandenboer, K., Van Beek, V. M. & Bezuijen, A. (2013) 3D FEMsimulation of groundwater flow during backward erosion piping.In Proceedings of the 5th young geotechnical engineers’ con-ference (eds Y.-J. Cui, F. Emeriault, F. Cuira, S. Ghabezloo,J.-M. Pereira, M. Reboul, H. Ravel and A. M. Tang),pp. 301–306. Amsterdam, the Netherlands: IOS Press.
Vrijling, J. K., Kok,M., Calle, E. O. F., Epema, W. G., van derMeer,M. T., van den Berg, P. & Schweckendiek, T. (2010). Piping –realiteit of rekenfout?, Technical report. Utrecht, the Netherlands:DutchExpertiseNetworkonFloodProtection (ENW) (inDutch).
Weijers, J. B. A. & Sellmeijer, J. B. (1993) A new model to deal withthe piping mechanism. In Filters in geotechnical and hydraulicengineering (eds J. Brauns, U. Schuler and M. Heibaum),pp. 349–355. Rotterdam, the Netherlands: Balkema.
Yao, Q., Xie, J., Sun, D. J. & Zhao, J. (2009) Data collection of dikebreach cases of China, Sino-Dutch cooperation project report.Beijing, China: Institute of Water Resources and HydropowerResearch.
VAN BEEK, VAN ESSEN, VANDENBOER AND BEZUIJEN754


![Effects of Soil and Rock Mineralogy on Soil Erosion Features in … · 2013. 12. 24. · piping, landslide and gully erosion [4-6]. Vermiculite is one of the common soil minerals](https://img.pdfslide.net/doc/110x75/5fd4592f2eb2797bbc1a2b72/effects-of-soil-and-rock-mineralogy-on-soil-erosion-features-in-2013-12-24.jpg)