Embed Size (px)
Citation preview
Dexcom CLARITY User Guide Page 1 of 24
Dexcom CLARITY
User Guide
To receive a printed version of this manual, contact your local Dexcom representative.
Dexcom CLARITY User Guide Page 2 of 24
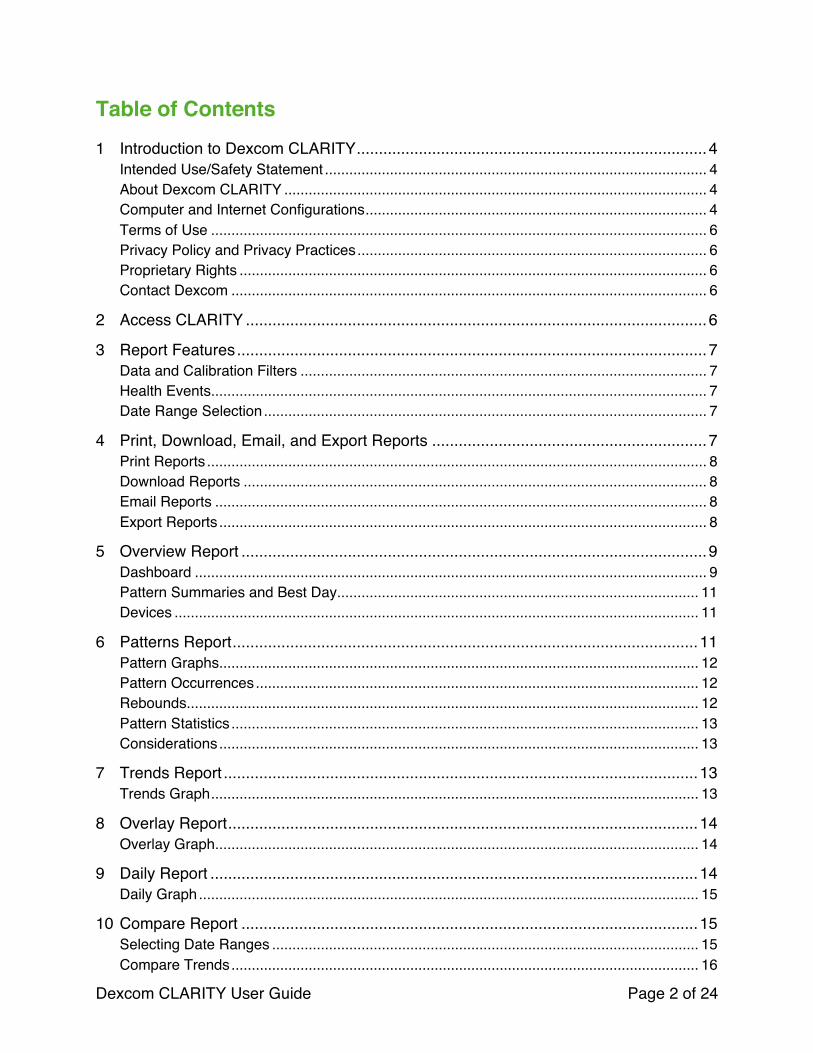
Table of Contents
1 Introduction to Dexcom CLARITY ............................................................................... 4Intended Use/Safety Statement .............................................................................................. 4About Dexcom CLARITY ........................................................................................................ 4Computer and Internet Configurations .................................................................................... 4Terms of Use .......................................................................................................................... 6Privacy Policy and Privacy Practices ...................................................................................... 6Proprietary Rights ................................................................................................................... 6Contact Dexcom ..................................................................................................................... 6
2 Access CLARITY ........................................................................................................ 6
3 Report Features .......................................................................................................... 7Data and Calibration Filters .................................................................................................... 7Health Events .......................................................................................................................... 7Date Range Selection ............................................................................................................. 7
4 Print, Download, Email, and Export Reports .............................................................. 7Print Reports ........................................................................................................................... 8Download Reports .................................................................................................................. 8Email Reports ......................................................................................................................... 8Export Reports ........................................................................................................................ 8
5 Overview Report ......................................................................................................... 9Dashboard .............................................................................................................................. 9Pattern Summaries and Best Day ......................................................................................... 11Devices ................................................................................................................................. 11
6 Patterns Report ......................................................................................................... 11Pattern Graphs ...................................................................................................................... 12Pattern Occurrences ............................................................................................................. 12Rebounds .............................................................................................................................. 12Pattern Statistics ................................................................................................................... 13Considerations ...................................................................................................................... 13
7 Trends Report ........................................................................................................... 13Trends Graph ........................................................................................................................ 13
8 Overlay Report .......................................................................................................... 14Overlay Graph ....................................................................................................................... 14
9 Daily Report .............................................................................................................. 14Daily Graph ........................................................................................................................... 15
10Compare Report ....................................................................................................... 15Selecting Date Ranges ......................................................................................................... 15Compare Trends ................................................................................................................... 16
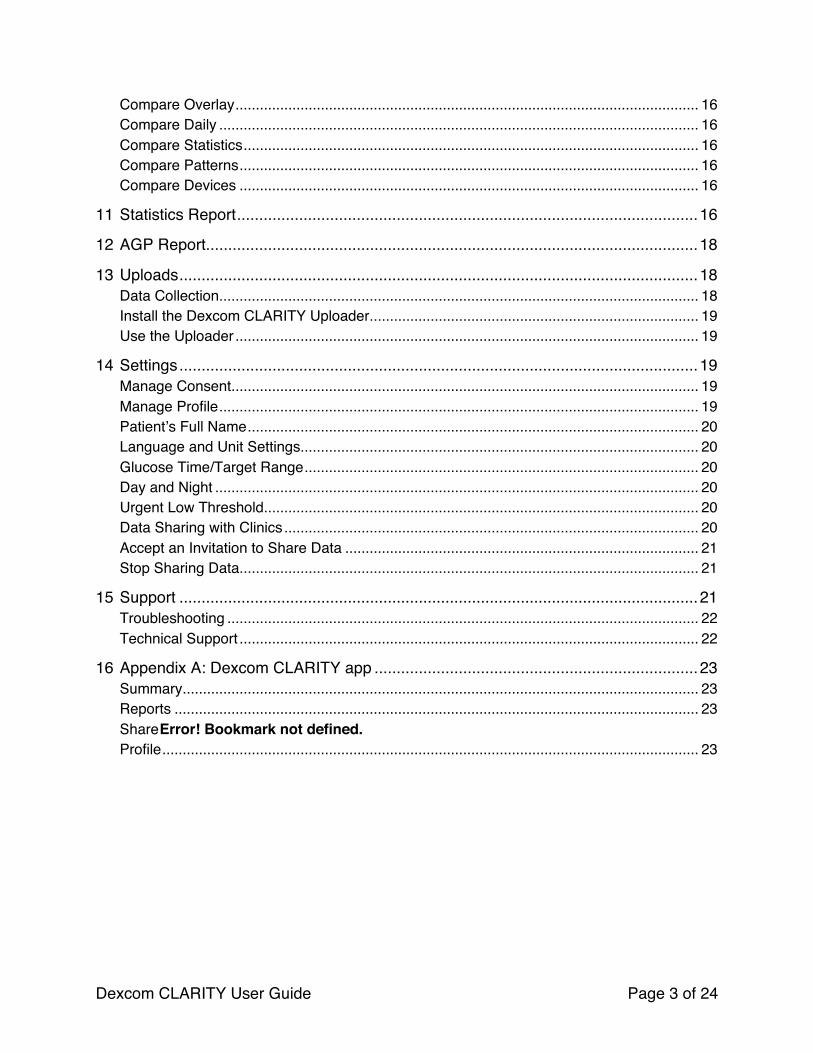
Dexcom CLARITY User Guide Page 3 of 24
Compare Overlay .................................................................................................................. 16Compare Daily ...................................................................................................................... 16Compare Statistics ................................................................................................................ 16Compare Patterns ................................................................................................................. 16Compare Devices ................................................................................................................. 16
11Statistics Report ........................................................................................................ 16
12AGP Report............................................................................................................... 18
13Uploads ..................................................................................................................... 18Data Collection ...................................................................................................................... 18Install the Dexcom CLARITY Uploader ................................................................................. 19Use the Uploader .................................................................................................................. 19
14Settings ..................................................................................................................... 19Manage Consent ................................................................................................................... 19Manage Profile ...................................................................................................................... 19Patient’s Full Name ............................................................................................................... 20Language and Unit Settings .................................................................................................. 20Glucose Time/Target Range ................................................................................................. 20Day and Night ....................................................................................................................... 20Urgent Low Threshold ........................................................................................................... 20Data Sharing with Clinics ...................................................................................................... 20Accept an Invitation to Share Data ....................................................................................... 21Stop Sharing Data ................................................................................................................. 21
15Support ..................................................................................................................... 21Troubleshooting .................................................................................................................... 22Technical Support ................................................................................................................. 22
16Appendix A: Dexcom CLARITY app ......................................................................... 23Summary ............................................................................................................................... 23Reports ................................................................................................................................. 23Share Error! Bookmark not defined.Profile .................................................................................................................................... 23

Dexcom CLARITY User Guide Page 4 of 24
1 Introduction to Dexcom CLARITY
Intended Use/Safety Statement The web-based Dexcom CLARITY software is intended for use by both home users and healthcare professionals to assist people with diabetes and their healthcare professionals in the review, analysis, and evaluation of historical CGM data to support effective diabetes management. It is intended for use as an accessory to Dexcom CGM devices with data interface capabilities. Caution: The software does not provide any medical advice and should not be used for that purpose. Home users must consult a healthcare professional before making any medical interpretation and therapy adjustments from the information in the software. Caution: Healthcare professionals should use information in the software in conjunction with other clinical information available to them.
About Dexcom CLARITY Dexcom CLARITY is a software program that allows the transfer of glucose data from your Dexcom CGM system to Dexcom remote servers for data management to assist in your use of the Dexcom CGM and to assist in healthcare services. Dexcom CLARITY can transfer and manage data from the Dexcom G4 PLATINUM, Dexcom G5 Mobile CGM System, and Dexcom G6 (all of which are referred to as Dexcom CGM systems).
After the glucose data is uploaded to CLARITY, the information is processed by CLARITY and displayed on your computer in graphs to help you and your healthcare professional analyze trends and patterns in glucose. You can review, save, email and print the software reports in your home environment.
CLARITY displays glucose data from a Dexcom CGM system 3 hours after the data is captured. This means that the most recent data you view in CLARITY is at least 3 hours old. Computer and Internet Configurations An internet connection of 1.5 Mbps or more is required to install the software from the web, upload data or view the online User Guide.
It is recommended that you use an appropriate firewall program and an anti-virus program on your computer to protect against viruses, malware and unauthorized access to and use of your computer and the information stored, processed and transmitted by it.

Dexcom CLARITY User Guide Page 5 of 24
Dexcom CLARITY requires the use of cookies for a variety of purposes including the collection of site usage data, content management, providing customized content, and traffic measurement and analysis. Please review our Privacy Policy and Cookie Policy for more information on the use of cookies at: http://www.dexcom.com
CLARITY supports the following system configurations:
• Windows 7, 8, or 10 o 1.3 GHz processor, 1 GB free RAM and 100 MB free disk space o Microsoft .NET Framework 4.6.1 or greater, full version o Display resolution of 1024 x 768 pixels or greater o Chrome, Firefox, or Internet Explorer 11 run in desktop mode or Microsoft
Edge o USB 2.0 port or better to connect the USB cable to upload data from the
optional Dexcom receiver
• Mac OSX 10.12, 10.13, 10.14, or 10.15
o 2.3 gigahertz (GHz) processor and 4 gigabytes (GB) free RAM with 100 megabytes (MB) free disk space
o Display resolution of 1280 x 800 pixels or greater o Safari 9.1, Chrome, or Firefox for Mac OSX o USB 2.0 port or better to connect the USB cable to upload data from the
optional Dexcom receiver
Optional computer configurations:
• A PDF reader for viewing, saving, and printing reports • A printer for printing reports • An Excel spreadsheet viewer for exported data
To run CLARITY, your network must allow the following outbound network traffic, which might require changes to proxy and network configuration:
• dexcom.eu (and all subdomains) on port 443 • dexcom.com (and all subdomains) on port 443 • agent.mydiabetesdata.com with DNS loopback support to 127.0.0.1
To run the CLARITY Uploader, your network must allow the following outbound network traffic:
• *.dexcom.eu (and all subdomains) on port 443 • *.dexcom.com (and all subdomains) on port 443

Dexcom CLARITY User Guide Page 6 of 24
Terms of Use Use by you of CLARITY and Dexcom services is subject to the Terms of Use at: http://www.dexcom.com/terms_of_use
By using this guide, you agree to comply with the applicable terms and conditions in connection with your use of CLARITY, services and this User Guide.
Privacy Policy and Privacy Practices To read Dexcom’s Privacy Policy, go to: http://www.dexcom.com Scroll to the bottom of the page, then click Privacy Policy.
Proprietary Rights Dexcom CLARITY and this User Guide are ©2016-2020 by Dexcom, Inc. and its licensors. All Rights Reserved. CLARITY downloaded onto your computer or other devices might include certain third-party software licensed by Dexcom and the notices for which are set forth at: http://www.dexcom.com/notices
Third party products mentioned in this guide are subject to the rights of their manufacturers and distributors in the products and their trademarks.
Contact Dexcom For help with a Dexcom CGM system, questions about CLARITY, or to receive a printed version of this manual, contact your local Dexcom representative.
2 Access CLARITY To access CLARITY on the web:
1. Go to https://clarity.dexcom.eu 2. Choose the Home Users option. 3. Enter the username and password for your Dexcom Mobile or any other Dexcom
account. Do not create a duplicate Dexcom account or your data will not be found. If you are unsure if you have an account, try to recover the login. You already have a Dexcom account if you:
• Use the Dexcom CGM app • Upload your Dexcom receiver to CLARITY at home • Order supplies directly from Dexcom
Your CLARITY account is specific to your geographical area. Accounts created outside the United States will not be accessible within, or with a United States created account. United States created accounts will not be accessible outside the United States.
Dexcom CLARITY User Guide Page 7 of 24
3 Report Features In CLARITY, you view glucose data reports with interactive graphs and relevant statistics.
Use the Settings page to customize data display and sharing, see section 14.
Data and Calibration Filters You can view or hide both CGM data and Calibration events from the graphs. By default, both events are on as indicated by a green slider. Off is indicated by a white slider.
To turn these events off so they do not appear on the graphs:
• Click the CGM slider to white. • Click the Calibrations slider to white.
Health Events Health events you enter into your Dexcom CGM system, appear on the graphs. Events show up on all graphs that include the date of the event. Each event is marked with an icon displayed below the x-axis and viewed by hovering your cursor over the icon.
If you enter multiple events within the same one-hour window, the icons display stacked on top of each other. Hover over one of the icons to view all the hourly information.
Date Range Selection CLARITY presents data in a default date range of the most recent 14 days of data.
To change the date range, from any report:
1. Click in the date range box. 2. Choose a most recent number of days or click the date boxes to choose dates for
a custom view, then click OK.
4 Print, Download, Email, and Export Reports You can print, download, email and export reports with the links located at the top of CLARITY.
All reports are generated in the default language and units of measurement for your account. Your healthcare professional might request a report in different language or unit of measurement. To send a report with different settings, go to Settings, see section 14.
Dexcom CLARITY User Guide Page 8 of 24
Print Reports Printed reports include a section at the bottom for writing notes.
To print a report, from any report page:
1. Click the print icon at the top of the page. 2. Select a date range. 3. Choose a most recent number of days or click the date boxes to choose dates for
a custom view, then click OK. 4. Select at least one report to print. 5. Click Print Report.
Download Reports To download a report as a PDF, from any report page:
1. Click the download icon at the top of the page. 2. Select a date range. 3. Choose a most recent number of days or click the date boxes to choose dates for
a custom view, then click OK. 4. Select at least one report to download. 5. Click Save Report.
Email Reports You can only email the report to one email at a time. To email to multiple addresses, repeat the process after the first email has sent.
To send an email, from any report page:
1. Click the email icon at the top of the page. 2. Select a date range. 3. Choose a most recent number of days or click the date boxes to choose dates for
a custom view, then click OK. 4. Select at least one report to email. 5. Click Continue. 6. Enter the email address and an optional message. 7. Click the Send a copy to myself box if you would like a copy. 8. Click Continue. 9. Click I Agree to the Terms after you have read them.
Export Reports You can export raw glucose data values, calibration values and events to an Excel spreadsheet, saved to your computer. This generates a .csv file.
Dexcom CLARITY User Guide Page 9 of 24
To export a report, from any report page:
1. Click the export icon at the top of the page. 2. Select a date range. 3. Choose a most recent number of days or click the date boxes to choose dates for
a custom view, then click OK. 4. Click Export, then Close.
5 Overview Report The Overview report shows a glucose summary dashboard of statistics, pattern summaries and your best glucose day for the date range selected. It also provides information about the Dexcom CGM system used to upload the data shown.
Dashboard The Overview report includes a summarized dashboard of key measurements from the selected date rage including:
• Estimated A1C: Estimated A1C (eA1C) is not a lab test and is related to the average glucose as calculated from your CGM data and is reported as a percentage. A1C is a lab test that reflects the average glucose over approximately the last 3 months and is reported as a percentage.
CLARITY determines an eA1C as the average glucose from a minimum number of days with a minimum duration of CGM wear time.
o For reports with fewer than 20 days in the selected date range, eA1C is calculated from a minimum of 12 days that maintain CGM wear time of 66% or more.
o For reports spanning more than 20 days in the selected date range, eA1C is calculated from at least 60% of all the days in the selected date range that maintain CGM wear time of 66% or more.
If the above conditions are not met for the selected date range, CLARITY will display eA1C as N/A. The eA1C is a simple calculation determined from the average CGM glucose. It is not a lab test and eA1C may be different than the A1C test result. This is normal and expected for a variety of reasons:
o eA1C is based on data from the selected date range. CLARITY’s default and commonly viewed date range is set for 14 days. Blood-drawn lab A1C is the glucose average of the last 3 months with more weight on the most recent 2-3 weeks. If control has improved or declined over the last 14 days, eA1C will be either lower or higher than what lab A1C results will be.
Dexcom CLARITY User Guide Page 10 of 24
o Lab A1C can be affected by race, age or by conditions that affect red blood cells (for example, hemolysis, blood loss, chronic liver disease, erythropoietin use and valvular heart disease, etc.). This means that at the same lab A1C value, the average glucose may vary between people. eA1C provides an estimate based only on CGM data and is not affected by age, race, or conditions that affect blood cells.
o Lab A1C can be affected by blood storage, the analysis method used, and the equipment on which the test is conducted. A1C lab results can vary if the blood samples are sent to different labs or to the same lab but tested at different times.
• Average glucose (CGM): The average of all the glucose readings in the selected date range.
• Standard deviation (CGM): Standard Deviation (SD) reflects the amount of variability in CGM readings. The larger the SD, the larger the variability in CGM readings
• Hypoglycemia risk: This calculation estimates risk for severe hypoglycemia. It is based on a combination of the number of times glucose was low, the magnitude of the low glucose and for how long there was low glucose.
Experiencing frequent lower measured glucose values for short durations has more impact than minimal hypoglycemia for longer periods but with less frequency. Having more frequent lows for longer durations and at lower glucose levels carries a high risk for severe hypoglycemia. The hypoglycemia risk complements the patient's A1C measurements. Patients can have low or high A1C and still be at low, medium or high hypoglycemia risk. The impact of hypoglycemic risk on patients and diabetes management should be reviewed by a healthcare professional.
The hypoglycemia risk estimation is calculated from a minimum number of days with a minimum duration of CGM wear time as follows:
o For reports with fewer than 20 days in the selected date range, hypoglycemia risk is calculated from a minimum of 12 days that maintain CGM wear time of 66% or more.
o For reports spanning more than 20 days in the selected date range, hypoglycemia risk is calculated from at least 60% of all the days in the selected date range that maintain CGM wear time of 66% or more.
o Clinical References § Kovatchev, B, et al. Algorithmic Evaluation of Metabolic Control and
Risk of Severe Hypoglycemia in Type 1 and Type 2 Diabetes Using
Dexcom CLARITY User Guide Page 11 of 24
Self-Monitoring Blood Glucose Data. Diabetes Technology and Therapeutics, 5(5): 817-828, 2003.
§ Clarke W, Kovatchev B. Statistical Tools to Analyze Continuous Glucose Monitor Data. Diabetes Technology & Therapeutics. 2009; 11(Suppl 1): S-45-S-54. doi:10.1089/dia.2008.0138.
• Time in range: The percentage of time that glucose levels are in low, target and high ranges. CLARITY displays time in range from both daytime and nighttime ranges. Each Dexcom CGM reading is compared against the custom glucose target range and assigned a category of High, In Range, Low, or Urgent Low. Readings are tallied, then percentages for each category are calculated.
• Sensor Usage: Provides a high-level view of Dexcom CGM device usage. o Days with CGM data shows the number of days during the reporting
period with at least 50% CGM readings. o Avg. calibrations per day displays the average number of calibrations
per day, entered by the patient, during the reporting period. Only days with at least 50% CGM readings are included. The Dexcom G6 system is approved for use without calibrations or optionally with calibrations, making it possible to have zero average daily calibrations.
Pattern Summaries and Best Day The Overview report shows up to four patterns identified in the data. To view a summarized pattern on the Patterns report, click the box of the pattern for detailed graphs and statistics.
Limits for low and high glucose levels are changed on the Settings page, see section 14. Changes made in CLARITY apply throughout CLARITY, but don’t affect any settings on the CGM device.
Your best glucose day is the day you were most within your target range for the selected date range. Click the best glucose day box for a detailed view.
Devices Details about the Dexcom CGM system in use, include the Serial Number, last upload, and current alert settings.
6 Patterns Report The Patterns report provides graphical patterns, statistics and considerations for highs, lows and your best day within the selected date range. These are the same patterns summarized on the Overview report. There will always be a Best Day tab to review. Click each tab to see details.
Dexcom CLARITY User Guide Page 12 of 24
Pattern Graphs Each pattern is represented by a series of graphs, dated by each time the pattern was found in the selected date range, or a pattern occurrence.
Each graph includes:
• A 24-hour timeline on the bottom x-axis. • Scale for glucose readings on the left y-axis. • Target range limits on the right y-axis. • CGM lines that connect the individual CGM glucose readings. • Values associated with each CGM reading viewed by moving your mouse along
the CGM lines. • Target glucose ranges shown by the colored lines that run parallel to the x-axis,
as determined in Settings, see section 14. The yellow line is the upper limit and the red line is the lower limit.
• Significant daily data that is used to indicate the pattern, highlighted in the white background columns.
• Health events as recorded on the Dexcom CGM system shown with an icon below the x-axis and viewed by hovering your cursor over each icon.
• Calibration events entered into the Dexcom CGM system shown by the gray circle C icon, when the calibration toggle is active.
Pattern Occurrences A pattern occurrence is a period of glucose data that matches a larger pattern of similar periods of glucose data. For example, if your data shows a pattern of nighttime lows, one of those nighttime lows would be an occurrence. Days may have multiple occurrences of a pattern.
Pattern occurrence are the white columns. Gray areas of the graph are not part of the pattern. Glucose values and events are viewed by moving your mouse over any part of the graph and hovering.
The Best Day pattern graph does not include gray shading.
A letter marks each pattern occurrence. This letter is displayed at the top of the graph, above the white column, and displayed at the left of the graph with the times of the occurrence.
Column and left side pattern occurrences will be highlighted when you hover your cursor over occurrences.
Rebounds
Dexcom CLARITY User Guide Page 13 of 24
A rebound is when a pattern instance is followed immediately by the opposite – a high after a low, or a low after a high. The number of rebounds in the glucose data set is noted in the summary before the graphs.
Pattern Statistics Statistics for the selected date range of patterns include average glucose measurement, standard deviation and the time in range.
Considerations Based on the patterns of the selected date range, some possible considerations are provided at the bottom of the Patterns report. Consult a healthcare professional before making any medical interpretations and therapy adjustments from this information.
7 Trends Report The Trends report allows you to see glucose trends at different times of day over the selected date range. For example, you might see that your glucose levels are stable during mornings but are less stable during afternoons.
To filter the Trends data, click Days, Time of Day, Events, and Usage, then click Apply. You must click Apply every time you change a filter to update the graph.
Click the CGM and Calibrations sliders to toggle them on or off.
Trends Graph The Trends graph includes:
• A 24-hour timeline along the bottom x-axis. • Scale for glucose readings on the right y-axis. • CGM lines that trace CGM glucose data readings. • Values associated with each CGM readings viewed by moving your mouse along
the CGM lines. • Target glucose ranges shown by the colored lines that run parallel to the x-axis
and values as set in Settings, see section 14, on the left y-axis. The yellow line is the upper limit and the red line is the lower limit.
• Calibration events entered into the Dexcom CGM system shown by the gray circle C icon, when the calibration toggle is active.
The yellow and red shaded bars show patterns of clinically significant hyper- or hypoglycemia, respectively. Three factors determine clinical significance:
• Time spent in hyper- or hypoglycemia • Scale of hyper- or hypoglycemia
Dexcom CLARITY User Guide Page 14 of 24
• Frequency of hyper- or hypoglycemia
The darkest shaded bars are the most significant areas of hyper- and hypoglycemia. Lighter shaded bars show other patterns of hyper- and hypoglycemia, including data not clinically significant.
8 Overlay Report The Overlay report displays one week of data in each graph with colored lines to represent a single day’s data over time. For example, if you chose a date range of 10 days and do not apply any filters, you would see two graphs, one with seven lines and one with three.
To filter the Overlay data, click Days, Time of Day, Events, and Usage, then click Apply. You must click Apply every time you change a filter to update the graph.
Click the CGM and Calibrations sliders to toggle them on or off.
Overlay Graph The Overlay graph has several components:
• A 24-hour timeline along the bottom x-axis. • Scale for glucose readings on the left y-axis. • CGM lines: Each line on the Overlay graph represents a different day’s data. A
key above the graph shows which line corresponds with which day. Use these CGM lines to spot trends and compare data from different days in the selected date range.
• Hover: Put the cursor anywhere on a CGM line and rest it there for a moment to get detailed glucose information from that point in time.
• Target glucose ranges shown by the colored lines that run parallel to the x-axis and values as set in Settings, see section 14, on the right y-axis. The yellow line is the upper limit and the red line is the lower limit.
• Calibration events entered into the Dexcom CGM system shown by the gray circle C icon, when the calibration toggle is active.
9 Daily Report Daily displays glucose data in graphs by the day over the selected time range. Daily graphs are displayed with the most recent day first. Use the numbers along the bottom of the last graph to load previous days.
Dexcom CLARITY User Guide Page 15 of 24
To filter the Daily data, click Days, Time of Day, Events, and Usage, then click Apply. You must click Apply every time you change a filter to update the graph.
Click the CGM and Calibrations sliders to toggle them on or off.
Daily Graph The Daily graphs include:
• A 24-hour timeline along the bottom x-axis. • Scale for glucose readings on the left y-axis. • CGM lines that trace CGM glucose data readings. • Values associated with each CGM readings viewed by moving your mouse along
the CGM lines. • Target glucose ranges shown by the colored lines that run parallel to the x-axis,
as determined in Settings, see section 14. The yellow line is the upper limit and the red line is the lower limit.
• Health events as recorded on your Dexcom CGM system, shown with an icon below the x-axis and viewed by hovering your cursor over each icon.
• Calibration events for each blood glucose meter result recorded by your Dexcom CGM system, shown using the gray circle C icon when the calibration toggle is active.
If the black trace line in the graph has interruptions or stops, then your Dexcom CGM system did not record glucose data during that time.
10 Compare Report The Compare report is divided into two columns containing graphs, statistics, patterns and devices to compare within selected date ranges.
Selecting Date Ranges Each column has its own date range selector. You can compare up to 90 days of data. Use the numbers located below the last graph to view more graphs in your selected date range.
The date bars display the current date ranges for comparison. To change the ranges for each column, choose a most recent number of days or click the date boxes to choose dates for a custom view, then click OK.
Compare graphs through the Trends, Overlay, or Daily views and apply filters. To change the data views and filters:
1. Click Trends, Overlay, or Daily to select the view.
Dexcom CLARITY User Guide Page 16 of 24
2. Click Days, Time of Day, Events, and Usage, then click Apply. You must click Apply every time you change a filter to update the graph.
3. Click the CGM and Calibrations sliders to toggle them on or off.
Compare Trends In the Trends view, see side-by-side glucose trends throughout the day over the selected date ranges. These graphs include the same features as the Trends graph, see section 6.
Compare Overlay In the Overlay view, compare day by day, a week of data over the selected date ranges. These graphs include the same features as the Overlay graph, see section 7.
Compare Daily In the Daily view, see side-by-side Daily 24-hour graphs for the selected date range. These graphs include the same features as the Daily graph, see section 8.
Compare Statistics All Compare views include statistics, which are shown below the graphs. These statistics are similar to those shown on the Overview report, see section 4.
Statistics in the right column are marked with arrows to indicate changes from the left column values. An arrow pointed up means the statistic on the right is higher than the same statistic on the left. An arrow pointed down means it is lower.
Compare Patterns Click the name of the pattern to view the time range, number of events and rebounds of the pattern.
Patterns that were resolved from the left column are marked on the right column with strikethrough green text and a checkmark icon.
New patterns in the right column are highlighted with a NEW icon. Best Days are always included for both selected date ranges.
Compare Devices Click the device name at the bottom of the page to compare the Dexcom CGM model, serial number, and the upload date of the selected date ranges.
11 Statistics Report Statistics for CGM data are shown either Daily or Hourly with standard and advanced views for the date range selected.
Dexcom CLARITY User Guide Page 17 of 24
Daily statistics are calculated values for the individual day of the week over the date range selected. For example, if the date range is 14 days, all the CGM values collected on the two Mondays would be used in the Monday calculations.
Hourly statistics are calculated values for the individual hour of the day over the date range selected. For example, if the date range is 7 days, all CGM values collected for each individual hour for each of the seven days would be used in the calculations.
Click Daily or Hourly for standard views, then click the Advanced checkbox if you want to view all the statistics.
Daily and Hourly both have the same statistics and include:
• Time in Range: The percentage of time that glucose levels are in low, target and high ranges. CLARITY displays time in range from both day and night ranges. Each Dexcom CGM reading is compared against the custom glucose target range and assigned a category of High, In Range, Low, or Urgent Low. Readings are tallied, then percentages for each category are calculated.
• # Readings: Total number of CGM readings. • Min: Minimum is the lowest CGM reading. • Mean: The average of CGM readings. • Max: Maximum is the highest CGM reading. • Quartile 25: The CGM reading where 25% of all readings fell at or below this
value, after ranking all values from lowest to highest. • Median: The midpoint of all CGM readings where half the readings fall above. • Quartile 75: The CGM reading where 75% of all readings fell at or below this
value, after ranking all values from lowest to highest. • IQR: Inter Quartile Range (IQR) is the difference between the Quartile 75 and
Quartile 25 readings. • Std. Dev.: Standard Deviation (SD) reflects the amount of variability in CGM
readings. The larger the SD, the larger the variability in CGM readings. • IQ Std. Dev.: Inter Quartile Standard Deviation (IQSD) removes the top 25%
and bottom 25% of CGM before calculating the SD. • SD Mean: Standard Deviation of the Mean (SD Mean) estimates variability by
dividing the SD by the square root of the number of values. • %CV: The Coefficient of Variation (%CV) is calculated by dividing the glucose
Standard Deviation by the mean glucose. %CV is a standardized measure that assesses the magnitude of glucose variability. The larger the %CV, the larger the variability in CGM readings.
Dexcom CLARITY User Guide Page 18 of 24
12 AGP Report The Ambulatory Glucose Profile (AGP) is a licensed, standardized glucose report created by the International Diabetes Center (IDC). AGP provides a standard set of information and graphs relating to your diabetes management and is only one part of understanding your glucose patterns.
The report is divided into these sections:
• Glucose Statistics summarize the glucose values from the selected date range. o Glucose Exposure: The average of all the glucose readings in the
selected date range. o Glucose Ranges: Percentage of time spent in each of the glucose
ranges. o Glucose Variability: How far readings are from the average. o Data Sufficiency: Percentage of time CGM readings were provided.
• Ambulatory Glucose Profile readings are combined to make a one day, 24-hour picture.
o 50% Median: Half of glucose values are above this line and half are below.
o 25/75%-IQR: Half of the glucose values are between these lines and half are outside these lines.
o 10/90%: 80% of glucose values are between these lines. • Daily Glucose Profiles contain single day views of glucose values from the
selected date range.
13 Uploads After signing in the first time, if you are using a Dexcom CGM receiver, you will see instructions to install the CLARITY Uploader software. You must have the Uploader to upload data from your CGM receiver to CLARITY. You only need to install this once.
If you use the Dexcom Mobile CGM, your data is already streaming to CLARITY so you do not need the Uploader.
Data Collection It is possible to use both a smartphone and a receiver to provide CGM data. The smartphone system streams data to the CLARITY server, where that data is made available for reports after three hours. The Dexcom receiver requires connection to a computer to upload the data periodically. If patients use a smartphone part of the time and a receiver part of the time, then CLARITY needs data from both to provide accurate statistics.
Dexcom CLARITY User Guide Page 19 of 24
Install the Dexcom CLARITY Uploader From the top of the page, click Upload and follow the instructions. When prompted, enter the username and password you use for CLARITY.
By default, the Keep me logged in box is checked so that each time you connect your Dexcom receiver to your computer, the Uploader will automatically open a browser window to show your CGM data page. Uncheck the Keep me logged in box if you want to disable auto-login.
Use the Uploader To upload data from your Dexcom receiver:
1. Connect your Dexcom receiver to your computer using the USB cable supplied with your CGM.
2. Click the CLARITY logo in your system tray to get upload instructions, set preferences, and to view reports.
3. Select Instructions if you are using a Mac, for directions to upload your CGM data or select Options, then Instructions if you are using a PC, for directions to upload your CGM data.
4. Select Options or Preferences tab to access the following: • Auto-Display Reports: Keep this box checked to allow Uploader to
automatically open CLARITY after uploading data. • Remembered Logins: Click Forget my login information to reset the
Uploader username autofill on the login screen. You can only access this feature if your Dexcom receiver is connected to the computer.
5. Select View Report to open CLARITY in a browser window. You may be asked to log in.
14 Settings Use the Settings page to customize data display and sharing. Changes only apply to CLARITY and do not change any settings on your Dexcom CGM system. Your healthcare professional may use different settings to view your data.
Manage Consent Click your name in the upper right corner to select Manage Consent to enable or disable consent for data sharing and privacy.
Manage Profile Click your name in the upper right corner to select Manage Profile to update your Dexcom account information.
Dexcom CLARITY User Guide Page 20 of 24
Patient’s Full Name Change how your name is displayed while viewing and for reports to your clinic. Use the name listed on your medical records.
Language and Unit Settings Change your language and unit of measure preference at any time.
Glucose Time/Target Range To customize the upper and lower limits for the glucose target range click and hold a gray circle icon and drag it up or down to set the desired glucose levels for your target range. Or select the time and thresholds of your glucose level for both Day and Night, from the drop-down lists.
Throughout CLARITY, the upper limit line is always yellow, and the lower limit line is always red. The colors may appear different based on your monitor settings.
Day and Night To customize the day and night, click and hold a gray circle icon and drag it left or right to set when the day begins and ends. Or, select a start and end time for both Day and Night, from the drop-down lists.
Urgent Low Threshold Choose 50 or 54mg/dL (2.8 or 3.0 mmol/L) as the threshold for Urgent Low displays within CLARITY reports. Changing this setting does not change the Dexcom CGM Urgent Low threshold which is set at 55mg/dL (3.1 mmol/L).
Data Sharing with Clinics You must give permission to share your CLARITY data with your clinic’s CLARITY account, and for you to see data uploaded at a clinic on your CLARITY account.
You can share with more than one clinic. Clinics are displayed once you have accepted a sharing invitation from that clinic.
After you approve to share data with a clinic, any following data uploaded to CLARITY can be accessed by the healthcare professionals at that clinic.
Users or clinics can stop sharing data at any time.
• All data uploaded by receiver to the clinic’s CLARITY account will still be accessible at the clinic. This data will not be accessible from your CLARITY account after sharing is stopped.
• All data streamed from the Dexcom Mobile app or uploaded from the receiver to your CLARITY account will not be accessible to the clinic after sharing is stopped.
Dexcom CLARITY User Guide Page 21 of 24
• You will continue to see your own data within your CLARITY account via receiver upload or streaming from your Dexcom Mobile app.
Accept an Invitation to Share Data A healthcare professional uses their CLARITY account to invite you to share data with their clinic. They will provide the invitation in print or by email.
The invitation includes a sharing code that you enter on your CLARITY Settings page to accept the invitation before the expiration date shown. Once you have completed the acceptance, your account and the clinic’s account will automatically share data between them.
You can accept the invitation from an internet browser or from a smart device with the Dexcom CLARITY app. See Appendix A for more information about the Dexcom CLARITY app that is separate from CLARITY.
To accept the invitation from an internet browser, log into your CLARITY account:
1. Click Settings. 2. Click Share Data with a New Clinic. 3. Enter the sharing code and your date of birth. 4. Click Continue. 5. Click the I consent to share my data with my clinic box. 6. Click Yes, Share My Data on the verification page to confirm sharing. 7. Click Close on the confirmation page.
Clinics you share with are listed under Data Sharing with Clinics. You may share with more than one clinic.
Stop Sharing Data To stop sharing data with a clinic, from the Settings page:
1. Click Stop Sharing with this Clinic for every clinic you want to stop sharing data.
2. Click Stop Sharing with this Clinic again on the verify page. 3. Click Close on the success page.
The clinic’s information will still appear on your Settings page for your reference.
15 Support For help using CLARITY, click Support and choose an option:
• Uploader Uninstall: Removes the Uploader software from your computer.
Dexcom CLARITY User Guide Page 22 of 24
• User Guide: View, print, and save this guide in PDF format. • Glossary: Definitions of terms and understanding of data calculations. • Contact Us: Find the contact information of your Dexcom distributer.
Troubleshooting If you are having trouble accessing CLARITY, try these troubleshooting steps:
• Make sure your computer is connected to the Internet throughout the session. If the computer loses that connection, it might not display the screens properly.
• Check that the computer’s operating system and browser are supported. See section 1 for more information.
• Know where downloaded files are stored. This will make finding downloads easier.
• Make sure that no other glucose data software is open or they could cause stalls or failures during uploads from a CGM.
• Make sure you have appropriate permissions on your computer to download reports or install Uploader software.
• Make sure the following URLs are included in any trusted website browser lists: o *.dexcom.eu (and all subdomains) on port 443 o *.dexcom.com (and all subdomains) on port 443
Technical Support For help with Dexcom CGM system, questions about CLARITY, or to receive a printed version of this manual, contact your local Dexcom representative.
Any serious incident that has occurred in relation to this device should be reported to the manufacturer and the competent authority of the Member State in which you are established.

Dexcom CLARITY User Guide Page 23 of 24
16 Appendix A: Dexcom CLARITY app The Dexcom CLARITY mobile app allows you to view glucose statistics, save and email reports, and enter the sharing code from your clinic to allow data sharing.
Download the Dexcom CLARITY app from the app store of your smartphone. The localization and languages selected on your smartphone and how you have your Dexcom account set up, controls how you view the CLARITY app. To view CLARITY compatible smartphones, visit: dexcom.com/compatibility Dexcom CLARITY app features may not be available in all countries.
Summary View the glucose data from the most recent number of days listed at the top.
Reports Select a range and the reports you want to view, save, print, and email.
To view reports:
1. Tap Reports from the menu. 2. Tap 2, 7, 14, 30 or 90 days. 3. Tap reports you want to view. 4. Tap View Reports.
Use the icons at the top to save, print, or email reports.
Goals View your Goals: Time in Range data and your Best Day data. To change your goals, tap Profile > Glucose Ranges > Goal: Time in Range.
Profile • Manage Profile: Update your Dexcom account information. • Manage Consent: Update your privacy preferences. • Authorize Sharing: Accept invitations to share data with your clinic. • Glucose Ranges: Customize the glucose ranges for viewing in CLARITY.
Changes to these ranges do not affect the ranges, alarm, or alerts for your Dexcom CGM devices.
• Notifications: Modify push notifications and the email summary. Notifications push to your smartphone when data is available and connected to the internet. Email Summary is sent weekly to the email address you have on file with Dexcom.
• Support: Learn about features or contact technical support. • About: Get information about this app.
Dexcom CLARITY User Guide Page 24 of 24
• Logout: Tap Logout log out of the app.
Dexcom, Inc. 6340 Sequence Drive San Diego, CA USA 92121 Outside US: Contact your local Dexcom representative
EU Importer DexCom International Ltd. 1 Tanfield, Edinburgh EH3 5DA, UK
Australian Sponsor Emergo Australia Level 20, Tower II Darling Park 201 Sussex Street Sydney, NSW 2000 Australia
Registration Holder, Israel I.L. Emergo Israel 9 Andrei Sakharov St. Matam, P.O.B. 15401 Haifa 3190501 Israel Phone: 02-6731634
AMAR Registration Number, Israel 24820094
MDSS GmbH Schiffgraben 41 30175 Hannover, Germany
See dexcom.com/symbols for a description of symbols shown in this User Guide.
© 2016-2020 Dexcom, Inc. LBL014288 Rev 14, 2020/03
Dexcom and Dexcom CLARITY are registered trademarks of Dexcom, Inc. in the United States and may be in other countries.